1. Introduction
In the last two decades, an extensive list of pharmaceuticals and personal care products has ranked as contaminants of emerging concern (CECs). They have been frequently found in aqueous systems disrupting the normal development of the local biota [
1,
2,
3]. The main concerns among these substances are their recalcitrant and cumulative behavior over the ecosystems. Nowadays, available technologies at industrial wastewater treatment plants (WWTPs) have not been enough to remove these pollutants from municipal effluents [
4,
5].
Advanced oxidation processes (AOPs) are well-known alternatives to deal with these types of compounds, which have been widely employed in the degradation of several CECs and proved to yield high degradation rates, even with removals over 99% at appropriate conditions [
6,
7,
8,
9]. Even so, AOPs still get challenged when it comes to the mineralization of recalcitrant compounds. This situation increases operational costs as more energy, reactive amount, and operation time are required [
10,
11,
12].
However, the simultaneous application of AOPs can substantially improve degradation and mineralization by enhancing the production of highly oxidizing species. These processes are known as intensifications, and they have proved to considerably increase the production rate of hydroxyl radicals
[
13,
14]. These processes have overcome kinetic limitations from traditional AOPs for a broad range of CECs from pharmaceutical, pesticidal, and petrochemical industries [
15,
16,
17]. In addition, ozone-based intensifications are a promising field for wastewater treatments because it exploits the unstable behavior of the ozone molecules by promoting its interaction with UV and different types of catalysts such as zeolites, activated carbon, and semiconductors [
18,
19,
20,
21].
The catalytic and photocatalytic ozonation (COz and PCOz) are intensifications with a high synergetic effect. According to [
22,
23], their electrical consumption could be lower than the ozonation (Oz). Therefore, catalyst-based ozonation processes are attractive alternatives to improve water treatments. Although PCOz is a catalyst-based ozone process, the presence of photo-excitation leads to a more complex pathway. Thus, reactions at the catalyst surface occur by electron exchange with photo-excited active sites [
24,
25,
26]. At the same time, COz reactions can also occur on non-excited active sites [
27].
According to Yu et al., the amount of Lewis active sites (LAS) for a given catalyst significantly influences the degradation and mineralization during the COz [
28,
29,
30]. Furthermore, for PCOz processes, a large amount of LAS could also increase the rate of capture of pairs electron-hole because of the high concentration of adsorbed ozone molecules, consequently increasing its oxidative potential [
31]. Despite the current knowledge, these technologies are still being explored, and no industrial application has been proposed yet [
32].
The kinetic studies on these processes have allowed a deeper insight into chemical and adsorption interactions. However, most of these studies have focused on setting operational ranges for critical variables, explaining synergy, and constructing feasible reaction mechanisms [
22,
25,
33,
34,
35]. Meanwhile, few works have studied these processes from the field of mathematical modeling [
26,
36]. One of the main challenges for this approach is still the lack of information on kinetic rate constants. Therefore, in most cases, the use of traditional gradient-based methods to estimate these constants could be impractical because constraints are uncertain [
37].
However, artificial intelligence (AI)-based methods such as genetic algorithms (GA) and particle swarm optimization (PSO) are feasible alternatives to overcome these problems. Nowadays, their popularity for solving multidimensional optimization problems has increased [
38,
39,
40]. Several works have employed these methods for the estimation of kinetic rate constants. In 2019, Kadi et al. formulated a mathematical model to evaluate rapeseed oil transesterification. In their study, a PSO algorithm was employed [
41]. Additionally, Ding et al. assessed both PSO and GA to model biomass pyrolysis based on 14 rate constants [
42].
The present work proposed three mathematical models to degrade diclofenac using Oz, COz, and PCOz in a modified flotation cell. Twenty kinetic rate constants from [
26,
36] were estimated to complete the model. This study was a continuation of the work from Lara et al., where the experimental data to assess the models’ predictions were obtained [
22]. The method employed to solve the optimization problem to find the rate constants was the Unified Non-dominated Sorting Genetic Algorithm (U-NSGA-III) proposed by [
43].
2. Mechanisms of Reaction for Ozone Processes
The reaction mechanism for the ozonation process has been widely studied, even for different pH conditions. Staehelin et al. and Tomiyasu et al. proposed the first reaction mechanisms for ozone in water at acidic and alkaline conditions, respectively [
44,
45,
46]. The significant difference between these pathways consisted of ozone decomposition reactions that occur because of alkalinity. However, because of the available variety of catalysts, the mechanisms for COz processes are less generalized. Jans and Hoigne carried the first known work in studying the effect of a catalyst over the ozonation process in 1998. Since then, different researchers have proposed feasible reaction paths based on the type of catalyst [
47].
For the particular case of heterogeneous PCOz with titanium dioxide (
), the available literature information is still scarce. Moreover, the already proposed mechanisms rely on independent knowledge over ozonation and heterogeneous photocatalysis mechanism [
24,
48]. Thus, this work collected part of this information to present a generalized mechanism, described in
Table 1.
First, the homogeneous ozonation path was set to reactions (1)–(9), where both (1) and (2) had an initializing role. Then, the generated ozonide radicals promoted the formation of hydroxyl radicals by reaction (3). It could consequently conduct homogeneous propagation reactions (5)–(9) or promote the hydroxyl attack on dissolved diclofenac molecules (4).
With the addition of
, the process was also affected by heterogeneous reactions promoted by adsorption phenomena at the catalyst surface. Then, the COz mechanism was also described by reactions (14)–(18). As the hydroxide ions
were adsorbed on the catalyst, they were prone to react with ozone molecules to promote the production of hydroxyl radicals [
49]. Furthermore, the heterogeneous hydroxyl attack reactions (16)–(18) additionally promoted the decomposition of diclofenac. However, as not enough information for adsorption kinetics was available, these reactions were modeled with a single global rate law.
Finally, UV radiation exposure led to the PCOz mechanism, which gathered photolysis and photocatalysis reactions. Here, the incidence of photons caused the catalyst excitation, where incident photons were likely to promote electrons at the catalyst valence band (VB) towards the conduction band (CB), which resulted in the formation of pairs electron-hole (19). The former allowed oxide-reduction reactions to take place. Thus, the holes promoted the generation of hydroxyl radicals by reactions (20) and (21), while electrons reacted with ozone to produce ozonide radicals (24). However, recombination of the photo-generated pair was also possible. Therefore, electrons could return to their VB (25). Meanwhile, at the homogeneous liquid phase, dissolved ozone was photolyzed (26), and the generated hydrogen peroxide was prone to react with hydroxyl radicals by (27).
3. Computational Design
3.1. Setup of the Flotation Cell
The experimental measurements were obtained in a previous work from Lara et al. employing diclofenac sodium salt (
, >98%) as a preccursor for diclofenac [
22]. The reaction system comprised an acrylic storage tank with a reaction volume
, two fluorescent tubular lamps (Repti Glo 5.0 Compact) with a rated power of
, and an Ozonator AZ2 model 5GLAB for ozone supply. This novel reactor has proven to involve turbulent zones which minimize the mass transfer limitations in the water treatments with ozone [
50].
The flotation cell was modelled for the diclofenac degradation by Oz, COz, and PCOz. The predictions were compared against experimental data from [
22], where the Oz process registered measures at ozone doses (
) of 2.66 and 7.40 ppm. Meanwhile, the COz and PCOz processes employed a factorial design
including the catalyst load (
) as a factor with levels 300 and 800
. The levels for the ozone dose factor were kept as equal as in the Oz.
3.2. Mathematical Models
According to
Table 1, the mathematical models for each process were formulated based on: (i) absorption equilibrium, (ii) perfect mixing for both gas and liquid phases, (iii) little volatility for the water dissolved species, (iv) the catalyst particles were uniformly distributed, (v) the diclofenac photolysis was negligible, (vi) adiabatic conditions for the reaction system, (vii) the mass transfer resistance in the gas phase was negligible, (viii) continuous operation for the gas phase, (ix) batch operation for the liquid phase, (x) the ozone interface concentration described by Henry’s law (
), and (xi) water and oxygen concentrations were considered constants as they were in excess.
Assumption (iii) implied that the models neglected the transport rate of the water-dissolved species to the gas phase. Then, ozone and oxygen were the only substances considered in the gas phase. The ozone accumulation rate was described according to (28), where the first and second terms, respectively, represented the net advective and the mixed convective-diffusive effects over the ozone transport to the liquid phase. The enhancement factor
accounted for the increase in the ozone mass transfer rate because of the chemical reactions at the interface.
The volumetric mass transfer coefficient
and the gas holdup
were computed with the empirical equations from Inkeri et al. for gassed stirred tank reactors [
51], and the ozone gas flow-rate
was maintained fixed to
. Meanwhile, the ozone concentration at the interphase
was a function of the mean logarithmic ozone gas concentration
, according to Equation (29).
Before evaluating the mathematical models, the Hatta number
was computed for each of the experimental observations based on a first-order rate law according to Equation (30). Then, depending on the type of regime, the enhancement factor was computed [
49]. Furthermore, the computed pseudo-first-order rate constant was employed to roughly estimate the electrical energy per order (EE/O) corresponding to each experimental configuration [
52].
Finally, the GA was applied, and the models’ predictions for the optimal rate constants were compared against the experimental data. Then, the Theil Inequality Coefficient (
) was employed as a criterion to assess the models’ deviation as proposed by Beltrán et al., Equation (31). Values under 0.3 indicated a good agreement between the experimental measurements
and the model’s predictions
[
36].
3.2.1. Ozonation
The degradation rate for the Oz process was mainly affected by the ozone and diclofenac concentrations
. Reactions (1)–(9) described the rate laws for the chemical species. Equation (32) described the resulting system of differential Equations
. Here,
was a vector of rate laws, and
was a matrix of stoichiometric coefficients whose rows and columns represented the species and the kinetic rate constants each. Additionally, the element
accounted for the ozone at the gas phase. All the remaining elements of the row
and the column
were zeros as none of the water-dissolved species could pass to the gas phase. The vector of initial conditions
was given to the model according to (35).
3.2.2. Catalytic Ozonation
The catalytic ozonation model was also a function of the catalyst load
. Reactions (1)–(9) and (14)–(18) described the set rate laws. According to the general assumptions from
Section 3, the adsorption-desorption rates at the catalyst surface were at equilibrium with the liquid phase. Therefore, the concentration of adsorbed species was described in terms of the homogeneous concentration (36).
As the heterogeneous reactions were surface interactions, its rate laws relied on the available surface rather than the reaction volume. Therefore, a dimensionality factor was required to represent the global volumetric effect of these interactions based on the load and specific surface of the catalyst
. Then, the
vector was modified according to (37). The corresponding
matrix was constructed similarly to (34), but rather than
chemical reactions, it was composed by
, where
was the total number of heterogeneous chemical reactions. The
vector for the initial condition was the same as that from (35).
3.2.3. Photocatalytic Ozonation
The PCOz process was additionally affected by the rate of photon absorption, which was quantified using the volumetric rate of photon absorption (VRPA). Therefore, the model was a function
based on reactions (1)–(9), (14)–(21), (22) and (24)–(27). Equations (38) and (39) depict the formulation for the
vector and the
matrix.
Although reaction (23) has an active role in heterogeneous photocatalysis processes, it was assumed negligible compared to (24). Hence, it was supposed that most of the active sites
would take preference to interact with ozone rather than oxygen molecules [
36]. The reaction (22) was considered at equilibrium. Therefore, the concentration of active sites was quantified in terms of the electron concentration
, Equation (40).
Radiant Field
A fundamental part of modeling photocatalysis-based processes is the quantification of the VRPA. Among the literature, researchers have widely aborded stochastic and deterministic approaches estimating the VRPA [
53,
54,
55]. Although stochastic methods based on Monte Carlo simulations have proved highly precise, their implementation involves a high computational effort, resulting in a time-consuming task [
56,
57,
58,
59]. Meanwhile, some deterministic methods have proved to yield prediction approximated enough to Monte Carlo simulations. Among these methods, the Six-Flux Model (SFM) has been successfully adapted to different photoreactor geometries [
60,
61,
62,
63,
64].
As the study of the radiant field was not the main objective of this work, the estimation of the VRPA at the flotation cell followed the SFM approach (See
Section S.1). The optical properties of the catalyst were obtained from [
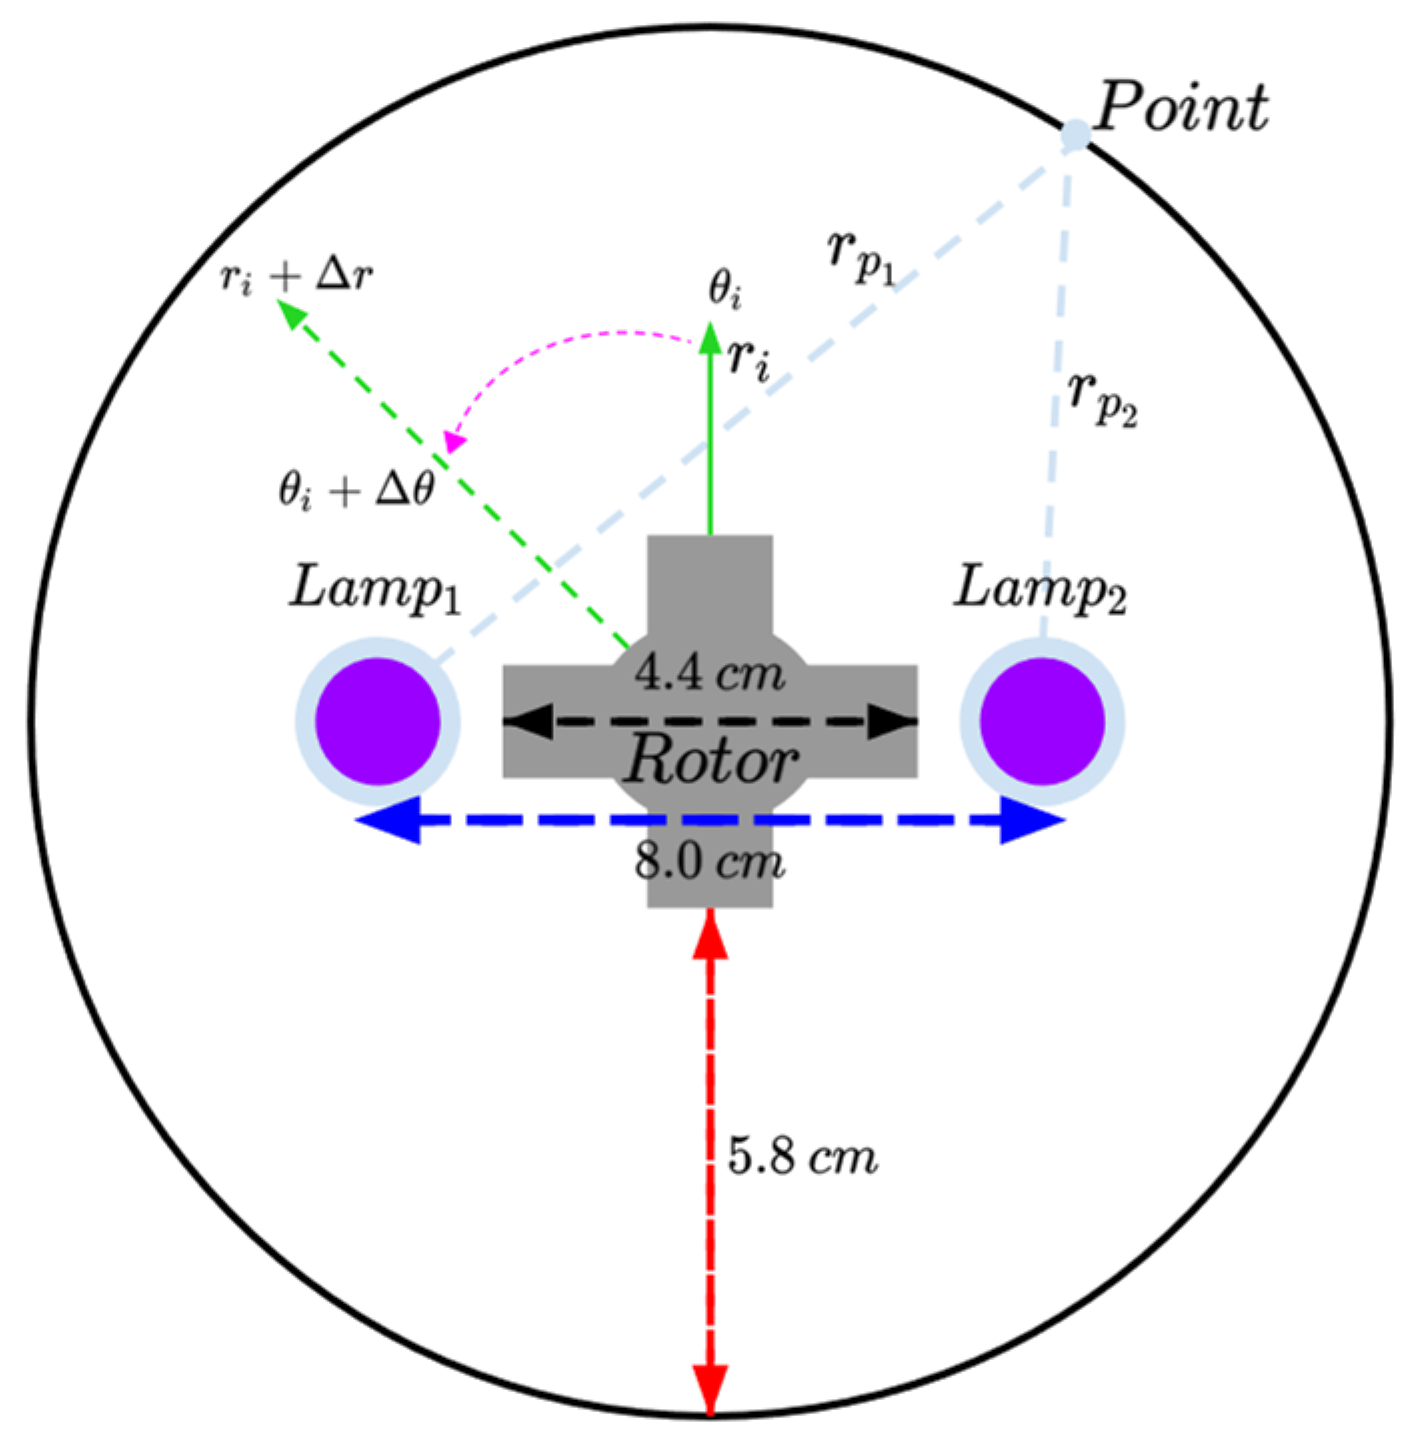
61]. Equation (41) describes the local volumetric rate of photon absorption (LVRPA) for each lamp as a function of the intensity
.
As the studied system comprised two non-concentric lamps, Equation (42) re-defined the relative coordinate to the emission source
as a composed coordinate
, where the constant
was the distance from the reactor center to the emission source.
Then, to account for the effect of both emission sources, the real LVRPA value for a given point inside the flotation cell was computed as the summation of the individual lamp’s contribution, Equation (43). The overall rate of photon absorption in the system (VRPA) was given by Equation (44) [
63].
Figure 1 depicts the geometry for the studied system.
3.3. Numerical Solution
The kinetic parameters were estimated by the U-NSGA-III algorithm from the Pymoo library of Python [
65]. Seada and Deb initially proposed this method in 2016 to deal with mono and multi-objective optimization problems [
43]. The objective function was the weighted least squares shown in Equation (45). The index
accounted for the involved processes (Oz, COz, and PCOz),
were the residual values, and
was the experimental variance for the
experiment at the
measurement.
Algorithm 1 described pseudocode for the case of the present optimization problem. Both population size and the maximum number of iterations were set to 150. First, the algorithm distributed an initial population
of vector parameters
within the problem space and evaluated its associated error. Then, the offspring were generated based on binary tournament selection events. Each winner from a tournament was matched with an individual from another tournament, resulting in two offspring individuals
and
[
43].
| Algorithm 1 Pseudocode for the application of the U-NSGA-III. |
| Degenerated U-NSGA-III |
Inputs: Mono-objective problem , experimental data , Boundaries for the problem space , and known physicochemical constants.
Output: Best explored solution |
|
|
| while do |
|
|
| while do |
|
|
|
|
|
|
|
|
|
|
|
|
| end while |
|
|
|
|
| end while |
|
Before introducing the obtained pair of candidates to the offspring set
, the algorithm applied mutation operators over the vectors. This approach helps the algorithm keep diversity between individuals and improves the exploration of the problem space [
66]. Once
equaled the size of
, the algorithm computed the error for the offspring individuals. Finally, a new population was constituted by selecting the best candidates from
and
. This methodology continued until the maximum number of generations was met.
3.4. Sensitivity Analysis
A sensitivity analysis was employed to study the effect of each kinetic constant on the models’ error. The corresponding sensitivity coefficients were used as criteria to neglect poor influential chemical reactions. Although global sensitivity analysis algorithms are preferred since they provide more valuable information [
67], the local-based methods had the advantage of quick computing and easy applicability. Therefore, a one-at-a-time (OAT) approach was implemented to estimate the sensitivity coefficients for the rate constants. Hence, the number of samples was set to
, and the error was evaluated while varying one rate constant and keeping the remaining fixed to their optimal values. Then, the variance of the error for that constant was computed [
68,
69]. Thus, the corresponding sensitivity coefficients
were estimated based on Equation (46).
4. Results
All the processes described a slow kinetic regime (
). Therefore, no significant enhancement of the mass transfer occurred by the chemical reactions at the gas-liquid interface (
). The values for the mass transfer parameters and the computed values for the
Ha corresponding to each experiment were reported in
Sections S.2 and S.3 of the Supplementary Material, respectively.
The EE/O in terms of diclofenac degradation for the COz and PCOz were lower than the Oz process only when operating at high ozone dose conditions. COz presented the lowest EE/O, with a value of 7.22
for 7.44 ppm ozone dose and 800 ppm catalyst load, which suggested that these conditions promoted the fastest degradation (See
Section S.4).
4.1. Ozonation
The ozonation model was constructed based on the reactions (1)–(9), resulting in the system of ordinary differential equations (ODEs) from Equation (47).
Table 2 reported the values for the involved reaction rate constants.
Although the estimated values in the present work had a good agreement with the experimental data, their values highly deviated from already reported kinetic constants for the Oz process.
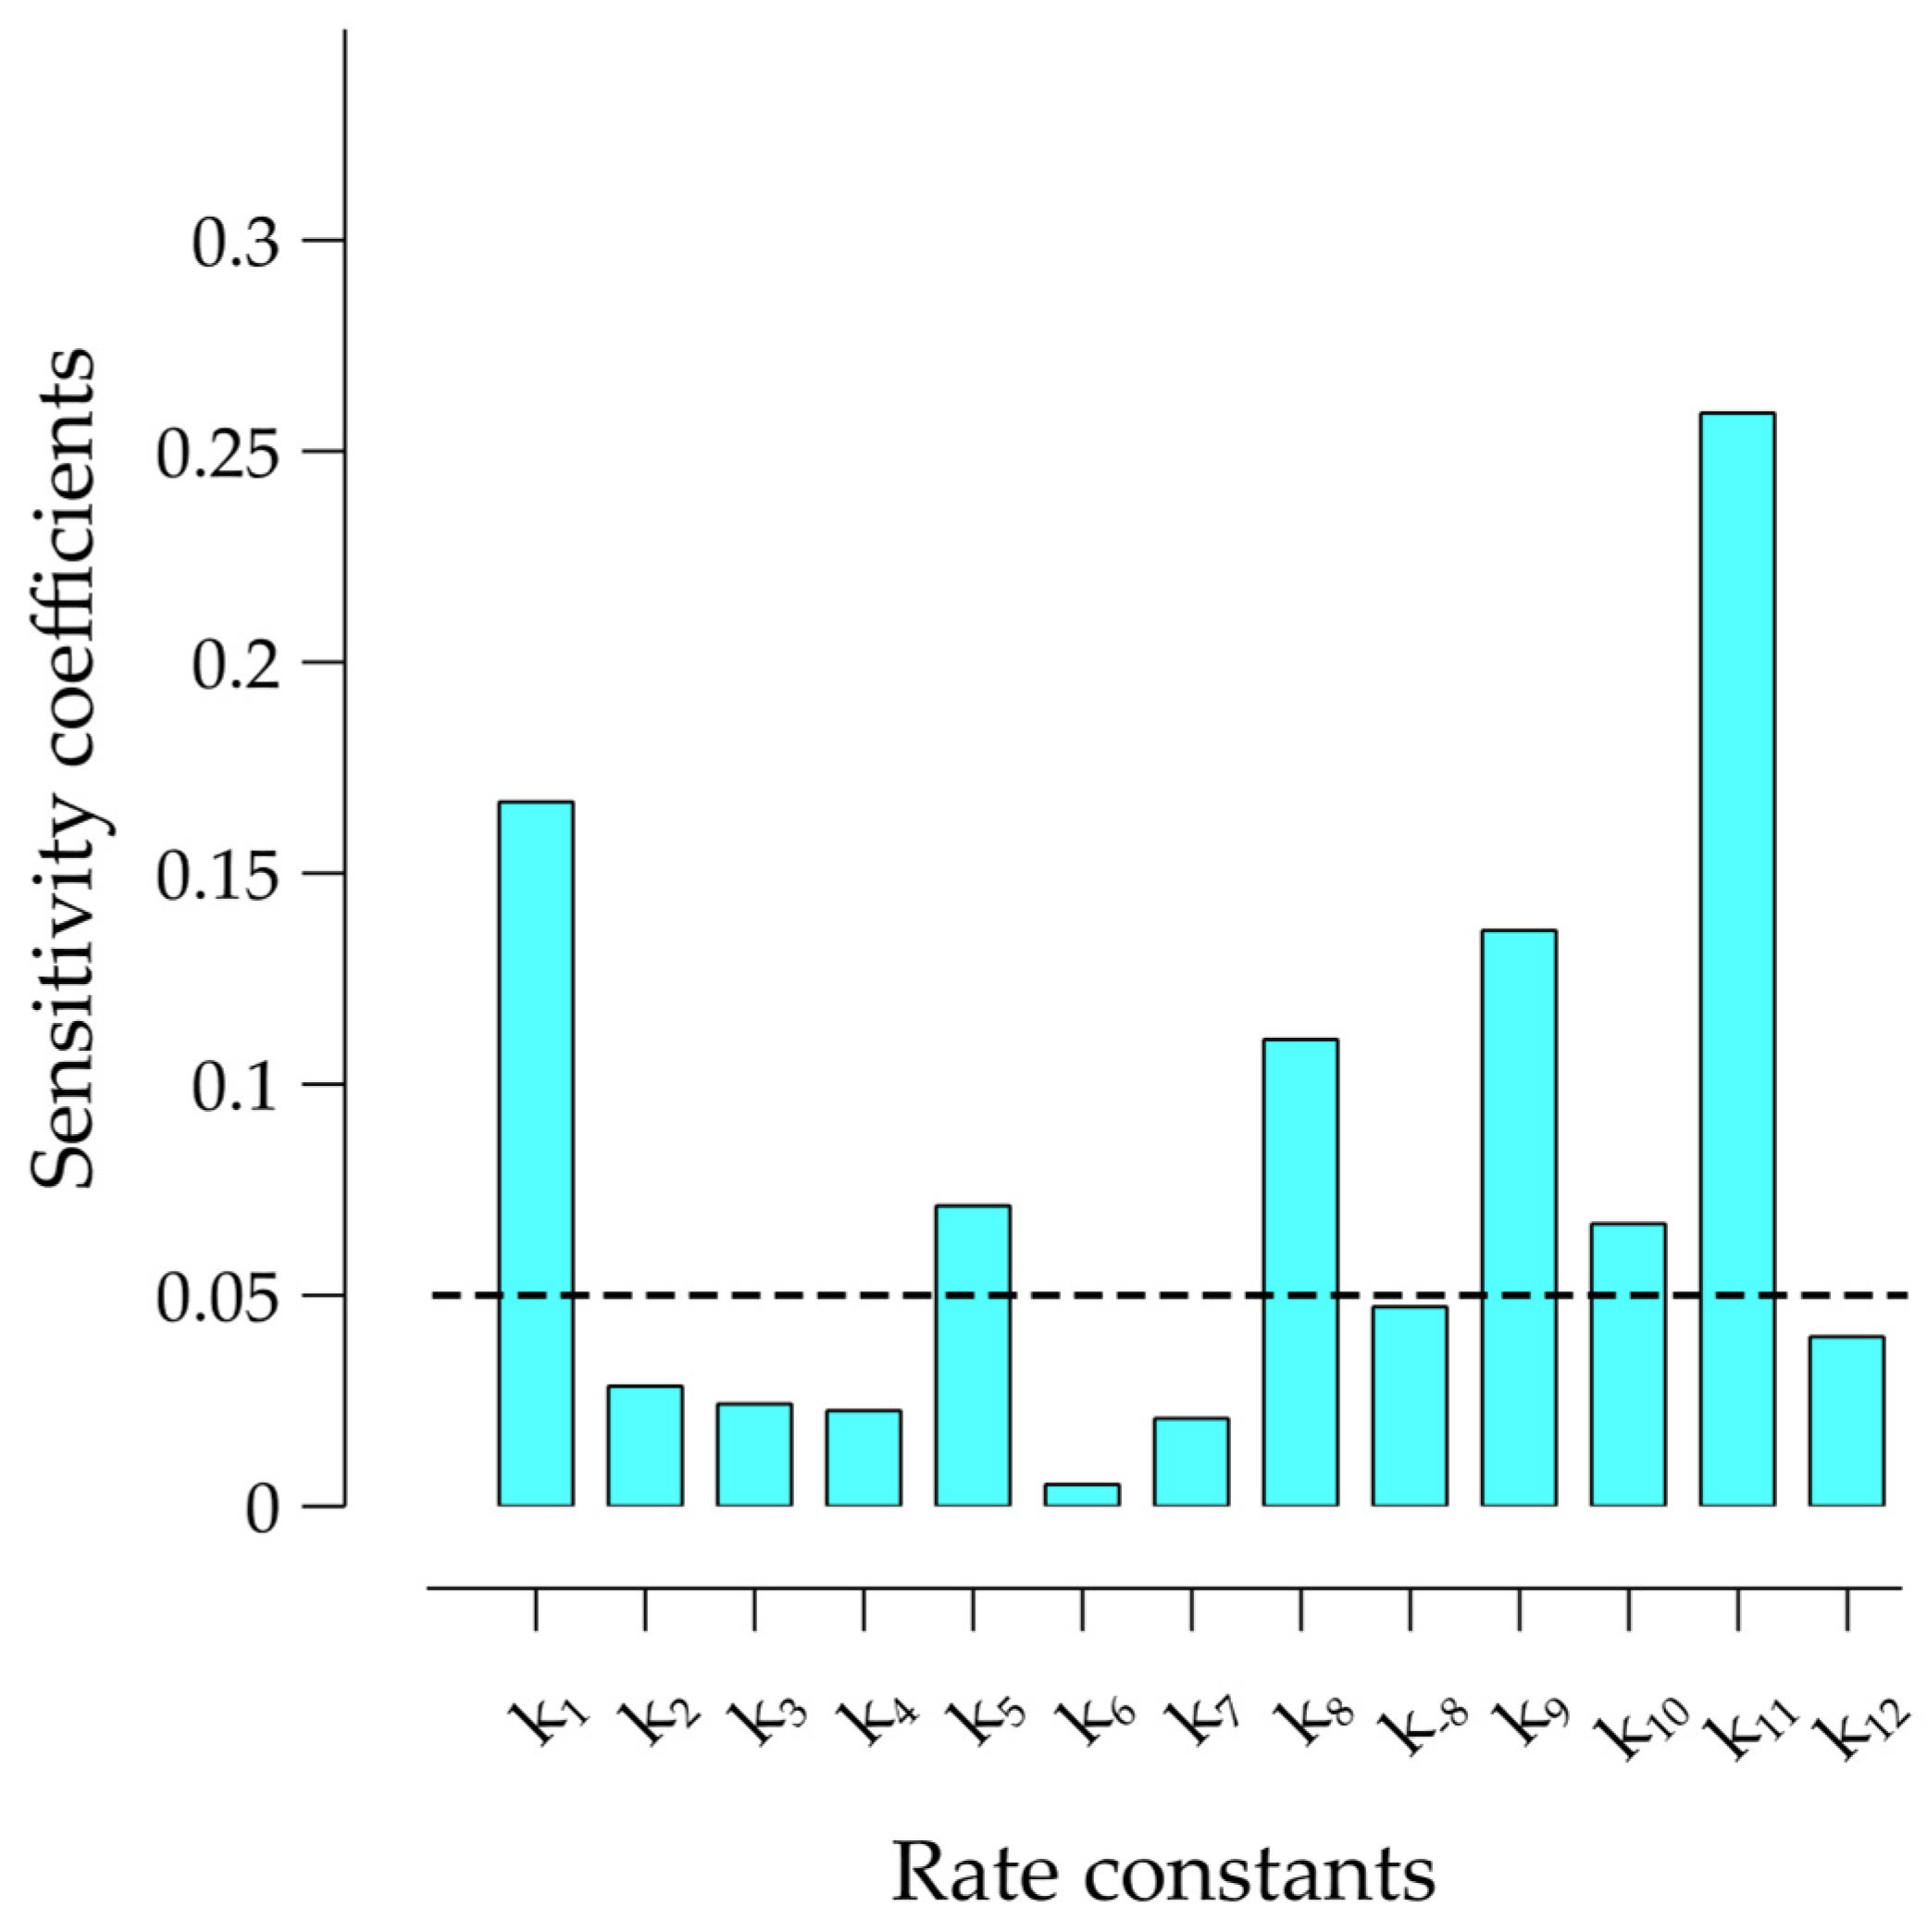
The sensitivity analysis showed that only reaction (1) had a significant effect on the Oz model. Its sensitivity coefficient presented a value over 0.9, as depicted in
Figure 2. Thus, the mechanism was reduced to a single homogeneous reaction given by (1). The resulting mathematical model was only dependent on the ozone and diclofenac concentrations.
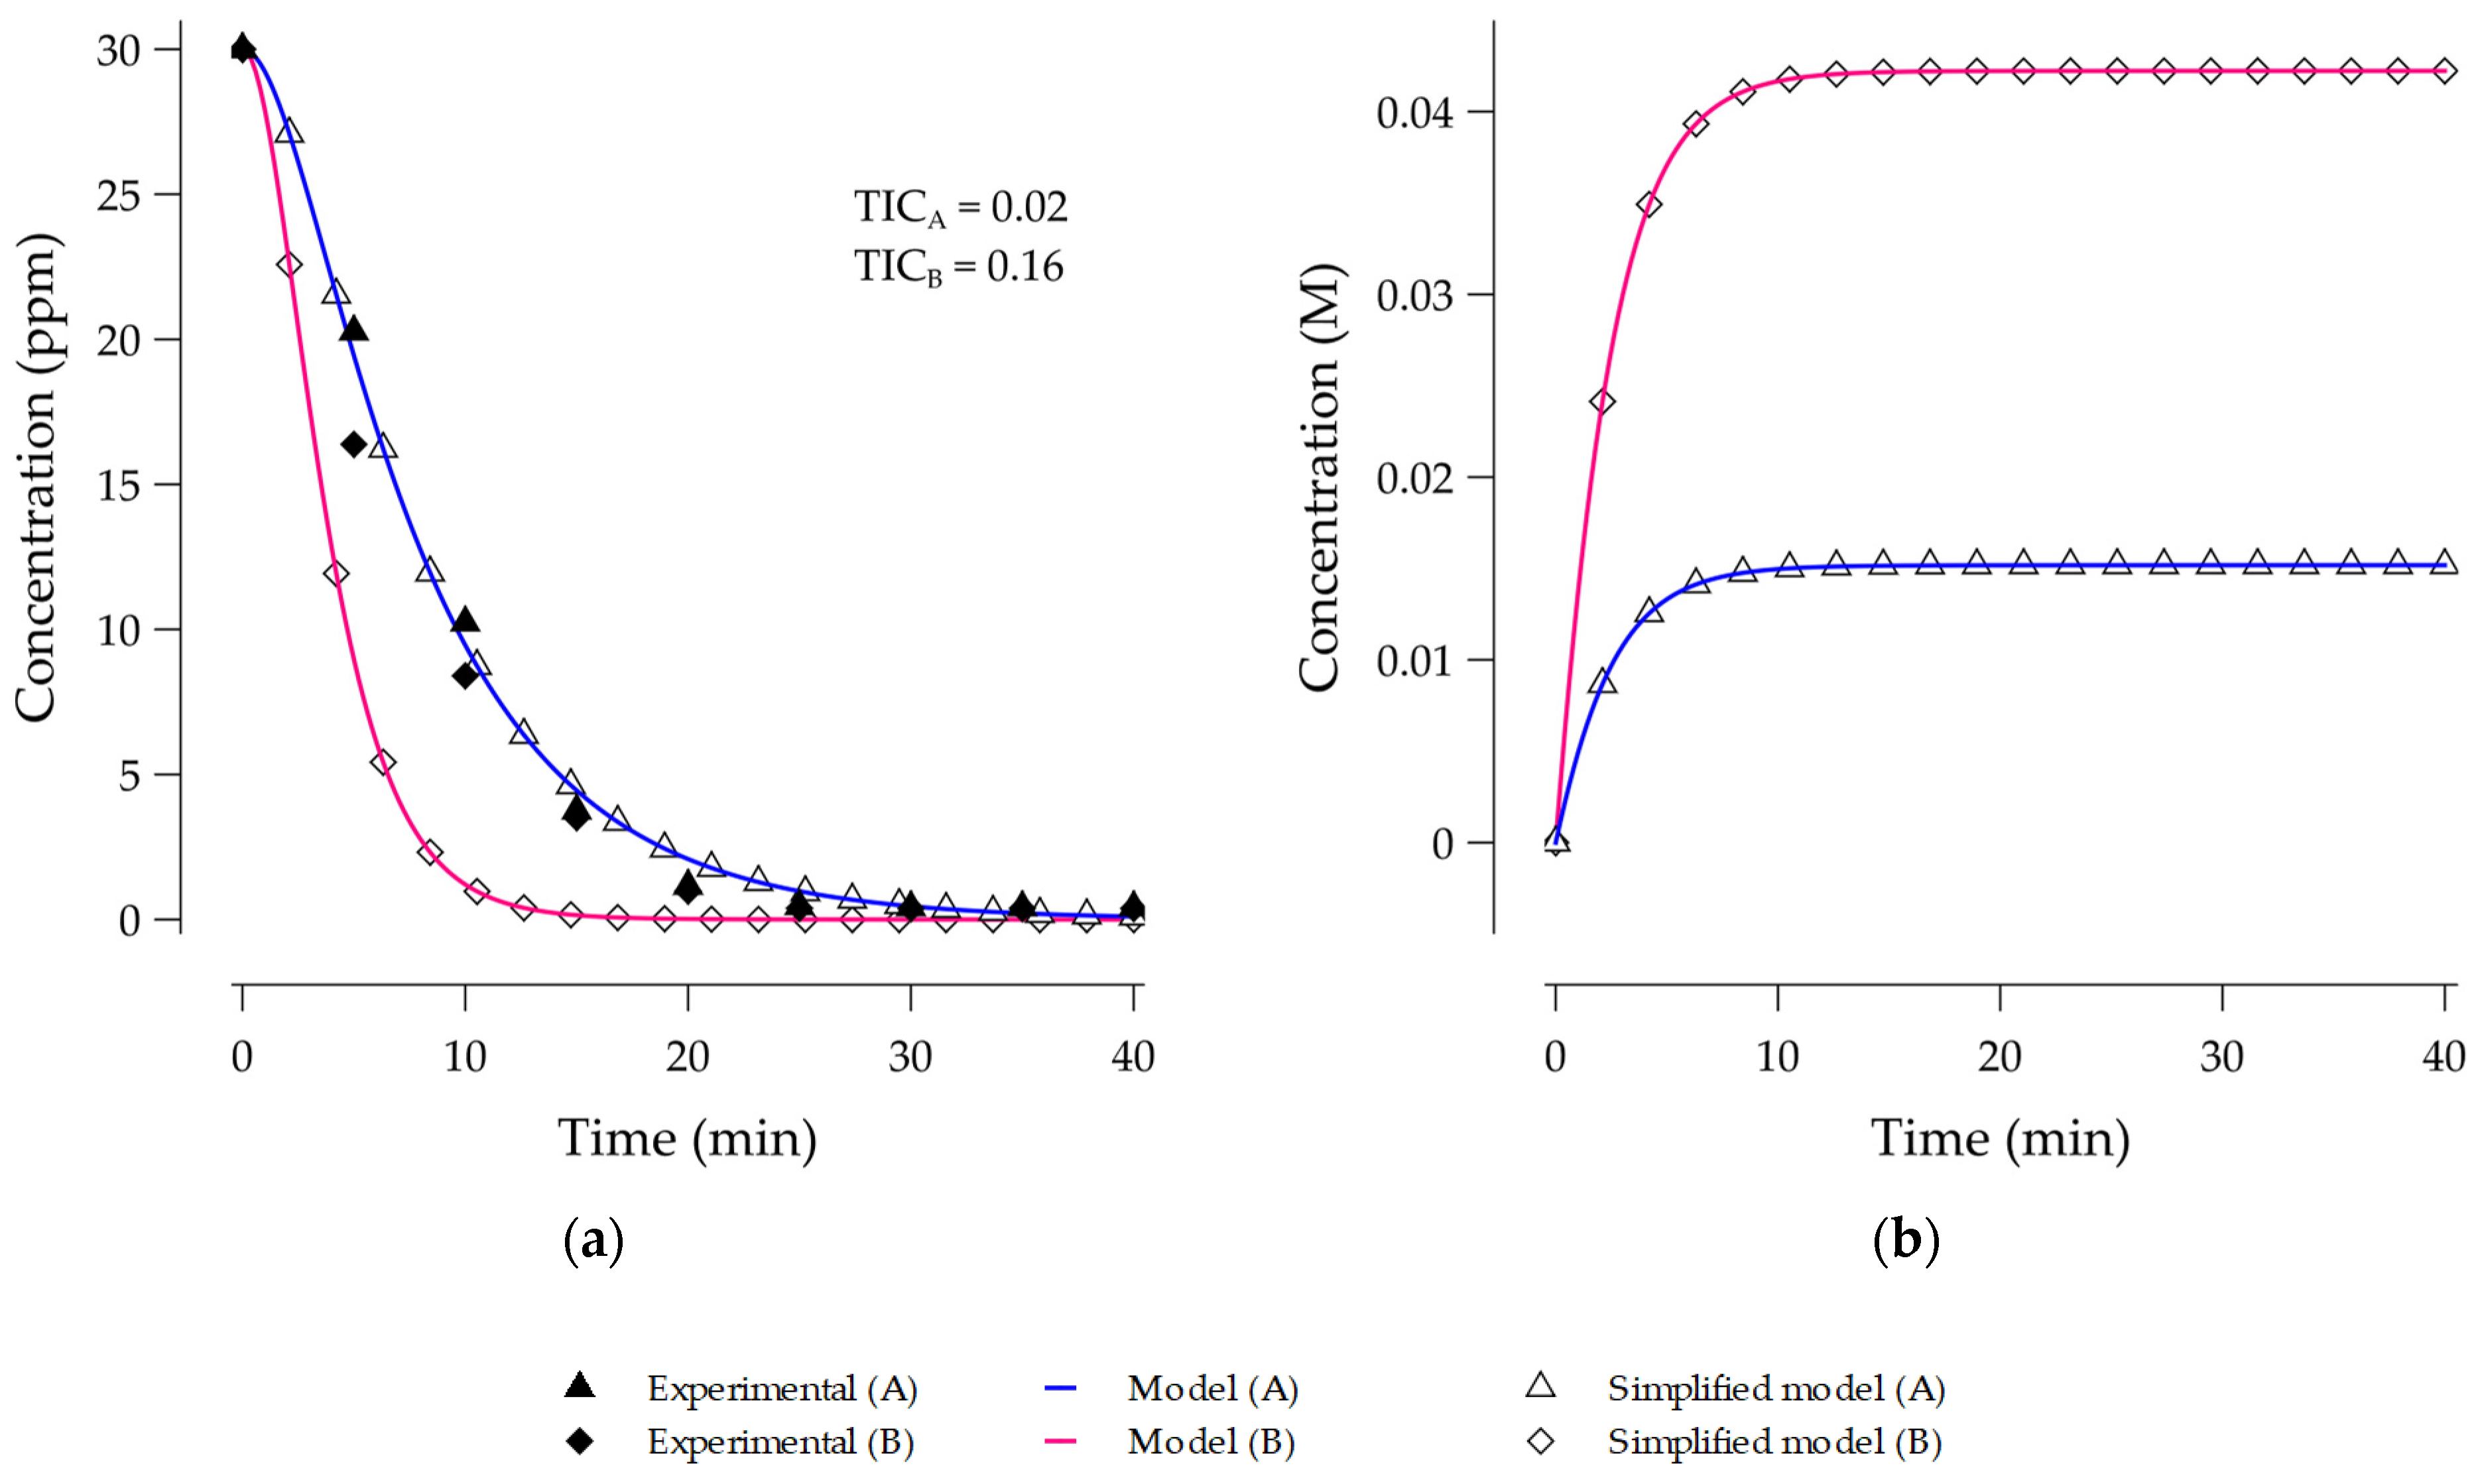
Both complex and simplified models fitted the diclofenac degradation kinetic. Nevertheless, for the high ozone dose conditions (7.40 ppm), the model deviation increased because of the high sensitivity to the ozone concentration.
Figure 3 depicted the concentration profiles. According to
Figure 3b, no ozone decomposition occurred. It explained the negligible influence of the hydroxyl radicals on the diclofenac degradation.
4.2. Catalytic Ozonation
In addition to (1)–(9), the rate laws from (14)–(18) affected the COz process. Then, the corresponding system of differential equation was formulated as a function of
, Equation (48). The optimal values for the heterogeneous rate constants were presented in
Table 3. Due to the lack of information, their values could not be compared with literature.
According to the sensitivity coefficients from
Figure 4, the reaction mechanism for the catalytic ozonation process was simplified by just considering (1), (5), (8) and (9)–(11) to affect the mathematical model.
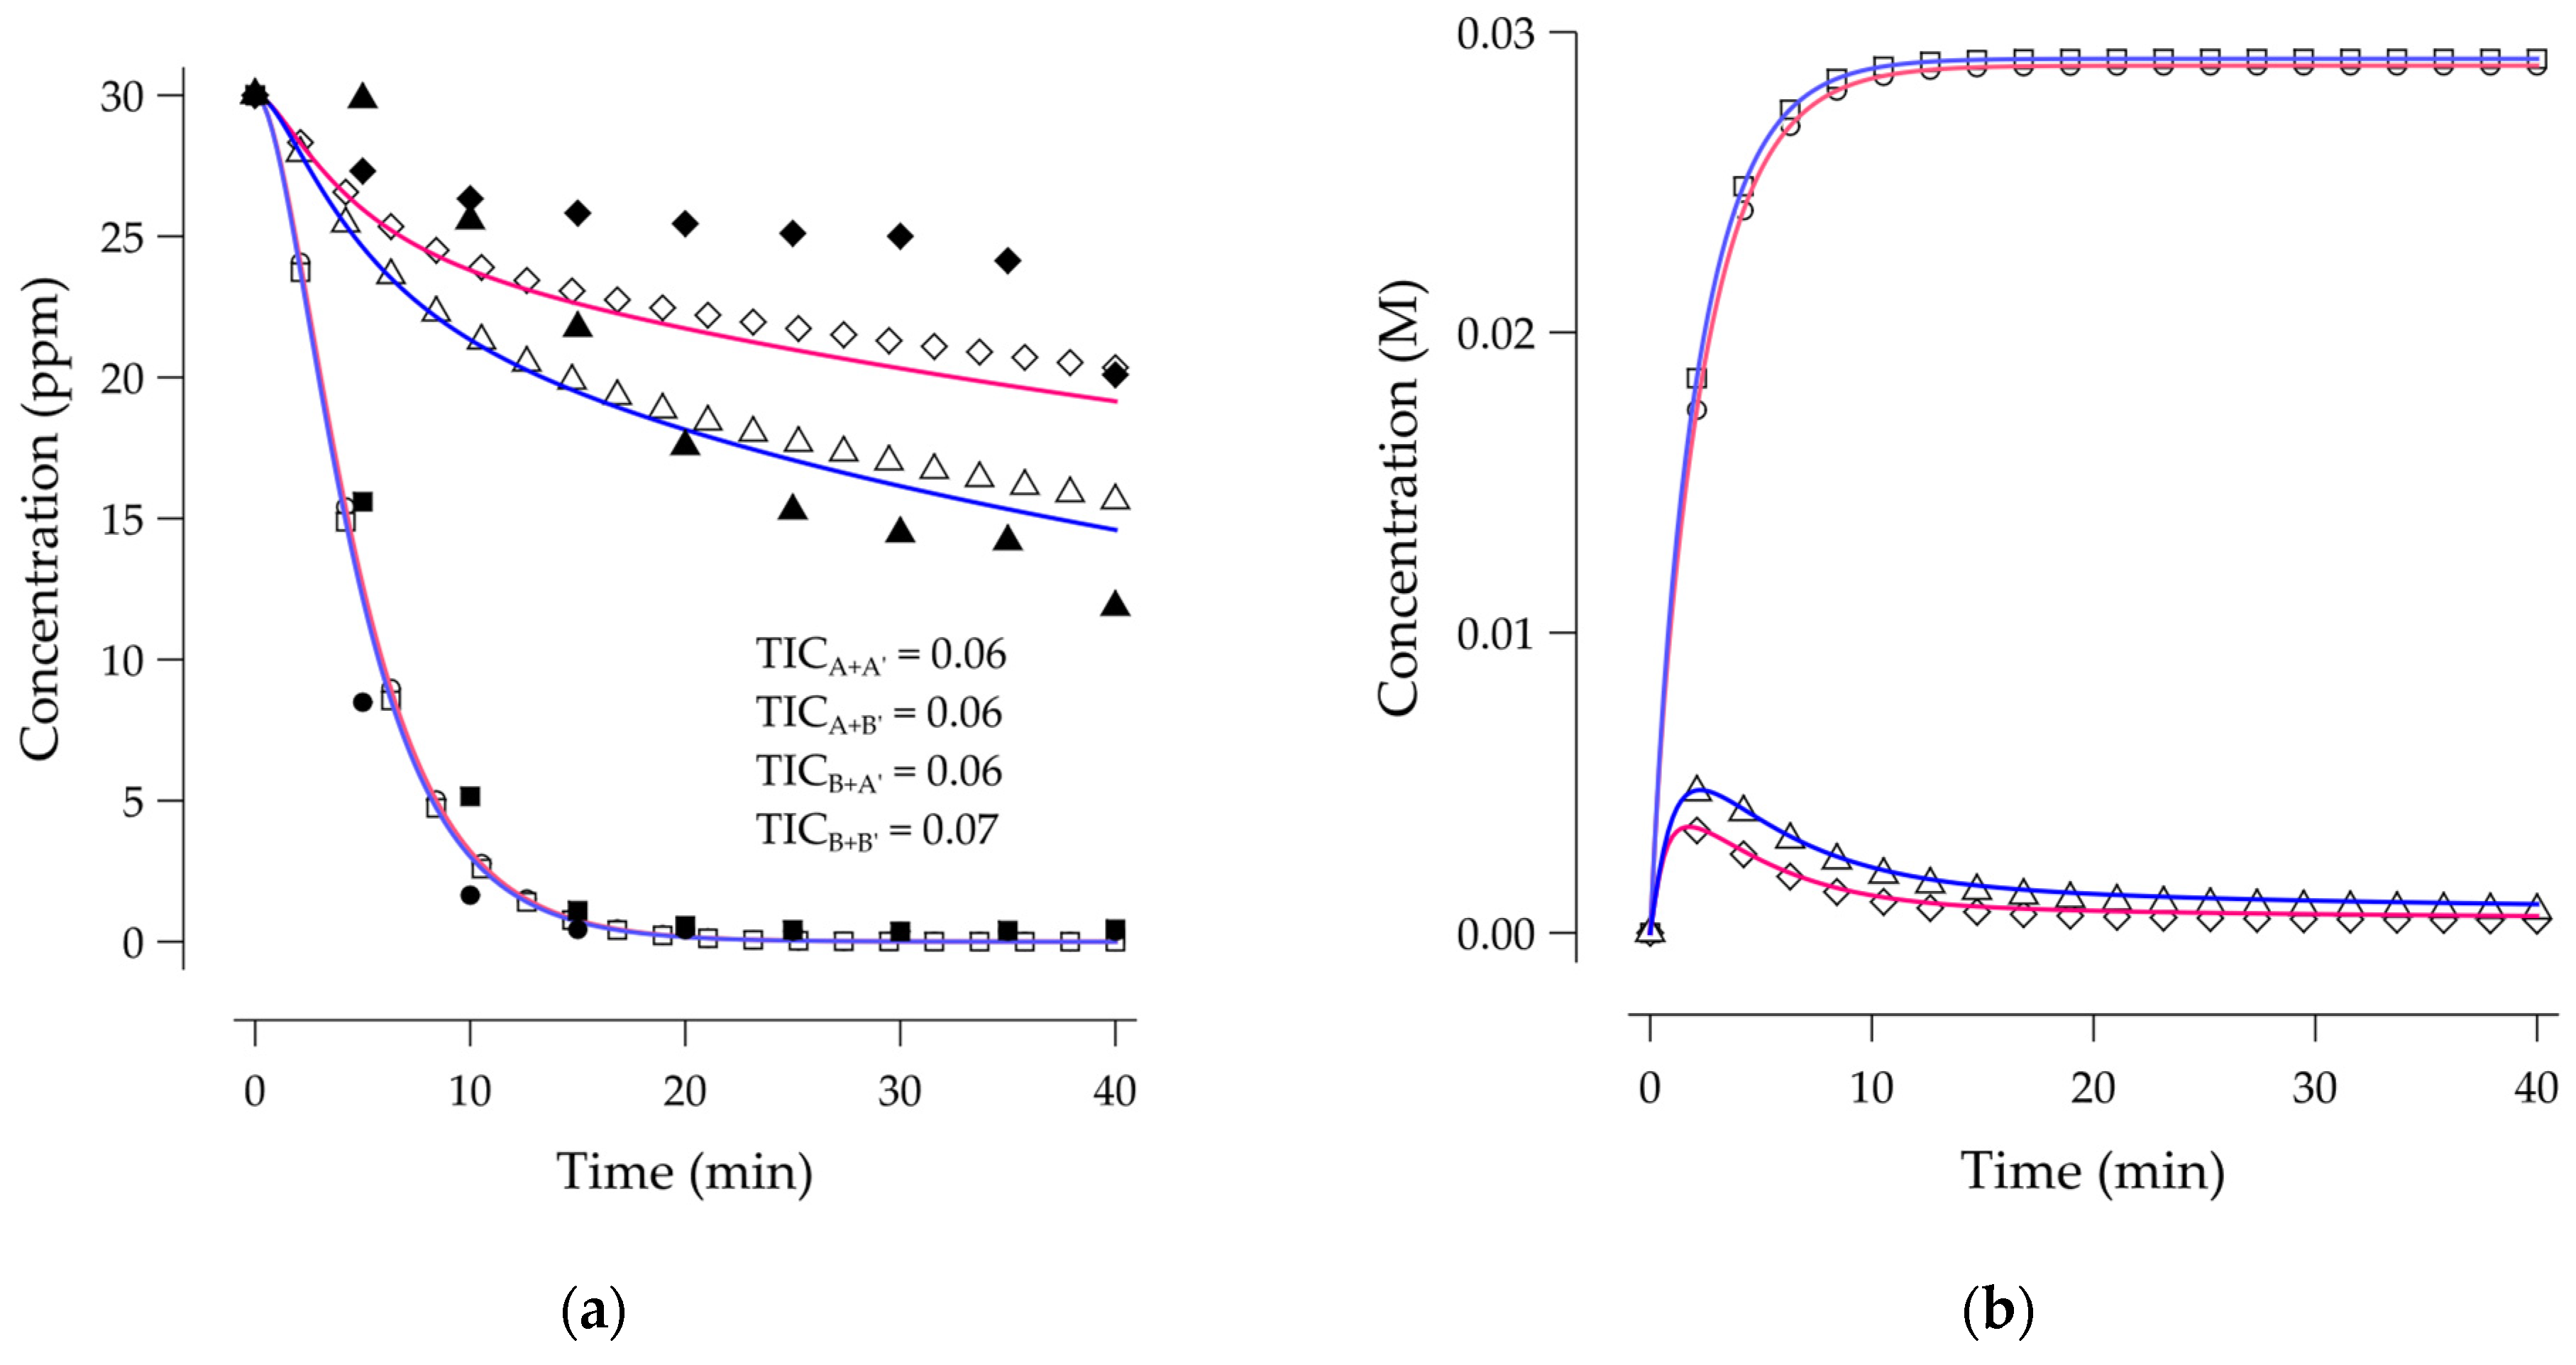
The low concentration at the ozone dose (2.66 ppm) caused the decomposition at the catalyst surface (14) to compete with the direct diclofenac destruction by ozone (1),
Figure 5a. It occurred for both experimental and predicted data. However, for high ozone dose conditions (7.44 ppm), the ozone availability could drive the diclofenac degradation without competing. Additionally,
Figure 5b showed that the ozone decomposition at these conditions was negligible.
As the change in the number of active sites affects the adsorption equilibrium of catalytic reactions, the increase in the catalyst load led to a lower accumulation of dissolved ozone. Furthermore, the high ozone dose conditions did not promote the formation of hydroxyl radicals. Based on this, the ozone excess conditions could have led reaction (5) to become a scavenging pathway for the hydroxyl radicals. The former suggested that the ozone concentration had a strong influence on the kinetic behavior of the process.
4.3. Photocatalytic Ozonation
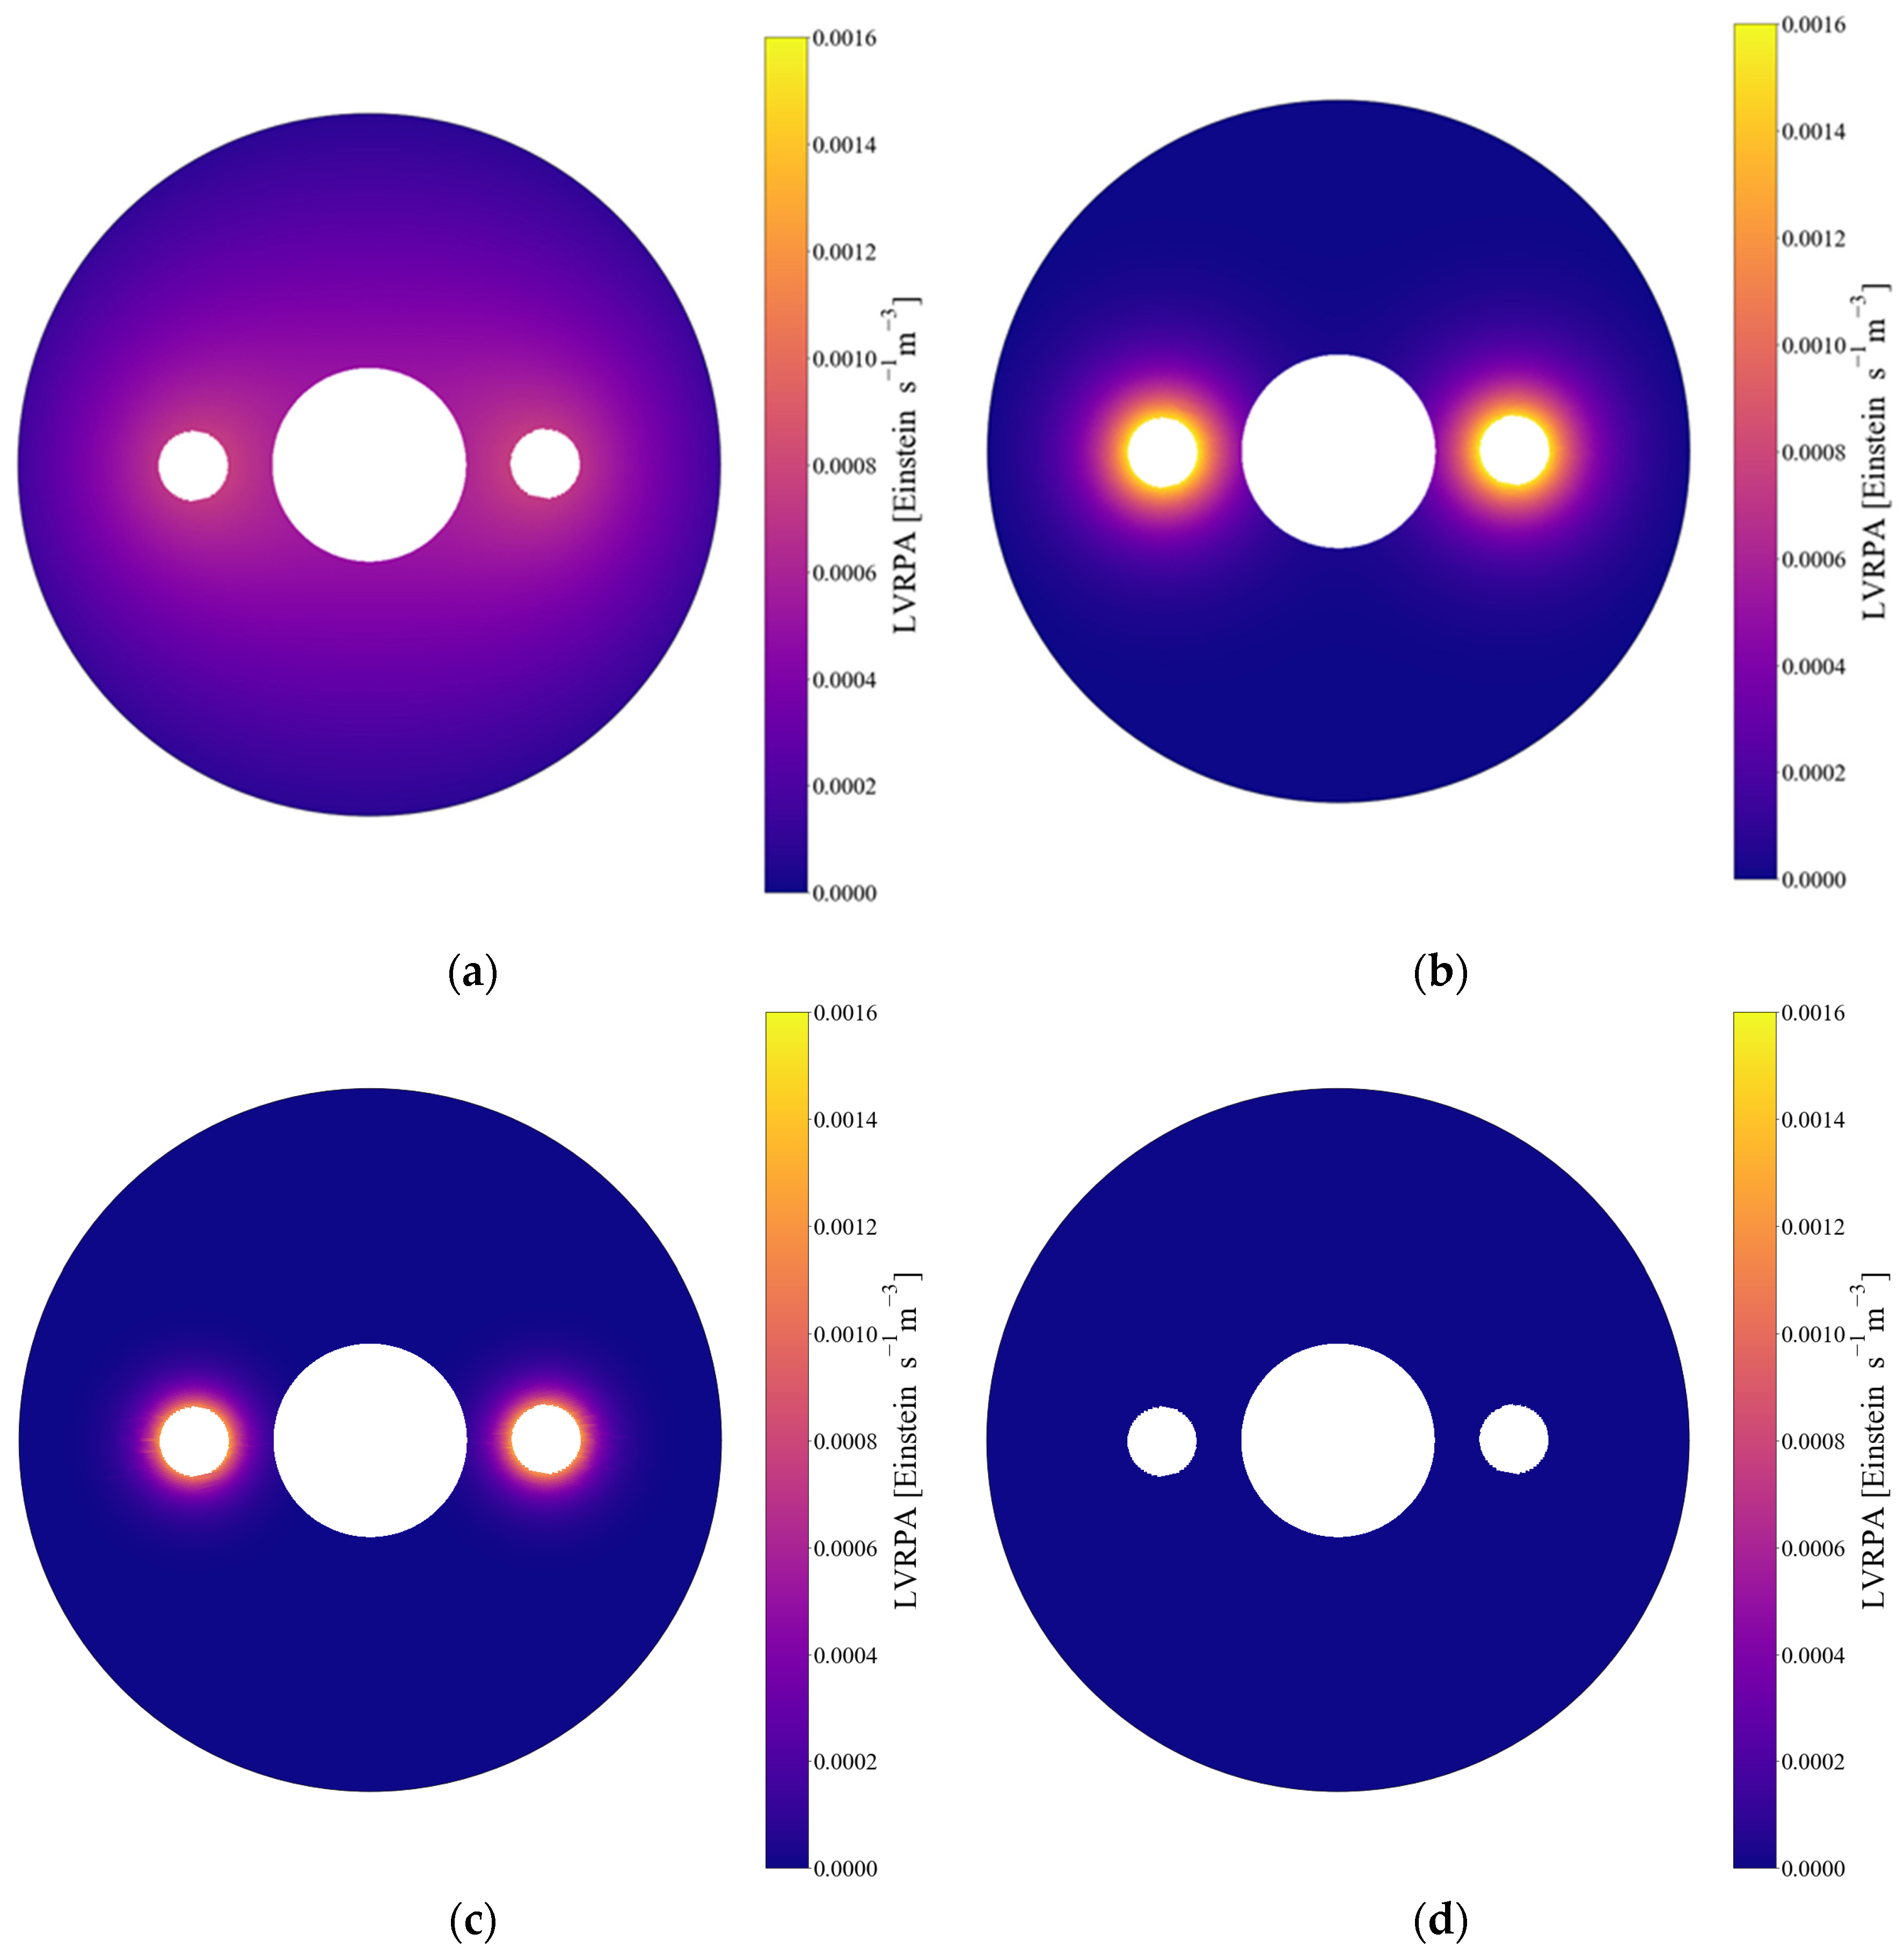
The catalyst particles near the emission sources strongly screened the photons for outer particles. Thus, the LVRPA for the catalyst particle near the walls of the flotation cell was almost null.
Figure 6 depicted the computed distribution of the LVRPA for a transversal view of the reactor at catalyst loads of 10, 50, 100, and 800 ppm.
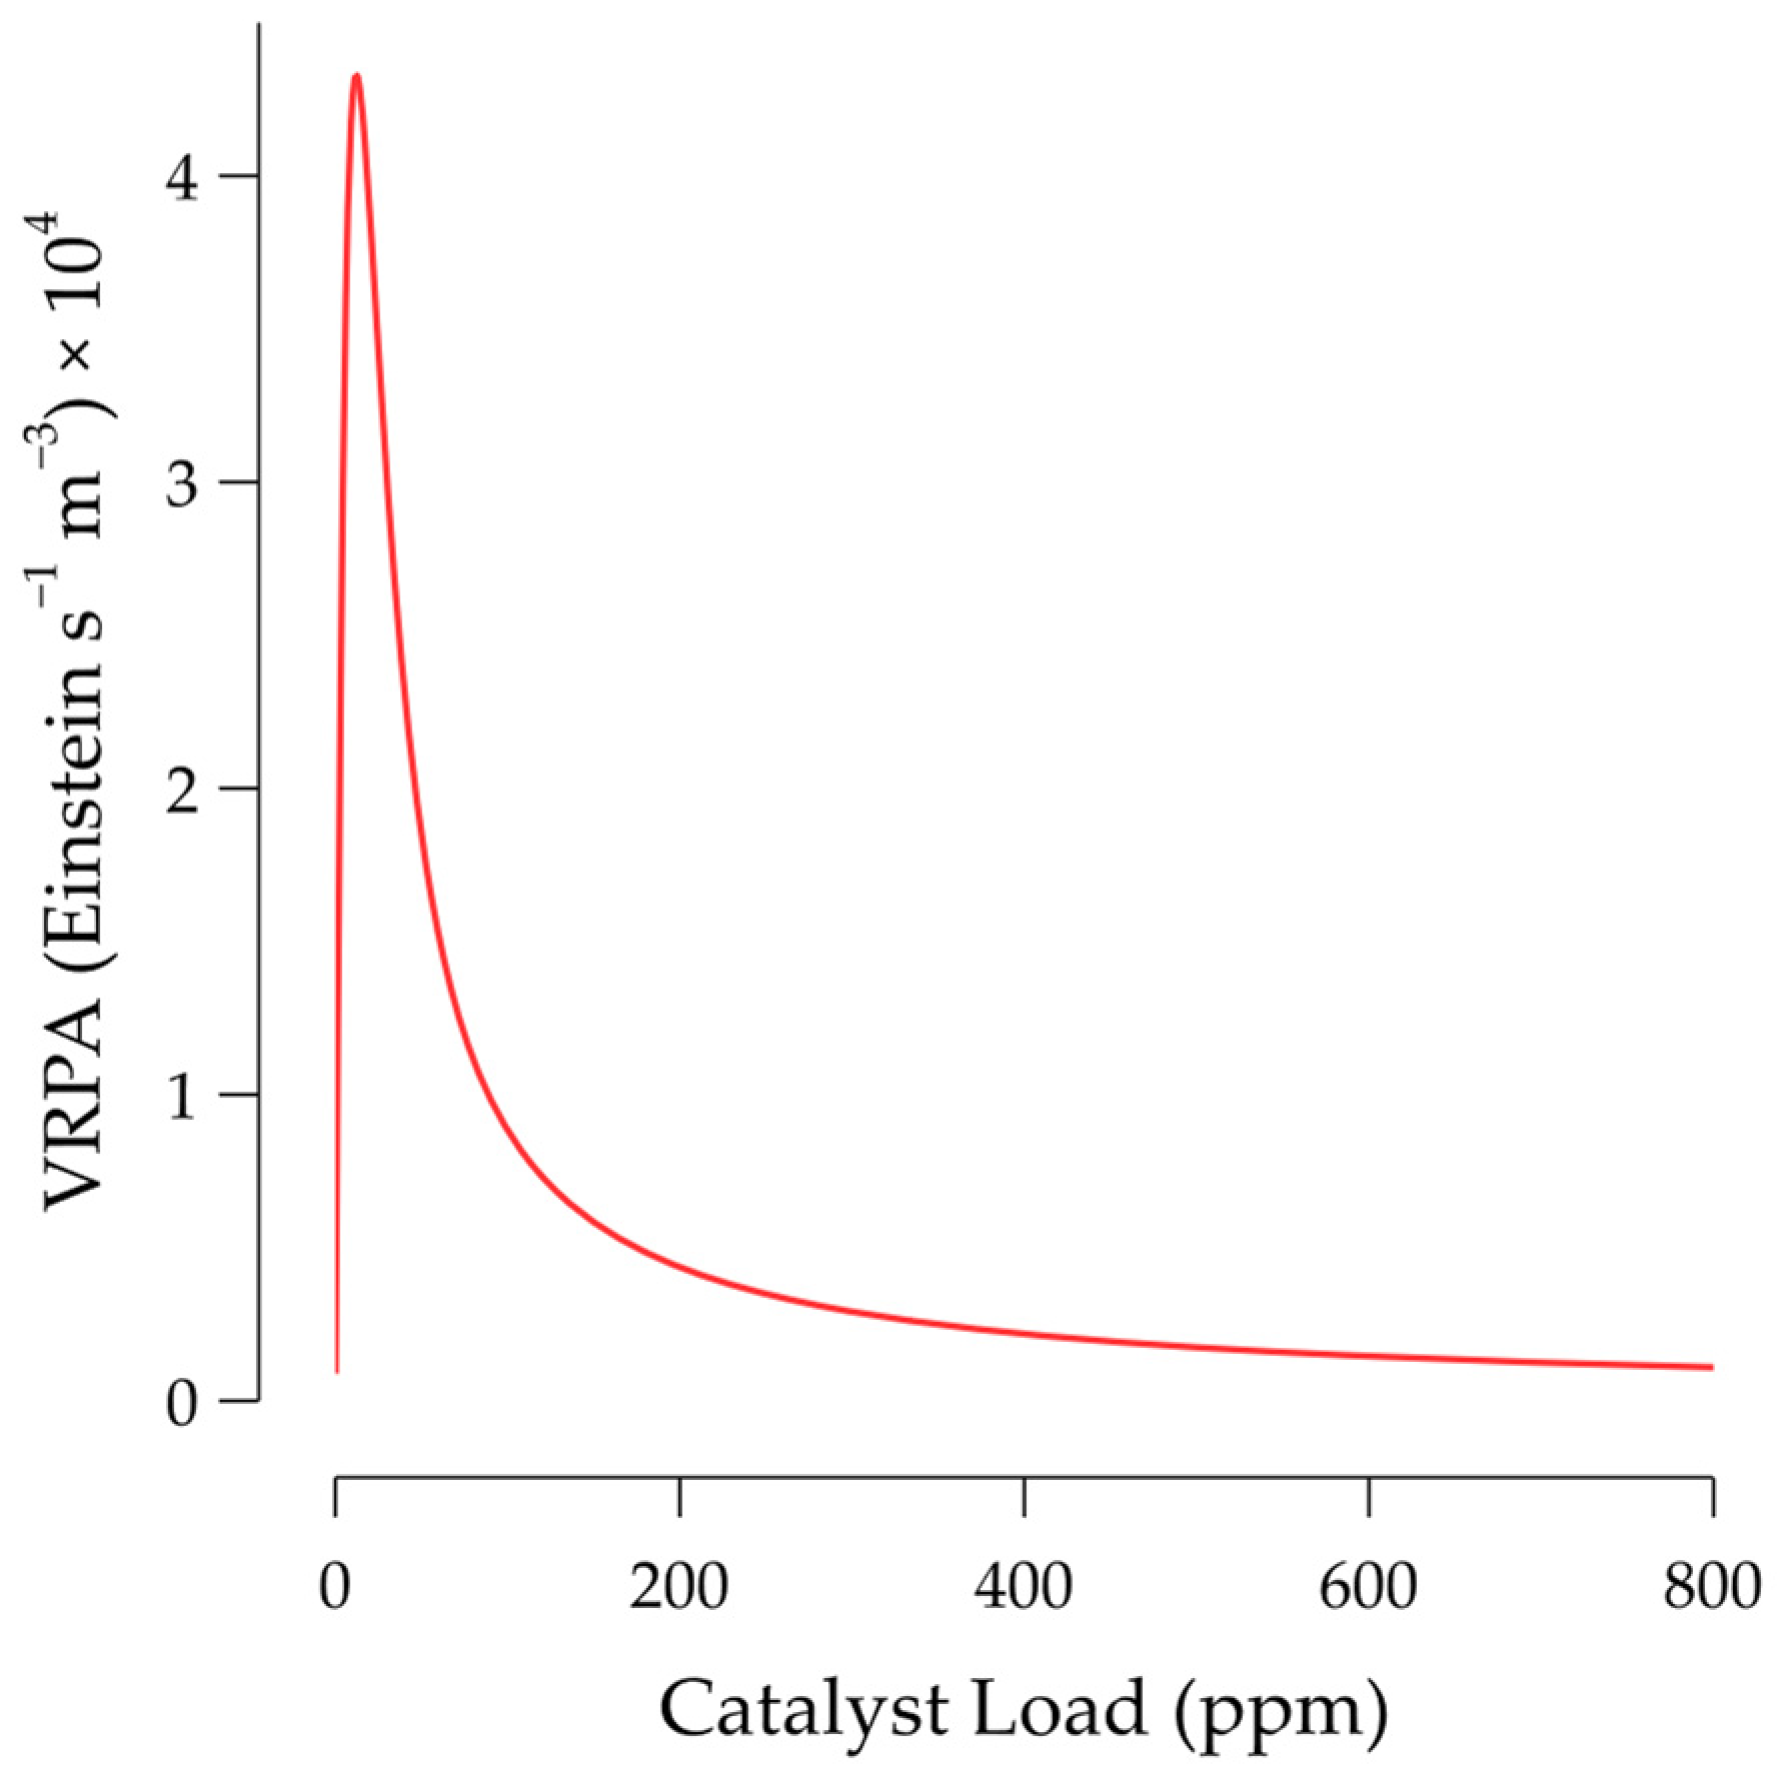
According to these observations, the range of catalyst loads employed was far from the VRPA optimal value.
Figure 7 confirmed it, as it showed that the maximum value for the VRPA was located at 12 ppm.
The mathematical model was fed with the dataset from
Figure 7 to interpolate the corresponding VRPA value given the catalyst load. The resulting system was constructed in terms of
. The photolysis and photocatalysis reactions from
Table 1 were included according to (49).
The optimal values for the photocatalysis and photolysis rate constants were summarized in
Table 4. According to
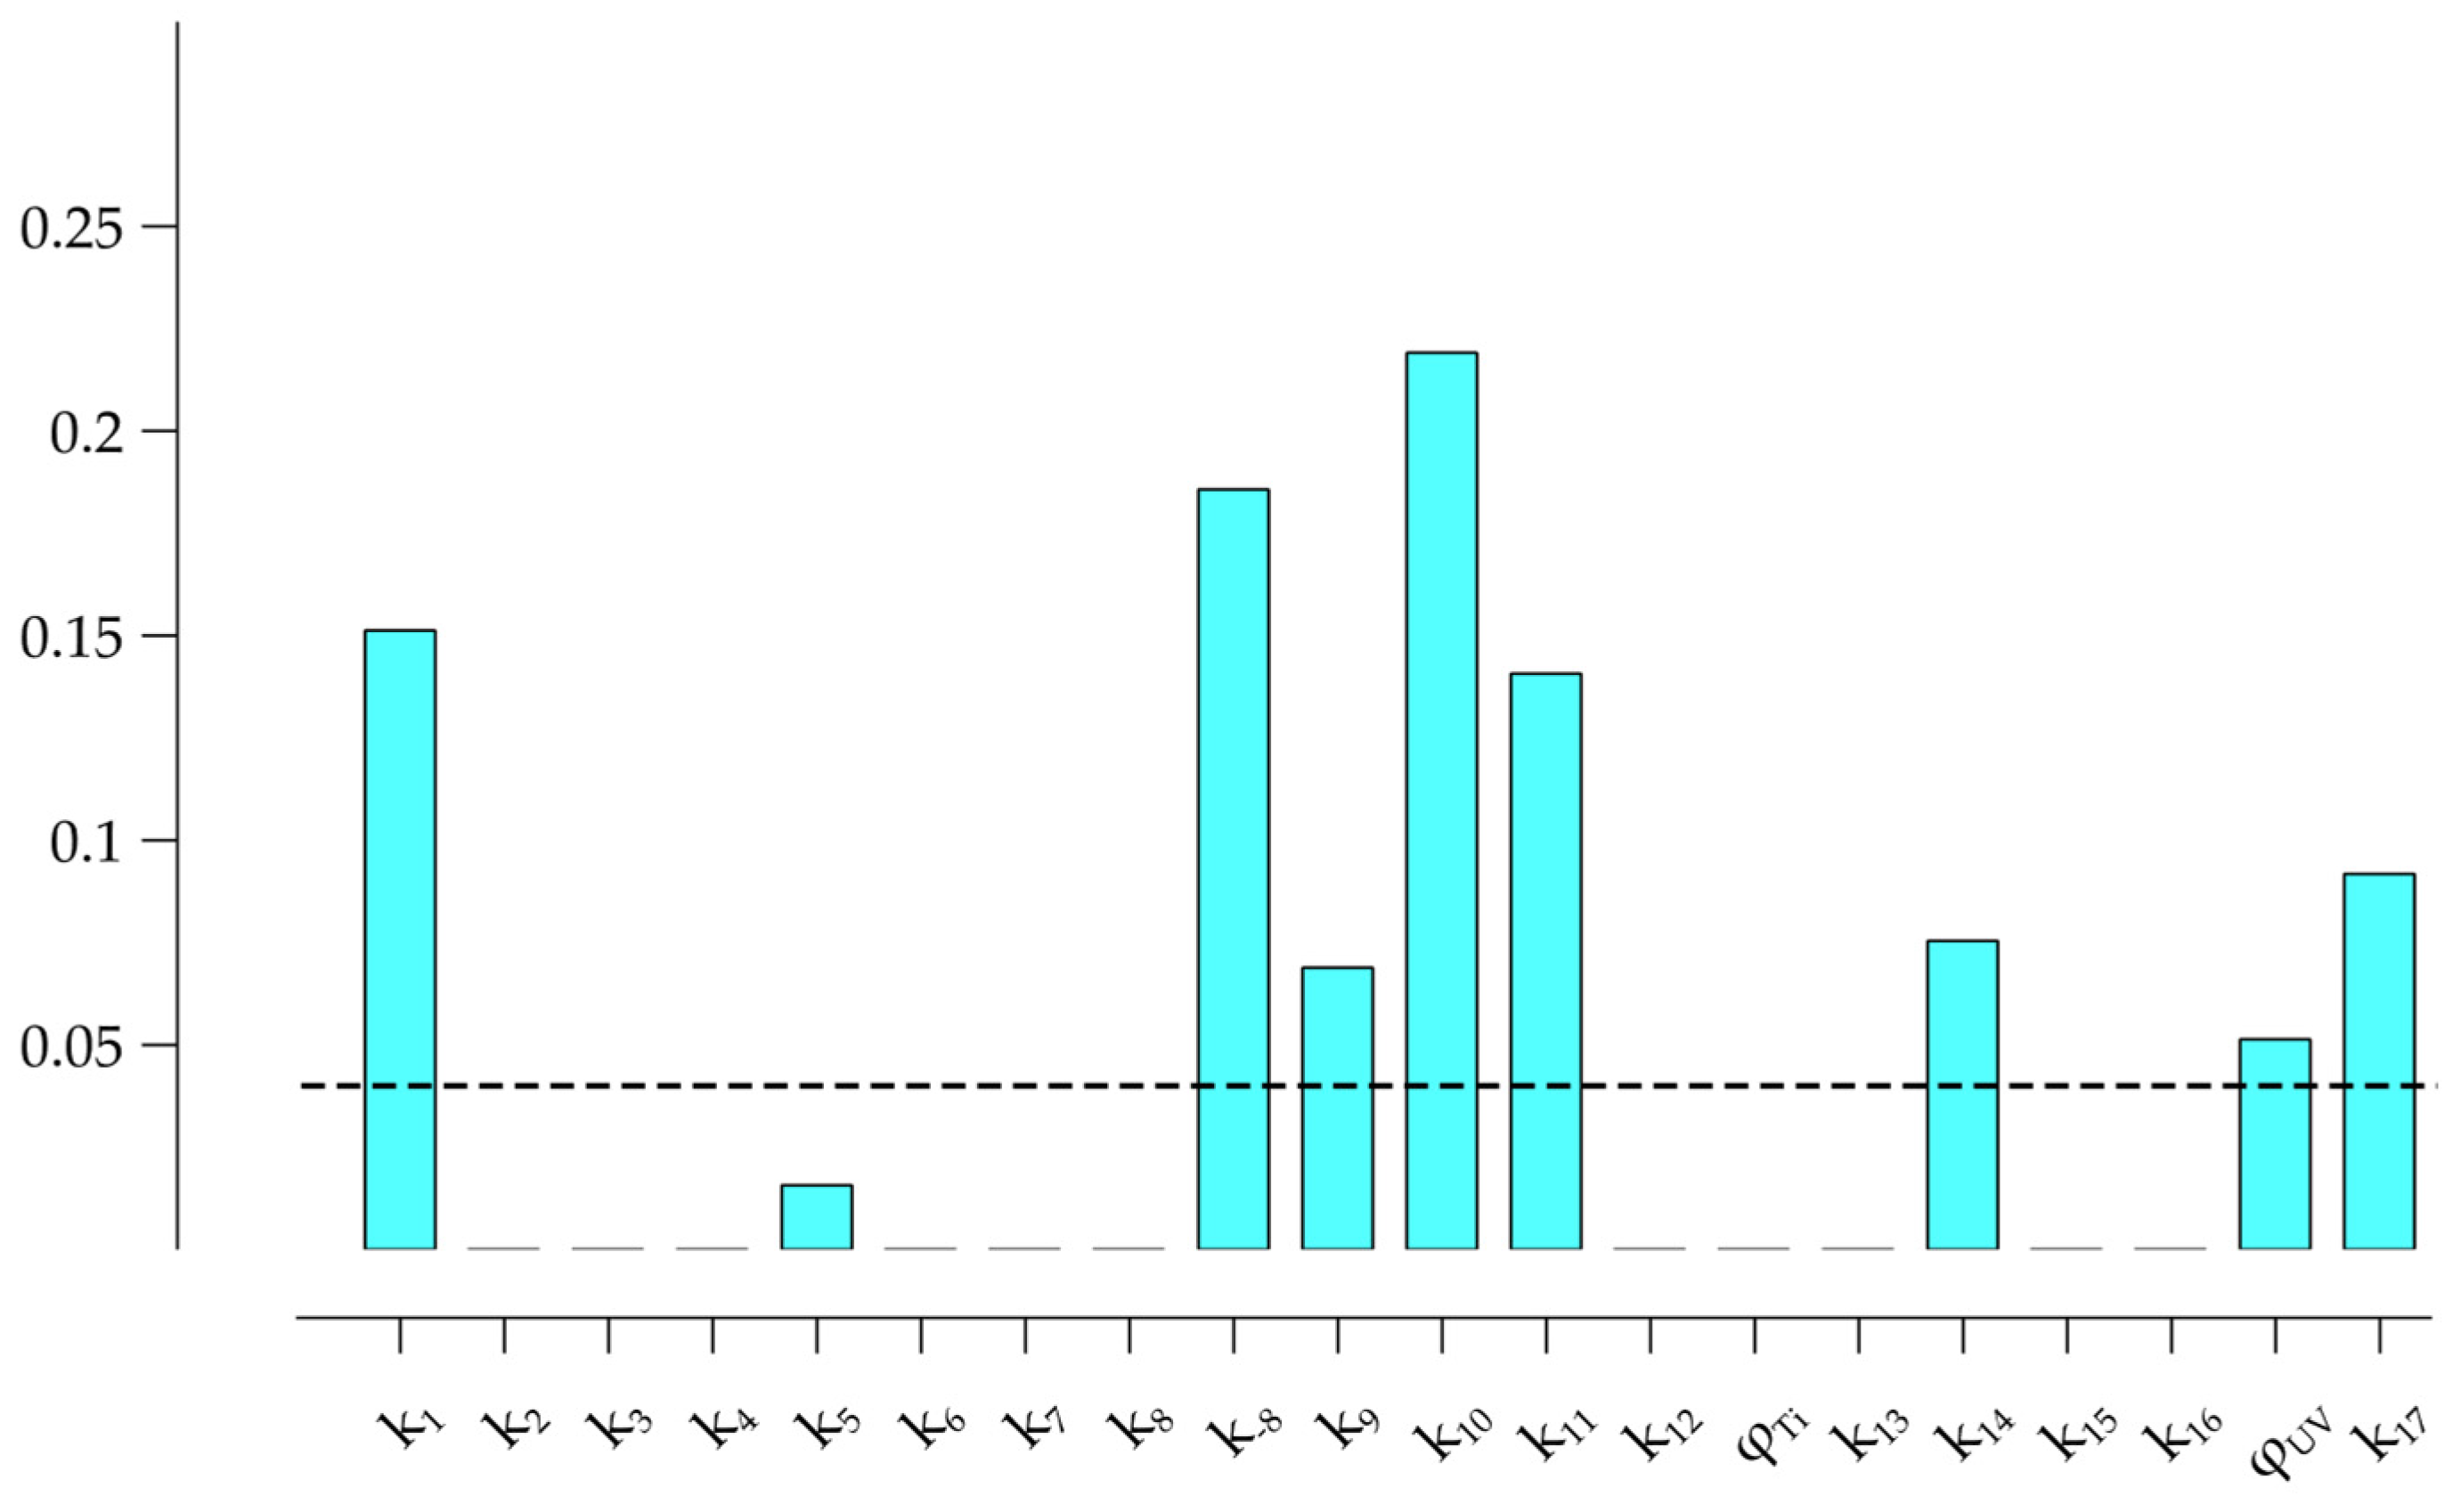
Figure 8, the simplified mechanism only included reactions (1), (8), (9), (14), (15), (21), (26) and (27). The participation of (25) acted as a route for radical hydroxyl consumption with a higher probability than (16).
Again, the ozone excess allowed the direct diclofenac destruction by ozone to dominate the process kinetics. However, the degradation kinetic was even slower for the low ozone dose than observed in the COz process. It was attributed to the ozone photolysis reaction.
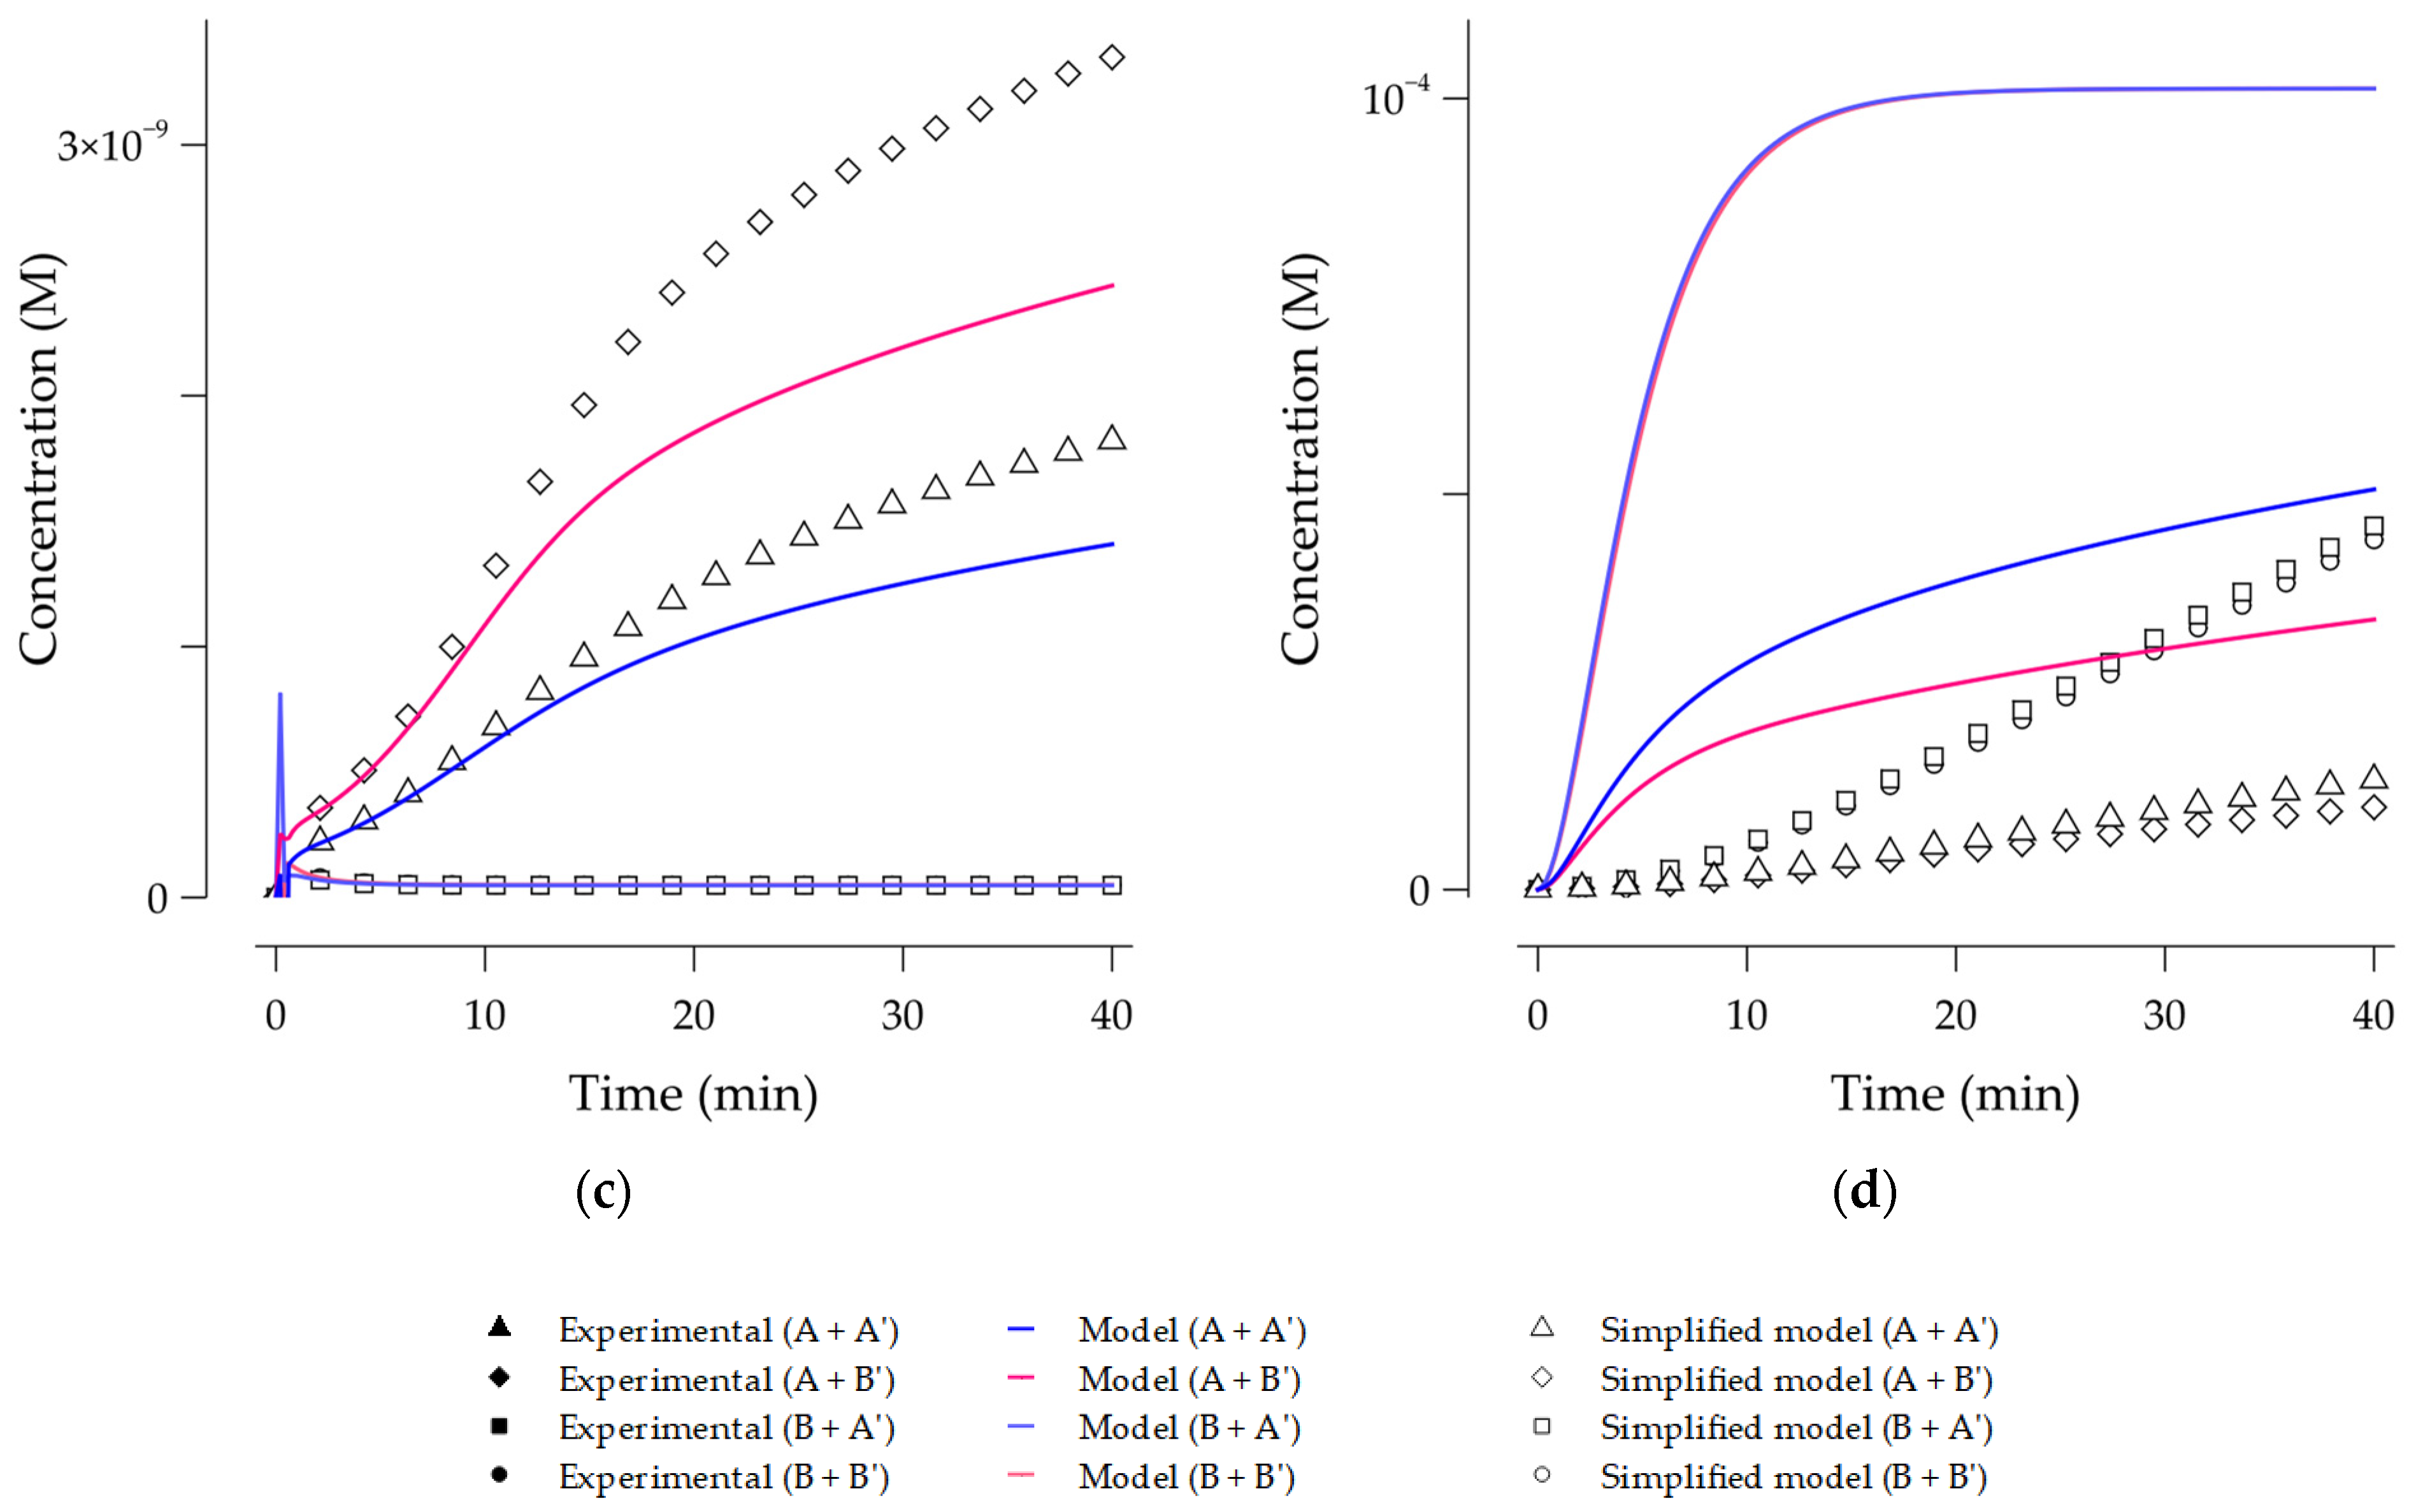
Figure 9 presents the concentration profiles for each of the experiment configurations. Because of the photolysis, ozone accumulation was slower compared with the COz and Oz processes. Besides, from
Figure 9d, the production of hydrogen peroxide was observed, which suggested the active role of the photolysis reaction.
5. Discussion
According to the EE/O estimates in terms of degradation, the PCOz and COz processes could save electrical consumption compared to the Oz process only when there was enough ozone in the system to carry direct diclofenac destruction by ozone, reaction (1), without competing with the decomposition reactions (7.40 ppm). Although COz presented the lowest EE/O, the authors encourage further estimations of the EE/O in terms of TOC removal in order to fairly compare these processes, according to the work from Yu et al. [
31].
5.1. Kinetic Rate Constants
The kinetic rate constants from
Table 2 described a high discrepancy with the values reported in the literature. It suggested that the proposed mathematical model overestimated the rate at which the ozone molecules reacted in the system. Thus, the optimization algorithm weighted this situation by giving lower values to the kinetic constants and fit the experimental data.
According to Beltran et al., the ozonation of diclofenac describes a fast kinetic regime. Although this contrasted the current results, a fast kinetic regime would explain the expected high value of the homogeneous kinetic constants. The former would imply that a significant amount of ozone must react at the gas-liquid interface before dissolving [
36]. Then, a different mathematical approach would be required to deal with the microscopic material balance, i.e., Benbelkacem et al. proposed to simultaneously integrate the microscopic and reactor material balances and compute the enhancement and depletion factors for each time step [
70].
To the best of the authors’ knowledge, no experimental data was reported to compare the heterogeneous and photolysis rate constants. However, it was observed that the catalyst played a significant role in the production of hydroxyl radicals by ozone decomposition. The main reason was the use of a metallic-oxide-based catalyst as it is known to promote electron transfer because of the formation of functional groups at the surface of the catalyst [
71].
On the other hand, the photocatalysis rate constants had negligible values compared to
and
. It suggested that photocatalysis yielded a poor influence on the diclofenac degradation. This idea was in agreement with [
22]. In their observations, the photocatalysis of diclofenac yielded the slowest degradation. The
bandgap could explain this behavior as it limits the catalyst photoactivity [
72,
73,
74].
Meanwhile, (27) was a potential path for scavenging hydroxyl radicals according to the value of
. It was the highest value within the estimated rate constants, with a magnitude even higher than the reported value [
36], exhibiting an error superior to 100%. Nevertheless, earlier studies have met this kind of discrepancy, i.e., Huber et al. reported that
. Meanwhile, Sein et al. and Zhaoxu et al. have reported values of
and
, respectively [
35,
75,
76]. Even so, it was not discarded that the optimization algorithm could mask
to fit the experimental data. Therefore, more information about the processes is required to establish more robust constraints over the optimization problem.
No asseveration regarding the degradation products could be established as they were not experimentally measured. However, it was expected the occurrence of hydroxylated diclofenac species, mainly 5-hydroxydiclofenac, which is more reactive than its isomer 4-hydroxidiclonac that is produced during the metabolization of diclofenac [
77,
78]. The major concern about this degradation product of diclofenac is that it could be further oxidated into quinone imine derivatives, which are suspected to be responsible for the diclofenac toxic effects [
7,
79].
5.2. Behavior of the Mathematical Models
5.2.1. Ozonation Model
The ozone dose condition limited the model accuracy. Nevertheless, the model predicted the experimental data within an acceptable error margin. For the case of the experimental conditions, the Theil inequality coefficient was under 0.3. Thus, there was a good agreement with the studied data. According to
Figure 3a, the mathematical model overestimated the ozone effect over the diclofenac degradation. The fact that the mechanism did not consider intermediate species may have influenced the model predictions. Earlier studies on the diclofenac degradation with ozone have demonstrated that intermediates such as aminyl radicals and hydroxylated diclofenac derivatives affect the process kinetics [
35,
77].
The negligible influence over the diclofenac degradation presented by
and
(
Figure 2) explained the absence of ozone decomposition in
Figure 3b. However, this contrasted with Flyunt et al., as it is expected that ozone processes will yield hydroxyl radicals [
80]. Additionally, the hydroxyl radicals are likely to attack the aromatic ring because of their electrophilic nature. According to Sein et al., the hydroxyl radicals can initiate a mechanism for the production of 5-hydroxydiclofenac [
35]. Therefore, the optimization problem required more accurate constraints based on the concentration of additional chemical species.
5.2.2. Catalytic Ozonation Model
According to
Figure 5a,b, the catalyst supported the ozone decomposition, but this process was susceptible to the ozone dose. Thus, no decomposition occurred at 7.40 ppm
. Following the sensitivity analysis of
Figure 4, the direct diclofenac destruction by ozone (1) was not the most influential over the mechanism for this model. Instead, reaction (15) assumed this role. Then, for the case of 2.66 ppm
ozone was not in excess and diclofenac molecules had to compete with (14), whose rate constant was three orders of magnitude above
. Thus, for these conditions, the diclofenac degradation was slower. In addition, the increase in the catalyst load made the degradation rate even slower as a large surface was available for reaction (14).
Although the ozone excess in the system enhanced the diclofenac degradation rate,
Figure 5c showed that such conditions did not promote a significant generation of hydroxyl radicals; however, the high value of
suggested the opposite. According to this, it was likely that a deficit of hydrogen ions limited the rate of reaction (15).
Figure 5d supported this hypothesis as it did not show consumption of the ozonide radicals
. Then, the rate of reactions (3) and (9) was negligible. The former contrasted most of the research in COz processes [
34]. Nevertheless, it should not be discarded that unfavorable setting of the operational conditions can lead processes to poor performance. According to this, not all the ozone doses favored mineralization.
Based on the model’s simplifications, it was stated that the OAT sensitivity analysis did not provide enough information to discard kinetic constants without affecting the model outputs. Thus, the sensitivity analysis required a more robust analysis based on global methods to assess the interaction between parameters [
67,
81]. The most significant discrepancy of the simplified model was observed in
Figure 5d, where the trend of concentration profiles described a completely different behavior. However, predictions for the diclofenac remained unchanged as the hydroxyl attack reactions (4) and (16) did not influence this output.
5.2.3. Photocatalytic Ozonation Model
As observed in
Figure 6, the catalyst particles were likely to screen the photon flux for particles near the reactor walls. Consequently, further research should weigh the available number of active sites against the VRPA to find optimal operation conditions. According to
Figure 7, the catalyst loads employed in this work were considerably distant from the computed optimum value for the VRPA. However, considering the results for the COz model, a reduction in the catalyst load could also reduce the number of active sites. It was observed that the behavior described in
Figure 7 was analogous to the results from Colina et al. [
61], which supported the proposed methodology to estimate the VRPA in cases of multiple non-concentric lamps with annular photoreactors.
The only considerable photocatalytic reaction was (21). Meanwhile, the reactions induced by photolysis both seemed to affect the model outputs. Due to the number of interactions, the diclofenac degradation was slower than the COz.
Figure 9b showed that reactions (14) and (27) produced a fast decay in the ozone accumulation. This effect was scaled with the catalyst load employed, as a larger surface was available for reaction (14) to occur.
Additionally, from
Figure 9c, it was observed for the cases of high ozone dose that the concentration of hydroxyl radicals increased suddenly when the dissolved ozone concentration approximated to zero. The attained accumulation was higher than that observed in the COz model. Meanwhile, the accumulation predicted for the hydrogen peroxide described a similar behavior to the observations from Peyton and Glaze for ozone photolysis on distilled water [
82]. However, for the present work, the equilibrium concentration dropped to zero,
Figure 9d. Finally, as observed in the COz model, the simplification based on the sensitivity analysis added no significant error in the diclofenac concentration, but outputs for other chemical species changed considerably.
6. Conclusions
Through this study, a generalized reaction pathway for ozone and ozone-catalyst-based processes was proposed. The mechanism could describe the degradation kinetics for all the experiments in the modified flotation cell for different configurations of the ozone dose and the catalyst load. The models might be extended for applications with other metal oxide-based catalysts. However, it is worth noting that optical and surface properties should be replaced and the kinetic constants accounting for surface reactions should be estimated.
Although the employed experimental equations for the calculation were proposed for stirred tanks, they proved to describe ozone unreactive transport from the gas to the liquid phase for the current experimental conditions. However, the computed slow kinetic regime was discordant to the established theories from previous works. Therefore, it was stated that a first-order rate law was not a determinant criterion to characterize kinetic regimes for ozone-based processes applied in the degradation of diclofenac.
The proposed approach for the VRPA estimation stood valid within the employed range of experimental variables of the current study and for the proposed mathematical models, although no formal validation was designed. Nevertheless, the selected values of the catalyst load were far from yielding an optimum for the VRPA.
No premature convergence was observed in estimating the rate constants; this suggested a high probability of reaching a global minimum for the objective function (18). In addition, all the experiments presented a . The former was traduced as a strong agreement between predictions and experimental data. Nevertheless, the homogeneous rate constants were discordant with the already reported values, which suggested that the optimization algorithm masked the magnitudes of the constants to fit the data.
Only the Oz process accepted the simplifications based on the sensitivity analysis without considerable changes on their outputs. However, for predictive purposes of the diclofenac concentration, the three simplified models could be employed within the current experimental conditions.
The PCOz promoted a higher amount of hydroxyl radical than the COz. However, this production only became significant when all the dissolved ozone was consumed. Moreover, more research is required to establish the optimal experimental configuration for the PCOz to exploit photoactivity and surface availability. The use of UVB/UVC could improve the rate of photocatalysis reactions.
Supplementary Materials
The following are available online at
https://www.mdpi.com/article/10.3390/w13121670/s1, Figure S1: First-order rate law predictions for the diclofenac concentration in the ozonation process, Figure S2: First-order rate law predictions for the diclofenac concentration in the catalytic ozonation process, Figure S3: First-order rate law predictions for the diclofenac concentration in the photocatalytic ozonation process, Table S1: Constants employed to estimate the LVRPA, Table S2: Mass transfer constants for the flotation cell, Table S3: Electrical energy per order (EE/O) for each process conditions.
Author Contributions
Conceptualization, J.L.-R., M.A.M., and F.M.-M.; methodology, B.A.-A., J.L.-R., and J.D.-A. validation, B.A.-A. and J.L.-R.; formal analysis, B.A.-A., J.L.-R., and J.D.-A.; investigation, B.A.-A. and J.L.-R.; writing—original draft preparation, B.A.-A.; writing—review and editing, B.A.-A., J.L.-R., and F.M.-M.; supervision, M.A.M. and F.M.-M.; project administration, F.M.-M.; funding acquisition, F.M.-M. All authors have read and agreed to the published version of the manuscript.
Funding
This paper was supported by Universidad del Valle (Colombia) and Sistema General de Regalias SGR (Colombia) with the projects CI. 2987 and Grant BPIN 2018000100096.
Institutional Review Board Statement
Not applicable.
Informed Consent Statement
Not applicable.
Data Availability Statement
Restrictions apply to the availability of these data. Data was obtained from [third party] and are available [from the authors/at URL] with the permission of [third party].
Acknowledgments
The author thanks Tecnoparque Nodo Cali and Universidad del Valle. Diaz-Angulo and Lara Ramos thank the Ministerio de Ciencia Tecnología e Innovación for the Ph.D. Scholarship 647, 727 and for the financial support to produce this work through the project CI. 2987 and BPIN 2018000100096.
Conflicts of Interest
The authors declare no conflict of interest.
References
- Pemberthy, M.D.; Padilla, Y.; Echeverri, A.; Peñuela, G.A. Monitoring pharmaceuticals and personal care products in water and fish from the Gulf of Urabá, Colombia. Heliyon 2020, 6. [Google Scholar] [CrossRef]
- Yokota, H.; Taguchi, Y.; Tanaka, Y.; Uchiyama, M.; Kondo, M.; Tsuruda, Y.; Suzuki, T.; Eguchi, S. Chronic exposure to diclofenac induces delayed mandibular defects in medaka (Oryzias latipes) in a sex-dependent manner. Chemosphere 2018, 210, 139–146. [Google Scholar] [CrossRef]
- Singh, V.; Suthar, S. Occurrence, seasonal variations, and ecological risk of pharmaceuticals and personal care products in River Ganges at two holy cities of India. Chemosphere 2021, 268, 129331. [Google Scholar] [CrossRef] [PubMed]
- Gosset, A.; Wiest, L.; Fildier, A.; Libert, C.; Giroud, B.; Hammada, M.; Hervé, M.; Sibeud, E.; Vulliet, E.; Polomé, P.; et al. Ecotoxicological risk assessment of contaminants of emerging concern identified by “suspect screening” from urban wastewater treatment plant effluents at a territorial scale. Sci. Total Environ. 2021, 778, 146275. [Google Scholar] [CrossRef]
- Kermia, A.E.B.; Fouial-Djebbar, D.; Trari, M. Occurrence, fate and removal efficiencies of pharmaceuticals in wastewater treatment plants (WWTPs) discharging in the coastal environment of Algiers. Comptes Rendus Chim. 2016, 19, 963–970. [Google Scholar] [CrossRef]
- Alharbi, S.K.; Price, W.E.; Kang, J.; Fujioka, T.; Nghiem, L.D. Ozonation of carbamazepine, diclofenac, sulfamethoxazole and trimethoprim and formation of major oxidation products. Desalin. Water Treat. 2016, 57, 29340–29351. [Google Scholar] [CrossRef]
- Calza, P.; Sakkas, V.A.; Medana, C.; Baiocchi, C.; Dimou, A.; Pelizzetti, E.; Albanis, T. Photocatalytic degradation study of diclofenac over aqueous TiO2 suspensions. Appl. Catal. B Environ. 2006, 67, 197–205. [Google Scholar] [CrossRef]
- Rosal, R.; Rodríguez, A.; Perdigón-Melón, J.A.; Petre, A.; García-Calvo, E.; Gómez, M.J.; Agüera, A.; Fernández-Alba, A.R. Degradation of caffeine and identification of the transformation products generated by ozonation. Chemosphere 2009, 74, 825–831. [Google Scholar] [CrossRef]
- Antonopoulou, M.; Kosma, C.; Albanis, T.; Konstantinou, I. An overview of homogeneous and heterogeneous photocatalysis applications for the removal of pharmaceutical compounds from real or synthetic hospital wastewaters under lab or pilot scale. Sci. Total Environ. 2021, 765, 144163. [Google Scholar] [CrossRef]
- Tufail, A.; Price, W.E.; Hai, F.I. A critical review on advanced oxidation processes for the removal of trace organic contaminants: A voyage from individual to integrated processes. Chemosphere 2020, 260, 127460. [Google Scholar] [CrossRef]
- Dyrda, G.; Kocot, K.; Poliwoda, A.; Mele, G.; Pal, S.; Słota, R. Hybrid TiO2 @ phthalocyanine catalysts in photooxidation of 4-nitrophenol: Effect of the matrix and sensitizer type. J. Photochem. Photobiol. A Chem. 2020, 387, 2–8. [Google Scholar] [CrossRef]
- Jing, Z.; Cao, S.; Yu, T.; Hu, J. Degradation Characteristics of Aniline with Ozonation and Subsequent Treatment Analysis. J. Chem. 2015, 2015, 1–6. [Google Scholar] [CrossRef]
- Rekhate, C.V.; Srivastava, J.K. Recent advances in ozone-based advanced oxidation processes for treatment of wastewater—A review. Chem. Eng. J. Adv. 2020, 3, 100031. [Google Scholar] [CrossRef]
- Bavasso, I.; Poggi, C.; Petrucci, E. Enhanced degradation of paracetamol by combining UV with electrogenerated hydrogen peroxide and ozone. J. Water Process Eng. 2020, 34, 101102. [Google Scholar] [CrossRef]
- Wang, S.; Shiraishi, F.; Nakano, K. A synergistic effect of photocatalysis and ozonation on decomposition of formic acid in an aqueous solution. Chem. Eng. J. 2002, 87, 261–271. [Google Scholar] [CrossRef]
- Garrido-Cardenas, J.A.; Esteban-García, B.; Agüera, A.; Sánchez-Pérez, J.A.; Manzano-Agugliaro, F. Wastewater treatment by advanced oxidation process and their worldwide research trends. Int. J. Environ. Res. Public Health 2020, 17, 170. [Google Scholar] [CrossRef] [Green Version]
- Paździor, K.; Bilińska, L.; Ledakowicz, S. A review of the existing and emerging technologies in the combination of AOPs and biological processes in industrial textile wastewater treatment. Chem. Eng. J. 2019, 376, 120597. [Google Scholar] [CrossRef]
- Ferreiro, C.; Villota, N.; Lombra, J.I.; Rivero, M.J. An efficient catalytic process for the treatment of genotoxic aniline wastewater using a new granular activated carbon-supported titanium dioxide composite. J. Clean. Prod. 2019, 228, 1282–1295. [Google Scholar] [CrossRef]
- Ikhlaq, A.; Kasprzyk-Hordern, B. Catalytic ozonation of chlorinated VOCs on ZSM-5 zeolites and alumina: Formation of chlorides. Appl. Catal. B Environ. 2017, 200, 274–282. [Google Scholar] [CrossRef] [Green Version]
- Liu, Z.; Hosseinzadeh, S.; Wardenier, N.; Verheust, Y.; Chys, M.; Hulle, S. Van Combining ozone with UV and H2O2 for the degradation of micropollutants from different origins: Lab-scale analysis and optimization. Environ. Technol. 2019, 40, 3773–3782. [Google Scholar] [CrossRef]
- Guo, Y.; Zhang, Y.; Yu, G.; Wang, Y. Revisiting the role of reactive oxygen species for pollutant abatement during catalytic ozonation: The probe approach versus the scavenger approach. Appl. Catal. B Environ. 2021, 280, 119418. [Google Scholar] [CrossRef]
- Lara-Ramos, J.A.; Sánchez-Gómez, K.; Valencia-Rincón, D.; Diaz-Angulo, J.; Mueses, M.; Machuca-Martínez, F. Intensification of the O3/TiO2/UV advanced oxidation process using a modified flotation cell. Photochem. Photobiol. Sci. 2019, 18, 920–928. [Google Scholar] [CrossRef]
- Pelalak, R.; Heidari, Z.; Forouzesh, M.; Ghareshabani, E.; Alizadeh, R.; Marjani, A.; Shirazian, S. High performance ozone based advanced oxidation processes catalyzed with novel argon plasma treated iron oxyhydroxide hydrate for phenazopyridine degradation. Sci. Rep. 2021, 11, 964. [Google Scholar] [CrossRef] [PubMed]
- Turchi, C.S.; Ollis, D.F. Photocatalytic degradation of organic water contaminants: Mechanisms involving hydroxyl radical attack. J. Catal. 1990, 122, 178–192. [Google Scholar] [CrossRef]
- Zeng, Y.; Chen, D.; Chen, T.; Cai, M.; Zhang, Q.; Xie, Z.; Li, R.; Xiao, Z.; Liu, G.; Lv, W. Study on heterogeneous photocatalytic ozonation degradation of ciprofloxacin by TiO2/carbon dots: Kinetic, mechanism and pathway investigation. Chemosphere 2019, 227, 198–206. [Google Scholar] [CrossRef] [PubMed]
- Fathinia, M.; Khataee, A.; Aber, S.; Naseri, A. Development of kinetic models for photocatalytic ozonation of phenazopyridine on TiO2 nanoparticles thin film in a mixed semi-batch photoreactor. Appl. Catal. B Environ. 2016, 184, 270–284. [Google Scholar] [CrossRef]
- Bulanin, K.M.; Lavalley, J.C.; Tsyganenko, A.A. Infrared Study of Ozone Adsorption on TiO2 (Anatase). J. Phys. Chem. 1995, 99, 10294–10298. [Google Scholar] [CrossRef]
- Yu, D.; Wu, M.; Hu, Q.; Wang, L.; Lv, C.; Zhang, L. Iron-based metal-organic frameworks as novel platforms for catalytic ozonation of organic pollutant: Efficiency and mechanism. J. Hazard. Mater. 2019, 367, 456–464. [Google Scholar] [CrossRef]
- Yu, D.; Wang, L.; Yang, T.; Yang, G.; Wang, D.; Ni, H.; Wu, M. Tuning Lewis acidity of iron-based metal-organic frameworks for enhanced catalytic ozonation. Chem. Eng. J. 2021, 404, 127075. [Google Scholar] [CrossRef]
- Yu, G.; Wang, Y.; Cao, H.; Zhao, H.; Xie, Y. Reactive oxygen species and catalytic active sites in heterogeneous catalytic ozonation for water purification. Environ. Sci. Technol. 2020, 54, 5931–5946. [Google Scholar] [CrossRef] [PubMed]
- Yu, D.; Li, L.; Wu, M.; Crittenden, J.C. Enhanced photocatalytic ozonation of organic pollutants using an iron-based metal-organic framework. Appl. Catal. B Environ. 2019, 251, 66–75. [Google Scholar] [CrossRef]
- Mecha, A.C.; Chollom, M.N. Photocatalytic ozonation of wastewater: A review. Environ. Chem. Lett. 2020, 18, 1491–1507. [Google Scholar] [CrossRef]
- Fathinia, M.; Khataee, A.; Vahid, B.; Joo, S.W. Scrutinizing the vital role of various ultraviolet irradiations on the comparative photocatalytic ozonation of albendazole and metronidazole: Integration and synergistic reactions mechanism. J. Environ. Manag. 2020, 272, 111044. [Google Scholar] [CrossRef]
- Nawrocki, J.; Kasprzyk-Hordern, B. The efficiency and mechanisms of catalytic ozonation. Appl. Catal. B Environ. 2010, 99, 27–42. [Google Scholar] [CrossRef]
- Sein, M.M.; Zedda, M.; Tuerk, J.; Schmidt, T.C.; Golloch, A.; Von Sonntag, C. Oxidation of diclofenac with ozone in aqueous solution. Environ. Sci. Technol. 2008, 42, 6656–6662. [Google Scholar] [CrossRef]
- Beltrán, F.J.; Aguinaco, A.; García-Araya, J.F. Kinetic modelling of TOC removal in the photocatalytic ozonation of diclofenac aqueous solutions. Appl. Catal. B Environ. 2010, 100, 289–298. [Google Scholar] [CrossRef]
- Elliott, L.; Ingham, D.B.; Kyne, A.G.; Mera, N.S.; Pourkashanian, M.; Wilson, C.W. Genetic algorithms for optimisation of chemical kinetics reaction mechanisms. Prog. Energy Combust. Sci. 2004, 30, 297–328. [Google Scholar] [CrossRef]
- Yarsky, P. Using a genetic algorithm to fit parameters of a COVID-19 SEIR model for US states. Math. Comput. Simul. 2021, 185, 687–695. [Google Scholar] [CrossRef]
- Datta, S.; Dev, V.A.; Eden, M.R. Hybrid genetic algorithm-decision tree approach for rate constant prediction using structures of reactants and solvent for Diels-Alder reaction. Comput. Chem. Eng. 2017, 106, 690–698. [Google Scholar] [CrossRef]
- Tian, D.; Shi, Z. MPSO: Modified particle swarm optimization and its applications. Swarm Evol. Comput. 2018, 41, 49–68. [Google Scholar] [CrossRef]
- Kadi, M.A.; Akkouche, N.; Awad, S.; Loubar, K.; Tazerout, M. Kinetic study of transesterification using particle swarm optimization method. Heliyon 2019, 5. [Google Scholar] [CrossRef] [PubMed] [Green Version]
- Ding, Y.; Zhang, W.; Yu, L.; Lu, K. The accuracy and efficiency of GA and PSO optimization schemes on estimating reaction kinetic parameters of biomass pyrolysis. Energy 2019, 176, 582–588. [Google Scholar] [CrossRef]
- Seada, H.; Deb, K. A unified evolutionary optimization procedure for single, multiple, and many objectives. IEEE Trans. Evol. Comput. 2016, 20, 358–359. [Google Scholar] [CrossRef]
- Bühler, R.E.; Staehelin, J.; Hoigné, J. Ozone decomposition in water studied by pulse radiolysis. 1. HO2/O2- and HO3/O3- as intermediates. J. Phys. Chem. 1984, 88, 2560–2564. [Google Scholar] [CrossRef]
- Staehelin, J.; Buehler, R.E.; Hoigne, J. Ozone decomposition in water studied by pulse radiolysis. 2. Hydroxyl and hydrogen tetroxide (HO4) as chain intermediates. J. Phys. Chem. 1984, 88, 5999–6004. [Google Scholar] [CrossRef]
- Tomiyasu, H.; Fukutomi, H.; Gordon, G. Kinetics and mechanism of ozone decomposition in basic aqueous solution. Inorg. Chem. 1985, 24, 2962–2966. [Google Scholar] [CrossRef]
- Jans, U.; Hoigné, J. Activated carbon and carbon black catalyzed transformation of aqueous ozone into OH-radicals. Ozone Sci. Eng. 1998, 20, 67–90. [Google Scholar] [CrossRef]
- Hassani, A.; Khataee, A.; Fathinia, M.; Karaca, S. Photocatalytic ozonation of ciprofloxacin from aqueous solution using TiO2/MMT nanocomposite: Nonlinear modeling and optimization of the process via artificial neural network integrated genetic algorithm. Process Saf. Environ. Prot. 2018, 116, 365–376. [Google Scholar] [CrossRef]
- Beltran, F.J. Heterogeneous catalytic ozonation. In Ozone Reaction Kinetics for Water and Wastewater Systems; Lewis Publishers: London, UK, 2003. [Google Scholar]
- Lara-Ramos, J.A.; Diaz-Angulo, J.; Machuca-Martínez, F. Use of modified flotation cell as ozonation reactor to minimize mass transfer limitations. Chem. Eng. J. 2021, 405, 126978. [Google Scholar] [CrossRef]
- Inkeri, E.; Tynjälä, T.; Laari, A.; Hyppänen, T. Dynamic one-dimensional model for biological methanation in a stirred tank reactor. Appl. Energy 2018, 209, 95–107. [Google Scholar] [CrossRef]
- Ghuge, S.P.; Saroha, A.K. Catalytic ozonation for the treatment of synthetic and industrial effluents—Application of mesoporous materials: A review. J. Environ. Manag. 2018, 211, 83–102. [Google Scholar] [CrossRef]
- Brucato, A.; Rizzuti, L. Simplified modeling of radiant fields in heterogeneous photoreactors. 2. limiting “Two-Flux” model for the case of reflectance greater than zero. Ind. Eng. Chem. Res. 1997, 36, 4748–4755. [Google Scholar] [CrossRef]
- Li Puma, G.; Brucato, A. Dimensionless analysis of slurry photocatalytic reactors using two-flux and six-flux radiation absorption-scattering models. Catal. Today 2007, 122, 78–90. [Google Scholar] [CrossRef]
- Pasquali, M.; Santarelli, F.; Porter, J.F.; Yue, P.L. Radiative transfer in photocatalytic systems. AIChE J. 1996, 42, 532–537. [Google Scholar] [CrossRef]
- Akach, J.; Ochieng, A. Monte Carlo simulation of the light distribution in an annular slurry bubble column photocatalytic reactor. Chem. Eng. Res. Des. 2018, 129, 248–258. [Google Scholar] [CrossRef]
- Moreira, J.; Serrano, B.; Ortiz, A.; de Lasa, H. TiO2 absorption and scattering coefficients using Monte Carlo method and macroscopic balances in a photo-CREC unit. Chem. Eng. Sci. 2011, 66, 5813–5821. [Google Scholar] [CrossRef]
- Acosta-Herazo, R.; Valadés-Pelayo, P.J.; Mueses, M.A.; Pinzón-Cárdenas, M.H.; Arancibia-Bulnes, C.; Machuca-Martínez, F. An optical and energy absorption analysis of the solar compound parabolic collector photoreactor (CPCP): The impact of the radiation distribution on its optimization. Chem. Eng. J. 2020, 395, 125065. [Google Scholar] [CrossRef]
- Zazueta, A.L.L.; Destaillats, H.; Li Puma, G. Radiation field modeling and optimization of a compact and modular multi-plate photocatalytic reactor (MPPR) for air/water purification by Monte Carlo method. Chem. Eng. J. 2013, 217, 475–485. [Google Scholar] [CrossRef]
- Brucato, A.; Cassano, A.E.; Grisafi, F.; Montante, G.; Rizzuti, L.; Vella, G. Estimating radiant fields in flat heterogeneous photoreactors by the six-flux model. AIChE J. 2006, 52, 3882–3890. [Google Scholar] [CrossRef]
- Colina-Márquez, J.; Machuca-Martínez, F.; Li Puma, G. Photocatalytic mineralization of commercial herbicides in a pilot-scale solar CPC reactor: Photoreactor modeling and reaction kinetics constants independent of radiation field. Environ. Sci. Technol. 2009, 43, 8953–8960. [Google Scholar] [CrossRef]
- Grčić, I.; Li Puma, G. Six-flux absorption-scattering models for photocatalysis under wide-spectrum irradiation sources in annular and flat reactors using catalysts with different optical properties. Appl. Catal. B Environ. 2017, 211, 222–234. [Google Scholar] [CrossRef]
- Otálvaro-Marín, H.L.; Mueses, M.A.; Crittenden, J.C.; Machuca-Martinez, F. Solar photoreactor design by the photon path length and optimization of the radiant field in a TiO2-based CPC reactor. Chem. Eng. J. 2017, 315, 283–295. [Google Scholar] [CrossRef]
- Diaz-Angulo, J.; Lara-Ramos, J.; Mueses, M.; Hernández-Ramírez, A.; Li Puma, G.; Machuca-Martínez, F. Enhancement of the oxidative removal of diclofenac and of the TiO2 rate of photon absorption in dye-sensitized solar pilot scale CPC photocatalytic reactors. Chem. Eng. J. 2020, 381, 122520. [Google Scholar] [CrossRef]
- Blank, J.; Deb, K. Pymoo: Multi-objective optimization in Python. IEEE Access 2020, 8, 89497–89509. [Google Scholar] [CrossRef]
- Deb, K.; Sindhya, K.; Okabe, T. Self-adaptive simulated binary crossover for real-parameter optimization. In Proceedings of the GECCO 2007: Genetic and Evolutionary Computation Conference, London, UK, 7–11 July 2007; pp. 1187–1194. [Google Scholar]
- Saltelli, A.; Annoni, P.; Azzini, I.; Campolongo, F.; Ratto, M.; Tarantola, S. Variance based sensitivity analysis of model output. Design and estimator for the total sensitivity index. Comput. Phys. Commun. 2010, 181, 259–270. [Google Scholar] [CrossRef]
- Xu, M.; Yang, J.; Gao, Z. Using one-at-a-time sensitivity analysis designs for genetic algorithm solving continuous network design problems. In Proceedings of the 2009 International Joint Conference on Computational Sciences and Optimization, Hainan, China, 24–26 April 2009; Volume 2, pp. 114–118. [Google Scholar]
- Yu, S.; Yun, S.T.; Hwang, S., II; Chae, G. One-at-a-time sensitivity analysis of pollutant loadings to subsurface properties for the assessment of soil and groundwater pollution potential. Environ. Sci. Pollut. Res. 2019, 26, 21216–21238. [Google Scholar] [CrossRef] [PubMed]
- Benbelkacem, H.; Cano, H.; Mathe, S.; Debellefontaine, H. Maleic acid ozonation: Reactor modeling and rate constants determination. Ozone Sci. Eng. 2003, 25, 13–24. [Google Scholar] [CrossRef]
- Wang, J.; Chen, H. Catalytic ozonation for water and wastewater treatment: Recent advances and perspective. Sci. Total Environ. 2020, 704, 135249. [Google Scholar] [CrossRef]
- Hong, Y.C.; Lho, T.; Lee, B.J.; Uhm, H.S.; Kwon, O.P.; Lee, S.H. Synthesis of titanium dioxide in O2/Ar/SO2/TiCl 4 microwave torch plasma and its band gap narrowing. Curr. Appl. Phys. 2011, 11, 517–520. [Google Scholar] [CrossRef]
- Owolabi, T.O.; Gondal, M.A. A hybrid intelligent scheme for estimating band gap of doped titanium dioxide semiconductor using crystal lattice distortion. Comput. Mater. Sci. 2017, 137, 249–256. [Google Scholar] [CrossRef]
- Diaz-Angulo, J.; Arce-Sarria, A.; Mueses, M.; Hernandez-Ramirez, A.; Machuca-Martinez, F. Analysis of two dye-sensitized methods for improving the sunlight absorption of TiO2 using CPC photoreactor at pilot scale. Mater. Sci. Semicond. Process. 2019, 103, 104640. [Google Scholar] [CrossRef]
- Qiu, Z.; Sun, J.; Han, D.; Wei, F.; Mei, Q.; Wei, B.; Wang, X.; An, Z.; Bo, X.; Li, M.; et al. Ozonation of diclofenac in the aqueous solution: Mechanism, kinetics and ecotoxicity assessment. Environ. Res. 2020, 188, 109713. [Google Scholar] [CrossRef]
- Huber, M.M.; Canonica, S.; Park, G.Y.; Von Gunten, U. Oxidation of pharmaceuticals during ozonation and advanced oxidation processes. Environ. Sci. Technol. 2003, 37, 1016–1024. [Google Scholar] [CrossRef]
- Coelho, A.D.; Sans, C.; Agüera, A.; Gómez, M.J.; Esplugas, S.; Dezotti, M. Effects of ozone pre-treatment on diclofenac: Intermediates, biodegradability and toxicity assessment. Sci. Total Environ. 2009, 407, 3572–3578. [Google Scholar] [CrossRef] [PubMed]
- De Jesus, A.C.S.P.S.; Costa, F.M.; das Neves, P.A.P.F.G.; Melo, F.P.A.; Silva, A.S.; Silva, O.P.P.; Santos, C.B.R.; Borges, R.S. The role of regioselective hydroxylation on toxicity of diclofenac and related derivatives. Mol. Simul. 2019, 45, 1454–1458. [Google Scholar] [CrossRef]
- Van Leeuwen, J.S.; Vredenburg, G.; Dragovic, S.; Tjong, T.F.J.; Vos, J.C.; Vermeulen, N.P.E. Metabolism related toxicity of diclofenac in yeast as model system. Toxicol. Lett. 2011, 200, 162–168. [Google Scholar] [CrossRef]
- Flyunt, R.; Leitzke, A.; Mark, G.; Mvula, E.; Reisz, E.; Schick, R.; Von Sonntag, C. Determination of .OH, O2.-, and hydroperoxide yields in ozone reactions in aqueous solution. J. Phys. Chem. B 2003, 107, 7242–7253. [Google Scholar] [CrossRef]
- Cukier, R.I.; Fortuin, C.M.; Shuler, K.E.; Petschek, A.G.; Schaibly, J.H. Study of the sensitivity of coupled reaction systems to uncertainties in rate coefficients. I Theory. J. Chem. Phys. 1973, 59, 3873–3878. [Google Scholar] [CrossRef]
- Peyton, G.R.; Glaze, W.H. Destruction of pollutants in water with ozone in combination with ultraviolet radiation. 3. photolysis of aqueous ozone. Environ. Sci. Technol. 1988, 22, 761–767. [Google Scholar] [CrossRef] [PubMed]
| Publisher’s Note: MDPI stays neutral with regard to jurisdictional claims in published maps and institutional affiliations. |
© 2021 by the authors. Licensee MDPI, Basel, Switzerland. This article is an open access article distributed under the terms and conditions of the Creative Commons Attribution (CC BY) license (https://creativecommons.org/licenses/by/4.0/).


 ,
, 


