Article

A Weight of Evidence (WOE) Approach to Assess Environmental Hazard of Marine Sediments from Adriatic Offshore Platform Area

by
Loredana Manfra
1,2,*,
Chiara Maggi
1,
Giuseppe d’Errico
3,
Alice Rotini
1,
Barbara Catalano
1,
Silvia Maltese
1,
Ginevra Moltedo
1,
Giulia Romanelli
1,
Giulio Sesta
1,
Giuseppe Granato
1,
Pasquale Lanera
1,
Marina Amici
1,
Giacomo Martuccio
1,
Fulvio Onorati
1,
Rossella Di Mento
1,
Maria T. Berducci
1,
Gianluca Chiaretti
1,
Olga Faraponova
1,
Francesco Regoli
3 and
Andrea Tornambè
1
1
Istituto Superiore per la Protezione e la Ricerca Ambientale (ISPRA), 00144 Rome, Italy
2
Dipartimento di Biotecnologia Marina, Stazione Zoologica Anton Dohrn, 80121 Naples, Italy
3
Dipartimento di Scienze della Vita e dell’Ambiente, Università Politecnica delle Marche, 60131 Ancona, Italy
*
Author to whom correspondence should be addressed.
Water 2021, 13(12), 1691; https://doi.org/10.3390/w13121691
Submission received: 18 May 2021 / Revised: 10 June 2021 / Accepted: 14 June 2021 / Published: 18 June 2021
(This article belongs to the Special Issue Aquatic Ecotoxicity Assessment)

Abstract

:
European legislative framework supports a multidisciplinary strategy of environmental monitoring because the environment is a complex system of abiotic and biotic interactions, and it should not be studied and protected by looking at one single aspect. The resulting heterogeneous data request to be carefully processed, and the application of Weight of Evidence (WOE) approaches is, thereby, an integrated validated tool. In this perspective, the present study aims to: (i). apply a specific model (Sediqualsoft) based on the WOE approach for processing multidisciplinary data related to four Lines Of Scientific Evidence (LOEs: chemical analyses, ecotoxicological bioassays, bioaccumulation tests and biomarkers) regarding sediments from an area of the Adriatic Sea; (ii). evaluate the usefulness of this specific integrated approach to estimate the potential environmental hazard due to the presence of gas production platforms respect to the traditional approach of sediment chemical characterization. This latter recognized a more contaminated area within 100 m of the platforms in which the Sediqualsoft model showed the presence of a chemical hazard, ranging from moderate to severe, and identified the contaminants (e.g., some metals, benzo(a)pyrene and acenaphthene) most responsible for it. A significant hazard also appeared in some of the sampled stations by analyzing the LOEs dedicated to the biological responses. The choice of different reference values (regulatory limits, threshold values or concentrations measured in the control area) influenced only the chemical hazard but not the overall integration with other LOEs, showing a moderate hazard for the majority of stations. Here, the concentrations measured in a control area are firstly proposed as possible reference values in Sediqualsoft model applications; this could be of particular relevance when Sediment Quality Guidelines are not available for all the measured substances. Moreover, the limitations of a conventional pass-to-fail approach or worst-case scenario were overcoming interpreting whole chemical and ecotoxicological results. All data analyzed and discussed confirm Sediqualsoft as a suitable tool for processing environmental data, including those first processed here on a monitoring scenario of gas platforms that discharge Produced Water into the sea.

1. Introduction

Different types of investigations are performed in environmental monitoring plans, from chemical to ecotoxicological and ecological analyses, although their independent interpretation is often misleading and not representative of the real environmental impacts due to contamination. In fact, contaminants are present concurrently, and biological responses are the result of both contaminant synergies and ecological interactions. Therefore, it is not always sufficient to investigate a broad spectrum of contaminants or a variety of biological patterns to assess the environmental hazard. Chemical analyses allow to measure the presence and concentration of contaminants in the environment. The water body contamination may be evaluated on the basis of regulatory limits as European Environmental Quality Standards (EQS): “…concentration of a particular pollutant or group of pollutants in water, sediment and biota that should not be exceeded to protect human health and the environment” [1]. Where EQSs are not available, concentrations measured for some contaminants may be compared to values measured in the control area or to threshold values below which adverse effects rarely occur as Effects Range Low (ERL) and Threshold Effect Level (TEL) [2,3]. However, the comparison between measured concentrations and regulatory thresholds is functional for the assessment of environmental chemical quality, but it does not take directly into account biological/ecological responses and potential toxic effects of chemical mixtures [4]. The interactions among different chemical compounds occurring in the environment cannot be fully evaluated; in this respect, the lack of chemical detection does not exclude pollution in the investigated area. Ecotoxicology may provide assessments of organismal, community and habitat health and integrity, even if the causative agent of the stress may not be immediately recognized. The bioassays may look into biological responses in the occurrence of pollution phenomena, considering different levels of biological organization (from molecular to community level). Ecotoxicological batteries, including species belonging to different taxonomic and trophic levels, should be preferred, and bioassays can be interpreted on the basis of toxicity scales, depending on the organism responses in the exposure experiments [5]. Changes in the structure of biological communities are indicators of potential natural and anthropic impacts and, therefore, one of the factors affecting environmental quality assessment [6]. A Weight of Evidence (WOE) approach is any process used to aggregate information from different Lines of Evidence (LOEs) to render a synthetic conclusion about the probability and magnitude of hazard [7]. The Sediment Quality Triad was the first WOE approach to integrate three LOEs: chemical analysis, toxicity tests and ecological analysis [8]. The triad allowed potential biological and ecological impacts to be related to contamination through a qualitative integrated assessment of the environmental data (e.g., low—adverse effects unlikely, medium—adverse effects may or may not occur, high—adverse effects likely). Unlike the original triad, the addition of more LOEs (e.g., bioaccumulation and biomarker analyses) has further improved the understanding of the relationships between chemical exposure and biological effects. Accumulation of contaminants in biota is an indication of their bioavailability and potential trophic transfer [9]. Biomarkers can represent the earliest warning signals of environmental disturbance, and the use of a multi-biomarker approach is recommended to assess organism health conditions [10,11]. For each biomarker, the measured variation may be compared to thresholds or control area data [12]. Synthetic indices are helpful to summarize the significance of all molecular/cellular alterations [13]. Interest is growing in the WOE approaches to environmental assessments, especially in the sediment quality assessment [14]. Sediment is a deposit of organic matter and contaminants, a refuge for benthic organisms and bacterial communities; in addition to its ecological value, it has a historical value as the sedimentary layers are a “reminder” of past contamination [15]. For this environmental compartment, WOE approaches are designed to integrate different LOEs: traditional chemical analyses can be combined with contaminant bioavailability or toxicity data on different species or molecular responses or even at the population/community level. With respect to the original Sediment Quality Triad, the latest WOE approaches quantitatively evaluate data by logical flowcharts and mathematical algorithms to provide a hazard index for each considered LOE, and then their different weights merge into an integrated environmental hazard assessment. The application of WOE methodologies also meets the needs of European Environmental Directives, such as the European Water Framework Directive (2000/60/CE) and the Marine Strategy Framework Directive (2008/56/CE), where the Member States are called to evaluate and classify the ecological status of water bodies using different indicators and combining multidisciplinary investigations in an integrated environmental risk assessment. In the present study, the environmental hazard associated with sediment contamination was assessed by using the Sediqualsoft model, a WOE approach integrating chemical analyses with biological and ecological investigations, quantifying a hazard quotient (HQ) in different classes: Absent, Slight, Moderate, Major and Severe [13,16]. A two-phase study was performed in an area of the Adriatic Sea influenced by the presence of two offshore gas platforms installed in the 1980s. Both may potentially affect the environment with a dual impact: one resulting from the discharge into the sea of Produced Water (the main discharge of the production process) and one from the physical presence of platforms and their industrial activities [17]. In the first phase, we evaluated sediment contamination by determining the concentrations of the main contaminants of the production process (trace metals, total hydrocarbons, volatile hydrocarbons and polycyclic aromatic hydrocarbons (PAHs)) and comparing the measured values with EQSs (when available) or, alternatively, with the values of the control area. In the second phase, the environmental hazard associated with core “hot spots” of contamination was assessed by the Sediqualsoft model through a weighted elaboration of data and integrating the chemical analyses in sediments with others LOEs (bioassays, bioaccumulation and biomarker analyses). Potential sediment toxicity was studied by a standard ecotoxicological battery: bioluminescence test with bacteria (Aliivibrio fischeri), algal growth assay (Dunaliella tertiolecta) and mortality test with copepods (Tigriopus fulvus). Moreover, a wide range of biomarkers was investigated on specimens of Hediste diversicolor after exposure to sediment: lysosomal membrane stability toward hexosaminidase method (LMS-ESO), an alteration in the antioxidant and/or biotransformation systems through catalase activity (CAT), the total glutathione level (tGSH), the whole capability to neutralize peroxyl and hydroxyl radicals (TOSCA ROO and TOSCA HO), glutathione S-transferases activities (GSTs), the presence of DNA damages through comet assay (COMET) and micronuclei frequency (MN), neurotoxicity through inhibition of acetylcholinesterase (AChE) and the eventual induction of metallothioneins or metallothionein-like proteins (MTs/MTLPs) synthesis. H. diversicolor is a test species widely used as sentinel, representative of the sedimentary compartment within an ecosystem [18,19,20,21,22]. These biological responses were integrated with an analysis of the accumulation of metals and PAHs in the same polychaetes. The study allowed evaluating the results and the usefulness of this WOE approach with respect to traditional chemical characterization of sediment and also a critical analysis of the first 10 years of applying of Sediqualsoft model to anthropic impacts in Mediterranean Sea assessments [9,12,13,16,23,24,25,26,27,28,29].

2. Materials and Methods

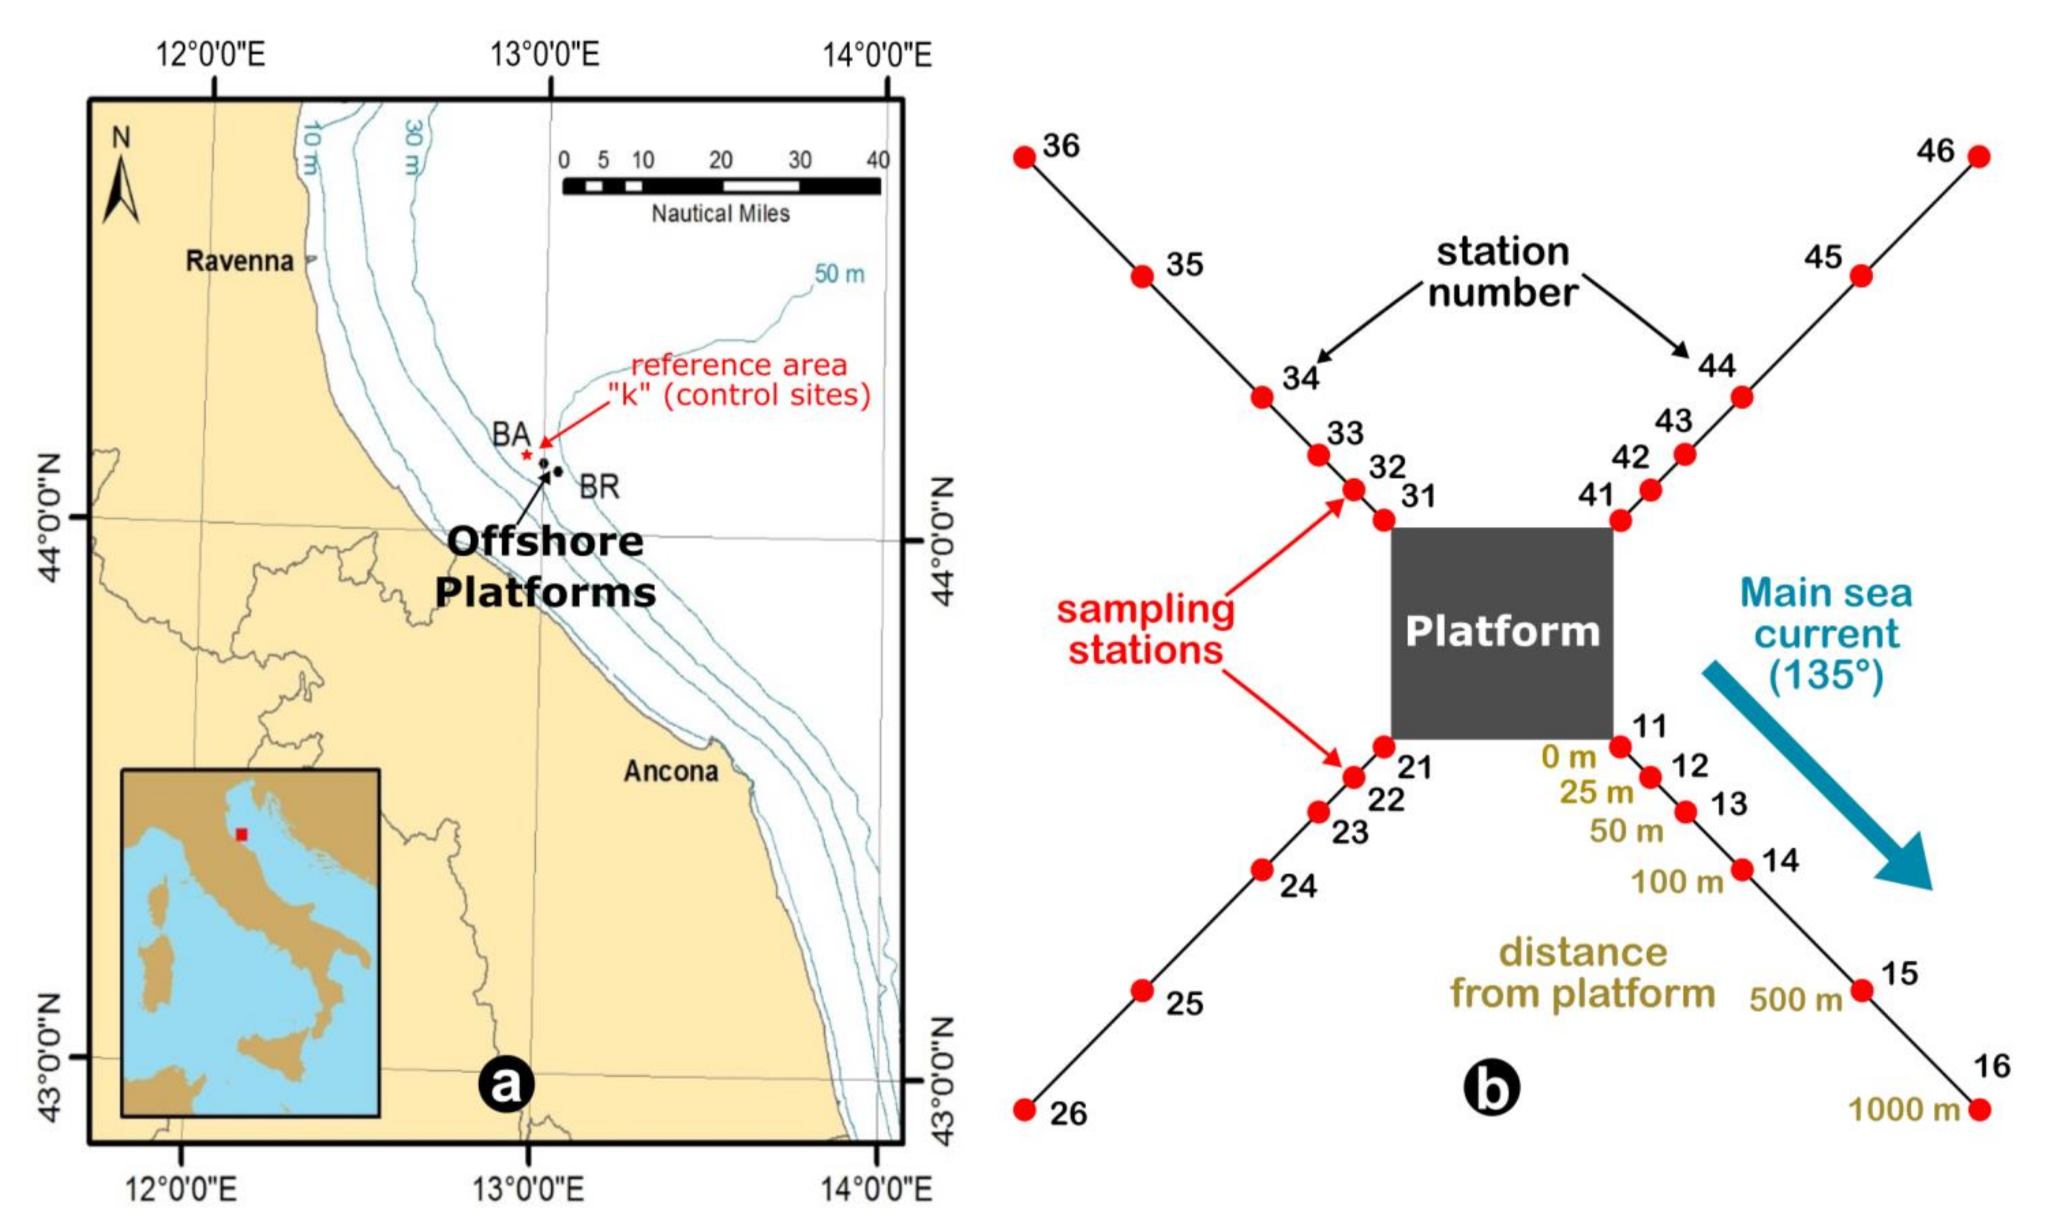
2.1. Strategy of Sampling and Experimental Design

Sediments were sampled in the Mediterranean basin, in an Adriatic Sea area between Ancona and Ravenna (Italy), characterized by the presence of 2 offshore structures (identified with BA and BR codes), located about 25 km (13.5 nautical miles) from the coast and on a 50 m deep seabed (Figure 1a).
The sampling plan included 24 stations for each platform along 2 transects: the first oriented in the direction of the main current (st. 11–16 and 31–36) and the second orthogonal (st. 21–26 and 41–46) to it (Figure 1b). Sample stations were located at increasing distances from the platforms (at 0, 25, 50, 100, 500 and 1000 m). In addition, 3 control sites (K1, K2, K3) were sampled as reference areas (identified with K code) approximately 3 miles NW of the selected platforms. These controls were placed at the vertices of a triangle at about 100 m from each other in the opposite direction to the mainstream of the Central–Northern Adriatic, thus excluding a possible influence of platform activities. A Van Veen Grab was used for sediment sampling at all stations, taking the first 2 cm of sediment. Chemical analyses were carried out on sediment samples from all the stations, while 4 sites (st. 11, 12, 13, 14) along the main current (at 0, 25, 50 and 100 m from the platforms) and the 3 controls (st. K1, K2, K3) were sampled for assessing the bioavailability of contaminants (bioaccumulation analyses) and sediment ecotoxicity (bioassays and biomarker investigations). However, the 4 above-mentioned stations were strategically selected considering the results of previous investigations showing the area at 100 m as the most affected in terms of sediment chemistry and dispersion of the Produced Water. Table 1 resumes analyzed parameters and adopted protocols for each LOE.

2.2. Chemical Characterization of Sediments

Total hydrocarbon content in the range nC10–C40 was analyzed according to UNI EN ISO [30]. A portion of freeze-dried sediment was added with a mixture of organic solvent and extracted by sonication. The organic phase was cleaned up on Florisil® (Carlo Erba, Milan, Italy) column and then analyzed by GC/FID.
Volatile organic fraction (BTEX and nC6–C10) was extracted from sediment and concentrated on a sorbent trap by purge and trap technique and then analyzed by GC/MSD according to EPA methods [31,32]. For the determination of PAHs, the sediment samples were freeze-dried, sieved at 2 mm and ground by an electric mill. The extraction was performed by Pressurized Fluid Extraction, and the chromatographic analysis was performed by HPLC with fluorescence detection according to EPA methods [33,34]. Total metal dissolution was conducted using an acid mixture in microwave-assisted digestion (Advanced Microwave Labstation Milestone Ethos TC, Fremont CA, USA). The dried sediment samples (35 °C for 48 h) were homogenized and digested with HNO3 and HCl [49]. The analytical determination of metals was performed by different methods: As and Cd by graphite furnace atomic absorption, with Zeeman background correction technique according to EPA Methods [36,37]; Hg by Direct Mercury Analyzer following the EPA Method [38], without sample pretreatment; Ba, Crtot, Cu, Fe, Mn, Ni, Pb and Zn by inductively coupled plasma optical emission spectrometry (ICP-OES, Agilent 5100, Santa Clara, CA, USA) according to the EPA Method [35]. To guarantee quality assurance and quality control (QA/QC), parameters such as accuracy, uncertainty, quantification limit and repeatability were estimated.

2.3. Hediste Diversicolor Exposure

Selected specimens (normophormed, immature, 9 ± 1 cm size) of H. diversicolor (O.F. Muller, 1776), purchased from a commercial bait supplier (Normandiè Appàts Italia (s.r.l.), Imperia, Italy), were washed and acclimated in aerated artificial sea water (ASW, Instant Ocean®, Aquarium Systems, Sarrebourg, France, at a salinity of 35 psu, filtered prior the use) for 48 h at 18 °C in darkness. During this period, polychaetes were supplied with glass tubes as artificial hiding places to avoid cannibalism phenomena [50]. The polychaete H. diversicolor was exposed for 10 days to the sediment under controlled laboratory conditions, following an adapted version of the ASTM method [51], as detailed below, before analyzing bioaccumulation and biomarkers. Prior organism exposure, eventual macrofauna and extraneous materials were removed from the sampled sediments before their homogenization. Test vessels were set up using glass containers of 1 l (Ø 12 cm) and 3 l (22 × 22 cm) capacity, respectively, for biomarkers and bioaccumulation analysis. Each container was prepared by adding sediments and then ASW at a 1:3 ratio (sediment:water). Once set up, test vessels were aerated and maintained in the dark at 18 °C for 24 h before introducing the organisms; the same conditions were applied for the whole experiment. On the whole, 13 replicates were set up for each tested sediment, including controls (10 for biomarkers and 3 for bioaccumulation analyses). Organisms were randomly distributed in each vessel in order to reach a final density of 5 individuals/liter. Throughout the 10-day exposure period, no food was supplied, and containers were controlled daily for temperature, dissolved oxygen (DO) and mortality, removing dead animals promptly. At the end of the exposure period, polychaetes were removed from sediments, rinsed with ASW and then placed in constantly aerated clean ASW at 18 °C for 24 h to allow depuration. Organisms were treated and stored according to the requirements of each single analysis (bioaccumulation and biomarkers). For each station, 3 pooled replicates were stored at −20 °C for chemical analysis (bioaccumulation), and 10 pooled replicates were stored for biomarker analyses.

2.3.1. Bioaccumulation Analyses

Bioaccumulation of PAHs and trace elements (Ba, Crtot, Cu, Fe, Mn, Ni, Pb, Zn, As, Cd and Hg) were carried out on the whole soft tissues of H. diversicolor specimens according to procedures. The polychaete samples for the determination of PAHs were freeze-dried and homogenized by an electric mill. The samples then underwent pressurized fluid extraction with concurrent in-cell clean up by solid-phase extraction on deactivated silica gel [33]. The concentrated extract subsequently underwent a saponification clean up by shaking with methanolic NaOH and was back-extracted with an apolar mixture. After water removal by anhydrous sodium sulfate, evaporation and filtration on 0.2 µm PTFE membrane, the extracts were analyzed by HPLC with fluorescence detection [34]. The determination of total metal content was conducted using an acid mixture in microwave-assisted digestion (Milestone Ethos TC). The dried organism tissues (35 °C for 48 h) were homogenized and digested with HNO3 and H2O2 according to EPA Method [52]. The analytical determination of metals was performed by different methods: As, Cd and Pb by graphite furnace atomic absorption (Varian Spectra 220Z, Santa Clara, CA, USA), with Zeeman background correction technique according to EPA Methods [36,37,39]; Hg by Direct Mercury Analyzer following the EPA Method [38], without sample pretreatment; Ba, Cr, Cu, Fe, Mn, Ni, and Zn by inductively coupled plasma optical emission spectrometry (ICP-OES) according to the EPA Method [35]. To guarantee quality assurance and quality control (QA/QC), parameters such as accuracy, uncertainty, quantification limit and repeatability were estimated.

2.3.2. Biomarkers Analyses

All detailed conditions for sample preparation have been reported in Moltedo et al. [53]. In addition, to evaluate genotoxic effects, coelomocytes were collected from ragworm by the extrusion method and used fresh for the Comet Assay or preserved in Carnoy fixative (acetic acid:methanol 1:3) for micronuclei evaluations [54]. Whole organism cell extracts were used for the evaluation of specific biomarkers, such as catalase (CAT), glutathione-S-transferases (GSTs), total glutathione content (tGSH), antioxidant defense capacity towards hydroxyl and peroxyl radicals (TOSCA HO and TOSCA ROO ), and also for the metallothionein/metallothionein-like protein quantification (MT/MTLPs) and the evaluation of neurotoxic effects by inhibition of acetylcholinesterase (AChE), which is the primary cholinesterase present in this species. Cryostat sections of the coelomic cavity were used instead for determining lysosomal integrity based on the cytochemical assay [40]. Methodological protocols for each biomarker analysis have been described elsewhere [40,41,53,55]. For each biological response, results obtained in organisms exposed to sediment samples from platforms were compared to results obtained in organisms exposed to control sediment. A parametric statistical analysis with One-way ANOVA was performed after testing the normal distribution of analysis results with Shapiro–Wilk test and homogeneity of variances with Cochran C test, followed by a post hoc analysis using Newmann Keuls test. In the case of non-normal data distribution, a non-parametric statistical analysis with Mann–Whitney U test was carried out. Differences with p < 0.05 were accepted as statistically significant. These statistical analyses are usually reported in the literature for biomarker data elaboration and have also been previously used in our studies [11,53].

2.4. Bioassays

Samples sediment were centrifuged at 2000× g for 30 min at 4 °C, and the supernatant was filtered with a nylon syringe filter (pore size 0.45 µm) and maintained at 4 °C until testing (within 24 h). Sediment pore water was tested by 3 bioassays. Algal growth test with D. tertiolecta was conducted on non-diluted samples, according to ISO protocol [47], with some modifications: using 24-well culture microplates as test containers, f/2 Guillard as a test medium, 6 replicates for sample (including controls) and 2000 cell/mL as initial inoculum. After 72 h, the cell concentration was estimated with a particle counter (Beckman Z1), and the growth inhibition of samples was statistically compared with the growth of controls (Tamhane-Dunnett Test). A mortality test with T. fulvus was carried out following the standardized protocol UNICHIM [48], using nauplii originating from a synchronized culture of about 200 ovigerous females (24–48 h) reared in artificial sea water (38 psu) prepared by Instant Ocean® salt mixture. Tests were carried out in 12-well flat-bottom tissue culture microplates at 19 °C ± 1 with a 16 h/8 h light/dark photoperiod and 500–1200 lux of light intensity, with 4 replicates for each sample and 10 individuals per replicate. After 96 h of exposure, the organisms were considered dead when they were unable to move any external appendage or internal member in a period of up to 20 s under stimulation. Test data were expressed as survival rate. Inhibition of bioluminescence of A. fischeri (as freeze-dried bacteria) was measured with Microtox® system (Modern Water Inc., New Castle, DE 19720, USA), following the Basic 90% Protocol ISO [46], with 7 sample dilutions and 3 replicates of controls. Software Microtox OmniTM v. 1.16 was utilized to calculate median effect concentration (EC50) and maximum effect after 30 min of exposure.

2.5. WOE Elaboration

A conceptual and software-assisted WOE model was developed to elaborate 4 LOEs (sediment chemistry, bioaccumulation, biomarkers and bioassays) within individual modules, with each considering several regulatory limits and threshold values. This allowed summarizing heterogeneous data into 4 specific synthetic indices (HQs), which were finally integrated, through a WOE approach giving a different weight to each LOE, into a hazard risk associated with sediments, creating a WOE index that includes 5 classes, ranging from “Absent” to “Severe” [9,13]. All details of individual LOEs elaboration algorithms, scientific criteria, rationale for weights, thresholds and expert judgments can be found elsewhere [9,12,13,23,24]. Concerning LOE1, the chemical hazard was obtained using the ratio between the concentration measured in investigated sediments and the relative threshold values, which included the EQS [1], ERL and TEL values [2,3]. The chemical hazard was also calculated using the ratio between the concentration measured in sediments around the platforms and the concentration measured in the reference area (K). Regarding the other LOEs (bioaccumulation, biomarkers and bioassays), the comparison was also conducted with respect to the “reference area,” using average data obtained from control sites.
In this investigation, assigned weights to the various LOEs were 1.0 for chemical characterization of sediments (LOE1), 1.2 for bioavailability of chemicals in H. diversicolor (LOE2), 1.0 for sub-lethal effects on biomarkers in H. diversicolor (LOE3) and 1.2 for the ecotoxicological results (LOE4).

3. Results

3.1. Chemical Characterization of Sediments

The content of the hydrocarbon component and trace metals were measured in sediment from 24 stations around each platform, including three controls (reference area K), as shown in Supplementary Materials (Tables S1 and S2). The concentrations measured were compared to EQS values, where these are established. Where EQSs were not available (e.g., total hydrocarbons), the concentrations measured in the platform area were compared to the mean value measured in the control area. Total hydrocarbon concentrations ranged from 8.6 to 155 mg/kg d.w. for the BR platform and from 12 to 1612 mg/kg d.w. for BA. At control sites, the mean total hydrocarbon concentration was 15 mg/kg d.w. In almost all sampled stations, the values of total hydrocarbons exceeded those of control sites, with the exception of stations 43, 44, 45 of BR and 23 and 25 of BA. Concentrations around the BA platform were higher than those detected around the BR platform, especially in the first 100 m along the main current direction. The highest concentration of this parameter was found in station 12 of BA (at about 25 m from the platform), about two orders of magnitude higher than in the control stations. However, the volatile organic fraction was almost always below the limit of quantification at most of the station. As for PAHs, the concentrations of the 15 compounds were generally lower than the EQS in all the sediment samples, from both the platform and the control stations, with minor exceedances in few cases. There were, however, two notable exceptions, the stations 14 and, especially, 21 of the BA platform: here the sum of total PAHs resulted, respectively, 1075 and 3765 ng/g d.w., and most of the hydrocarbons showed concentrations remarkably higher in comparison to both EQS values and concentrations measured in the control area. In general, trace metal levels were relatively high, with a decreasing gradient from the platforms towards the open sea for all chemical elements. Stations 12 and 21 near the BA platform exhibited a Pb enrichment of up to 10 times compared to the EQS and up to 16 times compared to control values. Ni and Cr also consistently exceeded EQS values in all stations, including those of the control area. Although there are no EQS values for Ba and Zn, their concentrations were relatively high, particularly in the stations close to platforms: Ba was up to 70 times higher and Zn up to 10 times compared to concentrations of control area.

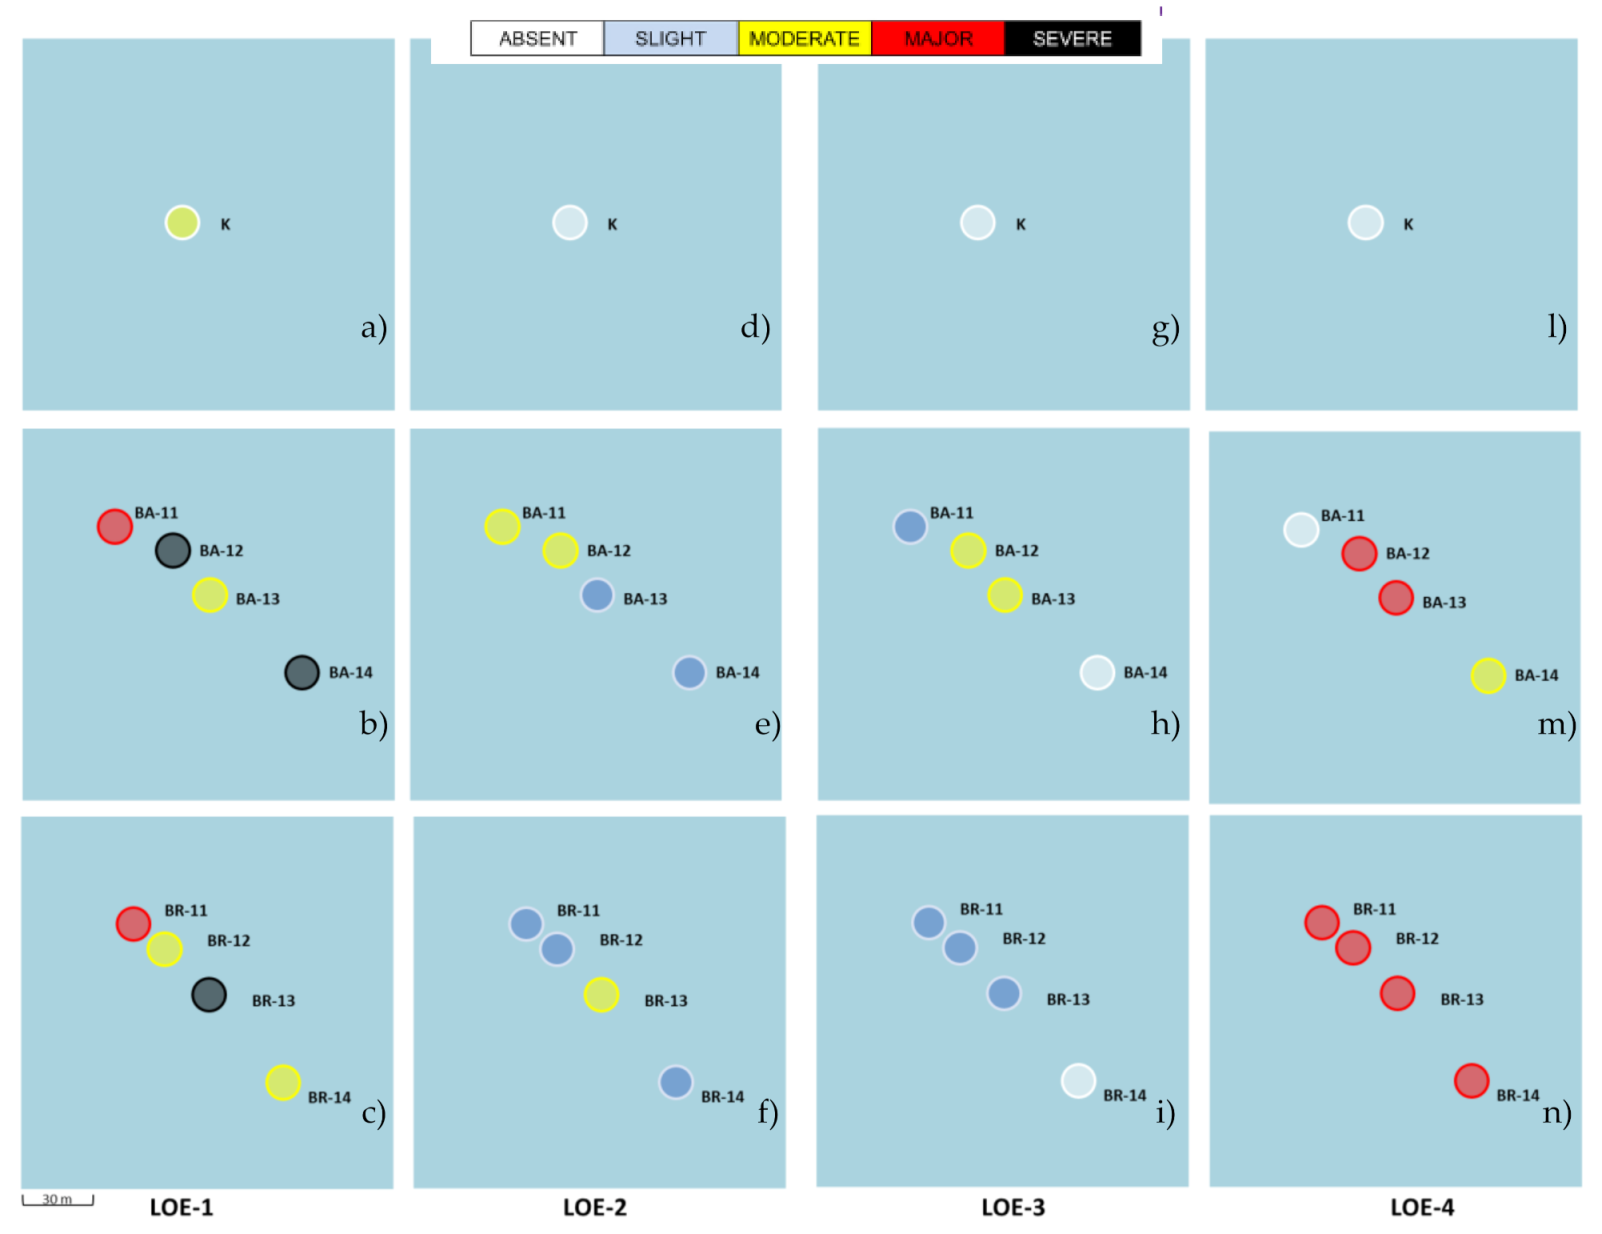
3.2. WOE Approach: Sediqualsoft Elaboration

The stations found to be more critical by the traditional chemical approach (4 hot spots within 100 m of each platform, stations 11, 12, 13 and 14) and the control stations were studied by multidisciplinary investigations (chemical analysis, bioaccumulation, biomarkers and bioassays). All data were processed with the WOE approach to assess the environmental hazard by applying both individual LOEs and their overall integration. Figure 2 reports the hazard levels for sediments calculated on the basis of each LOE elaboration for the sites of both the platforms and the control area (K).

3.2.1. LOE1—Level of Sediment Chemical Hazard

When chemical data were processed by Sediqualsoft against the weighted criterion of the EQS values, the control area and three stations (13 of BA, 12 and 14 of BR) exhibited moderate hazard, while three stations (12 and 14 of BA, 13 of BR) were severe and two (11 of BA and 11 of BR) major hazard, respectively (Figure 2a–c). Ni, Cd and Pb, together with benzo(a)pyrene, resulted in the most important parameters that have contributed to the definition of the weighted chemical hazard. The severity of sediment chemical hazard was also confirmed comparing measured concentrations toward threshold values below which adverse effects rarely occur (e.g., ERL and TEL); however, these thresholds available in the literature refer to typical North American test species, which are likely exposed to sediments with different geochemistry than those used in this study. When chemical data measured in the platform area were elaborated against the mean values measured in the control area, a severe hazard appeared in all stations of both platforms. Indeed, Ba, Zn, total hydrocarbons and acenaphthene are the ones that contribute the most to the severity of the hazard.

3.2.2. LOE2—Level of Hazard for Bioaccumulation

Although PAH bioaccumulation was generally higher in the platform stations with respect to the control area, only lighter and less toxic compounds were quantified, and the concentration values were limited (Table 2 and Table 3).
As for trace metals, only Cd and Ba showed significant bioaccumulation with respect to the control area. In the BA stations, Cd showed concentrations twice as high as the control area, while Ba reached levels of 10–20 times those found in the control area. Weighted elaboration of bioaccumulation data resulted in slight hazard for the majority of platform sites, with the exception of a moderate hazard in three stations (st. 11 and 12 of BA, st. 13 of BR) (Figure 2d–f), being Ba mainly responsible for the overall hazard level scores.

3.2.3. LOE3—Level of Hazard for Biomarkers

After 10 days of sediment exposure, the survival rate of polychaetes was ≥80 %. Mean values and standard deviations of biological responses are reported in Table 4. No significant sublethal effects of the physiological status (LMS-CYT/ESO) were observed in organisms exposed to the offshore platform sediments compared to control sediment, neither onset of effects linked to a specific class of contaminants such as metals or organic compounds (MT/MTLPs level, AChE inhibition), nor alteration of activity/level of single or total components of the antioxidant and biotransformation systems (CAT, TOSCA ROO, TOSCA HO, GSTs). Significant genotoxicity (p < 0.05) was detected in some stations, mainly in BA: increasing of DNA damage measured as DNA fragmentation (st. 11 and 13 of BA, 11 of BR), and MN frequency (st. 12 and 13 of BA), and alteration of total glutathione level (st. 12 of BA). The WOE analysis for biological responses integrating all biomarker data has shown generally a slight or no hazard for both the offshore platforms (Figure 2g–i). Only two BA stations (st. 12 and 13) showed a moderate hazard derived from the COMET, MN and tGSH results.

3.2.4. LOE4—Level of Hazard for Bioassays

Negligible effects were recorded by the Microtox® assay for all the samples near the platforms and controls. The algal bioassay showed great effects of growth rate stimulation in all the pore water samples. The major biological effects were recorded with T. fulvus: seven of eight platform samples showed high percentage of mortality for copepods (Table 5).
WOE elaboration integrating all data of bioassays showed the prevalence of a major hazard in the area, decreasing to moderate 100 m away from the BA platform (st. 14). No hazard was recorded for the control area and the nearest station to the BA platform (st. 11) (Figure 2l–n). The bioassay that mostly contributed to the integrated judgment was the copepod survival, demonstrating as this species is the most sensitive to the contamination of the investigated sediments.

3.2.5. WOE Index-Integration of LOEs

Table 6 and Table 7 report the classification of hazard levels elaborated for all sediments around the offshore platforms (BA and BR) and in control area (K). The two tables differ for the reference values selected to elaborate chemical results and to calculate the HQ of LOE1, being SQA in Table 6 and concentrations measured at control sites in Table 7, respectively.
The overall integration of all the LOEs led to the same classification of the WOE index independently to the reference chosen for LOE1. Moderate risk was calculated for the majority of stations with WOE values between 59.6 and 44.7; major risk occurred for BA 12 and BR 13 (WOE value between 69.0 and 60.9), while slight or absent in the control area (WOE values between 23.3 and 7.7). In these tables, the percentage contribution of each LOE was also reported, showing the greater contribution of chemical analyses and bioassays on the final WOE assessment.

4. Discussion and Conclusions

Environmental assessment and management require the processing of extensive and heterogeneous data that can be usefully integrated by using WOE approaches. In the last decade, a quantitative model (Sediqualsoft) has been developed and validated in several studies (reviewed in Table 8) with field and/or laboratory conditions, aimed to assess environmental hazards associated with sediments contaminated by natural or anthropic sources [9,12,13,16,23,24,25,26,27,28,29]. In most of these studies, the concentrations of contaminants in sediments and their bioavailability in target species, together with ecotoxicological bioassays and biomarkers, were included in the weighted Sediqualsoft elaborations, revealing the significance of multidisciplinary investigations. The kind of chemicals, the relevance of ecotoxicological endpoints and biomarkers, the intensity of variations normalized toward specific thresholds have been considered and adequately weighted for the computation of various sediment hazard indices and final WOE assessment.
Overall, the authors showed that the use of the model efficiently synthesized the huge amount of data derived by environmental monitoring plans; each LOE is first elaborated as synthetic and quantitative hazard indexes and then integrated into the overall WOE assessment, assigning the evaluation level to five classes (from absent to severe) [9,13]. This allows to better discriminate the potential sediment hazard compared to a conventional chemical tabular approach while also providing a scientific tool for support appropriate and efficient management options for each class of environmental hazard to environmental managers. In our study, we applied the Sediqualsoft model as a tool to integrate multidisciplinary data related to the sediments from an area of the North–Central Adriatic Sea in order to assess environmental hazards due to the presence of two gas platforms. The chemical analysis of sediments identified a more contaminated area within 100 m of the platforms. The elevated concentrations of some trace elements (e.g., Ba, Cd and Zn) could be linked to the presence of the platforms and their activities (e.g., use of barite in the drilling muds or contents of Zn and Cd in sacrificial anodes), also including the release of Produced Water, being the elements present in its composition. Other metals (e.g., Ni and Cr) showed concentrations higher than EQS in the whole area, including control stations, indicating local geochemistry characteristics rather than a direct influence of the platforms [56]. When chemical data that referred to “core hot spot stations” were processed by the Sediqualsoft model using those of SQG (regulatory limits such EQS and/or threshold values for marine sediments such ERL/TEL) as reference values, widespread contamination was confirmed in the entire 100 m area, with severe chemical hazard in three of the eight stations sampled around both platforms. In this case, a moderate chemical hazard was also attributed to the reference area, including the control sites. Instead, when the chemical hazard of platforms sediments was calculated using the chemical concentrations measured in the control area as reference values, a severe hazard appeared in all the stations. It should be noted that chemical hazard elaboration provided different outputs depending on the selected reference values, primarily because EQS, as well as ERL/TEL, values are not available for all contaminants. Therefore, in the first case of chemical hazard calculation, the weighted elaboration was applied to a lower number of substances; in the second case, all contaminants were considered in the calculation of hazard level, which was driven mostly by those analytes for which EQS in sediment is not yet defined (e.g., Ba, Zn and total hydrocarbons). The choice of reference values (regulatory levels, thresholds or concentrations measured in the controls) influenced the chemical hazard but not the overall integration of various LOEs, which led to a moderate WOE index for the majority of stations. The use of the Sediqualsoft model for elaborating chemical analyses with bioassays, bioaccumulation and biomarker data was also useful to summarize the overall significance of biomarkers and bioassays in single hazard indices, giving a different weight to various biological endpoints and magnitude of observed effects, and thus facilitating the interpretation of such biological data. The moderate hazard highlighted in some stations by the bioaccumulation and biomarker analyses gave evidence of uptake and biological effects of contaminants in polychaetes and confirmed the moderate to severe hazard highlighted by sediment chemistry in stations close to the platforms. Bioassays revealed significant hazards, particularly for BR platform stations. The overall WOE integration confirmed the existence of environmental hazards associated with the sediments allowing a better understanding of which substances are most responsible for integrated risk associated with the sediments. Furthermore, this allowed to overcome the limitations of a conventional pass-to-fail approach or worst-case scenario when interpreting separately chemical or ecotoxicological results. In fact, the chemical characterization by itself or the outcome of the test with a sensitive species as T. fulvus would have “unbalanced” considerably the overall sediment assessment, classifying the entire area as highly compromised. The application of the Sediqualsoft model, by weighting the results of various LOEs and their integration, allowed a more scientifically sound identification of the ecotoxicological hazard associated with specific contaminated sites in the area surrounding the platforms, together with the possible recovery actions to be taken. Our study, like those that in the previous 10 years have applied this model to sediment hazard assessment, showed its strengths, but some challenges can still be addressed. Most of the studies evaluated the chemical hazard level by comparing measured concentrations of contaminants and SQG. The main novelty of this work is the possibility to use as chemical reference values the concentrations measured in a control area; this could be of particular relevance when SQGs are not available for all the measured substances and to obtain a more site-oriented assessment of chemical hazard. This study confirmed the Sediqualsoft model as a valid tool for sediment quality assessment; it allows to elaborate independently various LOEs, from chemical analysis to ecological investigations, enabling integrated management of multiple heterogeneous data coming from a complex monitoring scenario. At the same time, it provides the quantitative interpretation of data through the use of mathematical models and statistical analyses, resulting in a synthetic hazard index, easily interpretable by policymakers or environmental managers, therefore supporting site-oriented and scientifically robust management options. The use of further LOEs associated with the dispersion of discharges or with the processes of biomagnification could be a challenge for future applications of this model.
In conclusion, this study would point to the following roadmaps:
  • inclusion of concentrations measured in the control area among the chemical reference values of the Sediqualsoft model;
  • routine application of this model to process multidisciplinary data related to environmental monitoring plans of offshore platform impacts, including those concerning the Produced Water discharge into the sea;
  • promotion of further LOEs to assess the integrated risk associated with investigated impacts.

Supplementary Materials

The following are available online at https://www.mdpi.com/article/10.3390/w13121691/s1, Table S1: Concentrations of contaminants in sediments sampled around the offshore platform called BA and in control sites (Mean ± s.d.). European Environmental Quality Standards-EQS (Italian D.Lvo 172/2015) were reported, if available, Table S1: Concentrations of contaminants in sediments sampled around the offshore platform called BR and in control sites (Mean ± s.d.). European Environmental Quality Standards—EQS (Italian D.Lvo 172/2015) were reported, if available.

Author Contributions

Conceptualization, L.M., A.T., R.D.M. and F.O.; supervision, L.M., C.M. and A.T.; investigation, B.C., G.M. (Giacomo Martuccio), G.M. (Ginevra Moltedo), M.T.B., C.M., M.A., G.R., G.S., G.C., O.F., A.T., R.D.M. and P.L.; data elaboration, G.d., B.C., G.M. (Giacomo Martuccio), G.M. (Ginevra Moltedo), C.M., G.R., G.S., P.L., A.T. and L.M.; data control and visualization, G.d., P.L., G.G., C.M. and G.S.; project administrator and resources, R.D.M.; writing—original draft L.M., B.C., G.M. (Giacomo Martuccio), G.M. (Ginevra Moltedo), C.M., G.R., G.S., A.T., A.R., S.M. and G.d.; writing—review and editing L.M., B.C., A.R., F.O., R.D.M., P.L., G.S. and F.R. All authors have read and agreed to the published version of the manuscript.

Funding

This research received no funding.

Acknowledgments

We are grateful to all the personnel of the ASTREA ship who performed the sea-sampling activities.

Conflicts of Interest

The authors declare no conflict of interest.

References

  1. Italian Legislative Decree n. 172/2015 “Attuazione Della Direttiva 2013/39/UE, che Modifica le Direttive 2000/60/CE per Quanto Riguarda le Sostanze Prioritarie Nel Settore Della Politica Delle Acque”. Available online: https://pdc.minambiente.it/sites/default/files/allegati/dlgs_172_del_13_ottobre_2015.pdf (accessed on 28 February 2021).
  2. Long, E.R.; Macdonald, D.D.; Smith, S.L.; Calder, F.D. Incidence of adverse biological effects within ranges of chemical concentrations in marine and estuarine sediments. Environ. Manag. 1995, 19, 81–97. [Google Scholar] [CrossRef]
  3. Macdonald, D.D.; Carr, R.S.; Calder, F.D.; Long, E.R.; Ingersoll, C.G. Development and evaluation of sediment quality guidelines for Florida coastal waters. Ecotoxicology 1996, 5, 253–278. [Google Scholar] [CrossRef] [PubMed]
  4. Vethaak, A.D.; Davies, I.M.; Thain, J.E.; Gubbins, M.J.; Martínez-Gómez, C.; Robinson, C.D.; Moffat, C.F.; Burgeot, T.; Maes, T.; Wosniok, W.; et al. Integrated indicator framework and methodology for monitoring and assessment of hazardous substances and their effects in the marine environment. Mar. Environ. Res. 2017, 124, 11–20. [Google Scholar] [CrossRef] [Green Version]
  5. Chapman, P.M. Ecological Risk and Weight of Evidence Assessments. In Marine Ecotoxicology; Blasco, J., Chapman, P.M., Campana, O., Hampel, M., Eds.; Academic Press: Cambridge, MA, USA, 2016; pp. 257–271. [Google Scholar]
  6. Mouillot, D.; Villéger, S.; Scherer-Lorenzen, M.; Mason, N.W.H. Functional Structure of Biological Communities Predicts Ecosystem Multifunctionality. PLoS ONE 2011, 6, e17476. [Google Scholar] [CrossRef] [Green Version]
  7. Environment Canada. Federal Contaminated Sites Action Plan (FCSAP): Ecological Risk Assessment Guidance. Prepared by Azimuth Consulting Group, Vancouver, BC, Canada. 2012. Available online: http://publications.gc.ca/collections/collection_2021/eccc/En14-92-6-2020-eng.pdf (accessed on 15 January 2021).
  8. Chapman, P.M. Determining when contamination is pollution—Weight of evidence determinations for sediments and effluents. Environ. Int. 2007, 33, 492–501. [Google Scholar] [CrossRef]
  9. Regoli, F.; d’Errico, G.; Nardi, A.; Mezzelani, M.; Fattorini, D.; Benedetti, M.; Di Carlo, M.; Pellegrini, D.; Gorbi, S. Application of a Weight of Evidence Approach for Monitoring Complex Environmental Scenarios: The Case-Study of Off-Shore Platforms. Front. Mar. Sci. 2019, 6, 377. [Google Scholar] [CrossRef]
  10. Depledge, M.H. The Rational Basis for the Use of Biomarkers as Ecotoxicological Tools. In Nondestructive Biomarkers in Vertebrates; Leonzio, C., Ed.; CRC: London, UK, 1994; pp. 271–295. [Google Scholar]
  11. Regoli, F.; Frenzilli, G.; Bocchetti, R.; Annarumma, F.; Scarcelli, V.; Fattorini, D.; Nigro, M. Time-course variations of oxyradical metabolism. DNA integrity and lysosomal stability in mussels. Mytilus galloprovincialis during a fiel translocation experiment. Aquat. Toxicol. 2004, 68, 167–178. [Google Scholar] [CrossRef]
  12. Morroni, L.; d’Errico, G.; Sacchi, M.; Molisso, F.; Armiento, G.; Chiavarini, S.; Rimauro, J.; Guida, M.; Siciliano, A.; Ceparano, M.; et al. Integrated characterization and risk management of marine sediments: The case study of the industrialized Bagnoli area (Naples, Italy). Mar. Environ. Res. 2020, 160, 104984. [Google Scholar] [CrossRef]
  13. Piva, F.; Ciaprini, F.; Onorati, F.; Benedetti, M.; Fattorini, D.; Ausili, A.; Regoli, F. Assessing sediment hazard through a weight of evi-dence approach with bioindicator organisms: A practical model to elaborate data from sediment chemistry bioavailability, biomarkers and ecotoxico-logical bioassays. Chemosphere 2011, 83, 475–485. [Google Scholar] [CrossRef]
  14. Khosrovyan, A.; Rodriguez-Romero, A.; Ramos, M.A.; Del Valls, T.Á.; Riba, I. Comparative analysis of two weight-of-evidence methodologies for integrated sediment quality assessment. Chemosphere 2015, 120, 138–144. [Google Scholar] [CrossRef]
  15. Sany, S.B.T.; Hashim, R.; Rezayi, M.; Salleh, A.; Safari, O. A review of strategies to monitor water and sediment quality for a sustainability assessment of marine environment. Environ. Sci. Pollut. Res. 2014, 21, 813–833. [Google Scholar] [CrossRef]
  16. Benedetti, M.; Ciaprini, F.; Piva, F.; Onorati, F.; Fattorini, D.; Notti, A.; Ausili, A.; Regoli, F. A multidisciplinary weight of evidence approach for classifying polluted sediments: Integrating sediment chemistry, bioavailability, biomarkers responses and bioassays. Environ. Int. 2012, 38, 17–28. [Google Scholar] [CrossRef]
  17. Beyer, J.; Goksøyr, A.; Hjermann, D.Ø.; Klungsøyr, J. Environmental effects of offshore produced water discharges: A review focused on the Norwegian continental shelf. Mar. Environ. Res. 2020, 162, 105155. [Google Scholar] [CrossRef]
  18. Barrick, A.; Marion, J.-M.; Perrein-Ettajani, H.; Chatel, A.; Mouneyrac, C. Baseline levels of biochemical biomarkers in the endobenthic ragworm Hediste diversicolor as useful tools in biological monitoring of estuaries under anthropogenic pressure. Mar. Pollut. Bull. 2018, 129, 81–85. [Google Scholar] [CrossRef] [PubMed]
  19. Durou, C.; Poirier, L.; Amiard, J.C.; Budzinski, H.; Gnassia-Barelli, M.; Lemenach, K.; Peluhet, L.; Mouneyrac, C.; Roméo, M.; Amiard-Triquet, C. Biomonitoring in a clean and multi-contaminated estuary based on biomarkers and chemical analyses in the endobenthic worm Nereis di-versicolor. Environ. Poll. 2007, 148, 445–458. [Google Scholar] [CrossRef] [PubMed]
  20. Moreira, S.M.; Lima, I.; Ribeiro, R.; Guilhermino, L. Effects of estuarine sediment contamination on feeding and on key physiological functions of the polychaete Hediste diversicolor: Laboratory and in situ assays. Aquat. Toxicol. 2006, 78, 186–201. [Google Scholar] [CrossRef] [PubMed]
  21. Pérez, E.; Blasco, J.; Sole, M. Biomarker responses to pollution in two invertebrate species: Scrobicularia plana and Nereis diversicolor from the Cádiz bay (SW Spain). Mar. Environ. Res. 2004, 58, 275–279. [Google Scholar] [CrossRef] [PubMed]
  22. Gomiero, A.; Strafella, P.; Pellini, G.; Salvalaggio, V.; Fabi, G. Comparative effects of ingested PVC micro particles with and without adsorbed Benzo(a)pyrene vs. Spiked sediments on the cellular and subcellular processes of the benthic organism Hediste diversicolor. Front. Mar. Sci. 2018, 5, 1–12. [Google Scholar] [CrossRef] [Green Version]
  23. Benedetti, M.; Gorbi, S.; Fattorini, D.; d’Errico, G.; Piva, F.; Pacitti, D.; Regoli, F. Environmental hazards from natural hydrocarbons seepage: Integrated classification of risk from sediment chemistry, bioavailability and biomarkers responses in sentinel species. Environ. Pollut. 2014, 185, 116–126. [Google Scholar] [CrossRef] [PubMed]
  24. Regoli, F.; Pellegrini, D.; Cicero, A.M.; Nigro, M.; Benedetti, M.; Gorbi, S.; Fattorini, D.; d’Errico, G.; Di Carlo, M.; Nardi, A.; et al. A multidisciplinary weight of evidence approach for environmental risk asses-ment at the Costa Concordia wreck: Integrative indices from Mussel Watch. Mar. Environ. Res. 2014, 96, 92–104. [Google Scholar] [CrossRef]
  25. Bebianno, M.; Pereira, C.; Rey, F.; Cravo, A.; Duarte, D.; d’Errico, G.; Regoli, F. Integrated approach to assess ecosystem health in harbor areas. Sci. Total Environ. 2015, 514, 92–107. [Google Scholar] [CrossRef]
  26. Mezzelani, M.; Gorbi, S.; Da Ros, Z.; Fattorini, D.; d’Errico, G.; Milan, M.; Bargelloni, L.; Regoli, F. Ecotoxicological potential of non-steroidal anti-inflammatory drugs (NSAIDs) in marine organisms: Bioavailability, biomarkers and natural occurrence in Mytilus galloprovincialis. Mar. Environ. Res. 2016, 121, 31–39. [Google Scholar] [CrossRef]
  27. Mestre, N.C.; Rocha, T.L.; Canals, M.; Cardoso, C.; Danovaro, R.; Dell’Anno, A.; Gambi, C.; Regoli, F.; Sanchez-Vidal, A.; Bebianno, M.J. Environmental hazard assessment of a marine mine tailings deposit site and potential implications for deep-sea mining. Environ. Pollut. 2017, 228, 169–178. [Google Scholar] [CrossRef]
  28. Nardi, A.; Mincarelli, L.F.; Benedetti, M.; Fattorini, D.; d’Errico, G.; Regoli, F. Indirect effects of climate changes on cadmium bioavailability and biological effects in the Mediterranean mussel Mytilus galloprovincialis. Chemosphere 2017, 169, 493–502. [Google Scholar] [CrossRef]
  29. Pittura, L.; Avio, C.G.; Giuliani, M.E.; d’Errico, G.; Keiter, S.H.; Cormier, B.; Gorbi, S.; Regoli, F. Microplastics as Vehicles of Environmental PAHs to Marine Organisms: Combined Chemical and Physical Hazards to the Mediterranean Mussels, Mytilus galloprovincialis. Front. Mar. Sci. 2018, 5. [Google Scholar] [CrossRef] [Green Version]
  30. UNI EN ISO 16703:2011. Soil Quality—Determination of Content of Hydrocarbon in the Range C10 to C40 by Gas Chromatography; ISO: Geneva, Switzerland, 2011. [Google Scholar]
  31. EPA. Method 5035A: Closed-System Purge-and-Trap and Extraction for Volatile Organics in Soil and Waste Samples. Revision 1, Washington, DC, USA; 2002. Available online: https://www.epa.gov/sites/production/files/2015-07/documents/epa-5035a.pdf (accessed on 14 November 2020).
  32. EPA. Method 8260D: Volatile Organic Compounds by Gas Chromatography/Mass Spectrometry (GC/MS). Revision 4 June 2018; 2006. Available online: https://www.epa.gov/sites/production/files/2017-04/documents/method_8260d_update_vi_final_03-13-2017.pdf (accessed on 14 November 2020).
  33. EPA. Method 3545A (SW-846): Pressurized Fluid Extraction (PFE). 2007. Available online: https://www.epa.gov/sites/production/files/2015-12/documents/3545a.pdf (accessed on 14 November 2020).
  34. EPA. Method 8310 (SW-846): Polynuclear Aromatic Hydrocarbons. 1986. Available online: https://www.epa.gov/sites/production/files/2015-12/documents/8310.pdf (accessed on 14 November 2020).
  35. EPA. Method 6010C (SW-846): Inductively Coupled Plasma—Atomic Emission Spectrometry. 2010. Available online: http://gwmc.ou.edu/files/metals_EPA6010c.pdf (accessed on 14 November 2020).
  36. EPA. Method 7060A: Arsenic (Atomic Absorption, Furnace Technique). 1994. Available online: https://settek.com/documents/EPA-Methods/PDF/EPA-Method-7060A.pdf (accessed on 14 November 2020).
  37. EPA. Method 7131: Cadmium (Atomic Absorption, Furnace Technique). 1994. Available online: https://settek.com/documents/EPA-Methods/PDF/EPA-Method-7131-A.pdf (accessed on 14 November 2020).
  38. EPA. Method 7473: Mercury in Solids and Solutions by Thermal Decomposition, Amalgamation, and Atomic Absorption Spectro-photometry. 2007. Available online: https://www.epa.gov/sites/production/files/2015-12/documents/7473.pdf (accessed on 14 November 2020).
  39. EPA. Method 7421: Lead (Atomic Absorption, Furnace Technique). 1986. Available online: http://ctntes.arpa.piemonte.it/Raccolta%20Metodi%202003/pdf/Metodi%20EPA/7421.pdf (accessed on 14 November 2020).
  40. UNEP/RAMOGE. Manual on the Biomarkers Recommended for the MED POL Biomonitoring Programme; UNEP: Athens, GA, USA, 1999; 39p. [Google Scholar]
  41. Cong, Y.; Banta, G.T.; Selck, H.; Berhanu, D.; Valsami-Jones, E.; Forbes, V.E. Toxic effects and bioaccumulation of nano-, micron- and ionic-Ag in the polychaete, Nereis diversicolor. Aquat. Toxicol. 2011, 105, 403–411. [Google Scholar] [CrossRef] [Green Version]
  42. Gorbi, S.; Lamberti, C.V.; Notti, A.; Benedetti, M.; Fattorini, D.; Moltedo, G.; Regoli, F. An ecotoxicological protocol with caged mussels, Mytilus galloprovincialis, for monitoring the impact of an offshore platform in the Adriatic sea. Mar. Environ. Res. 2008, 65, 34–49. [Google Scholar] [CrossRef] [PubMed]
  43. Ellman, G.L.; Courtney, K.D.; Andres, V., Jr.; Featherstone, R.M. A new and rapid colorimetric determination of acetylcholinesterase activity. Biochem. Pharmacol. 1961, 7, 88–90. [Google Scholar] [CrossRef]
  44. Regoli, F.; Winston, G.W. Quantification of Total Oxidant Scavenging Capacity of Antioxidants for Peroxynitrite, Peroxyl Radicals, and Hydroxyl Radicals. Toxicol. Appl. Pharmacol. 1999, 156, 96–105. [Google Scholar] [CrossRef] [PubMed]
  45. Akerboom, T.P.; Sies, H. Assay of glutathione, glutathione disulfide, and glutathione mixed disulfides in biological samples. Methods Enzymol. 1981, 77, 373–382. [Google Scholar] [CrossRef]
  46. ISO 11348-3, 2019. Water Quality—Determination of the Inhibitory Effect of Water Samples on the Light Emission of Vibrio Fischeri (Luminescent Bacteria Test)—Part 3: Method Using Freeze-Dried Bacteria; ISO: Geneva, Switzerland, 2007. [Google Scholar]
  47. ISO 10253:2016. Water Quality—Marine Algal Growth Inhibition Test with Skeletonema sp. and Phaeodactylum Tricornutum; ISO: Geneva, Switzerland, 2016. [Google Scholar]
  48. UNICHIM. Qualità Dell’Acqua–Determinazione Della Tossicità Le-Tale a 24 h, 48 h e 96 h di Esposizione con Naupli di Tigriopus fulvus (Fischer, 1860) (Crustacea: Copepoda); Method no. M.U. 2396:14; UNICHIM: Milano, Italy, 2014. [Google Scholar]
  49. EPA. Method 3051A: Microwave Assisted Acid Digestion of Sediments, Sludges, Soils, and Oils. 2007. Available online: https://www.epa.gov/sites/production/files/2015-12/documents/3051a.pdf (accessed on 16 November 2020).
  50. Bryan, G.; Hummerstone, L. Adaptation of the polychaete Nereis diversicolor to estuarine sediments containing high concentrations of zinc and cadmium. J. Mar. Biol. Assoc. UK. 1973, 53, 839–857. [Google Scholar] [CrossRef]
  51. ASTM. E1611-00: Standard Guide for Conducting Sediment Toxicity Tests with Polychaetous Annelids; ASTM International: West Conshohocken, PA, USA, 2007. [Google Scholar]
  52. EPA. Method 3052: Microwave Assisted Acid Digestion of Siliceous and Organically Based Matrices. 1996. Available online: https://www.epa.gov/sites/production/files/2015-12/documents/3052.pdf (accessed on 16 November 2020).
  53. Moltedo, G.; Martuccio, G.; Catalano, B.; Gastaldi, L.; Maggi, C.; Virno-Lamberti, C.; Cicero, A.M. Biological responses of the polychaete Hediste diversicolor (O.F.Müller, 1776) to inorganic mercury exposure: A multimarker approach. Chemosphere 2019, 219, 989–996. [Google Scholar] [CrossRef]
  54. Homa, J.; Olchawa, E.; Sturzenbaum, S.R.; Morgan, A.J.; Plytycz, B. Early-phase immunodetection of metallothionein and heat shock proteins in extruded earthworm coelomocytes after dermal exposure to metal ions. Environ. Pollut. 2005, 135, 275–280. [Google Scholar] [CrossRef]
  55. Catalano, B.; Moltedo, G.; Martuccio, G.; Gastaldi, L.; Virno-Lamberti, C.; Lauria, A.; Ausili, A. Can Hediste diversicolor (Nereidae, Polychaete) be considered a good candidate in evaluating PAH contamination? A multimarker approach. Chemosphere 2012, 86, 875–882. [Google Scholar] [CrossRef] [PubMed]
  56. Manfra, L.; Moltedo, G.; Lamberti, C.V.; Maggi, C.; Finoia, M.G.; Giuliani, S.; Onorati, F.; Gabellini, M.; Di Mento, R.; Cicero, A.M. Metal Content and Toxicity of Produced Formation Water (PFW): Study of the Possible Effects of the Discharge on Marine Environment. Arch. Environ. Contam. Toxicol. 2007, 53, 183–190. [Google Scholar] [CrossRef] [PubMed]
Figure 1. A map showing the location of the offshore platforms in Adriatic Sea (a) and sampling strategy for each platform named BA and BR (b).
Water 13 01691 g001
Figure 2. A map of the hazard level for sediments sampled around offshore platforms called BA and BR and reference area K, according to the weight of evidence elaboration. Levels of hazard are reported for each LOE (LOE1 (weighted criterion: EQS values): (ac); LOE2: (df); LOE3: (gi); LOE4: (ln)).
Water 13 01691 g002
Table 1. The analyzed parameters and adopted protocols for each Line of Evidence (LOE).
LOEEvidence LineAnalysisMethod
1Sediment chemical characterizationTotal hydrocarbons (C10–C40)
Volatile hydrocarbons
(BTEX and nC6–C10)
PAHs
Metals:
Ba, Crtot, Cu, Fe, Mn, Ni, Pb, Zn
As
Cd
Hg
UNI EN ISO 16703, 2011 [30]
EPA 5035A, 2002 [31]
EPA 8260D, 2006 [32]
EPA 3545A, 2007 [33]
EPA 8310, 1986 [34]
EPA 6010C, 2010 [35]
EPA 7060, 1994 [36]
EPA 7131, 1994 [37]
EPA 7473, 2007 [38]
2Bioaccumulation
Hediste diversicolor (polychaete)
PAHs
Metals:
Ba, Crtot, Cu, Fe, Mn, Ni, Zn
As
Cd
Pb
Hg
EPA 3545A, 2007 [33]
EPA 8310, 1986 [34]
EPA 6010C, 2010 [35]
EPA 7060, 1994 [36]
EPA 7131, 1994 [37]
EPA 7421, 1986 [39]
EPA 7473, 2007 [38]
3Biomarkers
Hediste diversicolor (polychaete)
LMS-ESO (whole tissue)
COMET (coelomocytes)
MN (coelomocytes)
AChE (whole tissue)
MT/MTLPs (whole tissue)
CAT (whole tissue)
TOSCA HO and ROO (whole tissue)
GSTs (whole tissue)
tGSH (whole tissue)
UNEP_Ramoge, 1999 [40]
Cong et al., 2011 [41]
Gorbi et al., 2008 [42]
Ellman et al., 1961 [43]
UNEP_Ramoge, 1999 [40]
Regoli et al., 2004 [11]
Regoli and Winston, 1999 [44]
Regoli et al., 2004 [11]
Akerboom and Sies, 1981 [45]
4BioassaysBacterial bioluminescence test (Aliivibrio fischeri)
Algal growth assay (Dunaliella tertiolecta)
Copepod mortality test (Tigriopus fulvus)
ISO 11348-3, 2019 [46]
ISO 10253, 2016 (modified) [47]
UNICHIM 2396, 2014 [48]
Acronyms: Benzene, Toluene, Ethylbenzene, Xylene (BTEX), Polycyclic Aromatic Hydrocarbons (PAHs), Barium (Ba), Chromium (Cr), Copper (Cu), Iron (Fe), Manganese (Mn), Nickel (Ni), Zinc (Zn), Arsenic (As), Cadmium (Cd), Lead (Pb), Mercury (Hg), lysosomal membrane stability toward hexosaminidase method (LMS-ESO), alteration in the antioxidant and/or biotransformation systems through catalase activity (CAT), total glutathione level (tGSH), whole capability to neutralize peroxyl and hydroxyl radicals (TOSCA ROO and TOSCA HO), glutathione S-transferases activities (GSTs), presence of DNA damages through comet assay (COMET) and micronuclei frequency (MN), neurotoxicity through inhibition of acetylcholinesterase (AChE) and eventual induction of metallothioneins or metallothionein-like proteins (MTs/MTLPs) synthesis.
Table 2. Concentrations of contaminants in the Hediste diversicolor polychaete exposed to sediments sampled around offshore platform called BA and control sites. Mean ± standard deviation (s.d.).
Control SitesBA Platform Stations
Contaminants 11121314
means.d.means.d.means.d.means.d.means.d.
Polycyclic aromatic hydrocarbons PAH (ng/g)
Naphthalene3.182.8721.894.5993.206.494.312.689.442.87
Acenaphthene0.590.140.370.217.423.440.410.27<0.5
Fluorene1.131.053.520.554.342.242.360.222.740.69
Phenanthrene22.011.6642.8913.0472.4423.2532.645.0228.476.51
Anthracene0.660.041.360.163.930.861.000.071.230.21
Fluoranthene1.290.193.411.8112.742.363.061.193.451.41
Pyrene1.590.135.051.9226.156.683.030.8410.252.38
Benzo(a)Anthracene0.750.190.440.172.110.280.670.130.450.35
Chrysene0.650.38<0.5 10.891.560.630.382.600.42
Benzo(b)Fluoranthene2.560.380.670.394.020.732.301.212.880.35
Benzo(k)Fluoranthene0.860.060.590.131.090.090.660.060.640.09
Benzo(a)Pyrene0.770.210.470.191.070.180.720.020.990.35
Dibenzo(a,h)Anthracene<0.5 <0.5 <0.5 <0.5 <0.5
Benzo(g,h,i)Perylene0.740.610.380.231.100.320.750.161.690.35
Indeno(1,2,3,c,d)Pyrene0.740.020.360.190.630.330.410.280.350.17
Total PAHs37.203.1080.6522.51241.0526.8252.579.9364.8511.24
Trace metals (mg/kg)
Ba0.480.2827.6441.549.616.171.690.6815.2921.19
Cr0.830.181.030.570.560.230.580.200.650.25
Cu7.770.396.400.637.230.386.840.089.180.39
Fe1496.59366.501860.341126.921322.174.991270.40113.291462.09218.43
Mn8.752.3910.615.377.760.147.520.217.991.35
Ni2.730.072.950.342.780.122.790.323.270.48
Pb0.230.040.290.120.310.080.170.010.290.10
Zn56.785.9861.757.8467.394.2957.970.5860.526.76
As14.210.6212.800.9413.680.4615.121.0414.870.26
Cd0.040.000.060.000.070.010.070.020.050.01
V1.160.091.260.510.930.020.940.081.110.16
Table 3. Concentrations of contaminants in the Hediste diversicolor polychaete exposed to sediments sampled around offshore platform called BR and control sites. Mean ± standard deviation (s.d.).
Control SitesBR Platform Stations
Contaminants 11121314
means.d.means.d.means.d.means.d.means.d.
Polycyclic aromatic hydrocarbons PAH (ng/g)
Naphthalene0.840.526.112.117.031.974.922.635.323.54
Acenaphthene0.780.912.010.732.210.061.030.711.510.29
Fluorene2.110.675.630.504.630.563.840.604.380.64
Phenanthrene34.968.5569.816.6863.8321.6949.629.2245.014.12
Anthracene1.500.202.780.262.410.921.910.701.670.20
Fluoranthene4.590.588.821.027.102.196.170.854.831.31
Pyrene1.970.276.100.945.781.884.941.594.120.66
Benzo(a)Anthracene<0.5 <0.5 <0.5 <0.5 <0.5
Chrysene<0.5 <0.5 0.400.260.500.23<0.5
Benzo(b)Fluoranthene1.270.492.351.182.401.101.890.232.310.80
Benzo(k)Fluoranthene0.540.270.770.160.460.180.660.150.710.21
Benzo(a)Pyrene<0.5 0.330.140.510.220.450.170.380.22
Dibenzo(a,.h)Anthracene<0.5 <0.5 <0.5 <0.5 <0.5
Benzo(g,h,i)Perylene<0.5 <0.5 0.520.25<0.5 <0.5
Indeno(1,2,3,c,d)Pyrene0.620.350.560.530.670.210.550.280.510.23
Total PAHs48.789.28104.936.5997.5229.0176.1514.5570.497.05
Trace metals (mg/kg)
Ba0.290.071.902.781.401.4724.8825.5414.4915.04
Cr0.440.130.730.630.480.090.880.470.870.55
Cu9.071.306.090.996.920.838.051.049.080.39
Fe2929.52144.502903.301545.633156.191297.852913.22449.073160.751256.85
Mn10.770.449.921.2810.010.7713.103.9212.786.37
Ni2.040.332.030.252.090.122.620.312.790.10
Pb0.250.060.160.080.140.030.220.040.230.01
Zn55.922.5652.553.1152.404.5153.322.4351.833.95
As11.950.7710.170.8011.581.3111.241.3210.400.66
Cd0.010.000.020.000.010.010.020.000.020.00
V0.850.020.820.470.630.031.020.301.060.52
Table 4. The results of biomarker analyses in Hediste diversicolor exposed to sediment sampled around offshore platforms called BA and BR and control area K. Mean ± standard deviation (s.d.) or standard error (s.e.m.). N = 10.
LMS-ESOAChECATCOMETMNtGSHGSTsMT/
MTLPs
TOSCA HOTOSCA ROO
stmeans.d.means.d.means.d.means.d.means.e.m.means.d.means.d.means.d.means.d.means.d.
K22.467.4071.1916.209.593.3125.706.770.350.150.570.1847.8714.610.370.20574.68147.72807.32209.73
BA
1120.2514.1788.8617.767.922.4534.205.620.600.100.460.1348.849.220.420.11494.8671.87669.86170.30
1219.899.4773.6415.4510.893.7334.706.581.100.240.360.0448.274.150.430.13668.93127.78878.56169.02
1322.765.8077.7215.5511.024.1141.739.391.100.370.440.0652.249.030.450.21675.31147.63792.5437.62
1430.469.5598.7520.879.073.2422.301.210.400.190.430.0750.5913.270.450.20573.47171.05664.13238.23
BR
1134.7214.9870.3612.388.382.5133.953.470.400.100.620.0947.0616.990.630.19432.06188.41767.00256.33
1236.389.5669.5117.537.152.1930.203.350.500.270.660.1140.993.360.320.19459.96183.92850.40238.88
1333.888.6571.0814.8911.244.3324.591.530.400.190.640.2135.508.610.550.12617.25197.41908.23225.94
1436.2510.2268.1016.778.493.4925.515.780.300.120.730.2536.833.080.450.19522.72135.92618.67212.85
Table 5. Results of bioassays in marine species exposed to pore water of sediment sampled around offshore platforms called BA and BR and control sites. Negative values denote biostimulation.
Aliivibrio fischeriDunaliella tertiolectaTigriopus fulvus
stMean Effect
Bioluminescence Inhibition (%)
s.d.Mean Effect
Growth Rate
(%)
s.d.Mean Effect
Mortality Rate
(%)
s.d.
K115.040.36−69.4010.842.55.0
K216.091.48−78.124.792.55.0
K3−19.111.27−70.446.3510.0011.55
BA
117.500.65−136.1111.320.00.0
1212.564.35−115.177.2182.522.17
137.171.54−106.3518.0865.05.77
148.611.98−68.8110.7850.014.14
BR
117.711.44−111.6214.6295.05.77
127.300.58−104.337.0187.515.0
135.451.00−93.532.99100.00.0
148.681.57−82.1314.2472.517.08
Table 6. Classification of hazard level and WOE index for sediments sampled around offshore platforms (BA and BR) and control area (K), with Chemical hazard (LOE1) estimated using EQS values. The contribution to the WOE (as %) is reported for each LOE.
StationLOE1
(Chemical Hazard Against SQA)
LOE2
(Hazard for Bioavailability)
LOE3
(Hazard for Biomarkers)
LOE4
(Hazard for Bioassays)
WOE Index
(Integrated Risk)
KMODERATE
66.8%
ABSENT
11.7%
ABSENT
9.8%
ABSENT
11.7%
SLIGHT Water 13 01691 i001
BA
11MAJOR
49.6%
MODERATE
29.2%
SLIGHT
15.1%
ABSENT
6.1%
MODERATE Water 13 01691 i002
12SEVERE
38.2%
MODERATE 17.7%MODERATE
16.0%
MAJOR
28.1%
MAJOR Water 13 01691 i003
13MODERATE
29.7%
SLIGHT
14.8%
MODERATE
22.2%
MAJOR
33.3%
MODERATE Water 13 01691 i004
14SEVERE
48.4%
SLIGHT
17.4%
ABSENT
4.3%
MODERATE
29.8%
MODERATE Water 13 01691 i005
BR
11MAJOR
34.8%
SLIGHT
13.1%
SLIGHT
13.6%
MAJOR
38.6%
MODERATE Water 13 01691 i006
12MODERATE
36.3%
SLIGHT
13.5%
SLIGHT
10.0%
MAJOR
40.2%
MODERATE Water 13 01691 i007
13SEVERE
37.9%
MODERATE
20.7%
SLIGHT
7.9%
MAJOR
33.5%
MAJOR Water 13 01691 i008
14MODERATE
33.8%
SLIGHT
21.0%
ABSENT
5.0%
MAJOR
40.2%
MODERATE Water 13 01691 i009
Table 7. Classification of hazard level and WOE index for sediments sampled around offshore platforms called BA and BR and control area K, with the Chemical hazard (LOE1) estimated using reference area (K) values. The contribution to the WOE (as %) is reported for each LOE.
AreaLOE1
(Chemical Hazard
Against K)
LOE2
(Hazard for Bioavailability)
LOE3
(Hazard for Biomarkers)
LOE4
(Hazard for Bioassays)
WOE Index
(Integrated Risk)
KABSENT
25.0%
ABSENT
25.0%
ABSENT
25.0%
ABSENT
25.0%
ABSENT Water 13 01691 i010
BA
11SEVERE
50.2%
MODERATE
28.8%
SLIGHT
15%
ABSENT
6%
MODERATE Water 13 01691 i011
12SEVERE
34.8%
MODERATE
18.6%
MODERATE
16.9%
MAJOR
29.7%
MAJOR Water 13 01691 i012
13SEVERE
38.1%
SLIGHT
13.0%
MODERATE
19.6%
MAJOR
29.3%
MODERATE Water 13 01691 i013
14SEVERE
45.5%
SLIGHT
18.4%
ABSENT
4.6%
MODERATE
31.5%
MODERATE Water 13 01691 i014
BR
11SEVERE
39.8%
SLIGHT
12.1%
SLIGHT
12.5%
MAJOR
35.6%
MODERATE Water 13 01691 i015
12SEVERE
42.2%
SLIGHT
12.3%
SLIGHT
9.1%
MAJOR
36.4%
MODERATE Water 13 01691 i016
13SEVERE
37.3%
MODERATE
20.8%
SLIGHT
8.0%
MAJOR
33.8%
MAJOR Water 13 01691 i017
14SEVERE
43.2%
SLIGHT
18.0%
ABSENT
4.3%
MAJOR
34.5%
MODERATE Water 13 01691 i018
Table 8. Case studies showing application of the Sediqualsoft model to marine ecosystem issues, including present study.
Area of Application
(Location)
LOE1
—Chemistry
(Matrix)
LOE2
—Bioavailability
(Tissues) (sp.) (Exposure Type)
LOE 3
—Biomarkers
(Tissues) (sp.)
LOE 4
—Bioassays
(sp.) (Matrix)
LOE5—
Benthic Community
Further (Statistical) AnalysisChemical Reference Value/Threshold/SQGReferences
Petrol-chemical site (Adriatic Sea, Italy)
Harbour site
(Adriatic Sea, Italy)
PAHs, Aliphatic hydrocarbons, trace metals (As, Cd, Cr, Cu, Fe, Mn, Ni, Hg, Pb, V)
(sediments)
PAHs, Aliphatic hydrocarbons, trace metals
(eel liver and gills)
(Anguilla anguilla)
(field, lab)
EROD, MTs, AOX
CAT, GSTs, GR, GPx-H2O2, GPx-CHP, tGSH, TOSCA ROO, TOSCA HO, LLP (liver)
PAH metabolites (bile)
AChE (brain)
MN (gills)
(A. anguilla)
growth test (Phaedactylum
tricornutum)
(elutriate)
growth test (Dunaliella tertiolecta) (elutriate)
Bioluminescence test
(Aliivibrio fischeri) (elutriate, centrifuged sediment),
mortality test (Tigriopus fulvus) (elutriate)
N.A.N.A.(Italian legislative Decree n. 152/2006)Piva et al., 2011
[13]
Venice lagoon
(Adriatic Sea, Italy)
PAHs, trace metals (As, Cd, Cr, Cu, Hg, Ni, Pb, V, Zn)
(sediments)
PAHs, trace metals (As, Cd, Cr, Cu, Fe Hg, Mn, Ni, Pb, V, Zn)
(eel liver)
(A. anguilla)
(lab.)
EROD, MTs, AOX,
CAT, GSTs, GR, GPx-H2O2, GPx-CHP, tGSH, TOSCA ROO, TOSCA HO, LLP, LP, MDA (liver)
PAH metabolites (bile)
AChE (brain)
Comet assay (blood)
MN (gills)
(A. anguilla)
Bioluminescence test
(A. fischeri)
(solid phase),
embryo development test
(Crassostrea Gigas)
(elutriate)
mortality/growth test
(T. fulvus)
(elutriate)
larval development test
(Acartia tonsa) (elutriate),
fertilization test
(Paracentrotus lividus)
(elutriate)
Mortality test
(Corophium orientale)
(whole sediment)
N.A.N.A.normative limits (Venice Protocol. 1993)Benedetti et al., 2012
[16]
Offshore platform and seepage area
(Adriatic Sea, Italy)
PAHs, Aliphatic hydrocarbons, VHs, trace metals (As, Cd, Cr, Cu, Fe, Hg, Mn, Ni, Pb, V, Zn) (sediments)PAHs, Aliphatic hydrocarbons,
VHs, trace metals
(eel gills and liver, mussel whole tissues)
(A. anguilla, Mytilus galloprovincialis)
EROD, AOX, CAT, GSTs, GR, GPx-CHP, TOSCA ROO, TOSCA HO, LLP (liver)
PAH metabolites (bile)
Comet Assay (blood)
MN (gills)
(A. anguilla)
MTs, AOX,
CAT, GSTs, GR, GPx-H2O2, GPx-CHP, tGSH, TOSCA ROO, TOSCA HO, LP, MDA (dig, gland)
NRRT, Comet assay,
MN, AChE (haemolymph)
(M. galloprovincialis)
N.A.N.A.N.A.TEL/PEL (Macdonald et al., 1996);
(Italian legislative Decree n. 152/2006)
Benedetti et al., 2014
[23]
Harbour site
(Portimão harbor, Atlantic Ocean, Portugal)
trace metals (Cd, Cr, Cu, Pb, Ni, Zn), PAHs, PCBs, HCB
(sediment)
trace metals
(mussel whole soft tissues)
(M. galloprovincialis)
(field)
SOD, CAT, GPx-H2O2, MDA, 4-HNE, MTs (dig. gland and gills).
AChE (gills)
ALP (gonad)
ALAD (whole soft tissue)
(M. galloprovincialis)
Mortality test
(Corophium insidiosum)
(whole sediment)
Bioluminescence test
(A. fischeri) (solid phase)
N.A.N.A.ERL/ERM (Long et al., 1995);
TEL/PEL (Macdonald et al., 1996);
Portuguese legislation (Portaria n°1450)
French. Spanish. Uk. Italian normative limits for dredged sediments (Arrêté du 14/06/00; CEDEX. 1994; OSPAR. 2004; Italian D.Lvo 152/2006)
Bebianno et al., 2015
[25]
Non steroidal anti-inflammatory drugs (NSAIDs) exposure
Portonovo Bay
(Adriatic Sea, Italy)
N.A.Not includedNRRT, G/H ratio, PA, Comet assay, MN (haemolymph)
LP, NL, AOX, CAT, GSTs, GPx-H2O2, GPx-CHP, GR, tGSH, TOSCA ROO, TOSCA HO (dig. gland)
AChE (haemolymph and gills)
(M. galloprovincialis)
N.A.N.A.Multivariate PCA analysis of biomarker responsesN.A.Mezzelani et al., 2016
[26]
Costa Concordia shipwreck
(Giglio Island, Tirrenian Sea, Italy)
N.A.VHs, Aliphatic hydrocarbons,
PAHs,
PCBs, OCPs, OSn, BFRs, trace
metals (As, Cd, Cr, Cu, Hg, Ni, Pb, V, Zn),
TASs
(mussel whole soft tissues)
(M. galloprovincialis)
(field)
AChE (haemolymph and gills)
MTs, AOX, CAT, GSTs, GPx-H2O2, GPx-CHP, GR, tGSH, MDA, TOSCA ROO, TOSCA HO, LP, NL, LLP (dig. gland)
Comet assay, MN (gills)
(M. galloprovincialis)
N.A.N.A.non-metric Multidimensional Scaling (nMDS)
on bioaccumulation
and biomarker responses
Regoli et al., 2014
[24]
Mine tailing disposal
(Portman Bay, Spain)
Trace metals (Ag, As, Au, Cd, Cr, Cu, Fe, Hg, Ni, Pb, Sb, Zn)
(sediments)
Trace metals
(mussel gills, digestive gland and mantle)
(M. galloprovincialis) (field)
SOD, CAT, GPx, GSTs, MTs, MDA, 4-HNE (dig. gland, gills and mantle)
(M. galloprovincialis)
Bioluminescence test
(A. fischeri) (solid phase)
N.A.N.A.Spanish limits for dredged sediments
(CIEM. 2015)
Mestre et al., 2017
[27]
Climate changes and Cd exposureN.A.Trace metals (Cd)
(mussel gills, digestive gland)
(M. galloprovincialis) (lab)
MTs, CAT, GSTs, GPx-H2O2, GPx-CHP, GR, tGSH, TOSCA ROO, TOSCA HO, MDA (dig. gland and gills)
LP. NL (dig. glands)
NRRT, PA, G/H ratio, Comet Assay, MN (haemolymph)
(M. galloprovincialis)
N.A.N.A.N.A.N.A.Nardi et al., 2017
[28]
Microplastics (LDPE) and PAHs (Benzo-a-pyrene) exposureN.A.Benzo-a-pyrene (mussel digestive gland and gills)
(M. galloprovincialis) (lab)
NRRT, PA, G/H ratio, Comet assay, MN (haemolymph)
AChE (haemolymph and gills)
AOX, CAT, GSTs, GPx-H2O2, GPx-CHP; GR, tGSH, TOSCA ROO, TOSCA HO, MDA, NL, (dig. gland)
(M. galloprovincialis)
N.A.N.A.Multivariate statistical analyses (principal component analysis, PCA) Pittura et al., 2018
[29]
Offshore platforms (Adriatic Sea, Italy)trace metals (Al, As, Cd, Cu, Cr,
Hg, Ni, Pb, Zn), PAHs, Aliphatic hydrocarbons,
(sediments)
trace metals, PAHs, Aliphatic hydrocarbons
(native and transplanted mussel whole soft tissues)
(M. galloprovincialis) (field)
PAHs
(ragworm whole tissues)
(Hediste diversicolor)
(lab)
CAT, GSTs, GPx-H2O2, GPx-CHP, GR, tGSH, TOSCA ROO, TOSCA HO, MDA, MTs (dig. gland)
AChE, NRRT, PA, G/H ratio, Comet assay, MN (haemolymph)
(M. galloprovincialis)
Bioluminescence test
(A. fischeri) (solid phase)
larval development test
(A. tonsa)
(solid phase)
growth test
(P. tricornutum)
(elutriate)
embryotoxicity assay
(P. lividus)
(elutriate)
AMBI indexN.A.SQG (2000/60/EC)Regoli et al., 2019
[9]
Industrial site
(Gulf of Naples, Italy)
OM, trace metals (Al, As, Cd, Cr, Cu, Fe, Hg, Ni, Pb, V, Zn), metalloids, Aliphatic hydrocarbons, PAHs, PCBs, OTC, OCP, PCDDs, PCDFs
(sediments)
trace metals, PAHs
(mussel whole soft tissues)
(M. galloprovincialis)
(fish liver)
(Mullus barbatus Pagellus erythrinus, Diplodus vulgaris)
(field)
NRRT, AChE, MN (haemolymph)
MTs (dig. gland)
(M. galloprovincialis)
PAH metabolites (bile)
AChE (brain)
EROD (liver)
MN (gills)
(M. barbatus,
P. erythrinus,
D. vulgaris)
Bioluminescence test
(A. fischeri)
(solid phase)
growth test (Skeletonema costatum)
(elutriate)
Embryo test
(P. lividus)
(elutriate)
AMBI indexN.A.dredged marine sediments SQG (DM 173/2016)Morroni et al., 2020
[12]
Offshore platforms (Adriatic Sea, Italy)trace metals (As, Cd, Ba, Mn, Cu, Cr, Fe
Hg, Ni, Pb, Zn), PAHs, Aliphatic hydrocarbons, Volatile hydrocarbons, BTEX
(sediments)
trace metals, PAHs
(ragworm whole tissues)
(H. diversicolor)
(lab)
LLP (whole tissue)
COMET (coelomocytes)
MN (coelomocytes)
AChE (whole tissue)
MT/MTLPs (whole tissue)
CAT (whole tissue)
TOSCA HO and ROO (whole tissue)
GSTs (whole tissue)
tGSH (whole tissue)
Bioluminescence test
(A. fischeri)
(sediment pore water)
growth test
(D. tertiolecta)
(sediment pore water)
mortality test
(T. fulvus)
(sediment pore water)
N.A.N.A.EQS, (Italian D.Lvo 152/2006), ERL values, (Long et al., 1995),TEL, (Macdonald et al., 1996)This Study
Acronyms: Benzene, Toluene, Ethylbenzene, Xylene (BTEX); Polycyclic Aromatic Hydrocarbons (PAHs); polychlorobiphenyls (PCBs); Aluminium (Al); Barium (Ba); Chromium (Cr); Copper (Cu); Iron (Fe); Manganese (Mn); Nickel (Ni); Zinc (Zn); Arsenic (As); Cadmium (Cd); Lead (Pb); Mercury (Hg); Vanadium (V), organic matter (OM); hexachlorobenzene (HCB); organotin compounds (OSn); organochlorine pesticides (OCPs); brominated flame retardants (BFRs); dioxin (PCDDs); furan (PCDFs); total anionic surfactants (TASs); low-density polyethylene (LDPE); lysosomal membrane stability toward hexosaminidase method (LMS-ESO); catalase (CAT); glutathione S-transferases (GSTs); glutathione peroxidase Se-dependent (GPx H2O2); glutathione peroxidase Se-independent (GPx CHP); glutathione reductase (GR); total glutathione level (tGSH); Total oxyradical scavenging capacity towards peroxyl and hydroxyl radicals (TOSCA ROO and TOSCA HO); d-aminolevulinic acid dehydratase (ALAD); comet assay (COMET); micronuclei frequency (MN); metallothioneins or metallothionein-like proteins (MTs/MTLPs); 4-hydroxyalkenal (4-HNE); acetylcholinesterase (AChE); alkali-labile phosphates (ALP); Acyl-CoA oxidase (AOX); ethoxyresorufin O-deethylase (EROD); granulocytes versus hyalinocytes ratio (G/H ratio); lipofuscin (LP); lysosomal labilisation period (LLP); malondialdehyde (MDA); neutral lipids (NL); neutral red retention time (NRRT); phagocytic activity (PA); superoxide dismutase (SOD); sediment quality guideline (SQG); Effects Range Low/Effects Range Median (ERL/ERM); Threshold Effect Level/Probable Effect Level (TEL/PEL).
Publisher’s Note: MDPI stays neutral with regard to jurisdictional claims in published maps and institutional affiliations.

