Article

Physiological Responses of the Submerged Macrophyte Stuckenia pectinata to High Salinity and Irradiance Stress to Assess Eutrophication Management and Climatic Effects: An Integrative Approach

by
Lamprini Malea
1,
Konstantinia Nakou
1,
Apostolos Papadimitriou
1,
Athanasios Exadactylos
2 and
Sotiris Orfanidis
1,*
1
Benthic Ecology & Technology Laboratory, Fisheries Research Institute (ELGO-DIMITRA), Nea Peramos, 640 07 Kavala, Greece
2
Department of Ichthyology and Aquatic Environment, School of Agricultural Sciences, University of Thessaly, Fytokou str., 384 46 Volos, Greece
*
Author to whom correspondence should be addressed.
Water 2021, 13(12), 1706; https://doi.org/10.3390/w13121706
Submission received: 21 May 2021 / Revised: 11 June 2021 / Accepted: 17 June 2021 / Published: 20 June 2021

Abstract

:
Stuckenia pectinata, a submerged macrophyte of eutrophic to hyper-eutrophic fresh to brackish waters, faces management and climatic-forced increment of salinity and irradiance in Vistonis Lake (Greece) that may endanger its existence and the ecosystem functioning. A pre-acclimated clone under low irradiance and salinity conditions was treated to understand the effects of high salinity and irradiance on a suite of subcellular (chlorophyll a fluorescence kinetics and JIP-test, and chlorophyll content) to organismal (relative growth rate—RGR) physiological parameters. The responses to high irradiance indicated the plant’s great photo-acclimation potential to regulate the number and size of the reaction centers and the photosynthetic electron transport chain by dissipation of the excess energy to heat. A statistically significant interaction (p < 0.01) of salinity and irradiance on Chl a, b content indicated acclimation potential through adjusting the Chl a, b contents. However, no significant (p > 0.05) difference was observed on Chl a/b ratio and the RGR, indicating the species’ potential to become acclimatized by reallocating resources to compensate for growth. Thus, the regulation of photosynthetic pigment content and photosystem II performance consisted of the primary growth strategy to present and future high salinity and irradiance stressful conditions due to eutrophication management and the ongoing climatic changes.

1. Introduction

Submerged macrophytes are aquatic plants of remarkable phenotypic plasticity [1] that grow across contrasting conditions, from pristine to degraded lakes, estuaries, and coastal lagoons [2,3]. They provide food and habitat for invertebrates, larvae and juvenile fishes [4]. They also play a crucial role in water quality improvement by stabilizing the sediments [2]. In addition, they take up excess nitrogen and phosphorus and excrete allelopathic substances [5], contributing to reductions in nuisance algal blooms [6]. Therefore, they are valuable components maintaining the functioning of ecosystems [7,8].
Among the submerged macrophytes, Stuckenia pectinata (L.) Börner (syn. Potamogeton pectinatus L.) is a common species of several eutrophic to hyper-eutrophic fresh to brackish waters worldwide [9,10,11]. Because the plant is food for waterfowl [12], it spreads over long distances [13] and in different environments, where it survives through acclimatization by means of plastic phenotypic responses [1,14,15] and genetic differentiation [16,17].
Stuckenia pectinata is a shade-adapted plant [18] with a relatively low irradiance optimum (50–60 μmol photons m−2 s−1) for photosynthesis [1,18]. Under highly turbid eutrophic conditions, it lengthens its bundles in the upper water layer without exposing them to full sunlight [10,19] to avoid excess light. Thus, this species has been indicated as a bioindicator of moderately turbid-degraded conditions in European lakes [20].
There are conflicting results regarding the effects of salinity on S. pectinata physiology, especially regarding the upper tolerance limit, which is reported from 4.2 to 20.1 [21] or less than 30 [22]. Rodríguez-Gallego et al. [23] reported a salinity tolerance range from 0 to 16.5, while a salinity tolerance range from ca. 5 to 18 has been also reported [24]. van Wijck et al. [25] showed successful plant growth at salinity 0 to 6, while at salinity 9, a decrease in biomass production was observed. Borgnis and Boyer [3] showed that S. pectinata showed four times the biomass production and ten times the number of shoots at salinity values between 0 and 5. While at salinity 10, the plant had double biomass production, at a salinity of 15, it could survive, but with obvious aging. At salinities 0 and 5, it showed the maximum growth and reproduction rate, while at salinities 10 and 15, there was no flowering.
In a recent study, Hu et al. [26] indicated that salinity 12 and 18 restricted light conversion efficiency at high irradiance (340 μmol photons m−2 s−1), and reduced chlorophyll a (Chl a) content, while increasing heat dissipation in S. pectinata. However, there is limited information regarding the effects of high irradiance on the growth and photosynthesis of S. pectinata, especially under fluctuating salinity conditions.
Vistonis is one of the largest Greek shallow lakes (2 m mean depth, ca. 45 km2 area) suffering occasionally from high turbidity (10 July 2014: light attenuation coefficient-k = 1.05−6.77 m−1) and eutrophic to hypertrophic waters (10 July 2014: Chl a = 9.1—240.5 μg/L, total dissolved inorganic nitrogen = 3.35—32.18 μmol/L, soluble reactive phosphorus = 0.16—2.15 μmol/L). Such conditions often favor cyanobacterial blooms, leading to anoxia and massive fish kills [27,28]. Under such conditions, a strong irradiance gradient formed, such that the 1% level of incident photosynthetically active radiation (PAR), often taken as the limit for macrophyte growth, penetrated from 2.19 to 0.61 m deep [29]. For water quality management, the Lake of Vistonis is connected through short channels to nearby lagoons and by a long channel with the Vistonikos Gulf (Northern Aegean Sea). So, its salinity fluctuates between 0 (north part) and 5.9, sometimes reaching 14 [30] and, occasionally, at deep levels, as much as 34 (July 2020; south part), with an increasing tendency. Climatic-forced, sea-level rise may increase the inflow of clear seawater in the lake, increasing the salinity and light availability and leading to benthic vegetation changes that will endanger the existing ecosystem services [31].
Chlorophyll a fluorescence analysis consists of an easy, non-destructive plant method which allows the estimation of photosynthetic physiology under different environmental stress conditions [32]. The OJIP polyphasic Chl a fluorescence rise kinetics plotted on logarithmic time-scale (JIP-test) is a tool to assess the photochemical quantum yield of PSII photochemistry and electron transport activity [33,34,35]. Some of the environmental stressors that caused malfunctions in the plant’s physiology are irradiance and salinity, and JIP-test has been used to assess the plant’s photosynthetic performance [36,37]. For example, high irradiance stress has been referred to as increasing the absorption flux (ABS), the trapping flux (TR), and the dissipation energy flux (DI) per reaction center (RC) in Lemna minor L. [38]. On the other hand, under high salinity conditions, ions enter the cell, disrupting the electron transport chain at the donor and acceptor sides of PSII [39].
Energy generated by photosynthesis is allocated to growth, reproduction, and defense [40]. However, as plants experience stressful conditions, to ensure their survival, they may be acclimatized by reallocating resources toward increased growth or alterations in morphology [41]. There is a need for an integrated (i.e., at different biological levels) study to assess plant response to stress [42].
This study aimed to investigate S. pectinata’s responses under medium (MI) and high irradiance (HI) and medium (MS) and high salinity (HS) stress, representative of existing and future water conditions of the brackish-south part of Vistonis Lake (Greece). The temperature was regulated to early-summer conditions and the nutrient levels to eutrophic conditions. A clone pre-acclimated for two years under low irradiance and salinity laboratory conditions was used to avoid seasonality or acute effects on species physiology. We applied a suite of physiological parameters representative of subcellular (Chl a fluorescence and Chl content) to organismal (growth) processes. The results will be valuable (a) in gaining an insight into on the photosynthetic and growth responses that allow the species to inhabit the brackish and clear water depths, (b) in contributing a management strategy to protect the freshwater habitats of the lake under the ongoing climatic changes.

2. Materials and Methods

2.1. Plant Material

A S. pectinata strain isolated from Vistonis Lake (Greece) was cultivated for two years in a PVC tank with tap water in the laboratory at 15–18 °C and 30 μmol photons m−2 s−1, 14 h light per day. Twenty-four apical shoots of the plant were randomly chosen for the experiment and pre-acclimated for 14 days at increased salinity from 4 to 19 (1 salinity degree per day), in 2 L aquariums at 21–22 °C and 60 μmol photons m−2 s−1, 14 h light per day. The eutrophic medium was renewed once a week, and it consisted of artificial aerated medium (60 μmol/L N-NO3 and 2 μmol/L P-PO4) produced by Münster sea salt (Meersalz) diluted in resin-filtered tap water (<15 μS cm−1).

2.2. Experimental Design and Treatments

A factorial experiment (n = 6) was carried out in culture chamber at 24–26 °C and lasted ten days in which combined effects of salinity (two levels: 9 and 19) and irradiance (two levels: 100 and 400 μmol photons m−2 s−1, MI and HI, respectively) on the pre-acclimated S. pectinata were tested. There were four experimental conditions. C1: salinity 9 and irradiance 100 μmol photons m−2 s−1, C2: salinity 19 and irradiance 100 μmol photons m−2 s−1, C3: salinity 9 and irradiance 400 μmol photons m−2 s−1, C4: salinity 19 and irradiance 400 μmol photons m−2 s−1. Irradiance was provided for 14 h per day by LED Fyto-Panels (81 × 27 cm; Photon Systems Instruments, Drasov, Czech Republic). Two hundred milliliters of the medium was renewed every day inside small glass jars covered by transparent glass (2 mm) to avoid evaporation. All glass jars used for the experiment were placed on shakers to avoid medium stratification.

2.3. Chlorophyll-a Fluorescence Measurements

Chlorophyll a fluorescence measurements were carried out on experimental days 1, 5, and 8. The polyphasic Chl a fluorescence kinetics (OJIP) were measured using a continuous excitation plant efficiency analyzer (Handy PEA; Hansatech Instruments Ltd., Norfolk, UK). Before the measurement of each specimen, a dark adaptation of 15 min was conducted. Plant leaves were illuminated with continuous red light (wavelength in peak 650 nm) from three diodes of 3.000 μmol photons m−2 s−1. The fast fluorescence rise kinetics was recorded from 10 μs to 1 s. The fluorescence intensity at 20 μs, 50 μs, 100 μs 300 μs, 2 ms, and 30 ms was measured, and the maximum fluorescence was extracted. Several basic parameters were calculated from the extracted data, and the basic parameters derived by the JIP-test models included nine biophysical parameters (Table 1).

2.4. Chlorophyll (a, b) Content

Chlorophyll a and Chl b content was determined at the end of the experiment (day 10th), according to [44]. The chlorophyll concentration was expressed as mg/g wet biomass (wb) of a leaf. The extraction was carried out in a dark room using 10 mL of 90% acetone and clear sand and the centrifugation lasted 10 min at 1500 rpm. Specimens’ absorbance was measured at the wavelengths of 647, 664, and 750 nm using a Shimadzu UV-1800 spectrophotometer, Kyoto, Japan. The chlorophyll content was calculated according to the following equations: Chl a (μg mL−1) = 11.93E664 − 1.93E647, Chl b (μg mL−1) = 20.3E647 − 4.68E664, where E = corrected absorbency (absorbency at the wavelength − absorbency at 750 nm). The final chlorophyll content was expressed as mg Chl g−1 wb using the volume of acetone used to extract the pigments, divide by the wb of the leaf.

2.5. Relative Growth Rate

The relative growth rate (RGR) was calculated as RGR (day−1) = (LnWBt2 − LnWBt1)/(t2 − t1), where WBt2 was the wet biomass on the experimental day 10th, and WBt1 was the wet biomass on the experimental day 1st.

3. Statistical Analysis

All statistical analyses were conducted using the software STATISTICA for Windows (version 7.1; StatSoft and TIBCO Software Inc., Palo Alto, CA, USA). Data were presented as mean (n = 6) ± standard error (SE) for each sample. Normality was tested by the Shapiro–Wilk’s W test, while Levene’s test tested the homogeneity. The effects of salinity (fixed factor, two levels: 9 and 19) and irradiance (fixed factor, two levels: 100 and 400 μmol photons m−2 s−1) on JIP-test parameters were analyzed with the parametric repeated measures analysis of variance (two-way repeated-measures ANOVA) and on chlorophyll content and RGR with parametric factorial analysis of variance (two-way ANOVA). The multiple comparisons were tested by Duncan’s post hoc test. In the present study, samples did not have normal distribution and homogeneity of variance; thus, the significance level (p-value) was defined as 0.01 [45]. Redundancy analysis (RDA) was used to quantify the irradiance and salinity effects on the variation of chlorophyll fluorescence (day 8th), chlorophyll content (day 8th), and RGR (day 10th) parameters using Canoco 5.1 (Microcomputer Power, Ithaca, NY, USA). Statistical tests were run using the Monte Carlo permutation procedure.

4. Results

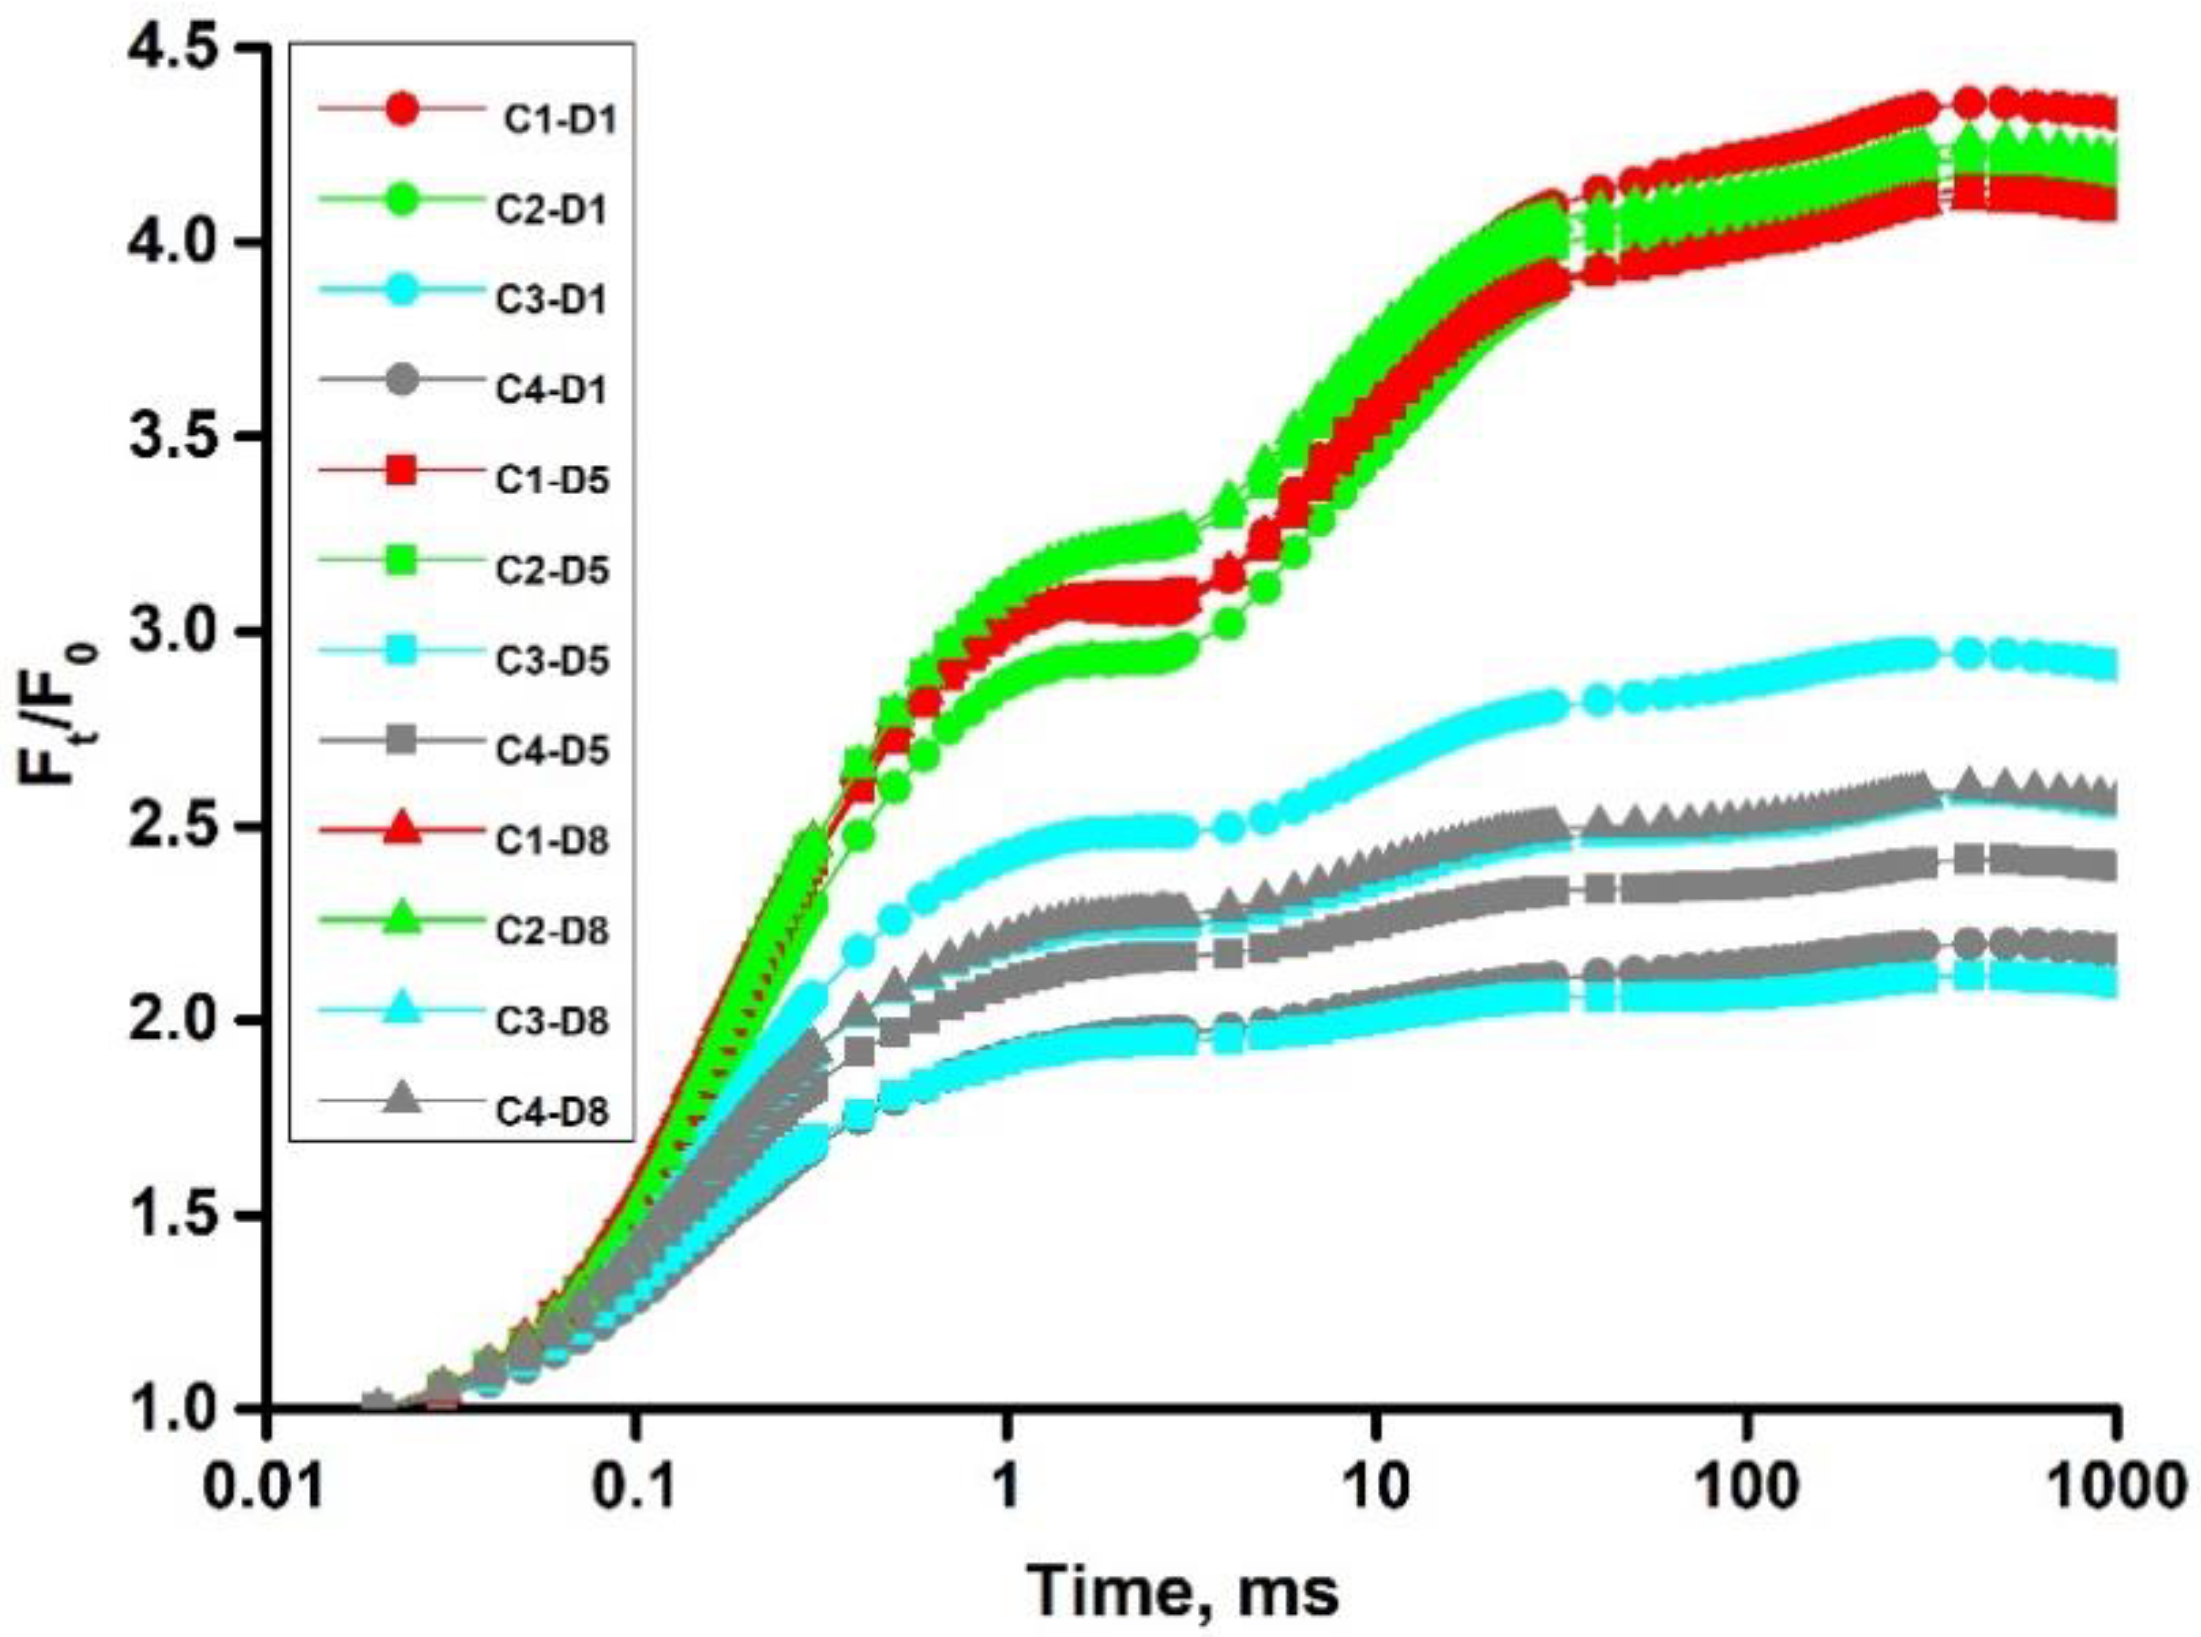
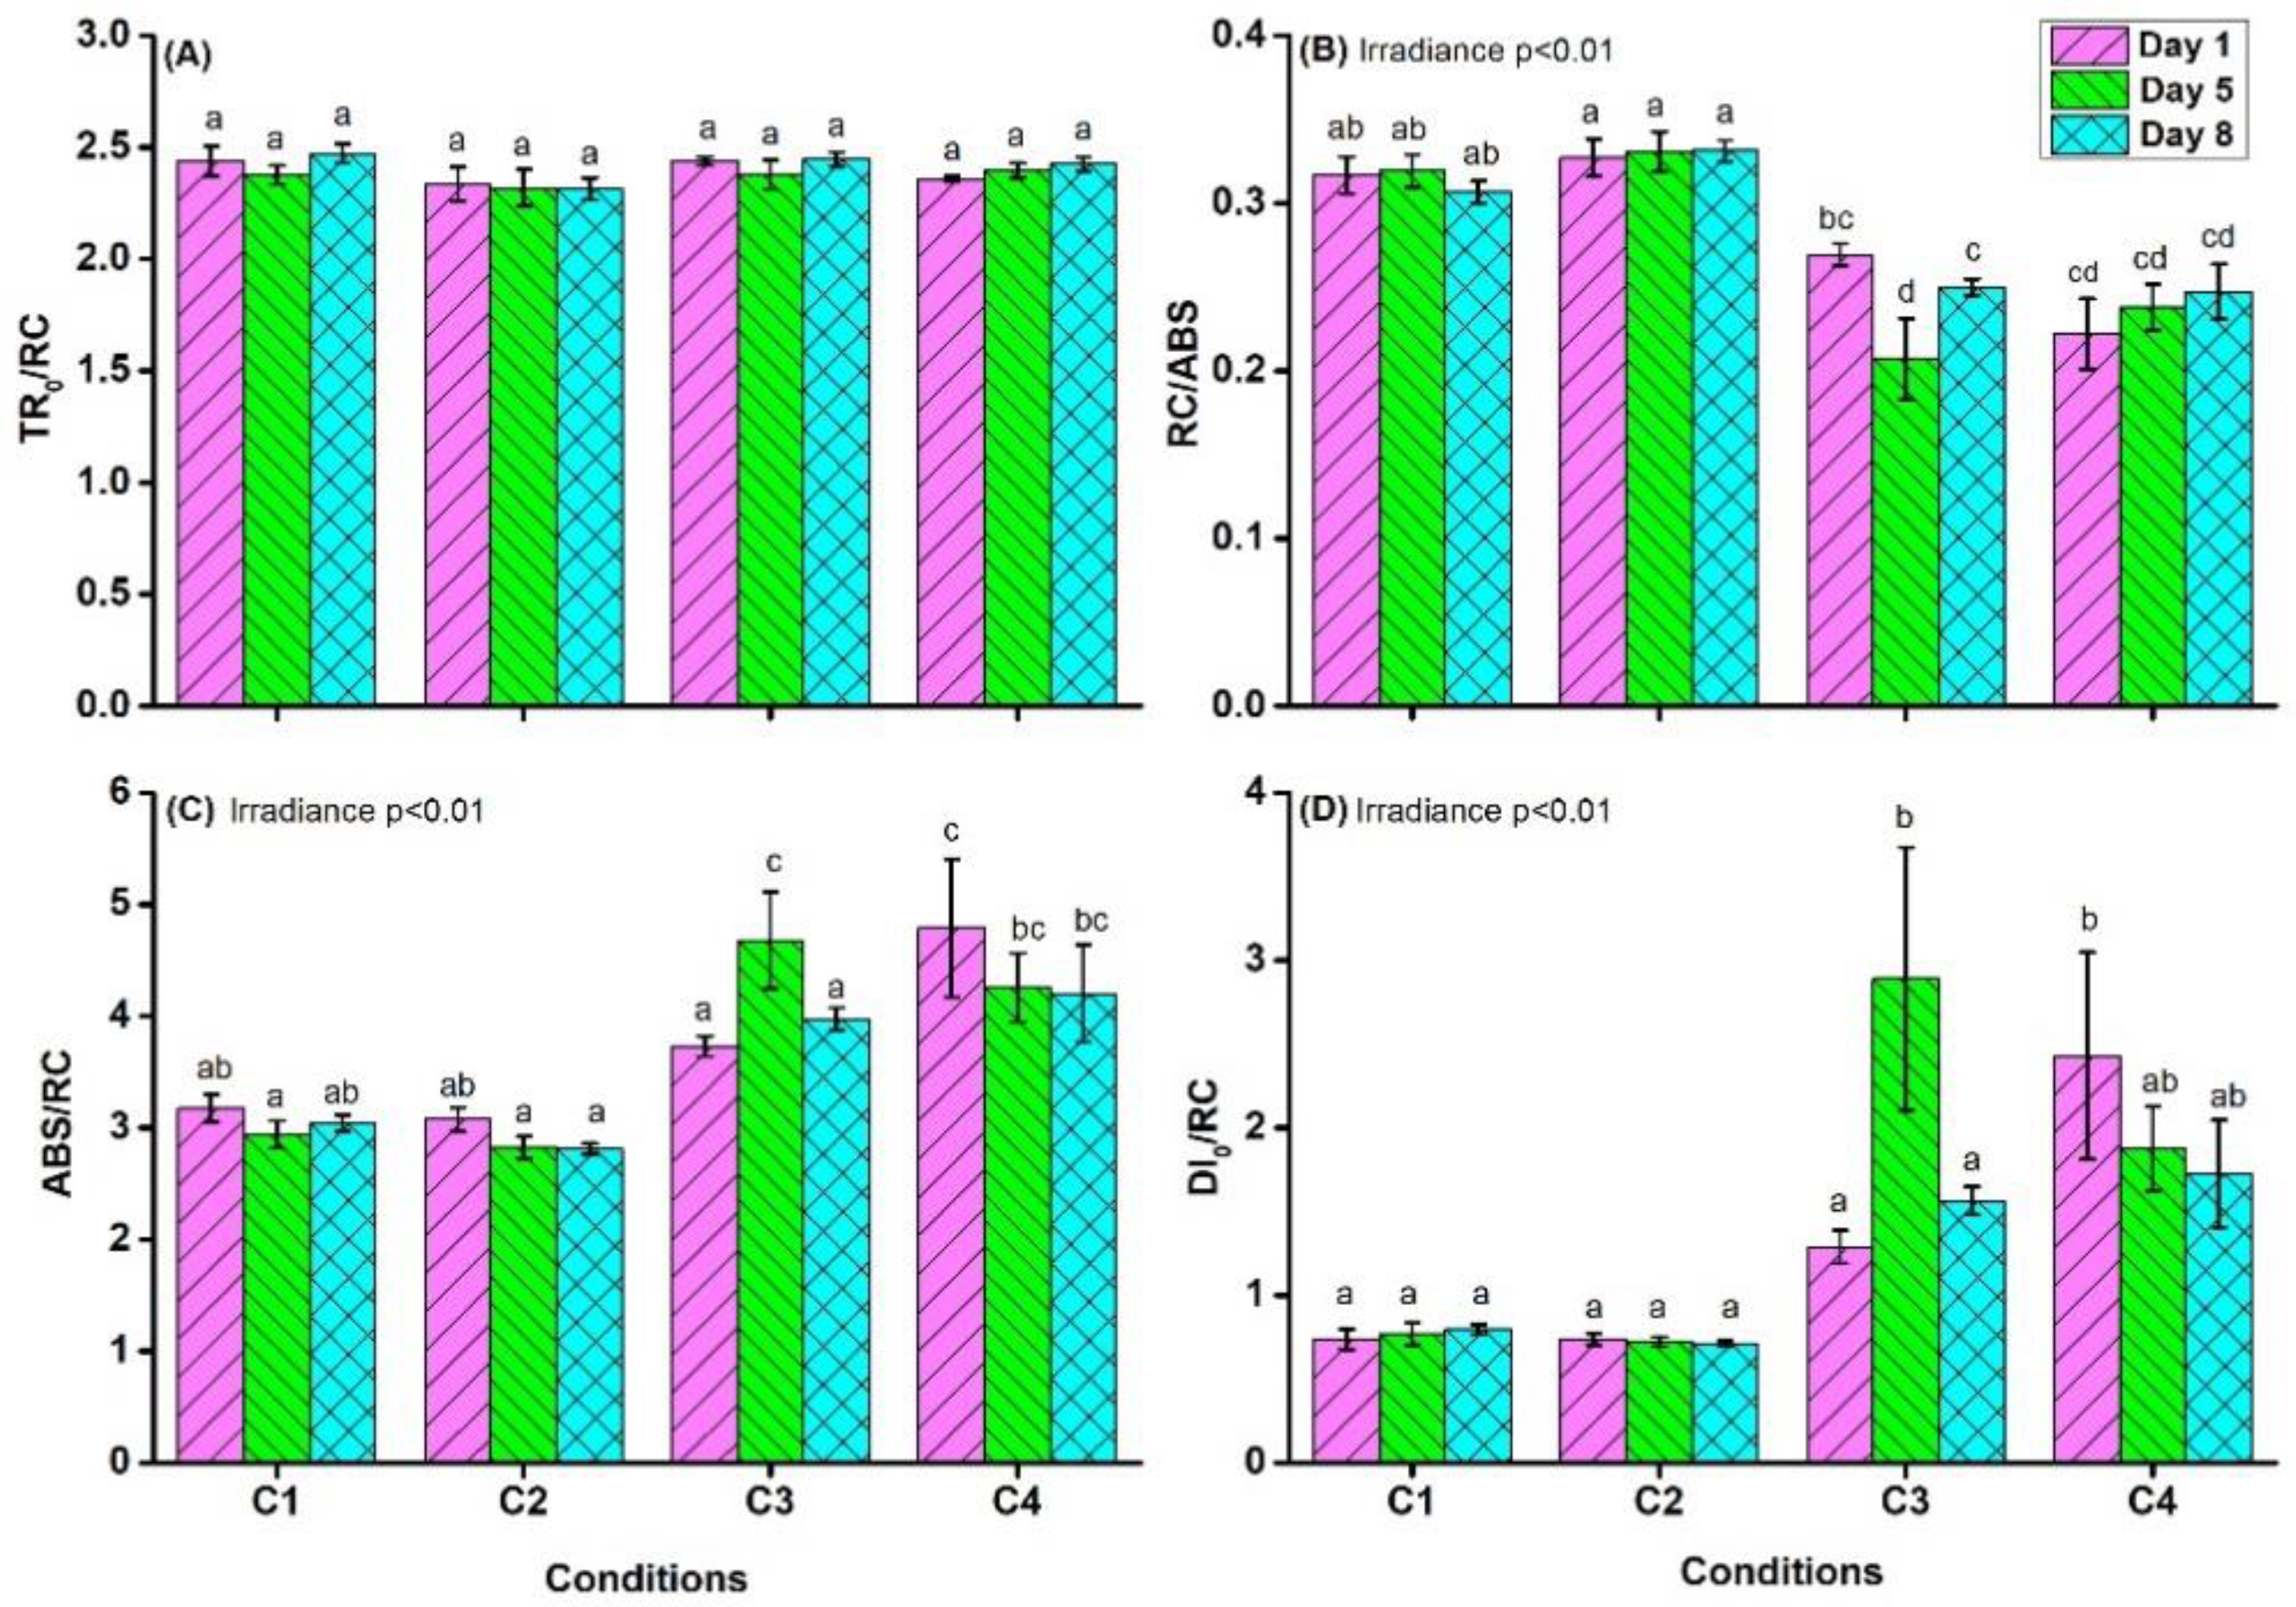
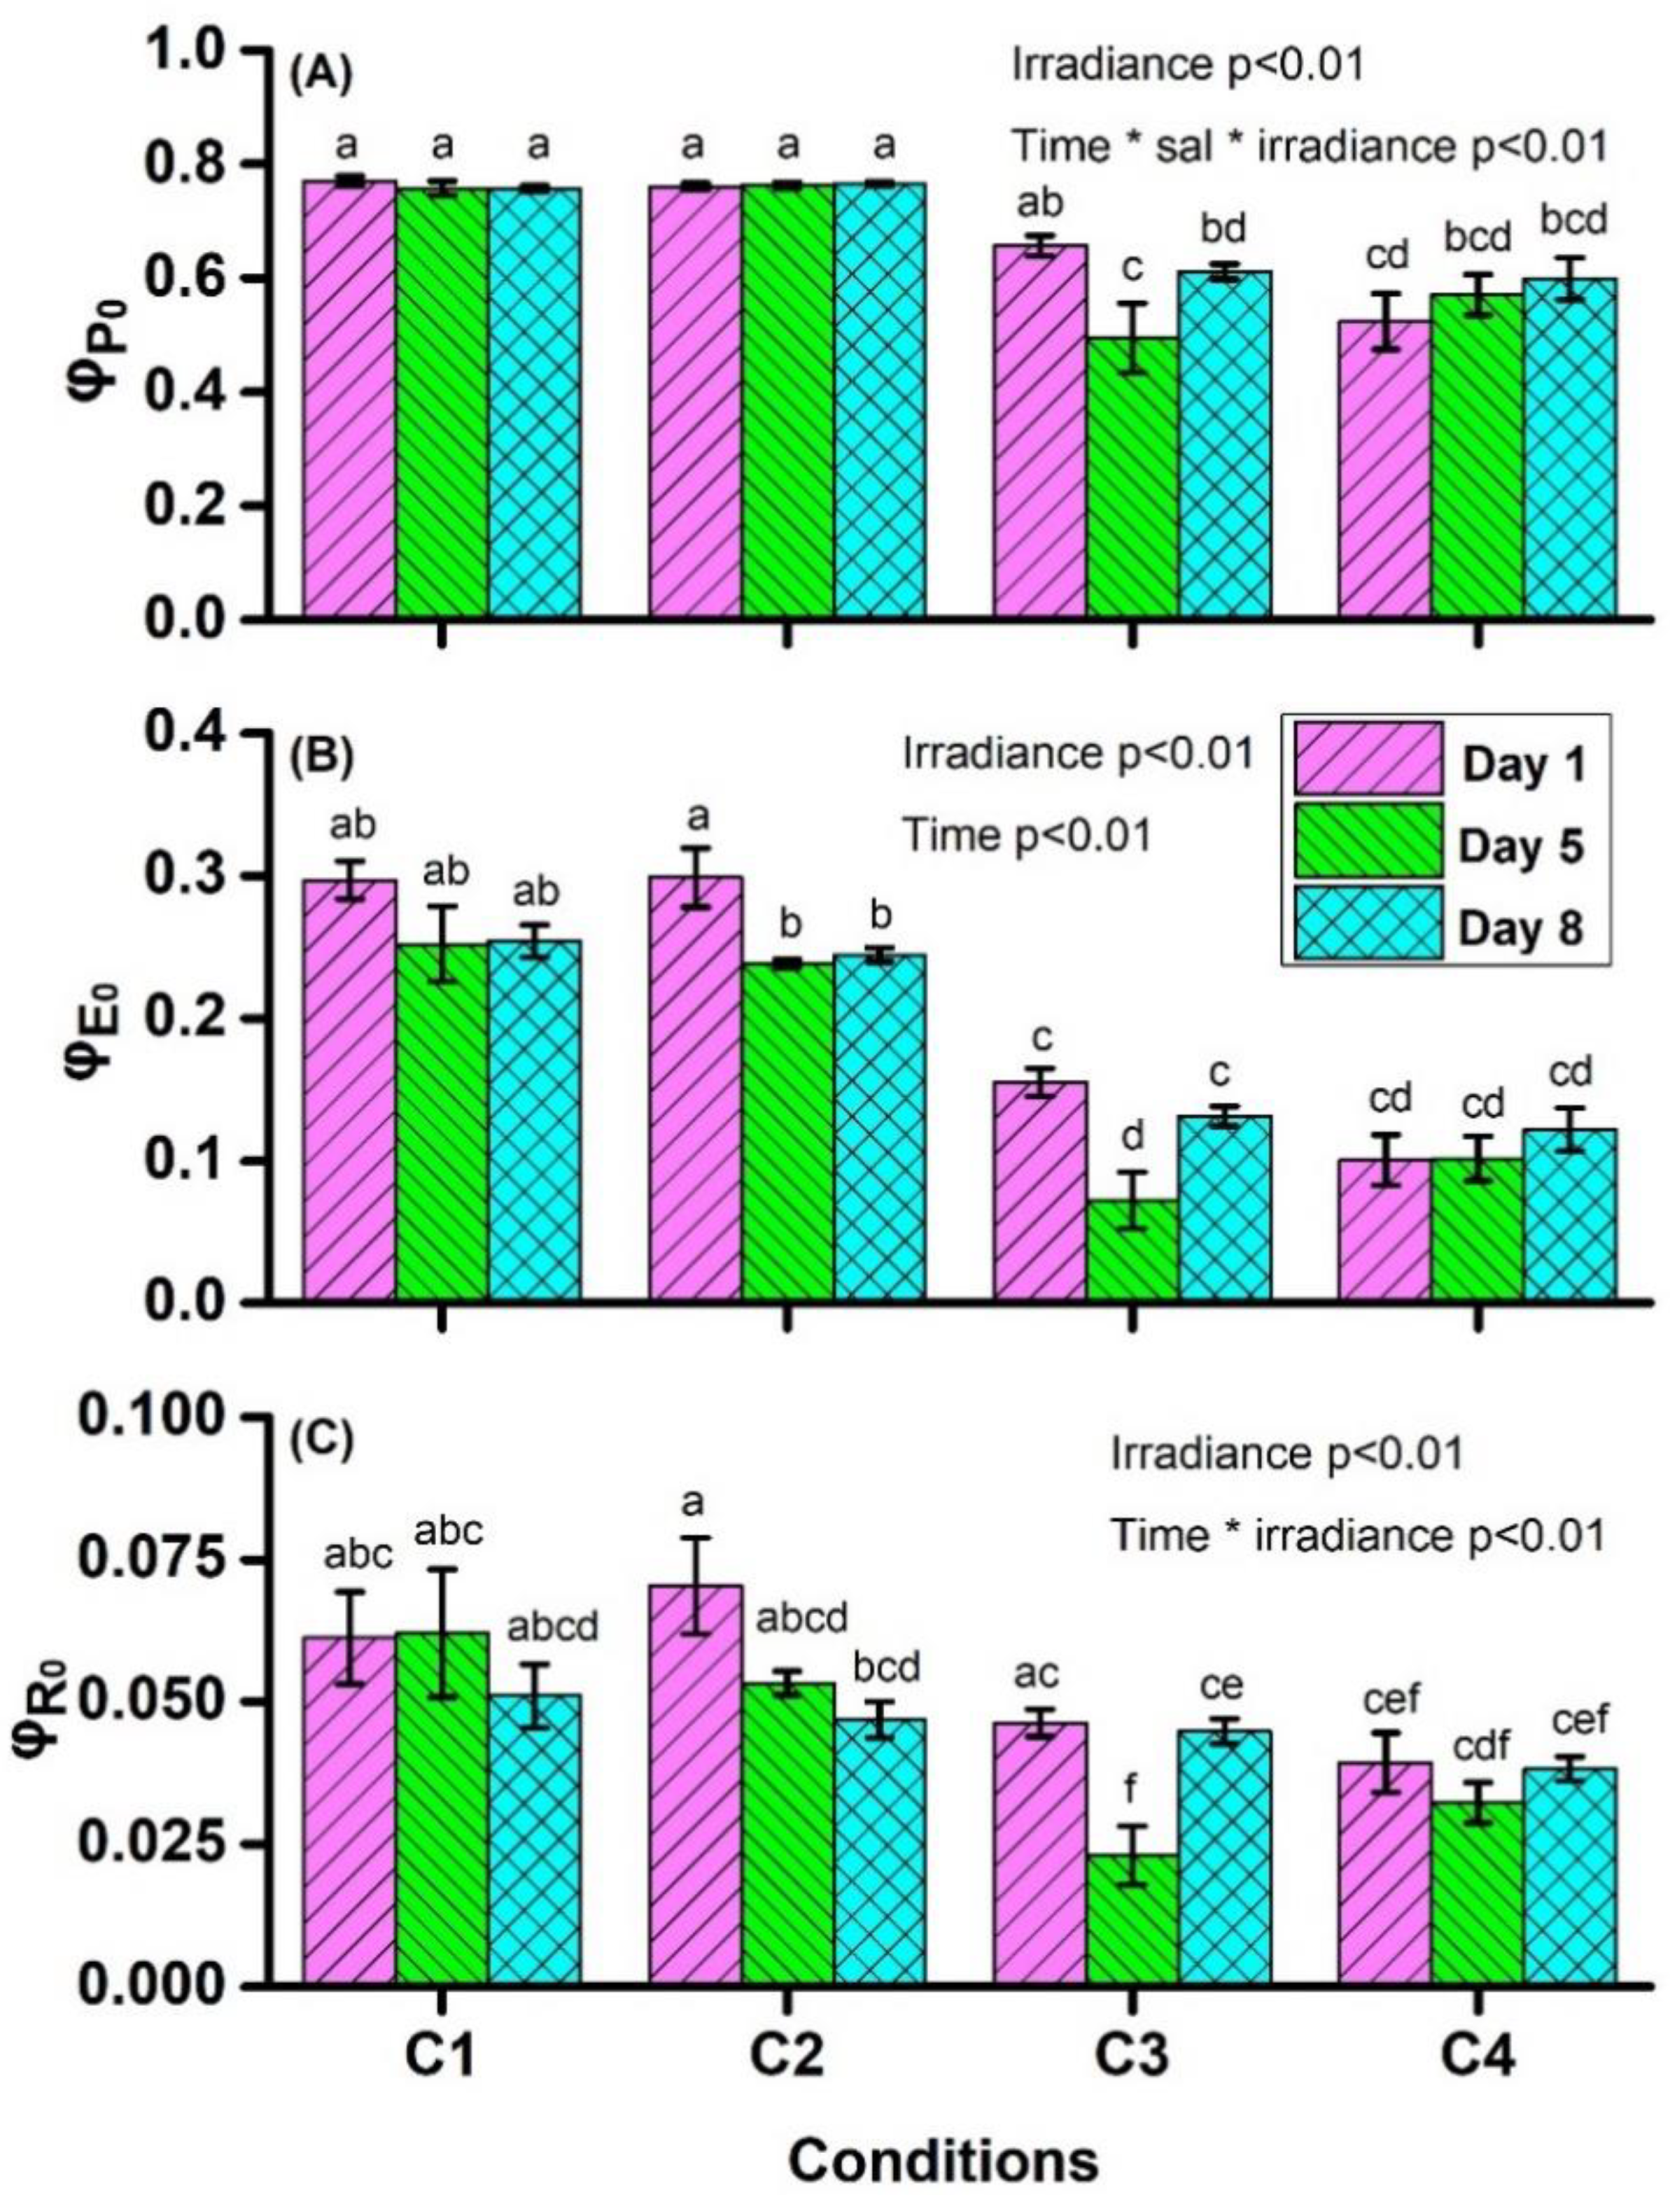
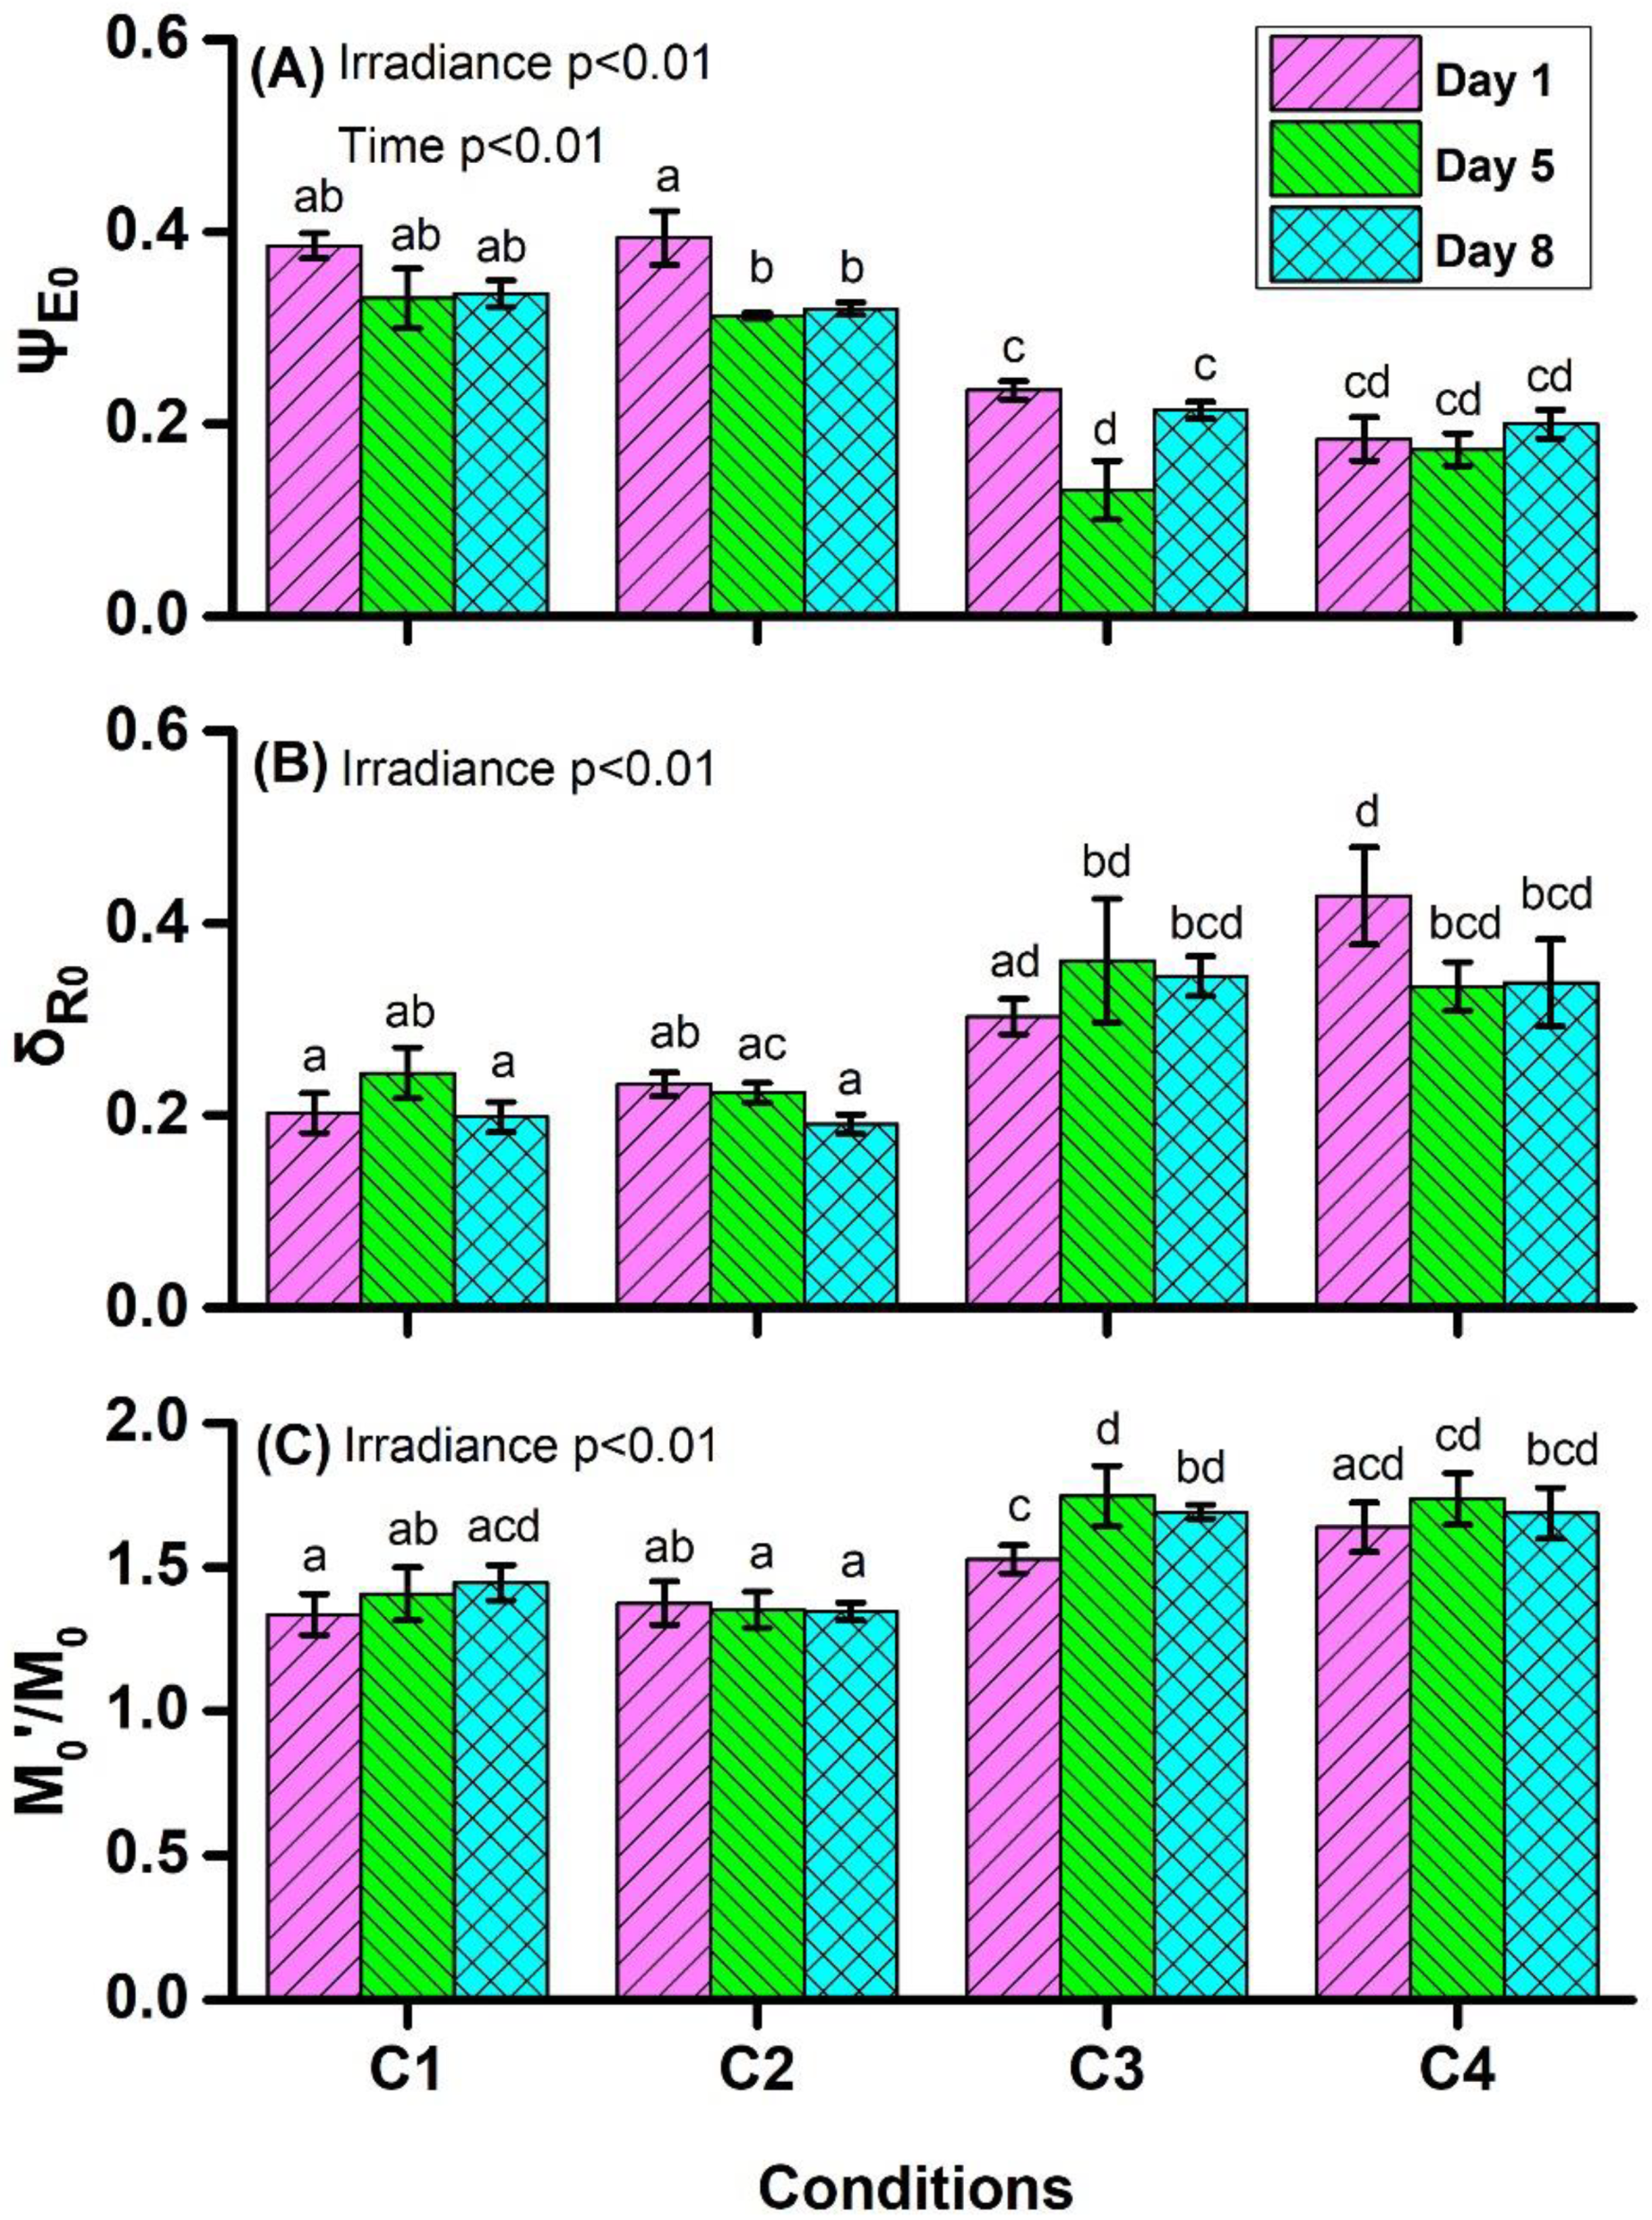
4.1. Chlorophyll a Fluorescence Measurements

(a) Normalizations and Subtractions
The chlorophyll a fluorescence polyphasic O-J-I-P kinetics of dark-adapted samples grown under C1, C2, C3, and C4, for 1, 5, and 8 days are evident in Figure 1. Each kinetic is the average of six replicates, after each of the kinetics Ft = f(t) was normalized on its initial value; i.e., the averages are plotted as Ft/F0 = f(t). This normalization was permitted as the minor variations observed among the raw F20μs values were random and not depending on the treatment. Hence, the experimental F20μs was reasonably taken as the real F0. The kinetics demonstrated clearly that high light levels (C3 and C4) result in a pronounced suppression of the variable fluorescence (Ft − F0) throughout the entire time course of the 1 s.
(b) The JIP-Test Parameters
The trapped energy flux per RC (TR0/RC) was not affected by irradiance or salinity and their interaction (Figure 2A, Table S1), but the effect of irradiance was significant on RCs per PSII antenna Chl a (RC/ABS; p < 0.001, Table S1). Mean RC/ABS values (Figure 2B) were higher at 100 μmol photons m−2 s−1 (C1, C2) than at 400 μmol photons m−2 s−1 (C3, C4). The maximum RC/ABS values were observed at C2 and at C1 on the 5th day, while the minimum values were observed at C3 on the 5th day and at C4 on the 1st day. Post hoc comparisons (Table S2) showed that RC/ABS values were significantly lower in C3 and C4 than in C1 and C2.
The effect of irradiance was significant on the light absorption flux of antenna chlorophyll molecules per RC (also a measure of PSII apparent antenna size-ABS/RC; p < 0.001, Table S1). Mean ABS/RC values (Figure 2C) were higher at 400 μmol photons m−2 s−1 (C3, C4) than at 100 μmol photons m−2 s−1 (C1, C2). The maximum values of ABS/RC were observed at C3 on the 5th day and at C4 on the 1st day, while the minimum values were observed at C1 on the 5th day and at C2 on the 8th day. Post hoc comparisons (Table S3) showed that ABS/RC values were significantly lower in C1 and C2 than in C3 and C4 conditions. There was a significant interaction between salinity and treatment time on ABS/RC (p < 0.01, Table S1). At salinity 19 (C2, C4), no significant differences were observed. At 400 μmol photons m−2 s−1 (C3), ABS/RC values increased from the 1st to the 5th day, but they decreased on the 8th day.
The effect of irradiance was significant on the dissipated energy flux per RC (DI0/RC; p < 0.001, Table S1). Mean DI0/RC values were higher at 400 μmol photons m−2 s−1 (C3, C4) than at 100 μmol photons m−2 s−1 (C1, C2). The maximum of DI0/RC were observed at C3 on the 5th day and at C4 on the 1st day, while the minimum values were observed at C2 on the 8th day and at C2 on the 1st day. Post hoc comparisons (Table S4) showed that DI0/RC values were significantly lower in C1 and C2 than in C3 and C4 conditions.
The effect of irradiance was significant on φP0, i.e., the efficiency by which PSII transforms excitation energy to oxido-reduction energy (reduction of the primary electron quinone acceptor QA to QA) (p < 0.01, Table S1). Mean φP0 values (Figure 3A) were higher at 100 μmol photons m−2 s−1 (C1, C2) than at 400 μmol photons m−2 s−1 (C3, C4). The maximum φP0 values were observed at C1 on the 1st day and at C2 on the 8th day, while the minimum values were observed at C3 on the 5th day and at C4 on the 1st day. Post hoc comparisons (Table S5) showed that φP0 values were significantly lower in C3 and C4 than in C1 and C2. There was also a significant interaction between salinity, irradiance and treatment time on φP0 (p < 0.01, Table S1). At salinity 9 and irradiance 400 μmol photons m−2 s−1 (C3), φP0 values decreased on the 5th day, but they partly recovered on the 8th day. In the other conditions (C1, C3, C4), φP0 did not exert significant changes over time.
The effect of irradiance was significant on the quantum yields for electron transport to the plastoquinone (PQ) pool (φE0; p < 0.01, Table S1). Mean φE0 values (Figure 3B) were higher at 100 μmol photons m−2 s−1 (C1, C2) than at 400 μmol photons m−2 s−1 (C3, C4). The maximum φE0 values were observed at C2 and at C1 on the 1st day, while the minimum values were observed at C3 on the 5th day and at C4 on the 1st day. Post hoc comparisons (Table S6) showed that φE0 values were significantly lower in C3 and C4 than in C1 and C2. The effect of treatment time was significant on φE0 (p < 0.01, Table S1). φE0 values in C3 decreased on the 5th day, but they partly recovered on the 8th day.
The effect of irradiance was significant on the quantum yields for electron transport to the electron acceptors at the PSI acceptor side (φR0; p < 0.01, Table S1). Mean φR0 values (Figure 3C) were higher at 100 μmol photons m−2 s−1 (C1, C2) than at 400 μmol photons m−2 s−1 (C3, C4). The maximum φR0 values were observed at C2 on the 1st day and at C2 on the 5th day, while the minimum values were observed at C3 and at C4 on the 5th day. Post hoc comparisons (Table S7) showed that φR0 values were significantly lower in C3 and C4 than in C1 and C2. There was also a significant interaction between irradiance and treatment time on φR0 (p < 0.01, Table S1). At irradiance 400 μmol photons m−2 s−1 (C3, C4), φR0 decreased from the 1st to the 5th day, but they partly recovered on the 8th day, while at 100 μmol photons m−2 s−1 (C1, C2), φR0 decreased over time.
The effect of irradiance was significant on the efficiency/probability that an electron moves further than QAE0; p < 0.01, Table S1). Mean ψE0 values (Figure 4A) were higher at 100 μmol photons m−2 s−1 (C1, C2) than at 400 μmol photons m−2 s−1 (C3, C4). The maximum ψE0 values were observed at C1 on the 1st day and at C2 on the 1st day, while the minimum values were observed at C3 on the 5th day and at C4 on the 5th day. Post hoc comparisons (Table S8) showed that ψE0 values were significantly lower in C3 and C4 than in C1 and C2. The effect of treatment time was significant on ψE0 (p < 0.01, Table S1). ΨE0 values decreased on the 5th day, but they partly recovered on the 8th day.
The effect of irradiance was significant on the efficiency/probability that an electron from the intersystem electron carriers is transferred to reduce end electron acceptors at the PSI acceptor side (δR0; p < 0.01, Table S1). Mean δR0 values (Figure 4B) were higher at 400 μmol photons m−2 s−1 (C3, C4) than at 100 μmol photons m−2 s−1 (C1, C2). The maximum δR0 values were observed at C4 on the 1st day and at C3 on the 5th day, while the minimum values were observed at C2 and at C1 on the 8th day. Post hoc comparisons (Table S9) showed that δR0 values were significantly higher in C3 and C4 than in C1 and C2.
The effect of irradiance was significant on the connectivity of PSII photosynthetic units (M0’/M0; p < 0.01, Table S1). Mean M0’/M0 values (Figure 4C) were higher at 400 μmol photons m−2 s−1 (C3, C4) than at 100 μmol photons m−2 s−1 (C1, C2). The maximum M0’/M0 values were observed at C3 and at C4 on the 5th day, while the minimum values were observed at C1 on the 1st day and at C2 on the 8th day. Post hoc comparisons (Table S10) showed that M0’/M0 values were significantly lower in C3 and C4 than in C1 and C2. Differences due to salinity and time are found not to be statistically significant.

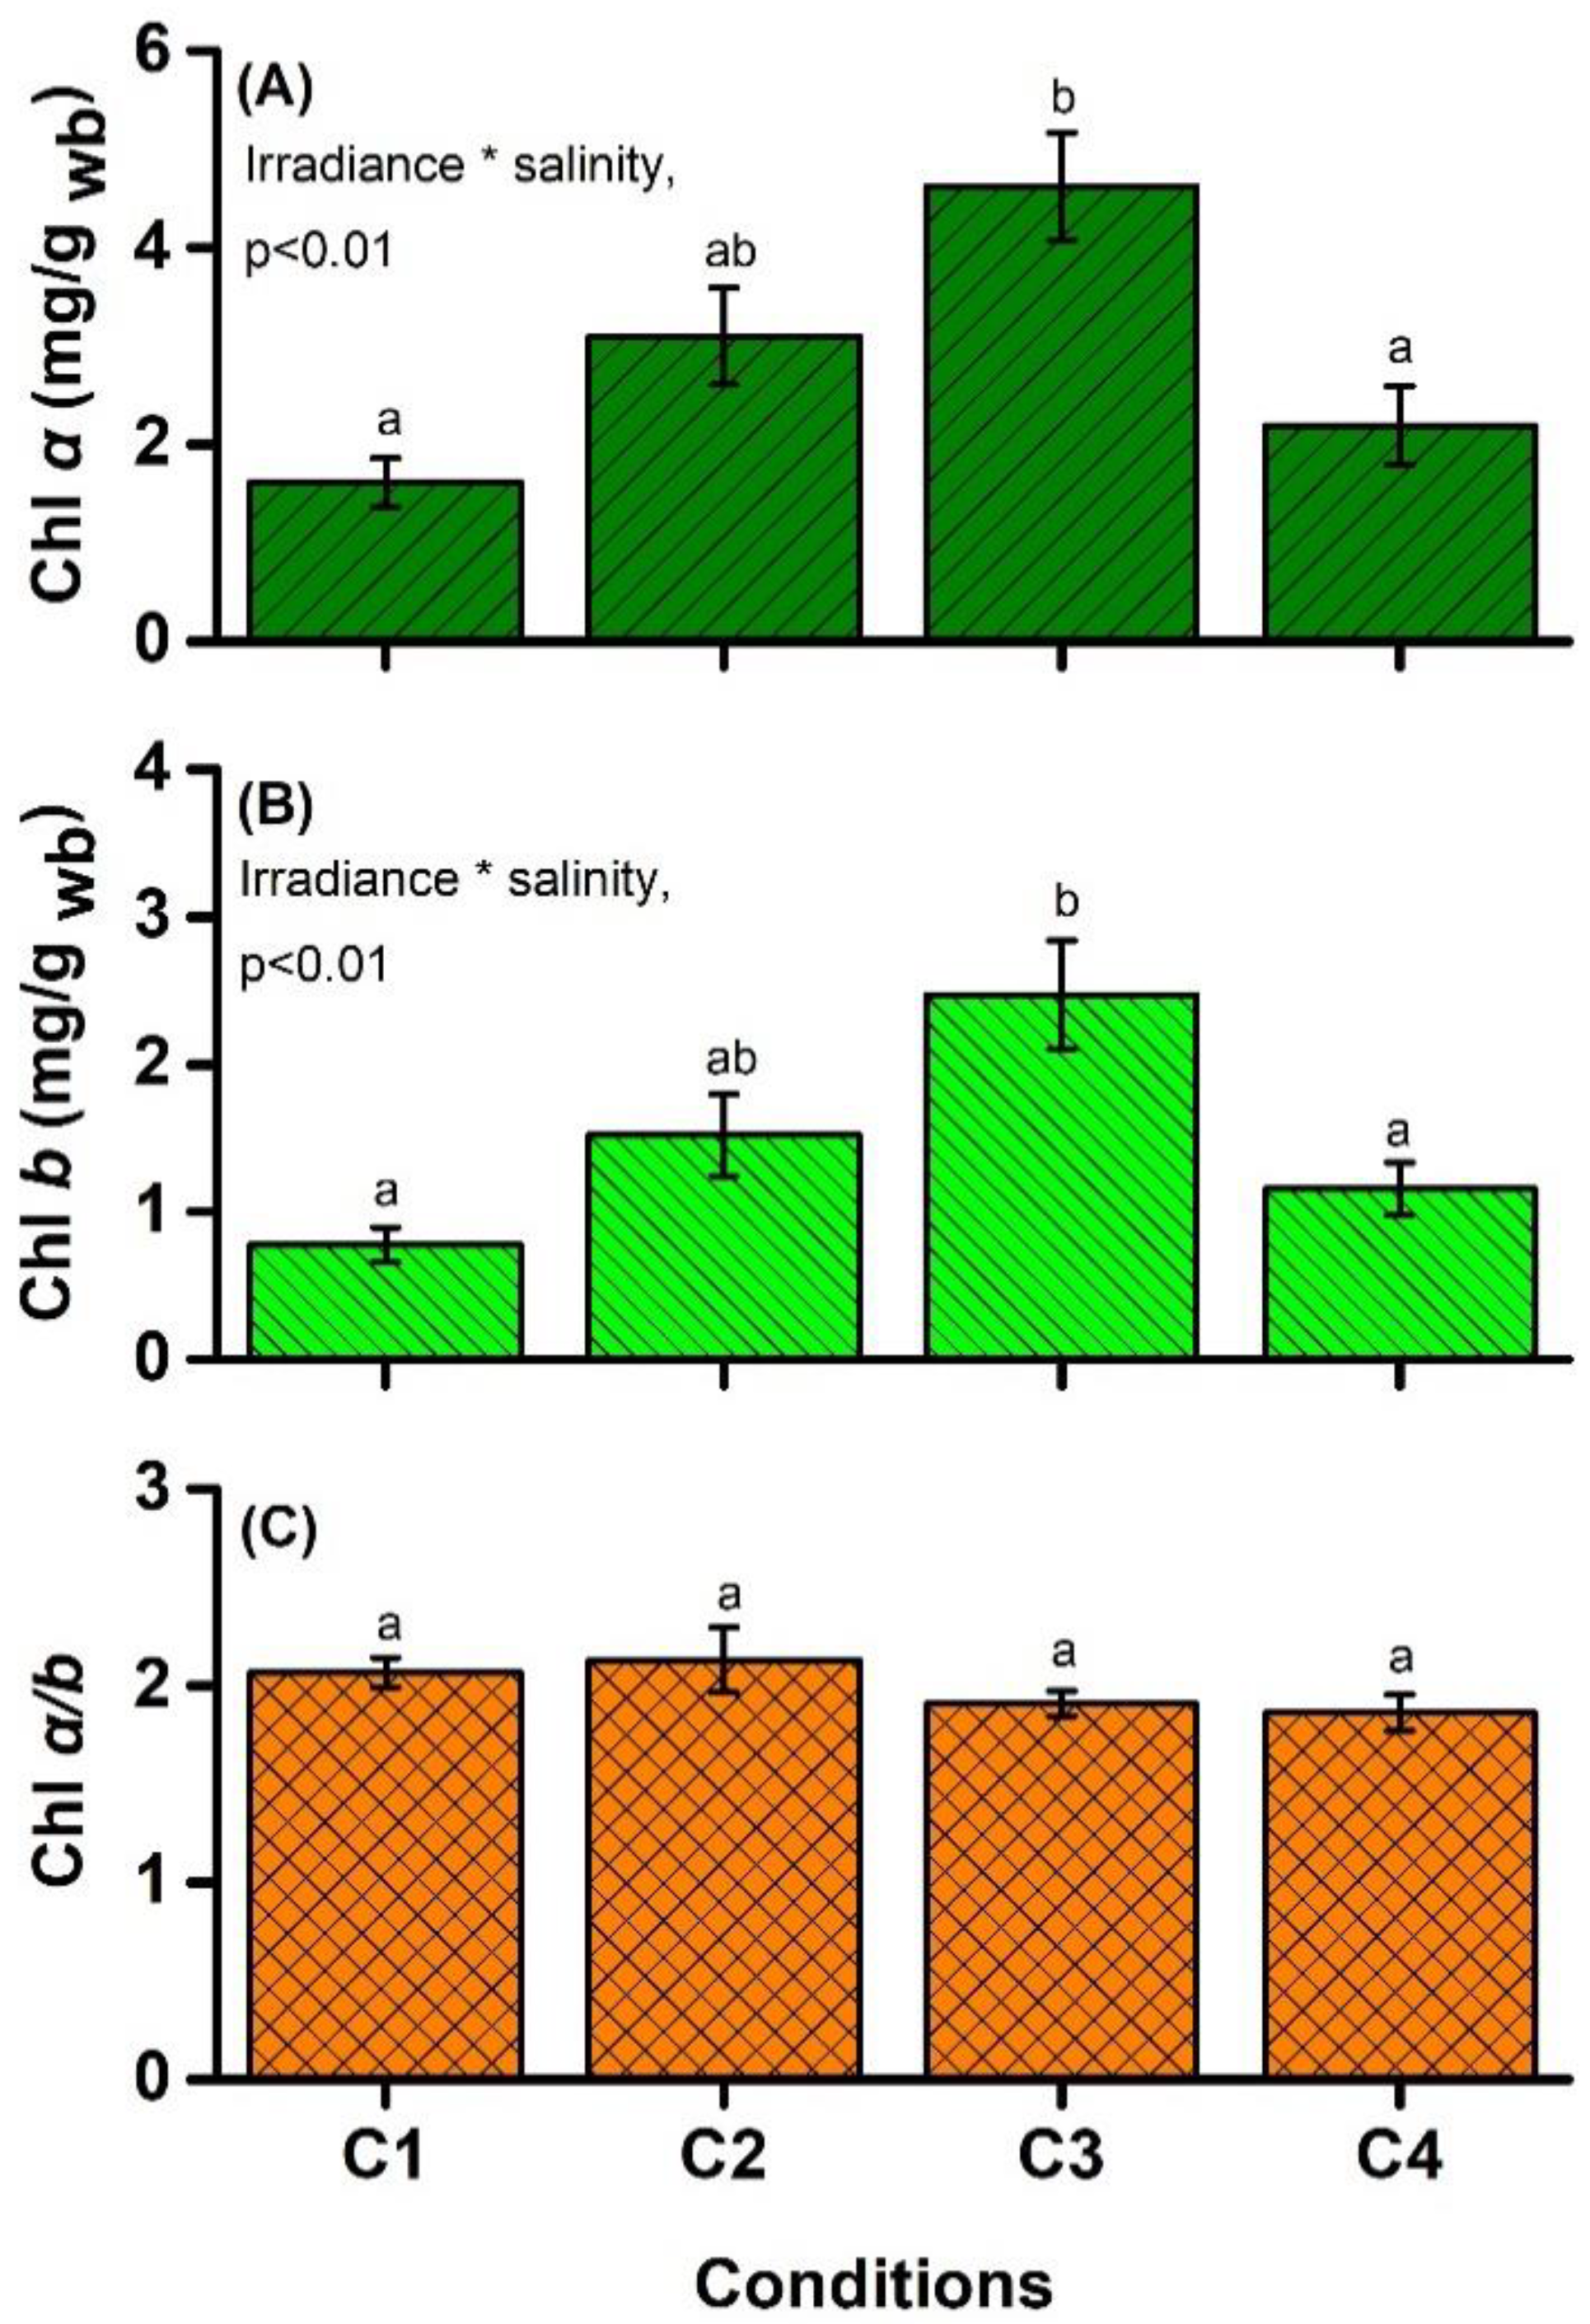
4.2. Chlorophyll Content

There was a significant interaction between irradiance and salinity on leaf Chl a and Chl b content (p < 0.001, Table S11). Mean Chl a and Chl b values are shown in Figure 5A,B and were maximal at C3 and minimal at C1. Post hoc comparisons showed that Chl a (Table S12) and Chl b (Table S13) values under C1 and C4 were significantly lower than those under C3. There was not any significant effect of irradiance and salinity on Chl a/b ratio (Table S2). Mean values of the Chl a/b ratio are shown in Figure 5C. The maximum mean Chl a/b values were at C2 and the minimum values were at C4.

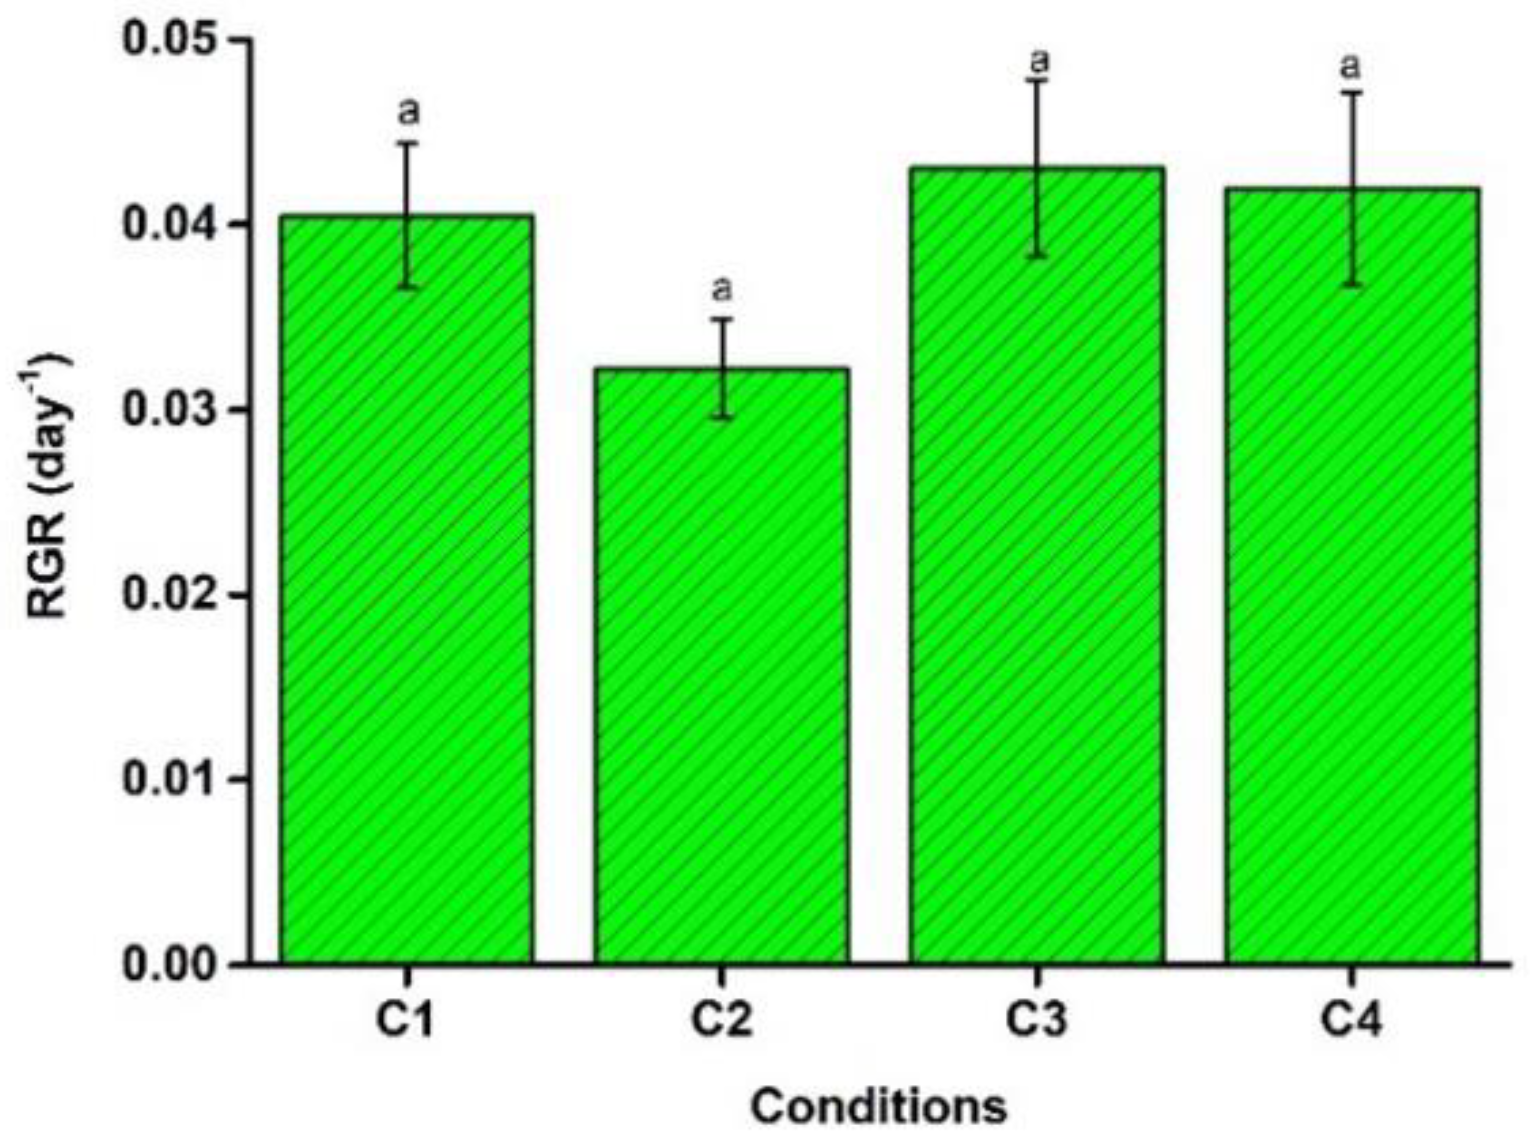
4.3. Relative Growth Rate

There was no significant effect of salinity and irradiance on RGR (Table S14). Mean RGR values (Figure 6) were maximal at C3 and minimal at C2.

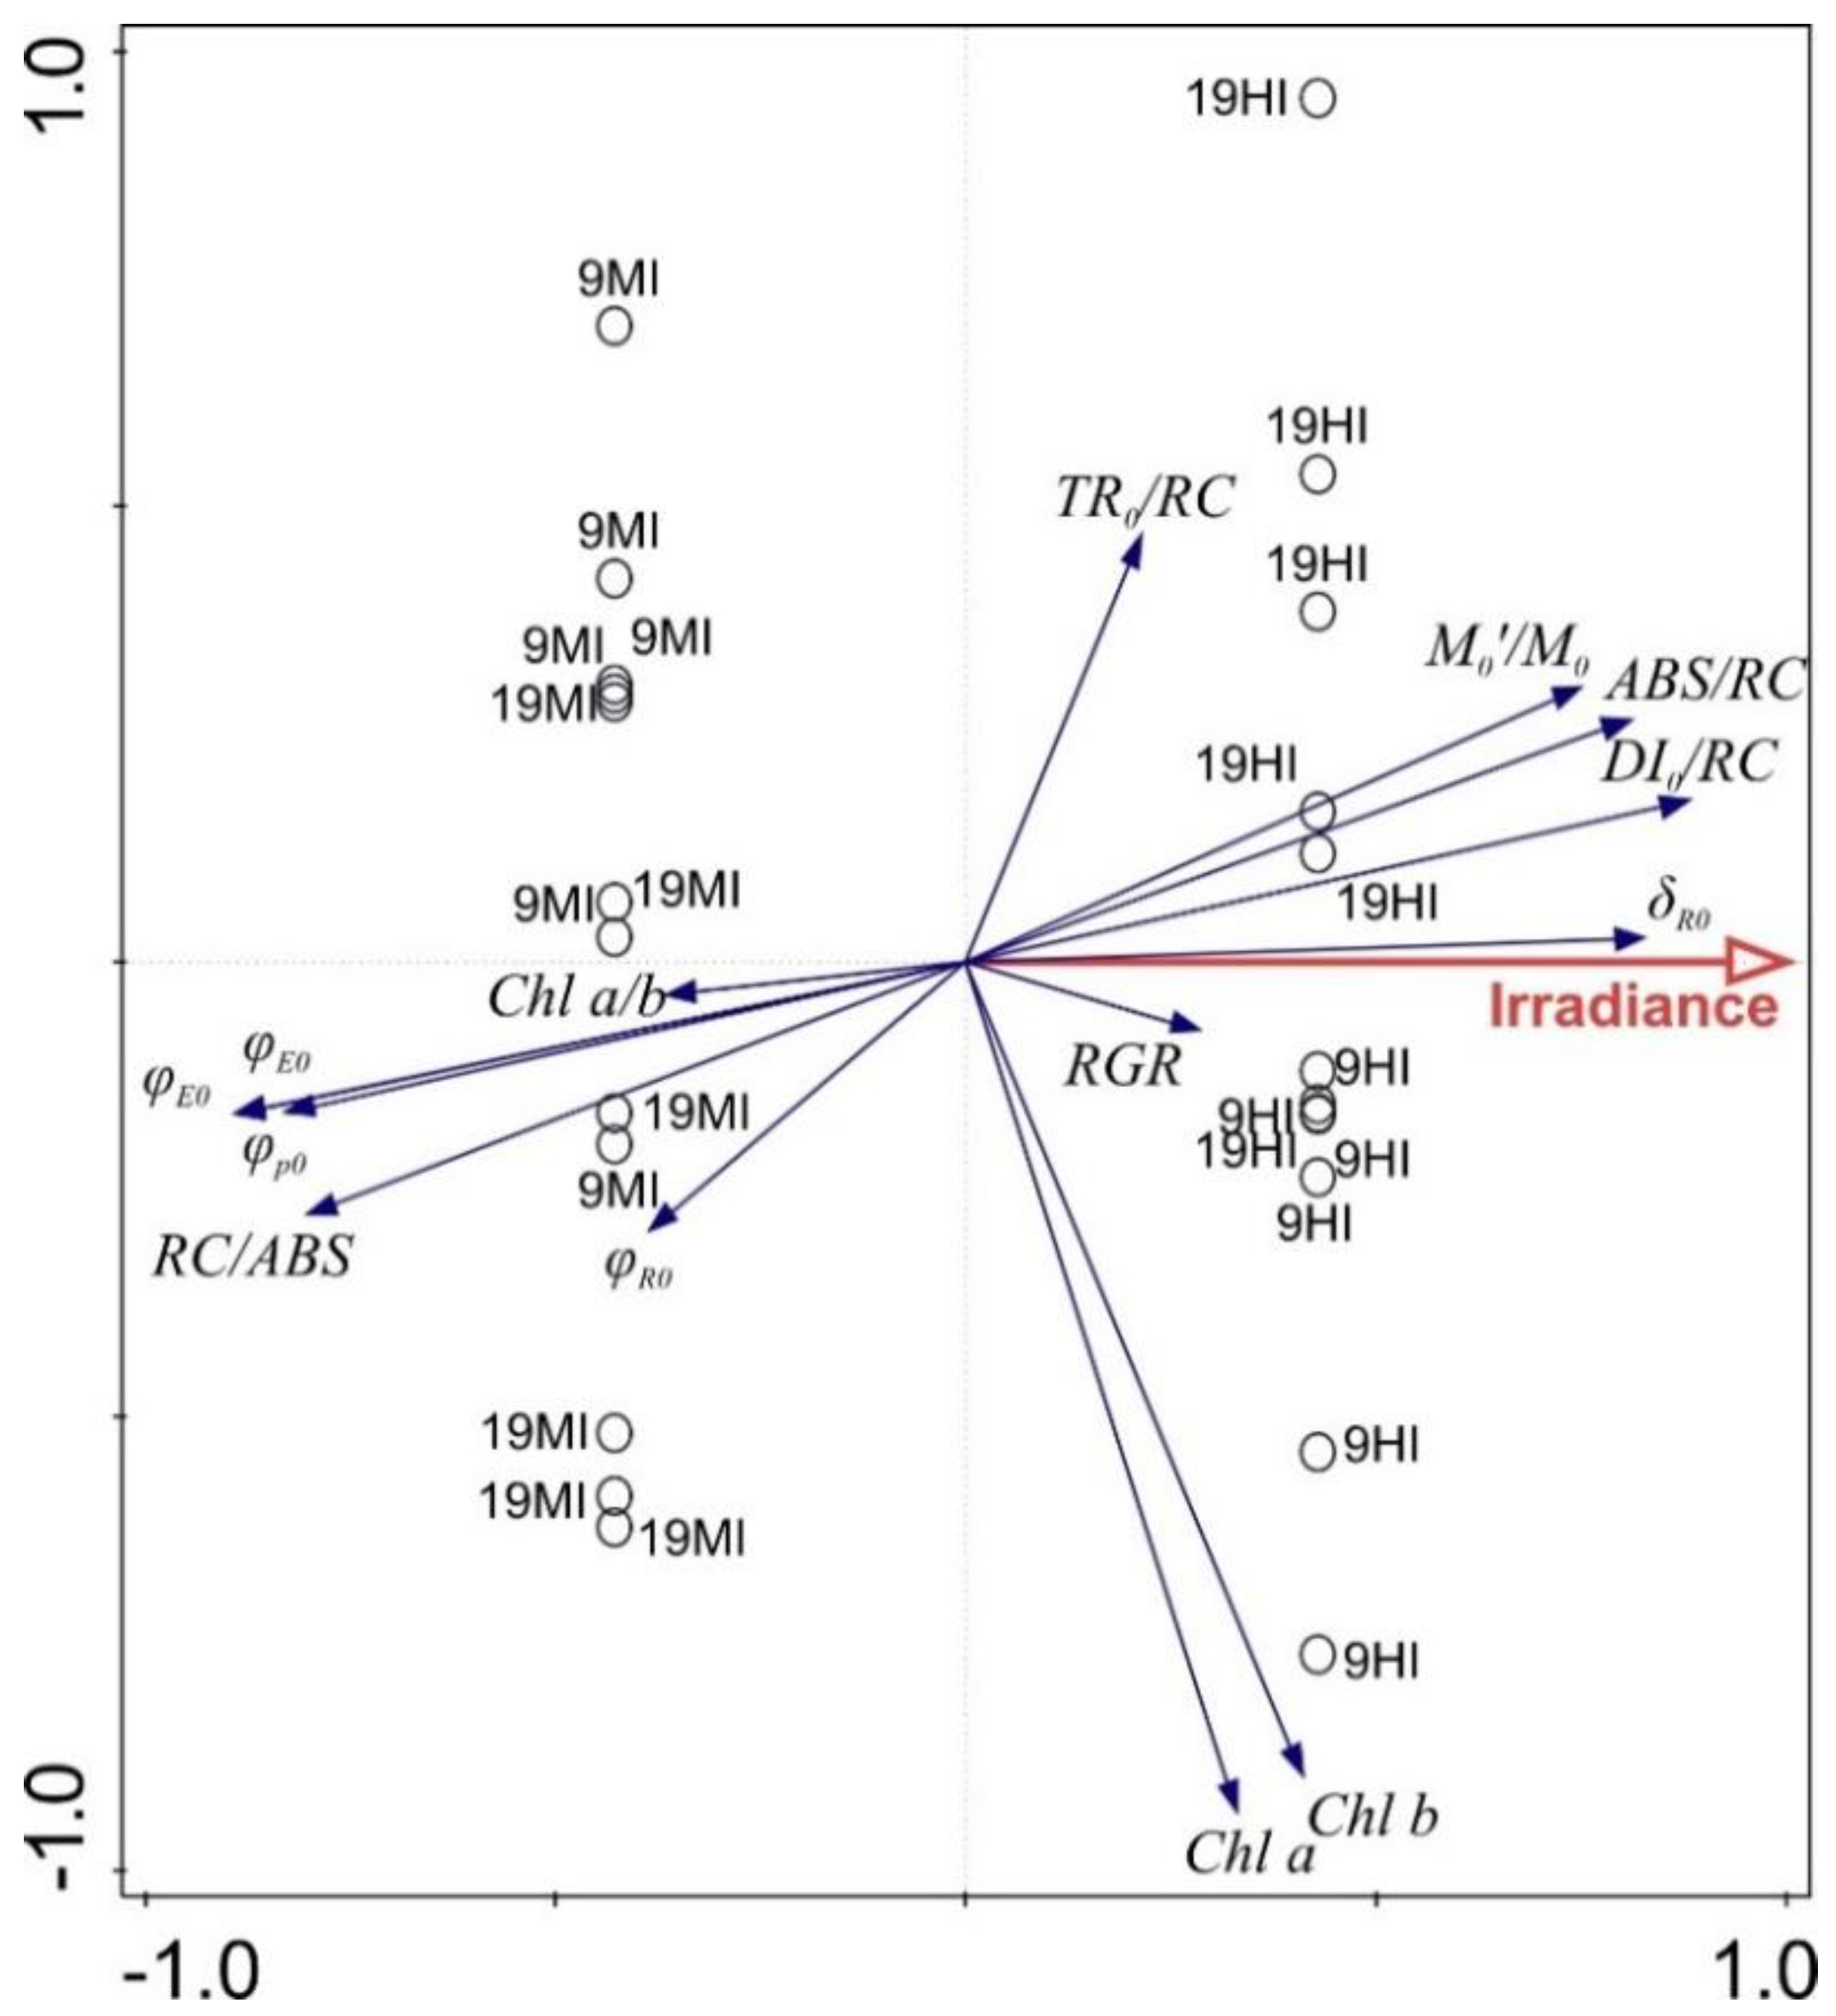
4.4. Redundancy Analysis (RDA)

Analysis of the correlations between the physiological parameters and stress factors (irradiance and salinity) was performed using an RDA forward selection model (Figure 7). According to the RDA results, irradiance was the only statistically significant factor that added 98.2% (Monte Carlo permutation test: pseudo F = 17.4, p = 0.001) to the explanatory power. The first axis accounted for 44.2% of the variation (Monte Carlo permutation test: F = 0.88) and was correlated with the irradiance, while the second axis accounted for 0.38% of the variation. The third axis accounted for 9.2% of the variation, while the fourth axis accounted for 3.9% of the total variation. While DI0/RC, ABS/RC, δR0 and M0’/M0 were positively correlated with Axis 1, ψE0, φE0, φP0, and RC/ABS were negatively correlated (Table 2). The experimental points were distributed rather homogeneously on the PC1/PC2 plane, with PC1 to clearly separate low light from high light conditions. This indicates that the irradiance was by far the most important factor affecting the studied physiological parameters of S. pectinata.

5. Discussion

5.1. Irradiance Effects

The irradiance significantly affected the photosynthetic performance from the two factors tested, but not the chlorophyll content and RGR of S. pectinata (Figure 7). Acclimation of plants to HI includes regulation of (a) the number of the reaction centers and the size of their light-harvesting antennae, (b) the photosynthetic electron transport chain by dissipation of the excess energy to heat, and (c) the stoichiometry of photosynthetic components such as chlorophylls [46,47,48].
Under HI conditions (C3, C4), the density of active RCs (RC/ABS) per PSII, i.e., the number of QA-reducing RCs per PSII antenna Chl, as a result of partial inactivity of RCs [49], decreased. This result indicates that some active RCs were converted into heat sinks, enhancing the energy dissipation, as also indicated by DI0/RC. DI0/RC represents the total dissipation of untrapped excitation energy from all RCs concerning the number of active RCs [35]. As the number of inactive centers under HI increased (Figure 2B), the DI0/RC ratio also increased (Figure 2D) because the inactive centers could not trap the photon, so the number of untrapped photons increased. Thus, the heat dissipation of excessive excitation energy slowed the overreduction of the photosynthetic electron transfer chain and minimized the potential photooxidative damage. On the other hand, an increase in the absorbance flux per reaction center (ABS/RC) value, as a measure for the average PSII antennae size [49], indicated overloading of PSII RC with electrons [38]. Although, in general, a smaller photosystems antenna size is reported under high light [50], we speculate that this is related to a Chl content increase, at least under the moderate salinity condition (C3).
HI affected negatively the parameters related to yields (φP0, φE0, and φR0) and efficiency/probability (ψE0) (p < 0.01), indicating that photoinhibition on PSII activity occurred of S. pectinata that considered as a positive acclimation for the downregulation of photosynthetic excitation pressure [51,52]. HI was also observed to reduce the maximum quantum yield in other plants [53,54]. Hu et al. [26] also showed that HI induced the decrease in effective quantum yield of PSII in S. pectinata. In agreement, TR0/RC represents the maximal rate by which an exciton is trapped by the RC, resulting in the reduction of QA− [55], which remained unaffected with all the treatments (Figure 2A). These results confirm that S. pectinata seemed to exhibit a photo acclimation rather than the photodamage οf the reaction center complexes when exposed to HI.
Among the numerous biophysical parameters derived by the JIP-test, φR0 is theoretically related to the energy supply from PSI towards the Calvin cycle, which is by definition the quantum yield of this supply. Indeed, there was a weak correlation φR0 with RGR (Table 2, RDA axis 4th). However, the actual energy supply to the Calvin cycle is affected by several other factors in addition to φR0, and RGR does not depend only on the activity of the Calvin cycle. Thus, in this study, HI did not impair the RGR. As a result, the plants could relocate resources to compensate for any potential costs associated with photoinhibition, repair of photosystem II, and processes of high-light acclimation.
On the other hand, δR0 increased when S. pectinata was exposed to HI, suggesting an improvement in the efficiency of electron transport, and therefore, energy, from plastoquinol (PQH2) via cytochrome b6/f to the PSI end electron acceptors (plastocyanin, ferredoxin) [56]. Thus, overexcitation energy pressure in PSII can be alleviated despite not increasing the sum of energy flux into PSI acceptors. Indeed, δR0 values increased during the first steps of stress, and only severe stress caused depletion of the efficiency of electron transport up to end electron acceptors of PSI [57]. The result was consistent with those in the stems of Hexinia polydichotoma. It suggests that the electron transport pattern related to PSI can play an important role in the photoprotection of PSII in adverse conditions [58].
Acclimation to HI was also expressed by a decrease in the energetic connectivity of PSII photosynthetic units compared to moderate irradiance treated samples (C1, C2). It is worth remembering that, in separate units, the initial fluorescence rise is exponential and that the bigger the degree of connectivity, the more the curves deviate towards sigmoidal [35]. Though none of the kinetics in the present study appear sigmoidal, the deviation from exponential could not be excluded, and it was evaluated by comparing M0’ with M0 (see Table 1) since the higher is their ratio, the more towards the exponential curve is the fluorescence rise.

5.2. Interactive Effects between Irradiance and Salinity

The chlorophyll content is associated with acclimation to different irradiance levels. HI or sun-grown plants contain lower chlorophyll than low light-grown or shade plants, which is considered a long-term regulation mechanism that controls light absorption capacity [59]. The results reveal that Chl a and Chl b content in S. pectinata increased significantly (p < 0.01) under HI and low salinity (Figure 5, Table S2), inconsistent with the general trend. Hu et al. [26] and Pilon and Santamaría [1] showed that the total chlorophyll concentration of S. pectinata was higher at low irradiance, which resulted in higher photosynthetic performance. Obviously, the HI condition used in this study was not too high to make the plants unable to produce more chlorophyll. This result is in line with a previous study focusing on Zostera marina (L) responses to light stress applied within controlled laboratory conditions [60]. Hu et al. [26] also noticed that HS and HI reduced (p < 0.001) the Chl a content in S. pectinata, in agreement with the results of this study, where Chl a content at HI and HS was lower (p < 0.01) than HI and MS.
The Chl a/b ratio indicates the degree of sun/shade acclimation and the structure of the photosynthetic apparatus to improve light capture [61,62]. Chl a/b ratio decreases under low irradiance conditions because the plants develop bigger light-harvesting complexes (LHCs). Both Chl a and Chl b are found in LHCs, yet only Chl a is found in the reaction centers. As a result, bigger LHCs as a response to low light levels lead to increments of both Chl a and Chl b; still, the overall Chl a/b ratio drops as there is no increase in the number of Chl a molecules forming the reaction centers of the photosystems. This pattern was not observed in our study, where the Chl a/b ratio remained constant under all treatments, as in the studies of [38,63] regarding the species of Lemna. Accordingly, the dissipation of energy became extremely important, reducing the risk of photoinhibition (see above). In any case, plants had a light-harvesting antenna size (mean Chl a/b ratios < 6.5) not susceptible to HI [64]. The absence of significant changes in the Chl a/b ratio under irradiance stress also revealed that the irradiance levels were adequate for the plant’s growth throughout the experiment [65]. It is well-known that under stressful conditions, the plant may reallocate resources toward increased growth or alterations in morphology at the expense of defensive compounds and reproductive structures [41].

5.3. Interactive Effects with Time

Photo-acclimation corresponds to different processes involving many cellular components and occurring over a broad range of time scales, from seconds to days. This study focused on long-term photo acclimation (days) monitored by changes in the number and size of the reaction centers and the photosynthetic electron transport chain. Changes within the eight days of the experiment duration were noticed in all measured parameters but statistical changes in the parameters related to yields (φP0, φE0, and φR0) and in DI0/RC. Besides regulation of irradiance as discussed above, φP0 and DI0/RC acclimation is also affected by salinity, indicating that the photosynthetic apparatus could cope with salinity stress, and the plant was tolerant within the range from 9 to 19. The great range of tolerance of S. pectinata to salinity (9–18) has been reported by other studies [3,23,24]. Hu et al. [26] also reported that PSII units and electron flow were not influenced under salinity stress.

5.4. Stuckenia pectinata in Vistonis Lake

Ruppia maritima L. is a submerged macrophyte that survives in brackish estuarine and coastal lagoon waters near Vistonis Lake. Following the scenario of the replacement of S. pectinata by R. maritima due to sea level and salinity rise, it seems the lower biomass which would be available to the overwintering waterfowl at Vistonis will impact the structure and function of higher trophic levels [66]. However, based on this study, that is a not near-future scenario as the Vistonis S. pectinata clone tolerated salinity of at least up to 19 and can occasionally survive salinity increases up to 34. High tolerance was also confirmed by the RGR but evidenced a tendency of a decrease at a salinity of 19 (Figure 6). This is a topic that should be further investigated in the future through long-term experiments.

6. Conclusions

This study investigates the correlations among parameters representing processes of two different biological levels, from subcellular (photosynthetic) to organismal (growth). It is now clear that the submerged macrophyte S. pectinata had great acclimation potential to present and future stressful irradiance and salinity conditions in hypertrophic Vistonis Lake. Such physiology might also be of great importance for other environmental disturbances, such as heavy metals. However, further research on the role of other abiotic factors, such as temperature and different nutrient forms, is needed to better determine how climate change will influence S. pectinata’s abundance. In addition, other species aspects, such as morphology and reproduction, should be further investigated in the future in long-term experiments.

Supplementary Materials

The following are available online at https://www.mdpi.com/article/10.3390/w13121706/s1. Table S1. Two-way repeated measures of variance of JIP-test in Stuckenia pectinata. Table S2. Duncan’s post hoc test for RC/ABS in Stuckenia pectinata. Table S3. Duncan’s post hoc test for ABS/RC in Stuckenia pectinata. Table S4. Duncan’s post hoc test for DI0/RC in Stuckenia pectinata. Table S5. Duncan’s post hoc test for φp0 in Stuckenia pectinata. Table S6. Duncan’s post hoc test for φE0 in Stuckenia pectinata. Table S7. Duncan’s post hoc test for φR0 in Stuckenia pectinata. Table S8. Duncan’s post hoc test for ψE0 in Stuckenia pectinata. Table S9. Duncan’s post hoc test for δR0 in Stuckenia pectinata. Table S10. Duncan’s post hoc test for Μ0’/Μ0 in Stuckenia pectinata. Table S11. Two-way measures of variance of chlorophyll content and ratio in Stuckenia pectinata. Table S12. Duncan’s post hoc test for Chl α in Stuckenia pectinata. Table S13. Duncan’s post hoc test for Chl b in Stuckenia pectinata. Table S14. Two-way measures of variance of RGR in Stuckenia pectinata.

Author Contributions

This work has been conducted at the Fisheries Research Institute (ELGO DIMITRA) as a Master’s dissertation of L.M. at the University of Thessaly with supervisors A.E. and S.O., S.O. conceived and designed research, analyzed and interpreted data, wrote the article; L.M. conducted experiments, analyzed data and wrote the article; K.N. and A.P. pre-acclimated the material and helped in the experiments; A.E. contributed to the writing and review of the manuscript. All authors have read and agreed to the published version of the manuscript.

Funding

This research received no external funding.

Institutional Review Board Statement

Not applicable.

Informed Consent Statement

Not applicable.

Acknowledgments

We thank Merope Tsimilli-Michael for her clarifications concerning the concept of the JIP-test and the interpretation of the derived parameters.

Conflicts of Interest

The authors declare no conflict of interest.

References

  1. Pilon, J.; Santamaría, L. Clonal variation in morphological and physiological responses to irradiance and photoperiod for the aquatic angiosperm Potamogeton pectinatus. J. Ecol. 2002, 90, 859–870. [Google Scholar] [CrossRef]
  2. Scheffer, M.; de Redelijkheid, M.R.; Noppert, F. Distribution and dynamics of submerged vegetation in a chain of shallow eutrophic lakes. Aquat. Bot. 1992, 42, 199–216. [Google Scholar] [CrossRef]
  3. Borgnis, E.; Boyer, K.E. Salinity tolerance and competition drive distributions of native and invasive submerged aquatic vegetation in the upper San Francisco Estuary. Estuaries Coasts 2016, 39, 707–717. [Google Scholar] [CrossRef]
  4. Jeppesen, E.; Søndergaard, M.; Søndergaard, M.; Kirsten, C. Alternative Stable states. In The Structering Role of Submerged Macrophytes in Lakes; Jeppesen, E., Søndergaard, M., Christoffersen, K., Eds.; Springer: Berlin/Heidelberg, Germany, 1998; p. 427. [Google Scholar]
  5. Gao, Y.N.; Dong, J.; Fu, Q.Q.; Wang, Y.P.; Chen, C.; Li, J.H.; Li, R.; Zhou, C.J. Allelopathic effects of submerged macrophytes on phytoplankton. Allelopath. J. 2017, 40, 1–22. [Google Scholar] [CrossRef] [Green Version]
  6. Chen, J.; Zhang, H.; Han, Z.; Ye, J.; Liu, Z. The influence of aquatic macrophytes on Microcystis aeruginosa growth. Ecol. Eng. 2012, 42, 130–133. [Google Scholar] [CrossRef]
  7. Engelhardt, K.A.M.; Ritchie, M.E. Effects of macrophyte species richness on wetland ecosystem functioning and services. Nature 2001, 411, 687–689. [Google Scholar] [CrossRef]
  8. Hilt, S.; Brothers, S.; Jeppesen, E.; Veraart, A.J.; Kosten, S. Translating regime shifts in shallow lakes into changes in ecosystem functions and services. Bioscience 2017, 67, 928–936. [Google Scholar] [CrossRef]
  9. Albertoni, E.F.; Palma-Silva, C.; Trindade, C.R.T.; Furlanetto, L.M. Field evidence of the influence of aquatic macrophytes on water quality in a shallow eutrophic lake over a 13-year period. Acta Limnol. Bras. 2014, 26, 176–185. [Google Scholar] [CrossRef] [Green Version]
  10. Bakker, E.S.; Van Donk, E.; Declerck, S.A.J.; Helmsing, N.R.; Hidding, B.; Nolet, B.A. Effect of macrophyte community composition and nutrient enrichment on plant biomass and algal blooms. Basic Appl. Ecol. 2010, 11, 432–439. [Google Scholar] [CrossRef]
  11. Hidding, B.; Brederveld, R.J.; Nolet, B.A. How a bottom-dweller beats the canopy: Inhibition of an aquatic weed (Potamogeton pectinatus) by macroalgae (Chara spp.). Freshw. Biol. 2010, 55, 1758–1768. [Google Scholar] [CrossRef]
  12. Triest, L.; Tran Thi, V.; Le Thi, D.; Sierens, T.; van Geert, A. Genetic differentiation of submerged plant populations and taxa between habitats. Hydrobiologia 2010, 656, 15–27. [Google Scholar] [CrossRef]
  13. Abbasi, S.; Afsharzadeh, S.; Saeidi, H.; Triest, L. Strong genetic differentiation of submerged plant populations across mountain ranges: Evidence from Potamogeton pectinatus in Iran. PLoS ONE 2016, 11, 1–20. [Google Scholar] [CrossRef] [PubMed] [Green Version]
  14. Ganie, A.H.; Reshi, Z.A.; Wafai, B.A. Reproductive ecology of Potamogeton pectinatus L. (= Stuckenia pectinata (L.) Börner) in relation to its spread and abundance in freshwater ecosystems of the Kashmir Valley, India. Trop. Ecol. 2016, 57, 787–803. [Google Scholar]
  15. Pilon, J.; Santamaría, J. Seasonal acclimation in the photosynthetic and respiratory temperature responses of three submerged freshwater macrophyte species. New Phytol. 2001, 151, 659–670. [Google Scholar] [CrossRef]
  16. Sandsten, H.; Beklioglu, M.; Ince, O. Effects of waterfowl, large fish and periphyton on the spring growth of Potamogeton pectinatus L. in Lake Mogan, Turkey. Hydrobiologia 2005, 537, 239–248. [Google Scholar] [CrossRef]
  17. Abbasi, S.; Afsharzadeh, S.; Saeidi, H. Genetic diversity of Potamogeton pectinatus L. in Iran as revealed by ISSR markers. Acta Bot. Croat. 2017, 76, 177–182. [Google Scholar] [CrossRef] [Green Version]
  18. Hootsmans, M.J.M.; Drovandi, A.A.; Soto Perez, N.; Wiegman, F. Photosynthetic plasticity in Potamogeton pectinatus L. from Argentina: Strategies to survive adverse light conditions. Hydrobiologia 1996, 340, 1–5. [Google Scholar] [CrossRef]
  19. Shabnam, N.; Sharmila, P.; Sharma, A.; Strasser, R.J.; Govindjee; Pardha-Saradhi, P. Mitochondrial electron transport protects floating leaves of long leaf pondweed (Potamogeton nodosus Poir) against photoinhibition: Comparison with submerged leaves. Photosynth. Res. 2015, 125, 305–319. [Google Scholar] [CrossRef] [PubMed]
  20. Poikane, S.; Portielje, R.; Denys, L.; Elferts, D.; Kelly, M.; Kolada, A.; Mäemets, H.; Phillips, G.; Søndergaard, M.; Willby, N.; et al. Macrophyte assessment in European lakes: Diverse approaches but convergent views of ‘good’ ecological status. Ecol. Indic. 2018, 94, 185–197. [Google Scholar] [CrossRef]
  21. Kondo, K.; Kawabata, H.; Ueda, S.; Hasegawa, H.; Inaba, J.; Mitamura, O.; Seike, Y.; Ohmomo, Y. Distribution of aquatic plants and absorption of radionuclides by plants through the leaf surface in brackish Lake Obuchi, Japan, bordered by nuclear fuel cycle facilities. J. Radioanal. Nucl. Chem. 2003, 257, 305–312. [Google Scholar] [CrossRef]
  22. Kantrud, H.A. Sago pondweed (Potamogeton pectinatus L.): A literature review. Resour. Publ. US Fish Wildl. Serv. 1990, 176, 23. [Google Scholar]
  23. Rodríguez-Gallego, L.; Sabaj, V.; Masciadri, S.; Kruk, C.; Arocena, R.; Conde, D. Salinity as a major driver for submerged aquatic vegetation in coastal lagoons: A Multi-Year Analysis in the Subtropical Laguna de Rocha. Estuaries Coasts 2014, 38, 451–465. [Google Scholar] [CrossRef]
  24. Dhir, B. Status of aquatic macrophytes in changing climate: A perspective. J. Environ. Sci. Technol. 2015, 8, 139–148. [Google Scholar] [CrossRef]
  25. van Wijck, C.; Grillas, P.; de Groot, C.J.; Ham, L.T. A comparison between the biomass production of Potamogeton pectinatus L. and Myriophyllum spicatum L. in the Camargue (southern France) in relation to salinity and sediment characteristics. Vegetatio 1994, 113, 171–180. [Google Scholar] [CrossRef]
  26. Hu, Q.; Turnbull, M.; Hawes, I. Salinity restricts light conversion efficiency during photo-acclimation to high irradiance in Stuckenia pectinata. Environ. Exp. Bot. 2019, 165, 83–91. [Google Scholar] [CrossRef]
  27. Moustaka-Gouni, M.; Hiskia, A.; Genitsaris, S.; Katsiapi, M.; Manolidi, K.; Zervou, S.K.; Christophoridis, C.; Triantis, T.M.; Kaloudis, T.; Orfanidis, S. First report of Aphanizomenon favaloroi occurrence in Europe associated with saxitoxins and a massive fish kill in Lake Vistonis, Greece. Mar. Freshw. Res. 2017, 68, 793–800. [Google Scholar] [CrossRef]
  28. Vardaka, E.; Moustaka-Gouni, M.; Cook, C.M.; Lanaras, T. Cyanobacterial blooms and water quality in Greek waterbodies. J. Appl. Phycol. 2005, 17, 391–401. [Google Scholar] [CrossRef]
  29. Lüning, K. Seaweeds: Their Environment, Biogeography, and Ecophysiology; Wiley: Hoboken, NJ, USA, 1990. [Google Scholar]
  30. Markou, D.A.; Sylaios, G.K.; Tsihrintzis, V.A.; Gikas, G.D.; Haralambidou, K. Water quality of Vistonis Lagoon, Northern Greece: Seasonal variation and impact of bottom sediments. Desalination 2007, 210, 83–97. [Google Scholar] [CrossRef]
  31. Dolbeth, M.; Crespo, D.; Leston, S.; Solan, M. Realistic scenarios of environmental disturbance lead to functionally important changes in benthic species-environment interactions. Mar. Environ. Res. 2019, 150, 104770. [Google Scholar] [CrossRef]
  32. Maxwell, K.; Johnson, G.N. Chlorophyll fluorescence—A practical guide Kate. J. Exp. Bot. 2000, 51, 659–668. [Google Scholar] [CrossRef]
  33. Strasser, R.J.; Tsimilli-Michael, M.; Dangre, D.; Rai, M. Biophysical phenomics reveals functional building blocks of plants systems biology: A case study for the evaluation of the impact of mycorrhization with Piriformospora indica. Adv. Tech. Soil Microbiol. 2007, 11, 319–341. [Google Scholar] [CrossRef]
  34. Strasser, R.J.; Srivastava, A.; Tsimilli-Michael, M. The fluorescence transient as a tool to characterize and screen photosynthetic samples. In Probing Photosynthesis: Mechanism, Regulation & Adaptation; CRC: Boca Raton, FL, USA, 2000; pp. 443–480. [Google Scholar]
  35. Tsimilli-Michael, M. Revisiting JIP-test: An educative review on concepts, assumptions, approximations, definitions and terminology. Photosynthetica 2020, 58, 275–292. [Google Scholar] [CrossRef] [Green Version]
  36. Wang, G.; Chen, L.; Hao, Z.; Li, X.; Liu, Y. Effects of salinity stress on the photosynthesis of Wolffia arrhiza as probed by the OJIP test. Fresenius Environ. Bull. 2011, 20, 432–438. [Google Scholar]
  37. Xu, C.; Wang, M.T.; Yang, Z.Q.; Zheng, Q.T. Low temperature and low irradiation induced irreversible damage of strawberry seedlings. Photosynthetica 2020, 58, 156–164. [Google Scholar] [CrossRef]
  38. Lepeduš, H.; Vidaković-Cifrek, Ž.; Šebalj, I.; Antunović Dunić, J.; Cesar, V. Effects of low and high irradiation levels on growth and PSII efficiency in Lemna minor L. Acta Bot. Croat. 2020, 79, 185–192. [Google Scholar] [CrossRef]
  39. Parihar, P.; Singh, S.; Singh, R.; Singh, V.P.; Prasad, S.M. Effect of salinity stress on plants and its tolerance strategies: A review. Environ. Sci. Pollut. Res. 2015, 22, 4056–4075. [Google Scholar] [CrossRef] [PubMed]
  40. Tuller, J.; Marquis, R.J.; Andrade, S.M.M.; Monteiro, A.B.; Faria, L.D.B. Trade-offs between growth, reproduction and defense in response to resource availability manipulations. PLoS ONE 2018, 13, 1–12. [Google Scholar] [CrossRef] [Green Version]
  41. Gleeson, S.K.; Tilman, D. Plant allocation and the multiple limitation hypothesis. Am. Nat. 1992, 139, 1322–1343. [Google Scholar] [CrossRef]
  42. Schubert, N.; Freitas, C.; Silva, A.; Costa, M.M.; Barrote, I.; Horta, P.A.; Rodrigues, A.C.; Santos, R.; Silva, J. Photoacclimation strategies in northeastern Atlantic seagrasses: Integrating responses across plant organizational levels. Sci. Rep. 2018, 8, 1–14. [Google Scholar] [CrossRef]
  43. Tsimilli-Michael, M.; Strasser, R.J. In vivo assessment of stress impact on plant’s vitality: Applications in detecting and evaluating the beneficial role of mycorrhization on host plants. Mycorrhiza 2008, 679–703. [Google Scholar] [CrossRef]
  44. Granger, S.; Lizumi, H. Water quality measurement methods for seagrass habitat. Glob. Seagrass Res. Methods 2001, 393–406. [Google Scholar] [CrossRef]
  45. Underwood, A.J. Experiments in Ecology; Cambridge University Press: Cambridge, UK, 1996. [Google Scholar]
  46. Owens, T.G.; Falkowski, P.G.; Whitledge, T.E. Diel periodicity in cellular chlorophyll content in marine diatoms. Mar. Biol. 1980, 59, 71–77. [Google Scholar] [CrossRef]
  47. Ruban, A.V.; Berera, R.; Ilioaia, C.; Van Stokkum, I.H.M.; Kennis, J.T.M.; Pascal, A.A.; Van Amerongen, H.; Robert, B.; Horton, P.; Van Grondelle, R. Identification of a mechanism of photoprotective energy dissipation in higher plants. Nature 2007, 450, 575–578. [Google Scholar] [CrossRef] [PubMed]
  48. Dietz, K.J. Efficient high light acclimation involves rapid processes at multiple mechanistic levels. J. Exp. Bot. 2015, 66, 2401–2414. [Google Scholar] [CrossRef] [Green Version]
  49. Stirbet, A. Govindjee On the relation between the Kautsky effect (chlorophyll a fluorescence induction) and Photosystem II: Basics and applications of the OJIP fluorescence transient. J. Photochem. Photobiol. B Biol. 2011, 104, 236–257. [Google Scholar] [CrossRef] [PubMed]
  50. Wientjes, E.; Van Amerongen, H.; Croce, R. LHCII is an antenna of both photosystems after long-term acclimation. Biochim. Biophys. Acta Bioenerg. 2013, 1827, 420–426. [Google Scholar] [CrossRef] [PubMed] [Green Version]
  51. Raven, J.A. The cost of photoinhibition. Physiol. Plant. 2011, 142, 87–104. [Google Scholar] [CrossRef] [PubMed]
  52. Jiang, H.X.; Chen, L.S.; Zheng, J.G.; Han, S.; Tang, N.; Smith, B.R. Aluminum-induced effects on Photosystem II photochemistry in Citrus leaves assessed by the chlorophyll a fluorescence transient. Tree Physiol. 2008, 28, 1863–1871. [Google Scholar] [CrossRef]
  53. Broetto, F.; Monteiro Duarte, H.; Lüttge, U. Responses of chlorophyll fluorescence parameters of the facultative halophyte and C3-CAM intermediate species Mesembryanthemum crystallinum to salinity and high irradiance stress. J. Plant Physiol. 2007, 164, 904–912. [Google Scholar] [CrossRef]
  54. Hazrati, S.; Tahmasebi-Sarvestani, Z.; Modarres-Sanavy, S.A.M.; Mokhtassi-Bidgoli, A.; Nicola, S. Effects of water stress and light intensity on chlorophyll fluorescence parameters and pigments of Aloe vera L. Plant Physiol. Biochem. 2016, 106, 141–148. [Google Scholar] [CrossRef]
  55. Stirbet, A.D.; Strasser, R.J. Numerical simulation of the in vivo fluorescence in plants. Math. Comput. Simul. 1996, 42, 245–253. [Google Scholar] [CrossRef]
  56. Yan, K.; Chen, P.; Shao, H.; Shao, C.; Zhao, S.; Brestic, M. Dissection of photosynthetic electron transport process in Sweet Sorghum under Heat Stress. PLoS ONE 2013, 8, 1–6. [Google Scholar] [CrossRef] [Green Version]
  57. Goltsev, V.; Zaharieva, I.; Chernev, P.; Kouzmanova, M.; Kalaji, H.M.; Yordanov, I.; Krasteva, V.; Alexandrov, V.; Stefanov, D.; Allakhverdiev, S.I.; et al. Drought-induced modifications of photosynthetic electron transport in intact leaves: Analysis and use of neural networks as a tool for a rapid non-invasive estimation. Biochim. Biophys. Acta Bioenerg. 2012, 1817, 1490–1498. [Google Scholar] [CrossRef] [PubMed] [Green Version]
  58. Li, L.; Zhou, Z.; Liang, J.; Lv, R. In vivo evaluation of the high-irradiance effects on PSII activity in photosynthetic stems of Hexinia polydichotoma. Photosynthetica 2015, 53, 621–624. [Google Scholar] [CrossRef]
  59. Ruban, A.V. Plants in light. Commun. Integr. Biol. 2009, 2, 50–55. [Google Scholar] [CrossRef]
  60. Bertelli, C.M.; Unsworth, R.K.F. Light stress responses by the eelgrass, Zostera marina (L). Front. Environ. Sci. 2018, 6, 1–13. [Google Scholar] [CrossRef]
  61. Esteban, R.; Barrutia, O.; Artetxe, U.; Fernández-Marín, B.; Hernández, A.; García-Plazaola, J.I. Internal and external factors affecting photosynthetic pigment composition in plants: A meta-analytical approach. New Phytol. 2015, 206, 268–280. [Google Scholar] [CrossRef]
  62. Collier, C.J.; Waycott, M.; Ospina, A.G. Responses of four Indo-West Pacific seagrass species to shading. Mar. Pollut. Bull. 2012, 65, 342–354. [Google Scholar] [CrossRef] [PubMed]
  63. Paolacci, S.; Harrison, S.; Jansen, M.A.K. The invasive duckweed Lemna minuta Kunth displays a different light utilisation strategy than native Lemna minor Linnaeus. Aquat. Bot. 2018, 146, 8–14. [Google Scholar] [CrossRef]
  64. Wu, G.; Ma, L.; Sayre, R.T.; Lee, C.H. Identification of the optimal light harvesting antenna size for high-light stress mitigation in plants. Front. Plant Sci. 2020, 11, 1–11. [Google Scholar] [CrossRef]
  65. Zhu, S.; Qin, L.; Feng, P.; Shang, C.; Wang, Z.; Yuan, Z. Treatment of low C/N ratio wastewater and biomass production using co-culture of Chlorella vulgaris and activated sludge in a batch photobioreactor. Bioresour. Technol. 2019, 274, 313–320. [Google Scholar] [CrossRef] [PubMed]
  66. Casagranda, C.; Boudouresque, C.F. Biomass of Ruppia cirrhosa and Potamogeton pectinatus in a Mediterranean brackish lagoon, Lake Ichkeul, Tunisia. Fundam. Appl. Limnol. 2007, 168, 243–255. [Google Scholar] [CrossRef] [Green Version]
Figure 1. OJIP fluorescence transients expressed as Ft/F0 = f(t), induced by strong red actinic light (3.000 μmol photons m−2 s−1; peak at 650 nm) and measured with a plant efficiency analyzer (Handy PEA; Hansatech Instruments Ltd., Norfolk, UK) in S. pectinata leaves and dark-adapted for 30 min. Induction curves plotted on logarithmic scale from 20 μs tο 1 s (JIP-time). Experimental conditions C1: salinity 9 and irradiance 100 μmol photons m−2 s−1, C2: salinity 19 and irradiance 100 μmol photons m−2 s−1, C3: salinity 9 and irradiance 400 μmol photons m−2 s−1, C4: salinity 19 and irradiance 400 μmol photons m−2 s−1. Days: Day 1 (D1), Day 5 (D5), Day 8 (D8).
Water 13 01706 g001
Figure 2. Effects of salinity and irradiance on (A) TR0/RC, (B) RC/ABS, (C) ABS/RC, and (D) DI0/RC. Values are means ± standard error, n = 6. Statistical differences from the post hoc test (p < 0.01) are represented using different Latin letters. For further information see Table 1.
Water 13 01706 g002
Figure 3. Effects of salinity and irradiance on (A) φP0, (B) φE0, and (C) φR0. Values are means ± standard error, n = 6. * = statistically significant interaction. For further information see Table 1 and Figure 2.
Water 13 01706 g003
Figure 4. Effects of salinity and irradiance on (A) ψE0, (B) δR0, and (C) M0’/M0. Values are means ± standard error, n = 6. For further information see Table 1 and Figure 2.
Water 13 01706 g004
Figure 5. Effects of salinity and irradiance on (A) Chlorophyll a, (B) Chlorophyll b, and (C) Chlorophyll a/b ratio. Values are means ± standard error and measured on the day 10th of the experiment, n = 6. Wb = wet biomass. For further information see Figure 2 and Figure 3.
Water 13 01706 g005
Figure 6. Effects of salinity and irradiance on relative growth rate (RGR). Values are means ± standard error, n = 6. For further information see Figure 2.
Water 13 01706 g006
Figure 7. Triplot from the redundancy analysis (RDA) that shows the relationships between the JIP-test parameters, chlorophyll content and relative growth rate (RGR) parameters of Stuckenia pectinata. The length of the arrows indicates the strength of representation and contribution of each parameter to the PC axes. MI = moderate irradiance, HI = high irradiance, 9 and 19 correspond to salinity values. For further information, see Table 1 and Table 2. The first axis accounted for 44.2% of the variation, while the second axis accounted for 0.38%.
Water 13 01706 g007
Table 1. Glossary, definition of terms and formulae of the JIP-test used for the analysis of the Chl a fluorescence transients OJIP [35,43].
DATA EXTRACTED FROM THE RECORDED FLUORESCENCE TRANSIENT OJIP
Ft (or, simply, F)fluorescence at time t after onset of actinic illumination
F20μsminimal reliable recorded fluorescence, at 20 μs
F50μsfluorescence at 50 μs (for the calculation of the slopes)
F100μsfluorescence at 100 μs
F300μsfluorescence at 300 μs
FJ ≡ F2msfluorescence at the J-step (2 ms) of OJIP
FI ≡ F30msfluorescence at the I-step (30 ms) of OJIP
FPmaximal recorded fluorescence, at the peak P of OJIP
BASIC PARAMETERS CALCULATED FROM THE EXTRACTED DATA
F0 ≅ F20μsfluorescence when all PSII RCs are open (≅ to the minimal reliable recorded fluorescence)
FM (= FP)maximal fluorescence, when all PSII RCs are closed
(= FP when the actinic light intensity is above 500 [μmol(photon) m−2 s−1])
Vt ≡ (Ft − F0)/(FM − F0)relative variable fluorescence at time t
M0 and M0 ≡ [(ΔF/Δt)0]/(FM − F0)
approximated initial slopes (in ms−1) of the Vt = f(t) kinetics
M0 ≡ 4 × [( F300μs − F50μs)/(FM − F0)]/(Δt)0
M0 ≡ 20 × [( F100μs − F50μs)/(FM − F0)]/(Δt)0
with (Δt)0 = (300 − 50) μs = 0.25 ms
with (Δt)0 = (100 − 50) μs = 0.05 ms
BIOPHYSICAL PARAMETERS DERIVED FROM THE BASIC PARAMETERS BY THE JIP-TEST
Quantum yields and efficiencies/probabilities
φPt ≡ TRt/ABS = [1 − (Ft/FM)] = ΔFt/FMquantum yield for primary photochemistry, leading to QA reduction (i.e. trapped energy flux TR per absorption flux ABS), at any time t
φP0 ≡ TR0/ABS = [1 − (F0/FM)]maximum quantum yield for primary photochemistry
φE0 ≡ ET0/ABS = [1 − (F0/FM)] × (1 − VJ)quantum yield for electron transport (ET) further than QA
φR0 ≡ RE0/ABS = [1 − (F0/FM)] × (1 − VI)quantum yield for reduction of end electron acceptors (RE) at the PSI acceptor side
ψE0 ≡ ET0/TR0 = (1 − VJ)efficiency/probability that an electron moves further than QA
δR0 ≡ RE0/ET0 = (1 − VI)/(1 − VJ)efficiency/probability that an electron from the intersystem electron carriers is transferred to reduce end electron acceptors at the PSI acceptor side
Specific energy flux (per active, i.e., per QA-reducing PSII reaction centre - RC), in ms−1
TR0/RC = M0 × (1/VJ)trapped energy flux, per RC
DI0/RC = ABS/RC − TR0/RCspecific energy flux for dissipation per RC
Density of active RCs
RC/ABS = (TR0/ABS) × (TR0/RC)1RCs per PSII antenna Chl a
ABS/RC = M0 × (1/VJ) × (1/φP0)
absorption flux (exciting PSII antenna Chl a molecules) per RC (also used as a unit-less measure of PSII apparent antenna size)
Energetic connectivity of PSII units
M0/M0grouping or connectivity among PSII units (the higher is the ratio indicate the less of connectivity)
Table 2. Loading scores of JIP-test, chlorophyll content and relative growth rate (RGR) parameters in the redundancy analysis (RDA) in temperate and subtropical forests. The correlation coefficients (ρ) are shown in the matrix. For further information, see Table 1. Axis = RDA axis.
Axis 1Axis 2Axis 3Axis 4
φP0−0.829−0.165−0.5210.011
TR0/RC0.2140.4680.0250.220
DI0/RC0.8810.1770.4230.023
RC/ABS−0.803−0.279−0.471−0.052
ABS/RC0.8110.2660.4920.044
M0’/M00.7500.3010.3980.198
φR0−0.386−0.297−0.235−0.699
φE0−0.889−0.167−0.398−0.066
ψE0−0.892−0.168−0.334−0.101
δR00.8270.0260.350−0.345
Chl a0.331−0.9360.0420.021
Chl b0.410−0.8960.1350.026
Chl a/b−0.365−0.037−0.379−0.021
RGR0.285−0.0760.136−0.768
Publisher’s Note: MDPI stays neutral with regard to jurisdictional claims in published maps and institutional affiliations.

