
Potential Climate Change Impacts on Water Resources in Egypt
by
 , , and
Soha M. Mostafa
1 ,
,
Osama Wahed
2,
Walaa Y. El-Nashar
2,
Samia M. El-Marsafawy
3,
Martina Zeleňáková
4,* and
Hany F. Abd-Elhamid
2,5 1
Technical Office of General Administration of WR&I for El-Sharkia Governorate, Ministry of Water Resources and Irrigation, Zagazig 44519, Egypt
2
Department of Water and Water Structures Engineering, Faculty of Engineering, Zagazig University, Zagazig 44519, Egypt
3
Soils, Water & Environment Research Institute (SWERI), Agricultural Research Center (ARC), Giza 12112, Egypt
4
Institute of Environmental Engineering, Faculty of Civil Engineering, Technical University of Košice, 04200 Košice, Slovakia
5
Center for Research and Innovation in Construction, Faculty of Civil Engineering, Technical University of Košice, 04200 Košice, Slovakia
*
Author to whom correspondence should be addressed.
Water 2021, 13(12), 1715; https://doi.org/10.3390/w13121715
Submission received: 6 May 2021
/
Revised: 15 June 2021
/
Accepted: 17 June 2021
/
Published: 21 June 2021
(This article belongs to the Special Issue Assessment and Management of Flood Risk in Urban Areas)
Abstract
:This paper presents a comprehensive study to assess the impact of climate change on Egypt’s water resources, focusing on irrigation water for agricultural crops, considering that the agriculture sector is the largest consumer of water in Egypt. The study aims to estimate future climate conditions using general circulation models (GCMs), to assess the impact of climate change and temperature increase on water demands for irrigation using the CROPWAT 8 model, and to determine the suitable irrigation type to adapt with future climate change. A case study was selected in the Middle part of Egypt. The study area includes Giza, Bani-Sweif, Al-Fayoum, and Minya governorates. The irrigation water requirements for major crops under current weather conditions and future climatic changes were estimated. Under the conditions of the four selected models CCSM-30, GFDLCM20, GFDLCM21, and GISS-EH, as well as the chosen scenario of A1BAIM, climate model (MAGICC/ScenGen) was applied in 2050 and 2100 to estimate the potential rise in the annual mean temperature in Middle Egypt. The results of the MAGICC/SceGen model indicated that the potential rise in temperature in the study area will be 2.12 °C in 2050, and 3.96 °C in 2100. The percentage of increase in irrigation water demands for winter crops under study ranged from 6.1 to 7.3% in 2050, and from 11.7 to 13.2% in 2100. At the same time, the increase in irrigation water demands for summer crops ranged from 4.9 to 5.8% in 2050, and from 9.3 to 10.9% in 2100. For Nili crops, the increase ranged from 5.0 to 5.1% in 2050, and from 9.6 to 9.9% in 2100. The increase in water demands due to climate change will affect the water security in Egypt, as the available water resources are limited, and population growth is another challenge which requires a proper management of water resources.
1. Introduction
The climate change impact on Egypt’s water resources can be considered a significant challenge due to the dependence of its large and growing population on the Nile River. Egypt has already reached the water poverty limit. Changes in the flow of the Nile will surely affect the country’s economy, as it supplies irrigation water for agriculture. The flow of the Nile may be decreased due to climate change and regional change, such as constructing new dams on the river. Therefore, research has focused on irrigation water for agricultural crops, considering that the water consumption in the agriculture sector is the largest consumption of Egypt’s water resources. Many international studies have been carried out in this regard, including Hammond [1], who stated that, due to climate and socioeconomic changes, management of water resource in the Nile Basin will become increasingly complex. Cunha et al. [2] studied irrigation adoption in Brazil under the effects of climate change. A number of different climate scenarios were employed under temperature and precipitation projections for the 2010–2099 periods. The results show that climate change will affect irrigation adoption. Fader et al. [3] assessed how irrigation requirements in the Mediterranean region may be affected due to climate change and increases in atmospheric CO2 concentrations in the context of demographic and technological change. The Mediterranean region, when applying some climate models at 3 °C global warming and above, showed a signal of increasing the net irrigation requirements, without the positive effects of higher CO2 concentrations in the atmosphere. Rolim et al. [4] anticipated that, to maintain current crop yield levels, water demand for irrigation will be increased. Kakumanu et al. [5] stated that in recent years, water resources, agriculture, ecology, and other disciplines have become hotspots for research under the conditions of climate change characterized by global warming. In India, water resource availability and the agricultural food production system is affected by climate change. Studies suggested decreasing trends in rainfall and increasing trends in surface temperature. Various adaptation strategies were developed and implemented to mitigate climate change effects through the Climate Adapt program. Bocci and Smanis [6] indicated that for all southern Mediterranean countries, general atmospheric circulation model predicted changes in temperature and precipitation patterns are already affecting the sector through greater exposure to risks of floods and extreme droughts.
Ritchie and Roser [7] indicated that one of the world’s most pressing challenges is climate change. Global temperatures have increased by around 1 °C since pre-industrial times due to greenhouse gas emissions caused by human activities. These gases include carbon dioxide (CO2), methane, and others. Globally, the emissions of CO2 are over 36 billion tons per year, and present a continuous increase over 400 ppm concentrations in the atmosphere. These are the highest levels in about 800,000 years. Today, China is the largest CO2 emitter worldwide (about 25% of emissions). This is followed by the USA (15%); EU-28 (10%); India (7%); and Russia (5%). Although less than 1% of emissions are contributed by the world’s poor countries, they will be the most vulnerable to the impact of climate change. The predicted warming will be about 3.1 to 3.7 °C under current policies.
Schilling et al. [8] studied and compared the climate change vulnerability of Algeria, Egypt, Libya, Morocco, and Tunisia, and linked it to its social implications. The results suggested that all countries are exposed to have strong temperature increases and a high drought risk under climate change. Across North Africa, the combination of climate change and strong population growth is very likely to further aggravate the already scarce water situation. In the same trend, Driouech et al. [9] studied future changes in temperature, precipitation, and related extreme events in the Middle East and North Africa (MENA) region using Regional Climate Model ALADIN-Climate over the CORDEX-MENA domain. They found that projected changes in the temperature rate amounted to 0.2 °C/decade to 0.5 °C/decade, depending on the scenario. Drought is projected to increase in the northern half of the region independently from the index used. ALADIN-Climate results corroborate previous studies, projecting the MENA region to host global hot spots for drought in the late twenty first century. Zittis et al. [10] added that global climate predictions suggest a significant strengthening of summer heat extremes in the MENA region. They added that, on a business-as-usual pathway, unprecedented super- and ultra-extreme heatwave conditions will appear in the second half of this century. These events comprise extremely high temperatures (up to 56 °C and higher) and will be of prolonged duration (several weeks), being possibly life threatening for humans. By the end of the century, about half of the MENA population (approximately 600 million) could be exposed to annually frequent super- and ultra-extreme heatwaves.
Driouech et al. [9] used Regional Climate Model ALADIN-Climate to study future changes of temperature, precipitation, and associated extreme events in the MENA region. The study concluded that 0.2 °C/decade to 0.5 °C/decade over land are the warming rate ranges, depending on the scenario. Duration and magnitude of projected heat waves are expected to be increased. The northern half of the region is expected to have an increase in drought.
Mohammad et al. [11] investigated the changes in a 20-year (2000–2019) mean surface temperature (ST), wind speed (WS), and albedo (AL) data from the Global Land Data Assimilation System (GLDAS) over the globe with respect to those in 1961–1990. The results showed that the mean of monthly global mean surface temperature (GMST) anomalies in 2000–2019 is 0.54 °C higher than that in 1961–1990. Increasing greenhouse gas (GHG) emissions and variations of the North Atlantic Oscillation (NAO) are the main causes of increasing ST across the globe, particularly in the northern hemisphere (NH). Regarding these topics, there are many studies carried out in Egypt and the Arab region, for example El-Ramady et al. [12] concluded that, due to the hot climate, agriculture in Egypt is expected to be especially vulnerable. Crop productivity is expected to reduce due to further warming. Nour El-Din [13] in “Proposed Climate Change Adaptation Strategy for the Ministry of Water Resources & Irrigation in Egypt” stated that, due to science progress, knowledge, and acquired capacity in dealing with climate change impacts, the water strategy should be continuously revised and updated. In the Annual Report of the Arab Forum for Environment & Development, Sadik et al. [14] stated that in the next few decades, one of the main drivers reducing levels of food security in the Arab world will be climate change.
Water availability is reduced by climate change and therefore will significantly limit crop productivity in affected areas due to the increase in demand of water needed for irrigation. El Agroudy et al. [15] indicated that water storage in front of the Renaissance Dam will cause a lack of incoming water to Nasser Lake up to approximately 25–33 billion m3 per year, and if there will be no pulling of shortage from Dam Lake, this will result in wasting about 3–5 million acres of Egypt’s cultivated area. Mahmoud and El-Bably [16] revealed that evapotranspiration may increase as the warmer temperatures expected with climate change will increase evaporation. Increasing crop water requirements due to climate change will affect crops production indirectly.
Most of the research conducted in Egypt was aimed at studying the impact of climate change on the productivity or water consumption of a particular crop, however studies on the impact of climate change on the total water needs required for major crops under climate change conditions have not been considered to date.
This study focuses on providing decision makers with data on the amount of irrigation water needed for major crops under climate change conditions, in an effort to manage saving methods for these quantities from now on, or to determine the appropriate area that can be grown under future conditions and to develop plans and strategies to utilize the lost area in the event of an inability to provide quantities under climate change conditions.
Accordingly, the current study aims to investigate the impact of climate change on Egypt’s water resources focusing on the agriculture sector. The study also aims to determine solutions to reduce the pressure on the water budget of agricultural crops through adaptation measures.
2. Study Area
Egypt lies in the north eastern north of the African continent; the Mediterranean Sea lies on its northern coasts and the Red Sea lies on its eastern coasts. Egypt’s location is between longitude 22° to longitude 32°, and between latitude 24° to latitude 37°. Egypt’s land frontiers border Palestine to the northeast, Sudan to the south, and Libya to the west. Its total area is about one million km2. The total population of Egyptians hit 104.2 million citizens (both living in Egypt and abroad). In Egypt, there are three types of climate. On the northern coast, there is a Mediterranean climate, while there is a desert climate in inland areas, and on the Red Sea coast there is a milder desert climate. Agriculture area in year 2017, according to the Central Agency for Public Mobilization and Statistics (CAPMS), was approximately 3.8 million hectares (1 hectare (ha) = 10,000 m2).
More than 95% of Egypt’s freshwater resources come from Nile River. Egypt is considered as a downstream country and the Nile water comes from outside its international borders. Egypt’s annual share of the river′s water is 55.5 BCM.
In the western desert region and Sinai, groundwater exists in the nonrenewable deep aquifers, with a yearly extraction of about 0.9 BCM. Reuse of drainage is another important source of water that Egypt adopted, which produces about 4.5 BCM in the Nile Delta.
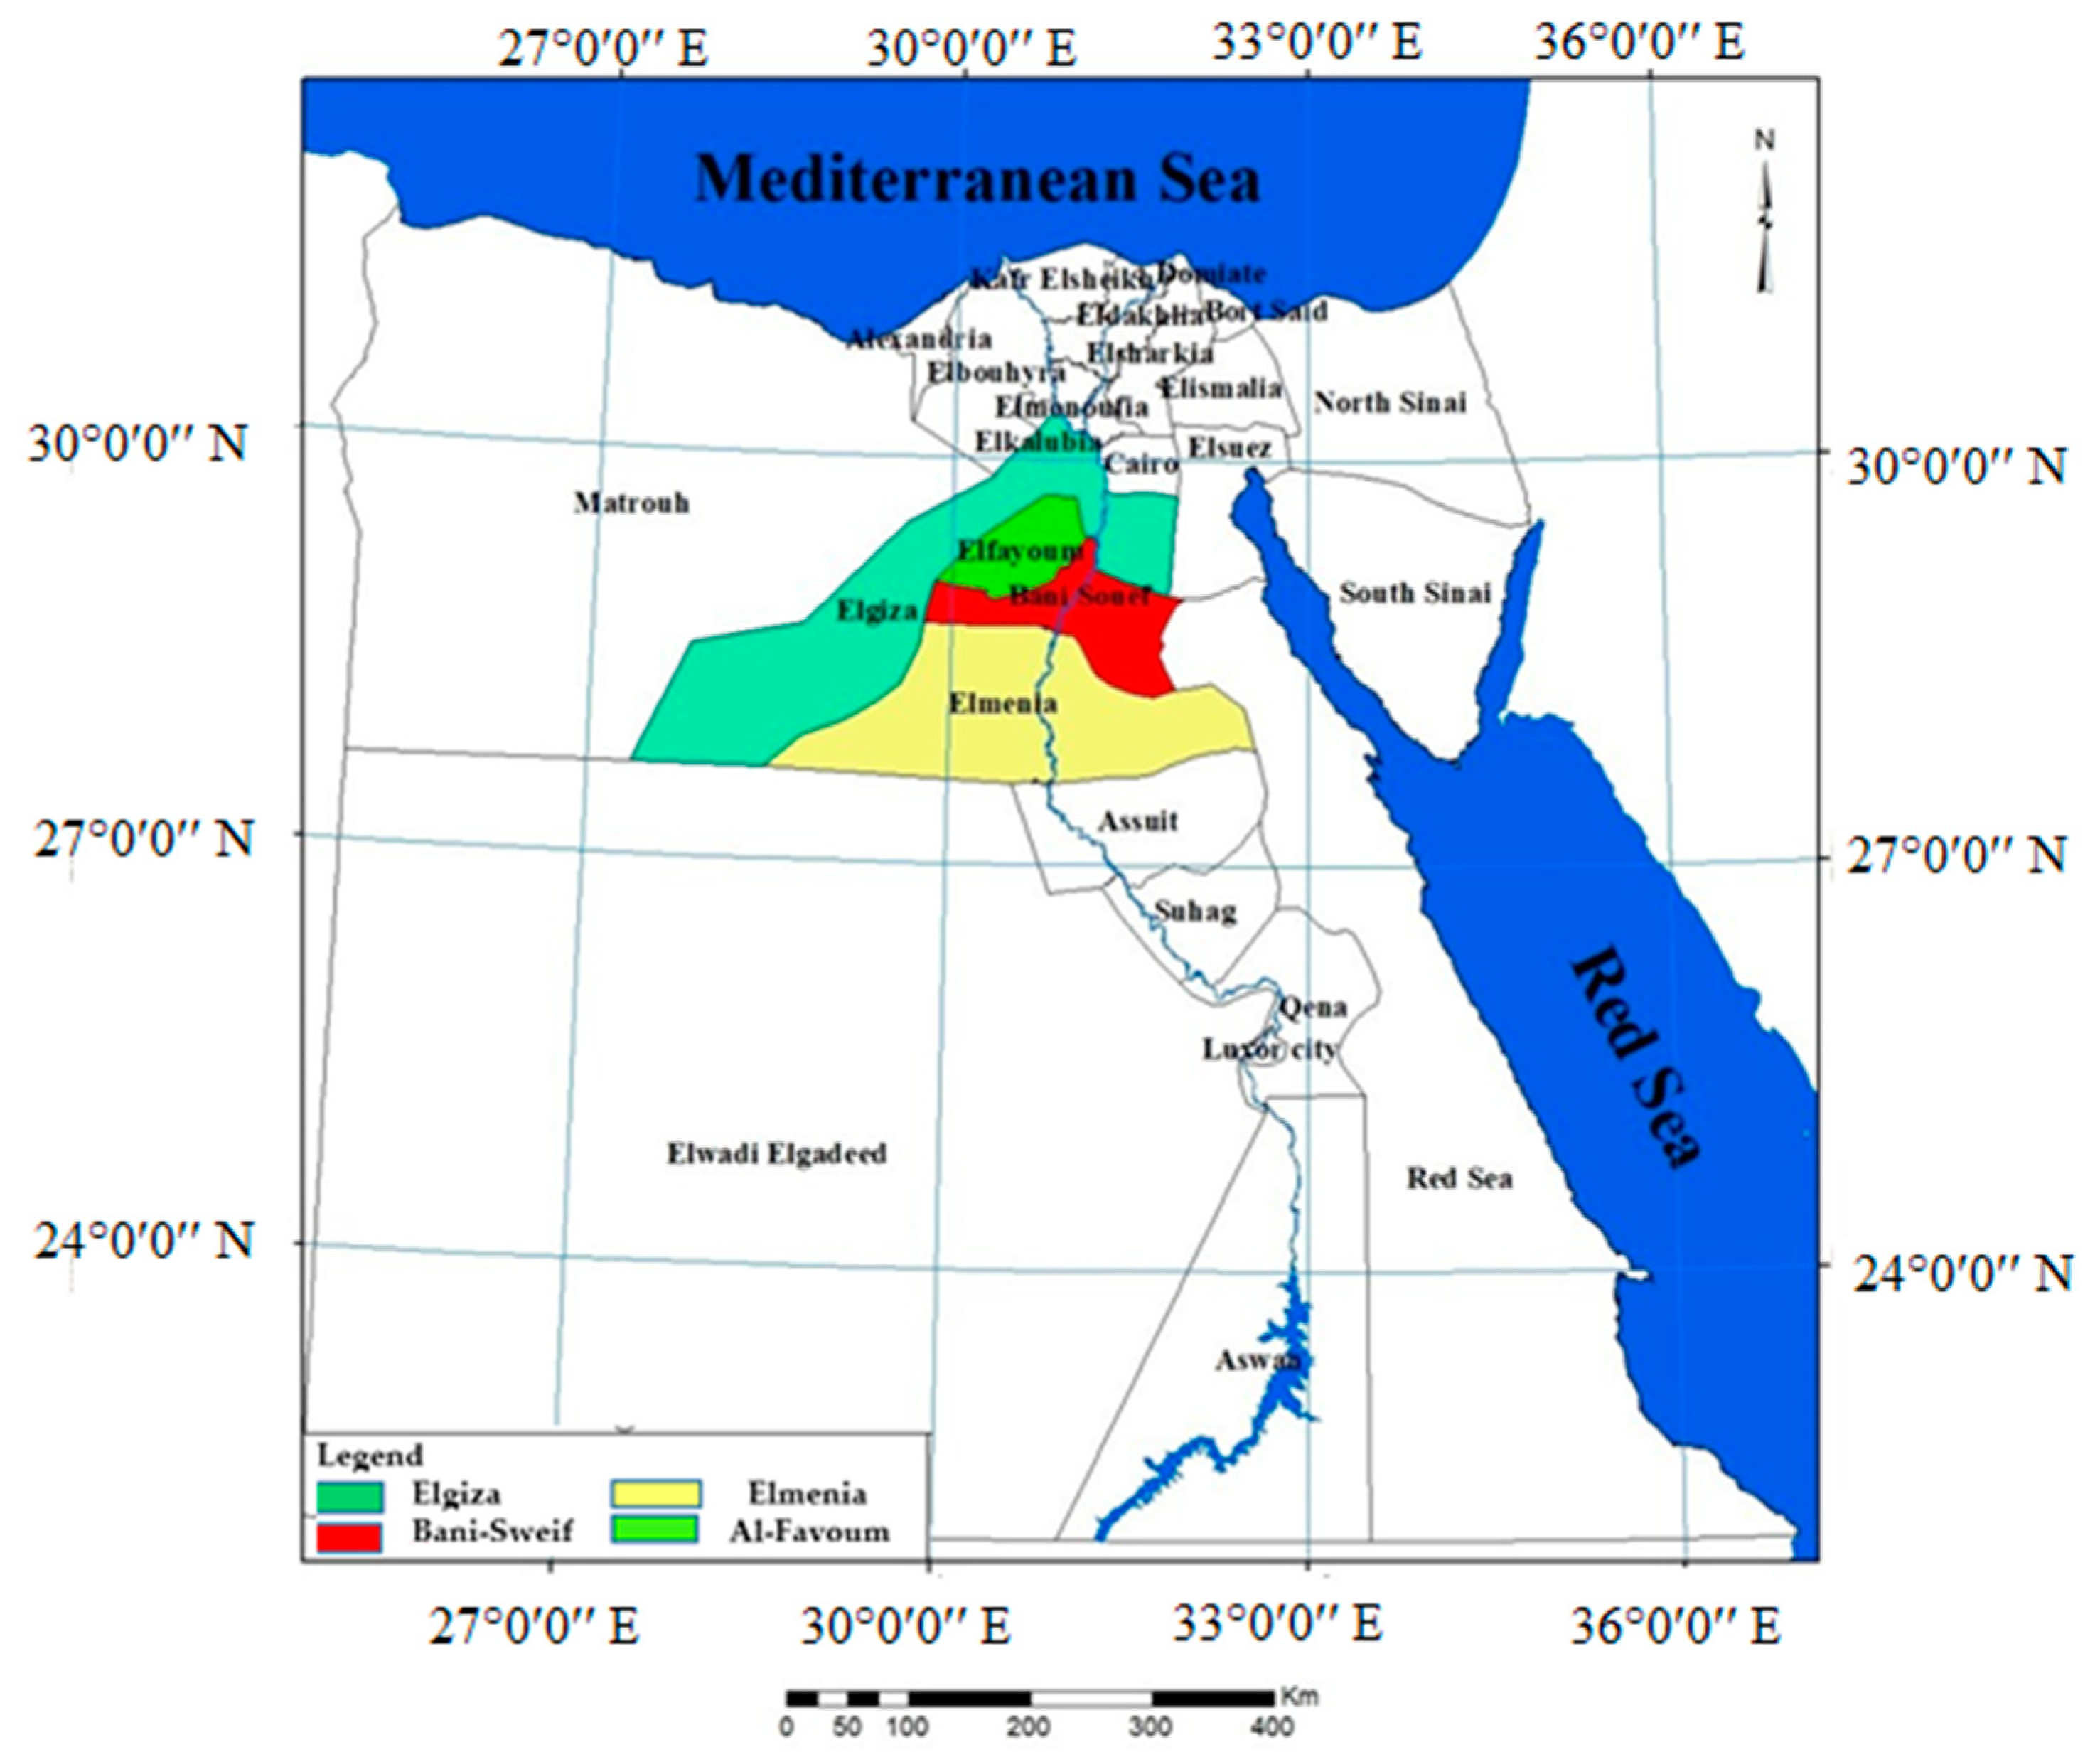
The current study is focused on the Middle Egypt region. It includes four governorates: Elgiza, Bani-Sweif, Al-Fayoum, and Elmenia, as shown in Figure 1. As a result of the lack of weather data for a long period, Giza governorate has been relied upon to represent Middle Egypt region, due to the existence of sufficient data for it. Its irrigated area is approximately 1.1 million feddan (1 fed. = 0.42 ha). In the summer season, cotton and maize are the main crops. In the winter season, wheat and berseem are the main crops.
3. Methodology
The Methodology of this study includes the following steps:
- Define the Characteristics of the study area;
- Collect climatic data, water resources data and crop data;
- Use CropWat8.0 model to calculate irrigation water requirements (IWR) under current and future climate conditions.
CROPWAT is developed by the Land and Water Development Division of FAO. It is used as a support decision tool (www.fao.org/land-water/databases-and-software, accessed on 25 January 2019).
CROPWAT8.0 calculation procedures are based on two FAO publications. These publications of the Irrigation and Drainage Series are named No. 56 “Crop Evapotranspiration—Guidelines for computing crop water requirements” and No. 33 is titled “Yield response to water” [18].
3.1. Calculation of Irrigation Water Requirements
To calculate irrigation water requirements, three steps have been done as follows:
3.1.1. Calculation of the Reference Crop Evapotranspiration (ETo)
The ETo was calculated by FAO Penman–Monteith method, using the decision support software CROPWAT8.0 developed by FAO, based on Allen et al. [20]. The equation used for calculating ETo is described as follows:
where ETo is the reference crop evapotranspiration (mm day−1), Rn is the net radiation at the crop surface (MJ m−2 day−1), G is the soil heat flux density (MJ m−2 day−1), T is the mean daily air temperature at 2 m height (°C), U2 is the wind speed at 2 m height (m s−1), es is the saturation vapor pressure (kPa), ea is the actual vapor pressure (kPa), (es − ea) is the vapor pressure deficit (kPa), Δ is the slope of the pressure-temperature curve (kPa °C−1), and γ is the psychrometric constant (kPa °C−1).
3.1.2. Calculation of the Crop Water Use (Crop Evapotranspiration, ETc)
The amount of water required to compensate the evapotranspiration loss from the cropped field is defined as crop water requirement (crop evapotranspiration). According to Allen et al. [20], crop evapotranspiration (ETc) is calculated by multiplying the reference crop evapotranspiration (ETo), by crop coefficient (Kc):
where: ETc is the crop evapotranspiration (mm day−1), Kc is the crop coefficient (dimensionless), and ETo is the reference crop evapotranspiration (mm day−1).
ETc = Kc ETo
3.1.3. Calculation of the Irrigation Water Requirements (IWR)
IWR = ETc/IE
The irrigation efficiency values used in this study were:
- -
- 60% for surface irrigation system [21];
- -
- 75% and 80% for the sprinkler and drip irrigation systems, respectively.
The study of the climate change impact on the irrigation water requirements was achieved through the results of the MAGICC/SCENGEN model predictions. Current weather data has been converted to what is expected in 2050 and 2100 using the results of the model, and irrigation water requirements were calculated
Calculations of IWR under current and future climatic changes conditions have been implemented on the following crops:
- Winter crops: barley, faba bean (dry), wheat, potato, and tomato;
- Summer crops: cotton, maize, sunflower, potato, and tomato;
- Nili crops: potato and tomato.
In addition, total irrigation water requirements according to the cropped area in 2013/2014 were calculated on the old and new lands.
4. Results
4.1. Climate Change Impacts
GCMs are used to simulate climate change. The atmospheric concentrations of greenhouse gases were gradually increased, and the impacts on the climate model were monitored. Decisions regarding how concentrations of greenhouse gases will alter in the future have been made. Scenarios using these decisions are applied into the GCM. SRES (Special Report on Emissions Scenarios) may be the best-known emissions scenarios [22]. For impact and adaptation studies, these scenarios and model output are still in use. (https://coastadapt.com.au, accessed on 21 May 2021).
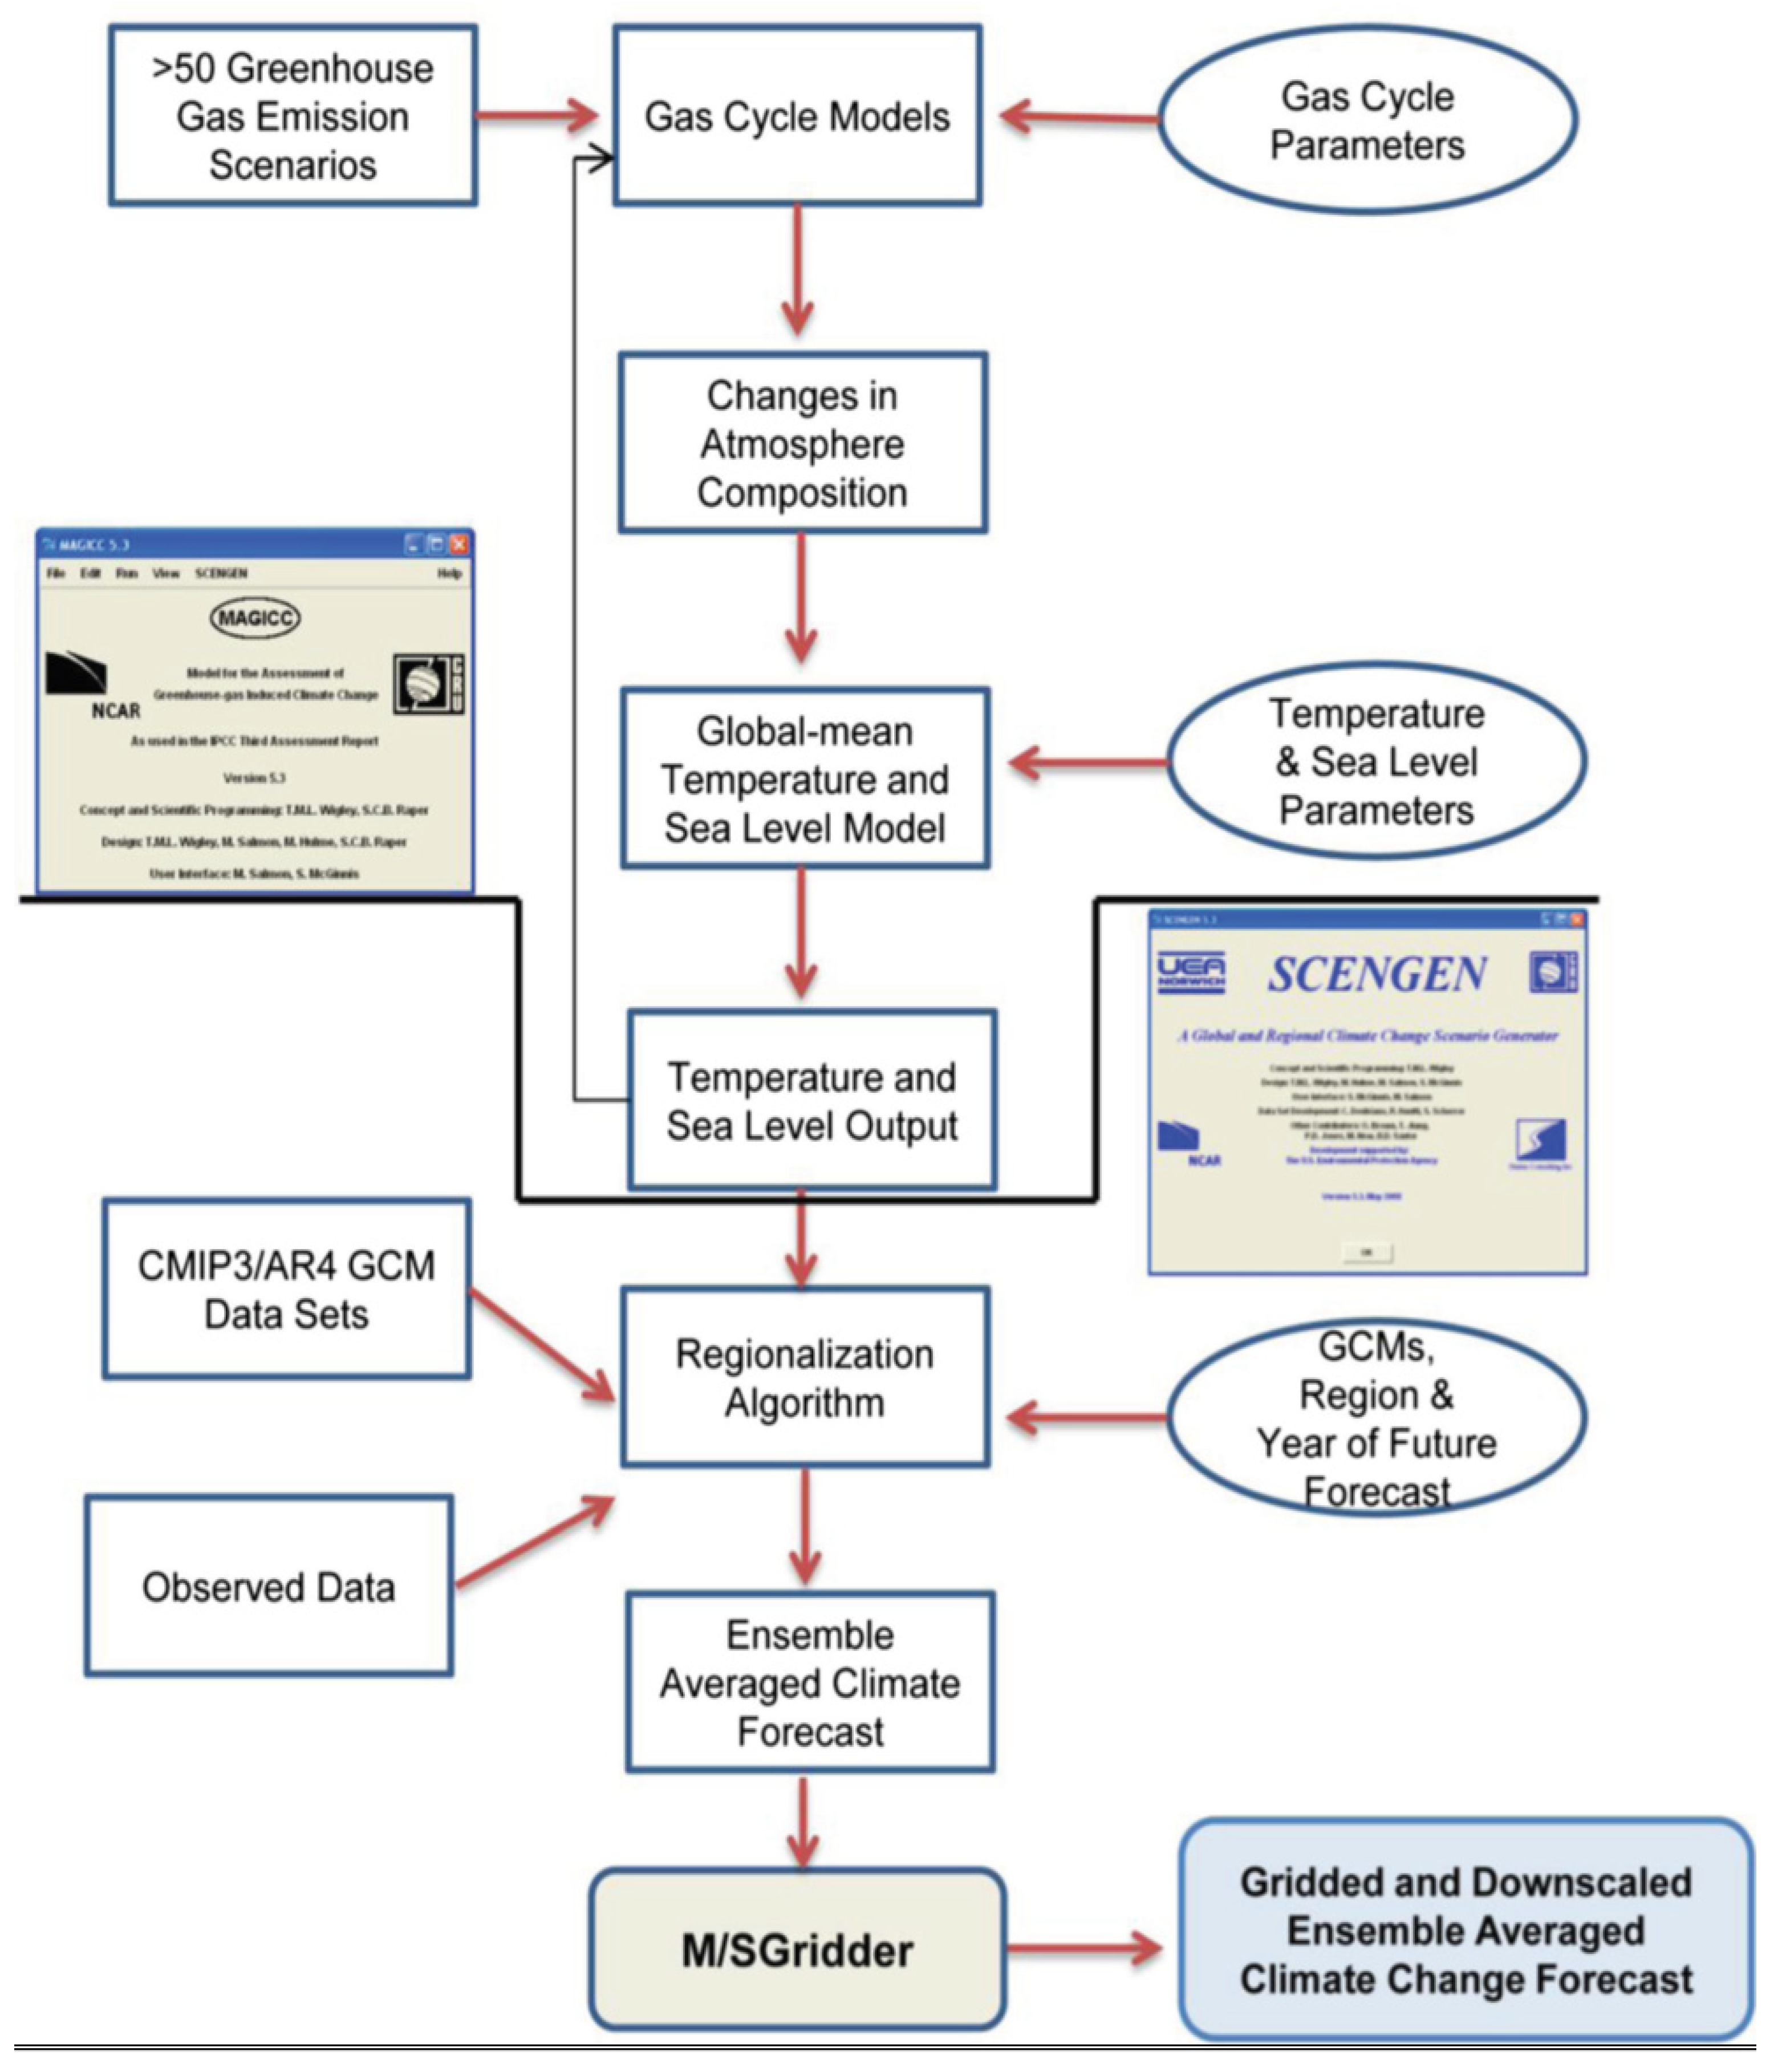
MAGICC/SCENGEN is a coupled gas-cycle/climate model (MAGICC; Model for the Assessment of Greenhouse-gas Induced Climate Change) that drives a spatial climate-change SCENario GENerator (SCENGEN). Since 1990, IPCC [23] has used MAGICC to produce projections of future global-mean temperature and sea level rise.
4.2. Impact of Climate Change at the National Level of the Study Area
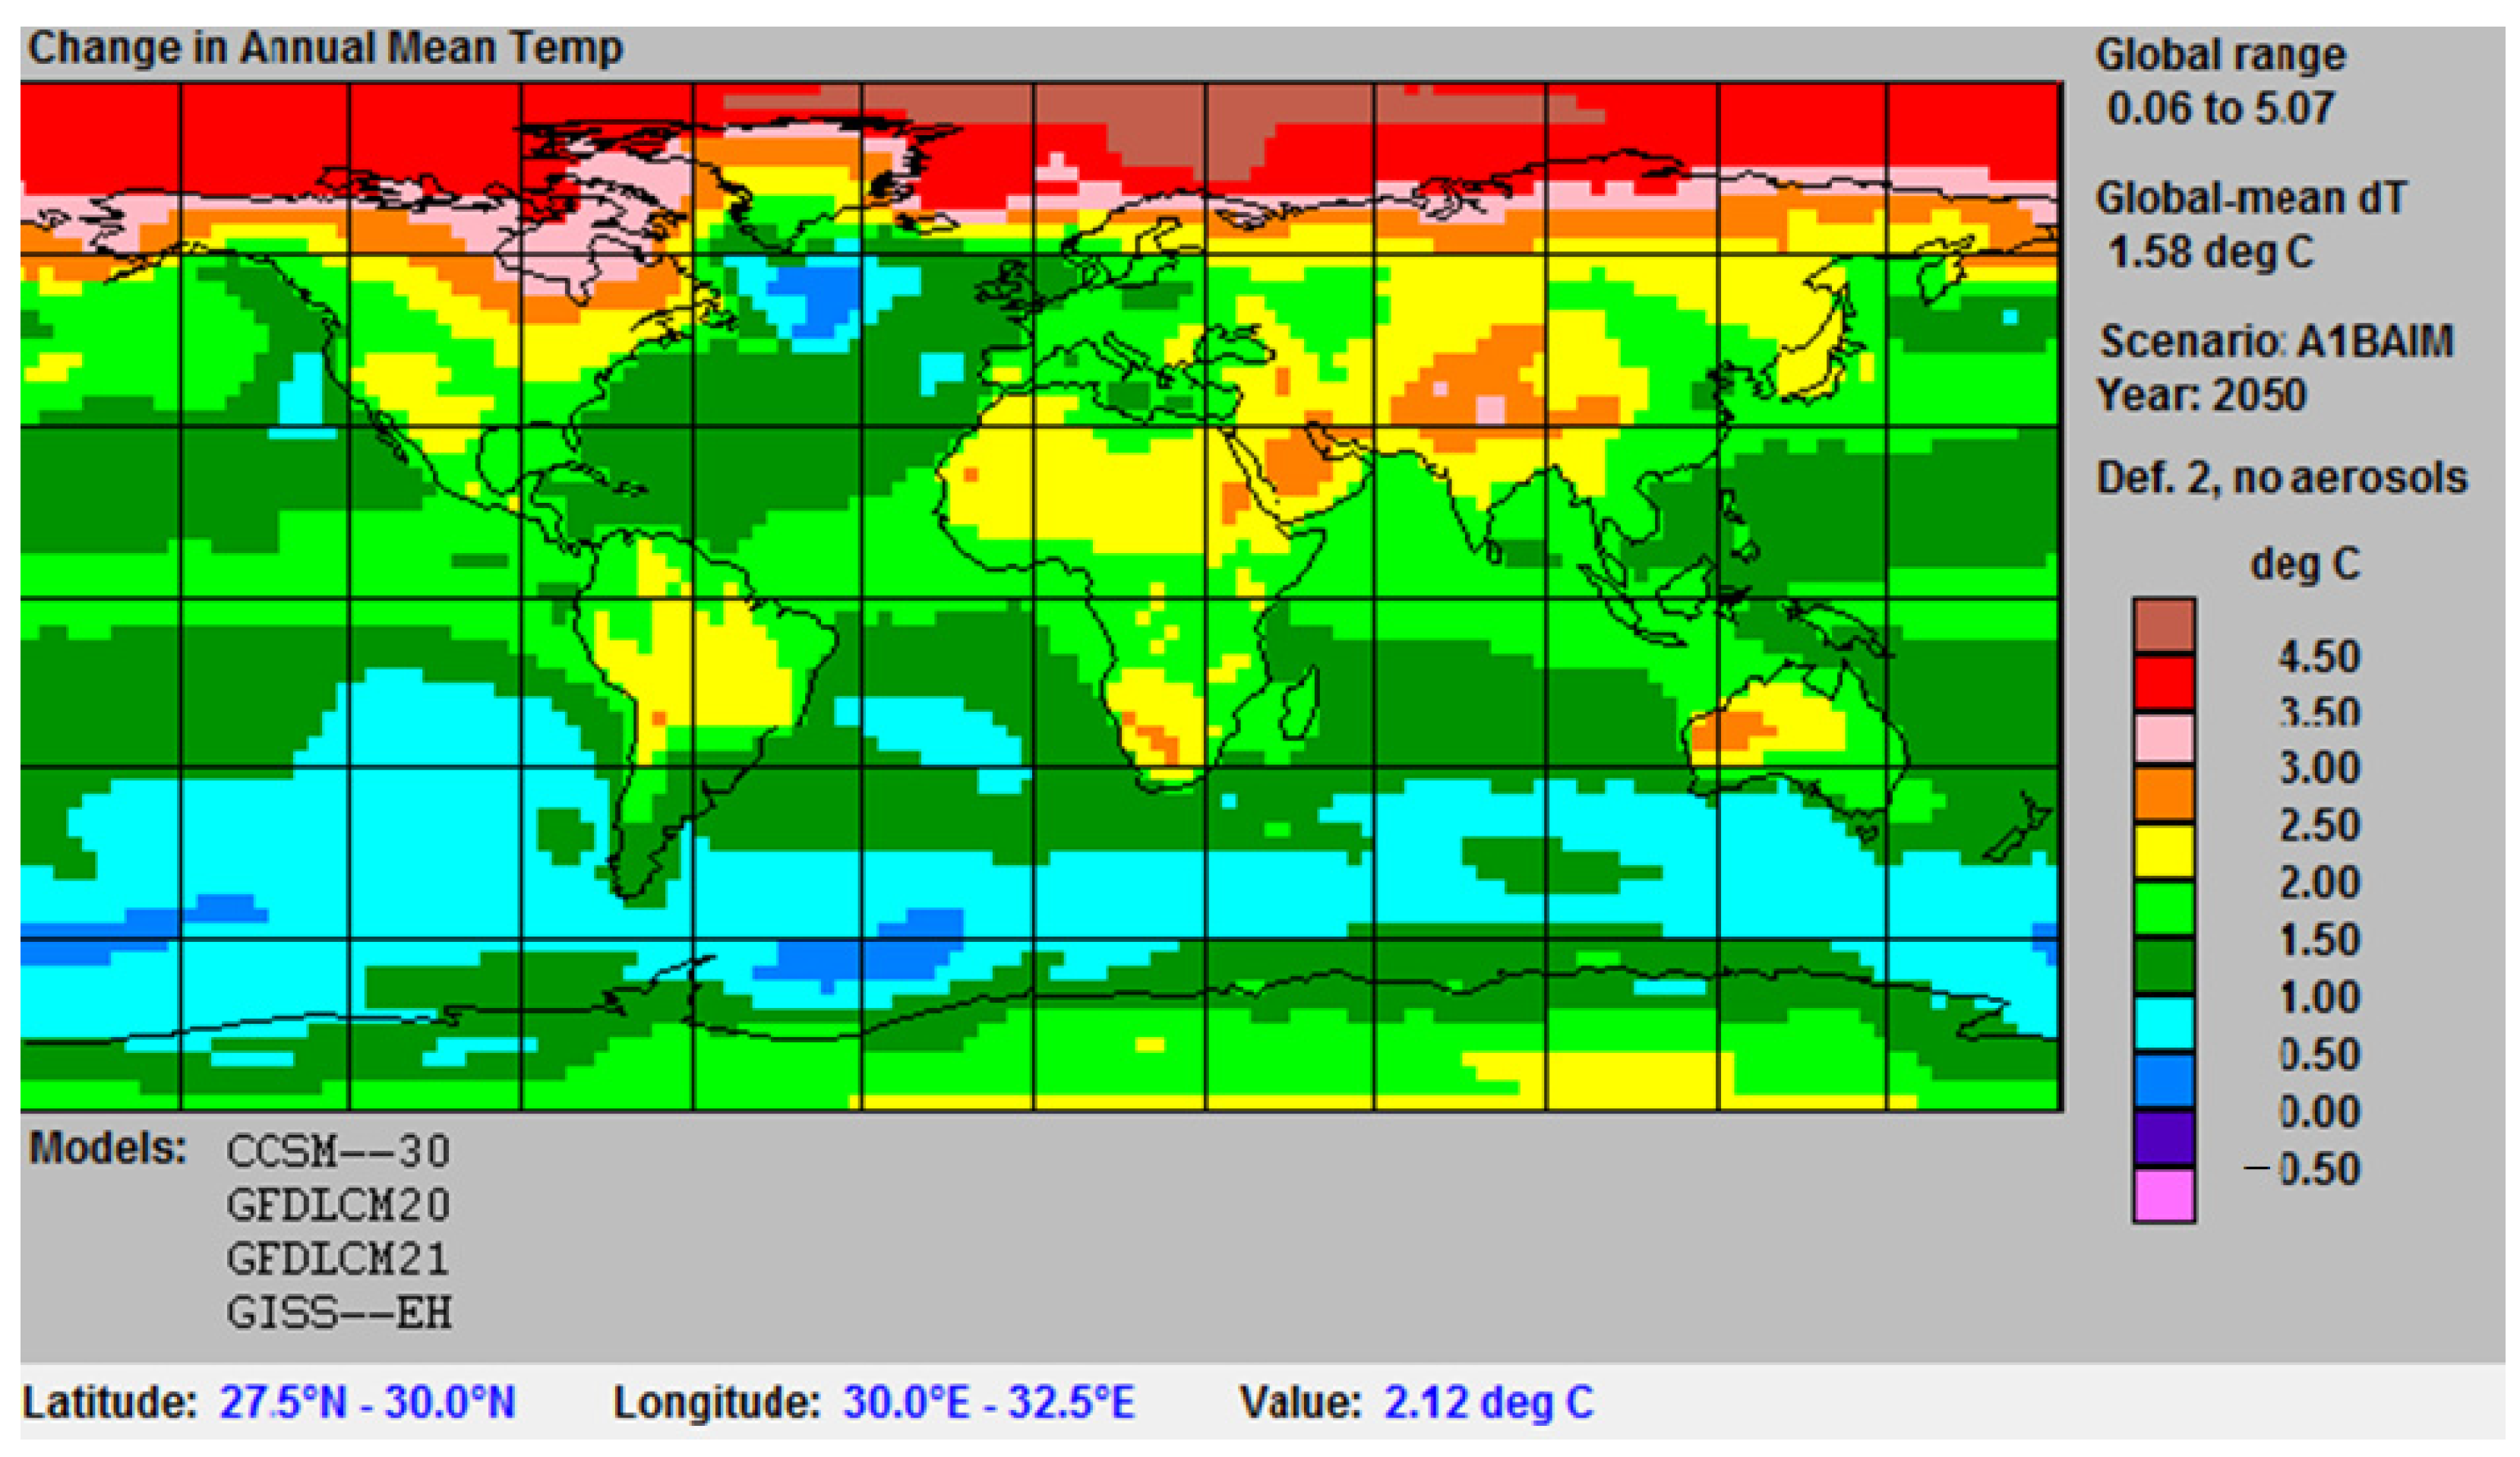
Change in annual mean temperature has been predicted in 2050 and 2100 using MAGICC/SCENGEN model under the conditions of the four selected models CCSM-30, GFDLCM20, GFDLCM21, and GISS-EH, as well as the scenario of A1BAIM (from SRES families). The A1B marker scenario (A1B-AIM) emissions increase through 2030, and subsequently decline to levels similar to those in 1990. After 2030, declining population levels, the introduction of modern management techniques, and the increased recycling result in a reduction in the waste which is sent to landfills, thus in a reduction in waste emissions. Emissions from biomass burning in A1B-AIM are assumed to decline steadily through the adoption of bio-recycling and other “no-waste” agricultural practices. Similarly, CH4 emissions from fossil fuel production and use grow through 2030 and subsequently decline as fossil fuel production falls (www.grida.no/climate/ipcc, accessed on 21 May 2021).
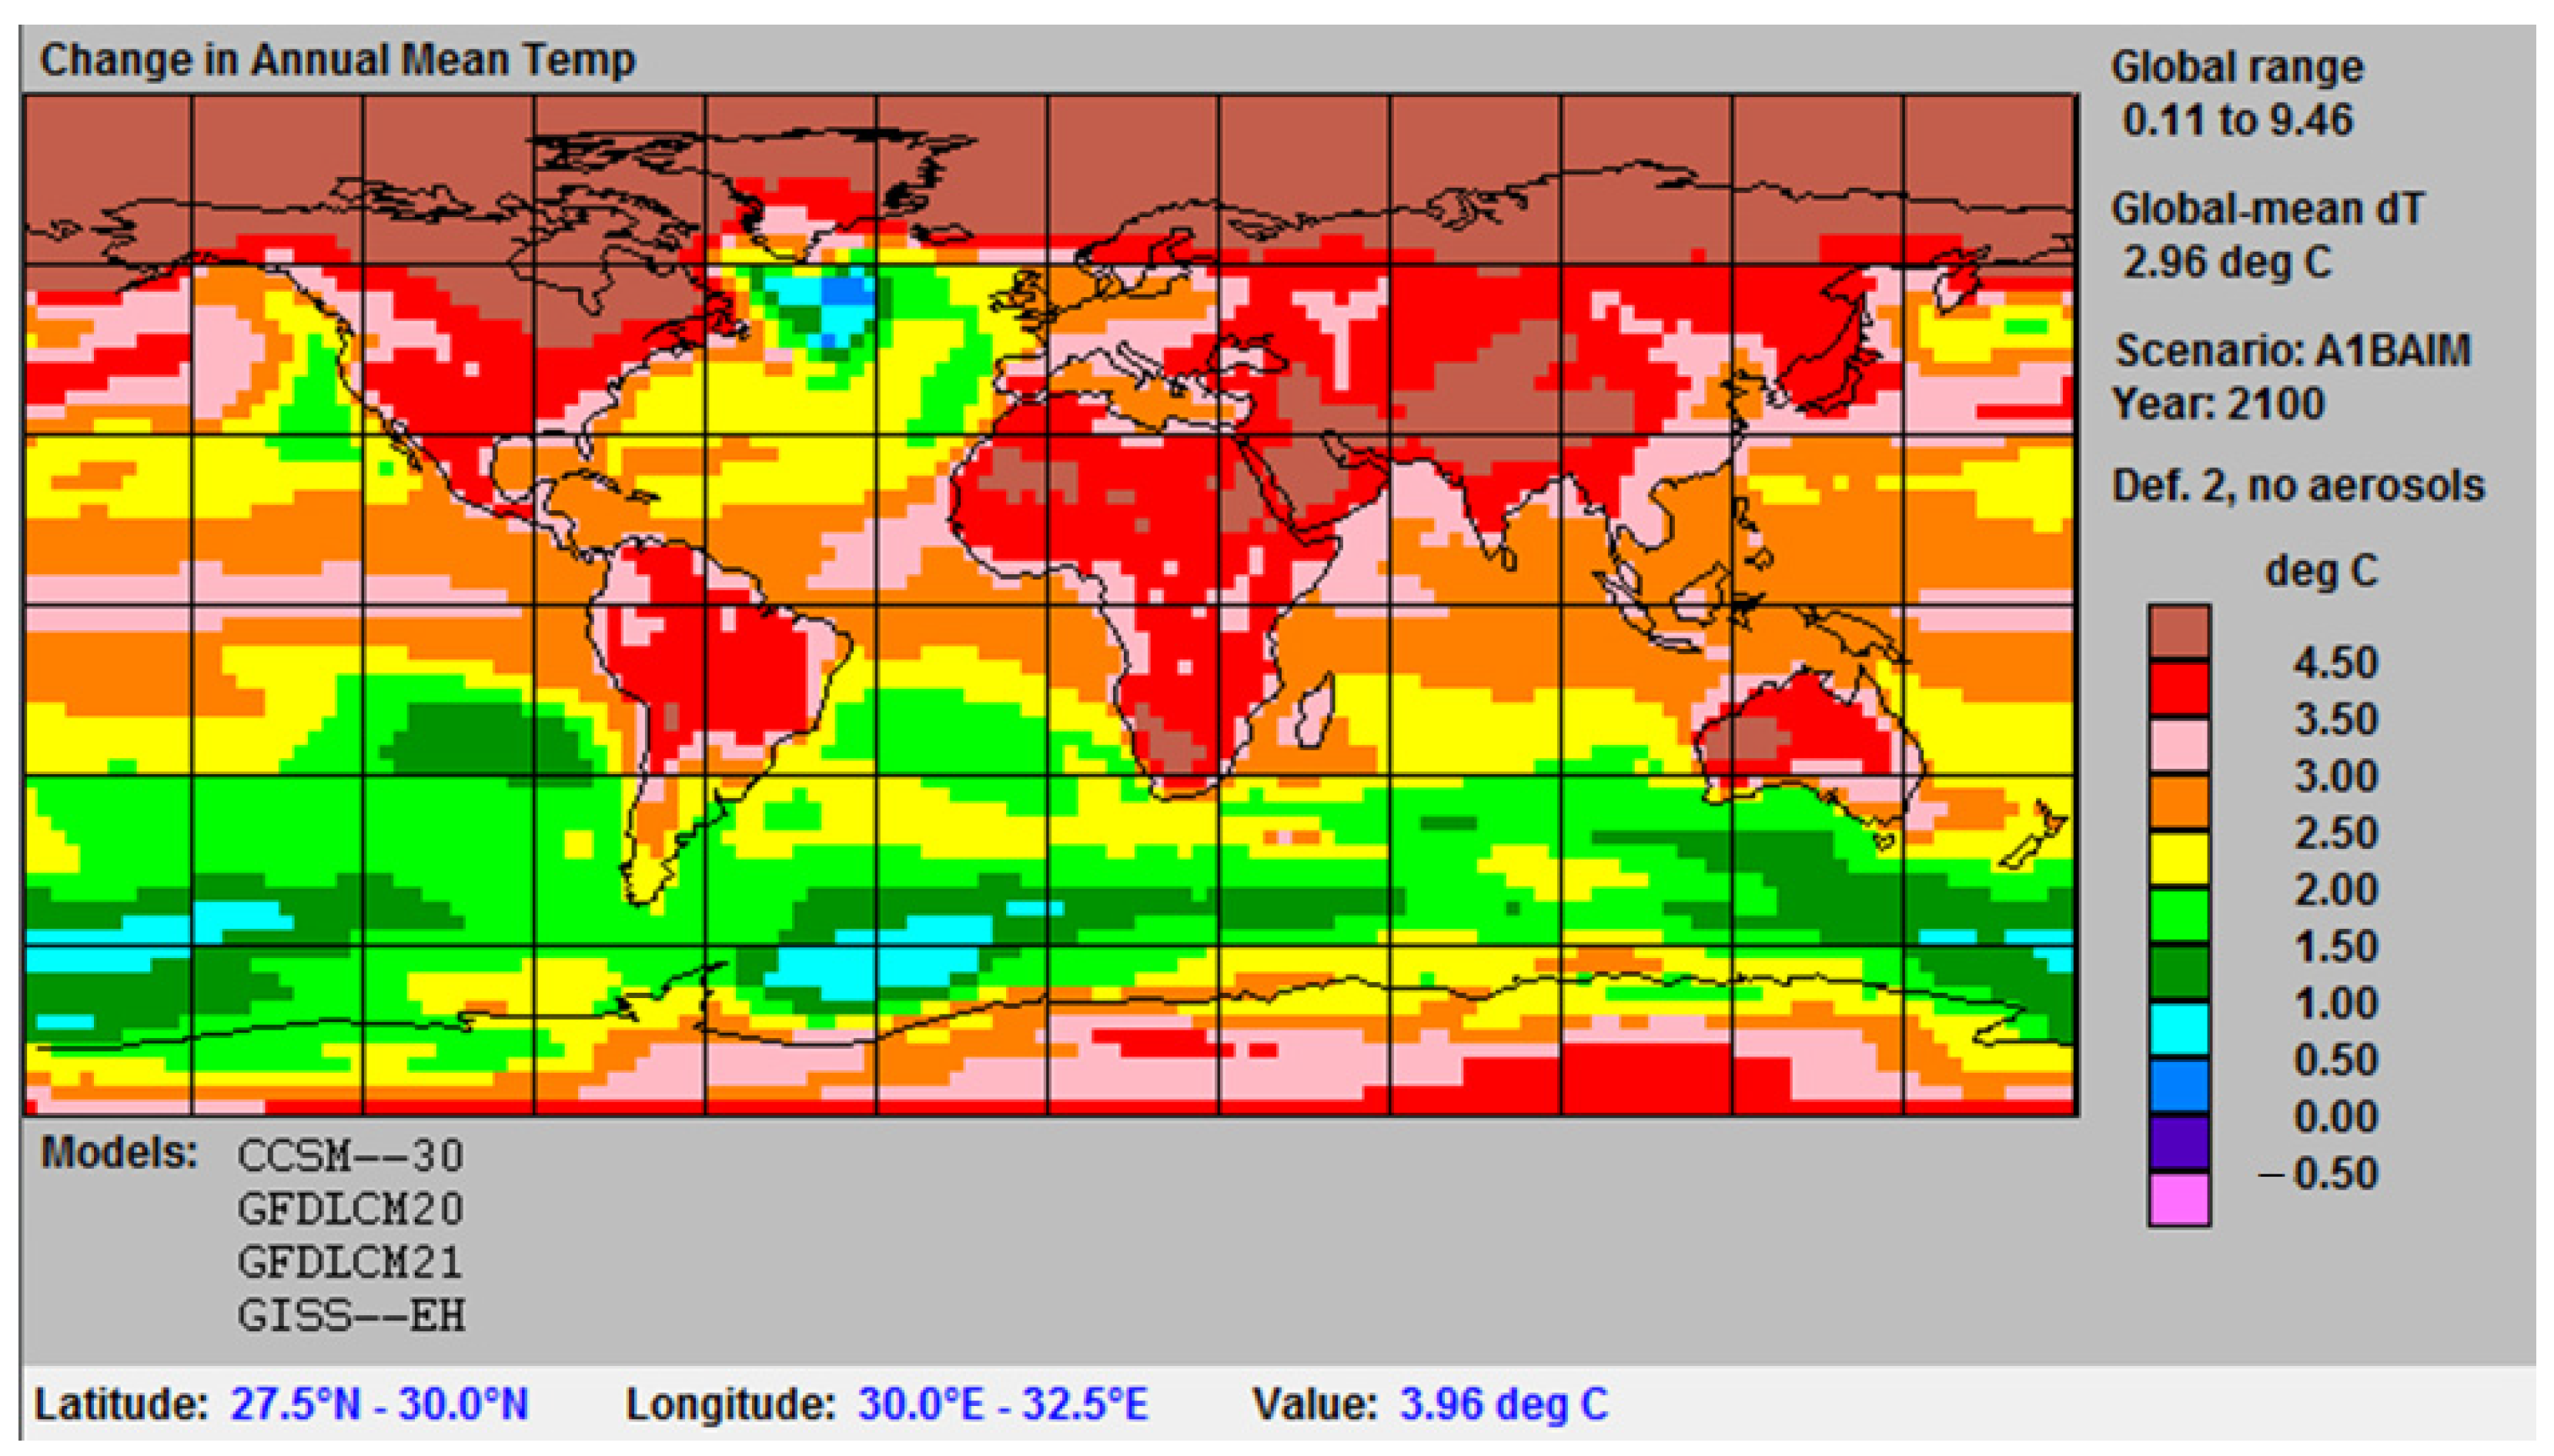
The forecasts were made to cover the entire study area (Middle Egypt region). The prediction was implemented at the coordinates of latitude 27.5° to 30.0° N, and longitude 30.0° to 32.5° E. The results of the MAGICC/ SENGEN model showed that climate changes resulting from increased global greenhouse gas emissions would cause an increase in the average global surface temperature, at different degrees depending on the latitudes of each country. According to the study area’s latitude, results showed that the possible rise in the average temperature in 2050 would reach 2.12 °C, while the possible increase in 2100 would reach 3.96 °C (Figure 3 and Figure 4).
4.3. Impact of Climate Change on Irrigation Water Requirements (IWR) in Egypt
4.3.1. Winter Crops
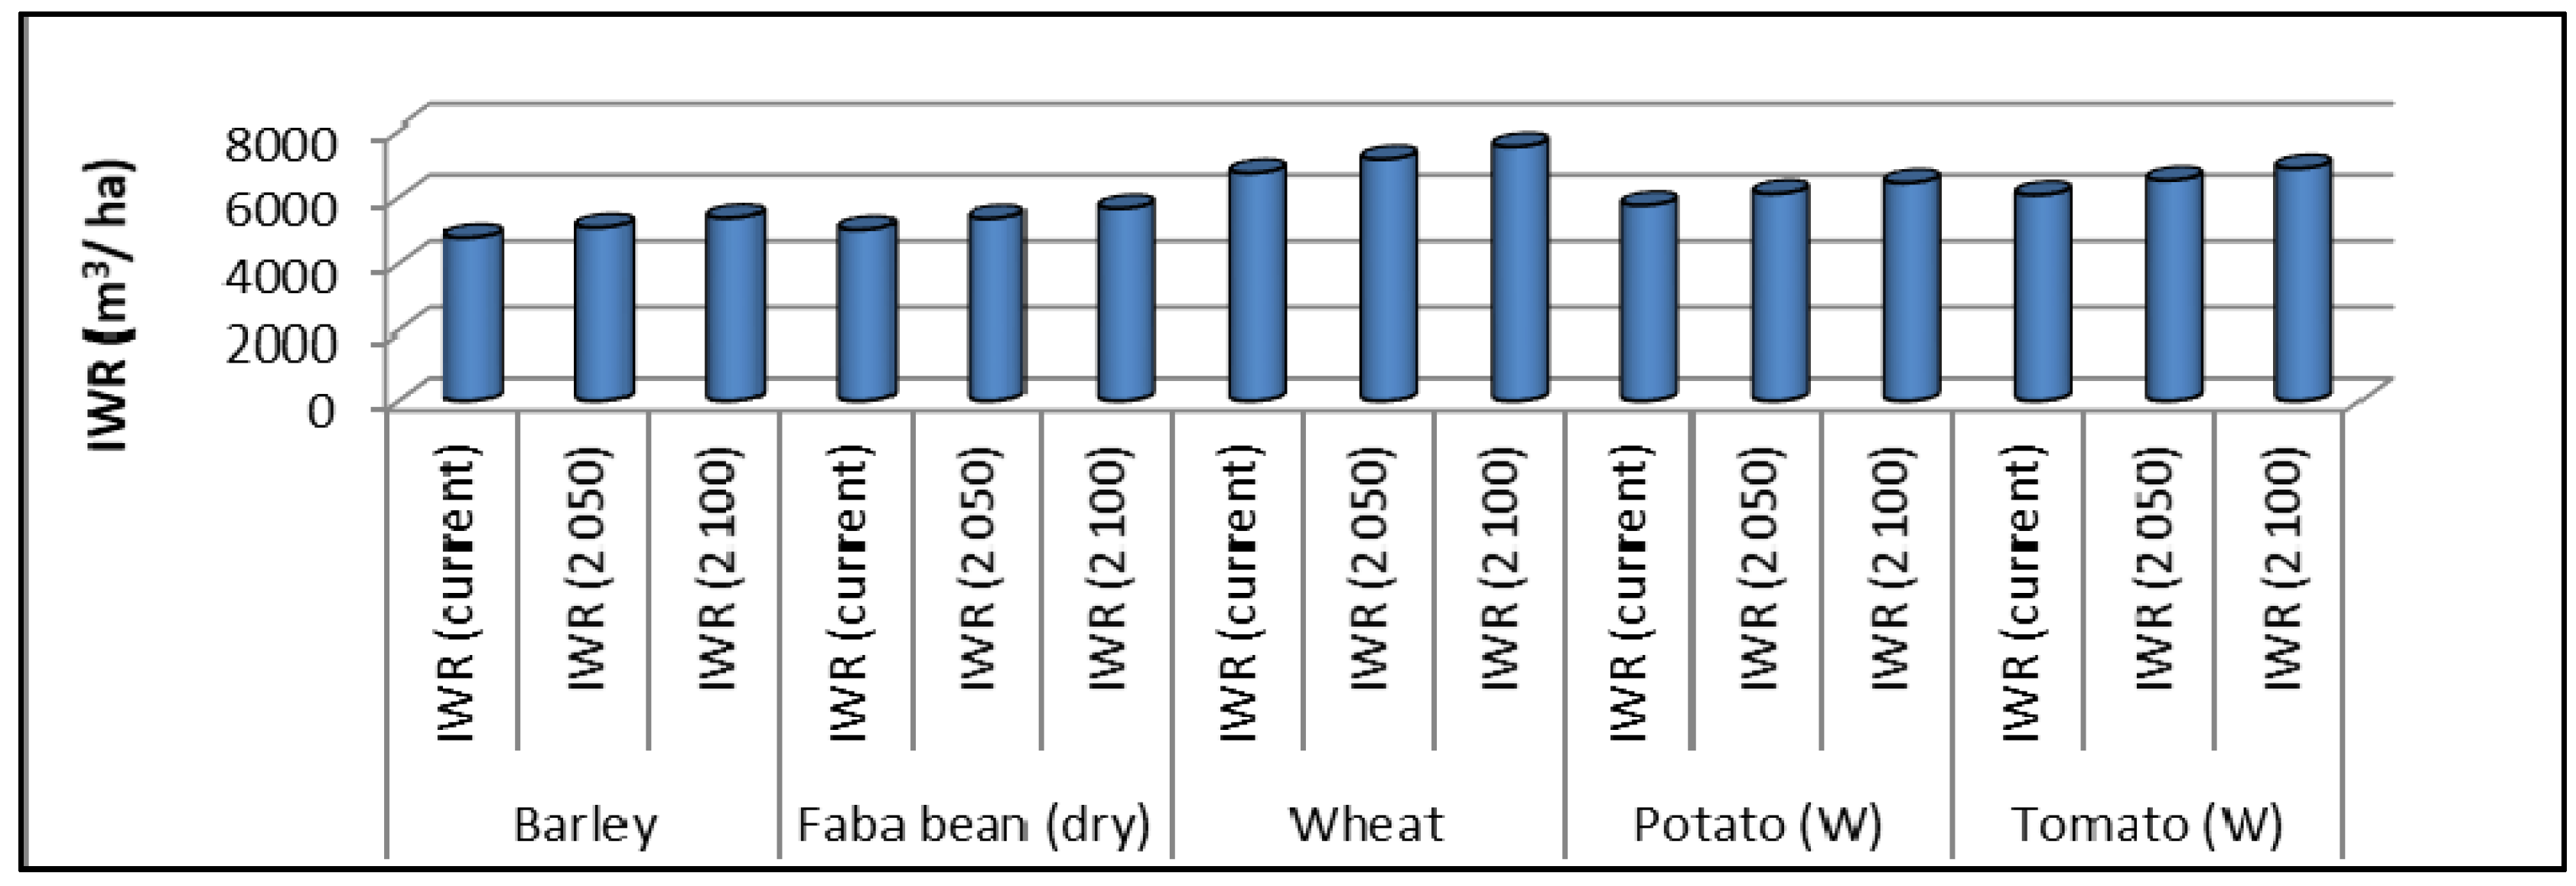
Results as presented in Figure 5 indicate average IWR over 30 years for some of the main winter crops in Middle Egypt under current and climate change conditions. Values of IWR under current conditions varied from 3792 to 5693 m3/ha for barley; 4060 to 5782 m3/ha for faba bean; 5462 to 8177 m3/ha for wheat; 4862 to 6650 m3/ha for potato; and 5107 to 6972 m3/ha for tomato. Increasing IWR is always due to high temperature, increased wind speed, or low relative humidity.
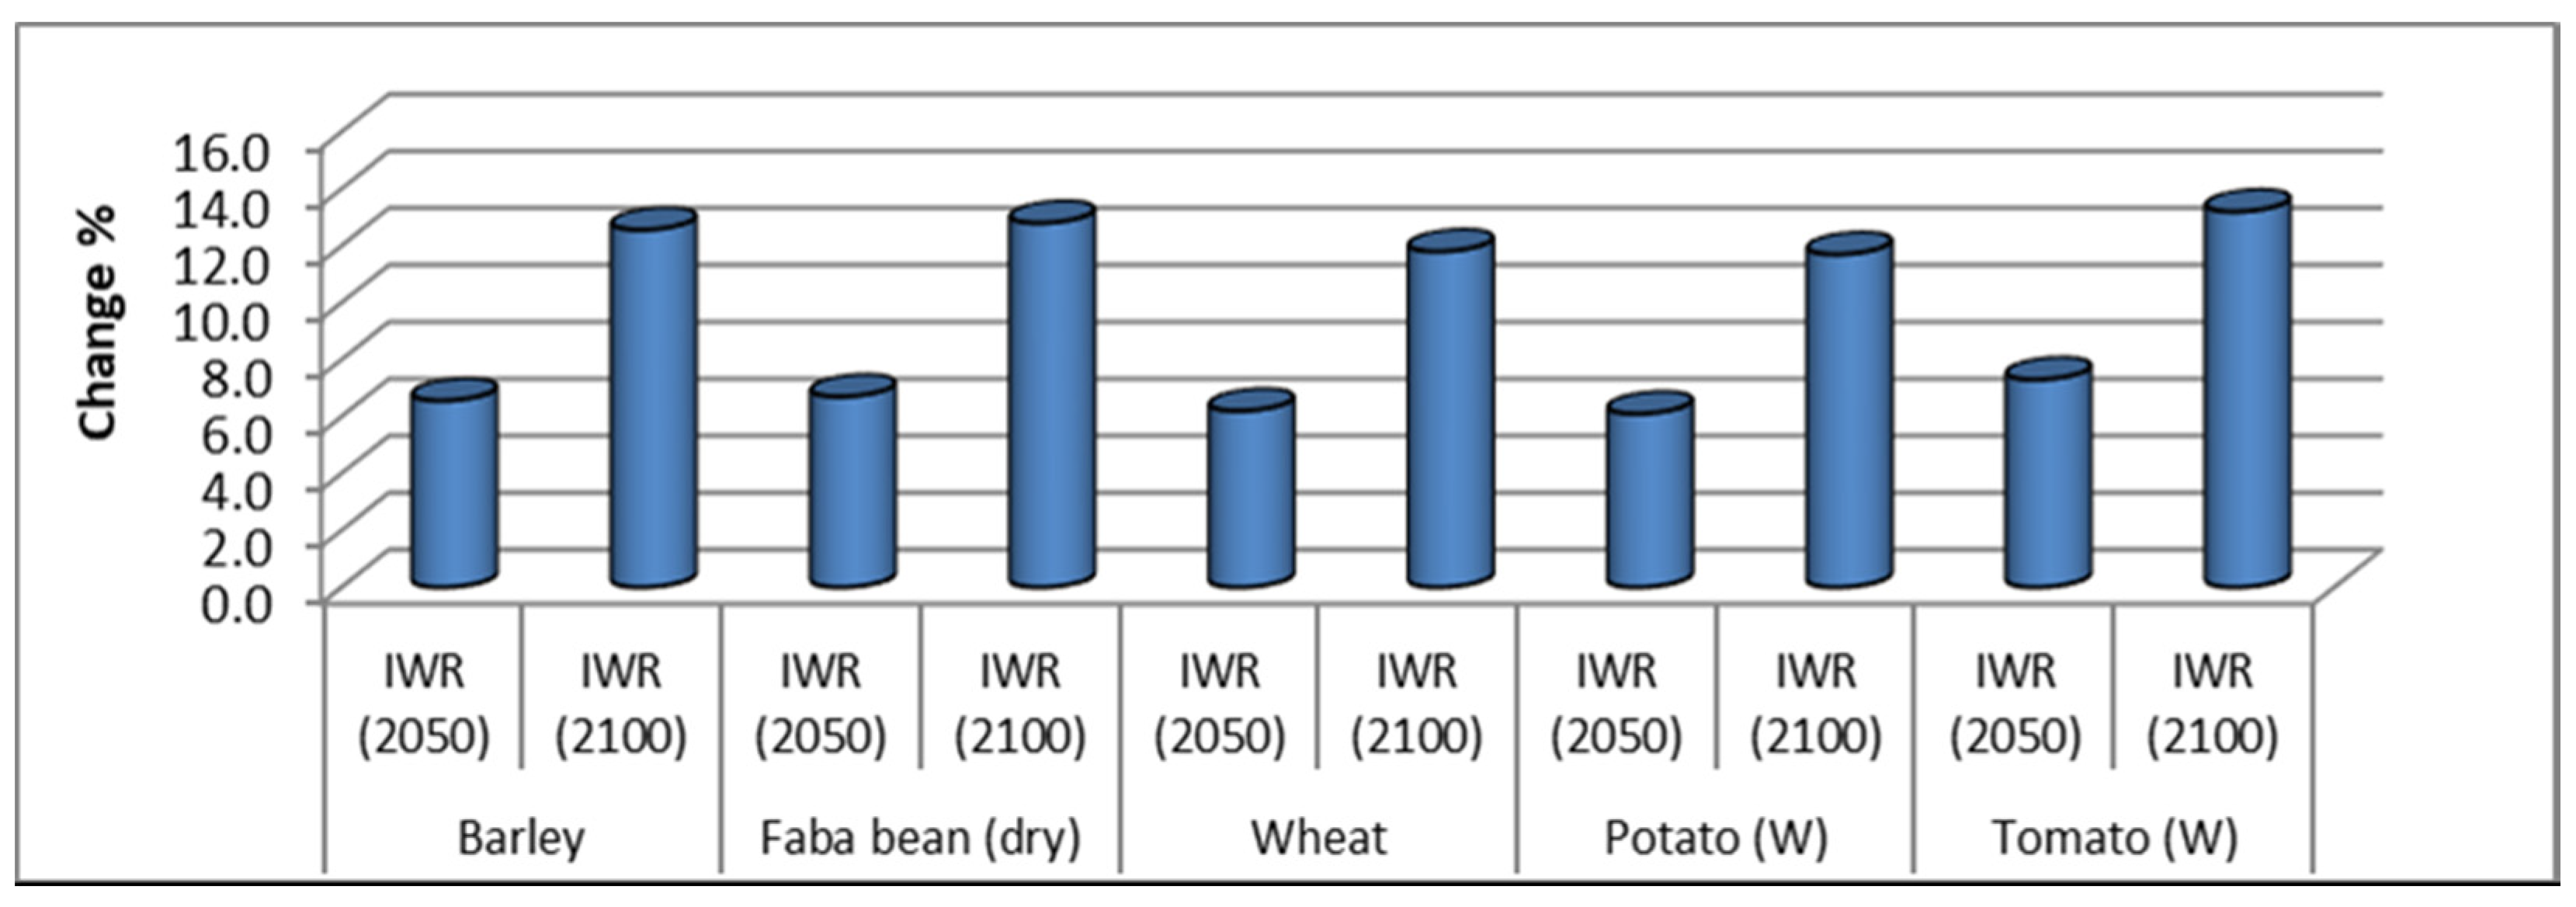
In regards to future climate changes and their effects on the water needs of winter crops, the results indicated that values of IWR in 2050 varied from 4023 to 6090 m3/ha; 4317 to 6205 m3/ha; 5773 to 8712 m3/ha; 5148 to 7048 m3/ha; and 5457 to 7253 m3/ha for the respective winter crops. However, in 2100, the values ranged between 4240 and 6477 m3/ha; 4558 and 6590 m3/ha; 6063 and 9240 m3/ha; 5423 and 7420 m3/ha; 5755 and 7653 m3/ha, respectively. The change in percentage of IWR under climate change conditions, compared to current conditions (Figure 6), ranged from +6.1 up to +7.3% in 2050 and from +11.7 up to +13.2% in 2100.
4.3.2. Summer Crops
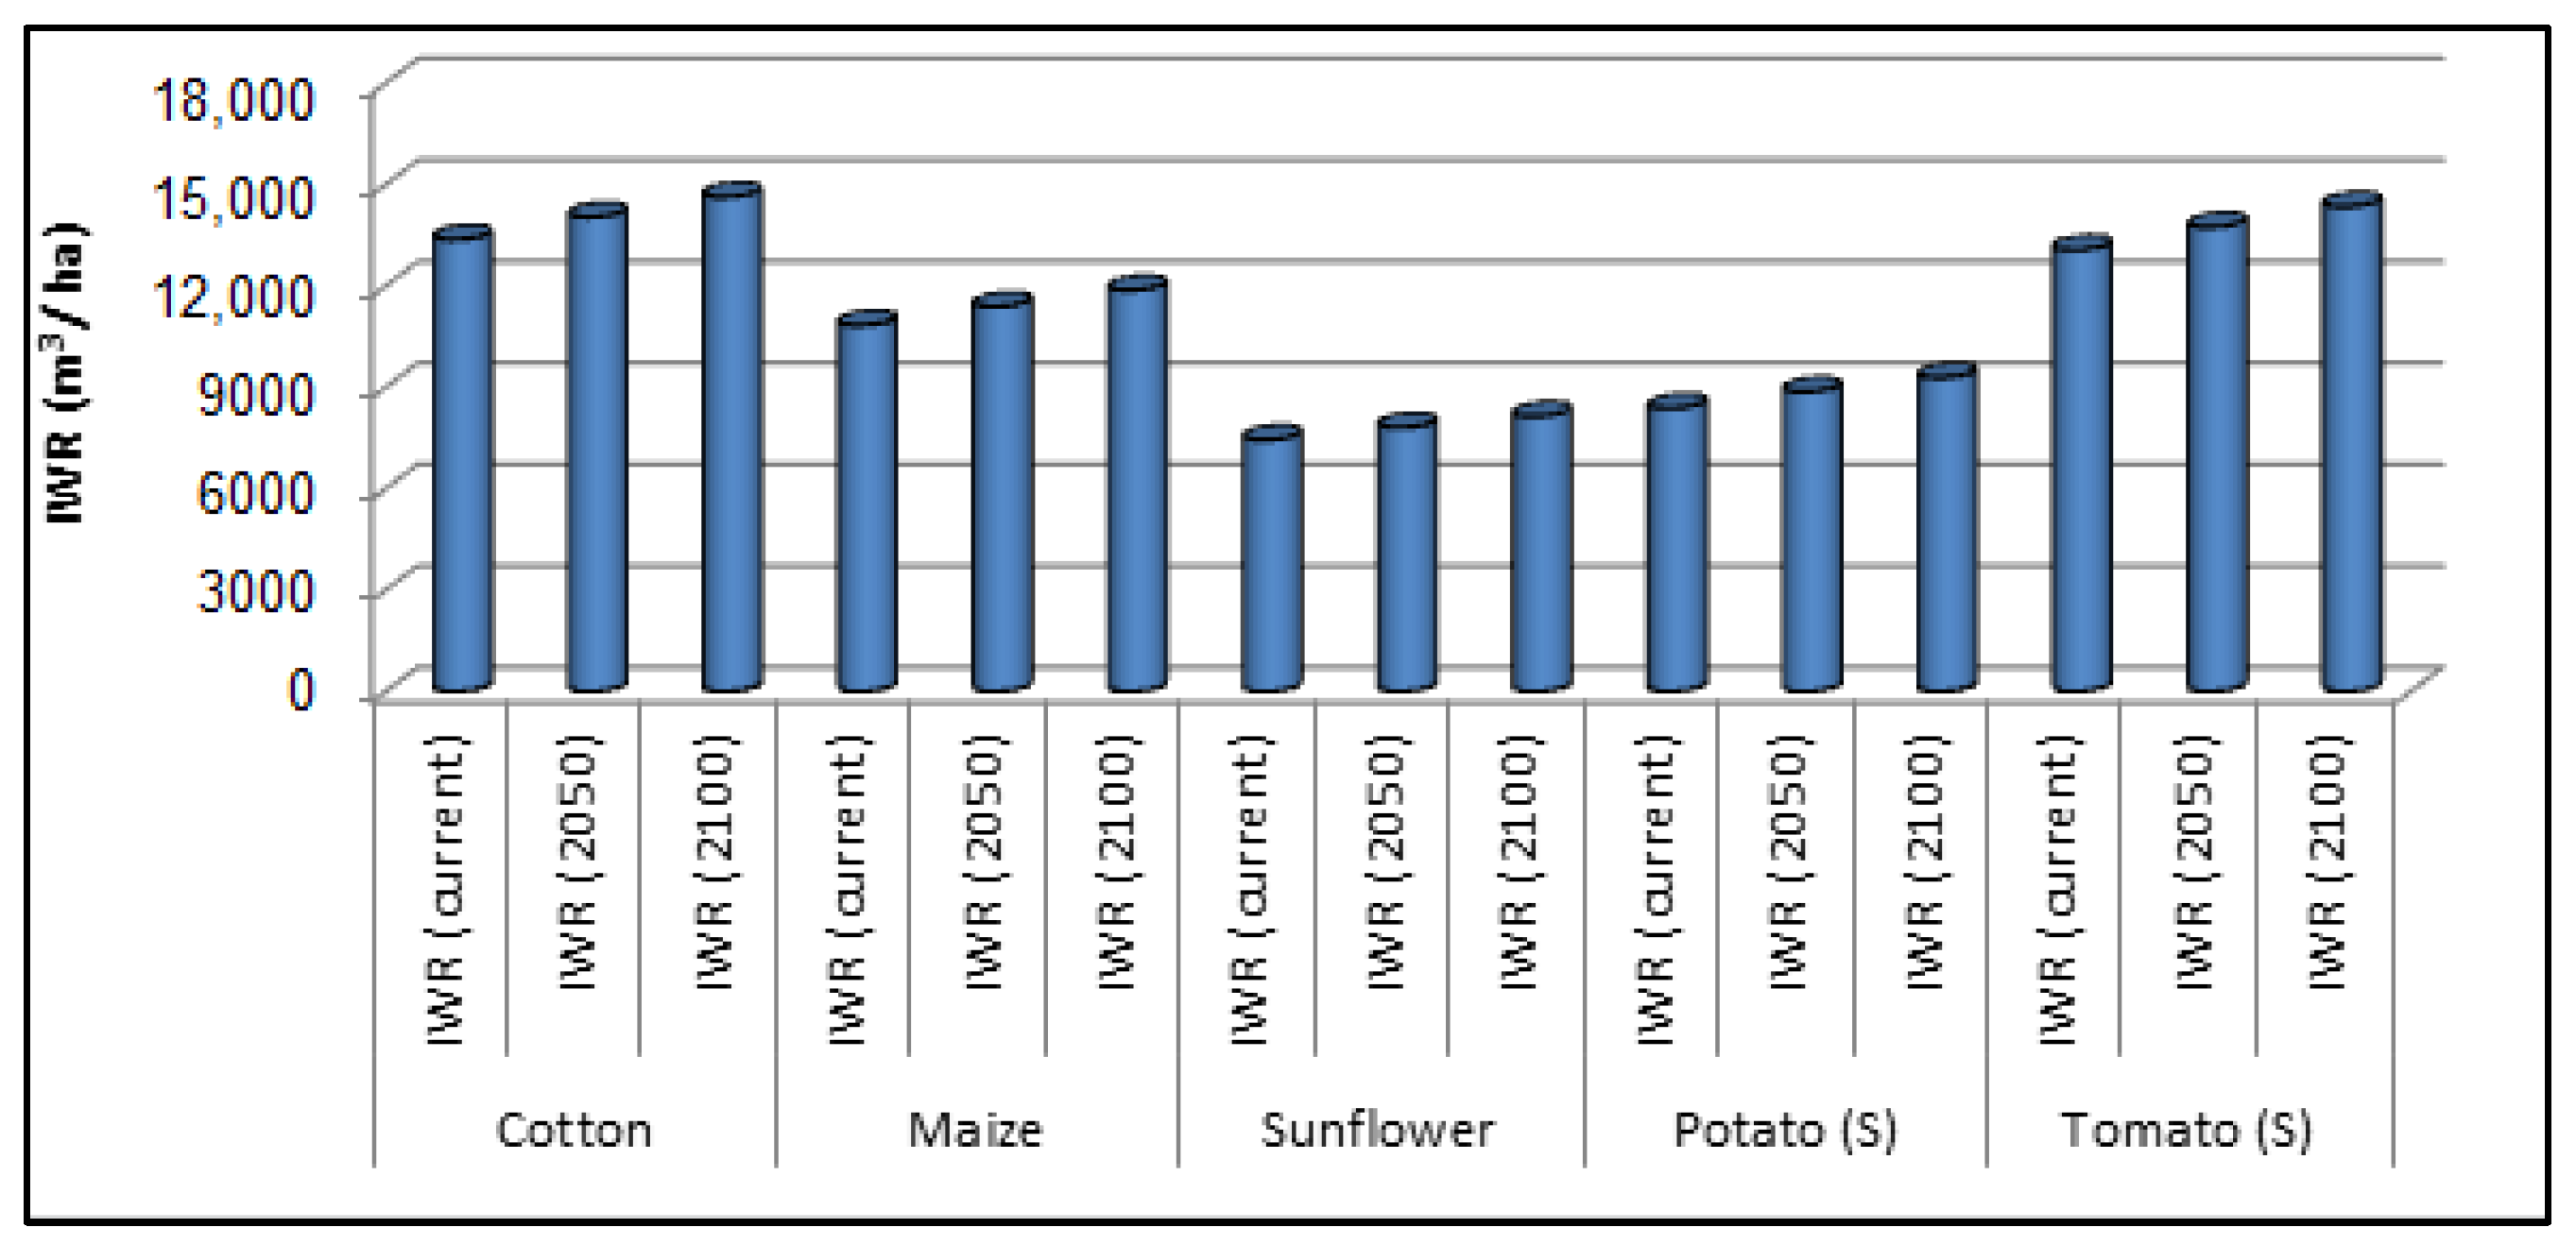
Average values of IWR for summer crops over 30 years are listed in Figure 7. Results under current conditions showed the seasonal IWR ranged between 11,372 and 15,745 m3/ha for cotton; 9362 and 12,517 m3/ha for maize; 6308 and 8790 m3/ha for sunflower; 7002 and 10,400 m3/ha for potato; and 11,180 and 15,535 m3/ha for tomato. However, in 2050, the values varied from 11,888 to 16,538 m3/ha for cotton; 9782 to 13,107 m3/ha for maize; 6585 to 9218 m3/ha for sunflower; 7360 to 10,962 m3/ha for potato; and 11,700 to 16,330 m3/ha for tomato.
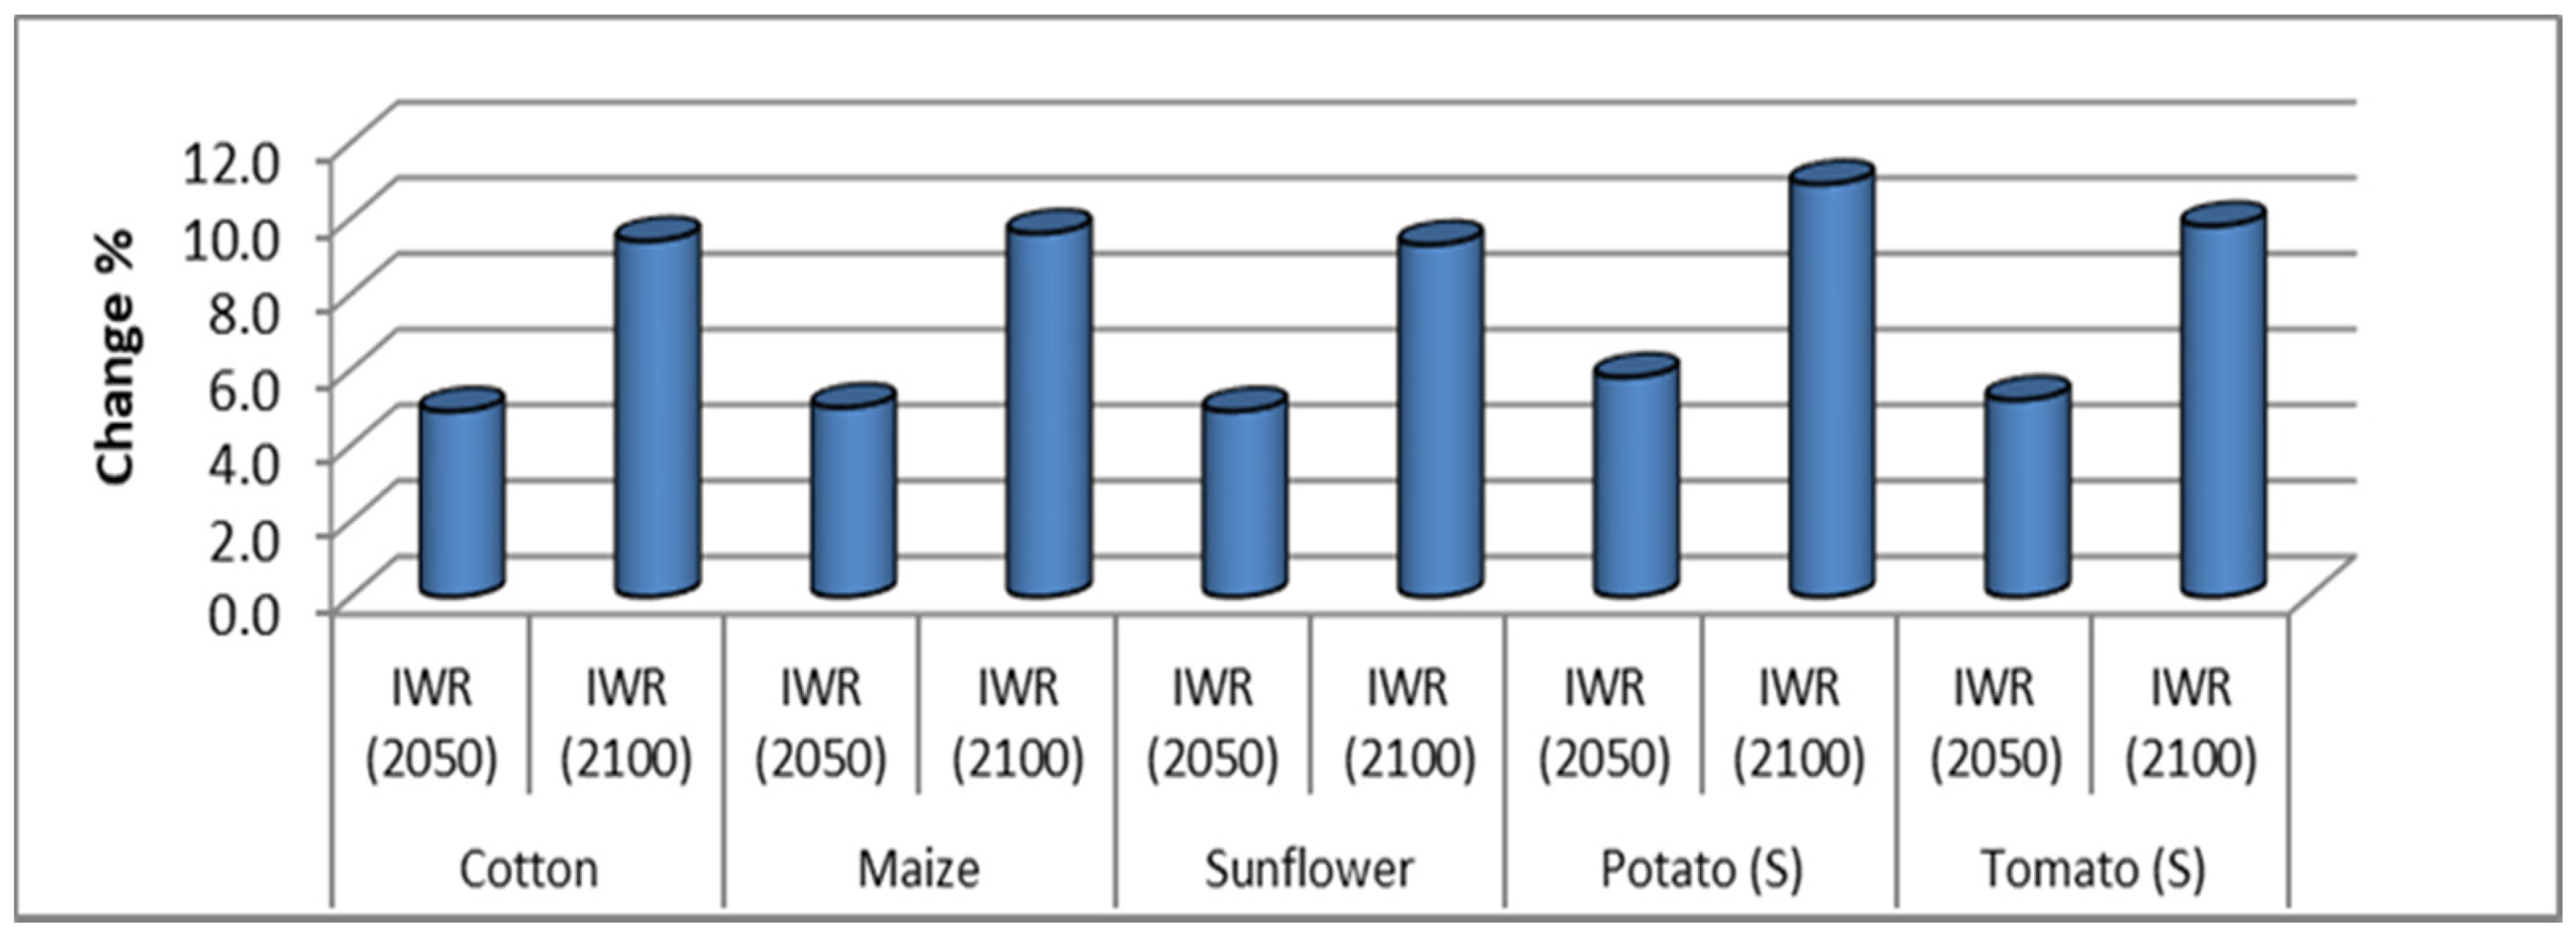
In 2100, they ranged from 12,367 to 17,273 m3/ha for cotton; 10,178 to 13,665 m3/ha for maize; 6842 to 9610 m3/ha for sunflower; 7690 to 11,513 m3/ha for potato; and 12,182 to 17,073 m3/ha for tomato. The change in percentage of IWR increased up to 5.8% in 2050 and 10.9% in 2100 (Figure 8).
4.3.3. Nili Crops
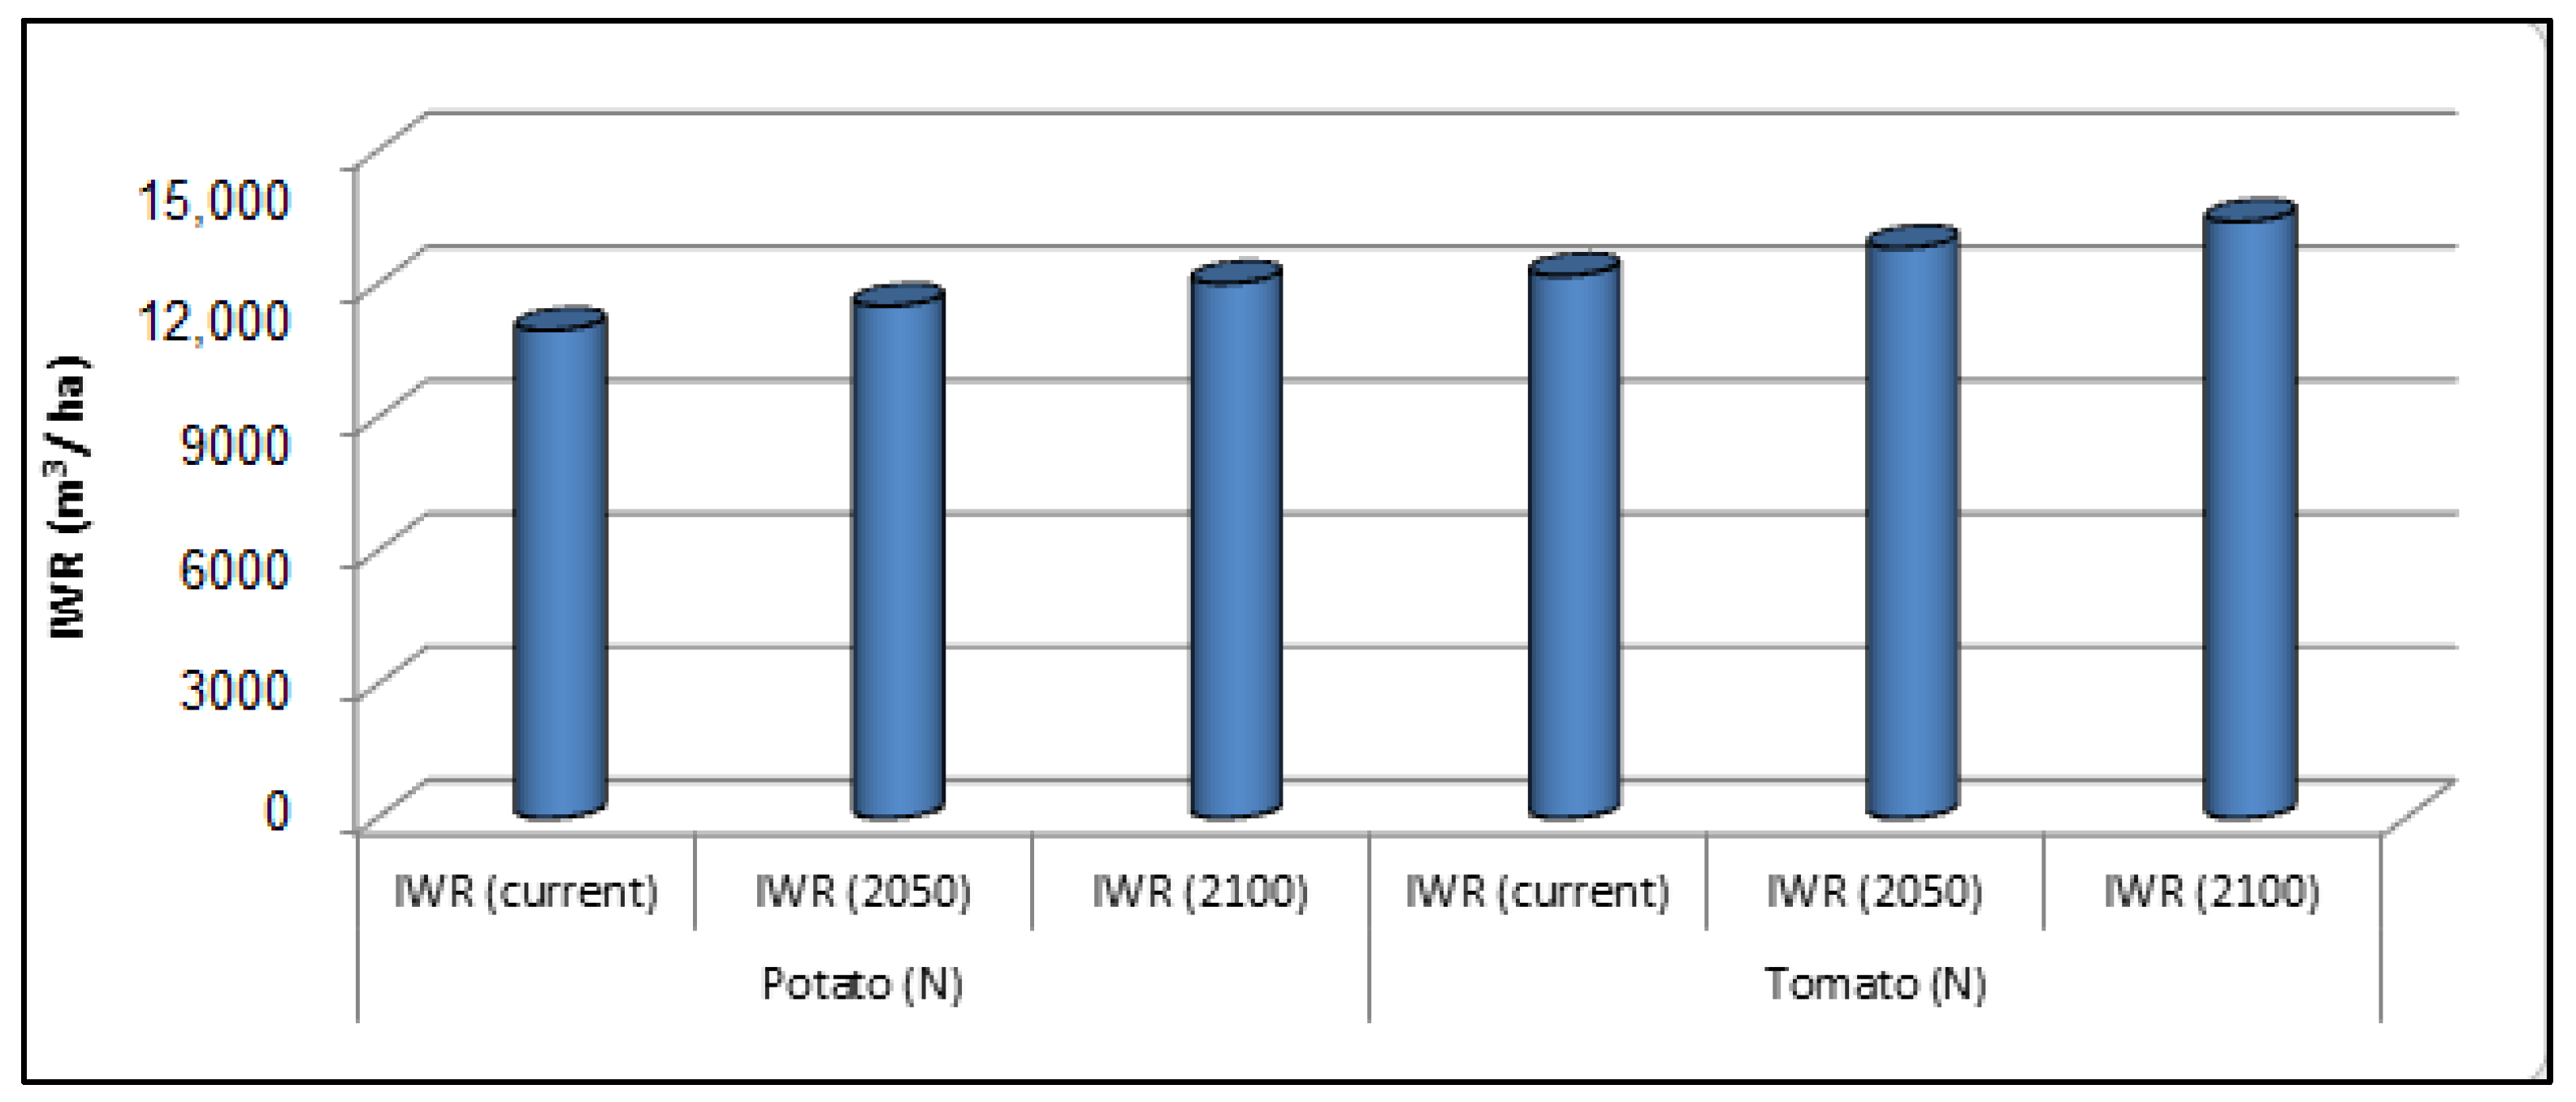
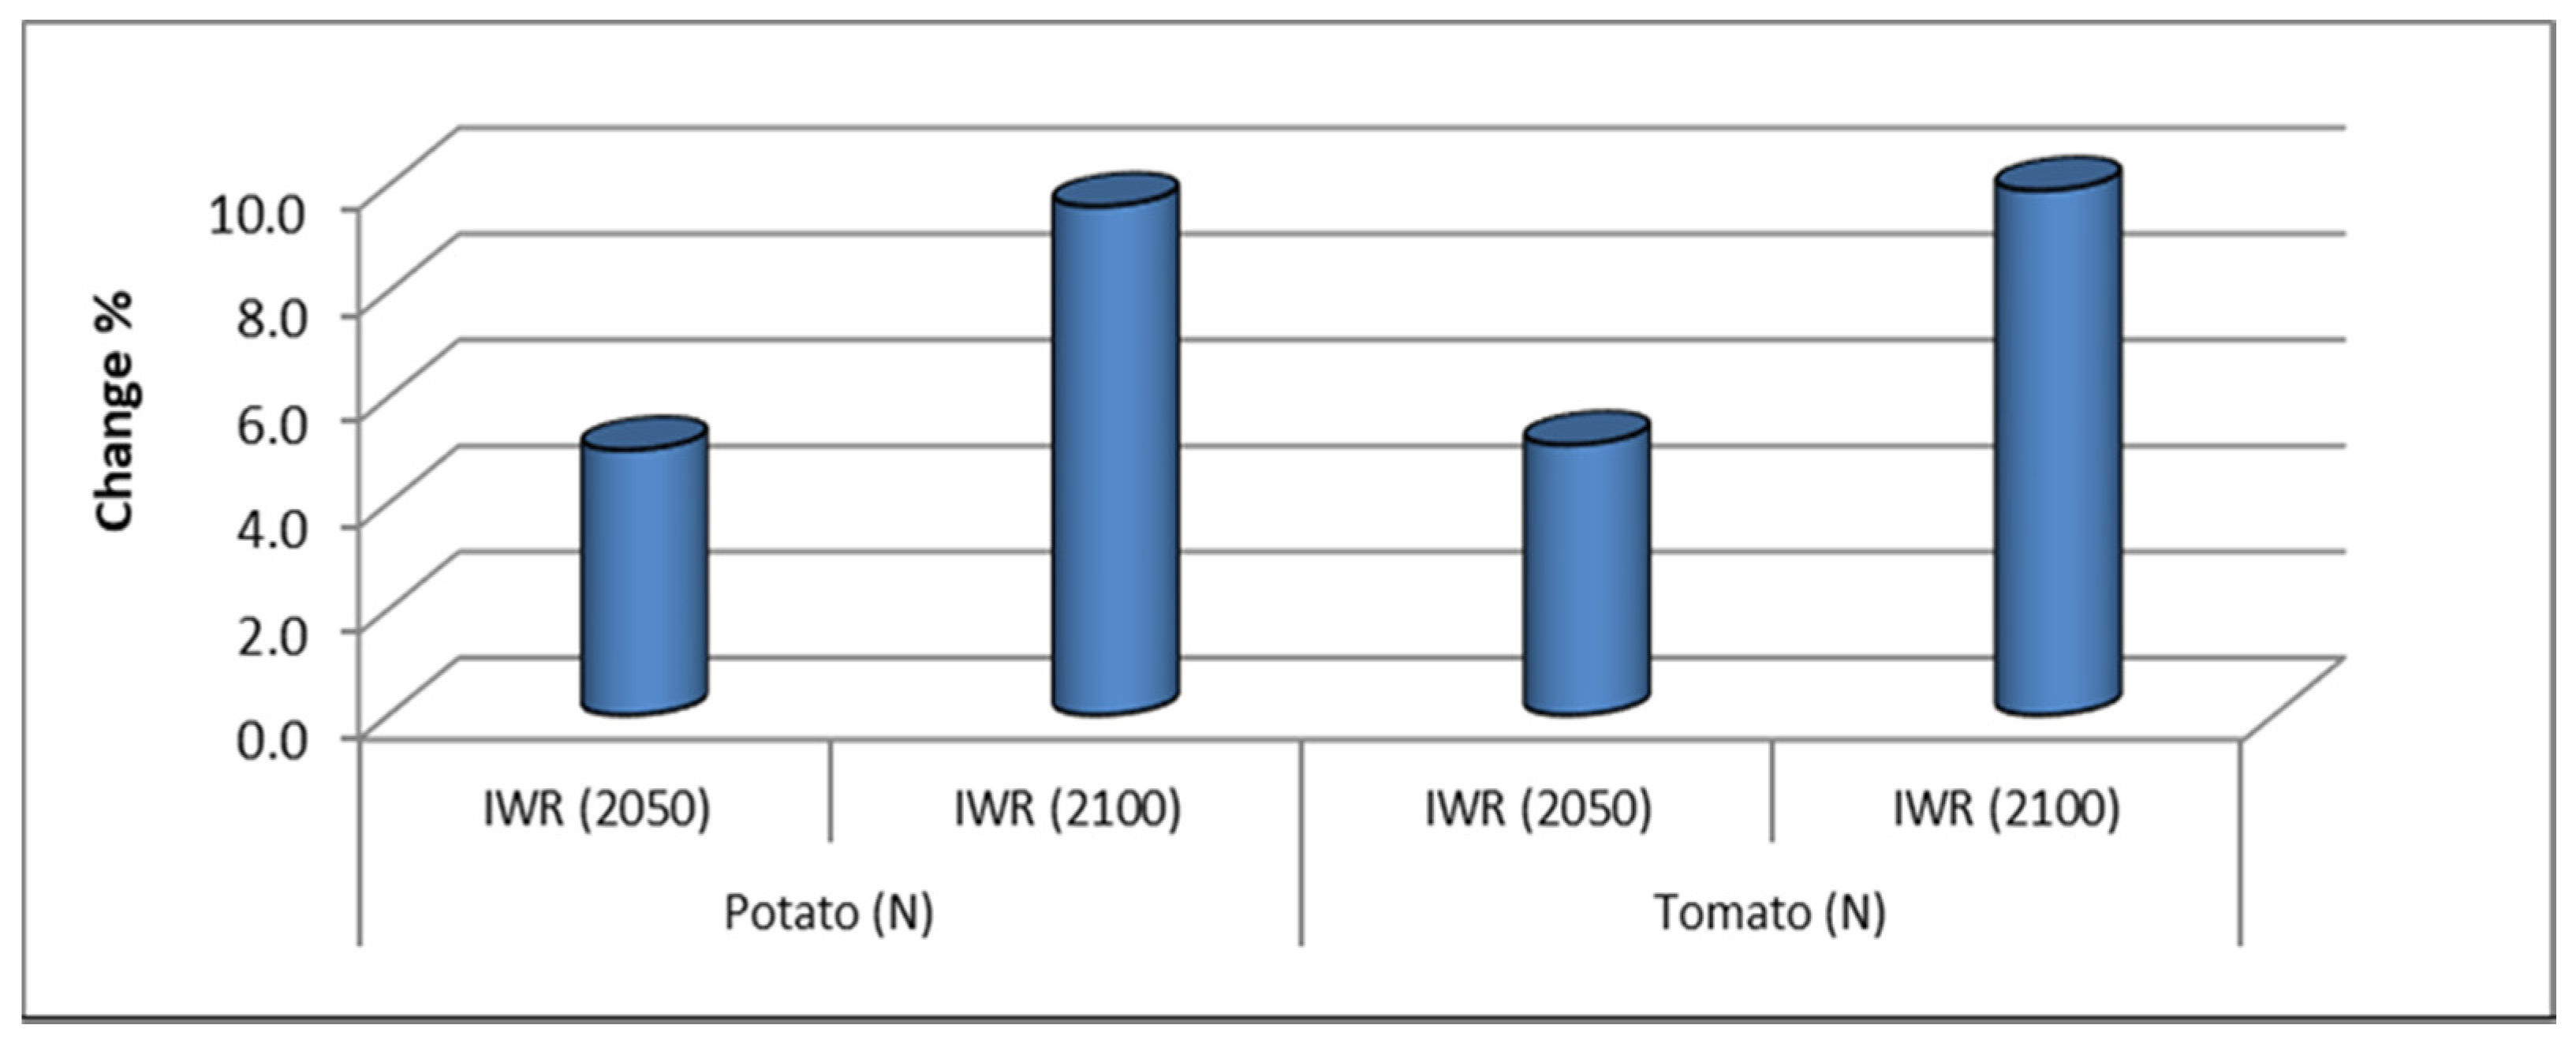
Values of IWR for Nili crops are presented in Figure 9. Results under current conditions revealed that seasonal IWR over three decades ranged from 9520 to 12,602 m3/ha for potato and 10,567 to 14,142 m3/ha for tomato. Concerning the values in 2050, the amounts varied from 9963 to 13,222 m3/ha for potato and 11,077 to 14,858 m3/ha for tomato. In 2100, the values ranged from 10,382 to 13,797 m3/ha for potato and 11,560 to 15,525 m3/ha for tomato. The change in percentage of IWR under climate change compared to current conditions (Figure 10) reached approximately +5% in 2050 and +10% in 2100.
4.4. Total Irrigation Water Requirements (IWR) According to Cropped Area
Results as tabulated in Table 1 and Table 2 indicate total IWR for the crops in the study in the old and new lands under current and climate change conditions according to the total cropped area in 2013/2014 winter season and 2014 summer and Nili seasons.
4.4.1. Old Lands
Results as listed in Table 1 indicated that current total IWR in the old lands registered 11.9, 3.3, 1697.5, 65.7, and 71.5 million m3 for winter crops of barley, faba bean (dry), wheat, potato, and tomato, respectively. However, the total values for the respective crops under climate change recorded 12.7, 3.5, 1802.6, 69.7, and 76.7 million m3 in 2050, and 13.4, 3.7, 1898.4, 73.4, and 81.0 million m3 in 2100. Regarding the summer crops in the old lands, current values for respective crops of cotton, maize, sunflower, potato, and tomato were 140.9, 2887.0, 9.8, 46.4, and 122.6 million m3; 147.9, 3032.6, 10.3, 49.1, and 129.0 million m3 in 2050; and 154.2, 3164.0, 10.7, 51.5, and 134.6 million m3 in 2100. Regarding Nili crops of potato and tomato, total IWR for the two crops were 184.7 and 115.1 million m3 under current conditions; 193.9 and 121.0 million m3 in 2050; and 202.5 and 126.5 million m3 in 2100, respectively.
4.4.2. New Lands
Results shown in Table 2 indicate that the values of total IWR for winter crops of barley, faba bean (dry), wheat, potato, and tomato, respectively, were 3.2, 0.42, 80.8, 2.9, and 32.8 million m3 under current conditions; 3.4, 0.45, 85.8, 3.1, and 35.1 million m3 in 2050; and 3.6, 0.48, 90.3, 3.3, and 37.1 million m3 in 2100. As for summer crops of maize, sunflower, potato, and tomato, respectively, the total amounts listed 78.1, 1.13, 1.85, and 44.8 million m3 for current conditions; 82.0, 1.18, 1.95, and 47.1 million m3 in 2050; and 85.6, 1.23, 2.05, and 49.2 million m3 in 2100. It is worth mentioning that the cotton crop was not sown in the new lands in Middle Egypt, according to the Economic Affairs sector (EAS) Ministry of Agriculture in 2014. Regarding Nili crops, values of total IWR for potato and tomato, respectively, reached 4.1 and 0.34 million m3 under the current conditions; 4.3 and 0.36 million m3 in 2050; and 4.5 and 0.37 million m3 in 2100.
4.4.3. The total Increase in IWR due to Climate Change
Data as tabulated in Table 3 indicate the total IWR under current and climate change conditions. The results represent the total IWR for the studied crops in the old and new lands, according to the total cropped area in 2013/2014.
The results showed that the increase in IWR under future climatic changes compared to current conditions will range from 0.25 million m3 to 150 million m3 in 2050, while the increase will range from 0.48 million m3 to 285 million m3 in 2100.
Increasing temperature results in increased evapotranspiration to lower the temperature of the atmosphere surrounding the plant, so that the plant can perform its vital functions to the fullest; however, if the plant is exposed to water deficit during the high temperature, this will affect its activity and vitality, as it affects the process of photosynthesis, and thus decrease its production. Chowdhury et al. [25] indicated that, on an average, 1 °C increase in temperature may increase the overall crop water requirements (CWR) by 2.9% in Al-Jouf, Saudi Arabia.
In the same way, Radwan [26] showed that Egypt is one of the countries affected by climate change effects, within its borders and outside its borders, within the whole Nile Basin. The River Nile is expected to be severely reduced.
5. Conclusions
Although Egypt has limited water resources, climate change will put greater pressure on this important resource. Therefore, all efforts must be made to preserve every water droplet. As the agriculture sector consumes the largest amount of water resources, this sector must apply all agricultural practices that will rationalize water and raise the efficiency of irrigation at the field level; this will maximize the utilization, maintenance, and sustainability of every drop of water. The objectives of this study are to assess the climate change impact on water resources and the necessities of the agriculture sector from water resources under future conditions. The current study was carried out in the Middle Egypt region. Two models were used in the present study: the first is a climate model called MAGICC/SCENGEN model, and the second is an irrigation model named CROPWAT. The results of the climate model showed that increasing the concentration of the emission of global greenhouse gas would affect the average temperature of the earth’s surface, and it would increase at different degrees. The rate of rise in temperature at the regional level (study area) will reach about 2.12 °C by 2050, and 3.96 °C by 2100. Future climatic changes will require more irrigation water to cover the actual demands of crops. The percentage of increase in irrigation water demands for winter crops under study ranged from 6.1 to 7.3% in 2050 and from 11.7 to 13.2% in 2100. At the same time, the increase in irrigation water needs for summer crops ranged from 4.9 to 5.8% in 2050 and from 9.3 to 10.9% in 2100. For Nili crops, the increase ranged from 5.0 to 5.1% in 2050 and from 9.6 to 9.9% in 2100. The increase in IWR under future climatic changes compared to current conditions (according to the total cropped area in the old and new lands in 2013/2014) will range from 0.25 to 150 million m3 in 2050, and from 0.48 to 285 million m3 in 2100.
Author Contributions
Conceptualization, S.M.M., M.Z., and O.W.; methodology, W.Y.E.-N., S.M.E.-M., and H.F.A.-E.; validation, S.M.M. and S.M.E.-M.; formal analysis, M.Z. and H.F.A.-E.; investigation, S.M.M.; data curation H.F.A.-E. and W.Y.E.-N.; writing—original draft preparation, S.M.M. and H.F.A.-E.; writing—review and editing H.F.A.-E. and M.Z.; supervision, M.Z.; project administration, O.W.; funding acquisition, M.Z. All authors have read and agreed to the published version of the manuscript.
Funding
This work was supported by project of the Ministry of Education of the Slovak Republic VEGA 1/0308/20 Mitigation of hydrological hazards, floods and droughts by exploring extreme hydroclimatic phenomena in river basins and project HUSKROUA/1702/6.1/0072 Environmental Assessment for Natural Resources Revitalization in Solotvyno to prevent the further pollution of the Upper-Tisza Basin through the preparation of a complex monitoring system.
Institutional Review Board Statement
Not applicable.
Informed Consent Statement
Not applicable.
Data Availability Statement
Not applicable.
Conflicts of Interest
The authors declare no conflict of interest.
References
- Hammond, M. The Grand Ethiopian Renaissance Dam and the Blue Nile: Implications for Transboundary Water Governance; Discussion Paper 1307; Global Water Forum: Canberra, Australia, 2013. [Google Scholar]
- Cunha, A.D.; Coelho, A.B.; Féres, J.G.; Braga, M.J. Effects of Climate Change on Irrigation Adoption in Brazil; Acta Scientiarum: Rio de Janeiro, Brazil, 2014. [Google Scholar]
- Fader, S.; Bloh, W.; Bondeau, A.; Cramer, W. Mediterranean irrigation under climate change: More efficient irrigation needed to compensate for increases in irrigation water requirements. Hydrol. Earth Syst. Sci. 2016, 20, 953–973. [Google Scholar] [CrossRef] [Green Version]
- Rolim, J.; Teixeira, J.; Catalão, J.; Shahidian, S. The Impacts of Climate Change on Irrigated Agriculture in Southern Portugal. Irrig. Drain. 2017. [Google Scholar] [CrossRef]
- Kakumanu, K.R.; Kaluvai, Y.R.; Nagothu, U.S.; Lati, N.R.; Kotapati, G.R.; Karanam, S. Building Farm-Level Capacities In Irrigation Water Management To Adapt To Climate Change. Irrig. Drain. 2018. [Google Scholar] [CrossRef]
- Bocci, M.; Smanis, T. Assessment of the impacts of Climate Change on the Agriculture Sector in the Southern Mediterranean. Union-For-The-Mediterranean, A DGNEAR Project Led by Atkins Together with Pescares Italia Srl, GIZ and SML. 2019. Available online: https://ufmsecretariat.org/wp-content/uploads/2019/04/Climate-Change-impact-on-Agriculture.pdf (accessed on 22 December 2020).
- Ritchie, H.; Roser, M. CO2 and Greenhouse Gas Emissions. OurWorldInData.org. August 2020. Available online: https://ourworldindata.org/co2-and-other-greenhouse-gas-emissions (accessed on 15 January 2021).
- Schilling, J.; Hertig, E.; Tramblay, Y.; Scheffran, J. Climate Change Vulnerability, Water Resources and Social Implications in North Africa. Regional Environmental Change; Springer: Berlin/Heidelberg, Germany, 2020; Volume 20. [Google Scholar] [CrossRef] [Green Version]
- Driouech, F.; ElRhaz, K.; Moufouma-Okia, W.; Arjdal, K.; Balhane, S. Assessing Future Changes of Climate Extreme Events in the CORDEX-MENA Region Using Regional Climate Model ALADIN-Climate. Earth Syst. Environ. 2020, 4, 477–492. [Google Scholar] [CrossRef]
- Zittis, G.; Hadjinicolaou, P.; Almazroui, M.; Bucchignani, E.; Driouech, F.; El Rhaz, K.; Kurnaz, L.; Nikulin, G.; Ntoumos, A.; Ozturk, T.; et al. Business-as-usual will lead to super and ultra-extreme heatwaves in the Middle East and North Africa. NPJ Clim. Atmos. Sci. 2021, 4, 20. [Google Scholar] [CrossRef]
- Valipour, M.; Bateni, S.; Jun, C. Global Surface Temperature: A New Insight. Climate 2021, 9, 81. [Google Scholar] [CrossRef]
- El-Ramady, H.R.; El-Marsafawy, S.M.; Lewis, L.N. Sustainable Agriculture and Climate Changes in Egypt; INRA-CMSE-PME, UMR1347; Springer: Berlin/Heidelberg, Germany, 2013. [Google Scholar]
- El-Din, M.M.N. Climate Change Risk Management in Egypt; UNESCO-Cairo Office: Cairo, Egypt, 2013. [Google Scholar]
- Sadik, A.; El-Solh, M.; Saab, N. Arab Environment 7, FOOD Security, Challenges and Prospects. Annual Report of the Arab Forum for Environment & Development; AFED: Beirut, Lebanon, 2014. [Google Scholar]
- El Agroudy, N.; Shafiq, F.; Mokhtar, S. The Impact of Establishing the Ethiopian Dam Renaissance on Egypt. J. Basic Appl. 2014, 4, 1–5. [Google Scholar]
- Mahmoud, M.A.; El-Bably, A.Z. Crop Water Requirements and Irrigation Efficiencies in Egypt. Conventional Water Resources and Agriculture in Egypt; Springer: Berlin/Heidelberg, Germany, 2019. [Google Scholar]
- Wigley, T. MAGICC/SCENGEN 5.3: USER MANUAL (Version 2). National Center for Atmospheric Research, Boulder, CO 80307. Version 1, June 2008 Version 2, September 2008. 2008. Available online: http://www.cgd.ucar.edu/cas/wigley/magicc/UserMan5.3.v2.pdf (accessed on 12 January 2021).
- Robinson, S.; d’Croz, D.M.; Islam, S.; Sulser, T.B.; Robertson, R.D.; Zhu, T.; Gueneau, A.; Pitois, G.; Rosegrant, M.W. The International Model for Policy Analysis of Agricultural Commodities and Trade (IMPACT): Model Description for Version 3. Available online: https://www.ifpri.org/publication/international-model-policy-analysis-agricultural-commodities-and-trade-impact-0 (accessed on 12 June 2020).
- Fordham, D.A.; Wigley, T.M.L.; Watts, M.J.; Brook, B.W. Strengthening forecasts of climate change impacts with multi-model ensemble averaged projections using MAGICC/SCENGEN 5.3. Ecography 2012, 35, 4–8. [Google Scholar] [CrossRef]
- Allen, R.G.; Pereira, L.S.; Raes, D.; Smith, M. Crop evapotranspiration: Guide-lines for computing crop water requirements. In FAO Irrigation and Drainage Paper No. 56; FAO: Rome, Italy, 1998; 300p. [Google Scholar]
- Jensen, M.E. Design and Operation of Farm Irrigation System; (ASAE Monograph, No. 3); American Society of Agricultural Engineers: St. Joseph, MI, USA, 1980. [Google Scholar]
- Nakicenovic, N.; Swart, R. Special Report of Working Group III of the Intergovernmental Panel on Climate Change. In Published for the Intergovernmental Panel on Climate Change; Cambridge University Press: Cambridge, UK, 2000. [Google Scholar]
- IPCC Report. Chapter 5: Food Security—IPCC SRCCL. In Final Government Distribution; 2019; Available online: https://www.ipcc.ch/site/assets/uploads/2019/08/2f.-Chapter-5_FINAL.pdf (accessed on 10 August 2020).
- Santer, B.D.; Wigley, T.M.L.; Schlesinger, M.E.; Mitchell, J.F.B. Developing climate scenarios from equilibrium GCM results. Max Planck Inst. Meteorol. Tech. Rep. 1990, 47, 29. [Google Scholar]
- Chowdhury, S.; Al-Zahrani, M.; Abbas, A. Implications of climate change on crop water requirements in arid region: An example of Al-Jouf, Saudi Arabia. J. King Saud Univ. Eng. Sci. 2016, 28, 21–31. [Google Scholar] [CrossRef] [Green Version]
- Radwan, G.; Ellah, A. Water resources in Egypt and their challenges, Lake Nasser case study. Egypt. J. Aquat. Res. 2020, 46, 1–12. [Google Scholar]
- Khordagui, H. Climate change in ESCWA region: Reasons for concern. In Proceedings of the Expert Group Meeting on Trade and Environment Priorities in the Arab Region, Cairo, Egypt, 11–13 November 2007. [Google Scholar]
- IPCC. Climate Change 2007: The Physical Science Basis, Summary for Policy Makers. Contribution of Working Group 1 to the Fourth Assessment Report of the Intergovernmental Panel on Climate Change, WMO; UNEP: Nairobi, Kenya, 2007; 18p. [Google Scholar]
Figure 1.
Location map of the study area.

Figure 2.
Structure and flow of the MAGICC/SCENGEN software. Elliptical shapes are used to highlight user defined model parameters, Fordham et al. doi:10.1111/j.1600-0587.2011.07398.x. [19].
Figure 2.
Structure and flow of the MAGICC/SCENGEN software. Elliptical shapes are used to highlight user defined model parameters, Fordham et al. doi:10.1111/j.1600-0587.2011.07398.x. [19].

Figure 3.
Change in annual mean temperature in 2050 at the regional level at latitude 27.5° N–30.0° N and longitude 30.0° E–32.5° E.
Figure 3.
Change in annual mean temperature in 2050 at the regional level at latitude 27.5° N–30.0° N and longitude 30.0° E–32.5° E.

Figure 4.
Change in annual mean temperature in 2100 at the regional level at latitude 27.5° N–30.0° N and longitude 30.0° E–32.5° E.
Figure 4.
Change in annual mean temperature in 2100 at the regional level at latitude 27.5° N–30.0° N and longitude 30.0° E–32.5° E.

Figure 5.
Average irrigation water requirements (IWR) for some main winter crops in Middle Egypt under current and climate change conditions over 30 years.
Figure 5.
Average irrigation water requirements (IWR) for some main winter crops in Middle Egypt under current and climate change conditions over 30 years.

Figure 6.
Change percentage in irrigation water requirements (IWR) for some main winter crops in Middle Egypt under climate change conditions compared to current conditions.
Figure 6.
Change percentage in irrigation water requirements (IWR) for some main winter crops in Middle Egypt under climate change conditions compared to current conditions.

Figure 7.
Average irrigation water requirements (IWR) for some main summer crops in Middle Egypt under current and climate change conditions over 30 years.
Figure 7.
Average irrigation water requirements (IWR) for some main summer crops in Middle Egypt under current and climate change conditions over 30 years.

Figure 8.
Change percentage in irrigation water requirements (IWR) for some main summer crops in Middle Egypt under climate change conditions compared to current conditions.
Figure 8.
Change percentage in irrigation water requirements (IWR) for some main summer crops in Middle Egypt under climate change conditions compared to current conditions.

Figure 9.
Average irrigation water requirements (IWR) for some Nili crops in Middle Egypt under current and climate change conditions over 30 years.
Figure 9.
Average irrigation water requirements (IWR) for some Nili crops in Middle Egypt under current and climate change conditions over 30 years.

Figure 10.
Change percentage in irrigation water requirements (IWR) for some Nili crops in Middle Egypt under climate change conditions compared to current conditions.
Figure 10.
Change percentage in irrigation water requirements (IWR) for some Nili crops in Middle Egypt under climate change conditions compared to current conditions.


Table 1.
Total irrigation water requirements (IWR, m3) for some main crops in the old lands of Middle Egypt under current and climate change conditions.
Table 1.
Total irrigation water requirements (IWR, m3) for some main crops in the old lands of Middle Egypt under current and climate change conditions.
| Crop | Area (ha) * | IWR (Current) | Total IWR (Current) | IWR (2050) | Total IWR (2050) | IWR (2100) | Total IWR (2100) | |
|---|---|---|---|---|---|---|---|---|
| Winter crops | Barley | 2488 | 4777 | 11,885,176 | 5090 | 12,664,611 | 5377 | 13,378,252 |
| Faba bean (dry) | 654 | 5023 | 3,284,969 | 5358 | 3,503,950 | 5667 | 3,706,327 | |
| Wheat | 251,939 | 6738 | 1,697,467,006 | 7155 | 1,802,567,559 | 7535 | 1,898,444,345 | |
| Potato | 11,393 | 5764 | 65,672,417 | 6113 | 69,650,473 | 6439 | 73,355,096 | |
| Tomato | 11,767 | 6076 | 71,494,331 | 6520 | 76,723,455 | 6881 | 80,964,151 | |
| Summer crops | Cotton | 10,538 | 13,373 | 140,919,405 | 14,034 | 147,887,950 | 14,631 | 154,185,576 |
| Maize | 266,390 | 10,837 | 2,886,957,227 | 11,384 | 3,032,554,161 | 11,877 | 3,163,958,428 | |
| Sunflower | 1320 | 7445 | 9,827,400 | 7810 | 10,308,613 | 8138 | 10,742,453 | |
| Potato | 5540 | 8379 | 46,419,352 | 8865 | 49,114,562 | 9288 | 51,456,136 | |
| Tomato | 9387 | 13,062 | 122,611,951 | 13,740 | 128,977,902 | 14,344 | 134,643,999 | |
| Nili crops | Potato | 16,839 | 10,970 | 184,720,088 | 11,514 | 193,875,827 | 12,025 | 202,497,020 |
| Tomato | 9435 | 12,199 | 115,098,613 | 12,822 | 120,972,425 | 13,411 | 126,531,213 | |
* Source of data: Economic Affairs sector (EAS)—Bulletin of Important indicators of the Agricultural Statistics, Volumes No. 2013–2014. Ministry of Agriculture and Land Reclamation.
Table 2.
Total irrigation water requirements (IWR, m3) for some main crops in the new lands of Middle Egypt under current and climate change conditions.
Table 2.
Total irrigation water requirements (IWR, m3) for some main crops in the new lands of Middle Egypt under current and climate change conditions.
| Crop | Area (ha) * | IWR (Current) | Total IWR (Current) | IWR (2050) | Total IWR (2050) | IWR (2100) | Total IWR (2100) | |
|---|---|---|---|---|---|---|---|---|
| Winter crops | Barley | 834 | 3821 | 3,186,992 | 4072 | 3,396,233 | 4302 | 3,587,609 |
| Faba bean (dry) | 112 | 3768 | 421,960 | 4018 | 450,049 | 4250 | 476,042 | |
| Wheat | 14,983 | 5391 | 80,768,359 | 5724 | 85,760,028 | 6028 | 90,321,519 | |
| Potato | 676 | 4324 | 2,922,855 | 4585 | 3,099,516 | 4829 | 3,264,376 | |
| Tomato | 7187 | 4558 | 32,754,753 | 4890 | 35,145,628 | 5160 | 37,088,214 | |
| Summer crops | Cotton | 0 | 10,030 | 0 | 10,525 | 0 | 10,974 | 0 |
| Maize | 9608 | 8128 | 78,089,020 | 8538 | 82,032,303 | 8908 | 85,586,863 | |
| Sunflower | 202 | 5584 | 1,127,918 | 5857 | 1,183,148 | 6104 | 1,232,941 | |
| Potato | 294 | 6284 | 1,847,423 | 6649 | 1,954,831 | 6966 | 2,048,029 | |
| Tomato | 4569 | 9796 | 44,759,066 | 10,305 | 47,083,735 | 10,758 | 49,152,160 | |
| Nili crops | Potato | 500 | 8228 | 4,113,750 | 8635 | 4,317,563 | 9019 | 4,509,554 |
| Tomato | 37 | 9149 | 338,504 | 9616 | 355,801 | 10,058 | 372,151 | |
* Source of data: Economic Affairs sector (EAS)—Bulletin of Important indicators of the Agricultural Statistics, Volumes No. 2013–2014. Ministry of Agriculture and Land Reclamation.
Table 3.
Increase required in irrigation water under the conditions of future climatic changes compared to current irrigation water amounts according to the total cropped area in 2013/2014.
Table 3.
Increase required in irrigation water under the conditions of future climatic changes compared to current irrigation water amounts according to the total cropped area in 2013/2014.
| Crop | Total IWR (Current) | Total IWR (2050) | Amount of Excess of IW | Total IWR (2100) | Amount of Excess of IW | |
|---|---|---|---|---|---|---|
| Winter crops | Barley | 15,072,168 | 16,060,844 | 988,676 | 16,965,861 | 1,893,693 |
| Faba bean | 3,706,929 | 3,953,999 | 247,070 | 4,182,369 | 475,440 | |
| Wheat | 1,778,235,364 | 1,888,327,587 | 110,092,223 | 1,988,765,864 | 210,530,500 | |
| Potato | 68,595,272 | 72,749,989 | 4,154,717 | 76,619,472 | 8,024,200 | |
| Tomato | 104,249,083 | 111,869,083 | 7,619,999 | 118,052,365 | 13,803,282 | |
| Summer crops | Cotton | 140,919,405 | 147,887,950 | 6,968,545 | 154,185,576 | 13,266,171 |
| Maize | 2,965,046,247 | 3,114,586,464 | 149,540,218 | 3,249,545,291 | 284,499,045 | |
| Sunflower | 10,955,318 | 11,491,761 | 536,444 | 11,975,394 | 1,020,077 | |
| Potato | 48,266,775 | 51,069,393 | 2,802,618 | 53,504,164 | 5,237,389 | |
| Tomato | 167,371,017 | 176,061,637 | 8,690,620 | 183,796,159 | 16,425,142 | |
| Nili crops | Potato | 188,833,838 | 198,193,389 | 9,359,551 | 207,006,574 | 18,172,736 |
| Tomato | 115,437,117 | 121,328,226 | 5,891,109 | 126,903,363 | 11,466,246 | |
Publisher’s Note: MDPI stays neutral with regard to jurisdictional claims in published maps and institutional affiliations. |
© 2021 by the authors. Licensee MDPI, Basel, Switzerland. This article is an open access article distributed under the terms and conditions of the Creative Commons Attribution (CC BY) license (https://creativecommons.org/licenses/by/4.0/).
Share and Cite
MDPI and ACS Style
Mostafa, S.M.; Wahed, O.; El-Nashar, W.Y.; El-Marsafawy, S.M.; Zeleňáková, M.; Abd-Elhamid, H.F. Potential Climate Change Impacts on Water Resources in Egypt. Water 2021, 13, 1715. https://doi.org/10.3390/w13121715
AMA Style
Mostafa SM, Wahed O, El-Nashar WY, El-Marsafawy SM, Zeleňáková M, Abd-Elhamid HF. Potential Climate Change Impacts on Water Resources in Egypt. Water. 2021; 13(12):1715. https://doi.org/10.3390/w13121715
Chicago/Turabian StyleMostafa, Soha M., Osama Wahed, Walaa Y. El-Nashar, Samia M. El-Marsafawy, Martina Zeleňáková, and Hany F. Abd-Elhamid. 2021. "Potential Climate Change Impacts on Water Resources in Egypt" Water 13, no. 12: 1715. https://doi.org/10.3390/w13121715
Note that from the first issue of 2016, this journal uses article numbers instead of page numbers. See further details here.