
Interactions between Tandem Cylinders in an Open Channel: Impact on Mean and Turbulent Flow Characteristics

1
Department of Water Resources Engineering, Bangladesh University of Engineering and Technology, Dhaka 1000, Bangladesh
2
Department of Civil and Environmental Engineering, Clarkson University, Potsdam, NY 13699, USA
*
Author to whom correspondence should be addressed.
Water 2021, 13(13), 1718; https://doi.org/10.3390/w13131718
Submission received: 5 May 2021
/
Revised: 15 June 2021
/
Accepted: 18 June 2021
/
Published: 22 June 2021
(This article belongs to the Section Hydraulics and Hydrodynamics)
Abstract
:The flow hydrodynamics around a single cylinder differ significantly from the flow fields around two cylinders in a tandem or side-by-side arrangement. In this study, the experimental results on the mean and turbulence characteristics of flow generated by a pair of cylinders placed in tandem in an open-channel flume are presented. An acoustic Doppler velocimeter (ADV) was used to measure the instantaneous three-dimensional velocity components. This study investigated the effect of cylinder spacing at 3D, 6D, and 9D (center to center) distances on the mean and turbulent flow profiles and the distribution of near-bed shear stress behind the tandem cylinders in the plane of symmetry, where D is the cylinder diameter. The results revealed that the downstream cylinder influenced the flow development between cylinders (i.e., midstream) with 3D, 6D, and 9D spacing. However, the downstream cylinder controlled the flow recirculation length midstream for the 3D distance and showed zero interruption in the 6D and 9D distances. The peak of the turbulent metrics generally occurred near the end of the recirculation zone in all scenarios.
1. Introduction
Cylinders in tandem or side-by-side arrangements provide the simplest configurations of multiple slender structures in engineering projects (e.g., bridge piers, offshore and onshore structures, oil and gas pipelines, power lines, high-rise buildings, fish habitat structures, and flow past vegetation) [1,2]. Therefore, the hydrodynamic interference between two cylinders provides a good model for gaining insight into the complex flow characters around more cylinders, and has drawn considerable interest from researchers [3,4].
The significance of fluid flow around a single infinite/finite cylinder has been investigated for decades and has been widely studied in the literature [3]. Understanding the flow field around a single cylinder is not sufficient for understanding the interactions between cylinders in various configurations [2] that are encountered in practice. The flow characteristics over a single cylinder differ significantly from the flow field downstream of two cylinders due to the interaction between the individual cylinders [4]. Nosier et al. [3] highlighted that the interaction between cylinders affects the flow behavior and vortex shedding and, consequently, the forces acting upon the cylinders. A distinct flow pattern was observed when changing the finite cylinder’s height, differing from the infinite cylinder case [5,6,7]. The generated tip vortex structures near the free end of the submerged cylinder influence the near/far wake flow fields [3].
Since the earliest study by Zdravkovich [8], several numerical ([4,9,10], among others) and experimental studies [1,3,11,12] have investigated the flow passing through the infinite cylinders in a tandem arrangement with low to high Reynolds numbers (an in-depth review is provided by Heidari [2]). They found that the flow field in tandem cylinders is significantly influenced by the Reynolds number and the gap ratio (L/D), where L is the distance between two cylinders (center to center, c/c) and D is the diameter of the cylinder. Several studies (e.g., [1,12] for 1.5 < L/D > 6 at ReD = 800–42,000) reported three flow regimes: the extended-body regime (L/D < 2, vortex street far behind the downstream cylinder), the reattachment regime (L/D = 2–5, shed vortices from upstream cylinder formed just behind the downstream cylinder), and the co-shedding regime (L/D > 5, where each cylinder sheds its own von Kármán vortices individually). The studies mentioned so far focused on the effects of cylinder spacing and Reynolds number on vortex development and movement in the wake.
Previous investigations have improved our understanding of the flow field around wall-mounted cylinders in a tandem arrangement. However, many issues remain unresolved. For example: How do the detailed mean and turbulent flow profiles and their development behind the tandem cylinders depend on L/D? Are the flow fields behind the cylinders at L/D = 3 and 6 different from that at L/D = 9? What is the distribution of near-bed shear stress behind the cylinders at different values of L/D? Therefore, to provide a better physical understanding, the key goal of this study was to experimentally investigate the flow characteristics around emergent cylinders in a tandem arrangement. In meeting this study’s goal, one objective was to study the effect of L/D on the mean and turbulent flow profiles behind the tandem cylinders in the plane of symmetry. There is a lack of information on the mean and turbulent flow profiles in the literature. The second objective was to investigate how the presence of a downstream cylinder affects the flow fields in-between cylinders. The third objective was to examine the effect of L/D on the distribution of near-bed shear stress behind the cylinders.
The findings of this study could be used to improve knowledge on flow profiles and near-bed shear stress in the aspect of local sediment transport behind cylinders in a tandem arrangement and may help to improve the functionality of the cylinder structures in water resource engineering applications (e.g., bridge piers, offshore and onshore structures, fish habitat structures).
2. Materials and Methods
2.1. Experimental Setup
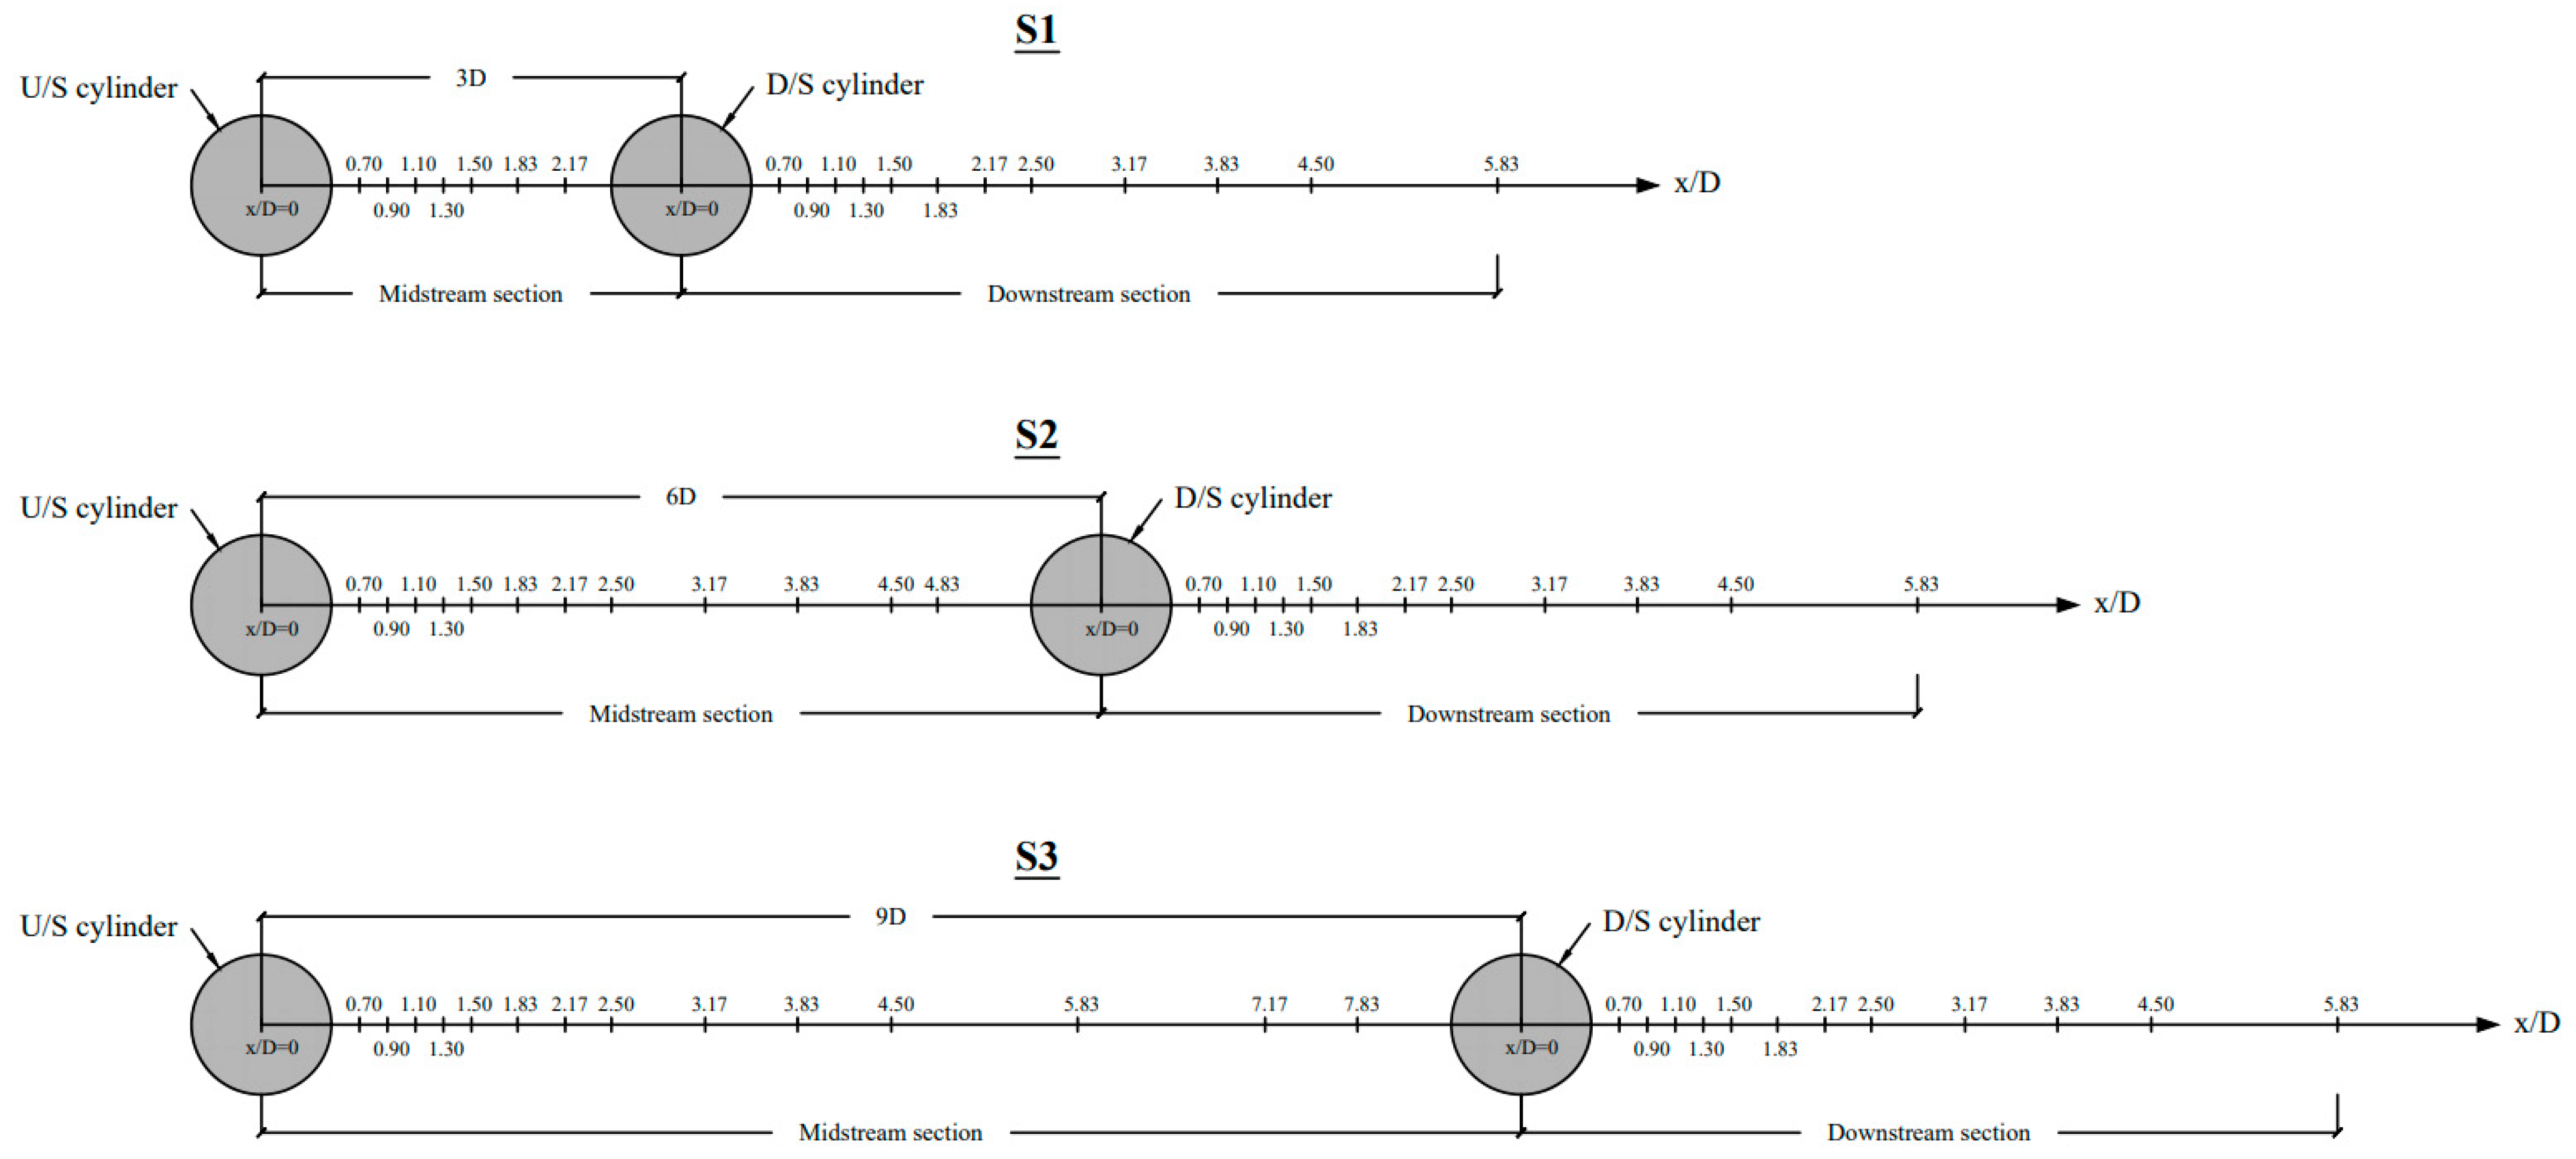
Experiments were performed in a 21.3 m long, 0.76 m wide, and 0.74 m deep re-circulating rectangular flume with an adjustable slope. For the narrow open channel, the side wall effects were assumed to be negligible based on some preliminary analyses on velocity distribution throughout the width of the flume. The flume sidewalls were transparent for visual access to the flow, and the longitudinal bed slope was set to 1.87 × 10⁻³. Two solid concrete circular cylinders of equal height (Hd = 0.30 m) and diameter (D = 0.15 m) were mounted vertically along the channel centerline of a smooth flume bed at a distance of 11.0 m from the inlet to ensure that the turbulent flow was fully developed in the test section (the approach flow development is discussed in Section 3.1.). Then, 3 experimental scenarios (hereafter called S1, S2, and S3) were performed, where the cylinders were aligned in a tandem arrangement (Figure 1) with 3 different gap ratios of L/D = 3D in S1, L/D = 6D in S2, and L/D = 9D in S3 center to center, with a flow blockage ratio of 20%. We acknowledge that there may have been some effects of cylinder blockage on the flow characteristics in a narrow channel. Nevertheless, because the main objective in this study was related to flow characteristics along the centerline (behind the tandem cylinders in the plane of symmetry), this blockage ratio was not expected to affect the key findings of this study significantly. Further studies are recommended to examine the effect of blockage ratio on flow characteristics for tandem cylinders.
In the 3 scenarios, the same approach uniform flow condition was maintained, where the approach flow depth was H = 26.5 cm, and the depth-averaged flow velocity was = 35.3 cm/s (Table 1). The cylinder’s aspect ratio was H/D = 1.80. Some shallow flow studies were conducted using similar H/D values (e.g., H/D = 0.5, 1.0, 2.0 by Akilli and Rockwell [13], H/D = 1.9 by Sadeque et al. [6], H/D = 1.25 by Gao et al. [14], and H/D = 1.12 by Kirkil and Constantinescu [15,16]). The approach shear velocity was u* = 1.40 cm/s, estimated by the Reynolds shear stress method () by Nezu and Nakagawa [17], using the measured Reynolds shear stress very close to the bed (10% depth from the bed), where τ is the total shear stress, σ is the distance from the bottom to the point of the maximum velocity, ρ is the water density, and and are the velocity fluctuations in the streamwise and vertical directions, respectively. All experiments were conducted at higher Reynolds numbers based on the diameter of the cylinder, , where is the coefficient of kinematic viscosity of water.
Figure 1 illustrates the position of the measurement stations in the symmetry plane between cylinders (hereafter referred to as “midstream”) and downstream of the second cylinder (referred to as “downstream”). Midstream, the measurement stations at various relative streamwise distances varied from x/D = 0.70 to 2.17 in S1, x/D = 0.70 to 4.83 in S2, and x/D = 0.70 to 7.83 in S3; and downstream the stations were at x/D = 0.70, 0.90, 1.10, 1.30, 1.50, 1.83, 2.17, 2.50, 3.17, 3.83, 4.50, and 5.83, and were the same in all scenarios (Figure 1). At each station both midstream and downstream, the vertical distance (z) between 2 points varied from 0.5 to 5 cm, and the relative depth (z/H) of the measured points varied from 0.02 to 0.75, covering both the inner layer (20% of flow depth) and outer layer (remaining 80% of flow depth) [17,18]. The near-bed measurement points were 0.5 cm (z/H = 0.02) away from the bed. Some other studies also took near-bed measurements at distances similar to those of this study [19,20].
2.2. ADV Measurements and Analysis
A downward-facing acoustic Doppler velocimeter (ADV) (SonTek, 16-Hz MicroADV) was used to measure the 3D instantaneous velocity time-series data at each point. Measurements were recorded at a rate of 30 Hz for a period of 120 s at each point, with a sampling volume of 0.05 cm3 and assuming implicitly that such a duration was long enough to describe the turbulence. Some studies used relatively small number of samples for turbulence measurements, using ADVs as low as 3000 samples [20] and 1500 samples [19]. The raw data were first post-processed using WinADV [21] to remove spikes using the phase space threshold method of Goring and Nikora [22]. Velocity signal correlations (COR) and the signal-to-noise ratio (SNR) are commonly used to eliminate poor-quality data from measured time series. A filtering scheme with an average COR ≤ 70% and average SNR ≤ 15 dB was used to eliminate bad data from the velocity time series to yield highly reliable data [20]. Such criteria led to more than 90% of the data being retained in each experimental scenario (Table 1). Afterward, the velocity time series in 3 directions that had noisy signals (velocity spectra that generally displayed a flat slope instead of the Kolmogorov −5/3 slope in the inertial subrange) were removed by visual inspection, thus rejecting about 10% of data points. It should be noted that due to the limitations of the downward-facing ADV, flow information for the top 6.5 cm of the flow depth is not available.
The time-averaged mean and turbulence metrics were estimated at each measurement point/location. The vertical profile of time-averaged velocity in the streamwise direction (u) was compared with the classical logarithmic law for the hydraulically rough flow regime:
where κ is the von Karman constant (= 0.41) and k is the medium bed roughness height (k = 0.0105 m, equivalent to Manning’s n = 0.015 for smooth cast iron bottom). We assumed that the logarithmic law described the velocity distribution over the entire depth of uniform and steady open-channel flows in practical applications.
The turbulence metrics included turbulent kinetic energy () and the resultant Reynolds shear stress (τp) per unit mass density of fluid on a surface parallel to the bed:
where is the velocity fluctuations in the transverse direction, is the primary Reynolds shear stress (per unit mass density of fluid) on the vertical plane (x − z), and is the Reynolds shear stress (per unit mass density of fluid) on the transverse plane (y − z); the bar sign over and indicates a time-averaged value. Herein, τp was estimated leveraging the Reynolds shear stress in both vertical and transverse planes instead of using the measured Reynolds shear stress on the horizontal plane.
The dimensionless near bed shear stress () was estimated from 3 different Reynolds, TKE, and modified TKE methods. In Reynolds method, the dimensionless bed shear stress was estimated from the resultant Reynolds shear stress:
Using the turbulent kinetic energy (TKE) method, the dimensionless bed shear stress was estimated as below [23]:
where is a constant equal to 0.19 [24]. The modified TKE method only uses the vertical component of the velocity fluctuations due to the smaller noise of the measurement instrument in this direction [24]. Therefore, the dimensionless bed shear stress (per unit mass density of fluid) was estimated as below:
where is a constant equal to 0.9 [24]. The near-bed shear stress at each station was estimated using Equations (3)–(5) for all points within the inner layer (20% of the flow depth from the bed) in all scenarios. However, the maximum near-bed shear stress values out of several points within the inner layer are presented.
3. Results and Discussion
3.1. Mean Flow Characteristics
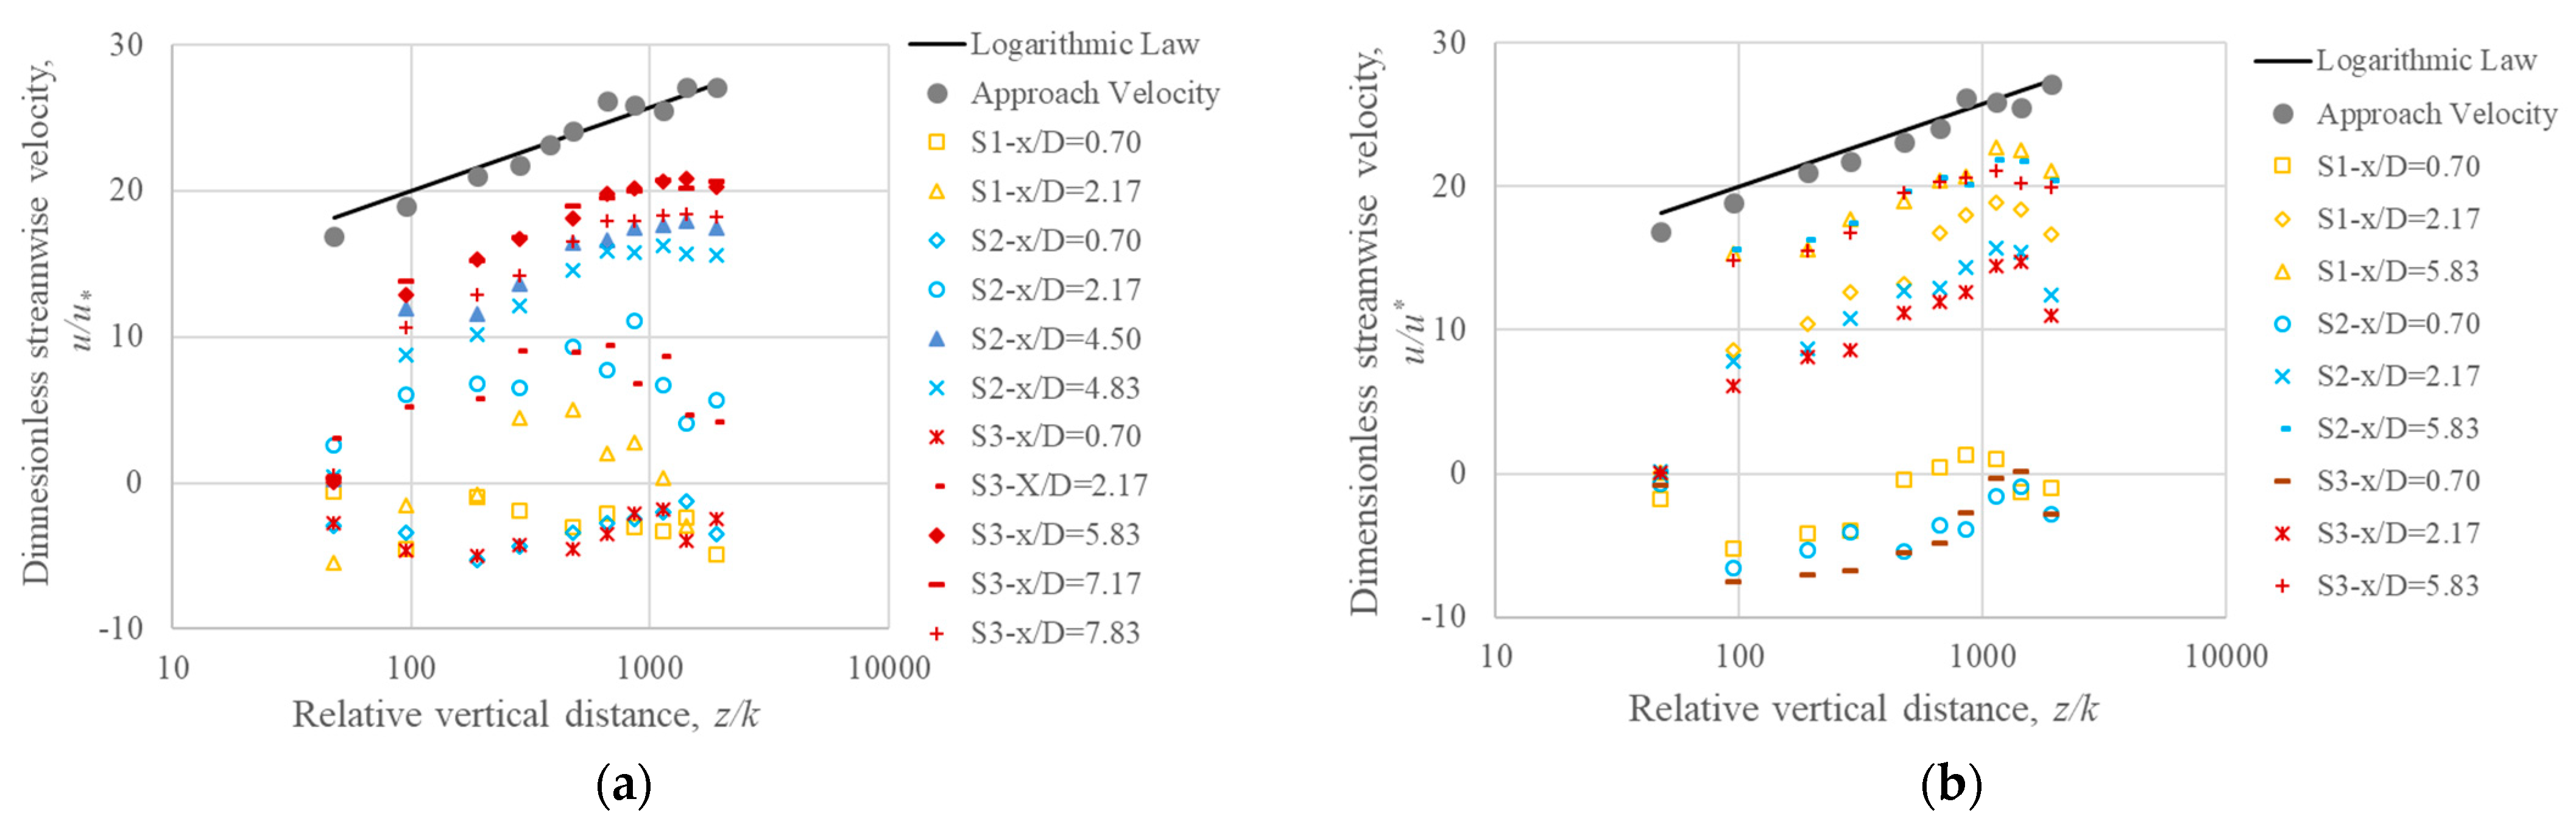
The mean flow characteristics were analyzed to better understand the flow fields in both midstream and downstream in terms of variation of velocity profiles, size of recirculation zone, and the velocity development process. Figure 2 shows the vertical profiles of dimensionless streamwise velocity (u/u*) in the plane of symmetry for all three scenarios both midstream and downstream. The Figure confirms that the vertical profiles of the streamwise approach velocity satisfy the logarithmic law (Equation (1)), assuring a fully developed approach flow for a hydraulically rough flow regime.
Midstream, all the velocity profiles for all scenarios deviated from the logarithmic law (Figure 2a), as expected because of flow disturbances caused by the cylinders. The profiles at x/D = 0.70 showed significant and maximum deviations from the logarithmic profile in all scenarios. The deviations became smaller with increasing downstream distance from the cylinder; the smallest average deviations were of about 95% in S1 (at x/D = 2.17), 36% in S2 (at x/D = 4.50), and 24% (at x/D = 7.17) in S3. In S3, the profile at x/D = 7.17 was the closest to the logarithmic profile, as compared to that at x/D = 7.83 (34% deviation), where the profiles were influenced by the downstream cylinder.
Similarly, downstream in all scenarios the profiles at x/D = 0.70 showed maximum deviations from the logarithmic profile, and the deviations became smaller with the downstream distance from the cylinder (Figure 2b). The profiles at x/D = 5.83 were the closest to the logarithmic profile (20%, 21%, and 22% deviations in S1, S2, and S3, respectively), approaching a fully developed undisturbed flow. Downstream in S3, the profiles at x/D = 5.83 were closer (about 6%) to the logarithmic profile as compared to the midstream profiles between x/D = 5.83 and 7.83. Therefore, it was revealed that the rate of flow development in downstream was faster than that midstream, providing further evidence that the downstream cylinder influenced the midstream profiles in all scenarios.
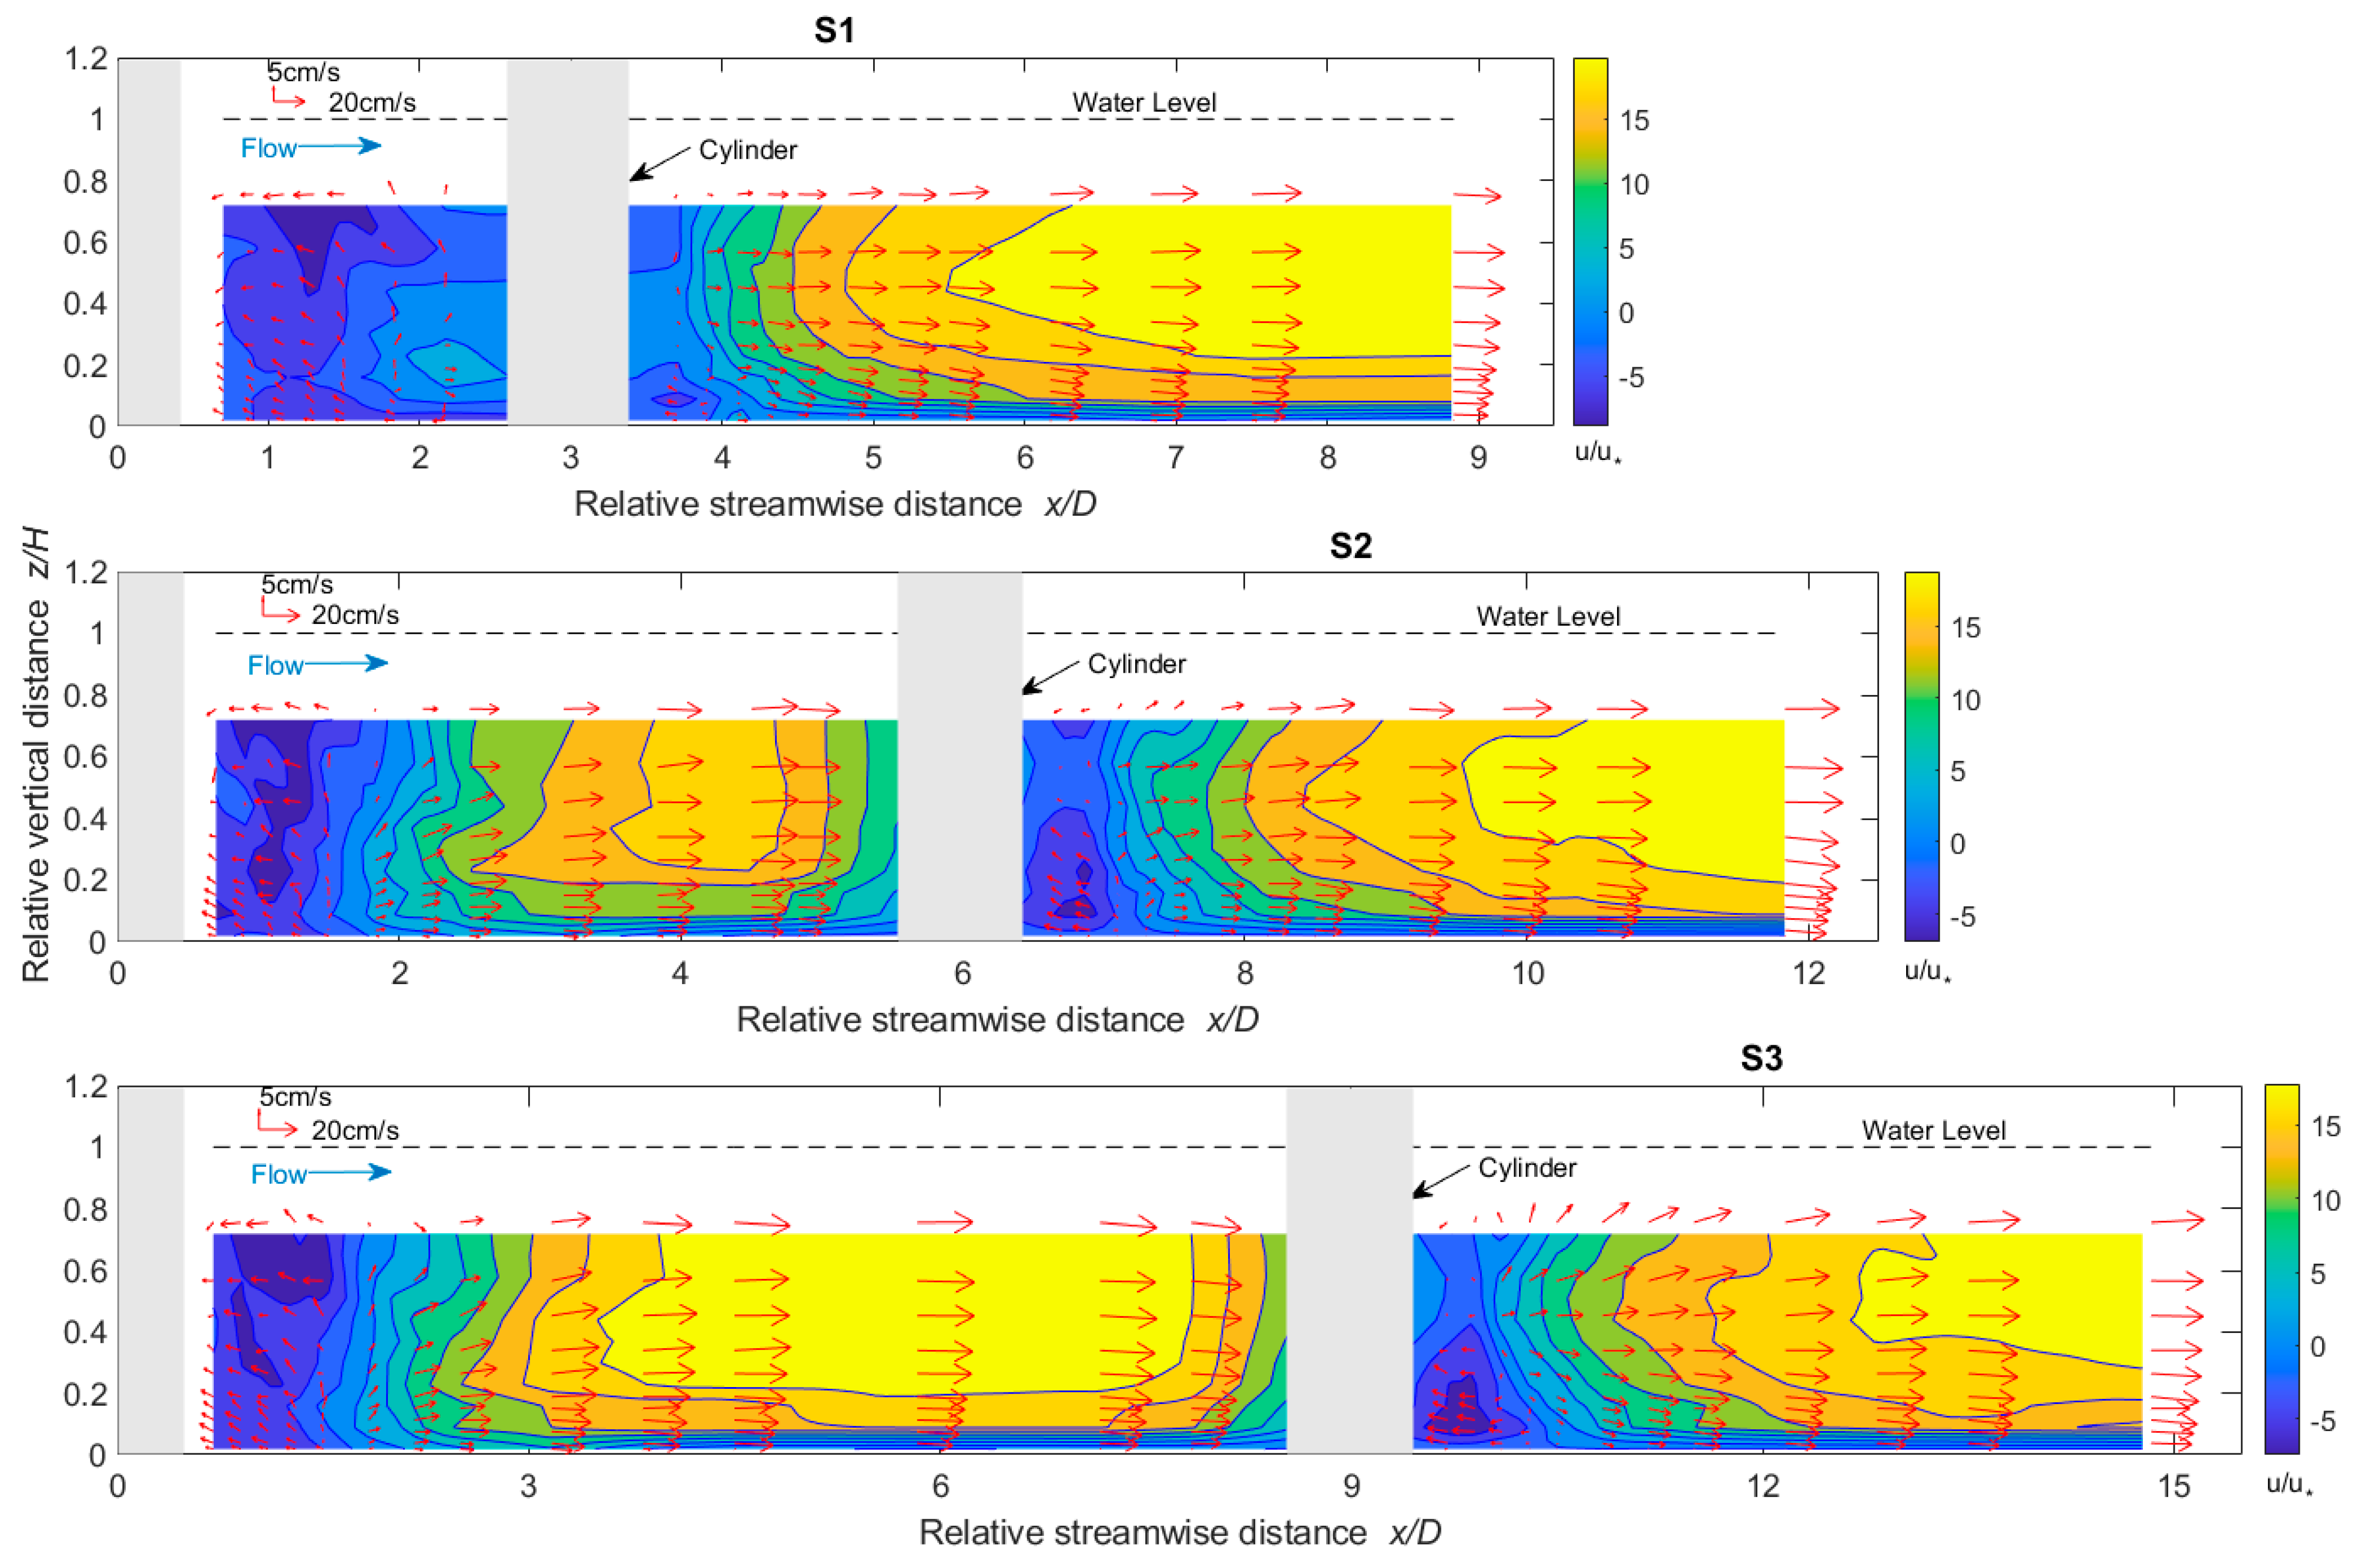
Figure 3 shows the velocity vector and isocontours of dimensionless streamwise velocity (u/u*) in the symmetry plane both midstream and downstream for all three scenarios. Midstream, based on velocity vector and u/u* ≤ 0, the flow recirculation length on the symmetry plane was x/D~1.80 in S1, and ~1.50 in S2 and S3 almost over the entire depth, and was stronger near the free surface than the bed level. On the other hand, downstream, flow recirculation was observed immediately behind the cylinder and was strong near the bed level. The size of the recirculation was x/D~0.90 in S1, ~1.10 in S2, and ~1.30 in S3, with values much smaller and weaker than that midstream. For an emergent cylinder and high Reynolds number, Sadeque et al. [6] determined x/D~1.50 for the entire water depth and for the rough bed; Kirkil and Constantinescu [16] found x/D~1.60 at the near-free surface; and Kirkil and Constantinescu [16] reported x/D~1.20 at the near-bed. By comparing the length of the recirculation zone (x/D ~ 1.20–1.6) for a single cylinder, it is clear that the downstream cylinder influences the longer recirculation zone midstream in S1. The smaller recirculation zone downstream in S1 and S2 are affected by the upstream cylinder. Similarly, Lin et al. [11] found that the upstream cylinder substantially altered the near-wake flow behind the downstream cylinder for L/D = 1.15 to 5.10 at a cylinder Reynolds number (ReD) = 1 × 10⁴. As the flow approached the downstream (away from the recirculation zone), a rapid increase in velocity and the profiles approaching developed from x/D = 3.80 in S3 midstream, x/D = 3.20 in S1, and 3.80 in S2 and S3 downstream. In midstream, the flow deceleration was evident as it approached the downstream cylinder.
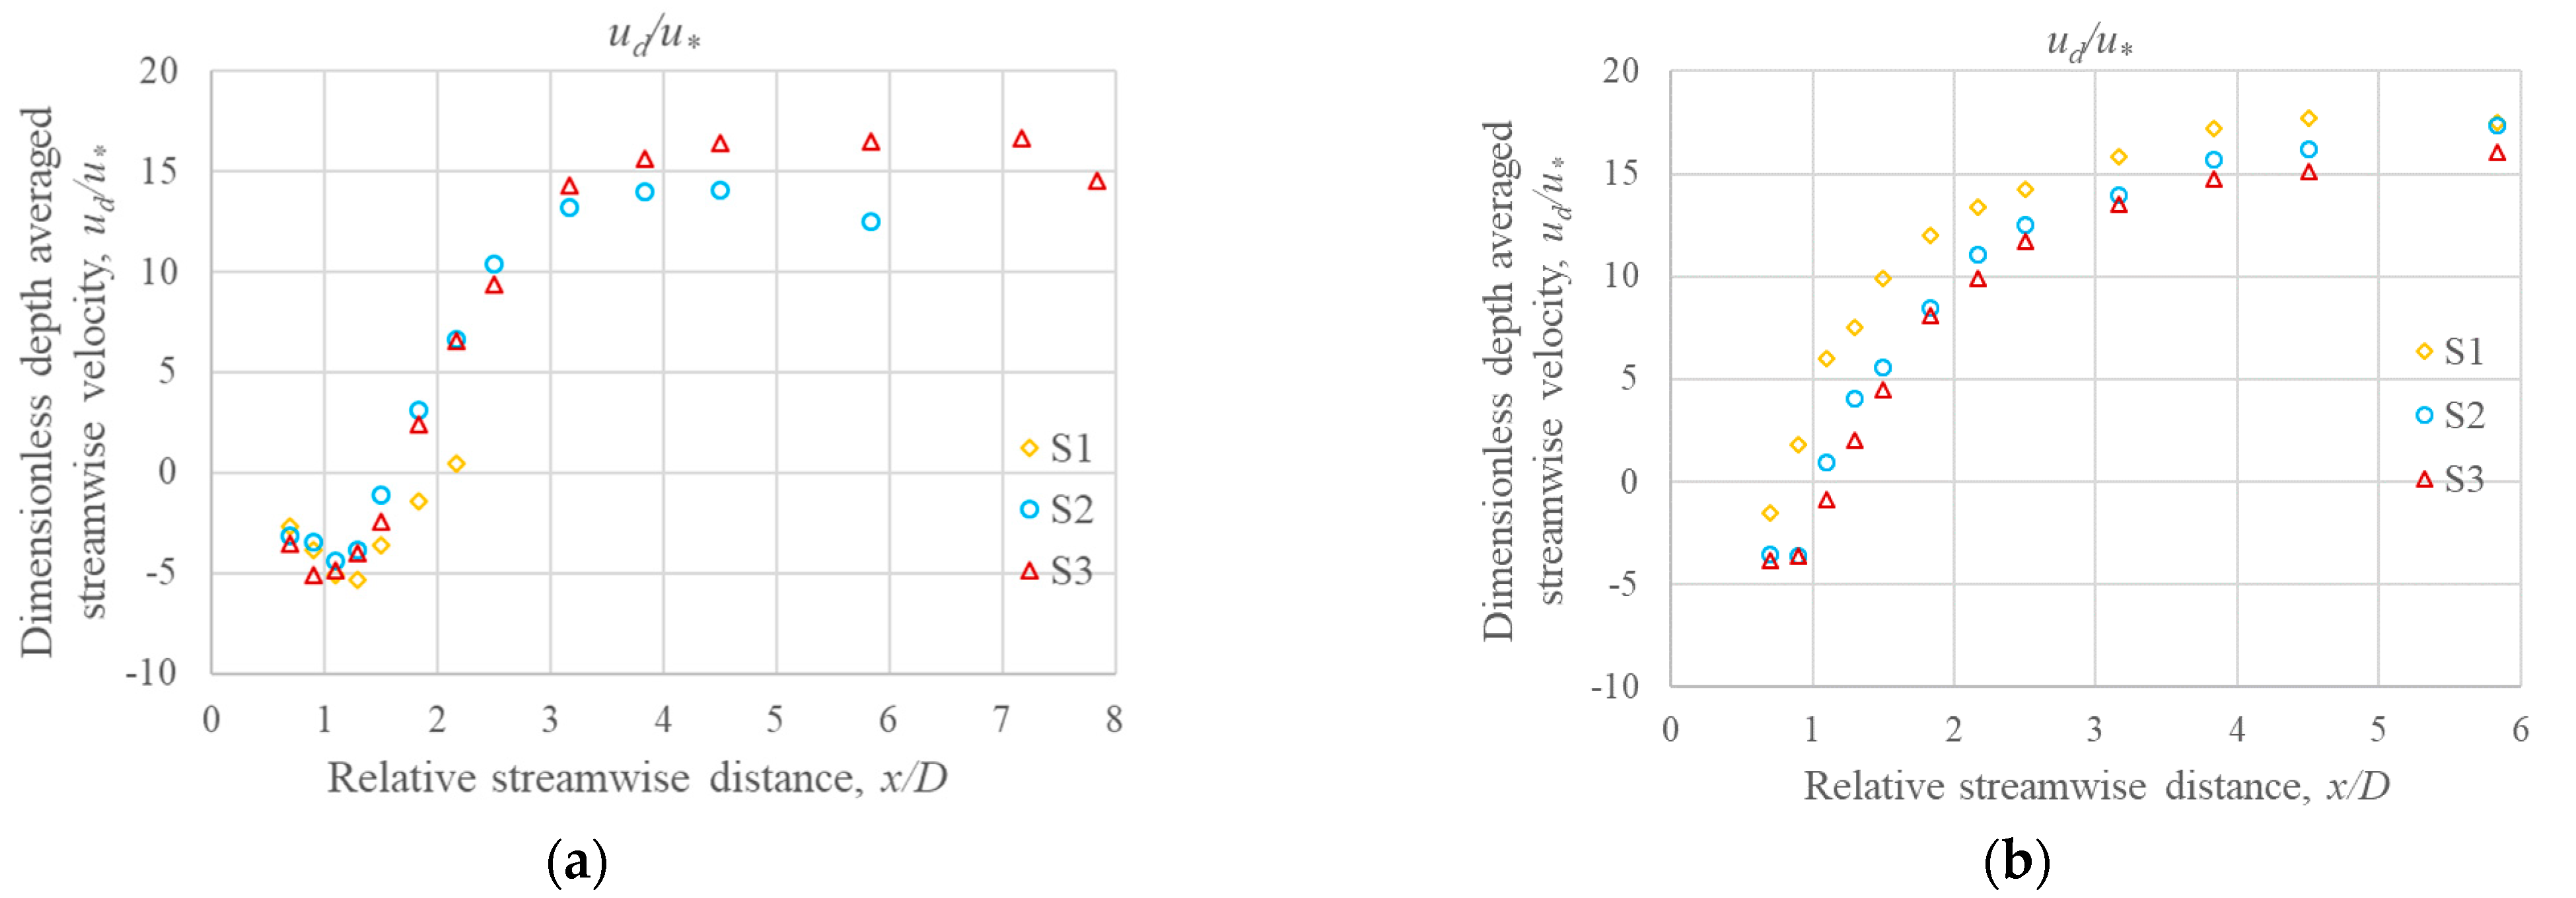
Figure 4 shows the variation of dimensionless depth averaged streamwise velocity (ud/u*) along the plane of symmetry both midstream and downstream. Midstream, ud/u* = 0 at x/D = 2.00 in S1 and at x/D = 1.70 in S2 and S3 (Figure 4a). In S1, the flow recirculation zone occupied almost the full space midstream, where ud/u* varied from −5.20 to 0.40. In S2, a rapid increase was found in ud/u* = −4.40 at x/D = 1.10 to ud/u* = 13.20 at x/D = 3.20; then the velocity slowed, and the maximum ud/u* = 14.10 occurred at x/D = 4.50. Finally, the velocity dipped as the flow approached the downstream cylinder. In S3, similar to S2, ud/u* increased sharply from −5.10 at x/D = 0.90 to 14.30 at x/D = 3.20. The rate of increase slowed and the maximum ud/u* = 16.60 occurred at x/D = 7.20; thereafter it decreased as the flow approached the downstream cylinder. In contrast to midstream, ud/u* = 0 at x/D 0.80, 1.10, and 1.20 in S1, S2, and S3, respectively (Figure 4b). The variation patterns of ud/u* in all three scenarios were similar, with a rapid increase in ud/u* (varying from −3.80 to 17.40) between x/D = 0.70 and x/D = 3.80 and values then remaining almost constant. Interestingly, downstream the value of ud/u* slightly decreased from S1 to S3 due to the effect of their corresponding recirculation lengths, which increased from S1 (x/D~0.90) to S3 (x/D~1.30) (as discussed above). Therefore, Figure 3 and Figure 4 show that the downstream cylinder controls the flow recirculation length midstream in S1 and has zero interruption in S2 and S3.
3.2. Turbulent Flow Characteristics
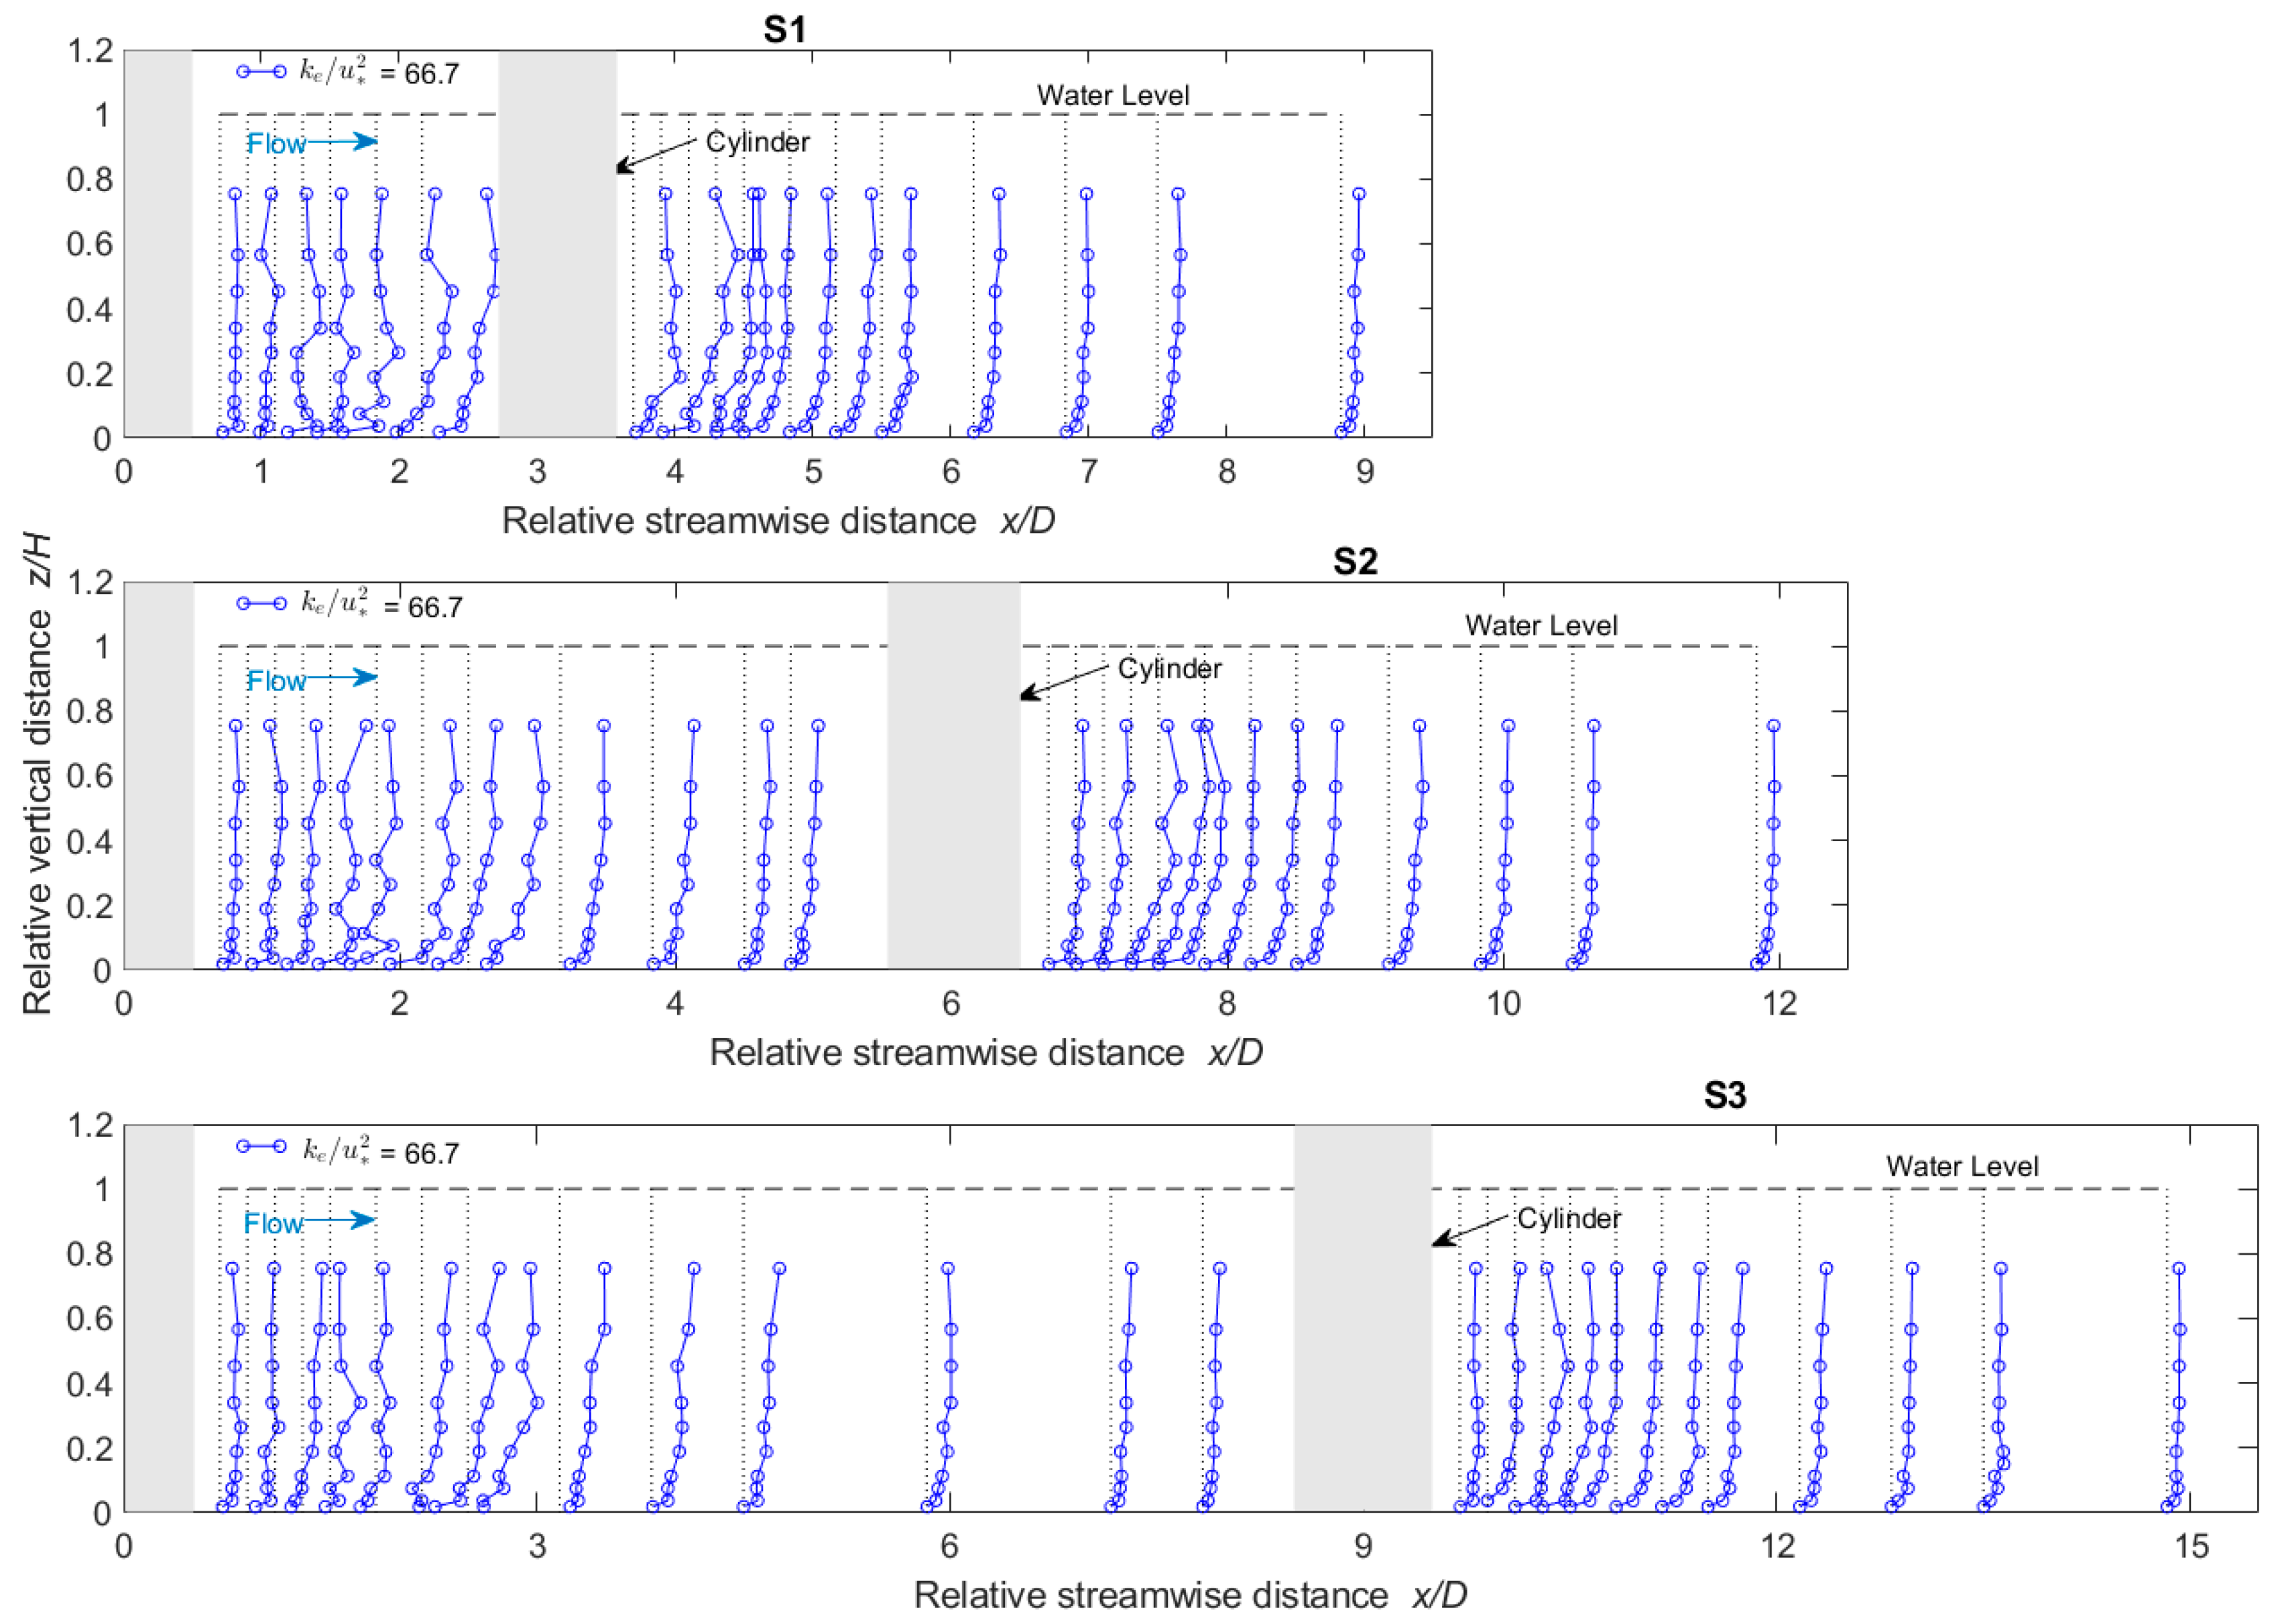
The time-averaged turbulent metrics of turbulent kinetic energy, ke, which characterizes the intensity of the turbulence, and the resultant Reynolds shear stress, , which may promote sediment movement, are analyzed here to understand the turbulence flow characters better. Figure 5 shows the vertical profiles of dimensionless ke/u*2 in the symmetry plane for scenarios S1, S2, and S3 both midstream and downstream. Both midstream and downstream, the elevated ke/u*2 grew with the streamwise distance until the end of the recirculation zone. With a further streamwise distance, despite the obvious reduction, the ke/u*2 remained at a relatively high level. The pronounced ke/u*2 downstream of the cylinders is attributed to large-scale vortices generated in the recirculation region [25].
In order to acquire a better understanding, the variations of maximum ke/u*2 for the plane of symmetry are also plotted in Figure 6a for midstream and in Figure 6b for downstream. Midstream, it is apparent that the ke keeps on increasing as the flow progresses. The highest ke/u*2 = 154 was observed at x/D = 1.83 in S1, while ke/u*2= 152 was observed at x/D = 1.83 in S2, and ke/u*2 = 157 was observed at x/D = 2.17 in S3. In all scenarios, a rapid increase in ke/u*2 (by about 3.9 times of the lowest ke/u*2) was found over a short longitudinal distance (x/D = 0.70) to 2.17. After that, the peak ke/u*2 gradually decreased by about 4.5 times over a distance x/D = 2.17 to 7.83 in S3. Downstream, the highest ke/u*2 = 156 was observed at x/D = 0.90 in S1, ke/u*2 = 159 was observed at x/D = 1.30 in S2, and ke/u*2 = 108 was observed at x/D = 1.10 in S3. In all scenarios, a rapid increase in ke/u*2 (by about 1.6, 2.1, and 2.8 times the lowest ke/u*2) over a short longitudinal distance x/D = 0.70 to 0.90, 0.70 to 1.30, and 0.70 to 1.10 in S1, S2, and S3, respectively, was observed. After that, the ke/u*2 peaks gradually decreased by about 4.3, 4.4, and 3.9 times over a distance x/D = 0.90 to 5.83, 1.30 to 5.83, and 1.10 to 5.83 in S1, S2, and S3, respectively. Therefore, peaks of ke/u*2 in both midstream and downstream for all three scenarios occurred near the end of their corresponding recirculation zones, except for S3 midstream where the peak occurred outside the recirculation zone.
It can also be observed from Figure 6 that the approaching ke towards the downstream cylinder had a significant influence on the ke just downstream of this cylinder. For S1, S2, and S3, the ke/u*2 just upstream of downstream cylinder ended with 150, 56, and 35, respectively, and their corresponding ke/u*2 downstream started with 95, 74, and 38, indicating that the ke downstream increased with the increased ke midstream.
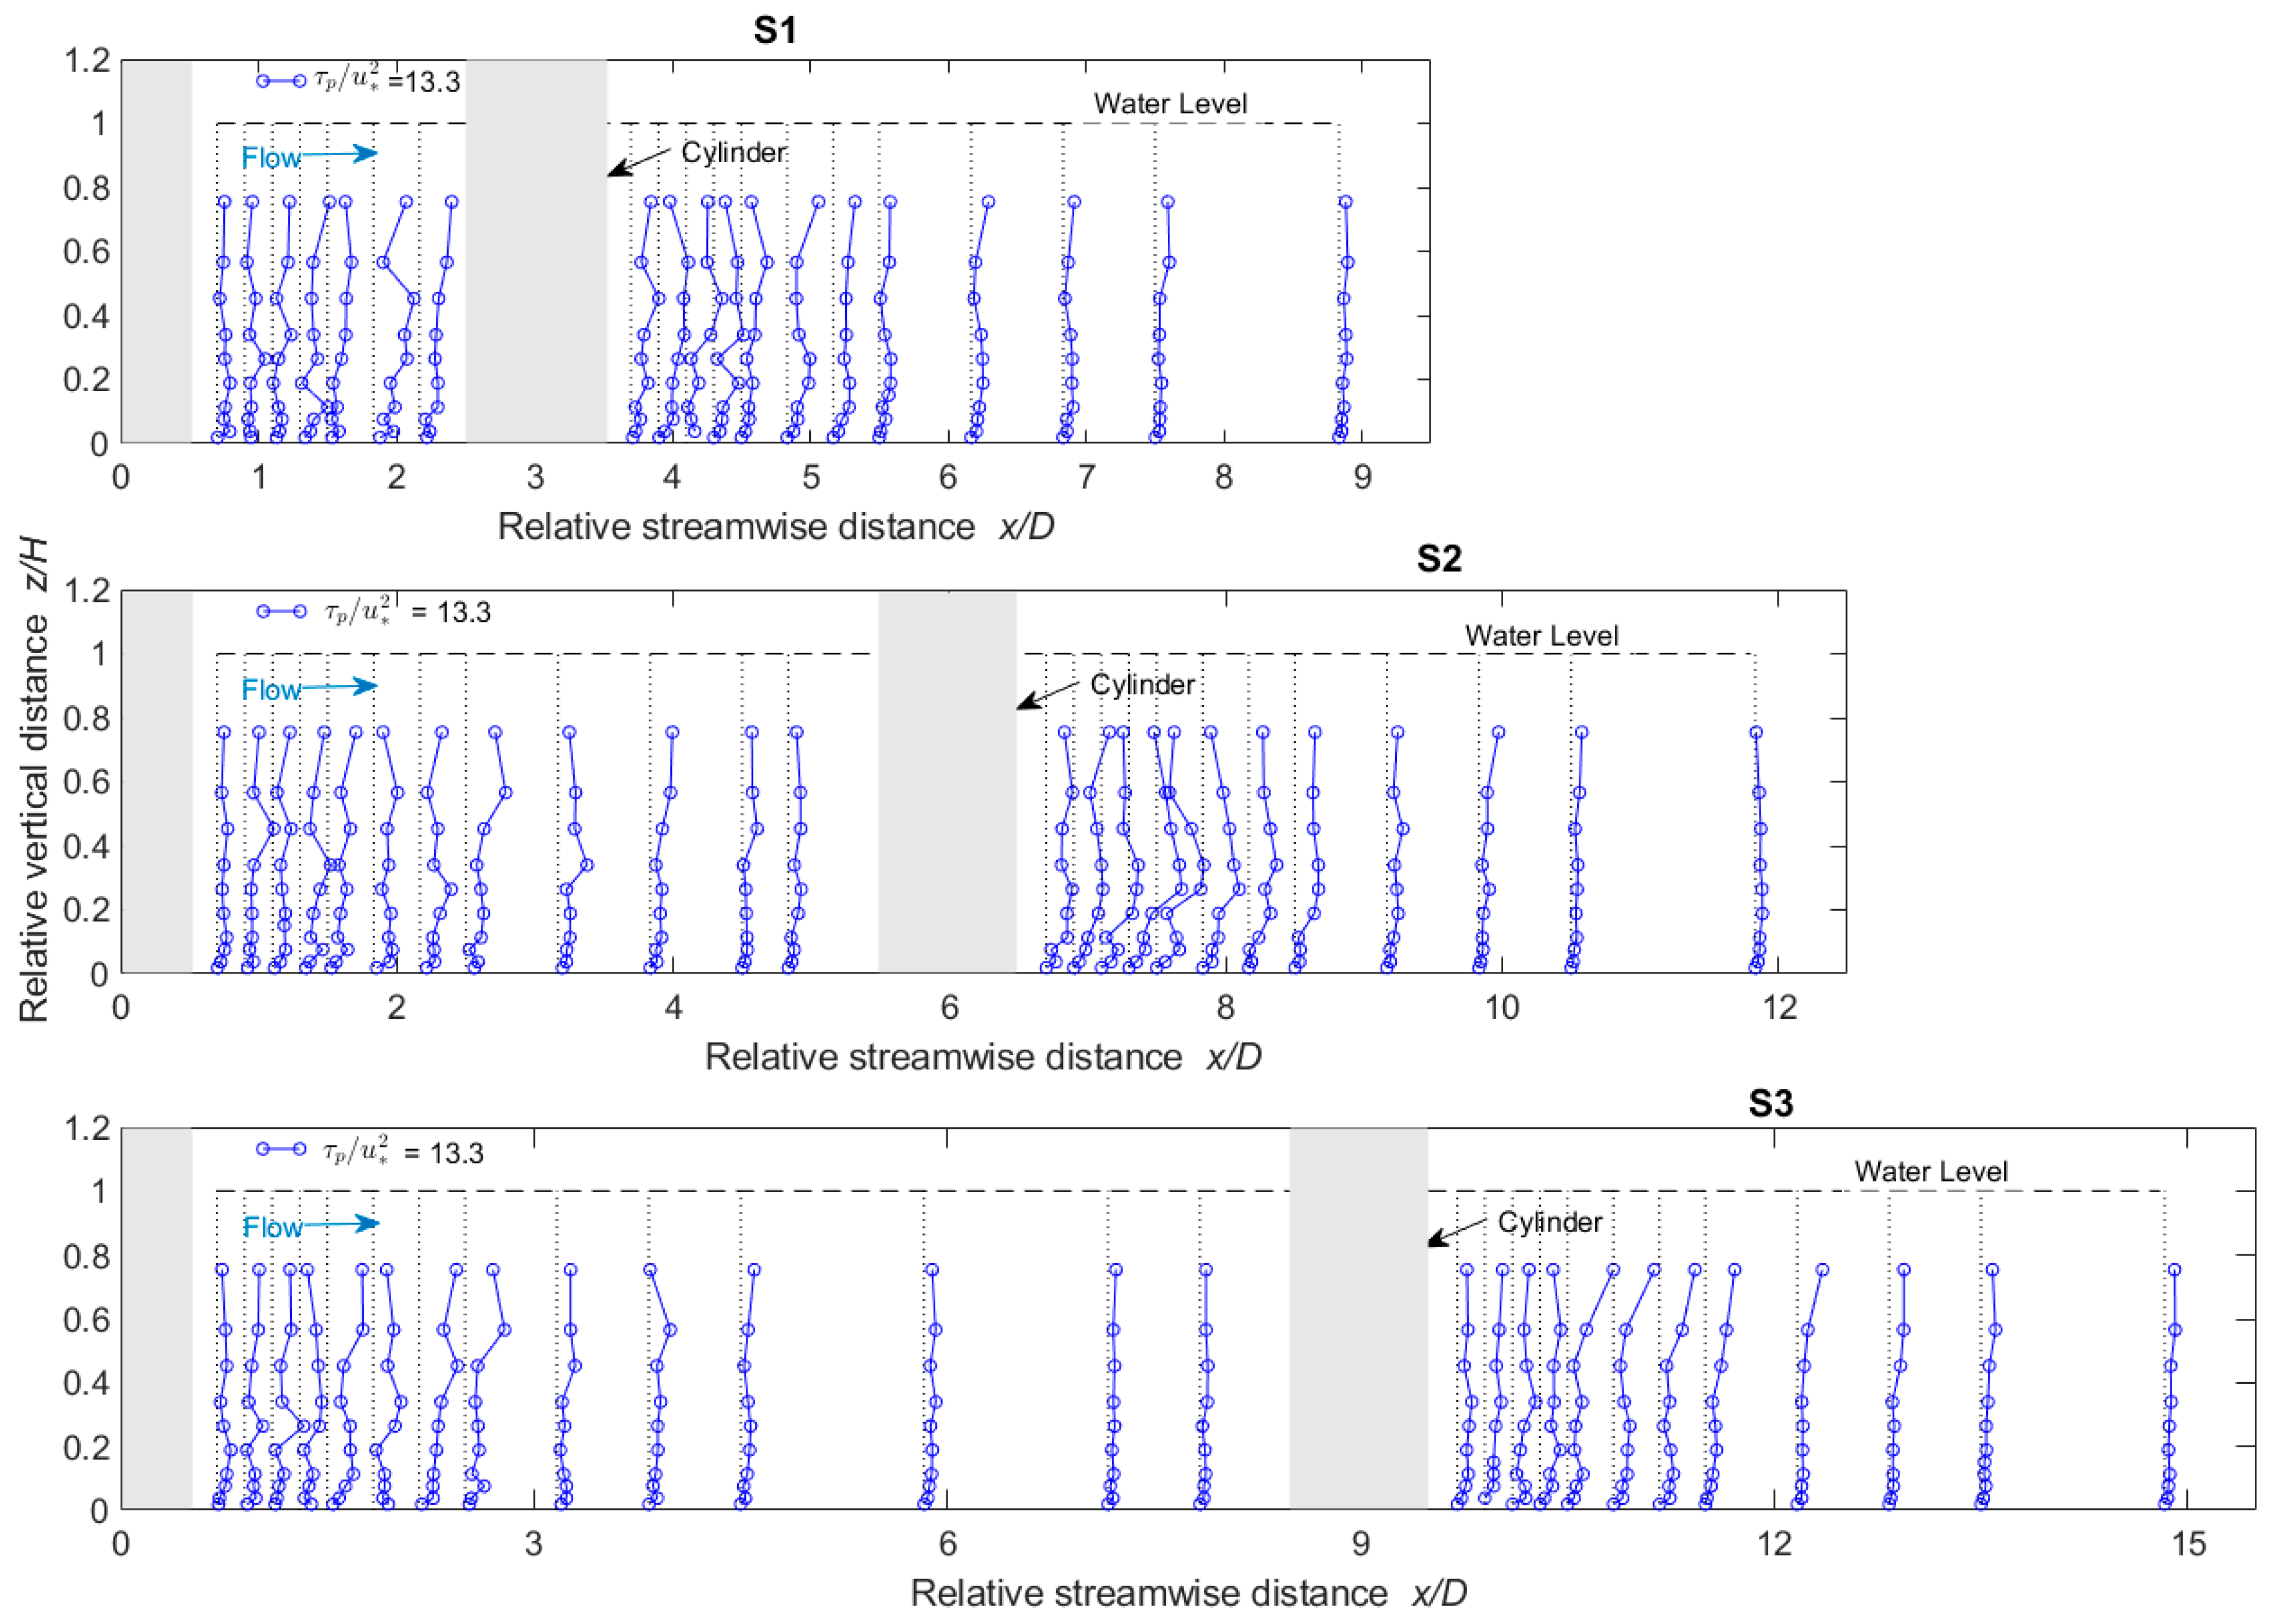
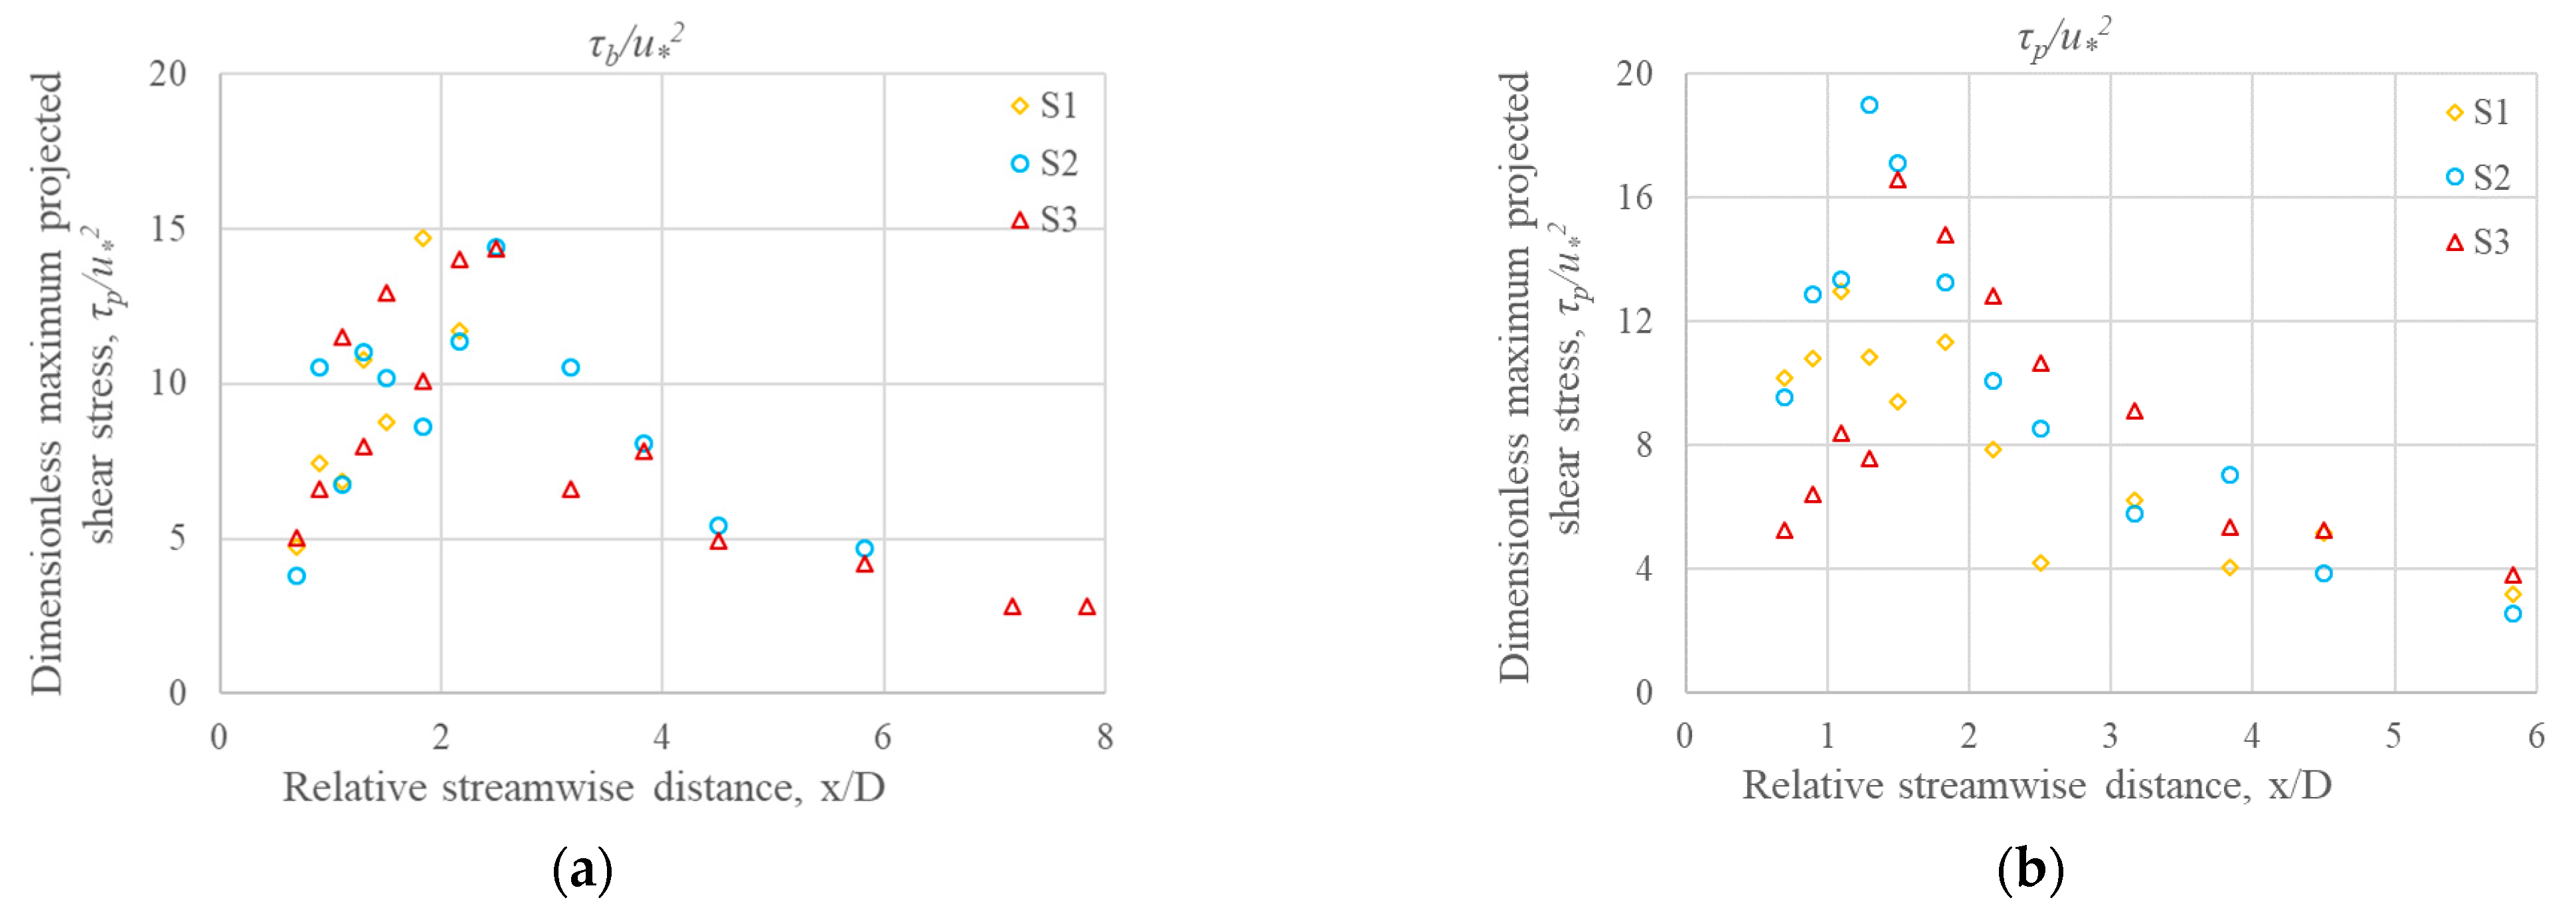
Figure 7 shows the vertical profiles of dimensionless resultant Reynolds shear stress (τp/u*2) in the plane of symmetry for S1, S2, and S3 both midstream and downstream. It is apparent that τp/u*2 dominated near the recirculation zone for all scenarios. The magnitude of vertical profiles outside of the recirculation zone and in farther downstream locations was generally low and slightly elevated the near-free surface. Figure 8 shows the variations of maximum τp/u*2 for the plane of symmetry midstream and downstream, which are relatively chaotic as compared to the variation of ke/u*2 with x/D.
Midstream, the highest τp/u*2 = 15 was observed at x/D = 1.83 in S1 and τp/u*2 = 14 was observed at x/D = 2.50 in S2 and S3 (Figure 8a). Similarly, downstream the highest τp/u*2 = 13 was observed at x/D = 1.10 in S1, where a value of 19 was observed at x/D = 1.30 in S2, and a value of 17 was obtained at x/D = 1.50 in S3 (Figure 8b). Though the plots are scattered, in general the lowest values of τp/u*2 just downstream of the cylinders increase rapidly in the streamwise distance, and the values reach a peak in or outside the recirculation region; thereafter the values gradually decrease with the downstream distance. In all three scenarios, the peaks of τp/u*2 in downstream are higher than those midstream.
3.3. Near-Bed Shear Stress
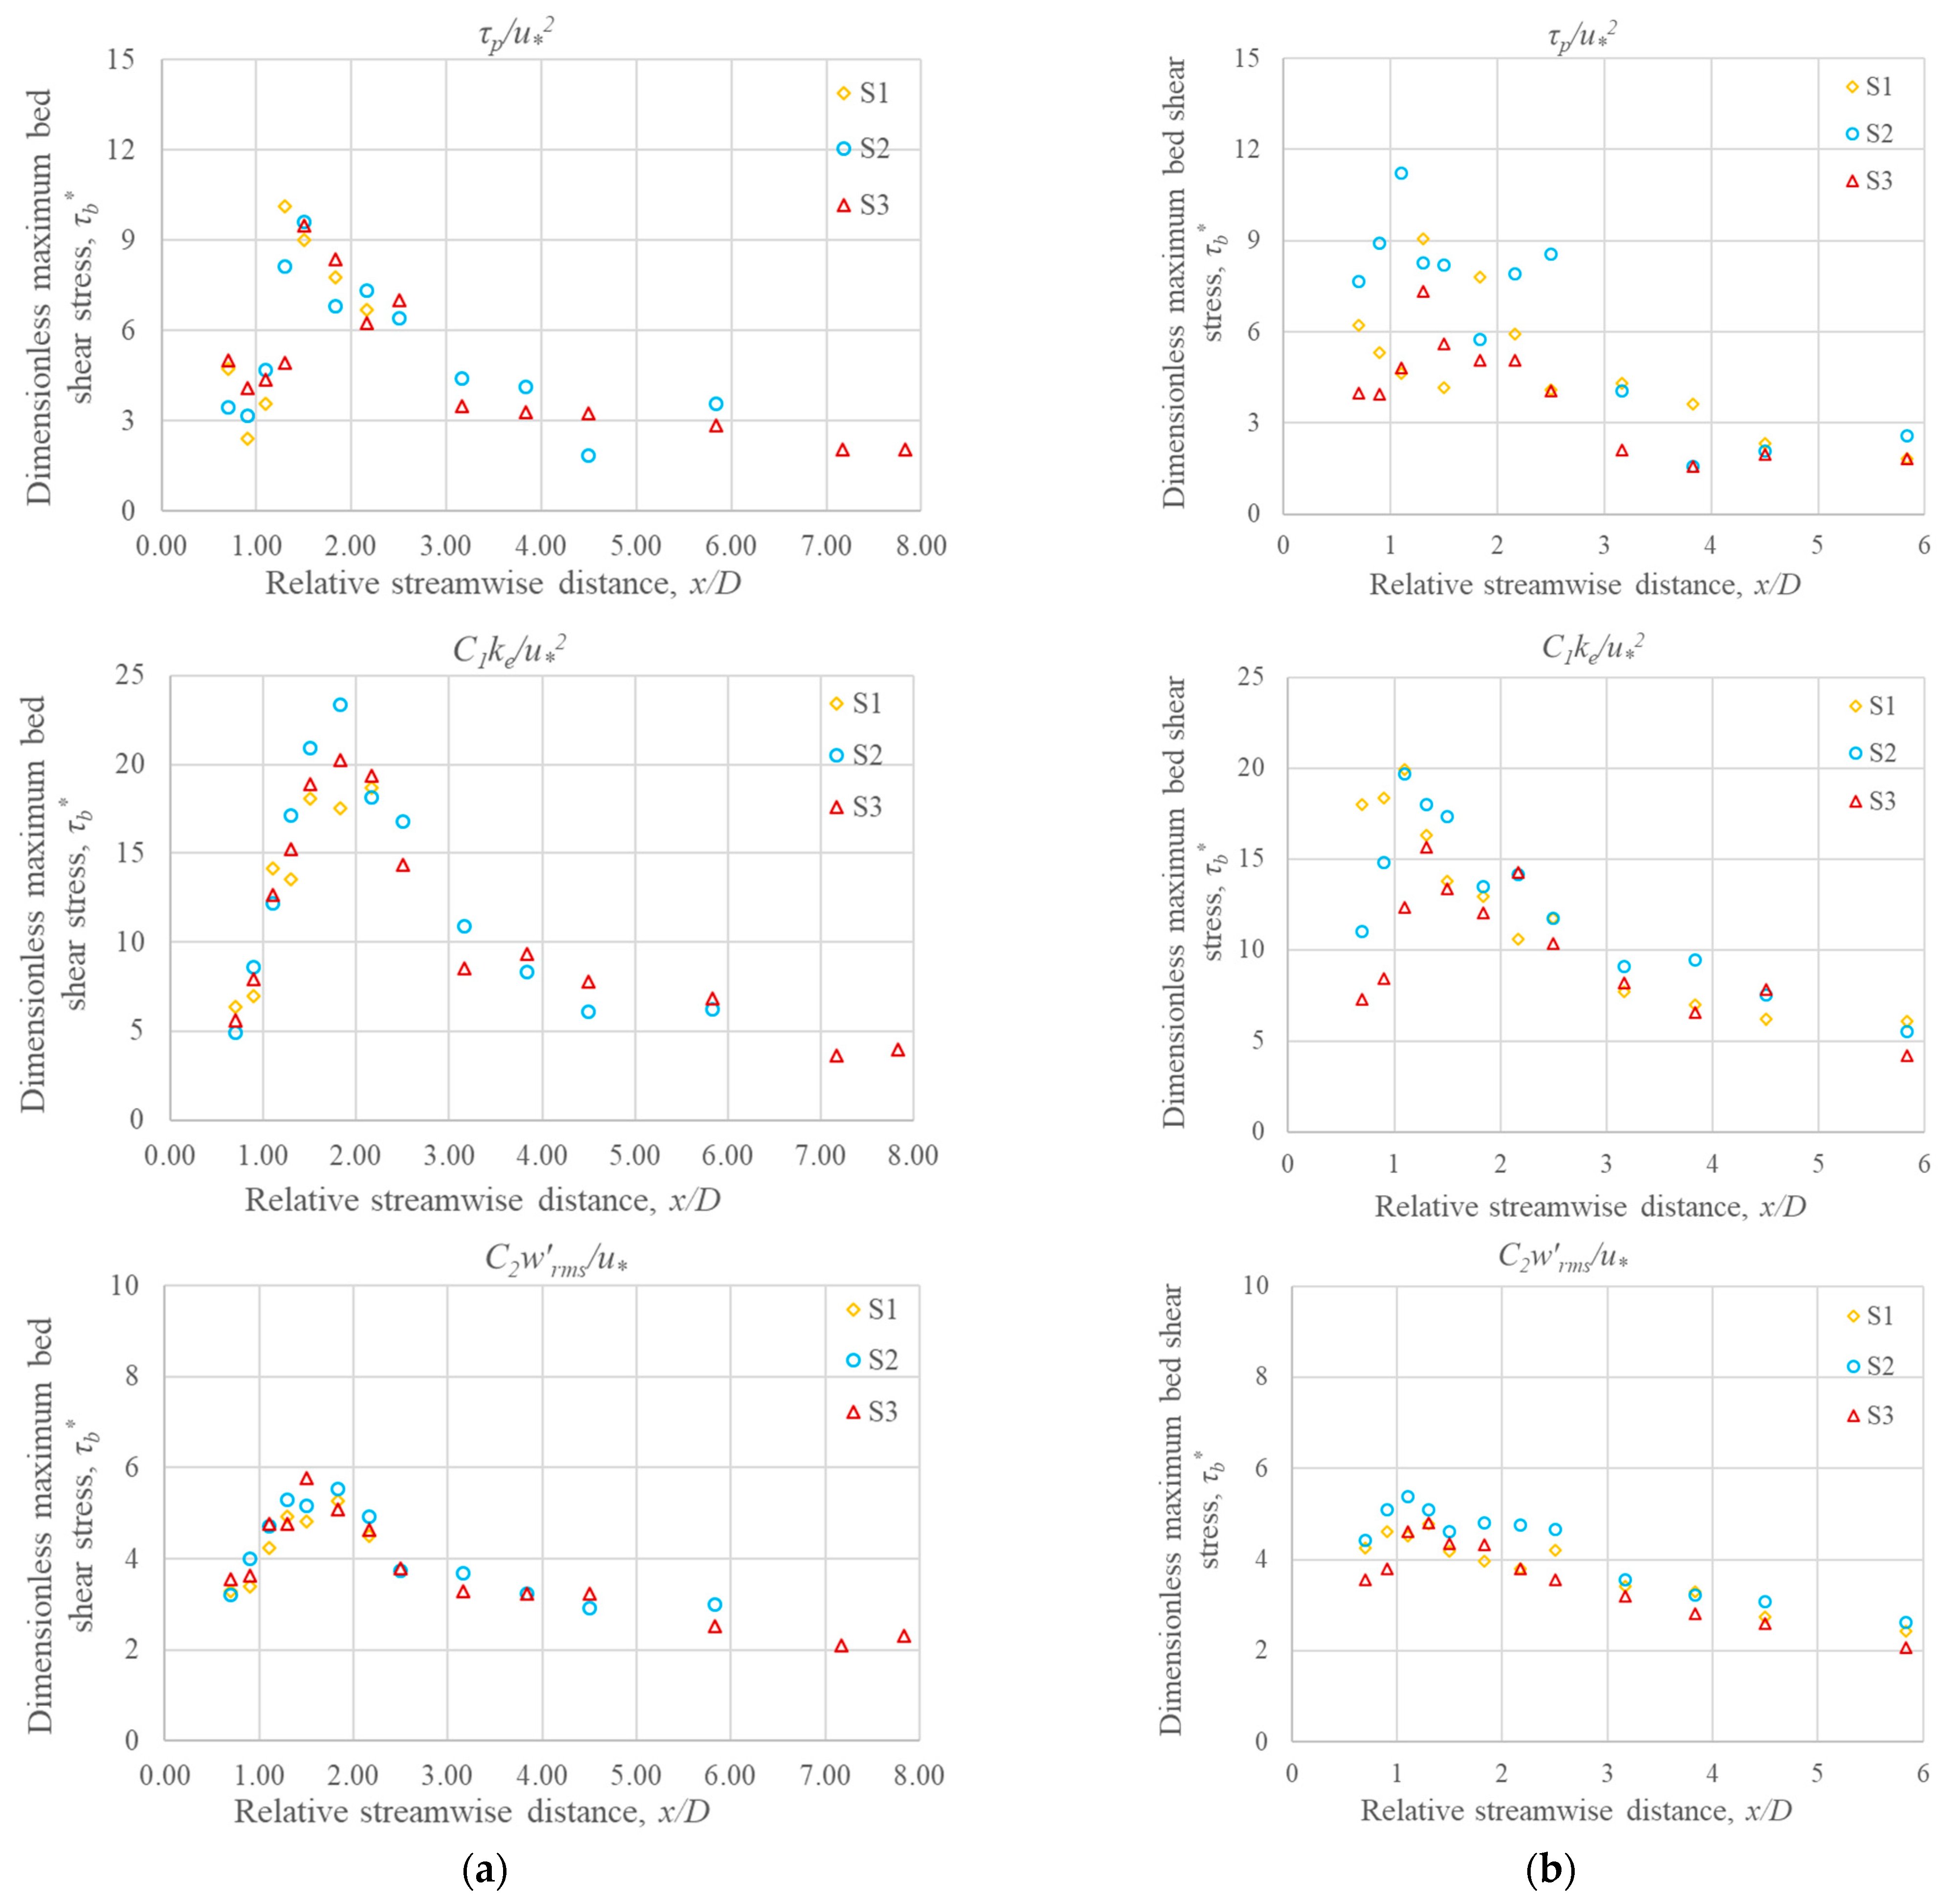
The spatial distribution of the dimensionless maximum near-bed shear stress () is of great importance in the presence of cylinders that significantly change the local flow hydrodynamics, as plotted in Figure 9 using the Reynolds (Equation (3)), TKE (Equation (4)), and modified TKE (Equation (5)) methods.
Apparently, midstream the results for all three scenarios exhibit better trends along with the relative streamwise distance (x/D) than downstream for all methods (Equations (3)–(5)). The peak values of 10, 20, and 5.5 for the Reynolds, TKE, and the modified TKE methods, respectively, occurred at x/D = 1.30–1.83 midstream, and downstream the peak values of 9, 19, and 4.5 for the corresponding methods occurred at x/D = 1.10–1.30. Therefore, the slightly elevated (5–20%) peaks of occurred over an extended length of about 0.5D midstream, in contrast to the peaks of downstream, which occurred over a short length of 0.2D. Following the length of the flow recirculation zone (as discussed above), the peaks of mostly occurred at the end of the recirculation zone or the reattachment point. Studies have reported an increased Reynolds shear stress and TKE downstream of a submerged boulder near the bed due to the large-scale vortices in the wake zone ([26,27], and others). According to the trends both midstream and downstream for all methods, the lowest values of just downstream of the cylinders increased rapidly in the downstream distance and the values attained a peak in the recirculation region; thereafter they gradually decreased as the flow approached the downstream distance. As expected, it should be noted that trends in Figure 9 are very similar to the variations in maximum ke/u*2 and τp/u*2 with the relative streamwise distance (x/D) in Figure 6 and Figure 8.
Both midstream and downstream the variations of with x/D using the three methods deviated from each other (Figure 9). The highest values were 10, 20 and 5.5 for the Reynolds, TKE, and modified TKE methods, respectively. The highest value of in the modified TKE method was exceptionally low (about 70%) compared to the TKE method. The reason for this low value may be a less significant velocity fluctuation in the vertical direction () in the calculation of the modified TKE shear stress. Similarly, the highest value of in the Reynolds method was about 50% less than that in the TKE method.
4. Conclusions
The experimental study examined the detailed flow fields around a pair of cylinders in a tandem arrangement placed at three different c/c spacings along the plane of symmetry in an open channel. Mean and turbulent flow fields between two cylinders as well as in the wake of downstream cylinders were investigated using an ADV. The following concluding remarks are extracted from the results of this study.
- The analysis of vertical profiles of streamwise normalized velocity revealed that the rate of flow development downstream was faster than that midstream. The midstream profiles were influenced by the downstream cylinder in all scenarios.
- The flow recirculation zones midstream (x/D~1.50–1.80) were larger and stronger than those downstream (x/D~0.90–1.30). The longest recirculation zone in S1 midstream was affected by the downstream cylinder, and there was zero interruption from the downstream cylinder in S2 and S3.
- The length of the recirculation zone increased with the increase in c/c spacing of cylinders. The rate of flow development to achieve cross-sectional mean velocity became slower with increasing c/c spacing.
- The maximum turbulent kinetic energy for all three scenarios occurred approximately near the end of their respective recirculation zones. The midstream ke had a significant influence on the ke in downstream.
- The variation of resultant Reynolds shear stress was relatively chaotic as compared to the turbulent kinetic energy. The maximum shear stresses occurred within the recirculation zone for all scenarios.
- The peaks of dimensionless maximum near-bed shear stress () were higher (5–20%) and occurred over an extended length of about 0.5D in midstream as compared to the peaks of downstream, which occurred over a short length of 0.2D. The highest value of in the TKE method was about 50% and 70% higher than that in the Reynolds and modified TKE methods, respectively.
This study’s results may be helpful for developing computational fluid dynamic models for simulation flows around similar obstructions such as bridge piers. Moreover, the results can be used to understand and interpret sediment transport, scour, and fish habitat assessment in natural rivers with similar structures. Further studies are recommended to examine the effects of Reynolds number on flow characteristics and turbulent events effects on sediment mobility for a tandem arrangement of the cylinders.
Author Contributions
Conceptualization, H.Z. and A.B.M.B.; methodology, H.Z., A.B.M.B., and S.N.N.; formal analysis, H.Z., A.B.M.B., and S.N.N.; investigation, H.Z. and S.N.N.; resources, H.Z.; writing—original draft preparation, H.Z. and A.B.M.B.; writing—review and editing, H.Z. and A.B.M.B.; supervision, H.Z.; project administration, H.Z.; All authors have read and agreed to the published version of the manuscript.
Funding
The third author was provided with financial support from the Bangladesh University of Engineering and Technology (BUET).
Institutional Review Board Statement
Not applicable.
Informed Consent Statement
Not applicable.
Data Availability Statement
Some or all data, models, or code generated or used during the study are available from the corresponding author by request.
Acknowledgments
The authors wish to thank laboratory attendants for their invaluable help in the lab measurements. The manuscript benefitted from the constructive comments of anonymous reviewers.
Conflicts of Interest
The authors declare no conflict of interest.
References
- Zhou, Y.; Yiu, M.W. Flow structure, momentum and heat transport in a two-tandem-cylinder wake. J. Fluid Mech. 2006, 548, 17–48. [Google Scholar] [CrossRef] [Green Version]
- Heidari, M. Wake Characteristics of Single and Tandem Emergent Cylinders in Shallow Open Channel Flow. Ph.D. Thesis, University of Windsor, Windsor, ON, Canada, 2016. Available online: https://scholar.uwindsor.ca/etd/5733 (accessed on 24 January 2021).
- Nosier, M.A.; Elbaz, A.R.; Fetouh, T.A.; El-Gabry, L.A. Characteristics of turbulent wakes generated by twin parallel cylinders. J. Fluids Eng. 2012, 134, 121201. [Google Scholar] [CrossRef]
- AlQadi, I.; AlHazmy, M.; Al-Bahi, A.; Rodi, W. Large eddy simulation of flow past tandem cylinders in a channel. Flow Turbul. Combust. 2015, 95, 621–643. [Google Scholar] [CrossRef]
- Shamloo, H.; Rajaratnam, N.; Katopodis, C. Hydraulics of simple habitat structures. J. Hydraul. Res. 2001, 39, 351–366. [Google Scholar] [CrossRef]
- Sadeque, M.F.; Rajaratnam, N.; Loewen, M.R. Shallow turbulent wakes behind bed-mounted cylinders in open channels. J. Hydraul. Res. 2009, 47, 727–743. [Google Scholar] [CrossRef]
- Rostamy, N.; Sumner, D.; Bergstrom, D.J.; Bugg, J.D. Local flow field of a surface-mounted finite circular cylinder. J. Fluids Struct. 2012, 34, 105–122. [Google Scholar] [CrossRef]
- Zdravkovich, M.M. The effects of the interference between circular cylinders in cross flow. J. Fluids Struct. 1987, 1, 239–261. [Google Scholar] [CrossRef]
- Sharman, B.; Lien, F.S.; Davidson, L.; Norberg, C. Numerical predictions of low Reynolds number flows over two tandem circular cylinders. Int. J. Numer. Meth. Fluids 2005, 47, 423–447. [Google Scholar] [CrossRef]
- Papaioannou, G.V.; Yue, D.K.P.; Triantafyllou, M.S.; Karniadakis, G.E. Three-dimensionality effects in flow around two tandem cylinders. J. Fluid Mech. 2006, 558, 387–413. [Google Scholar] [CrossRef] [Green Version]
- Lin, J.C.; Yang, Y.; Rockwell, D. Flow past two cylinders in tandem: Instantaneous and averaged flow structure. J. Fluids Struct. 2002, 16, 1059–1071. [Google Scholar] [CrossRef]
- Pinarbasi, A.; Pinar, E.; Akilli, H.; Ince, E. Shallow water experiments of flow past two identical square cylinders in tandem. Eur. J. Mech. B/Fluids 2015, 49, 100–107. [Google Scholar] [CrossRef]
- Akilli, H.; Rockwell, D. Vortex formation from a cylinder in shallow water. Phys. Fluids 2002, 14, 2957–2967. [Google Scholar] [CrossRef]
- Gao, Y.; Yu, D.; Tan, S.; Wang, X.; Hao, Z. Experimental study on the near wake behind two side-by-side cylinders of unequal diameters. Fluid Dyn. Res. 2010, 42, 055509. [Google Scholar] [CrossRef]
- Kirkil, G.; Constantinescu, G. A numerical study of the laminar necklace vortex system and its effect on the wake for a circular cylinder. Phys. Fluids 2012, 24, 073602. [Google Scholar] [CrossRef]
- Kirkil, G.; Constantinescu, G. Effects of cylinder Reynolds number on the turbulent horseshoe vortex system and near wake of a surface-mounted circular cylinder. Phys. Fluids 2015, 27, 075102. [Google Scholar] [CrossRef] [Green Version]
- Nezu, I.; Nakagawa, H. Turbulence in Open-Channel Flows; Balkema: Rotterdam, The Netherlands, 1993. [Google Scholar]
- Baki, A.B.M.; Zhang, W.; Zhu, D.Z.; Rajaratnam, N. Flow structures in the vicinity of a submerged boulder within a boulder array. J. Hydraul. Eng. 2016, 143, 04016104. [Google Scholar] [CrossRef]
- Biron, P.M.; Robson, C.; Lapointe, M.F.; Gaskin, S.J. Comparing different methods of bed shear stress estimates in simple and complex flow fields. Earth Surf. Process. Landf. J. Br. Geomorphol. Res. Group 2004, 29, 1403–1415. [Google Scholar] [CrossRef]
- Strom, K.B.; Papanicolaou, A.N. ADV measurements around a cluster microform in a shallow mountain stream. J. Hydraul. Eng. 2007, 12, 1379–1389. [Google Scholar] [CrossRef]
- Wahl, T.L. WinADV Version 2.028: A Windows-Based Viewing and Post-Processing Utility for ADV Files; User’s Manuals and On-Line Help Provided with the Software. 2002. Available online: http://www.usbr.gov/wrrl/twahl/winadv/ (accessed on 24 January 2021).
- Goring, D.G.; Nikora, V.I. Despiking acoustic Doppler velocimeter data. J. Hydraul. Eng. 2002, 128, 117–126. [Google Scholar] [CrossRef] [Green Version]
- Kim, S.C.; Friedrichs, C.T.; Maa, J.Y.; Wright, L.D. Estimating bottom stress in tidal boundary layer from acoustic Doppler velocimeter data. J. Hydraul. Eng. 2000, 126, 399–406. [Google Scholar] [CrossRef] [Green Version]
- Papanicolaou, A.N.; Kramer, C.M.; Tsakiris, A.G.; Stoesser, T.; Bomminayuni, S.; Chen, Z. Effects of a fully submerged boulder within a boulder array on the mean and turbulent flow fields: Implications to bedload transport. Acta Geophys. 2012, 60, 1502–1546. [Google Scholar] [CrossRef]
- Zexing, X.; Chenling, Z.; Qiang, Y.; Xiekang, W.; Xufeng, Y. Hydrodynamics and bed morphological characteristics around a boulder in a gravel stream. Water Supply 2020, 20, 397–407. [Google Scholar] [CrossRef]
- Dey, S.; Sarkar, S.; Bose, S.K.; Tait, S.; Castro-Orgaz, O. Wall-wake flows downstream of a sphere placed on a plane rough wall. J. Hydraul. Eng. 2011, 137, 1173–1189. [Google Scholar] [CrossRef]
- Baki, A.B.M.; Zhu, D.Z.; Rajaratnam, N. Turbulence characteristics in a rock-ramp-type fish pass. J. Hydraul. Eng. 2015, 141, 04014075. [Google Scholar] [CrossRef]
Figure 1.
Plan view of the position of the measurement stations in the symmetry plane midstream and downstream for 3 scenarios: S1, S2, and S3. The + symbol shows the position of the measurement stations. U/S and D/S indicate upstream and downstream, respectively.
Figure 1.
Plan view of the position of the measurement stations in the symmetry plane midstream and downstream for 3 scenarios: S1, S2, and S3. The + symbol shows the position of the measurement stations. U/S and D/S indicate upstream and downstream, respectively.

Figure 2.
Vertical profiles of dimensionless streamwise velocity (u/u*) in the symmetry plane: (a) midstream and (b) downstream. A solid black line shows the classical logarithmic law.
Figure 2.
Vertical profiles of dimensionless streamwise velocity (u/u*) in the symmetry plane: (a) midstream and (b) downstream. A solid black line shows the classical logarithmic law.

Figure 3.
Velocity vector and isocontours of dimensionless streamwise velocity (u/u*) on the symmetry plane for the 3 experimental scenarios S1, S2, and S3, combining both midstream and downstream.
Figure 3.
Velocity vector and isocontours of dimensionless streamwise velocity (u/u*) on the symmetry plane for the 3 experimental scenarios S1, S2, and S3, combining both midstream and downstream.

Figure 4.
Variation of dimensionless depth-averaged streamwise velocity (ud/u*) in the symmetry plane: (a) midstream and (b) downstream.
Figure 4.
Variation of dimensionless depth-averaged streamwise velocity (ud/u*) in the symmetry plane: (a) midstream and (b) downstream.

Figure 5.
Vertical profiles of dimensionless turbulent kinetic energy (ke/u*2) in the symmetry plane for the 3 experimental scenarios S1, S2, and S3, combining both midstream and downstream.
Figure 5.
Vertical profiles of dimensionless turbulent kinetic energy (ke/u*2) in the symmetry plane for the 3 experimental scenarios S1, S2, and S3, combining both midstream and downstream.

Figure 6.
Variation of dimensionless maximum turbulent kinetic energy (ke/u*2) in the symmetry plane: (a) midstream and (b) downstream.
Figure 6.
Variation of dimensionless maximum turbulent kinetic energy (ke/u*2) in the symmetry plane: (a) midstream and (b) downstream.

Figure 7.
Vertical profiles of dimensionless resultant Reynolds shear stress (τp/u*2) in the symmetry plane for the 3 experimental scenarios S1, S2, and S3, combining both midstream and downstream.
Figure 7.
Vertical profiles of dimensionless resultant Reynolds shear stress (τp/u*2) in the symmetry plane for the 3 experimental scenarios S1, S2, and S3, combining both midstream and downstream.

Figure 8.
Variation of dimensionless maximum projected Reynolds shear stress (τp/u*2) in the symmetry plane: (a) midstream and (b) downstream.
Figure 8.
Variation of dimensionless maximum projected Reynolds shear stress (τp/u*2) in the symmetry plane: (a) midstream and (b) downstream.

Figure 9.
Variation of dimensionless maximum near-bed shear stress () using the Reynolds (Equation (3)), TKE (Equation (4)), and modified TKE (Equation (5)) methods in the symmetry plane: (a) midstream and (b) downstream.
Figure 9.
Variation of dimensionless maximum near-bed shear stress () using the Reynolds (Equation (3)), TKE (Equation (4)), and modified TKE (Equation (5)) methods in the symmetry plane: (a) midstream and (b) downstream.


Table 1.
Details regarding the experimental scenarios.
| Experimental Scenarios | Cylinder Diameter (D) | Cylinder Spacing * | Flow Rate | Approach Water Depth (H) | Approach Flow Velocity θ | Reynolds Number Ϯ (Rd) | Shear Velocity ± (u *) | Average | Average | Data Retained |
|---|---|---|---|---|---|---|---|---|---|---|
| COR | SNR | |||||||||
| - | (cm) | (times) | (m3/s) | (cm) | (cm/s) | - | (cm/s) | (%) | (dB) | (%) |
| S1 | 15 | 3D | 0.069 | 26.5 | 35.3 | 52,900 | 1.4 | 80.6 | 16.7 | 90.1 |
| S2 | 15 | 6D | 0.069 | 26.5 | 35.3 | 52,900 | 1.4 | 80.6 | 16.9 | 90.4 |
| S3 | 15 | 9D | 0.069 | 26.5 | 35.3 | 52,900 | 1.4 | 78.3 | 15.6 | 91.2 |
± The Reynolds shear stress method was applied to estimate u* using measured Reynolds shear stress very close to the bed (lower 10% depth). Ϯ Reynolds number is based on the diameter of the cylinder. * Spacing is in center to center. θ Depth-averaged approach flow velocity magnitude.
Publisher’s Note: MDPI stays neutral with regard to jurisdictional claims in published maps and institutional affiliations. |
© 2021 by the authors. Licensee MDPI, Basel, Switzerland. This article is an open access article distributed under the terms and conditions of the Creative Commons Attribution (CC BY) license (https://creativecommons.org/licenses/by/4.0/).
Share and Cite
MDPI and ACS Style
Zobeyer, H.; Baki, A.B.M.; Nowrin, S.N. Interactions between Tandem Cylinders in an Open Channel: Impact on Mean and Turbulent Flow Characteristics. Water 2021, 13, 1718. https://doi.org/10.3390/w13131718
AMA Style
Zobeyer H, Baki ABM, Nowrin SN. Interactions between Tandem Cylinders in an Open Channel: Impact on Mean and Turbulent Flow Characteristics. Water. 2021; 13(13):1718. https://doi.org/10.3390/w13131718
Chicago/Turabian StyleZobeyer, Hasan, Abul B. M. Baki, and Saika Nowshin Nowrin. 2021. "Interactions between Tandem Cylinders in an Open Channel: Impact on Mean and Turbulent Flow Characteristics" Water 13, no. 13: 1718. https://doi.org/10.3390/w13131718
Note that from the first issue of 2016, this journal uses article numbers instead of page numbers. See further details here.