
Urban Flood Management through Urban Land Use Optimization Using LID Techniques, City of Addis Ababa, Ethiopia


1
College of Architecture and Civil Engineering, Addis Ababa Science and Technology University, Addis Ababa P.O. Box 16417, Ethiopia
2
Department of Earth and Environment, Institute of Environment, Florida International University, Miami, FL 33199, USA
*
Author to whom correspondence should be addressed.
Water 2021, 13(13), 1721; https://doi.org/10.3390/w13131721
Submission received: 25 May 2021
/
Revised: 11 June 2021
/
Accepted: 14 June 2021
/
Published: 22 June 2021
(This article belongs to the Special Issue Advances of Low Impact Development Practices in Urban Watershed)
Abstract
:In recent years, many urban areas in Ethiopia have experienced frequent flood events as a result of climate change and urban sprawl. Unplanned and unsustainable poor urban storm water management strategies will aggravate the impact and frequency of flood occurrence. In this study, impacts of urbanization and climate change on generated flood magnitude are analyzed using the urban hydrological model of Storm Water Management Model (SWMM) and Low Impact Development (LID) sustainable land use optimization techniques. Three rainfall distribution patterns (TS1, TS2 and TS3) in combination with rainfall duration periods of 10, 30 and 60 min and a pessimistic climate change scenario of RCP 4.5 compared to RCP 8.5 are used for the analysis purpose for selected infiltration and storage LID techniques (Bio-Retention Cell, Infiltration Trench and Rain Barrel). The study results showed that combined LID techniques have a significant impact on urban flood reduction of up to 75%. This significant amount of flood reduction is greater than the amount of excess flood magnitude which occurred as a result of climate change using the most pessimistic climate change scenario. The study results also confirmed that rainfall patterns have a significant impact on peak discharge for shorter rainfall durations. This study highly recommends using cost effective, easy and environmental adaptive and sustainable LID techniques for urban flood management in addition to existing drainage structures.
1. Introduction
Due to global warming and climate change, frequent heavy precipitation and urban flooding are becoming serious problems in many countries all over the world [1,2]. Recent studies confirmed that there is a high probability of extreme rainfall occurrence in the future due to climate change [3]. Other researchers agreed on future climate impacts on precipitation variables and corresponding causes [4,5,6,7,8]. In recent years, many urban areas in Ethiopia have experienced various levels of flooding events as common tragedies [9,10,11]. The flash and high-volume floods on streets disrupting transportation facilities are becoming critical problems demanding solutions. Addis Ababa City is currently one of the urban areas vulnerable to flooding as a result of rapid urban sprawl, poor or no implementation of urban flood management strategies in addition to global common climate change impact. Furthermore, an increase in summer season precipitation is expected with a possible risk of flooding in urban areas [10,12]. The city is susceptible to both riverine and flash floods due to extreme rainfall events and upper catchment modifications (increased paved areas through deforestation).
As with most global urban areas, the vulnerability to flooding in Addis Ababa is caused the low level drainage standards, poor drainage capacity, inappropriate drainage alignment, aged drainage facilities and complicated drainage pipe networks with unreasonable settings, rapid housing development along river banks, and interruption of drainage facilities with other urban utility lines. It is then difficult to drain logged water out of the system in time before it causes severe flooding. Taking Arada and Addis Ketema Sub cities as an example, the drainage pipe network infrastructures in some areas are more than 100 years old, lacking the capacity to meet the current storm runoff volume. Existing drainage networks are fully or partially blocked by solid waste, the areas are fully occupied by impermeable pavements and buildings which are increasing the expansion of urban built-up areas, decreased or no infiltration into the underground, thus causing flooding on the Earth’s surface everywhere in every summer season. In addition, natural depression storages, ponds and wetlands, which are functioning as natural water storage facilities to delay and store flood events, are gradually filled or built-up artificially for other purposes. Decadal growth rate of both population and built-up areas is above 30% within the city which indicates that there is significant sprawl of urban or impervious areas [13,14]. Following rapid urban spread, there is an estimated annual peak runoff increase with a growth rate beyond 2.5% and more than half of the city’s population live in slum areas which are susceptible to riverine and flash flooding as a result of unplanned and informal settlements [10].
According to a report done by the Addis Ababa Fire and Emergency Prevention and Rescue Authority (AAFEPRA), 121,000 houses in the city, including 1000 governmental and private institutions, are in locations vulnerable to flooding and 143 areas have been identified as having a high risk of flooding. In 2017, for instance, there were 76 flood events in the city, damaging houses and properties worth 20 million birr. The events and their corresponding damages are constantly increasing within all sub cities. As a result, the city has started developing a city-wide drainage master plan study through Addis Ababa City Roads Authority (AACRA) to overcome existing urban flood and drainage problems.
Many researchers agreed to build a ‘sponge city’ which means creating optimized urban environment through maximizing infiltration, storage, water quality and minimizing runoff magnitudes [1]. Low Impact Development (LID), an equivalent storm water management technique has also been developed by researchers of United States since 1990s [15]. LID aims to control the runoff and pollution by means of decentralized, small-scale source control, making the development area as close to the natural hydrological cycle pattern as possible. It is a kind of environmental technique which easily realizes urban rainwater collection and utilization. Its facilities mainly include rain gardens, green roofs, permeable pavements, vegetative swales, bio-retention cells and rain storage through rain barrels. Low Impact Development is the basis of storm water management with the goal of simulating a site’s pre settlement hydrology by using design techniques that infiltrate, filter, store, evaporate, and detain runoff close to its source. Since LID uses a variety of useful methods for controlling runoff, designs can be customized according to local regulatory and resource protection requirements, as well as site constraints [16,17]. Even though many developed countries are implementing the strategy for their urban environments, Germany was the first country to adopt governmental control systems of urban runoff, and runoff management laws and regulations, technology guidance, and economic incentive policies on LID were also established [18].
Although the present control effect and performance of LID measures on runoff has been investigated and agreed among many scholars, there are still limited studies and implementation strategies that have focused on the control effects of the indicator and combined LID measures on small urban and semi-urban catchments under climate change-induced variable rainfall characteristics. Impacts of LID on runoff reduction with rainfall durations greater than 1 h (relatively for longer storm events) are done by [1,19,20]. However, urban runoff problems frequently occur as a result of intensive short rainfall durations causing flash floods [21], which needs independent analysis to elude the problem. Due their efficiency, sustainability and climate adaptability, currently there are high global demands to use LID to manage urban storm water [22,23]. Hence, the main objective of this study is to reduce urban flood magnitudes using various LID-based catchment optimization techniques. The research will deliver an intuition on the performance of selected LID scenarios to overcome increasing challenge of urban flood management under climate uncertainty.
In this research, four selected LID scenarios (1) no application of LID practice, (2) infiltration-based LID practice, (3) an LID method based on water harvesting and (4) an LID technique based on the combination of infiltration and water harvesting are designated to analyze runoff characteristics in various land uses and rainfall characteristics. This study focused on (1) Storm Water Management Model (SWMM) model construction and validation using the Runoff Curve Number method; (2) the selection and design of LID scenarios; (3) evaluation of four LID scenarios in peak runoff reduction; (4) the impact of land use changes on LID applications; and (5) runoff characteristics of various LID scenarios under different rainfall patterns. The results of this study will introduce decentralized urban flood management strategies and offer technical inputs for the design, planning and construction of environmentally adaptive urban drainage systems.
2. Materials and Methods
2.1. Study Area
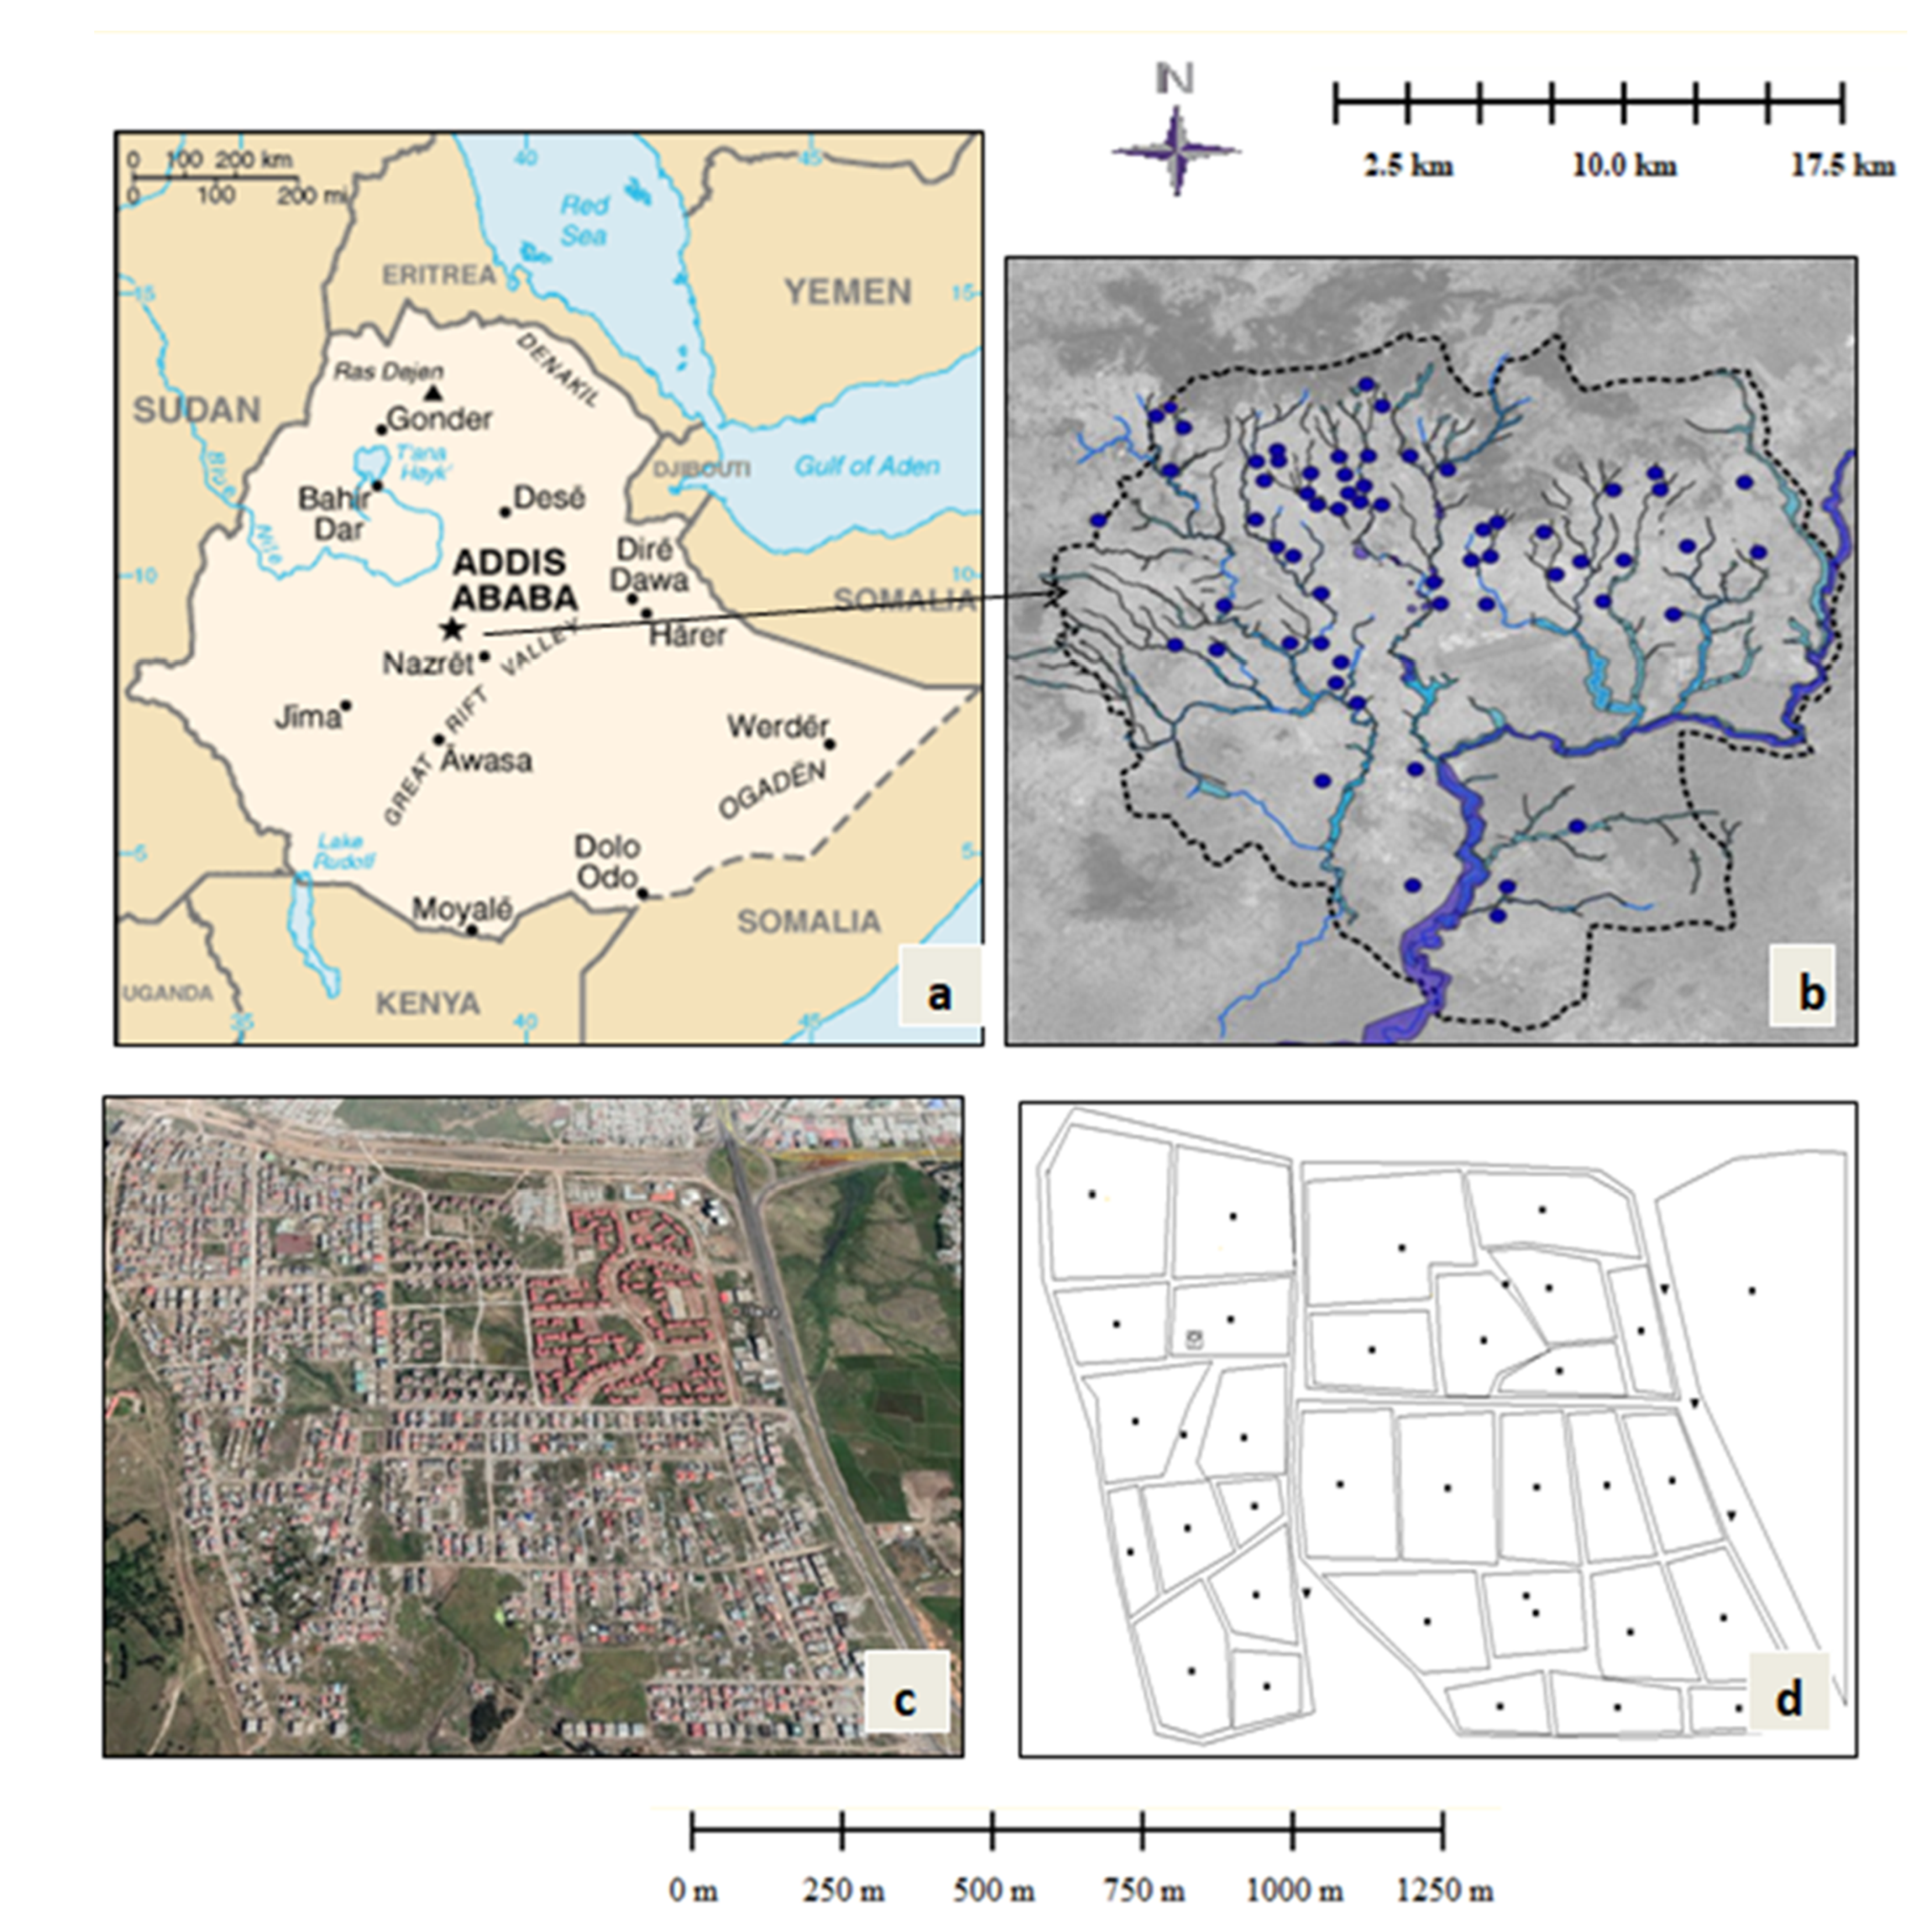
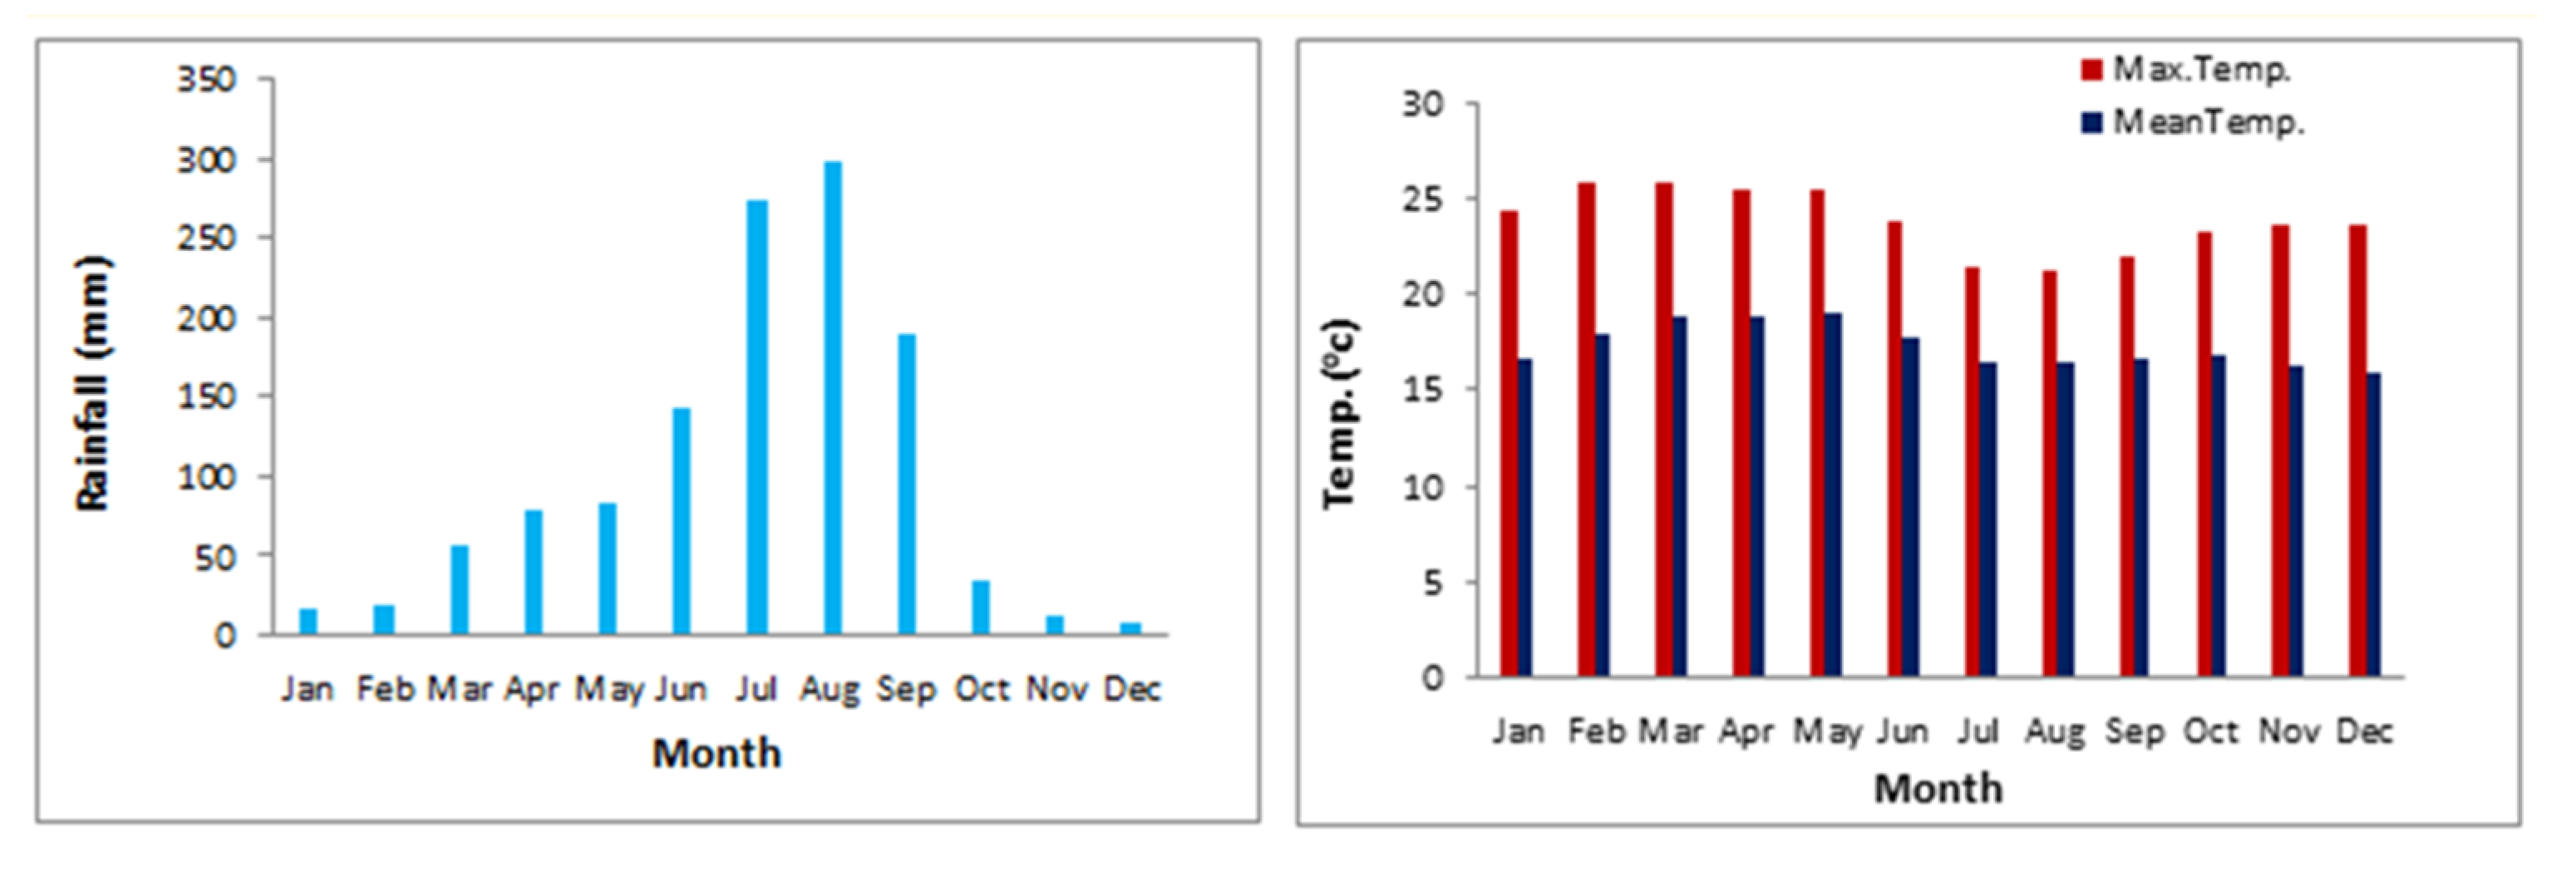
The study area is located in Southwest of Addis Ababa City, Ethiopia between 38°43′12.22″–38°44′03.11″ E and 8°55′29.85″–8°56′22.42″ N, in Nefas Silk Lafto Sub city (Figure 1). Elevation range from 2350 m to 2200 m above mean sea level. The area coverage is about 220 hectares in which 72.5% is mixed residential, 20.5% condominium houses and the other 7% is commercial and mixed use buildings. The area lies within a complex mix of highland climate zones with an average temperature of 15.8 °C and annual rainfall of 1260 mm. Winter and summer are the two major seasons. Due to spread of impervious areas and climate induced increase in summer precipitation, flooding has become a frequent problem in various areas. Figure 2 shows the long-term monthly rainfall and temperature for the study area.
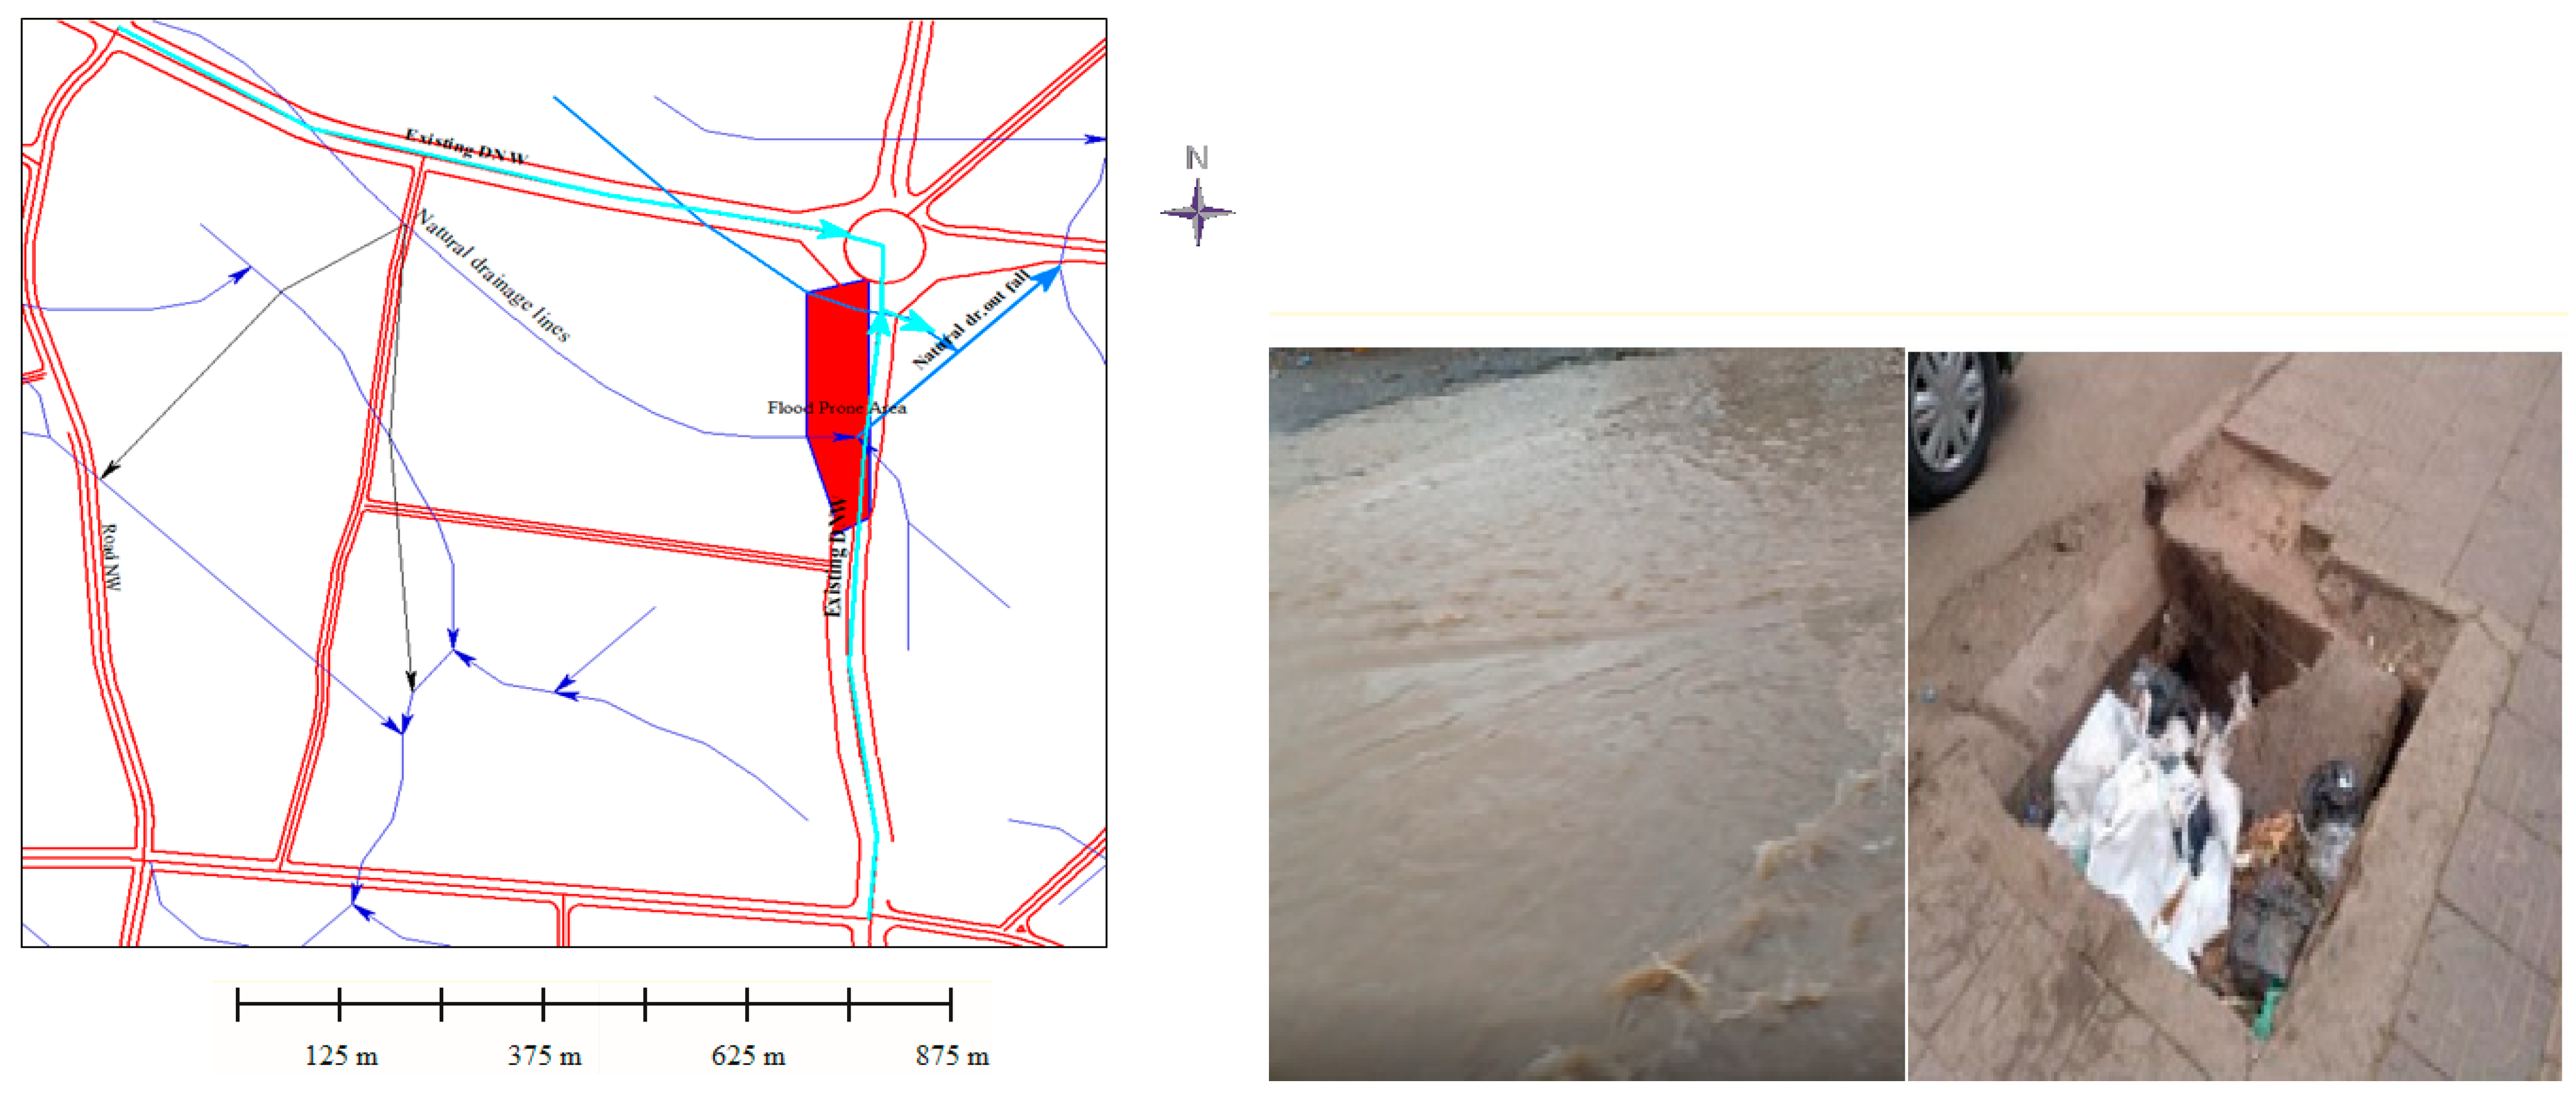
There is about 4.2 km of existing drainage network to serve the whole catchment area. However, the area demands planned and well-designed drainage networks with total length greater than 9 km with various types and sizes. In addition to inadequate drainage networks, existing drainage structures work partially due to solid waste blockage, inappropriate inlet structures and improper management. As a result, frequent flood events have been observed in the area affecting residents and transportation facilities which demands sustainable storm drainage strategies. Figure 3 show existing drainage networks, flood prone areas and observed site conditions.
2.2. LID
LID is a decentralized ecological-based storm water management approach favoring soft engineering to manage runoff on site through vegetated and storage networks [16,17]. It is climate-adaptive, easy to construct, small in size, economical, and aesthetically valuable to the landscape. LID uses the integration of hard engineering such as mechanical surface runoff control and/or storage methods by using detention and retention structures with soft engineering such as infiltration, filtration and treatment.
Several LID components are created within the Storm Water Management Model (SWMM) and then added to the corresponding subarea by varying parameters according to the actual site situation.
2.3. SWMM Model and Simulation Process
In this research, SWMM is applied for urban rainfall runoff process simulation. The model is a commonly used and widely applicable dynamic urban rainfall runoff process simulation model which is primarily used to simulate single storm events or long-term (continuous) simulation of runoff from primarily built-up areas [24].
According to SWMM, the drainage system is categorized into four components: atmosphere, land surface, groundwater, and conveyance. The study area is sub divided into several sub-catchments according to the type of underlying surface and drainage networks. Moreover, the runoff process in each sub-catchment is computed under specific storm intensities. Proposed LID techniques are introduced for each sub-catchment based on land surface conditions. The overland flow is calculated by specifying each subarea into a nonlinear reservoir model and dynamic wave routing model is selected to simulate the inflow, outflow and reflow in the pipelines. The study area is first divided into several large-scale sub-catchments based on the existing natural streams or main drainage networks and main roads, then further subdivided based on collector streets and drainage networks. The study area is divided into 34 sub-catchments in total as the layout of the drainage system is shown in above Figure 1.
2.4. Climate Change
In our study, climate change impact on extreme rainfall magnitudes is considered for the most pessimistic scenario of RCP 4.5 in comparison with RCP 8.5 and base line climate scenarios. According to IPCC, 2014 report and other recent studies conducted by the authors of [6,25,26,27], there is an agreement that there has been significant increase in precipitation extremes due to climate change even though annual average precipitation has decreased. In addition to extreme rainfall magnitude changes, climate change will also impact rainfall patterns and their durations [5]. Table 1 shows extreme precipitation indices and their corresponding changes within the study area using various work of the literature.
Based on the above literature, average climate change values of extreme precipitation indices (Table 1) are taken to fix rainfall intensity for selected rainfall return periods of 5, 10 and 25 years. Consequently, a mean rainfall intensity increase of 19.6% is taken for the corresponding RCP 4.5 climate scenario for all return periods. However, the maximum probable range of rainfall intensity change is a 35% increase.
2.5. Design of Rainstorm
Rainstorm is the basis for urban rainfall runoff process and model simulation to design appropriate drainage networks. Many scholars have developed their own equations to estimate rainfall intensity using available historical rainfall data and catchment conditions. The general formula for rainfall, duration and frequency relationships originally developed by [28] is:
where: i = rainfall intensity (mm/h); td = rainfall duration (h); a, b, c = constants
The general formula modified by [28,29] incorporating return period (T) and additional coefficient k is used as follows:
where: T = rainfall return period (year); a, b, c and k = constants. Constants a, b, c and k are obtained through regression by using historical recorded rainfall data of durations of 10, 20, 30 and 60 min.
In addition to the above formula, the following widely used and recommended method proposed by Ethiopian Roads Authority Drainage Design Manual [30] is used for intensity computation and verification of sub-hourly data obtained from the Ethiopian meteorological agency.
where: Rt = rainfall depth for time ‘t’; R24 = 24 h rainfall depth; b and n = coefficients. Short rainfall durations of 10, 20, 30 and 60 min are taken for the purpose of analysis.
2.6. Model Parameter Calibration and Validation
Initial model parameter values were determined by empirical values as recommend in the SWMM manual [24], as shown in Table 2. Then, the parameter values were calibrated and validated using the principle of the comprehensive curve number coefficient (CCNC), as shown in Table 3. Thus, the initial parameter values were modified to meet the corresponding comprehensive runoff coefficient (CRC). When the final model parameters shown in Table 2 were used, the corresponding comprehensive runoff coefficients were obtained, as shown in Table 3. All simulation results satisfied the requirement of the CCNC in the densely built-up commercial areas (78–94).
A rational formula was used to estimate peak discharges for corresponding rainfall return periods and durations. Then, using equivalent the curve number coefficient, various SWMM parameters were fixed.
2.7. Design of LID Scenarios
From widely available candidate LID measures, only rain barrels (storage methods), bio-retention cells and infiltration trench (infiltration methods) were selected in this study as a result of their simplicity, efficiency and cost. Field investigation was conducted to select their suitability and applicability. Based on space (land) constraints and simplicity, single use residential areas were identified as suitable for rainfall storage. In the other hand condominium areas, urban open spaces between mixed use buildings and residential areas are assessed as compatible for LID infiltration techniques.
Accordingly, four types of LID scenarios selected were: no LID technique, an LID technique based on infiltration (bio-retention and infiltration trench), an LID technique based on water storage (rain barrel) and an LID technique based on the combination of infiltration and water storage. Figure 4 shows configuration and distribution of LID facilities.
- No LID technique: This does not consider any LID effect and it is therefore considered as a base line scenario.
- LID technique based on infiltration (LID-Infiltration): This scenario consists of LID types that temporarily store runoff and infiltrate into the ground. In this study only the effects of Bio-Retention cells and infiltration trenches were taken among alternative infiltration-based LID techniques. Based on land use types and their area coverage (Table 4) and population density, both LID techniques were proposed on relatively sparsely populated areas and condominium houses as shown in Figure 4.
- LID technique based on water storage (LID-Storage): Rain barrels were proposed to be located in densely populated residential areas. Storage units were set up for runoff control in sub-catchment areas which are prone to flooding by collecting runoff from roof tops. It was proposed that 60% of households use rain barrels for this purpose. There are about 5500 housing units excluding condominium houses and about 3300 rain barrels to be used.
- LID technique based on the combination of infiltration and water storage (LID-Combination): This scenario is a combination of scenario 2 and scenario 3 (Table 5).
2.8. Rainfall Patterns and Durations
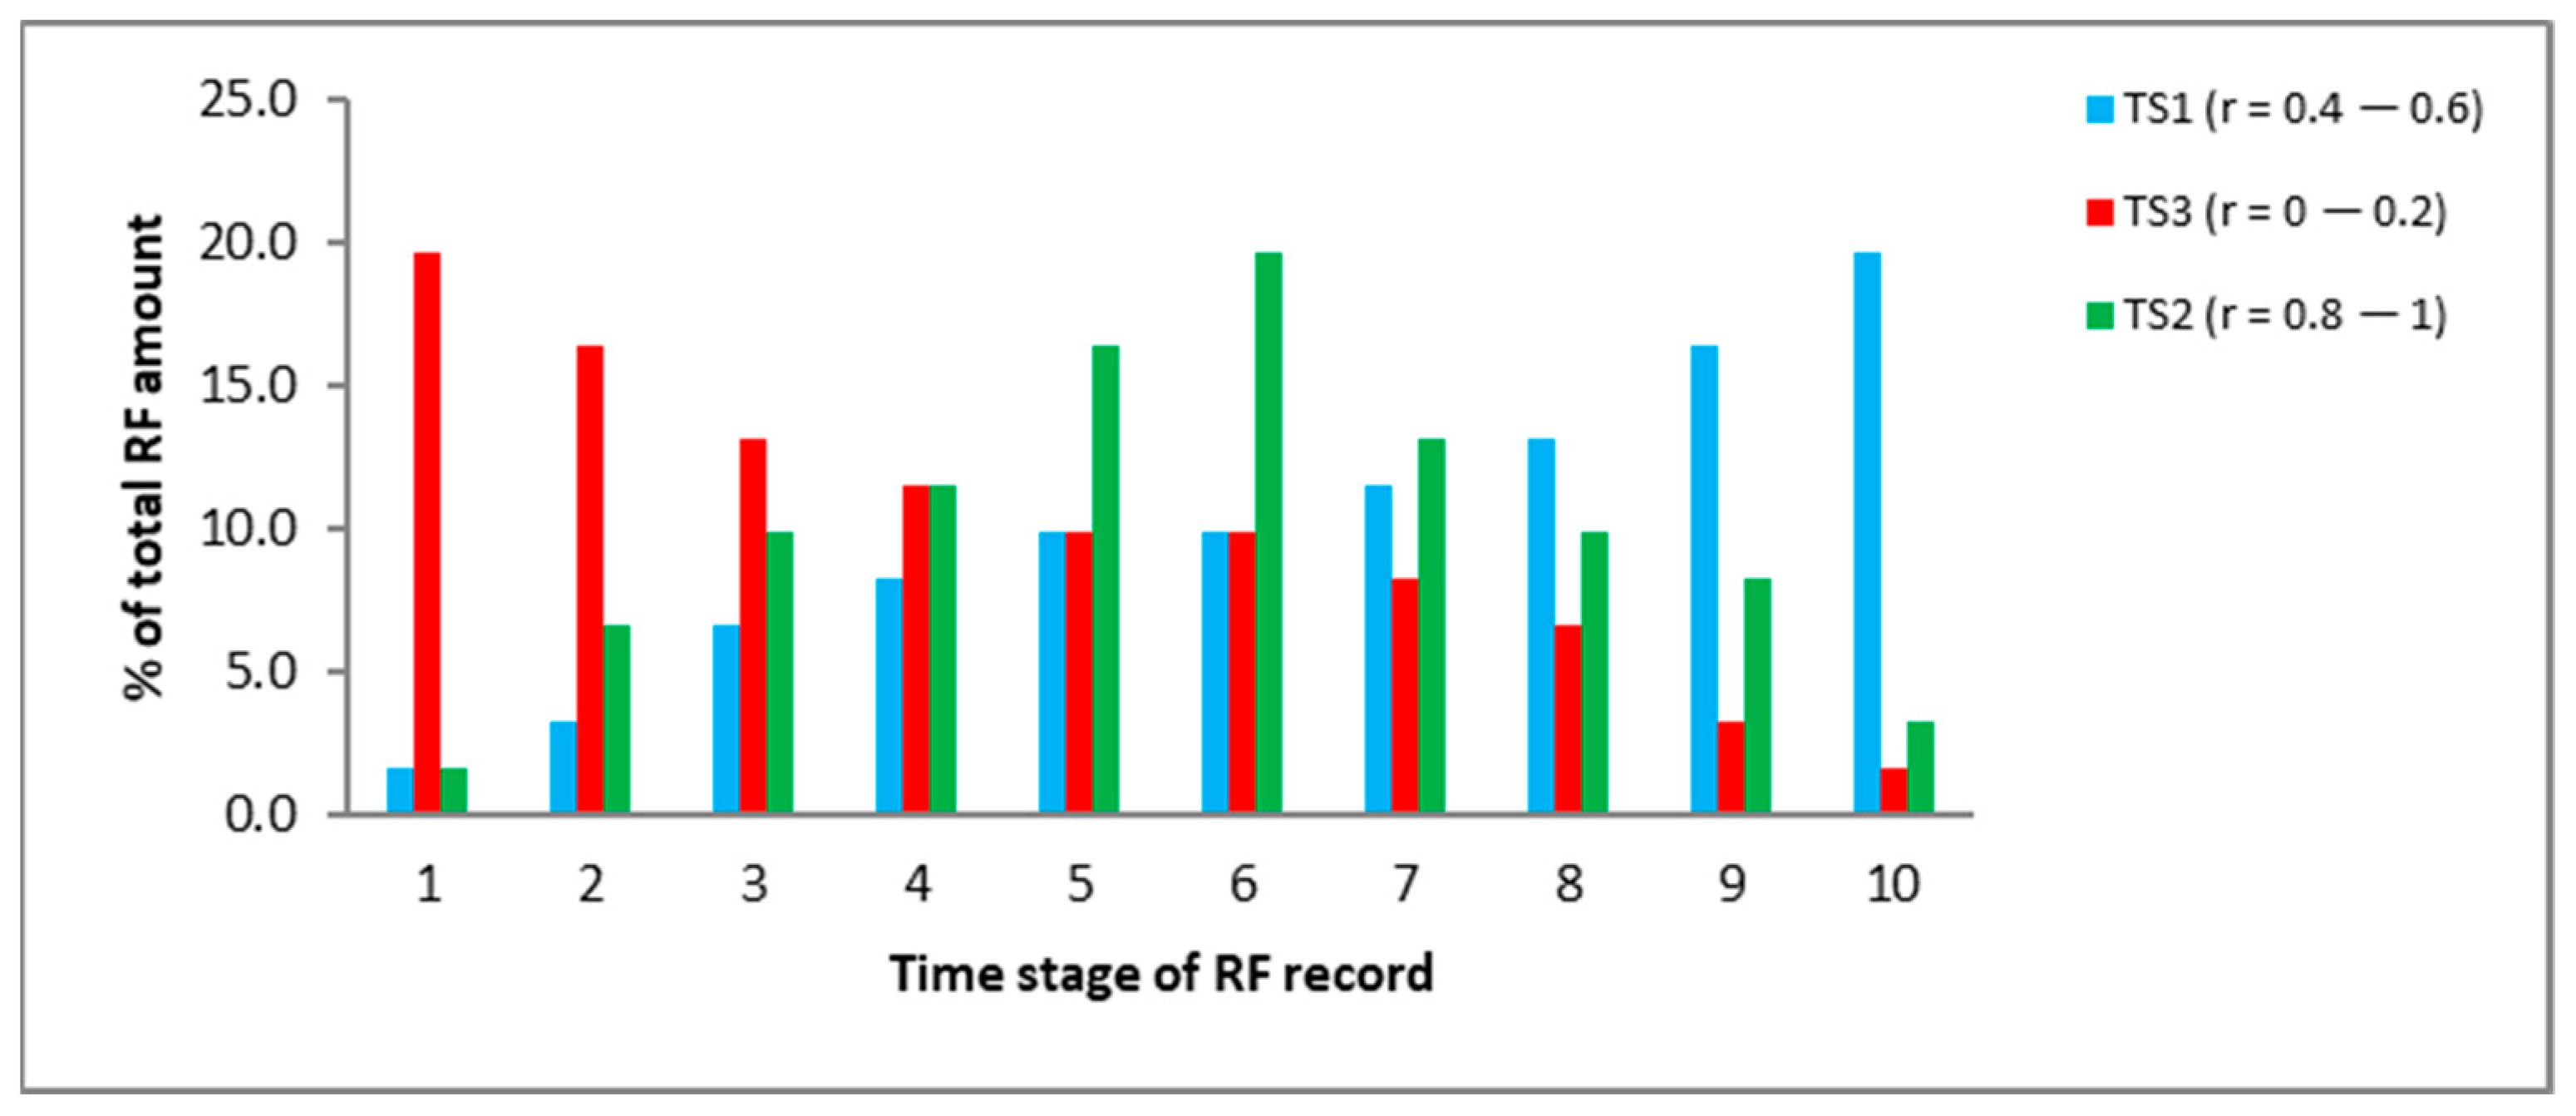
Three rainfall patterns were selected in our study using the ratio of peak rainfall time to total rainfall duration time (r). (TS1) Normal storm distribution with the peak at the middle of total storm duration (r = 0.4–0.6), (TS2) Peak rainfall at the end of rainfall event (r = 0.8–1) and (TS3) Peak rainfall at the start of the rain (r = 0–0.2). Rainfall durations of 10, 30 and 60 min were taken to represent short intensive and moderate rainfall durations. Figure 5 shows the proposed three rainfall patterns.
3. Results
Effects of selected storage and infiltration storm runoff management techniques of LID for relatively shorter rainfall induced runoff peaks and volumes emerged and are analyzed in this study under considerations of no climate change and a pessimistic climate scenario of RCP 4.5.
3.1. Effects of Various LID Scenarios on Rainfall-Runoff Relation of 10 min Duration
As is shown in Figure 6, all LID techniques have significant runoff reduction capacities for the shortest rainfall duration of 10 min. The result showed that use of LID combination techniques has capacity for maximum peak reduction up to 76.4% for the case of rainfall pattern TS3 followed by 75.4% of both the TS1 and TS2 rainfall patterns. Peak runoff reduction efficiency of all LID techniques is similar for all rainfall patterns. Application of LID storage using rain barrels (RB) only can reduce peak runoff up to 35% if it is effectively applied. The combination of LID infiltration techniques of bio-retention cells (BRC) and infiltration trenches (IT) can reduce peak runoff magnitude by 48.5%, whereas LID combination techniques of storage and infiltration have the capacity to reduce it by 75.5%. In addition to peak runoff reduction capacities, all LID techniques have make contributions to recharging ground water storage and can support by decreasing demand for domestic water to be used for household gardening. LID storage techniques can further reduce demand for domestic water to be used for toilets, washing and other purposes.
3.2. Effects of Various LID Scenarios on Runoff of 30 min Storm Duration
Use of LID techniques has remarkable runoff peak and volume reduction roles in a storm duration of 30 min without affecting time to peak as shown in Figure 7 below. LID combination measures have an average capacity of 71% peak runoff reduction for all rainfall patterns. There are peak reduction runoff rates of about 33%, 46% and 72% using LID-Storage, LID-Infiltration and LID-Combination techniques, respectively. Compared to a rainfall duration of 10 min, there is insignificant decrease in peak runoff rate in the case of a 30 min rainfall event. The result indicates that there is high potential for runoff reduction if all types of LID techniques are implemented based on land use types and scenarios. In addition, impacts of flash floods on urban residential areas can be easily managed using decentralized LID storage techniques.
3.3. Effects of Various LID Scenarios on Rainfall-Runoff Relation of 1 h Duration
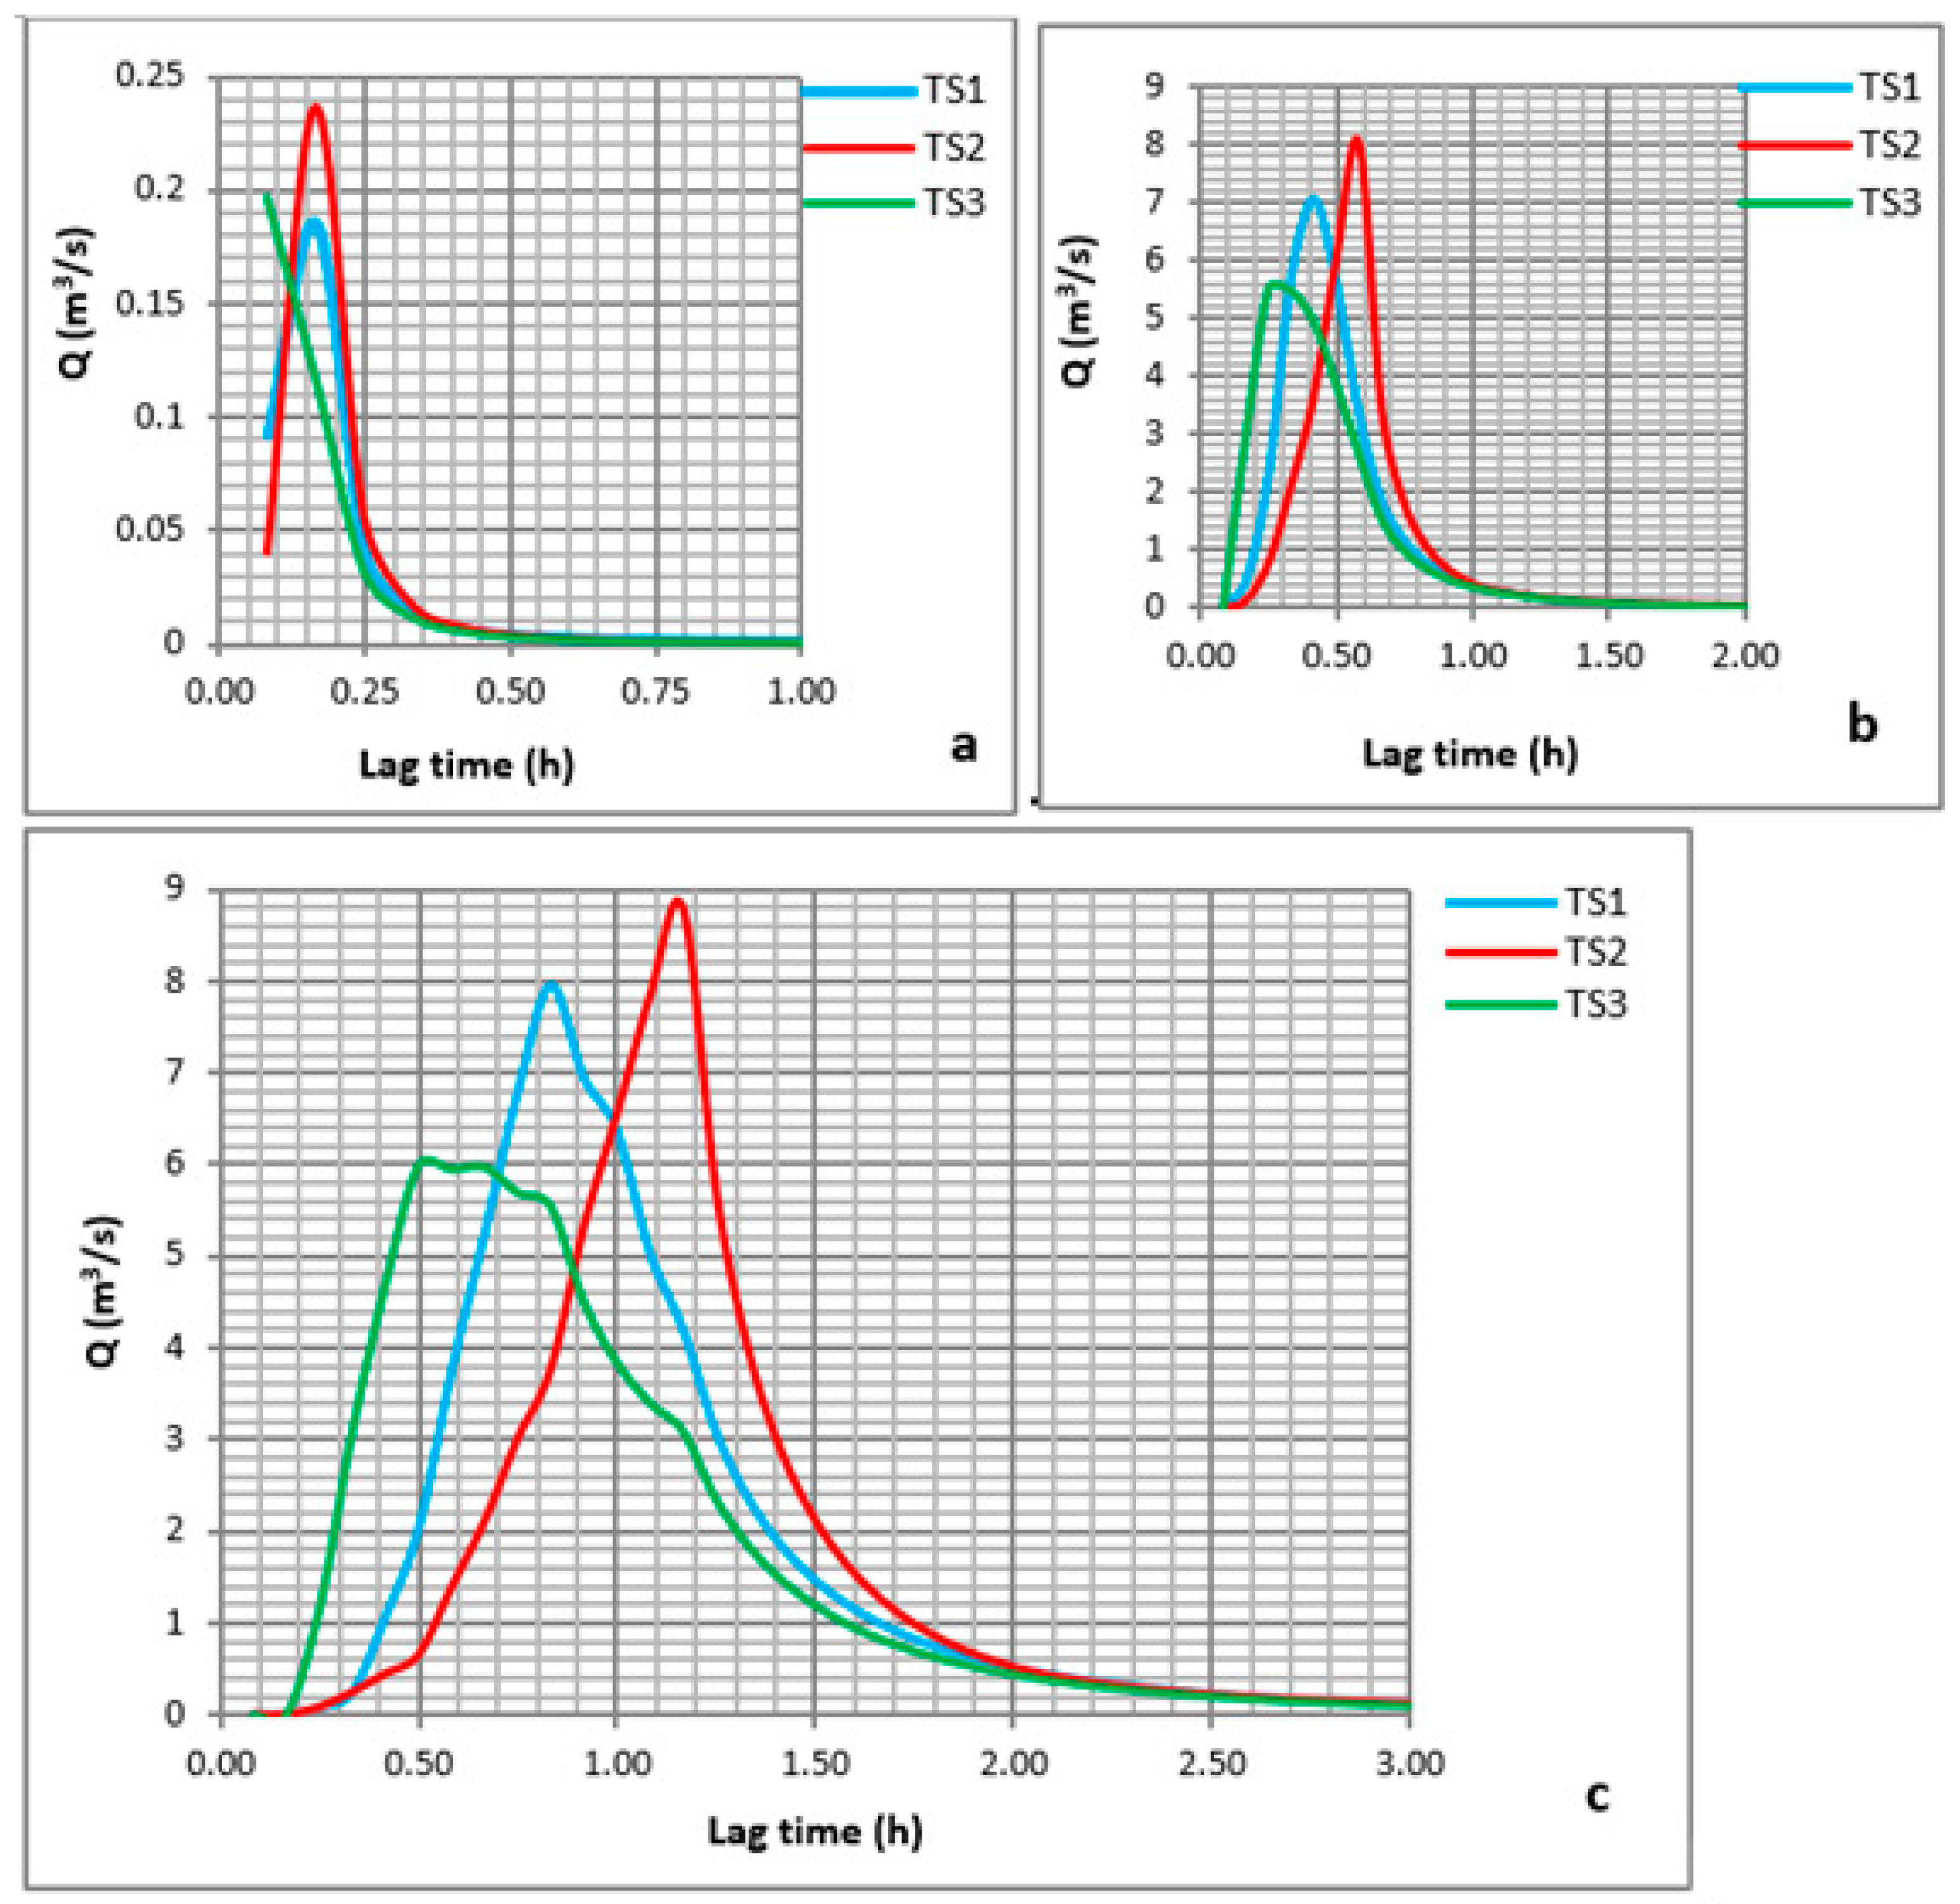
Besides smaller areas contributing runoff as a result of intensive short rainfall durations, runoff from relatively larger areas and longer duration can also be managed using LID techniques. The results shown in Figure 8 confirm that both LID-Storage and LID-Infiltration techniques have a significant role in runoff reduction for a 1 h rainfall duration as those of 10 min and 30 min shorter rainfall durations except very small decrease. LID combination techniques show that peak runoff reduction rates of 70.7%, 69.2% and 71.4% occur for rainfall patterns of TS1, TS2 and TS3, respectively. As it is shown in Figure 9, rainfall patterns have significant impacts on time to runoff peak for all rainfall durations of 10 min, 30 min and 1 h.
3.4. Effect of LID Scenarios under Climate Change
Considering a Representative Concentration Pathway (RCP 4.5) climate scenario and 30 min rainfall duration, the effect is analyzed as shown in Figure 10. Compared to the no climate change scenario, RCP 4.5 showed significant peak runoff and volume increases up to 75%, 71%, 79% and 67.7%, 70.4%, 67.7% for rainfall patterns of TS1, TS2 and TS3, respectively. Even though there is a substantial peak runoff increase as a result of climate change, LID-Combination techniques have shown substantial potential to reduce the peak up to 70%, 68.7% and 71% for the corresponding rainfall patterns of TS1, TS2 and TS3, respectively, as shown in Figure 10a–c. In addition to peak reduction rates, they have an average 66.5% volume reduction rate for all rainfall patterns (Figure 10d). There is no significant runoff reduction efficiency of LID measures for both climate change and baseline scenarios with similar values of 72% and 70% reduction in peak and volume, respectively, for all rainfall patterns.
4. Discussion
4.1. Impact of Rainfall Patterns on Peak Runoff
Many researchers agree that there is high probability of rainfall magnitude, duration, frequency and pattern change as a result of climate uncertainty. From three rainfall pattern scenarios, rainfall pattern TS2 (when r > 0.8) has an increased peak runoff impact for all rainfall durations. For the 10 min short rainfall event, rainfall patterns of TS2 and TS3 have runoff peak increase rates of 28.1% and 6.4%, respectively, compared to the normal rainfall pattern (TS1) (Figure 11a). Whereas storm event with a 30 min rainfall duration showed a 16% increase and 23.2% decrease in peak runoff for rainfall patterns TS2 and TS3, respectively, as shown in Section 3.3 of Figure 9b. Compared to shorter rainfall durations of 10 and 30 min, rainfall pattern TS2 for the storm event with a relatively longer duration of 1 h shows a lower peak runoff increase which is 10.4%. However, for the same 1 h rainfall duration decreasing rainfall pattern, TS3 shows a significant peak runoff decrease of 24.7% compared to TS1 (Figure 11c). The decreasing rainfall pattern (TS3) for 30 min and 1 h durations has showed a decrease in peak runoff compared to other rainfall patterns of TS2 and TS1, whereas a 10 min short rainfall duration does not show any decrease in peak runoff magnitude rather than a showing small shift of time to peak. On the other hand, both rainfall patterns TS2 and TS3 for all rainfall durations show significant shifts of time to peak compared to TS1 with proportional to their durations (Figure 11).
The reason for peak runoff increase for rainfall pattern TS2 is that the impact of initial depression storage or antecedent moisture conditions of the surface. When the surface is dry, depression storages are filled with less intensive rainfalls during the initial stages of the rain and high intensive rainfall magnitudes at the end of storm event are completely converted to direct runoff. On the contrary, if the antecedent moisture condition of the surface is initially wet, rainfall patterns will have no significant impact on peak runoff. TS2 and TS3 did not show a significant change of runoff volume compared to TS1. As is shown in Figure 9 of Section 3.3, rainfall patterns also have significant impacts on time to runoff peak with rainfall durations of 30 min and 1 h due to a delayed or early concentration time of intensive rainfall. In TS2, peak runoff can be observed to occur later, whereas in TS3 it is observed earlier compared to TS1. The study result indicates that there may be a risk of flash floods due to climate change-induced rainfall pattern changes unless proper urban flood management strategies are applied.
According to the study conducted on field experimental plots performed by [31], increase in peak runoff is observed for increasing type of rainfall pattern compared to other rainfall patterns. This study output is similar to the result of the study observed in the TS2 rainfall pattern. The result of the field experimental by [32] confirmed that increasing intensity rainfall types with a shorter duration have a significant impact on surface runoff with high erosion potential.
Our study confirmed that rainfall pattern changes have no significant impact on runoff volume changes for all rainfall durations, as shown in Figure 9d. There is only a little insignificant volume decrease in rainfall pattern TS2 compared to TS1 and TS3. The result implies that the storage type of urban storm management strategy can be effectively implemented regardless of rainfall pattern changes produced by climate change. In the other hand design-related issues should consider the consequences of climate change on rainfall pattern changes.
4.2. Impact of LID Measures on Runoff Management
The results of LID impacts on 1 h duration shown in Figure 8 indicate that there is an average peak runoff reduction rate of up to 70% using both the LID storage and LID infiltration methods. Our study is supported by the related study done by [1] who observed peak runoff reduction rates up to 32% using both LID infiltration and storage techniques for rainfall events with 2 h and 3 h durations. The runoff reduction rate of the study result is relatively smaller than our result, however the storm durations vary. Since most frequent flood events occur as a result of intensive rainfall events with durations less than 1 h, our study result shows that LID techniques are vital for small urban watersheds used to manage flash flood events using decentralized approaches at community and household levels. From study results, we observed that effect and efficiency of LID measures on runoff reduction depend highly on types and number of LID techniques which need availability of adequate urban spaces. The result in Figure 12 confirmed that integrated and combined LID techniques are effective runoff reduction measures in which the area is suitable for implementation if supported by governmental urban planning policies.
Another study done by [23] observed a total surface runoff reduction rate of 101% using an LID-based district unit planning model. This study result indicates that the methods are efficient urban flood management strategies and the maximum peak runoff reduction obtained in our study can be maximized by increasing LID scenarios. A study done by [33] obtained an annual runoff reduction rate up to 53.4% by considering the most effective LID scenario of MaxPerf. Even though most LID applications and research outputs are done in other countries with different land use and soil types, the study results agree their impact on runoff reduction which confirms our study result. In addition to sustainable urban runoff management, LID techniques such as bio retention have significant impacts on mitigation of urban pollution by increasing water quality and improving the conservation rate of the natural environment [23,33]. According to the study done by [20], about 10% of urban flood attenuation was obtained for short rainfall events using permeable pavement and green roof LID techniques only.
The LID model developed in this study is the tool used to indicate their applications in urban planning policies and strategies. The problem of existing urban flood management is that it only uses centralized structural measures which are inadequate in size, difficult for management and maintenance. The proposed LID tool in this study can be used to solve flood problems by incorporating it into urban design guidelines and policies up to lower governmental structures such as weredas and kebeles. For implementation, the model can be integrated and decentralized with various institutional stake holder organizations or offices such as the environmental protection agency, solid waste management office, water and sewerage authority, flood management and drainage, roads and infrastructures, design and construction office with other non-governmental organizations and the local community.
5. Conclusions and Recommendations
This study explored the effect of LID on urban runoff peaks and magnitude reduction under various rainfall patterns as a result of climate change and urbanization on a selected urban area in the city of Addis Ababa, Ethiopia. The analysis was performed using the SWMM model for selected LID scenarios. Three LID scenarios (storage, infiltration and combined) were applied with three rainfall patterns and two climate change scenarios (base line and RCP 4.5). Intensive and short rainfall durations from 10 min to 1 h are used to analyze the impacts.
The study showed that both LID storage and infiltration methods have significant runoff reduction roles to reduce flash flood impacts. If there are adequate urban spaces to provide LID measures, urban runoff can be managed, and the cost of drainage structures will be minimized by using combined LID techniques. The rainfall pattern on dry surfaces (Antecedent Moisture Condition, AMC I) has a more significant impact on peak runoff magnitude than those for moderate and wet surface conditions. The study showed that short rainfall durations are more sensitive than long rainfall durations to rainfall pattern changes and highly affect runoff peak magnitudes. However, the results showed that there is no significant change in runoff volumes as a result of rainfall pattern changes.
The results of the study agree with various previous findings on the influence of climate change and urbanization on increasing peak runoff magnitudes. The study indicates that consideration of the rainfall pattern changes as a result of climate change in design and analysis of drainage structures on small and hilly urban and semi-urban watersheds. Climate change impacts will alter future rainfall patterns and runoff magnitudes significantly unless proper climate adaptive urban storm water management practices like LID techniques are implemented properly.
This research concluded that LID techniques are effective for urban runoff management based on available space, soil type and land use/land cover conditions of the area. As the proposed LID methods have shown the significant advantages of peak and volume runoff reductions regardless of other multiple advantages such as ground water recharge, aesthetic values, cost reduction of urban drainage structures and creation of a climate resilient urban environment to be studied in the future, the study highly recommends considering and implementing the methods for sustainable and climate adaptive urban runoff management through various policies and strategies of urban planning, design and implementation.
Author Contributions
Conceptualization, M.A.J. and A.M.M.; methodology, M.A.J.; software, M.A.J.; validation, M.A.J.; formal analysis, M.A.J.; investigation, M.A.J.; resources, M.A.J.; data curation, M.A.J.; writing—original draft preparation, M.A.J.; writing—review and editing, M.A.J. and A.M.M.; visualization, M.A.J.; supervision, A.M.M.; project administration, M.A.J. and A.M.M.; funding acquisition, M.A.J. All authors have read and agreed to the published version of the manuscript.”
Funding
This research received no external funding.
Institutional Review Board Statement
Not applicable.
Informed Consent Statement
Not applicable.
Data Availability Statement
The data presented in this study are available on request from the corresponding author.
Conflicts of Interest
The authors declare no conflict of interest.
References
- Bai, Y.; Zhao, N.; Zhang, R.; Zeng, X. Storm Water Management of Low Impact Development in Urban Areas Based on SWMM. Water 2018, 11, 33. [Google Scholar] [CrossRef] [Green Version]
- Miller, J.D.; Hutchins, M. The impacts of urbanisation and climate change on urban flooding and urban water quality: A review of the evidence concerning the United Kingdom. J. Hydrol. Reg. Stud. 2017, 12, 345–362. [Google Scholar] [CrossRef] [Green Version]
- Alexander, L.V. Global observed long-term changes in temperature and precipitation extremes: A review of progress and limitations in IPCC assessments and beyond. Weather. Clim. Extremes 2016, 11, 4–16. [Google Scholar] [CrossRef] [Green Version]
- Maghsood, F.F.; Moradi, H.; Bavani, A.R.M.; Panahi, M.; Berndtsson, R.; Hashemi, H. Climate Change Impact on Flood Frequency and Source Area in Northern Iran under CMIP5 Scenarios. Water 2019, 11, 273. [Google Scholar] [CrossRef] [Green Version]
- Hettiarachchi, S.; Wasko, C.; Sharma, A. Increase in flood risk resulting from climate change in a developed urban watershed—The role of storm temporal patterns. Hydrol. Earth Syst. Sci. 2018, 22, 2041–2056. [Google Scholar] [CrossRef] [Green Version]
- Tegegne, G.; Melesse, A.M.; Alamirew, T. Projected changes in extreme precipitation indices from CORDEX simulations over Ethiopia, East Africa. Atmos. Res. 2021, 247, 105156. [Google Scholar] [CrossRef]
- Zhou, Q.; Leng, G.; Huang, M. Impacts of future climate change on urban flood volumes in Hohhot in northern China: Benefits of climate change mitigation and adaptations. Hydrol. Earth Syst. Sci. 2018, 22, 305–316. [Google Scholar] [CrossRef] [Green Version]
- Pumo, D.; Arnone, E.; Francipane, A.; Caracciolo, D.; Noto, L. Potential implications of climate change and urbanization on watershed hydrology. J. Hydrol. 2017, 554, 80–99. [Google Scholar] [CrossRef]
- Erena, S.H.; Worku, H. Urban flood vulnerability assessments: The case of Dire Dawa city, Ethiopia. Nat. Hazards 2019, 97, 495–516. [Google Scholar] [CrossRef]
- Birhanu, D.; Kim, H.; Jang, C.; Park, S. Flood Risk and Vulnerability of Addis Ababa City Due to Climate Change and Urbanization. Procedia Eng. 2016, 154, 696–702. [Google Scholar] [CrossRef] [Green Version]
- Bulti, D.T.; Abebe, B.G. Analyzing the impacts of urbanization on runoff characteristics in Adama city, Ethiopia. SN Appl. Sci. 2020, 2, 1–13. [Google Scholar] [CrossRef]
- Kaykhosravi, S.; Khan, U.T.; Jadidi, M.A. The Effect of Climate Change and Urbanization on the Demand for Low Impact Development for Three Canadian Cities. Water 2020, 12, 1280. [Google Scholar] [CrossRef]
- UN-Habitat. The State of Addis Ababa; UN-Habitat: Nairobi, Kenya, 2017. [Google Scholar]
- The World Bank. Ethiopia Urbanization Review; The World Bank Group: Washington, DC, USA, 2015. [Google Scholar]
- US Environmental Protection Agency. Low Impact Development (LID) A Literature Review; EPA: Washington, DC, USA, 2000. [CrossRef]
- SBSU. Low Impact Development (LID) Guidance Manual; SBSU: Burlington, VT, USA, 2009. [Google Scholar]
- SEMCOG. Low Impact Development Manual for Michigan; SEMCOG: Detroit, MI, USA, 2008; pp. 169–192. [Google Scholar]
- Peng, C.; Li, X.; Wang, J.; Xiong, L.; Zhang, Y.; Liu, X. A high power light emitting diode module for projection display application. In Proceedings of the 2010 11th International Conference on Electronic Packaging Technology & High Density Packaging, Xi’an, China, 25–29 October 2010; pp. 1412–1416. [Google Scholar] [CrossRef]
- Peng, Z.; Jinyan, K.; Wenbin, P.; Xin, Z.; Yuanbin, C. Effects of Low-Impact Development on Urban Rainfall Runoff under Different Rainfall Characteristics. Pol. J. Environ. Stud. 2019, 28, 771–783. [Google Scholar] [CrossRef]
- Ghimire, G.; Thakali, R.; Kalra, A.; Ahmad, S. Role of Low Impact Development in the Attenuation of Flood Flows in Urban Areas. In Proceedings of the World Environmental and Water Resources Congress 2016, West Palm Beach, FL, USA, 22–26 May 2016; pp. 339–349. [Google Scholar] [CrossRef]
- Velásquez, N.; Hoyos, C.; Vélez, J.; Zapata, E. Reconstructing the Salgar 2015 Flash Flood Using Radar Retrievals and a Conceptual Modeling Framework: A Basis for a Better Flood Generating Mechanisms Discrimination. Hydrol. Earth Syst. Sci. 2018, 24, 1367–1392. [Google Scholar] [CrossRef] [Green Version]
- Kaykhosravi, S.; Khan, U.T.; Jadidi, M. A Comprehensive Review of Low Impact Development Models for Research, Conceptual, Preliminary and Detailed Design Applications. Water 2018, 10, 1541. [Google Scholar] [CrossRef] [Green Version]
- Son, C.H.; Hyun, K.H.; Kim, D.; Baek, J.I.; Ban, Y.U. Development and Application of a Low Impact Development (LID)-Based District Unit Planning Model. Sustainability 2017, 9, 145. [Google Scholar] [CrossRef] [Green Version]
- Rossman, L.A. Storm Water Management Model User Manual. Version 5; No. September; US Environmental Protection Agency: Washington, DC, USA, 2015.
- Mekonnen, K.; Melesse, A.M.; Woldesenbet, T.A. Spatial evaluation of satellite-retrieved extreme rainfall rates in the Upper Awash River Basin, Ethiopia. Atmos. Res. 2021, 249, 105297. [Google Scholar] [CrossRef]
- Kitoh, A.; Endo, H. Changes in precipitation extremes projected by a 20-km mesh global atmospheric model. Weather. Clim. Extremes 2016, 11, 41–52. [Google Scholar] [CrossRef] [Green Version]
- Feyissa, G.; Zeleke, G.; Bewket, W.; Gebremariam, E. Downscaling of Future Temperature and Precipitation Extremes in Addis Ababa under Climate Change. Climate 2018, 6, 58. [Google Scholar] [CrossRef] [Green Version]
- TS-79-225. Design of Urban Highway Drainage; U.S. Department of Transportation: Washington, DC, USA, 1979.
- Cardoso, C.O.; Bertol, I.; Soccol, O.J.; Sampaio, C.A.D.P. Generation of intensity duration frequency curves and intensity temporal variability pattern of intense rainfall for Lages/SC. Braz. Arch. Biol. Technol. 2013, 57, 274–283. [Google Scholar] [CrossRef] [Green Version]
- ERA. Drainage Design Manual; Ethiopian Roads Authority: Addis Ababa, Ethiopia, 2013.
- Mohamadi, M.A.; Kavian, A. Effects of rainfall patterns on runoff and soil erosion in field plots. Int. Soil Water Conserv. Res. 2015, 3, 273–281. [Google Scholar] [CrossRef] [Green Version]
- Duan, J.; Yang, J.; Tang, C.; Chen, L.; Liu, Y.; Wang, L. Effects of rainfall patterns and land cover on the subsurface flow generation of sloping Ferralsols in southern China. PLoS ONE 2017, 12, e0182706. [Google Scholar] [CrossRef] [PubMed] [Green Version]
- Li, C.; Liu, M.; Hu, Y.; Han, R.; Shi, T.; Qu, X.; Wu, Y. Evaluating the Hydrologic Performance of Low Impact Development Scenarios in a Micro Urban Catchment. Int. J. Environ. Res. Public Health 2018, 15, 273. [Google Scholar] [CrossRef] [PubMed] [Green Version]
Figure 1.
Study Area: map of Ethiopia (a); Map of Addis Ababa City showing recorded floods with blue points (b); study area condition showing flood prone areas in red (c); and proposed drainage system plan black points showing sub-catchment centroids (d).
Figure 1.
Study Area: map of Ethiopia (a); Map of Addis Ababa City showing recorded floods with blue points (b); study area condition showing flood prone areas in red (c); and proposed drainage system plan black points showing sub-catchment centroids (d).

Figure 2.
Long term monthly rainfall and temperature data of the study area.

Figure 3.
Existing drainage networks (left) and the observed flood events with non-functional drainage inlets (right).
Figure 3.
Existing drainage networks (left) and the observed flood events with non-functional drainage inlets (right).

Figure 4.
Configuration of various LID techniques and distributions.

Figure 5.
Rainfall patterns (TS1, TS2 and TS3).

Figure 6.
Effect of various LID scenarios on 10 min rainfall of: (a) rainfall pattern TS1; (b) rainfall pattern TS2 and (c) rainfall pattern TS3.
Figure 6.
Effect of various LID scenarios on 10 min rainfall of: (a) rainfall pattern TS1; (b) rainfall pattern TS2 and (c) rainfall pattern TS3.

Figure 7.
Impact of LID techniques on runoff generated from a 30 min rainfall duration of rainfall patterns: (a) TS1 (r = 0.4–0.6); (b) TS2 (r = 0.8–1) and (c) TS3 (r = 0–0.2).
Figure 7.
Impact of LID techniques on runoff generated from a 30 min rainfall duration of rainfall patterns: (a) TS1 (r = 0.4–0.6); (b) TS2 (r = 0.8–1) and (c) TS3 (r = 0–0.2).

Figure 8.
Impact of LID Scenarios on 1 h duration rainfall patterns: (a) TS1 (r = 0.4–0.6); (b) TS2 (r = 0.8–1) and (c) TS3 (r = 0–0.2).
Figure 8.
Impact of LID Scenarios on 1 h duration rainfall patterns: (a) TS1 (r = 0.4–0.6); (b) TS2 (r = 0.8–1) and (c) TS3 (r = 0–0.2).

Figure 9.
Effect of rainfall patterns on peak runoff magnitudes for storm durations of: (a) 10 min, (b) 30 min and (c) 1 h; (d) runoff volume and (e) average peak runoff.
Figure 9.
Effect of rainfall patterns on peak runoff magnitudes for storm durations of: (a) 10 min, (b) 30 min and (c) 1 h; (d) runoff volume and (e) average peak runoff.

Figure 10.
Climate Change and LID Impacts on Peak Runoff Magnitudes of Rainfall Patterns: (a) TS1; (b) TS2; (c) TS3 and (d) Runoff Volume.
Figure 10.
Climate Change and LID Impacts on Peak Runoff Magnitudes of Rainfall Patterns: (a) TS1; (b) TS2; (c) TS3 and (d) Runoff Volume.

Figure 11.
Effect of rainfall patterns on peak runoff and time to peak for rainfall durations of: (a) 10 min; (b) 30 min and (c) 1 h.
Figure 11.
Effect of rainfall patterns on peak runoff and time to peak for rainfall durations of: (a) 10 min; (b) 30 min and (c) 1 h.

Figure 12.
Effect of various LID methods on peak runoff reduction under various rainfall patterns and rainfall durations of: (a) 10 min; (b) 30 min and (c) 1 h.
Figure 12.
Effect of various LID methods on peak runoff reduction under various rainfall patterns and rainfall durations of: (a) 10 min; (b) 30 min and (c) 1 h.


Table 1.
Extreme precipitation indices and their corresponding changes within the study area using various work of the literature.
Table 1.
Extreme precipitation indices and their corresponding changes within the study area using various work of the literature.
| Extreme PCP Indices. | RCP 4.5 | RCP 8.5 | Reference | Extent of Study | ||||
|---|---|---|---|---|---|---|---|---|
| 2020s | 2050s | 2080s | 2020s | 2050s | 2080s | |||
| Rx1day | 20–25 | 25–30 | 30–35 | 15–20 | 15–20 | 15–20 | [6] | Ethiopia |
| ---- | 7.22 | ---- | ---- | ---- | ---- | [27] | Addis Ababa | |
| ---- | ---- | ---- | ---- | ---- | 15–30 | [26] | Worldwide | |
| Rx5day | 35–40 | 35–40 | 35–40 | 10–20 | 15–20 | 10–20 | [6] | Ethiopia |
| 21 | ---- | ---- | ----- | ----- | 17 | [27] | Addis Ababa | |
| ---- | ---- | ---- | ---- | ---- | 10–30 | [26] | Worldwide | |
| SDII | −4–20 | −4–22 | −5–23 | −12–5.5 | −7–8 | −5–18 | [6] | Ethiopia |
| ---- | ---- | ---- | ---- | ---- | 5–25 | [26] | Worldwide | |
| Total pcp | 40–65 | 40–65 | 40–65 | 15 | 10 | −10 | [6] | Ethiopia |
| ---- | ---- | 29.3 | ---- | ---- | 21 | [27] | Addis Ababa | |
| 95th p | 20 | 25 | 20 | 25 | 5 | 10 | [6] | Ethiopia |
| Pav | ---- | ---- | ---- | ---- | ---- | 5–15 | [26] | Worldwide |
| ---- | ---- | 5–10 | ---- | ---- | 15–30 | IPCC, 2014 | Global | |
Table 2.
Calibration and validation results of model parameters in SWMM.
| No | Model Parameter | Parameter Definition | Value Range | Initial Value | Final Value |
|---|---|---|---|---|---|
| 1 | N-Imperv | Manning coefficients in impervious areas | 0.006–0.05 | 0.01 | 0.014 |
| 2 | N-Perv | Manning coefficients in pervious areas | 0.08–0.5 | 0.1 | 0.1 |
| 3 | S-Imperv | Depression storage in impervious areas/mm | 0.011–0.24 | 0.02 | 0.05 |
| 4 | S-Perv | Depression storage in pervious areas/mm | 0.2–5 | 0.5 | 2 |
| 5 | Max-Rate | Maximum infiltration rate (mm/h) | 25–75 | 25 | 40 |
| 6 | Min-Rate | Minimum infiltration rate (mm/h) | 0–10 | 2 | 5 |
| 7 | Decay | Infiltration decay constant (1/h) | 2–7 | 3 | 5 |
| 8 | %Zero-Imperv | Percentage of impervious area with no depression storage (%) | 0–100 | 10 | 25 |
Table 3.
Empirical values of the regional comprehensive curve number coefficient.
| No | Land Use (Catchment Type) | Comprehensive Curve Number Coefficient (CCNC) | Equivalent Runoff Coefficient |
|---|---|---|---|
| 1 | Densely built commercial areas | 78–94 | 0.7–0.9 |
| 2 | Densely built residential areas | 76–92 | 0.6–0.8 |
| 3 | Sparsely built residential areas | 72–88 | 0.5–0.7 |
| 4 | Sparsely populated areas | 70–86 | 0.4–0.6 |
Table 4.
Different land use types and areas within the study area.
| No | Land Use Type | % Impervious | Area (ha) | Areal Coverage (%) |
|---|---|---|---|---|
| 1 | Built-up (houses) | 75 | 149.16 | 67.8 |
| 2 | Parking lots | 50 | 16.06 | 7.3 |
| 3 | Green areas | 40 | 27.06 | 12.3 |
| 4 | Roads and pavements | 70 | 24.64 | 11.2 |
| 5 | Stream | - | 3.08 | 1.4 |
| Total | - | 220 | 100 | |
Table 5.
Area coverage of different LID types.
| No | LID Type | Area (ha) | Coverage (%) | % of Total Area |
|---|---|---|---|---|
| 1 | Bio-Retention cell | 26.2 | 39.7 | 11.9 |
| 2 | Infiltration trench | 18.4 | 27.9 | 8.4 |
| 3 | Rain Barrel | 21.3 | 32.4 | 9.7 |
| Total | 65.9 | 100 | 30.00 | |
Publisher’s Note: MDPI stays neutral with regard to jurisdictional claims in published maps and institutional affiliations. |
© 2021 by the authors. Licensee MDPI, Basel, Switzerland. This article is an open access article distributed under the terms and conditions of the Creative Commons Attribution (CC BY) license (https://creativecommons.org/licenses/by/4.0/).
Share and Cite
MDPI and ACS Style
Jemberie, M.A.; Melesse, A.M. Urban Flood Management through Urban Land Use Optimization Using LID Techniques, City of Addis Ababa, Ethiopia. Water 2021, 13, 1721. https://doi.org/10.3390/w13131721
AMA Style
Jemberie MA, Melesse AM. Urban Flood Management through Urban Land Use Optimization Using LID Techniques, City of Addis Ababa, Ethiopia. Water. 2021; 13(13):1721. https://doi.org/10.3390/w13131721
Chicago/Turabian StyleJemberie, Mengistu A., and Assefa M. Melesse. 2021. "Urban Flood Management through Urban Land Use Optimization Using LID Techniques, City of Addis Ababa, Ethiopia" Water 13, no. 13: 1721. https://doi.org/10.3390/w13131721
Note that from the first issue of 2016, this journal uses article numbers instead of page numbers. See further details here.