
Changes in Glacial Meltwater Runoff and Its Response to Climate Change in the Tianshan Region Detected Using Unmanned Aerial Vehicles (UAVs) and Satellite Remote Sensing


Abstract
:1. Introduction
2. Study Area and Datasets
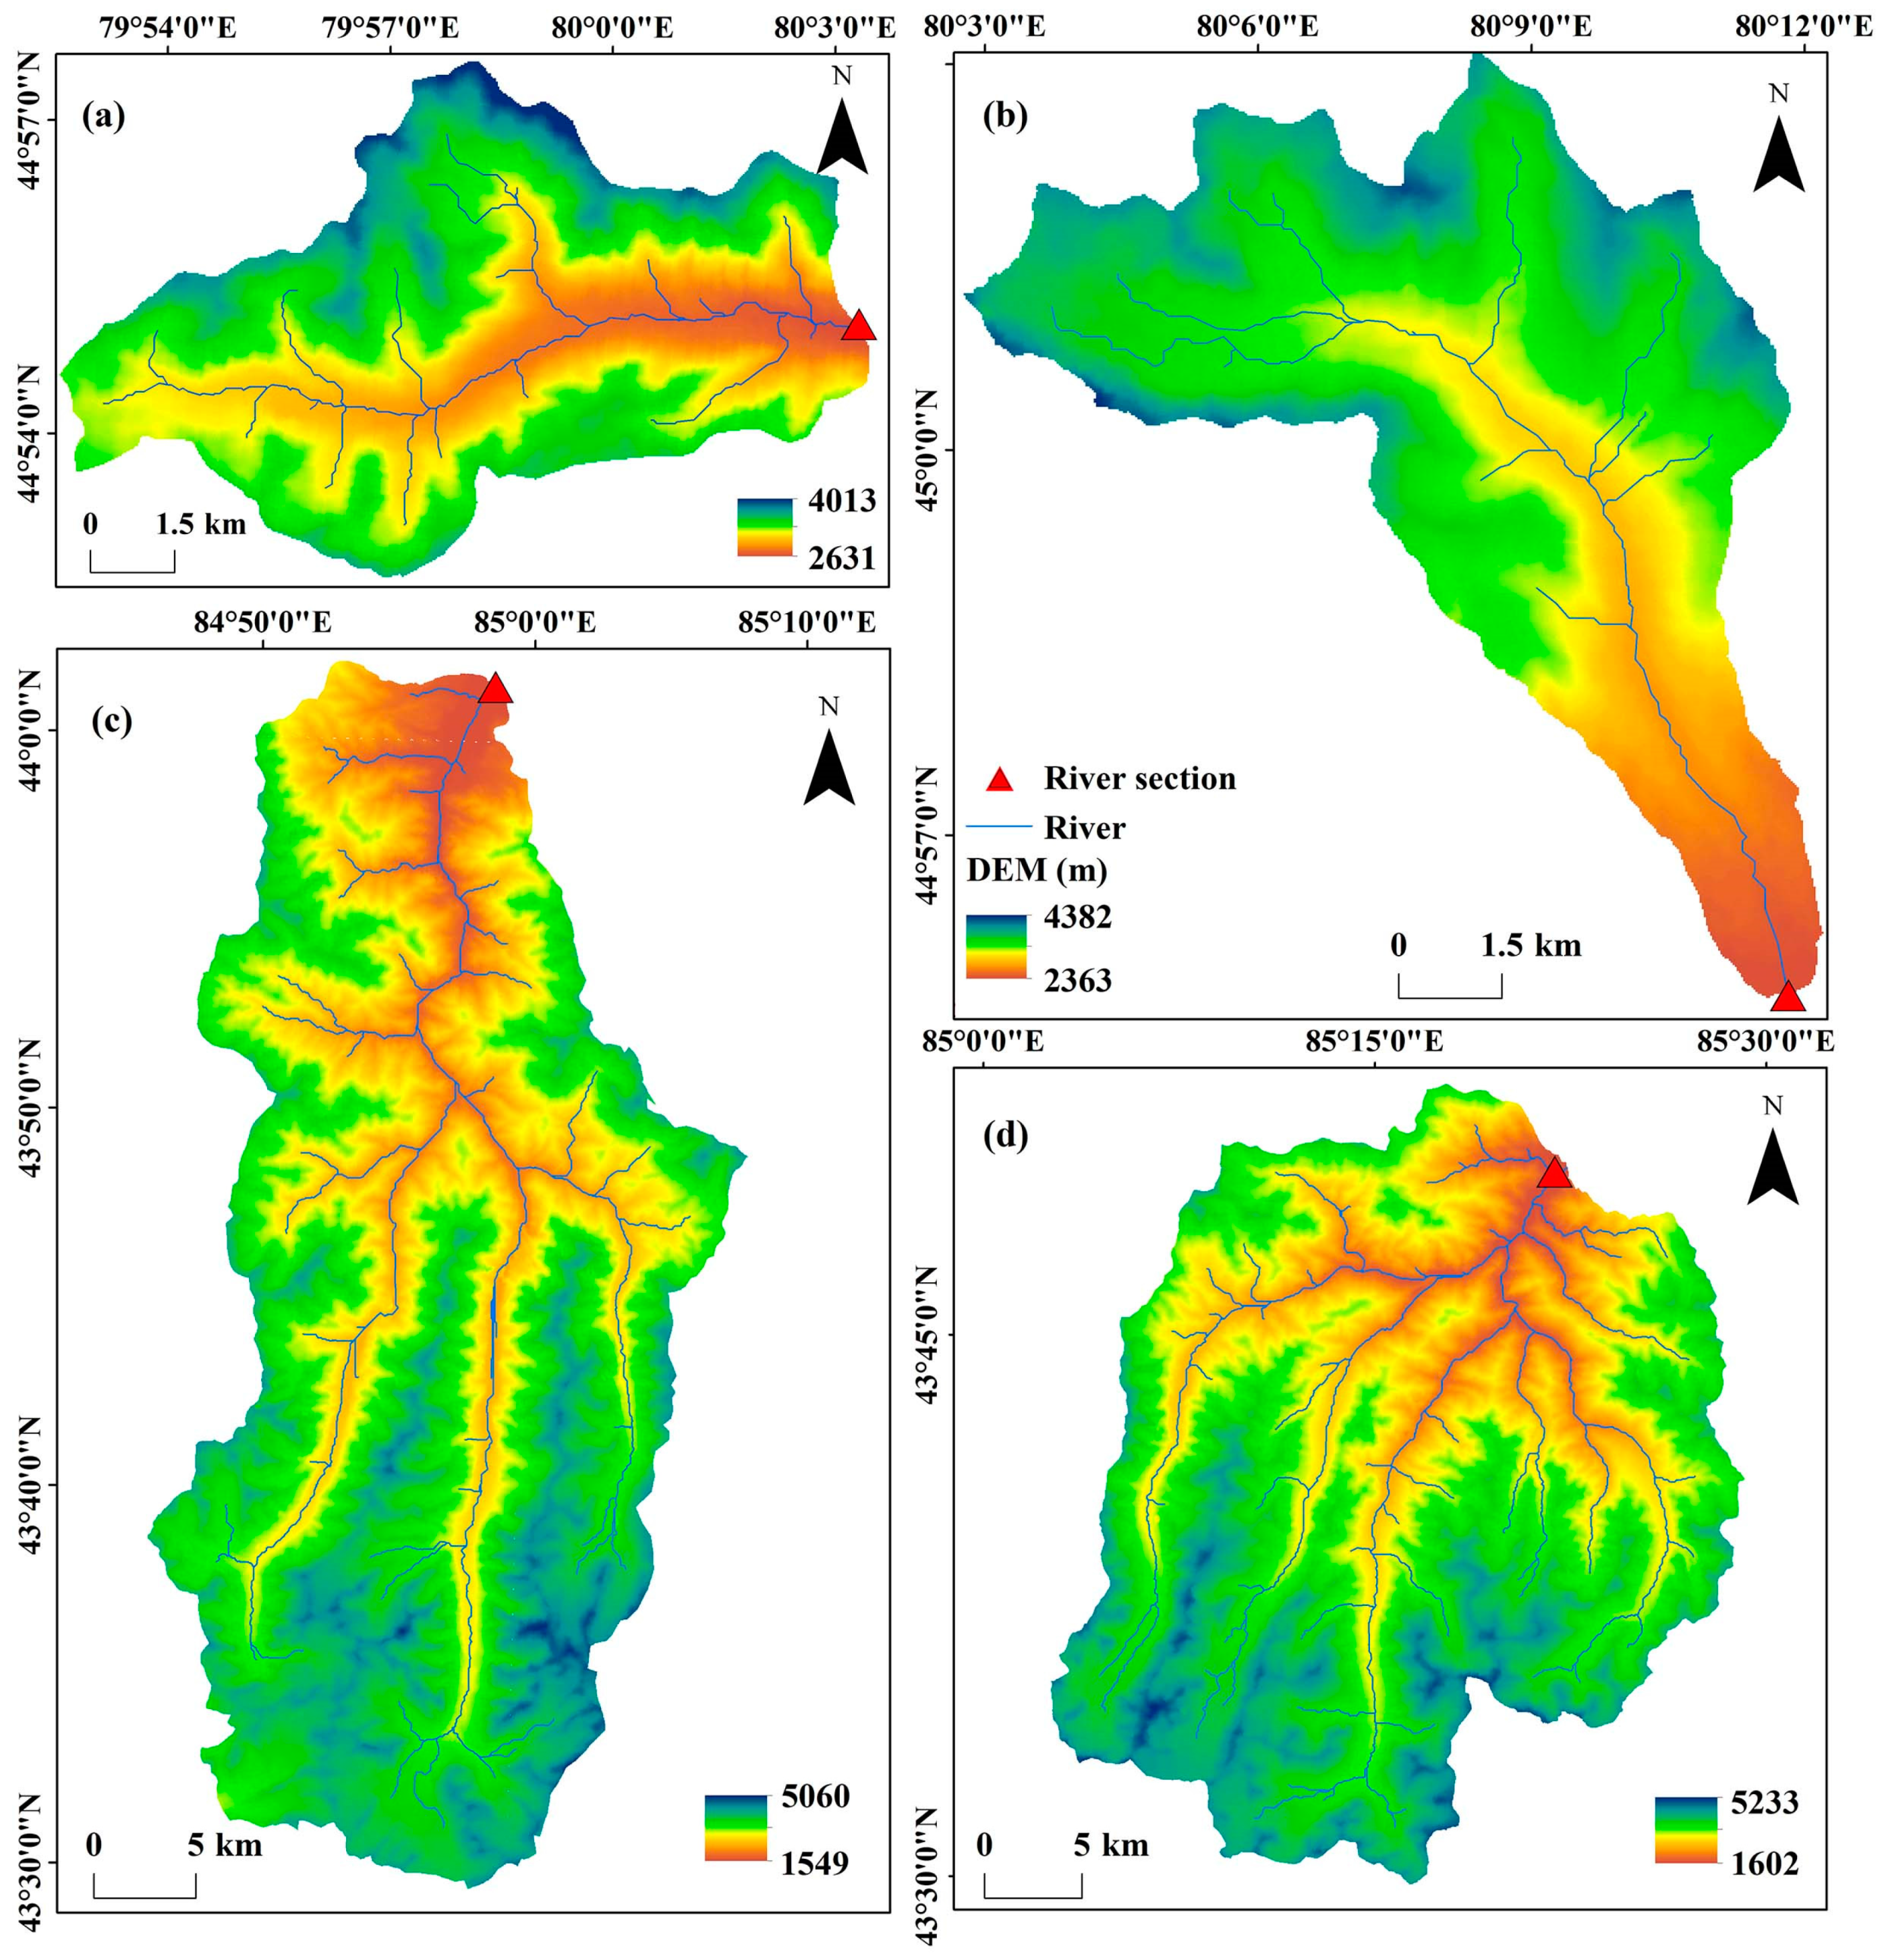
2.1. Study Area
2.2. Datasets
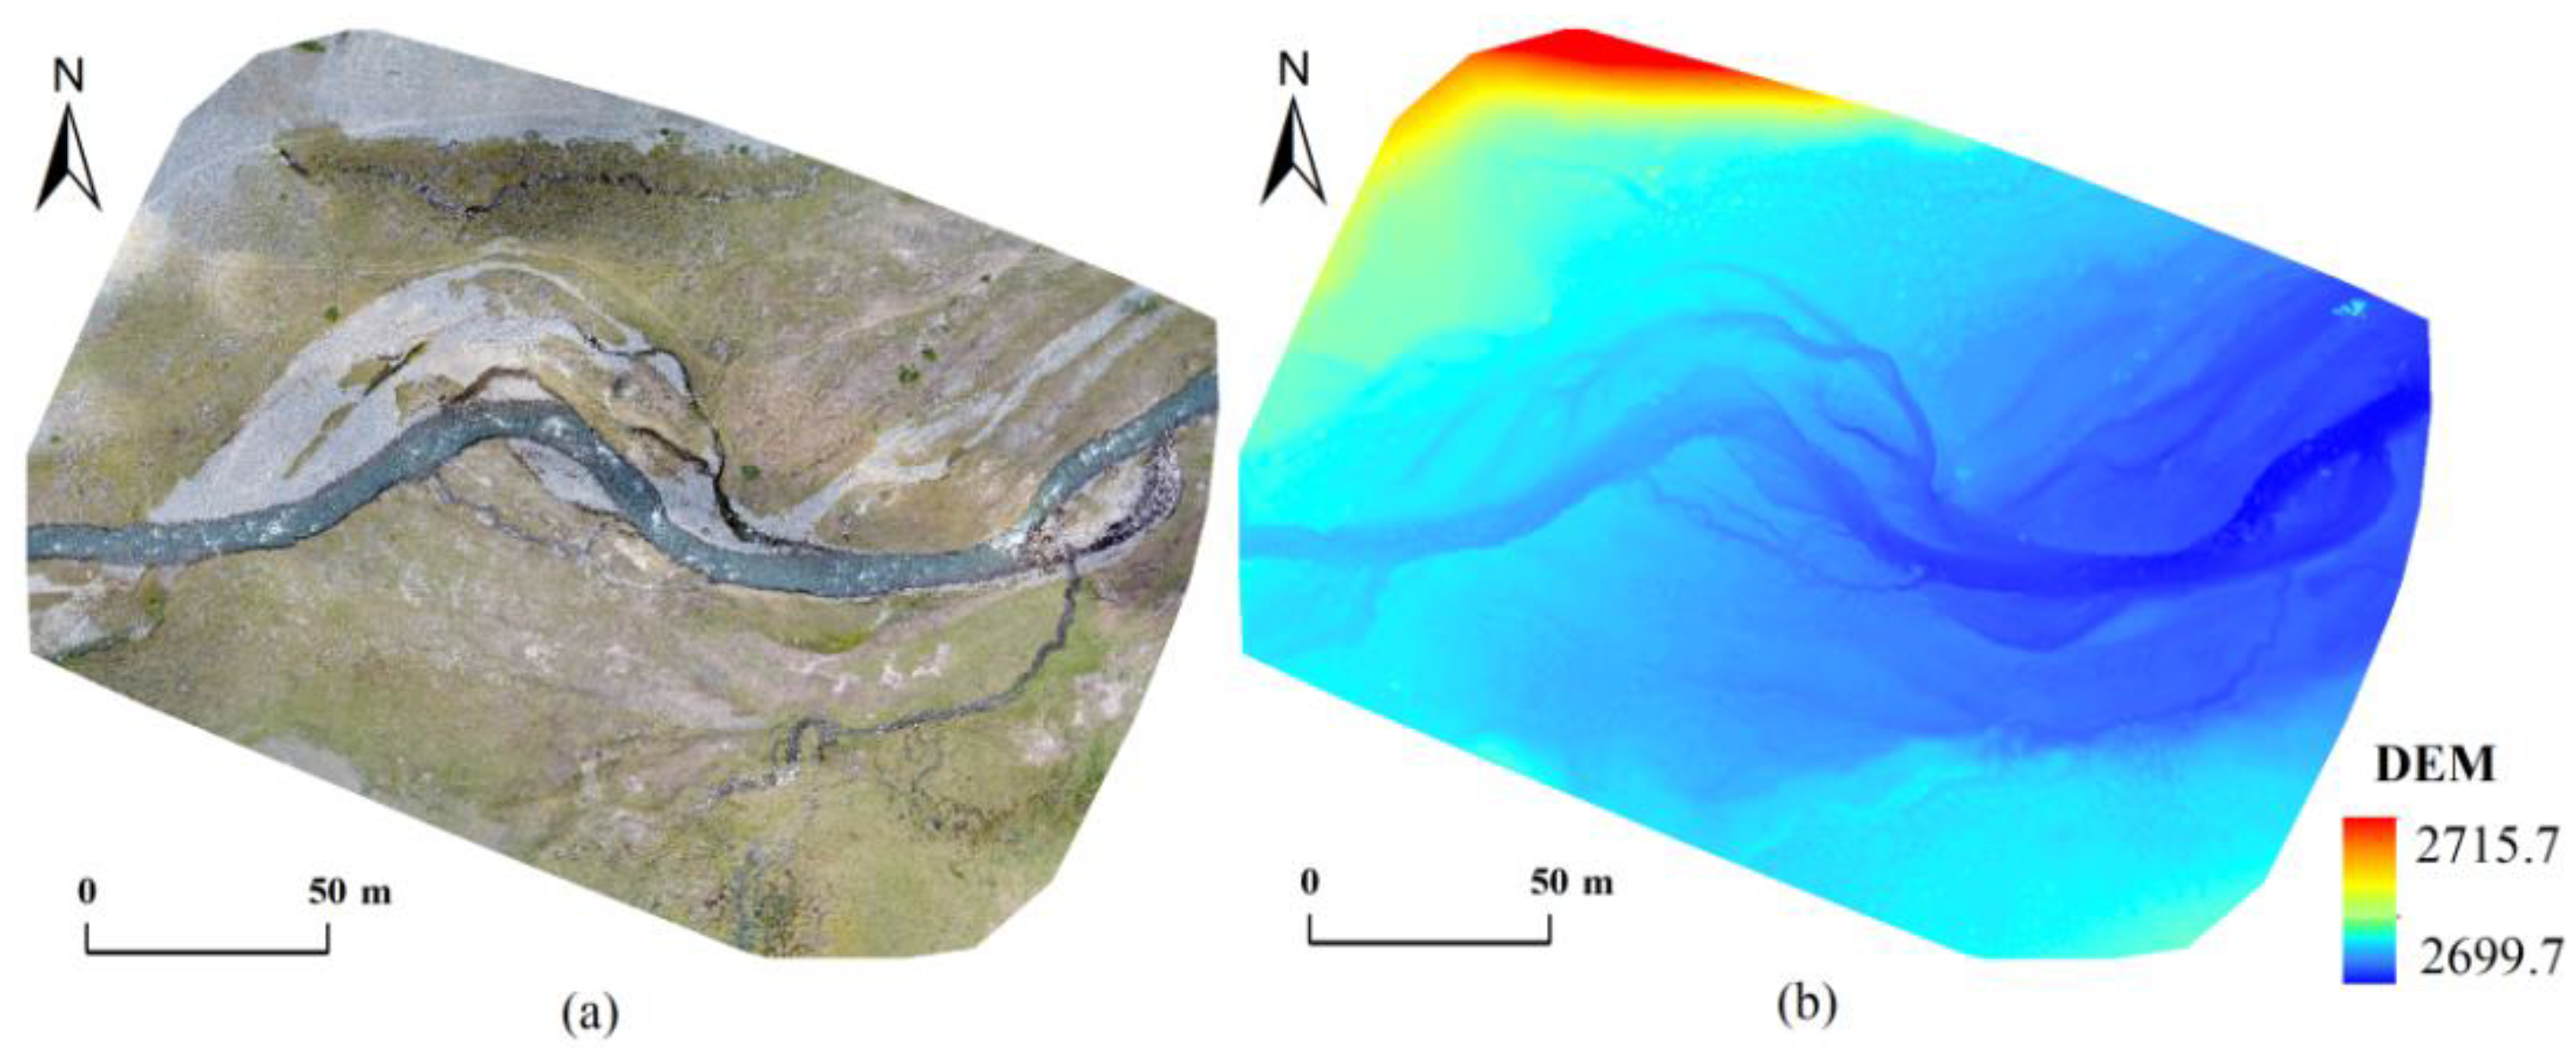
2.2.1. UAV Data
2.2.2. Satellite Remote Sensing Data
3. Methods
3.1. Remote Sensing Hydrological Station and Its Algorithms
3.2. Long-Term River Discharge Calculation Based on Satellite Remote Sensing
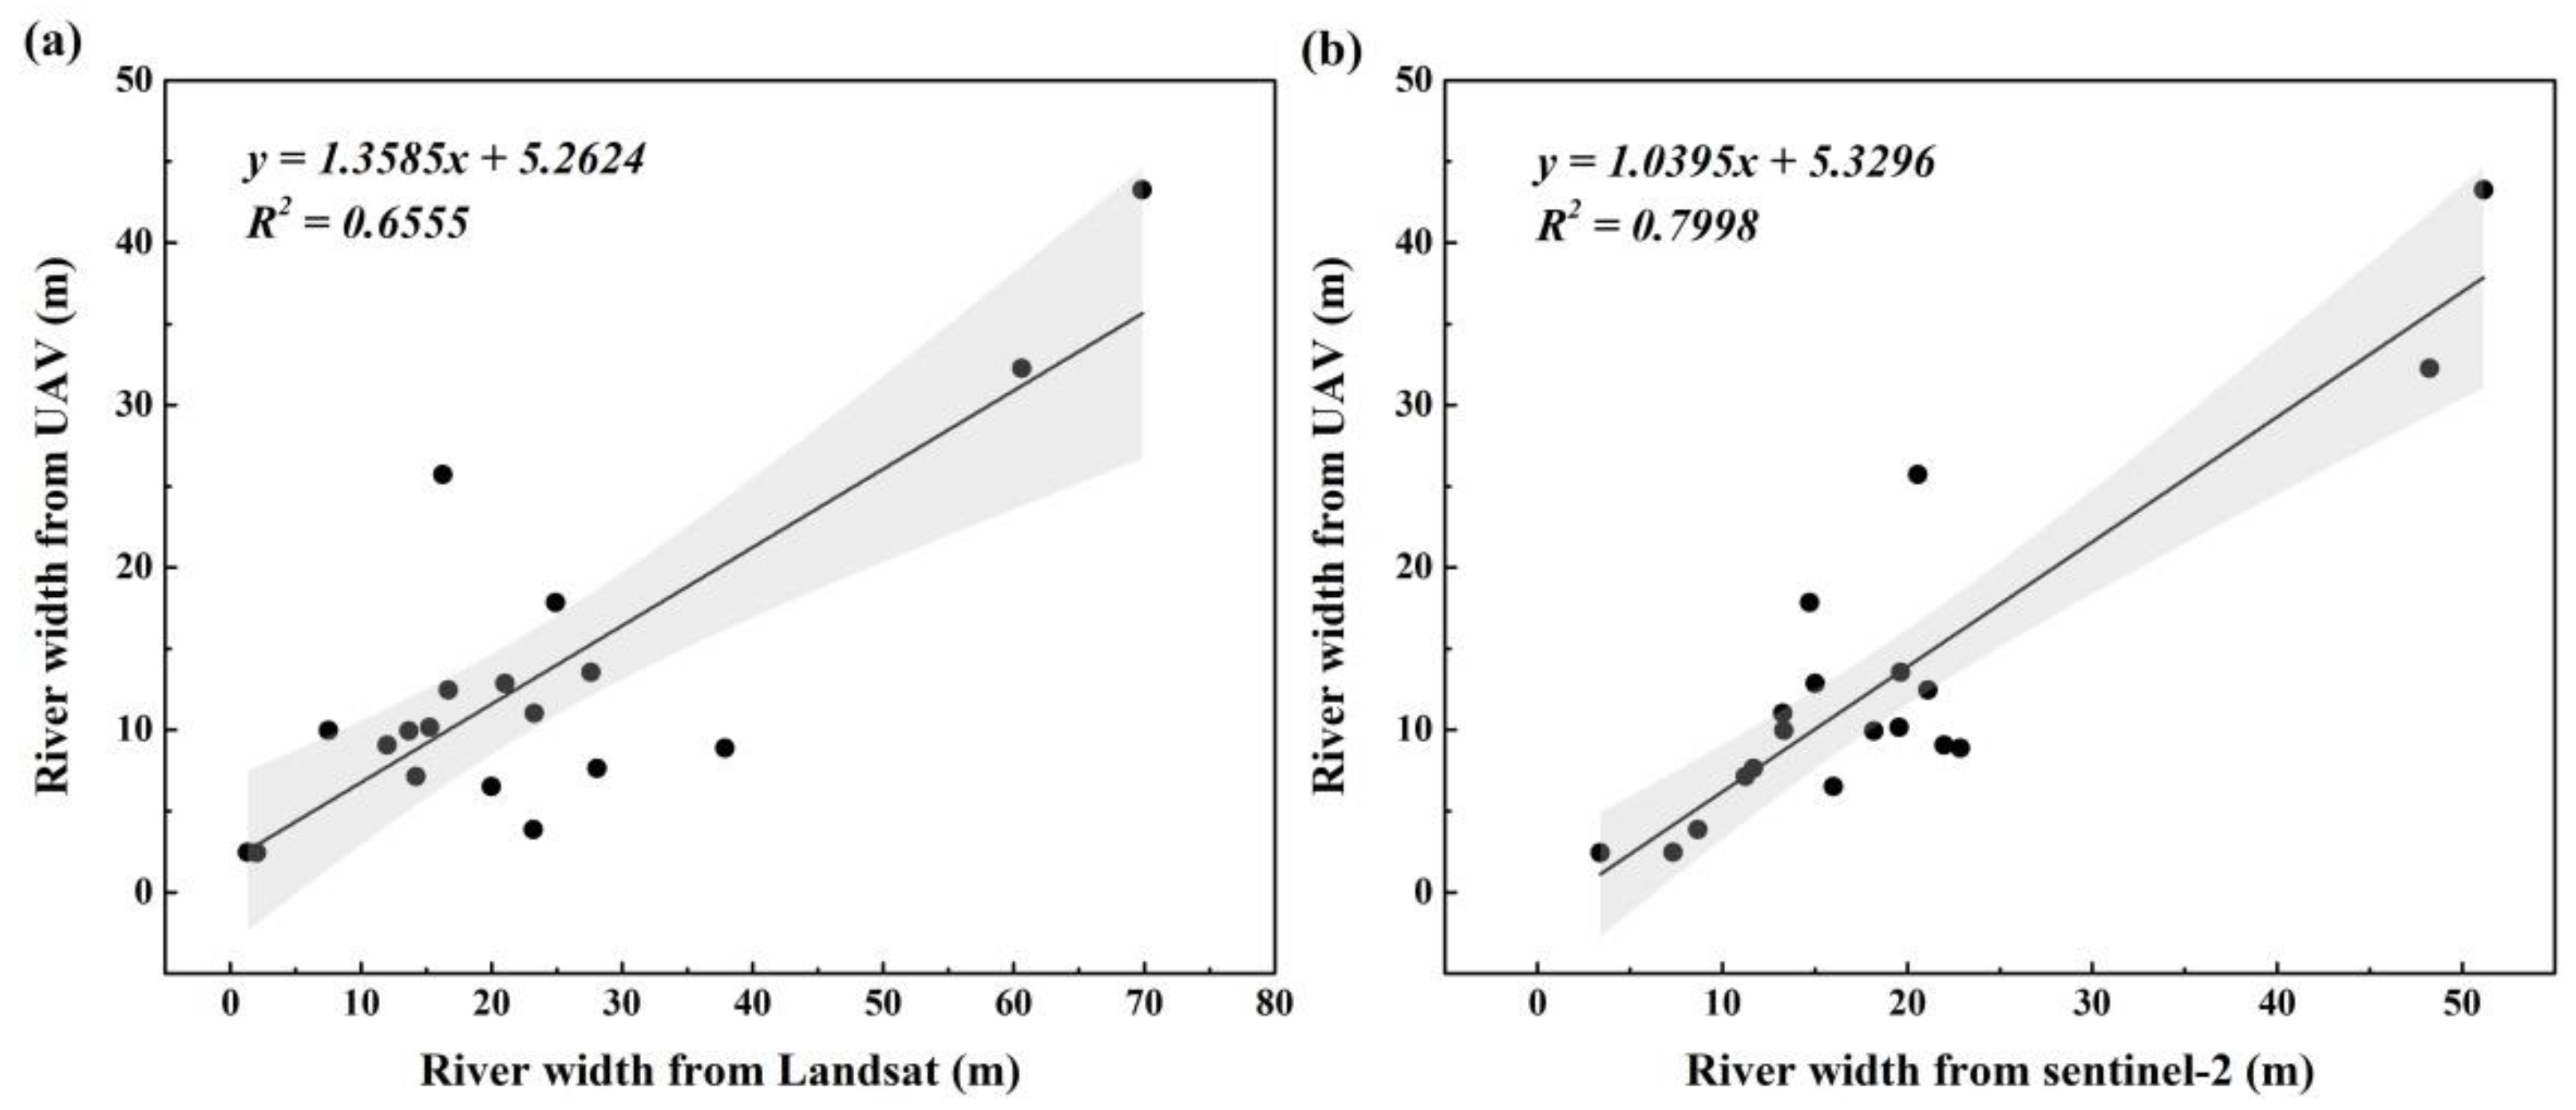
3.3. Accuracy Validation
4. Results
4.1. River Discharge by Remote Sensing Hydrological Station
4.2. River Discharge on Long Time Scales
4.3. Influence of Climate Change on River Discharge
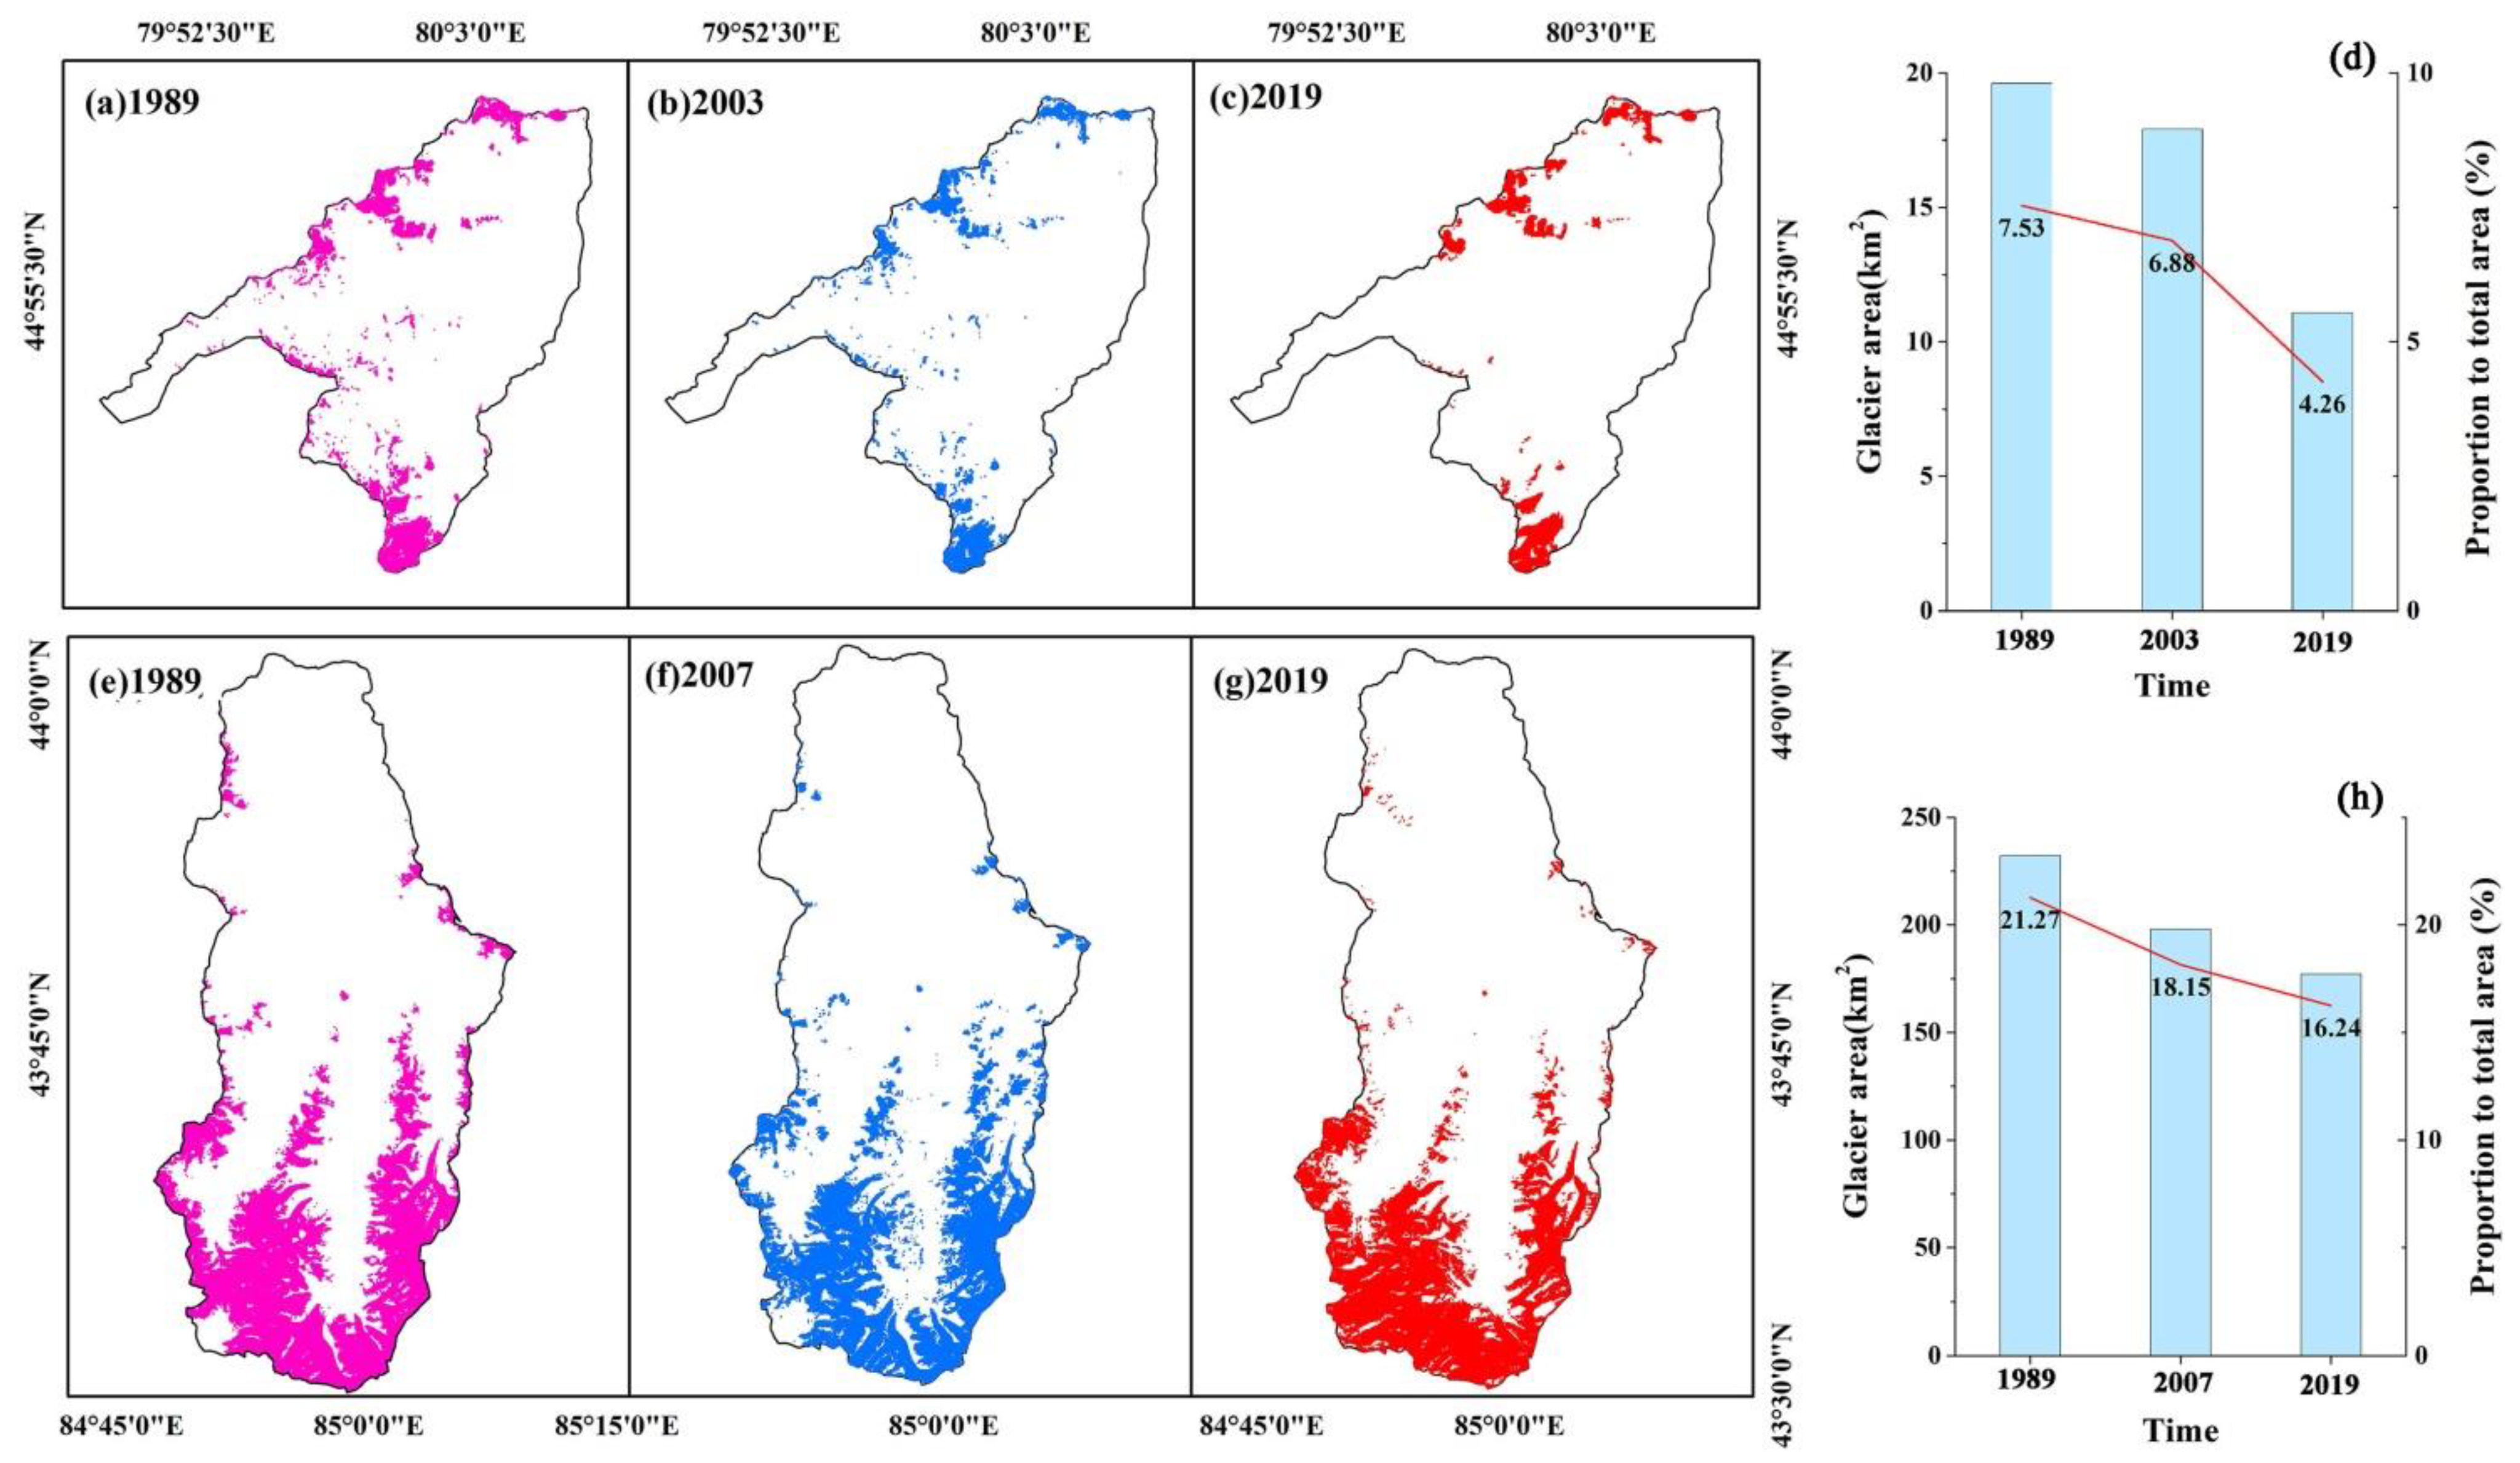
4.3.1. Glacier Area Changes
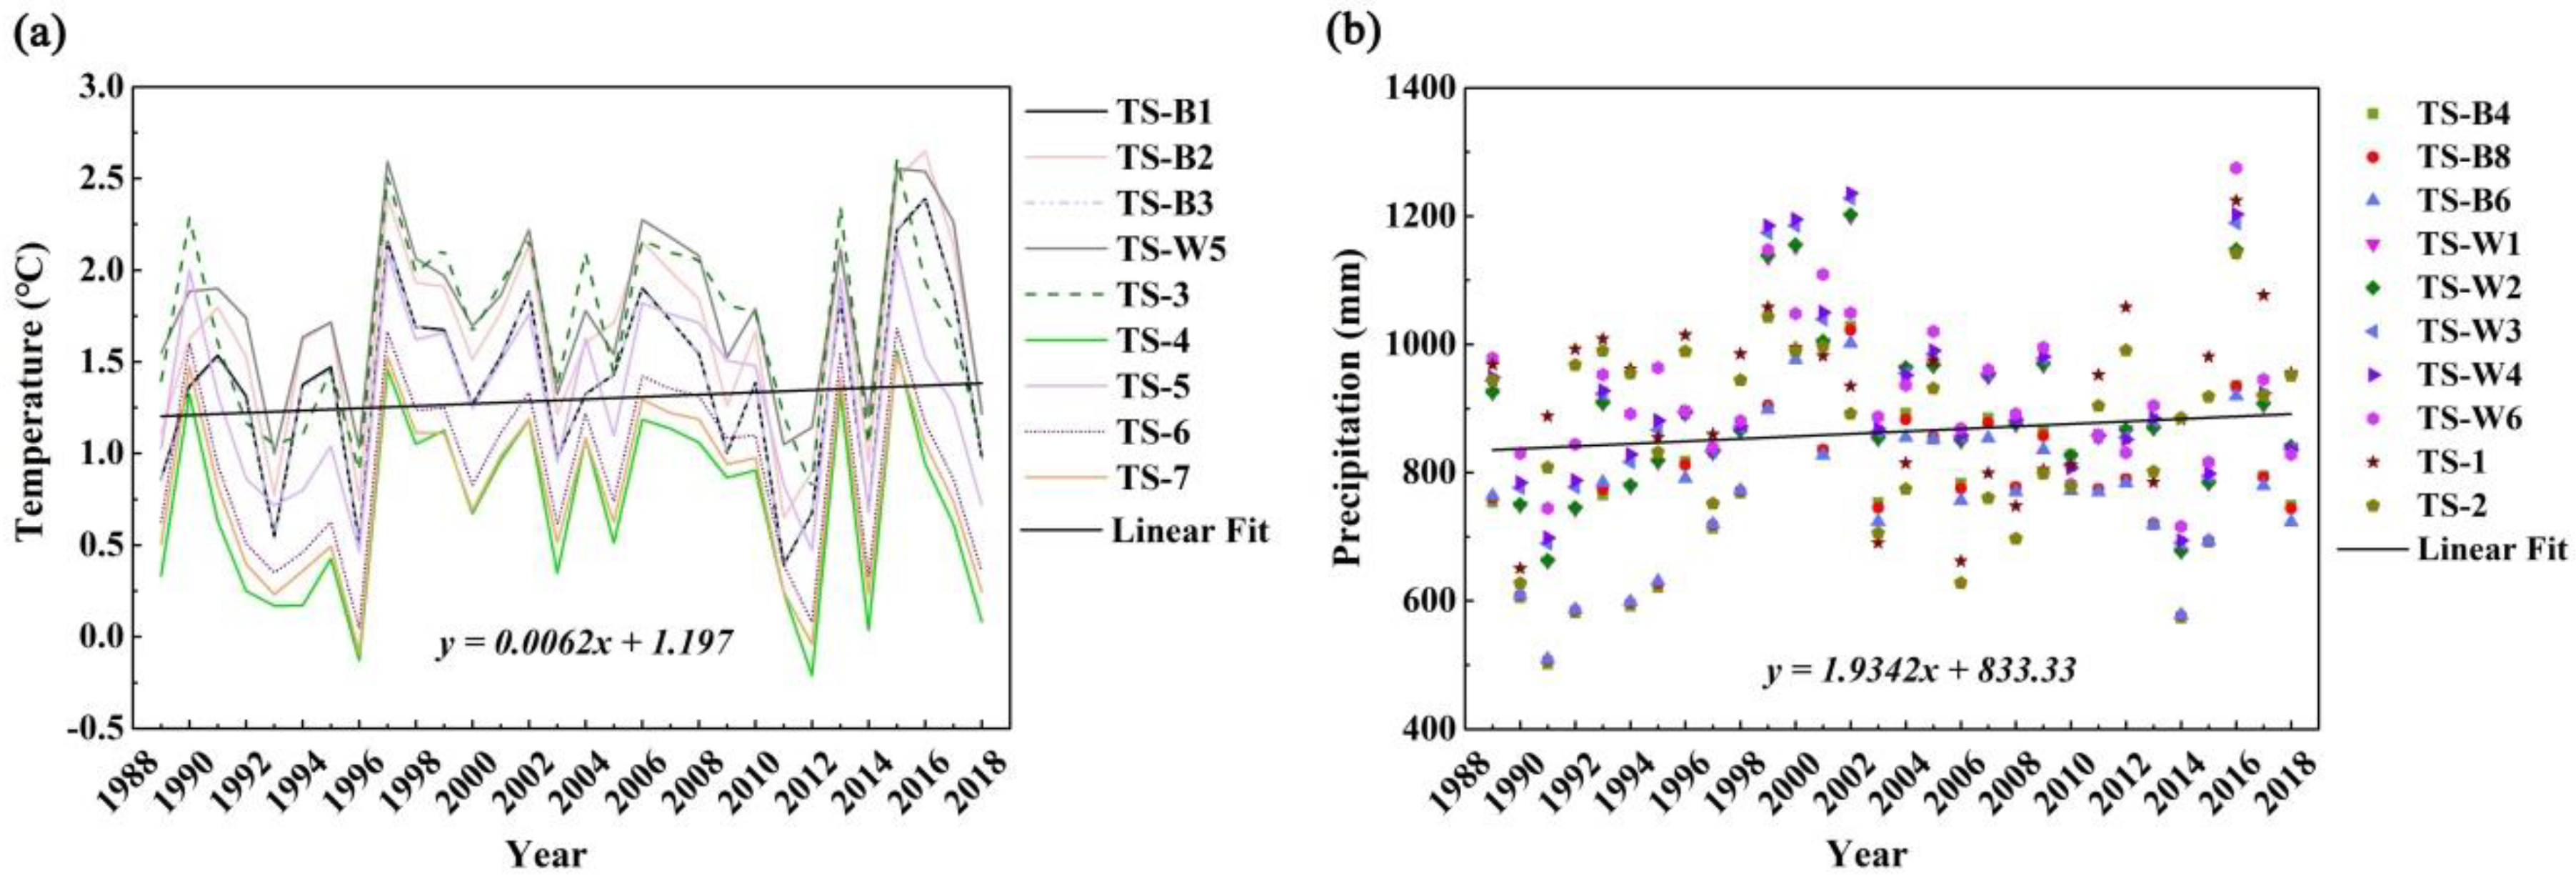
4.3.2. Changes in Temperature and Precipitation
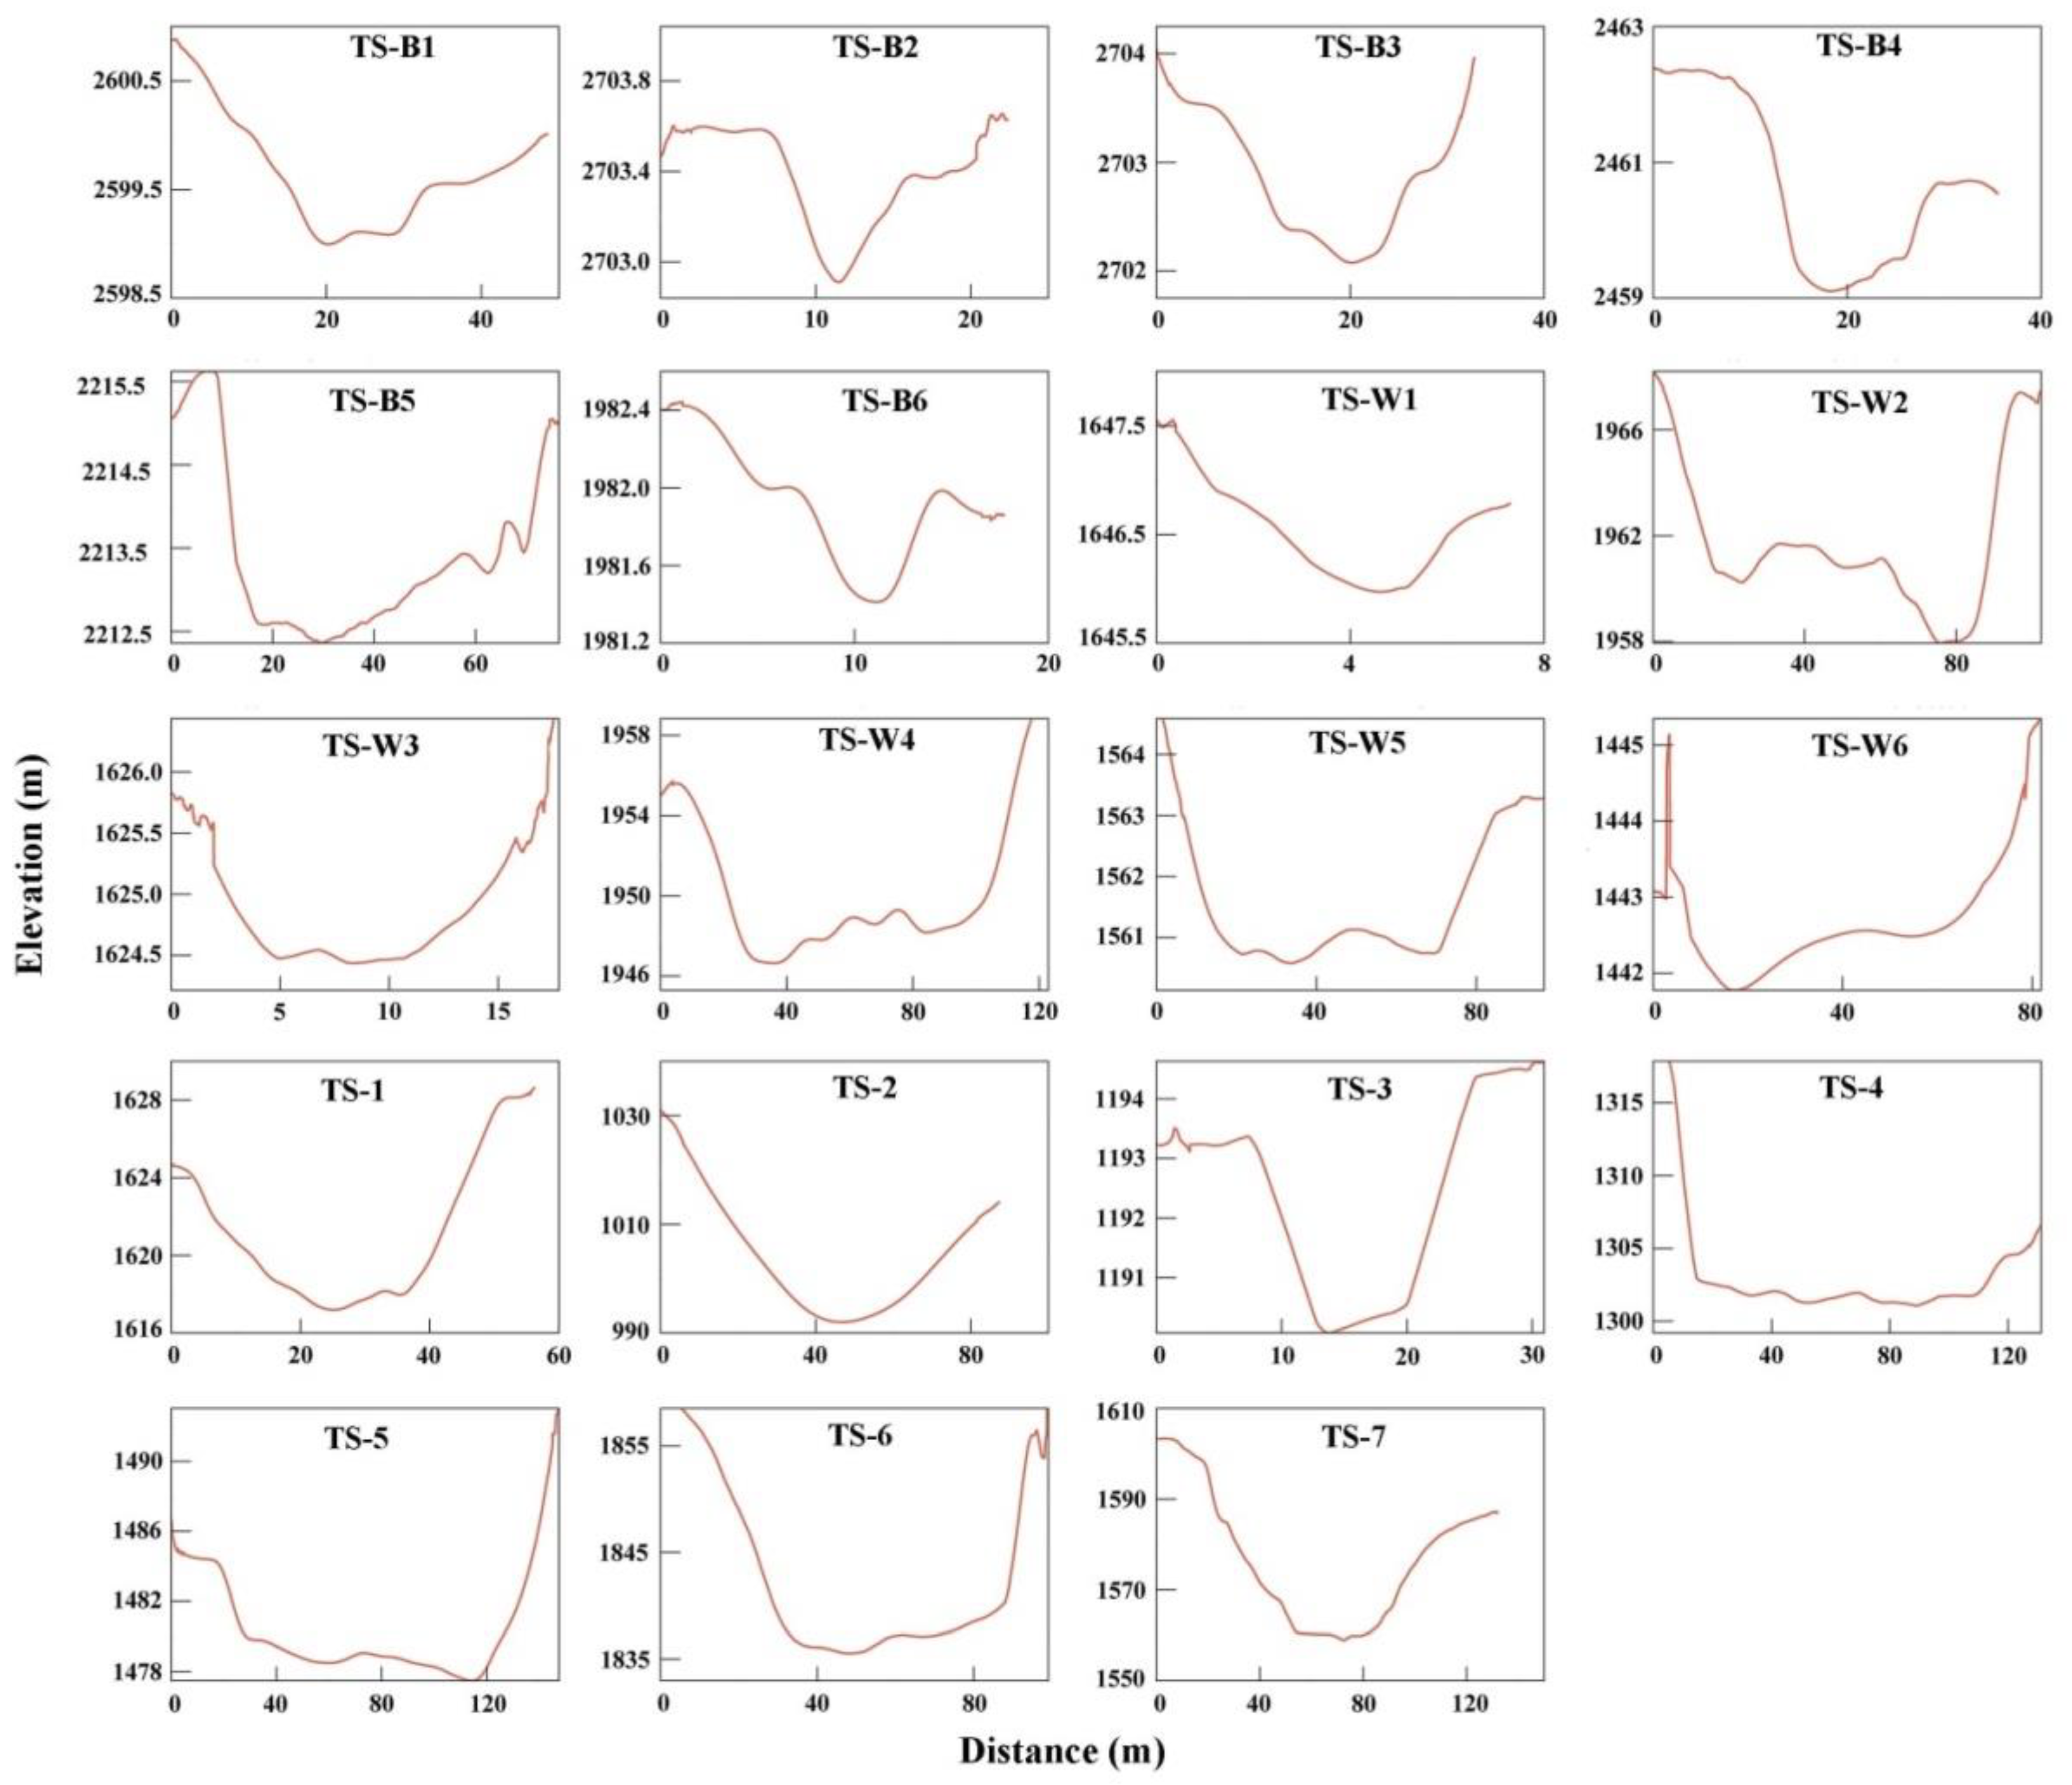
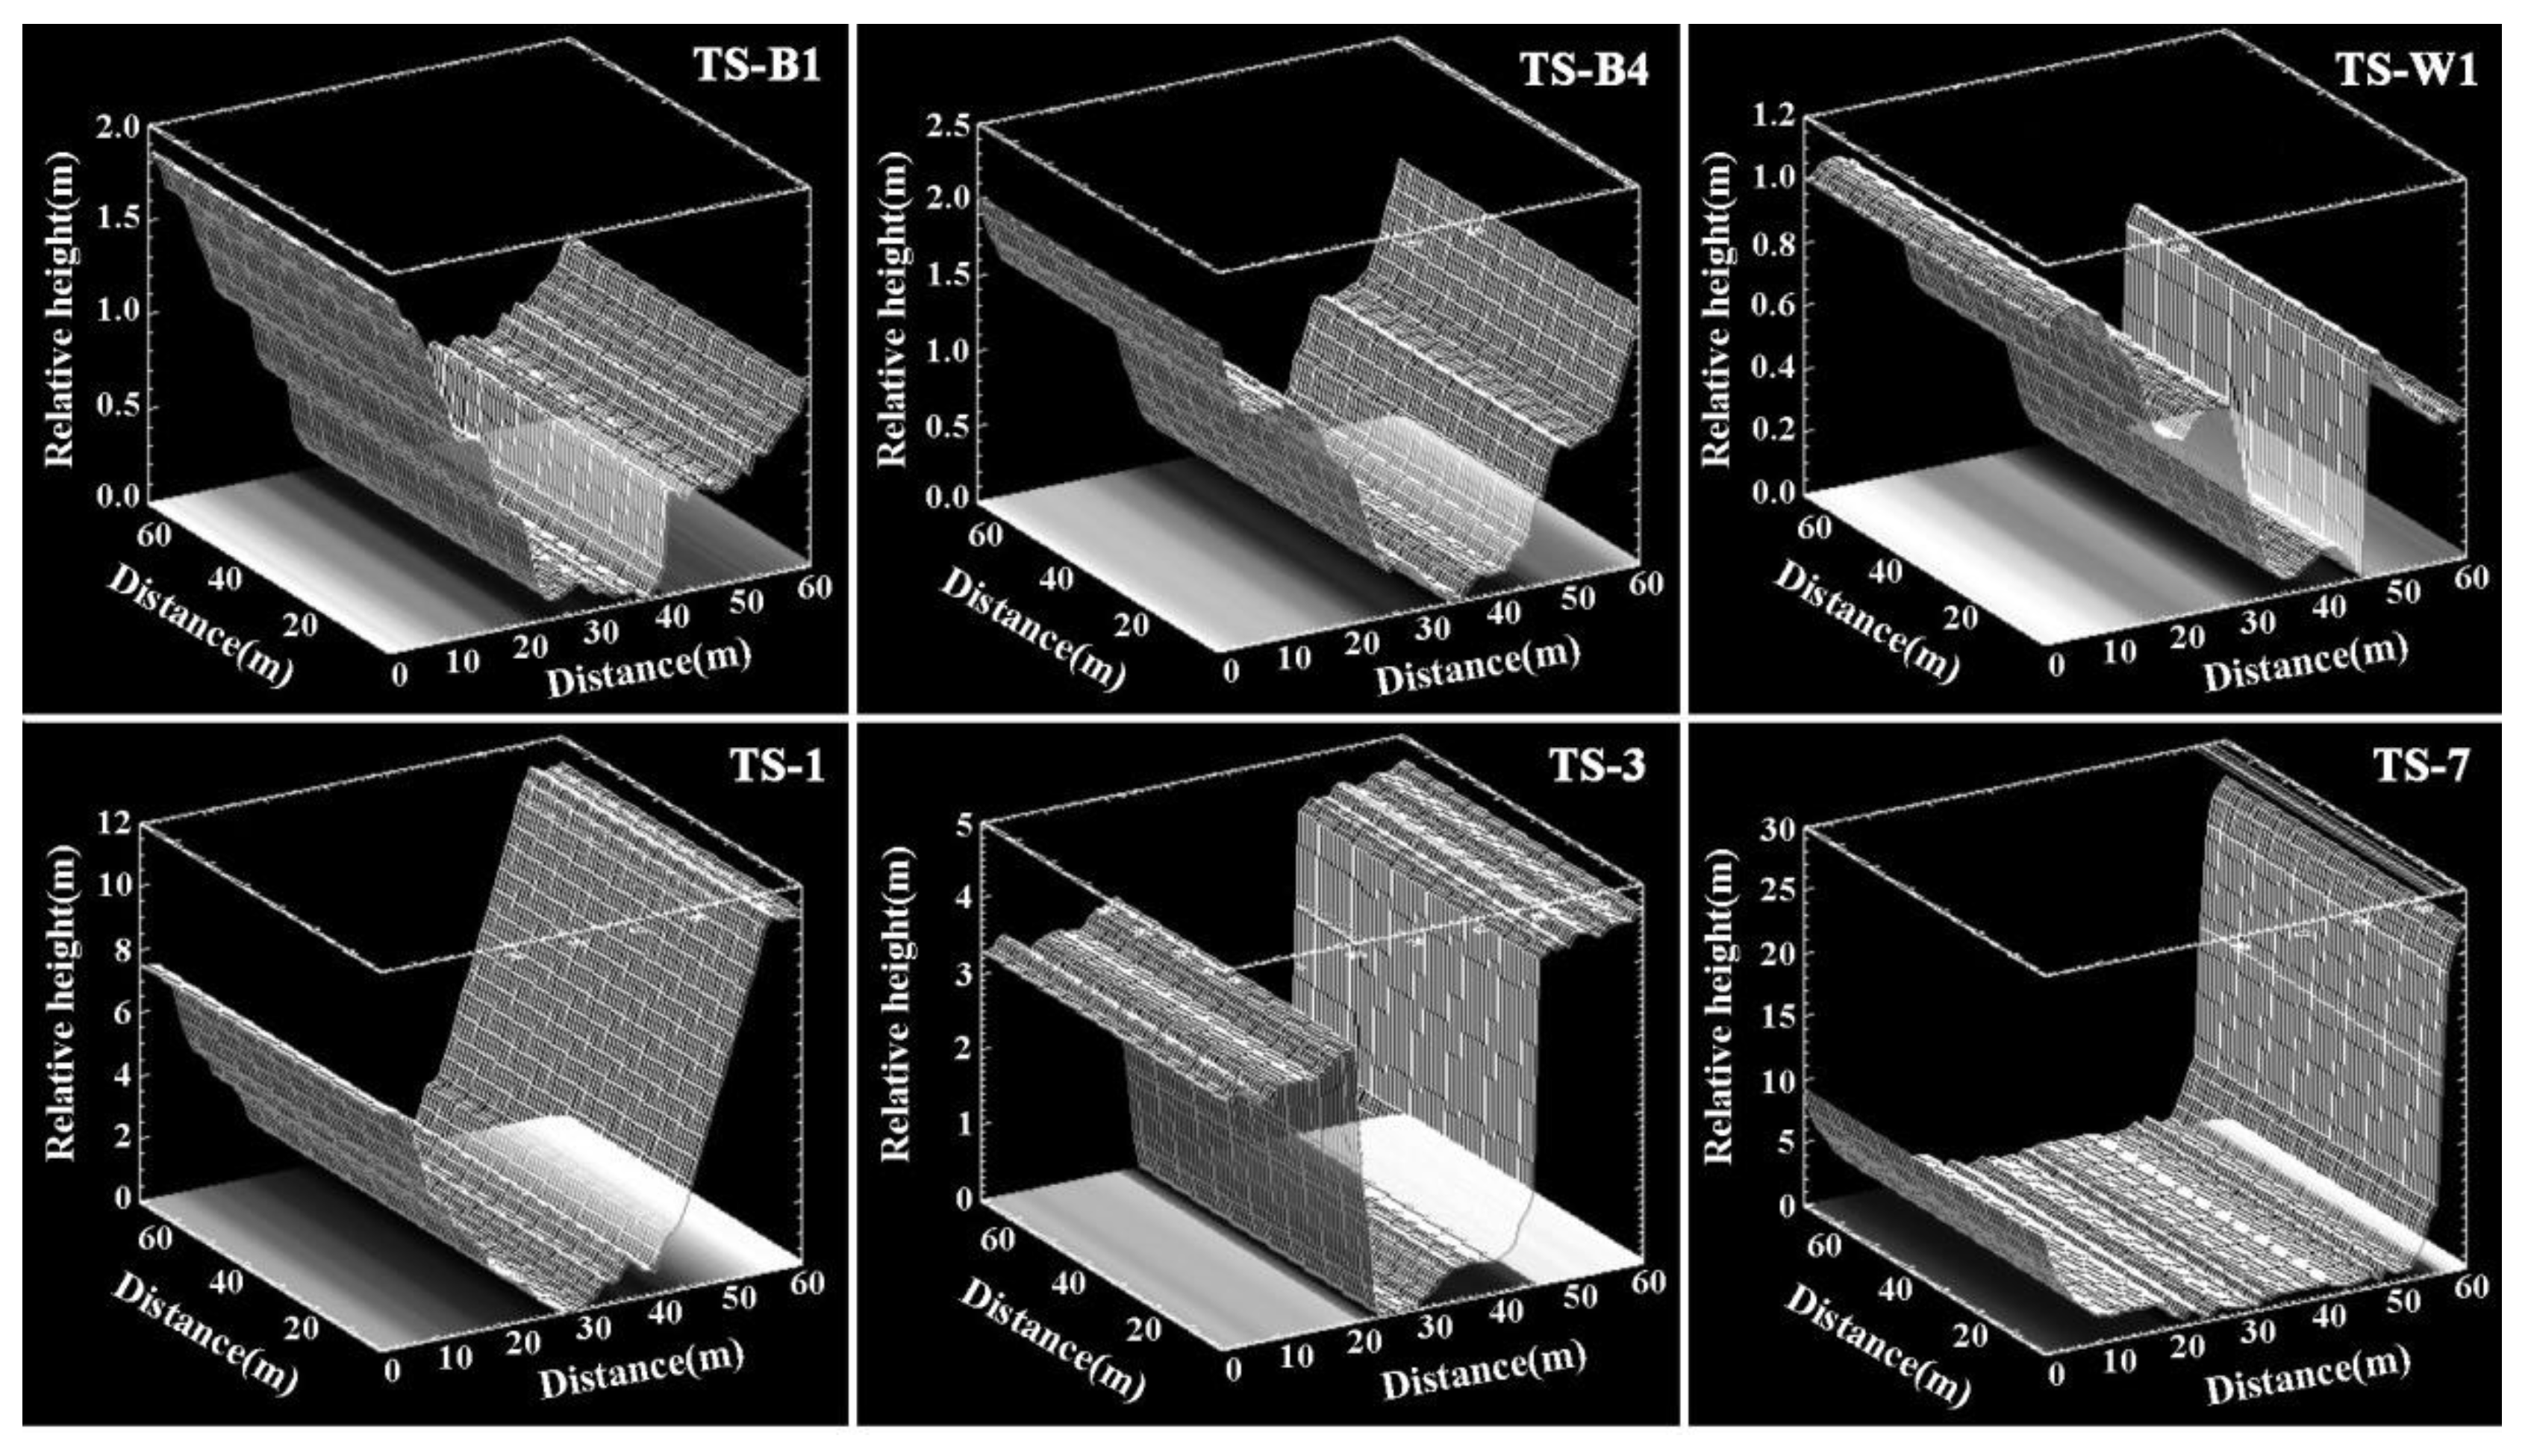
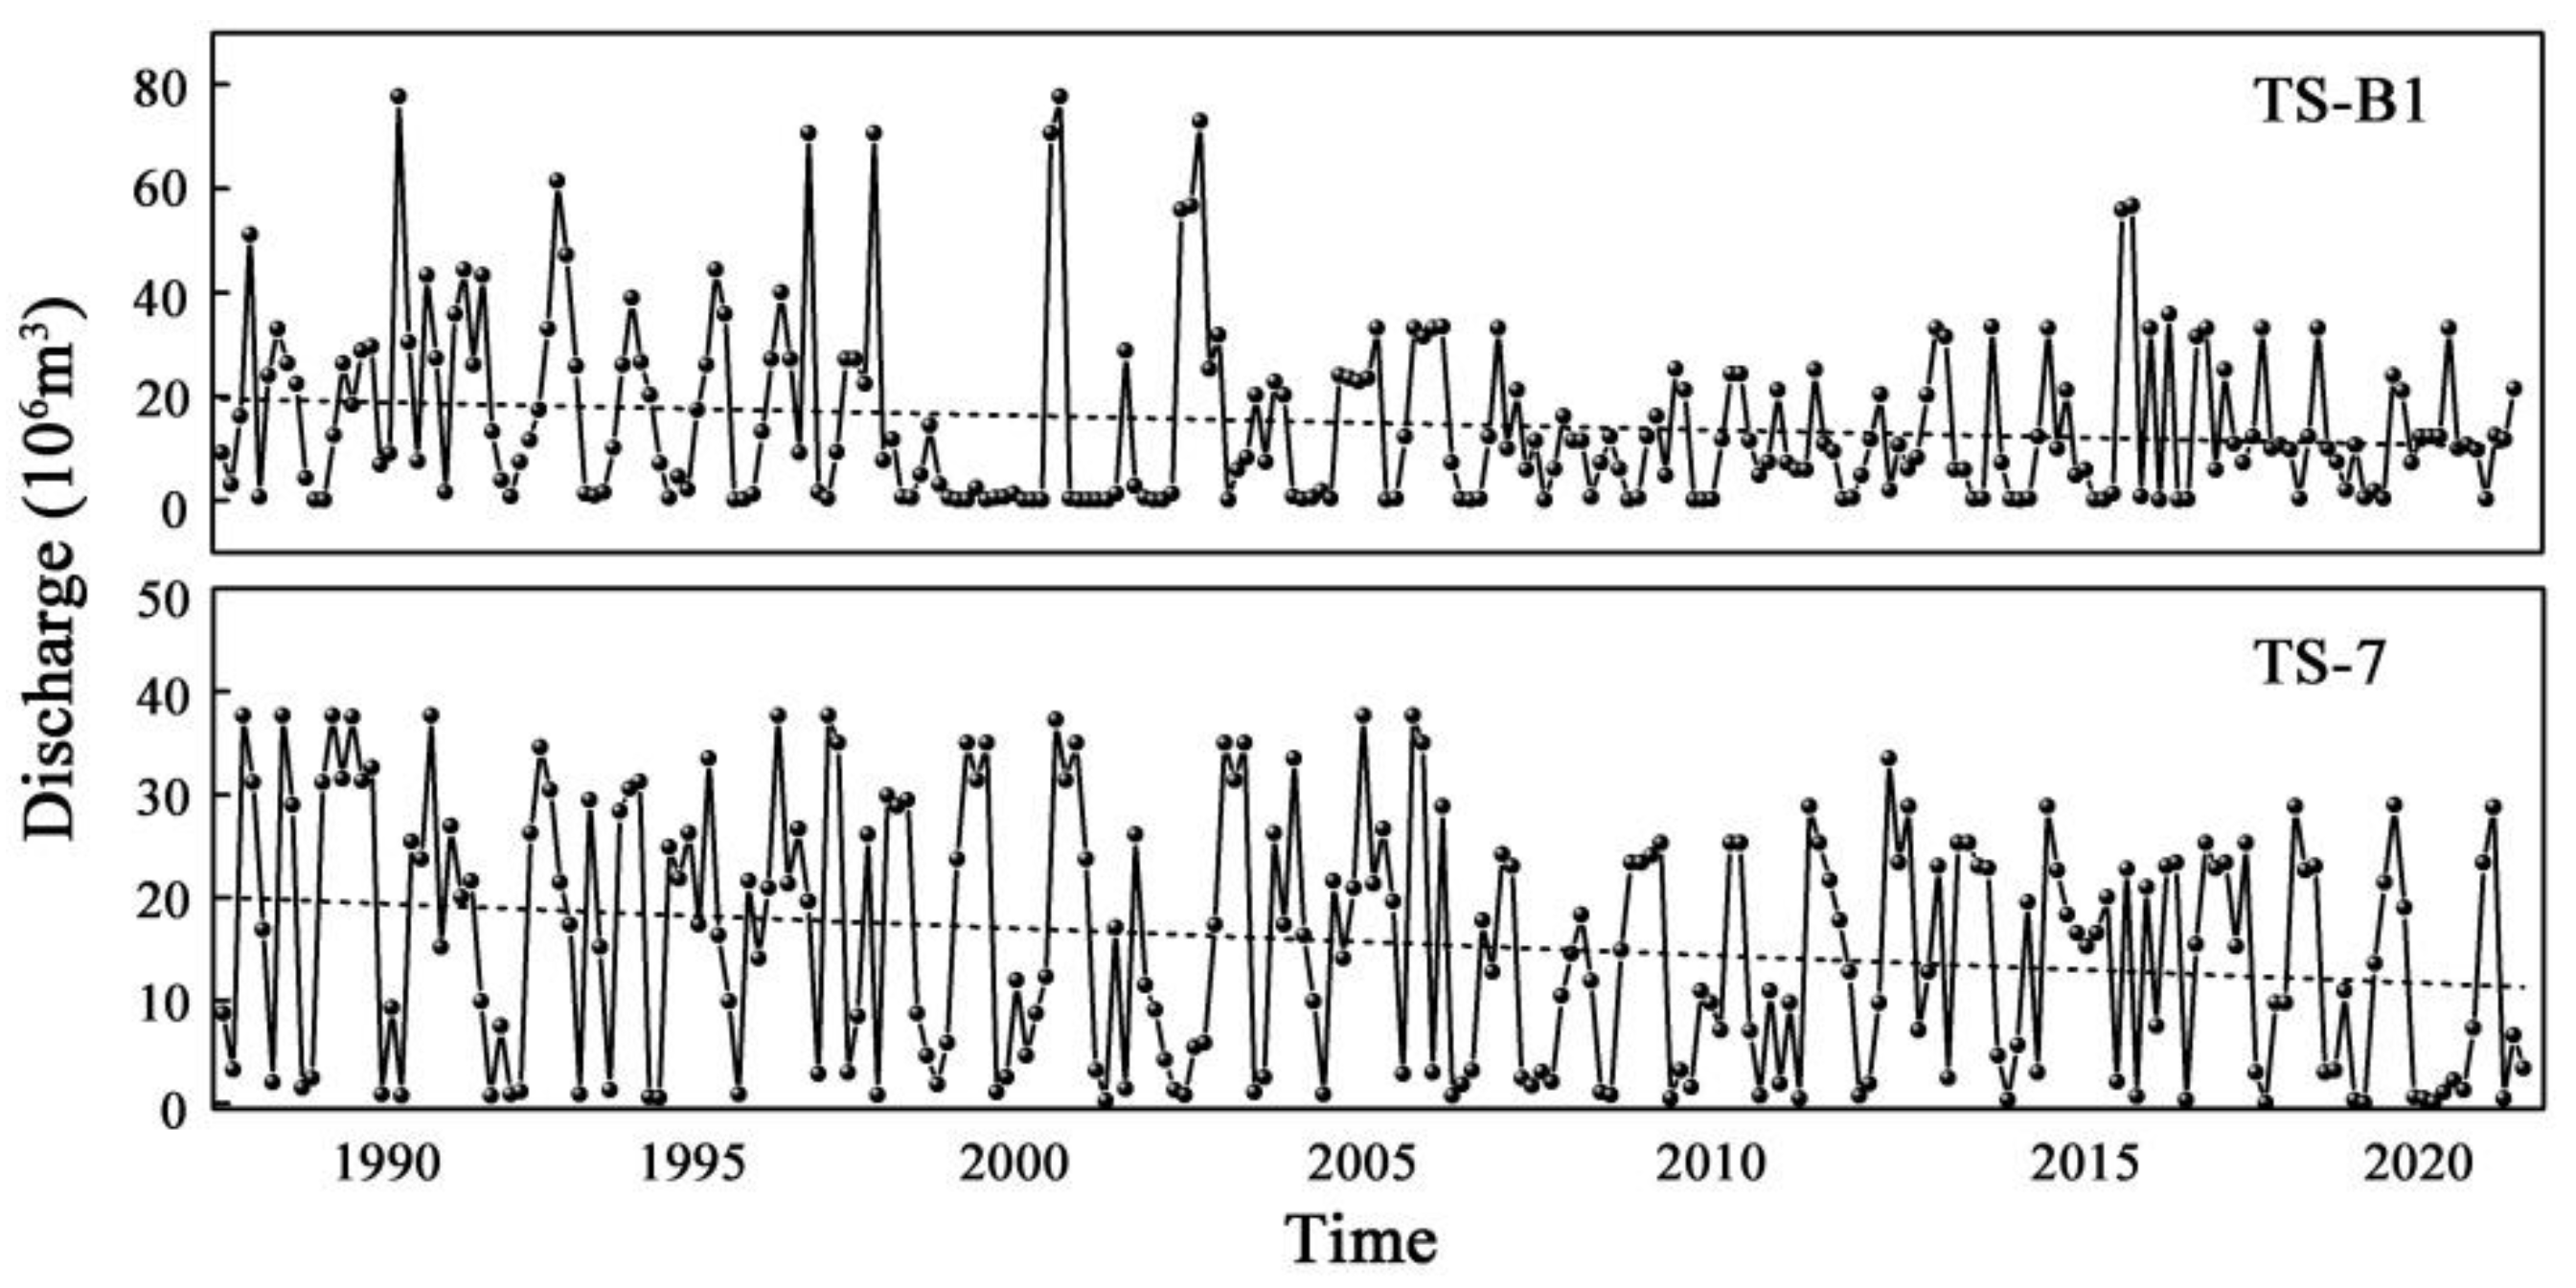
4.4. Discharge Changes in Representative River Sections
5. Discussion
5.1. Challenges of Discharge Estimation Results
5.2. Comparative Analysis of Research Results
6. Conclusions
- (1)
- The NSE, RMSE, and average qualification rate between the measured discharge and estimation results from the UAV data were 0.98, 8.49 m3/s, and 80%, respectively. This means that the discharge estimation method based on UAV and satellite remote sensing, is feasible in monitoring river discharges in the Tianshan region.
- (2)
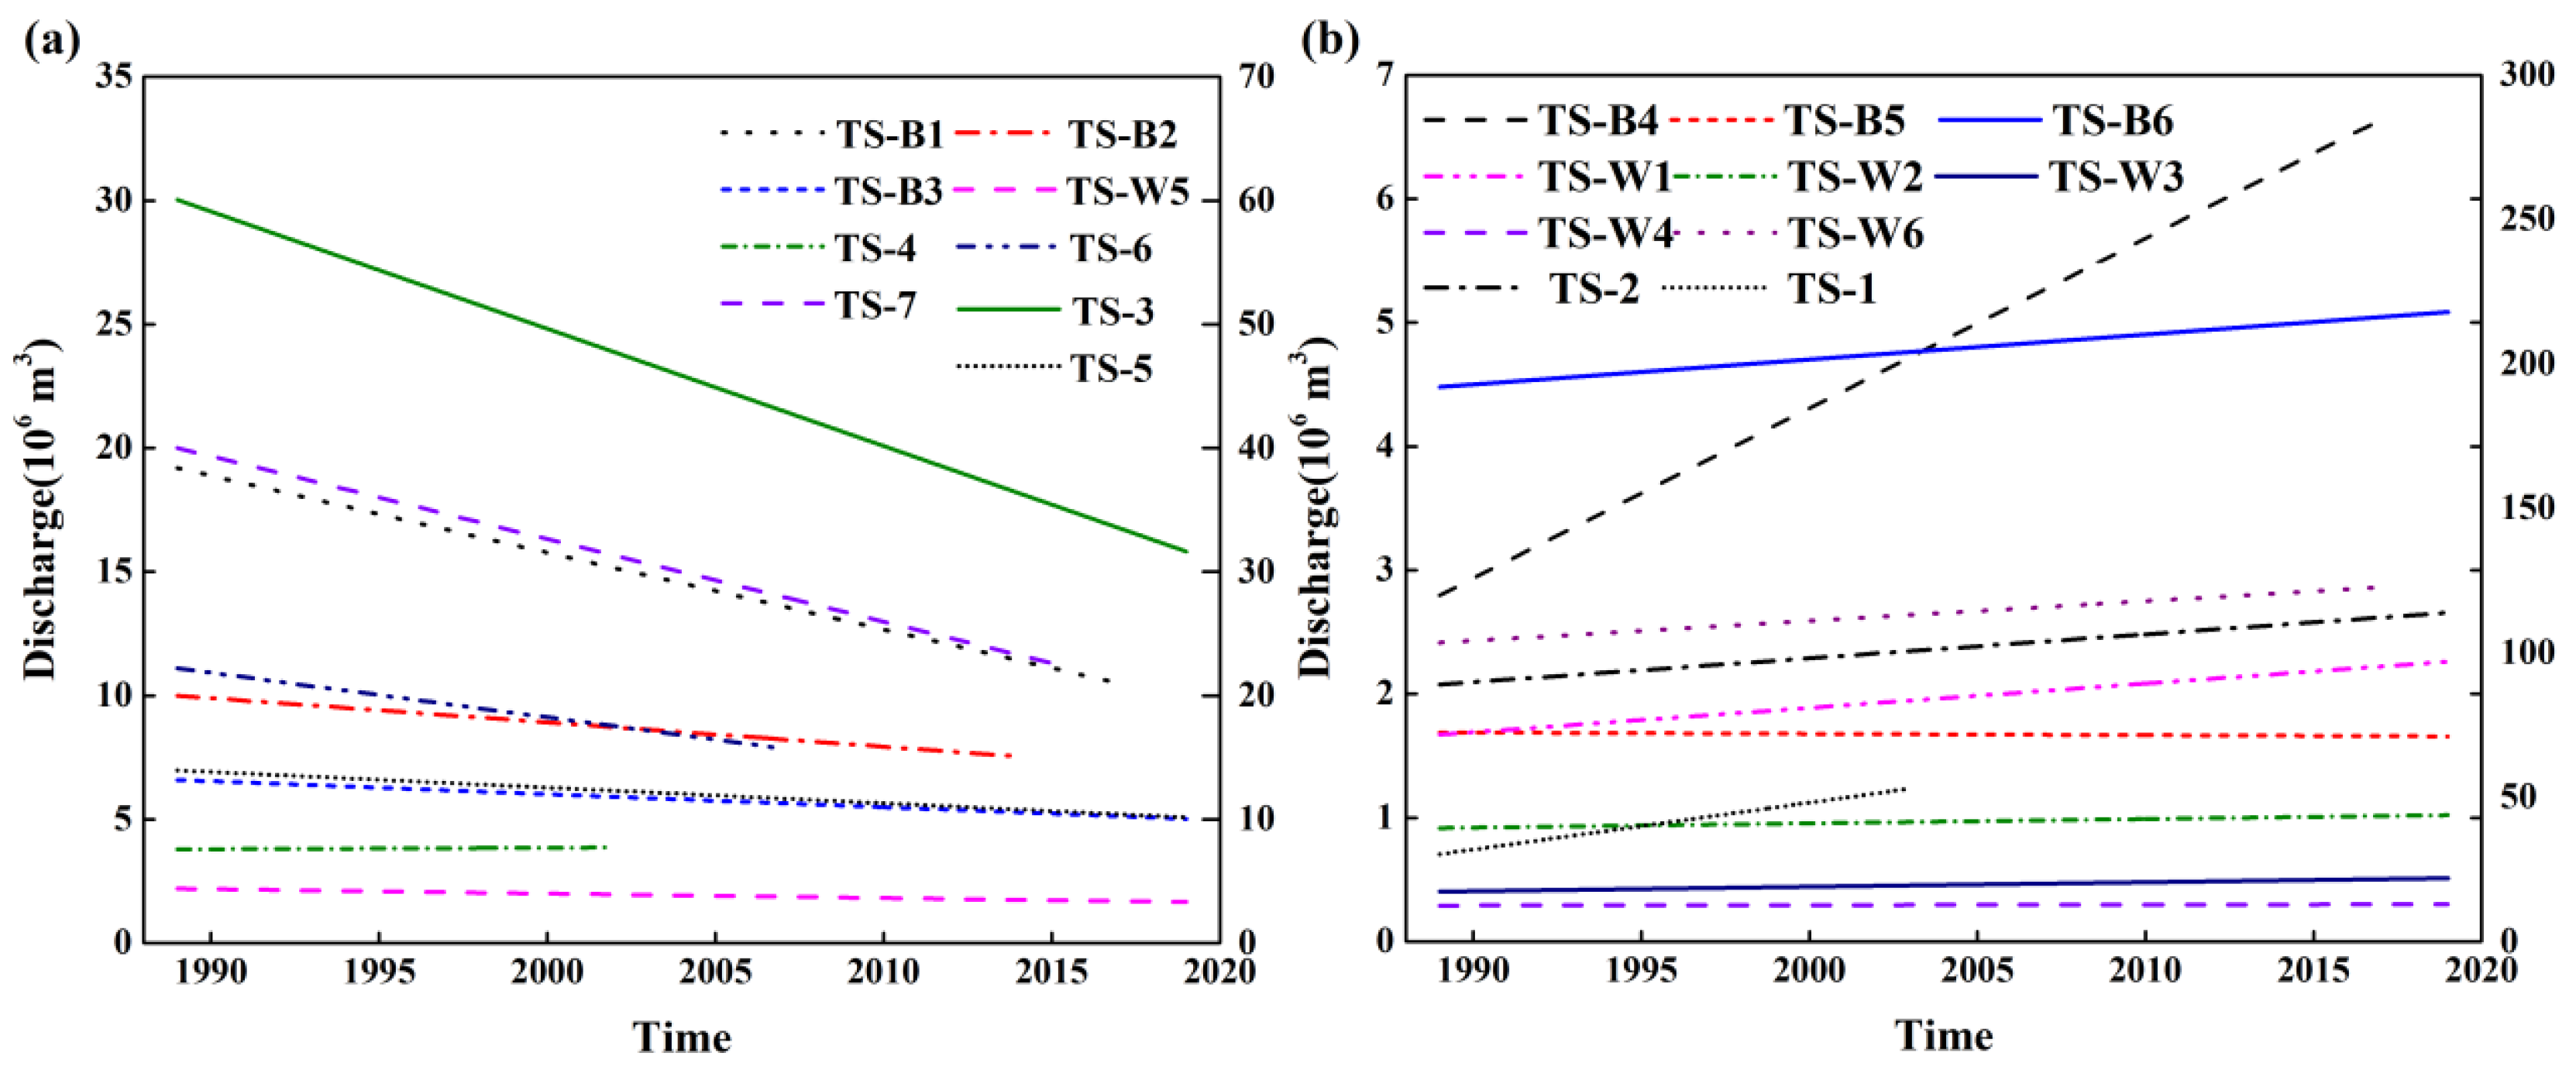
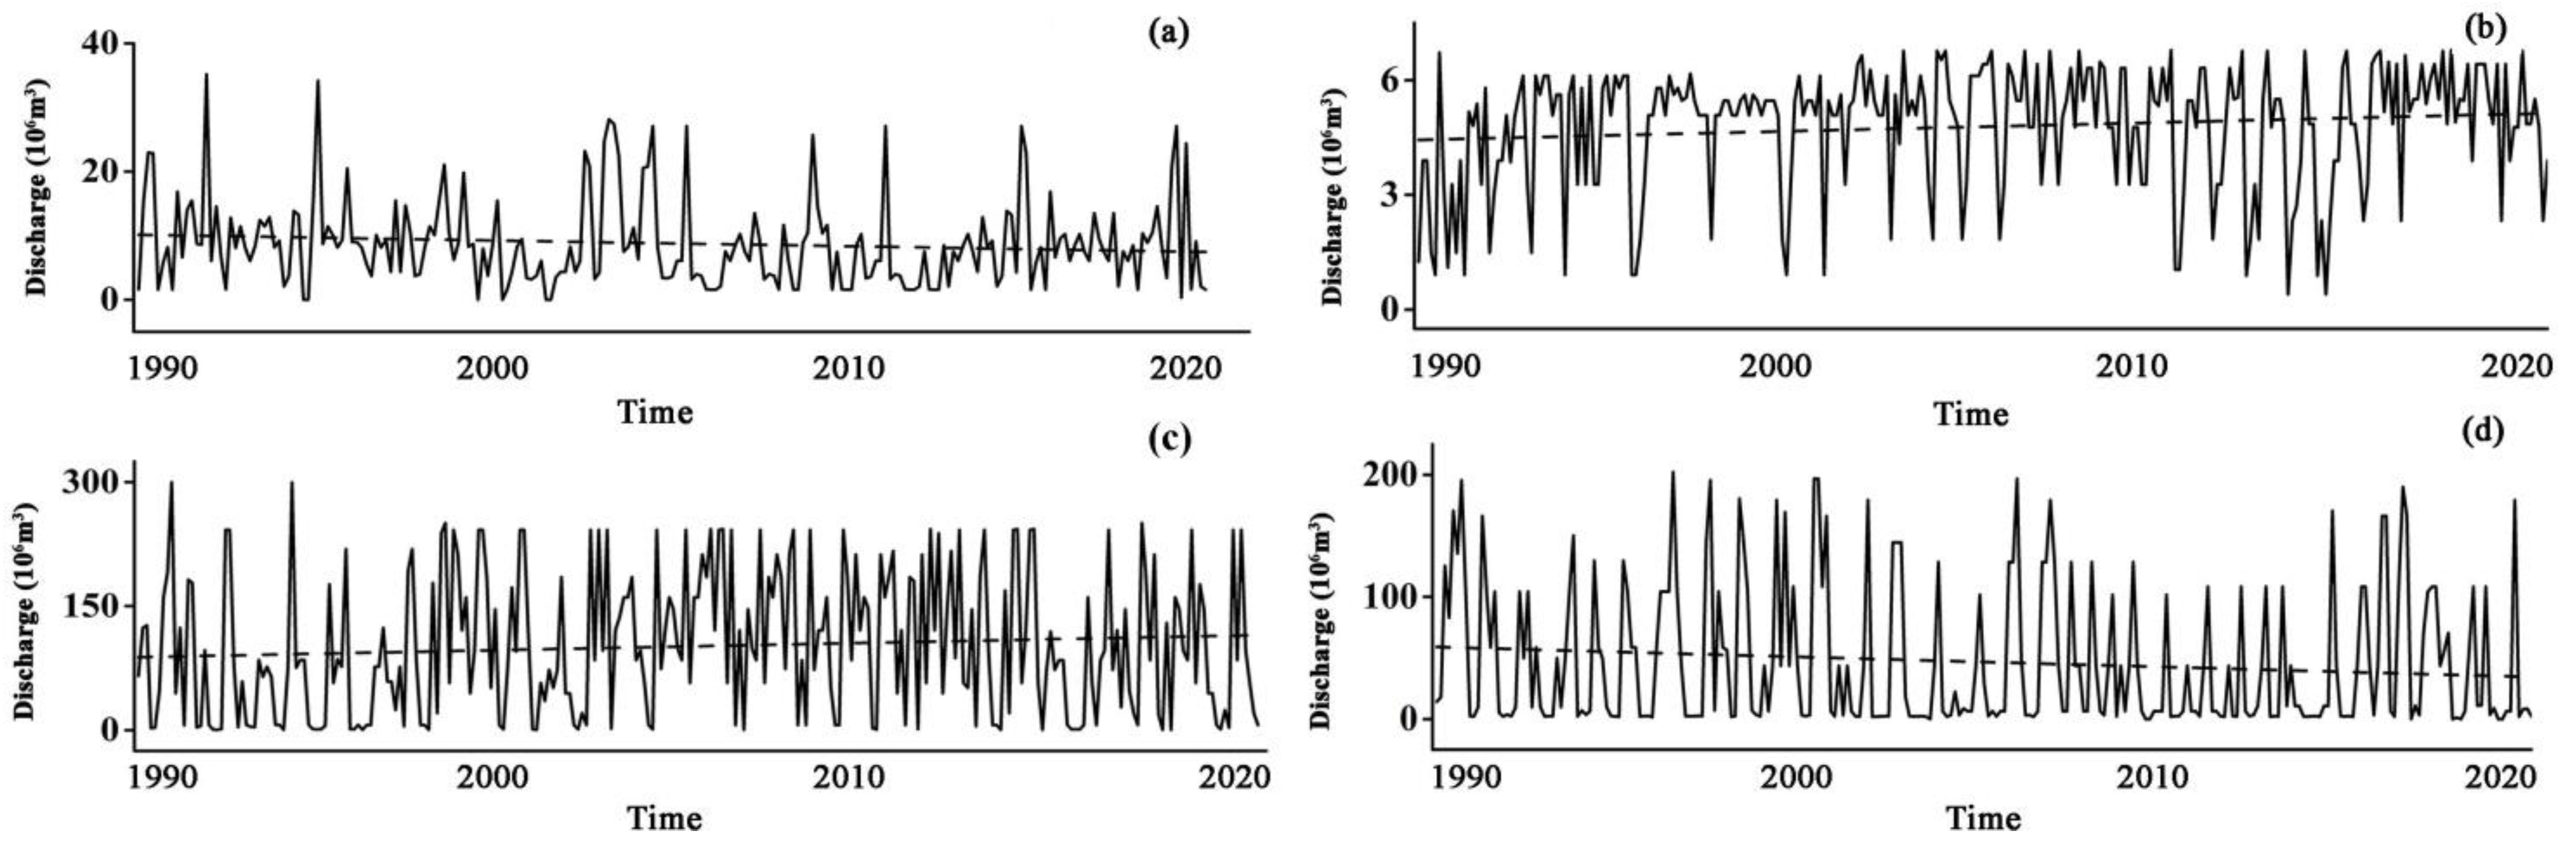
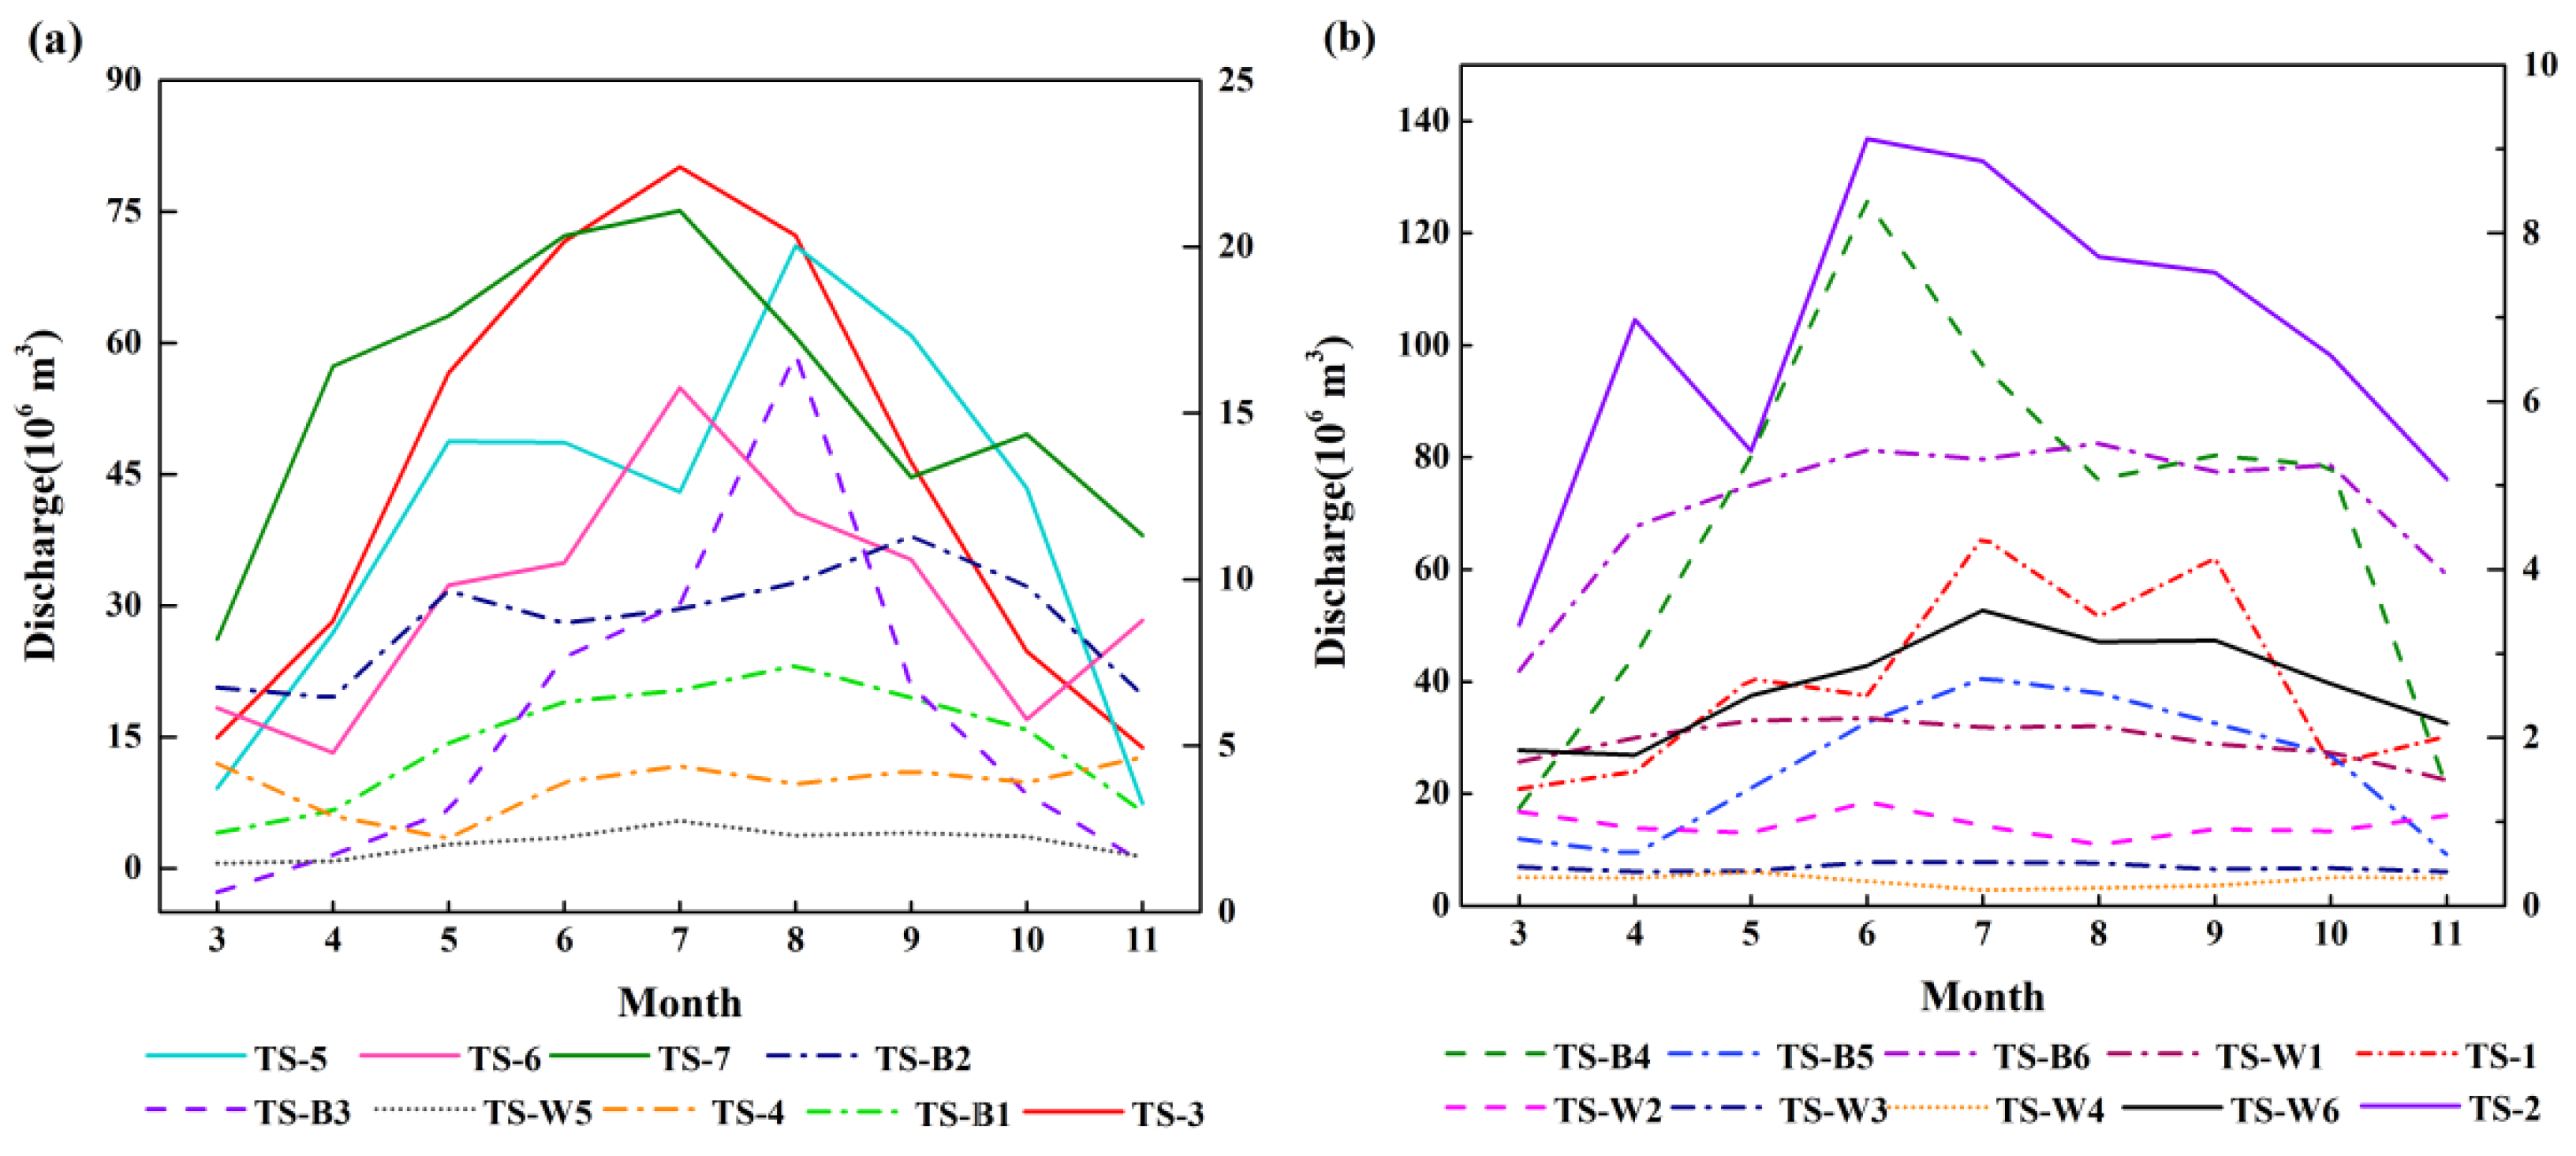
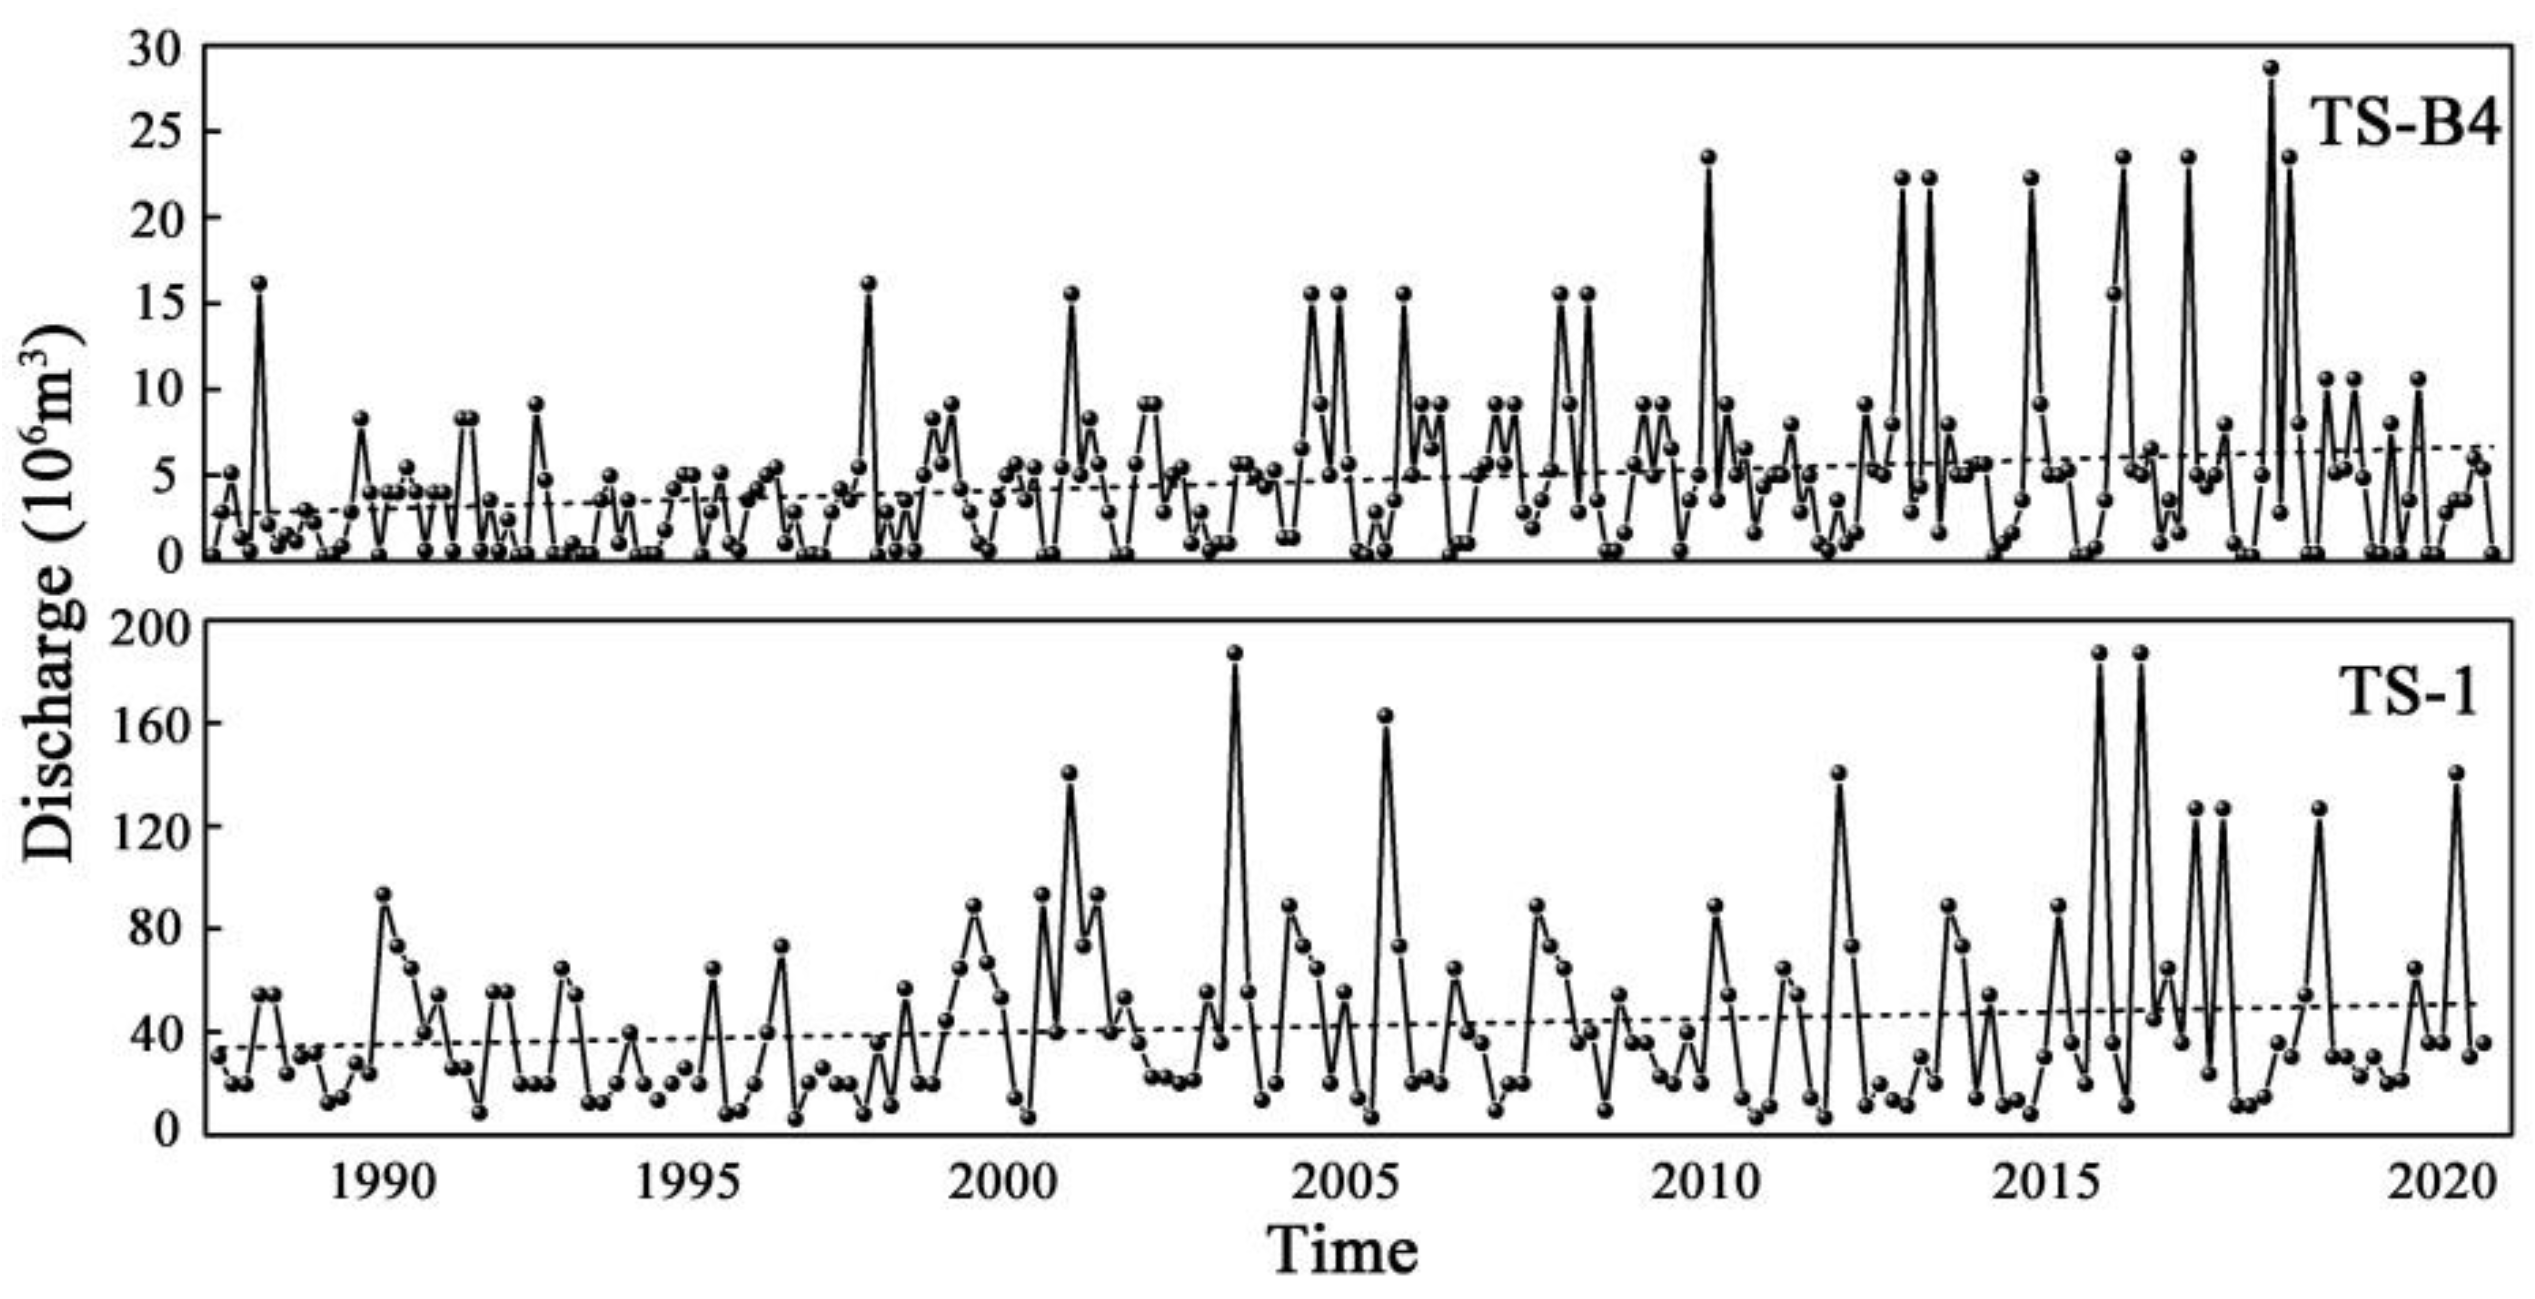
- According to the water supply source of the river, the study sections were divided into two types: glacial-meltwater-dominated river sections (9 sections) and precipitation-dominated river sections (10 sections). The monthly discharge of glacial-meltwater-dominated river sections showed a decreasing trend during 1989–2019, with an average decrease of 2.46%, and had obvious seasonal variations. The monthly discharge of precipitation-dominated river sections exhibited an increasing trend, with an average increase of 2.27%, and the seasonal discharge presented a double-peak trend in summer and spring.
- (3)
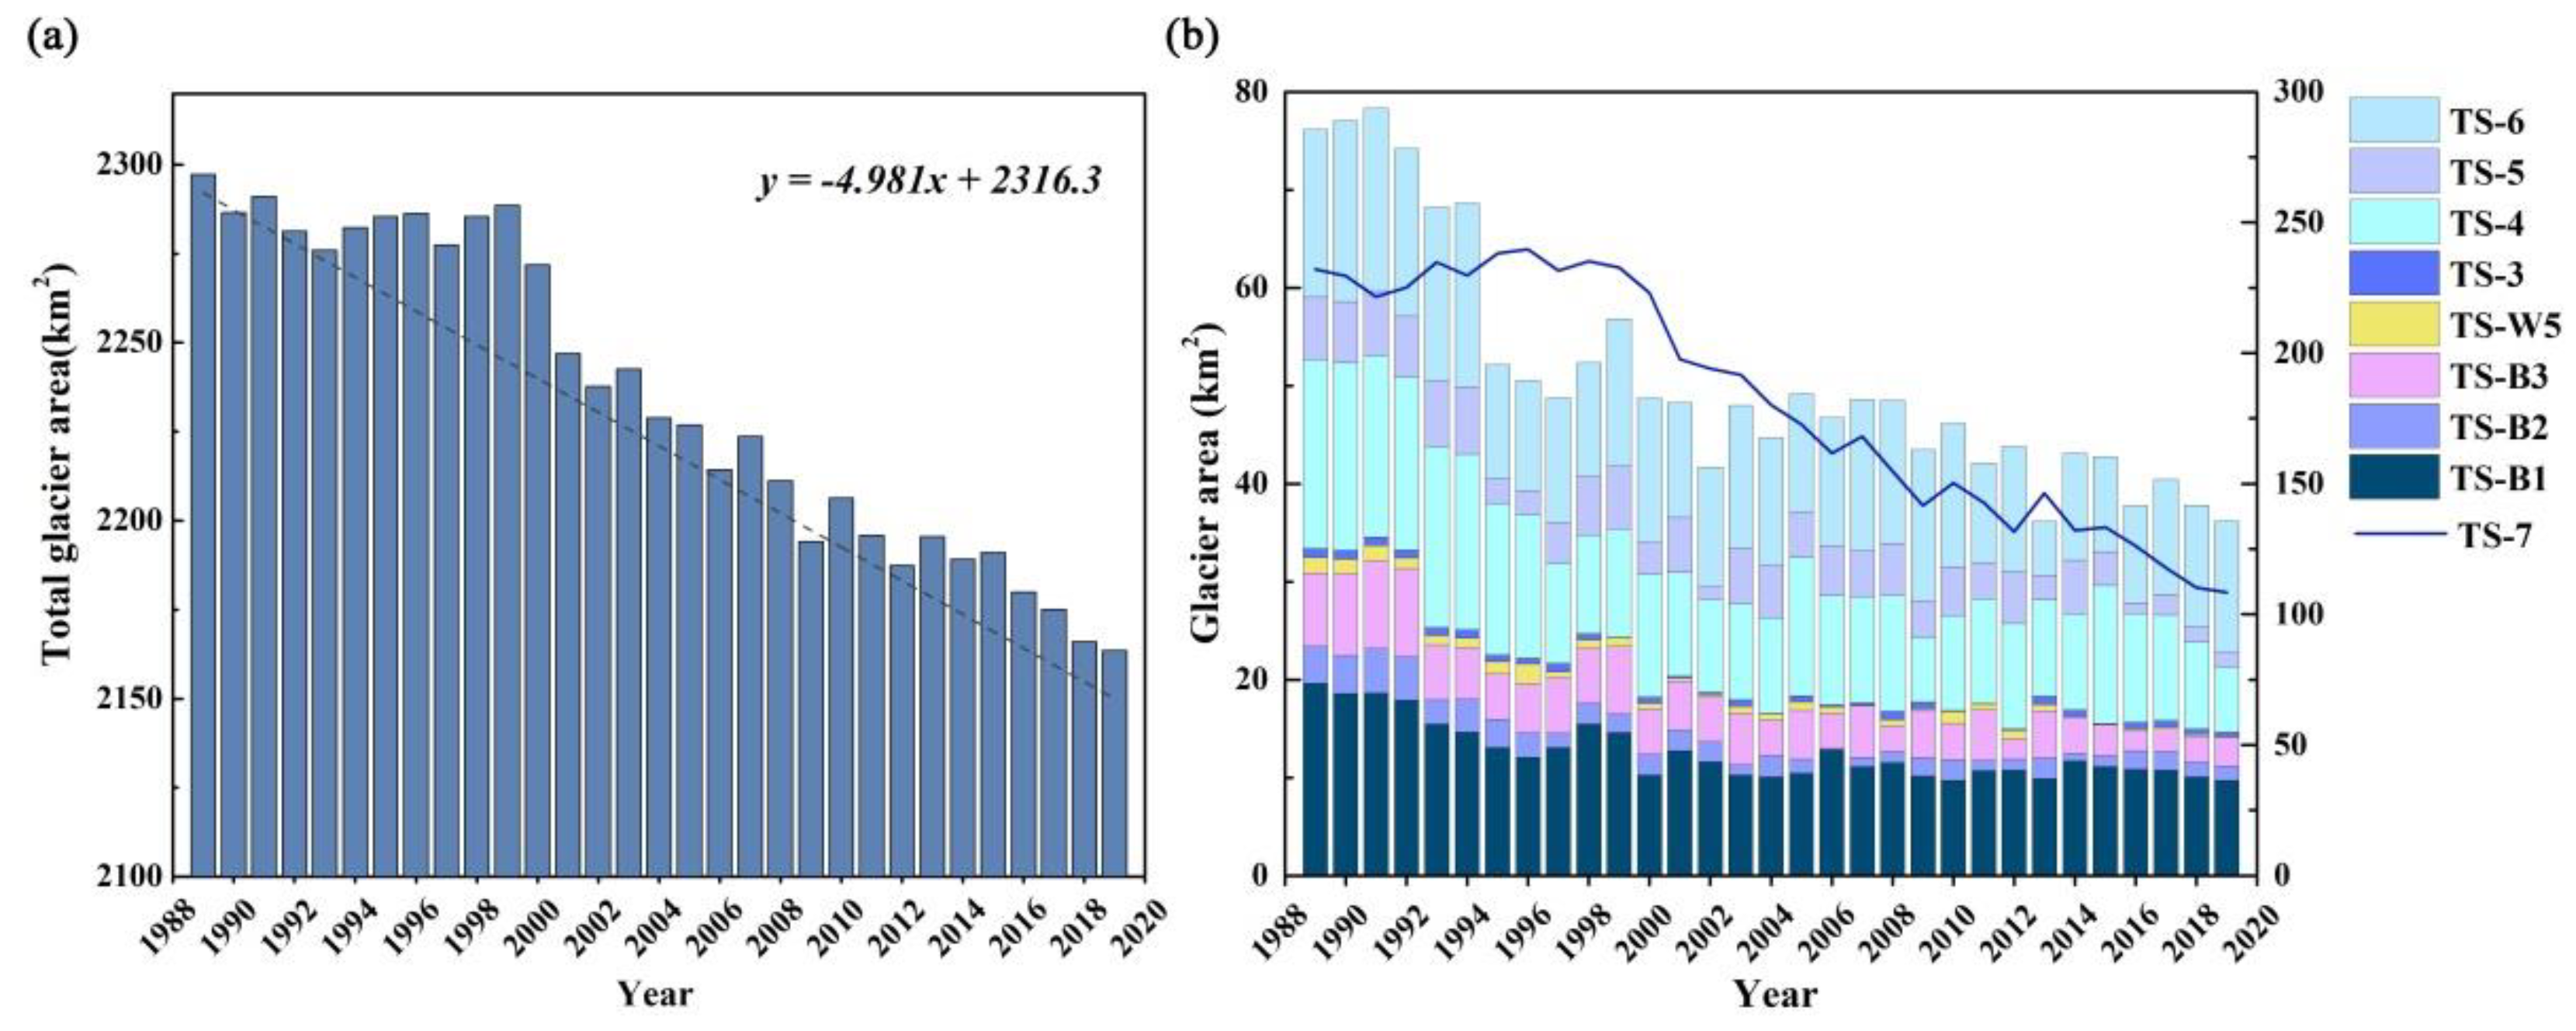
- The shrinking, and even disappearance, of mountain glaciers was the main reason for the decrease in discharge in glacial-meltwater-dominated river sections. The glacier area presented a decreasing trend during the study period, with a decreasing rate of −4.98 (p < 0.01), and the discharge change in these sections had the same trend. The increase in discharge in precipitation-dominated river sections was mainly attributed to the increase of precipitation at a rate of 1.93 mm/year, which is consistent with the discharge trend.
Author Contributions
Funding
Data Availability Statement
Conflicts of Interest
References
- IPCC. Climate Change 2014: Mitigation of Climate Change: Working Group III Contribution to the IPCC Fifth Assessment Report; Cambridge University Press: Cambridge, UK, 2015. [Google Scholar] [CrossRef] [Green Version]
- Leclercq, P.W.; Oerlemans, J.; Basagic, H.J.; Bushueva, I.; Cook, A.J.; Le Bris, R. A data set of worldwide glacier length fluctuations. Cryosphere 2014, 8, 659–672. [Google Scholar] [CrossRef] [Green Version]
- Zemp, M.; Huss, M.; Thibert, E.; Eckert, N.; McNabb, R.; Huber, J.; Barandun, M.; Machguth, H.; Nussbaumer, S.U.; Gartner-Roer, I.; et al. Global glacier mass changes and their contributions to sea-level rise from 1961 to 2016. Nature 2019, 568, 382–386. [Google Scholar] [CrossRef]
- Huss, M. Extrapolating glacier mass balance to the mountain-range scale: The European Alps 1900–2100. Cryosphere 2012, 6, 713–727. [Google Scholar] [CrossRef] [Green Version]
- Abermann, J.; Lambrecht, A.; Fischer, A.; Kuhn, M. Quantifying changes and trends in glacier area and volume in the Austrian Ötztal Alps (1969–1997–2006). Cryosphere 2009, 3, 205–215. [Google Scholar] [CrossRef] [Green Version]
- Fischer, M.; Huss, M.; Hoelzle, M. Surface elevation and mass changes of all Swiss glaciers 1980–2010. Cryosphere 2015, 9, 525–540. [Google Scholar] [CrossRef] [Green Version]
- Shijin, W.; Yanjun, C.; Yanqiang, W. Spatiotemporal dynamic characteristics of typical temperate glaciers in China. Sci. Rep. 2021, 11. [Google Scholar] [CrossRef]
- Sommer, C.; Malz, P.; Seehaus, T.C.; Lippl, S.; Zemp, M.; Braun, M.H. Rapid glacier retreat and downwasting throughout the European Alps in the early 21(st) century. Nat. Commun. 2020, 11, 3209. [Google Scholar] [CrossRef]
- Zemp, M.; Frey, H.; Gärtner-Roer, I.; Nussbaumer, S.U.; Hoelzle, M.; Paul, F.; Haeberli, W.; Denzinger, F.; Ahlstrøm, A.P.; Anderson, B.; et al. Historically unprecedented global glacier decline in the early 21st century. J. Glaciol. 2017, 61, 745–762. [Google Scholar] [CrossRef] [Green Version]
- Farinotti, D.; Usselmann, S.; Huss, M.; Bauder, A.; Funk, M. Runoff evolution in the Swiss Alps: Projections for selected high-alpine catchments based on ENSEMBLES scenarios. Hydrol. Process. 2012, 26, 1909–1924. [Google Scholar] [CrossRef]
- Leppi, J.C.; DeLuca, T.H.; Harrar, S.W.; Running, S.W. Impacts of climate change on August stream discharge in the Central-Rocky Mountains. Clim. Chang. 2011, 112, 997–1014. [Google Scholar] [CrossRef]
- Lutz, A.F.; Immerzeel, W.W.; Shrestha, A.B.; Bierkens, M.F.P. Consistent increase in High Asia’s runoff due to increasing glacier melt and precipitation. Nat. Clim. Chang. 2014, 4, 587–592. [Google Scholar] [CrossRef] [Green Version]
- Ragettli, S.; Immerzeel, W.W.; Pellicciotti, F. Contrasting climate change impact on river flows from high-altitude catchments in the Himalayan and Andes Mountains. Proc. Natl. Acad. Sci. USA 2016, 113, 9222–9227. [Google Scholar] [CrossRef] [Green Version]
- Stahl, K.; Moore, D. Influence of watershed glacier coverage on summer streamflow in British Columbia, Canada. Water Resour. Res. 2006, 42. [Google Scholar] [CrossRef]
- Nolin, A.W.; Phillippe, J.; Jefferson, A.; Lewis, S.L. Present-day and future contributions of glacier runoff to summertime flows in a Pacific Northwest watershed: Implications for water resources. Water Resour. Res. 2010, 46, 65–74. [Google Scholar] [CrossRef]
- Sorg, A.; Bolch, T.; Stoffel, M.; Solomina, O.; Beniston, M. Climate change impacts on glaciers and runoff in Tien Shan (Central Asia). Nat. Clim. Chang. 2012, 2, 725–731. [Google Scholar] [CrossRef]
- Azmat, M.; Liaqat, U.W.; Qamar, M.U.; Awan, U.K. Impacts of changing climate and snow cover on the flow regime of Jhelum River. Reg. Environ. Chang. 2016, 17, 1–13. [Google Scholar] [CrossRef]
- Immerzeel, W.W.; van Beek, L.P.H.; Konz, M.; Shrestha, A.B.; Bierkens, M.F.P. Hydrological response to climate change in a glacierized catchment in the Himalayas. Clim. Chang. 2012, 110, 721–736. [Google Scholar] [CrossRef] [PubMed] [Green Version]
- Rashid, I.; Majeed, U.; Aneaus, S.; Pelto, M. Linking the Recent Glacier Retreat and Depleting Streamflow Patterns with Land System Changes in Kashmir Himalaya, India. Water 2020, 12, 1168. [Google Scholar] [CrossRef] [Green Version]
- Pellicciotti, F.; Bauder, A.; Parola, M. Effect of glaciers on streamflow trends in the Swiss Alps. Water Resour. Res. 2010, 46. [Google Scholar] [CrossRef] [Green Version]
- Luo, M.; Liu, T.; Meng, F.; Duan, Y.; Bao, A.; Xing, W.; Feng, X.; De Maeyer, P.; Frankl, A. Identifying climate change impacts on water resources in Xinjiang, China. Sci. Total Environ. 2019, 676, 613–626. [Google Scholar] [CrossRef] [PubMed]
- Rets, E.P.; Durmanov, I.N.; Kireeva, M.B.; Smirnov, A.M.; Popovnin, V.V. Past ‘peak water’ in the North Caucasus: Deglaciation drives a reduction in glacial runoff impacting summer river runoff and peak discharges. Clim. Chang. 2020, 163, 2135–2151. [Google Scholar] [CrossRef]
- Chen, Y.; Li, W.; Deng, H.; Fang, G.; Li, Z. Changes in Central Asia’s Water Tower: Past, Present and Future. Sci. Rep. 2016, 6. [Google Scholar] [CrossRef] [PubMed] [Green Version]
- Farinotti, D.; Longuevergne, L.; Moholdt, G.; Duethmann, D.; Mölg, T.; Bolch, T.; Vorogushyn, S.; Güntner, A. Substantial glacier mass loss in the Tien Shan over the past 50 years. Nat. Geosci. 2015, 8, 716–722. [Google Scholar] [CrossRef]
- Jia, Y.; Li, Z.; Jin, S.; Xu, C.; Deng, H.; Zhang, M. Runoff Changes from Urumqi Glacier No. 1 over the Past 60 Years, Eastern Tianshan, Central Asia. Water 2020, 12, 1286. [Google Scholar] [CrossRef]
- Zhang, Q.; Chen, Y.; Li, Z.; Fang, G.; Xiang, Y.; Li, Y.; Ji, H. Recent Changes in Water Discharge in Snow and Glacier Melt-Dominated Rivers in the Tienshan Mountains, Central Asia. Remote Sens. 2020, 12, 2704. [Google Scholar] [CrossRef]
- Bjerklie, D.M.; Ayotte, J.D.; Cahillane, M.J. Simulating Hydrologic Response to Climate Change Scenarios in Four Selected Watersheds of New Hampshire; US Geological Survey Scientific Investigations Report: Reston, VA, USA, 2015; pp. 2015–5047. [Google Scholar]
- Hirpa, F.A.; Hopson, T.M.; De Groeve, T.; Brakenridge, G.R.; Gebremichael, M.; Restrepo, P.J. Upstream satellite remote sensing for river discharge forecasting: Application to major rivers in South Asia. Remote Sens. Environ. 2013, 131, 140–151. [Google Scholar] [CrossRef]
- Costa, J.E.; Cheng, R.T.; Haeni, F.P.; Melcher, N.; Spicer, K.R.; Hayes, E.; Plant, W.; Hayes, K.; Teague, C.; Barrick, D. Use of radars to monitor stream discharge by noncontact methods. Water Resour. Res. 2006, 42. [Google Scholar] [CrossRef]
- Gleason, C.J.; Smith, L.C. Toward global mapping of river discharge using satellite images and at-many-stations hydraulic geometry. Proc. Natl. Acad. Sci. USA 2014, 111, 4788–4791. [Google Scholar] [CrossRef] [Green Version]
- Jung, H.C.; Hamski, J.; Durand, M.; Alsdorf, D.; Hossain, F.; Lee, H.; Hossain, A.K.M.A.; Hasan, K.; Khan, A.S.; Hoque, A.K.M.Z. Characterization of complex fluvial systems using remote sensing of spatial and temporal water level variations in the Amazon, Congo, and Brahmaputra Rivers. Earth Surf. Process. Landf. 2010, 35, 294–304. [Google Scholar] [CrossRef]
- LeFavour, G.; Alsdorf, D. Water slope and discharge in the Amazon River estimated using the shuttle radar topography mission digital elevation model. Geophys. Res. Lett. 2005, 32. [Google Scholar] [CrossRef] [Green Version]
- Pavelsky, T.M. Using width-based rating curves from spatially discontinuous satellite imagery to monitor river discharge. Hydrol. Process. 2014. [Google Scholar] [CrossRef]
- Xu, K.; Zhang, J.; Watanabe, M.; Sun, C. Estimating river discharge from very high-resolution satellite data: A case study in the Yangtze River, China. Hydrol. Process. 2004, 18, 1927–1939. [Google Scholar] [CrossRef]
- Zhang, C.; Kovacs, J.M. The application of small unmanned aerial systems for precision agriculture: A review. Precis. Agric. 2012, 13, 693–712. [Google Scholar] [CrossRef]
- Anderson, K.; Gaston, K.J. Lightweight unmanned aerial vehicles will revolutionize spatial ecology. Front. Ecol. Environ. 2013, 11, 138–146. [Google Scholar] [CrossRef] [Green Version]
- Howell, T.L.; Singh, K.K.; Smart, L. Structure from Motion Techniques for Estimating the Volume of Wood Chips. In High Spatial Resolution Remote Sensing; CRC Press: Boca Raton, FL, USA, 2018; pp. 149–164. [Google Scholar] [CrossRef]
- Mesas-Carrascosa, F.J.; Notario Garcia, M.D.; Merono de Larriva, J.E.; Garcia-Ferrer, A. An Analysis of the Influence of Flight Parameters in the Generation of Unmanned Aerial Vehicle (UAV) Orthomosaicks to Survey Archaeological Areas. Sensors 2016, 16, 1838. [Google Scholar] [CrossRef] [Green Version]
- Zhao, C.S.; Zhang, C.B.; Yang, S.T.; Liu, C.M.; Xiang, H.; Sun, Y.; Yang, Z.Y.; Zhang, Y.; Yu, X.Y.; Shao, N.F.; et al. Calculating e-flow using UAV and ground monitoring. J. Hydrol. 2017, 552, 351–365. [Google Scholar] [CrossRef]
- Yang, S.; Wang, J.; Wang, P.; Gong, T.; Liu, H. Low Altitude Unmanned Aerial Vehicles (UAVs) and Satellite Remote Sensing are used to Calculated river discharge Attenuation Coefficients of Ungauged Catchments in Arid Desert. Water 2019, 11, 2633. [Google Scholar] [CrossRef] [Green Version]
- Ma, Y.; Huang, Y.; Liu, T. Change and Climatic Linkage for Extreme Flows in Typical Catchments of Middle Tianshan Mountain, Northwest China. Water 2018, 10, 1061. [Google Scholar] [CrossRef] [Green Version]
- Qi, J.; Kulmatov, R. An Overview of Environmental Issues in Central Asia; Springer: Tashkent, Uzbekistan, 2008. [Google Scholar] [CrossRef]
- Liu, S.; Yao, X.; Guo, W.; Xu, J. The contemporary glaciers in china based on the second chinese glacier inventory. Acta Geogr. Sin. 2015, 70, 3–16. [Google Scholar]
- Zhang, C.B.; Yang, S.T.; Zhao, C.S.; Lou, H.Z.; Zhang, Y.C.; Bai, J.; Wang, Z.W.; Guan, Y.B.; Zhang, Y. Topographic data accuracy verification of small consumer UAV. Remote Sens. 2018, 22, 185–195. [Google Scholar] [CrossRef]
- Drusch, M.; Del Bello, U.; Carlier, S.; Colin, O.; Fernandez, V.; Gascon, F.; Hoersch, B.; Isola, C.; Laberinti, P.; Martimort, P. Sentinel-2: ESA’s Optical High-Resolution Mission for GMES Operational Services. Remote Sens. Environ. 2012, 120, 25–36. [Google Scholar] [CrossRef]
- Wulder, M.A.; White, J.C.; Goward, S.N.; Masek, J.G.; Irons, J.R.; Herold, M.; Cohen, W.B.; Loveland, T.R.; Woodcock, C.E. Landsat continuity: Issues and opportunities for land cover monitoring. Remote Sens. Environ. 2008, 112, 955–969. [Google Scholar] [CrossRef]
- Balsamo, G.; Albergel, C.; Beljaars, A.; Boussetta, S.; Brun, E.; Cloke, H.; Dee, D.; Dutra, E.; Pappenberger, F.; Rosnay, P.; et al. ERA-Interim/Land: A Global Land-Surface Reanalysis Based on ERA-Interim Meteorological Forcing; Shinfield Park: Shinfield, UK, 2012. [Google Scholar]
- Yang, S.; Wang, P.; Lou, H.; Wang, J.; Zhao, C.; Gong, T. Estimating River Discharges in Ungauged Catchments Using the Slope area Method and Unmanned Aerial Vehicle. Water 2019, 11, 2361. [Google Scholar] [CrossRef] [Green Version]
- Zhao, C.; Pan, X.; Yang, S.; Liu, C.; Chen, X.; Zhang, H.; Pan, T. Measuring streamflow with low-altitude UAV imagery. Acta Geogr. Sin. 2019, 7, 1392–1408. [Google Scholar] [CrossRef]
- Lou, H.; Wang, P.; Yang, S.; Hao, F.; Ren, X.; Wang, Y.; Shi, L.; Wang, J.; Gong, T. Combining and Comparing an Unmanned Aerial Vehicle and Multiple Remote Sensing Satellites to Calculate Long-Term River Discharge in an Ungauged Water Source Region on the Tibetan Plateau. Remote Sens. 2020, 12, 2155. [Google Scholar] [CrossRef]
- Wang, J.; Yang, S.; Liu, H.; Wang, P.; Lou, H.; Gong, T. Simulation of Lake Water Volume in Ungauged Terminal Lake Basin Based on Multi-Source Remote Sensing. Remote Sens. 2021, 13, 697. [Google Scholar] [CrossRef]
- Wang, P.; Yang, S.; Wang, J.; Pan, T.; Zhang, S.; Gong, T. Discharge estimation with hydraulic geometry using unmanned aerial vehicle and remote sensing. J. Hydraul. Eng. 2020, 4, 492–504. [Google Scholar] [CrossRef]
- Yang, S.; Li, C.; Lou, H.; Wang, P.; Wang, J.; Ren, X. Performance of an Unmanned Aerial Vehicle (UAV) in Calculating the Flood Peak Discharge of Ephemeral Rivers Combined with the Incipient Motion of Moving Stones in Arid Ungauged Regions. Remote Sens. 2020, 12, 1610. [Google Scholar] [CrossRef]
- Yang, S.; Wang, P.; Wang, J.; Lou, H.; Gong, T. River Flow Estimation Method Based on UAV Aerial Photogrammetry. J. Remote Sens. 2021. accepted. [Google Scholar]
- De Doncker, L.; Troch, P.; Verhoeven, R.; Bal, K.; Meire, P.; Quintelier, J. Determination of the Manning roughness coefficient influenced by vegetation in the river Aa and Biebrza river. Environ. Fluid Mech. 2009, 9, 549–567. [Google Scholar] [CrossRef]
- Noarayanan, L.; Murali, K.; Sundar, V. Manning’s ‘n’ co-efficient for flexible emergent vegetation in tandem configuration. J. Hydro-Environ. Res. 2012, 6, 51–62. [Google Scholar] [CrossRef]
- Schulze, K.; Hunger, M.; Döll, P. Simulating river flow velocity on global scale. Adv. Geosci. 2005, 5, 133–136. [Google Scholar] [CrossRef] [Green Version]
- Ngo-Duc, T.; Oki, T.; Kanae, S. A variable streamflow velocity method for global river routing model: Model description and preliminary results. Hydrol. Earth Syst. Sci. Discuss. 2007, 4, 4389–4414. [Google Scholar] [CrossRef]
- Rebolho, C.; Andréassian, V.; Le Moine, N. Inundation mapping based on reach-scale effective geometry. Hydrol. Earth Syst. Sci. 2018, 22, 5967–5985. [Google Scholar] [CrossRef] [Green Version]
- William, F.C. Estimation of Roughness Coefficients for Natural Stream Channels with Vegetated Banks; United State Geological Survey: Reston, VA, USA, 1998; Volume 2441. [Google Scholar]
- Keshava, N.; Mustard, J.F. Spectral unmixing. IEEE Signal Process. Mag. 2002, 19, 44–57. [Google Scholar] [CrossRef]
- Sichangi, A.W.; Wang, L.; Yang, K.; Chen, D.; Wang, Z.; Li, X.; Zhou, J.; Liu, W.; Kuria, D. Estimating continental river basin discharges using multiple remote sensing data sets. Remote Sens. Environ. 2016, 179, 36–53. [Google Scholar] [CrossRef] [Green Version]
- Briney, A. An Overview of Valley Formation and Development. Available online: https://www.thoughtco.com/valley-formation-and-development-1435365 (accessed on 19 June 2021).
- Birkinshaw, S.; Moore, P.; Kilsby, C.; O’donnell, G.; Hardy, A.J.; Berry, P. Daily discharge estimation at ungauged river sites using remote sensing. Hydrol. Process. 2014, 28. [Google Scholar] [CrossRef]
- Singh, V.; Singh, P.; Haritashya, U. Tien Shan glaciers. In Encyclopedia of Snow, Ice and Glaciers; Springer: Dordrecht, The Netherlands, 2011. [Google Scholar] [CrossRef]
- Shi, C.; Wang, L. Incorporating spatial information in spectral unmixing: A review. Remote Sens. Environ. 2014, 149, 70–87. [Google Scholar] [CrossRef]
- Duethmann, D.; Bolch, T.; Farinotti, D.; Kriegel, D.; Vorogushyn, S.; Merz, B.; Pieczonka, T.; Jiang, T.; Buda, S.; Guentner, A. Attribution of streamflow trends in snow and glacier melt-dominated catchments of the Tarim River, Central Asia. Water Resour. Res. 2015, 51, 4727–4750. [Google Scholar] [CrossRef] [Green Version]
- Liu, Y.; Xu, J.; Lu, X.; Nie, L. Assessment of glacier- and snowmelt-driven streamflow in the arid middle Tianshan Mountains of China. Hydrol. Process. 2020, 34, 2750–2762. [Google Scholar] [CrossRef]
- Kogutenko, L.; Severskiy, I.; Shahgedanova, M.; Lin, B. Change in the Extent of Glaciers and Glacier Runoff in the Chinese Sector of the Ile River Basin between 1962 and 2012. Water 2019, 11, 1668. [Google Scholar] [CrossRef] [Green Version]
- Shen, Y.; Shen, Y.; Fink, M.; Kralisch, S.; Yaning, C.; Brenning, A. Trends and variability in streamflow and snowmelt runoff timing in the southern Tianshan Mountains. J. Hydrol. 2017, 557, 173–181. [Google Scholar] [CrossRef]


| UAV Model | Phantom-4-Pro |
|---|---|
| Camera model | FC300x |
| Sensor type | 1/2.3″ CMOS sensor |
| Image size | 1.2 million (4000 × 3000) |
| Maximum aperture | f/2.8 |
| Camera focal length | 20 mm |
| Field of view | 94° |
| Maximum flight altitude | 500 m |
| Water Supply Source | Section | Location | River Width (m) | Control Area (km2) |
|---|---|---|---|---|
| Glacial meltwater | TS-B1 | 44°55′02.74″,80°06′45.76″ | 25.71 | 260.29 |
| TS-B2 | 44°55′42.99″,80°03′38.42″ | 12.85 | 79.46 | |
| TS-B3 | 44°55′59.19″,80°05′39.60″ | 11.03 | 68.35 | |
| TS-W5 | 45°08′27.25″,81°17′24.40″ | 9.06 | 61.84 | |
| TS-3 | 43°56′40.16″,85°47′44.75″ | 12.46 | 3.64 | |
| TS-4 | 43°56′47.04″,85°36′09.42″ | 9.94 | 265.21 | |
| TS-5 | 43°59′27.51″,85°18′03.05″ | 7.63 | 166.55 | |
| TS-6 | 43°57′56.17″,85°06′44.52″ | 9.98 | 108.98 | |
| TS-7 | 44°01′27.58″,84°58′34.68″ | 32.25 | 1091.83 | |
| Precipitation | TS-B4 | 44°56′18.48″,80°12′42.14″ | 13.56 | 66.22 |
| TS-B5 | 44°57′11.48″,80°24′09.70″ | 8.88 | 82.19 | |
| TS-B6 | 44°57′42.17″,80°34′35.85″ | 7.13 | 58.13 | |
| TS-W1 | 45°03′06.98″,81°02′25.81″ | 2.47 | 45.54 | |
| TS-W2 | 45°05′02.60″,81°02′17.34″ | 10.17 | 45.54 | |
| TS-W3 | 45°03′41.95″,81°04′58.72″ | 2.42 | 23.89 | |
| TS-W4 | 45°07′40.96″,81°11′39.07″ | 3.88 | 18.02 | |
| TS-W6 | 45°08′46.43″,81°20′42.83″ | 6.51 | 119.34 | |
| TS-1 | 43°49′53.41″,85°21′58.71″ | 17.84 | 973.86 | |
| TS-2 | 43°54′02.98″,85°51′33.35″ | 43.25 | 961.48 |
| Dataset | Spatial Resolution | Temporal Resolution | Period | Source |
|---|---|---|---|---|
| UAV images | 3.8–4.2 cm | / | 8 August 2018–15 August 2018 | Fieldwork |
| Landsat | 30 m | 16-day | 1989–2019 | http://www.gscloud.cn/ (accessed on 19 September 2020) |
| Sentinel-2 | 10 m | 5-day | 2016–2019 | https://scihub.copernicus.eu/dhus/#/home (accessed on 19 September 2020) |
| ERA-Interim | 0.125° | daily | 1989–2018 | https://apps.ecmwf.int/datasets/ (accessed on 29 September 2020) |
| Section | Qc (m3/s) | Qm (m3/s) | RA (%) | Section | Qc (m3/s) | Qm (m3/s) | RA (%) |
|---|---|---|---|---|---|---|---|
| TS-B1 | 28.53 | 26.34 | 7.68 | TS-W5 | 1.21 | 1.07 | 11.57 |
| TS-B2 | 3.03 | 2.95 | 2.64 | TS-W6 | 1.97 | 2.25 | 14.21 |
| TS-B3 | 3.17 | 3.29 | 3.79 | TS1 | 39.15 | 40.07 | 2.35 |
| TS-B4 | 41.23 | 39.42 | 4.39 | TS2 | 54.02 | 49.29 | 8.76 |
| TS-B5 | 17.19 | 15.34 | 10.76 | TS3 | 10.43 | 11.76 | 12.75 |
| TS-B6 | 15.29 | 11.76 | 23.09 | TS4 | 3.74 | 3.96 | 5.88 |
| TS-W1 | 3.85 | 3.97 | 3.12 | TS5 | 1.02 | 1.2 | 17.65 |
| TS-W2 | 0.45 | 0.53 | 17.78 | TS6 | 2.56 | 2.95 | 15.23 |
| TS-W3 | 0.29 | 0.34 | 17.24 | TS7 | 106.05 | 95.46 | 9.99 |
| TS-W4 | 0.45 | 0.39 | 13.33 |
Publisher’s Note: MDPI stays neutral with regard to jurisdictional claims in published maps and institutional affiliations. |
© 2021 by the authors. Licensee MDPI, Basel, Switzerland. This article is an open access article distributed under the terms and conditions of the Creative Commons Attribution (CC BY) license (https://creativecommons.org/licenses/by/4.0/).
Share and Cite
Wufu, A.; Chen, Y.; Yang, S.; Lou, H.; Wang, P.; Li, C.; Wang, J.; Ma, L. Changes in Glacial Meltwater Runoff and Its Response to Climate Change in the Tianshan Region Detected Using Unmanned Aerial Vehicles (UAVs) and Satellite Remote Sensing. Water 2021, 13, 1753. https://doi.org/10.3390/w13131753
Wufu A, Chen Y, Yang S, Lou H, Wang P, Li C, Wang J, Ma L. Changes in Glacial Meltwater Runoff and Its Response to Climate Change in the Tianshan Region Detected Using Unmanned Aerial Vehicles (UAVs) and Satellite Remote Sensing. Water. 2021; 13(13):1753. https://doi.org/10.3390/w13131753
Chicago/Turabian StyleWufu, Adilai, Yun Chen, Shengtian Yang, Hezhen Lou, Pengfei Wang, Chaojun Li, Juan Wang, and Ligang Ma. 2021. "Changes in Glacial Meltwater Runoff and Its Response to Climate Change in the Tianshan Region Detected Using Unmanned Aerial Vehicles (UAVs) and Satellite Remote Sensing" Water 13, no. 13: 1753. https://doi.org/10.3390/w13131753