
Spatial and Temporal Diversity of Cyanometabolites in the Eutrophic Curonian Lagoon (SE Baltic Sea)


1
Marine Research Institute, University of Klaipėda, Universiteto ave. 17, LT-92294 Klaipeda, Lithuania
2
Division of Marine Biotechnology, Faculty of Oceanography and Geography, University of Gdańsk, Marszałka J. Piłsudskiego 46, PL-81378 Gdynia, Poland
*
Author to whom correspondence should be addressed.
Water 2021, 13(13), 1760; https://doi.org/10.3390/w13131760
Submission received: 11 May 2021
/
Revised: 17 June 2021
/
Accepted: 22 June 2021
/
Published: 25 June 2021
(This article belongs to the Special Issue Plankton Ecology in Shallow Coastal Waters)
Abstract
:This work aims to determine the profiles of cyanopeptides and anatoxin synthetized by cyanobacteria in the Lithuanian part of the Curonian Lagoon (SE Baltic Sea) and to characterize their spatial and temporal patterns in this ecosystem. Cyanometabolites were analysed by a LC-MS/MS system and were coupled to a hybrid triple quadrupole/linear ion trap mass spectrometer. During the investigation period (2013–2017), 10 microcystins, nodularin, anatoxin-a, 16 anabaenopeptins, including 1 oscillamide, 12 aeruginosins, 1 aeruginosamide, 3 cyanopeptolins and 4 microginins were detected. The most frequently detected metabolites were found at all investigated sites. Demethylated microcystin variants and anabaenopeptins had the strongest relationship with Planktothrix agardhii, while non-demethylated microcystin variants and anatoxin had the strongest relationship with Microcystis spp. Low concentrations of some microcystins: [Asp3]MC-RR, MC-RR, MC-LR, as well as a few other cyanopeptides: AP-A and AEG-A were found during the cold period (December–March). Over the study period, Aphanizomenon, Planktothrix and Microcystis were the main dominant cyanobacteria species, while Planktothrix, Microcystis, and Dolichospermum were potentially producers of cyanopeptides and anatoxin detected in samples from the Curonian Lagoon.
1. Introduction
Cyanobacteria are prokaryotes found in a wide variety of aquatic environments. They grow at high densities, forming ‘blooms’ that increase in extension and frequency, and follow anthropogenic activities and climate changes [1,2,3]. In temperate regions, cyanobacteria ‘blooms’ usually occur during the summer and autumn periods, while some cyanobacteria can also be found in winter and spring [4,5,6,7]. Cyanobacteria blooms are composed of toxic and nontoxic organisms representing different taxonomic units. Cyanobacteria species from at least 16 different genera, belonging to the orders Oscillatoriales, Nostocales, Chroococcales, and Synechococcales are considered as the main bloom forming species, and more than 100 different cyanobacteria taxa (species or genera) produce toxins [8,9,10]. The mixtures of various secondary metabolites are detected during naturally occurring cyanobacteria ‘blooms’. These include low molecular weight toxins, such as anatoxins, saxitoxins, β-methylamino-L-alanine (BMAA) and cylindrospermopsin, and a wide array of oligopeptides, termed cyanopeptides, including microcystins [11]. To date, 2031 cyanobacterial metabolites have been described, among which approximately 65% are peptides [10]. The majority of these peptides range from 400 to 1900 Da, but most of them are present in the 1000–1100 Da range. Cyanopeptides consist of cyclic and linear compounds [10]. Amongst the bioactive cyanopeptides, microcystins are the most geographically widespread and are not restricted to any climatic zone or geographic range [12]. Over 286 microcystin variants have been identified and structurally characterized so far [13,14]. Other peptide classes include anabaenopeptins, aerucyclamides, aeruginosins, and microginins [11,12,15]. The vast majority of cyanopeptides studies are related to compounds produced by the isolated strains of cyanobacteria, and the diversity of metabolites naturally present in field samples is less frequently investigated. Moreover, few studies have focused on the presence of cyanobacteria and cyanometabolites in water bodies during the winter period.
Toxic cyanometabolites, especially hepatotoxins, neurotoxins and cytotoxins, might represent health and ecological risks [16]. Hepatotoxins accumulate in liver cells via the organic anion transport system [17]. Microcystins inhibit protein phosphatase and cause oxidative stress, genotoxicity, and the abnormal function of hepatocytes leading to liver damage [17,18]. Neurotoxins are potent toxins that may rapidly disrupt the functioning of the whole organism or its specific organs leading to muscle paralysis, respiratory arrest, and rapid death [17,18]. The naturally occurring cyanobacteria and their toxins are widely used for water quality assessment [19]. However, data on the diversity, occurrence, (eco)toxicology, and effects of many other cyanometabolites on both recreational areas and drinking water supplies are lacking [10,11]. On the other hand, there is a growing interest in the biological activity of these compounds and their biotechnological application. Many of these compounds show cytotoxic, enzyme inhibiting, anti-inflammatory, anti-microbial or anti-fungal activity [20,21,22]. For example, aeruginosins and cyanopeptolins are serine protease inhibitors, anabaenopeptins inhibit the activity of protein phosphatases, elastase, and carboxy peptidase A, and microginins inhibit amino protease [23]. For this reason, expanded knowledge about the structural diversity of cyanometabolites produced in the Curonian Lagoon is important and can help to direct further studies on their potential application.
Due to the connection with Baltic Sea, the shallow temperate Curonian Lagoon (SE Baltic Sea) experiences a mass occurrence of cyanobacteria representing both brackish and freshwater species [24,25]. In total, about 100 cyanobacteria species have been detected in the Curonian Lagoon [6]. Cyanobacteria blooms typically occur during the summer–autumn period causing a serious threat to aquatic ecosystems and humans using water bodies for recreational purposes [3,4,26]. However, cyanobacteria can also be found during the winter–spring period [6], so also at this time certain effects on aquatic organisms can be exerted [5,27]. To date, studies on cell-bound cyanometabolites in the Curonian Lagoon have been episodic, focusing mainly on microcystins and anatoxin during the summer–autumn periods [28,29,30,31,32,33,34], and there are no published data on the diversity of cyanometabolites throughout all seasons. Therefore, the aim of this work was to present a comprehensive long term and all-season inventory of cyanometabolites found in the Curonian Lagoon and to assess the link between the composition of the cyanobacterial community and the cyanometabolites.
2. Materials and Methods
2.1. Study Area
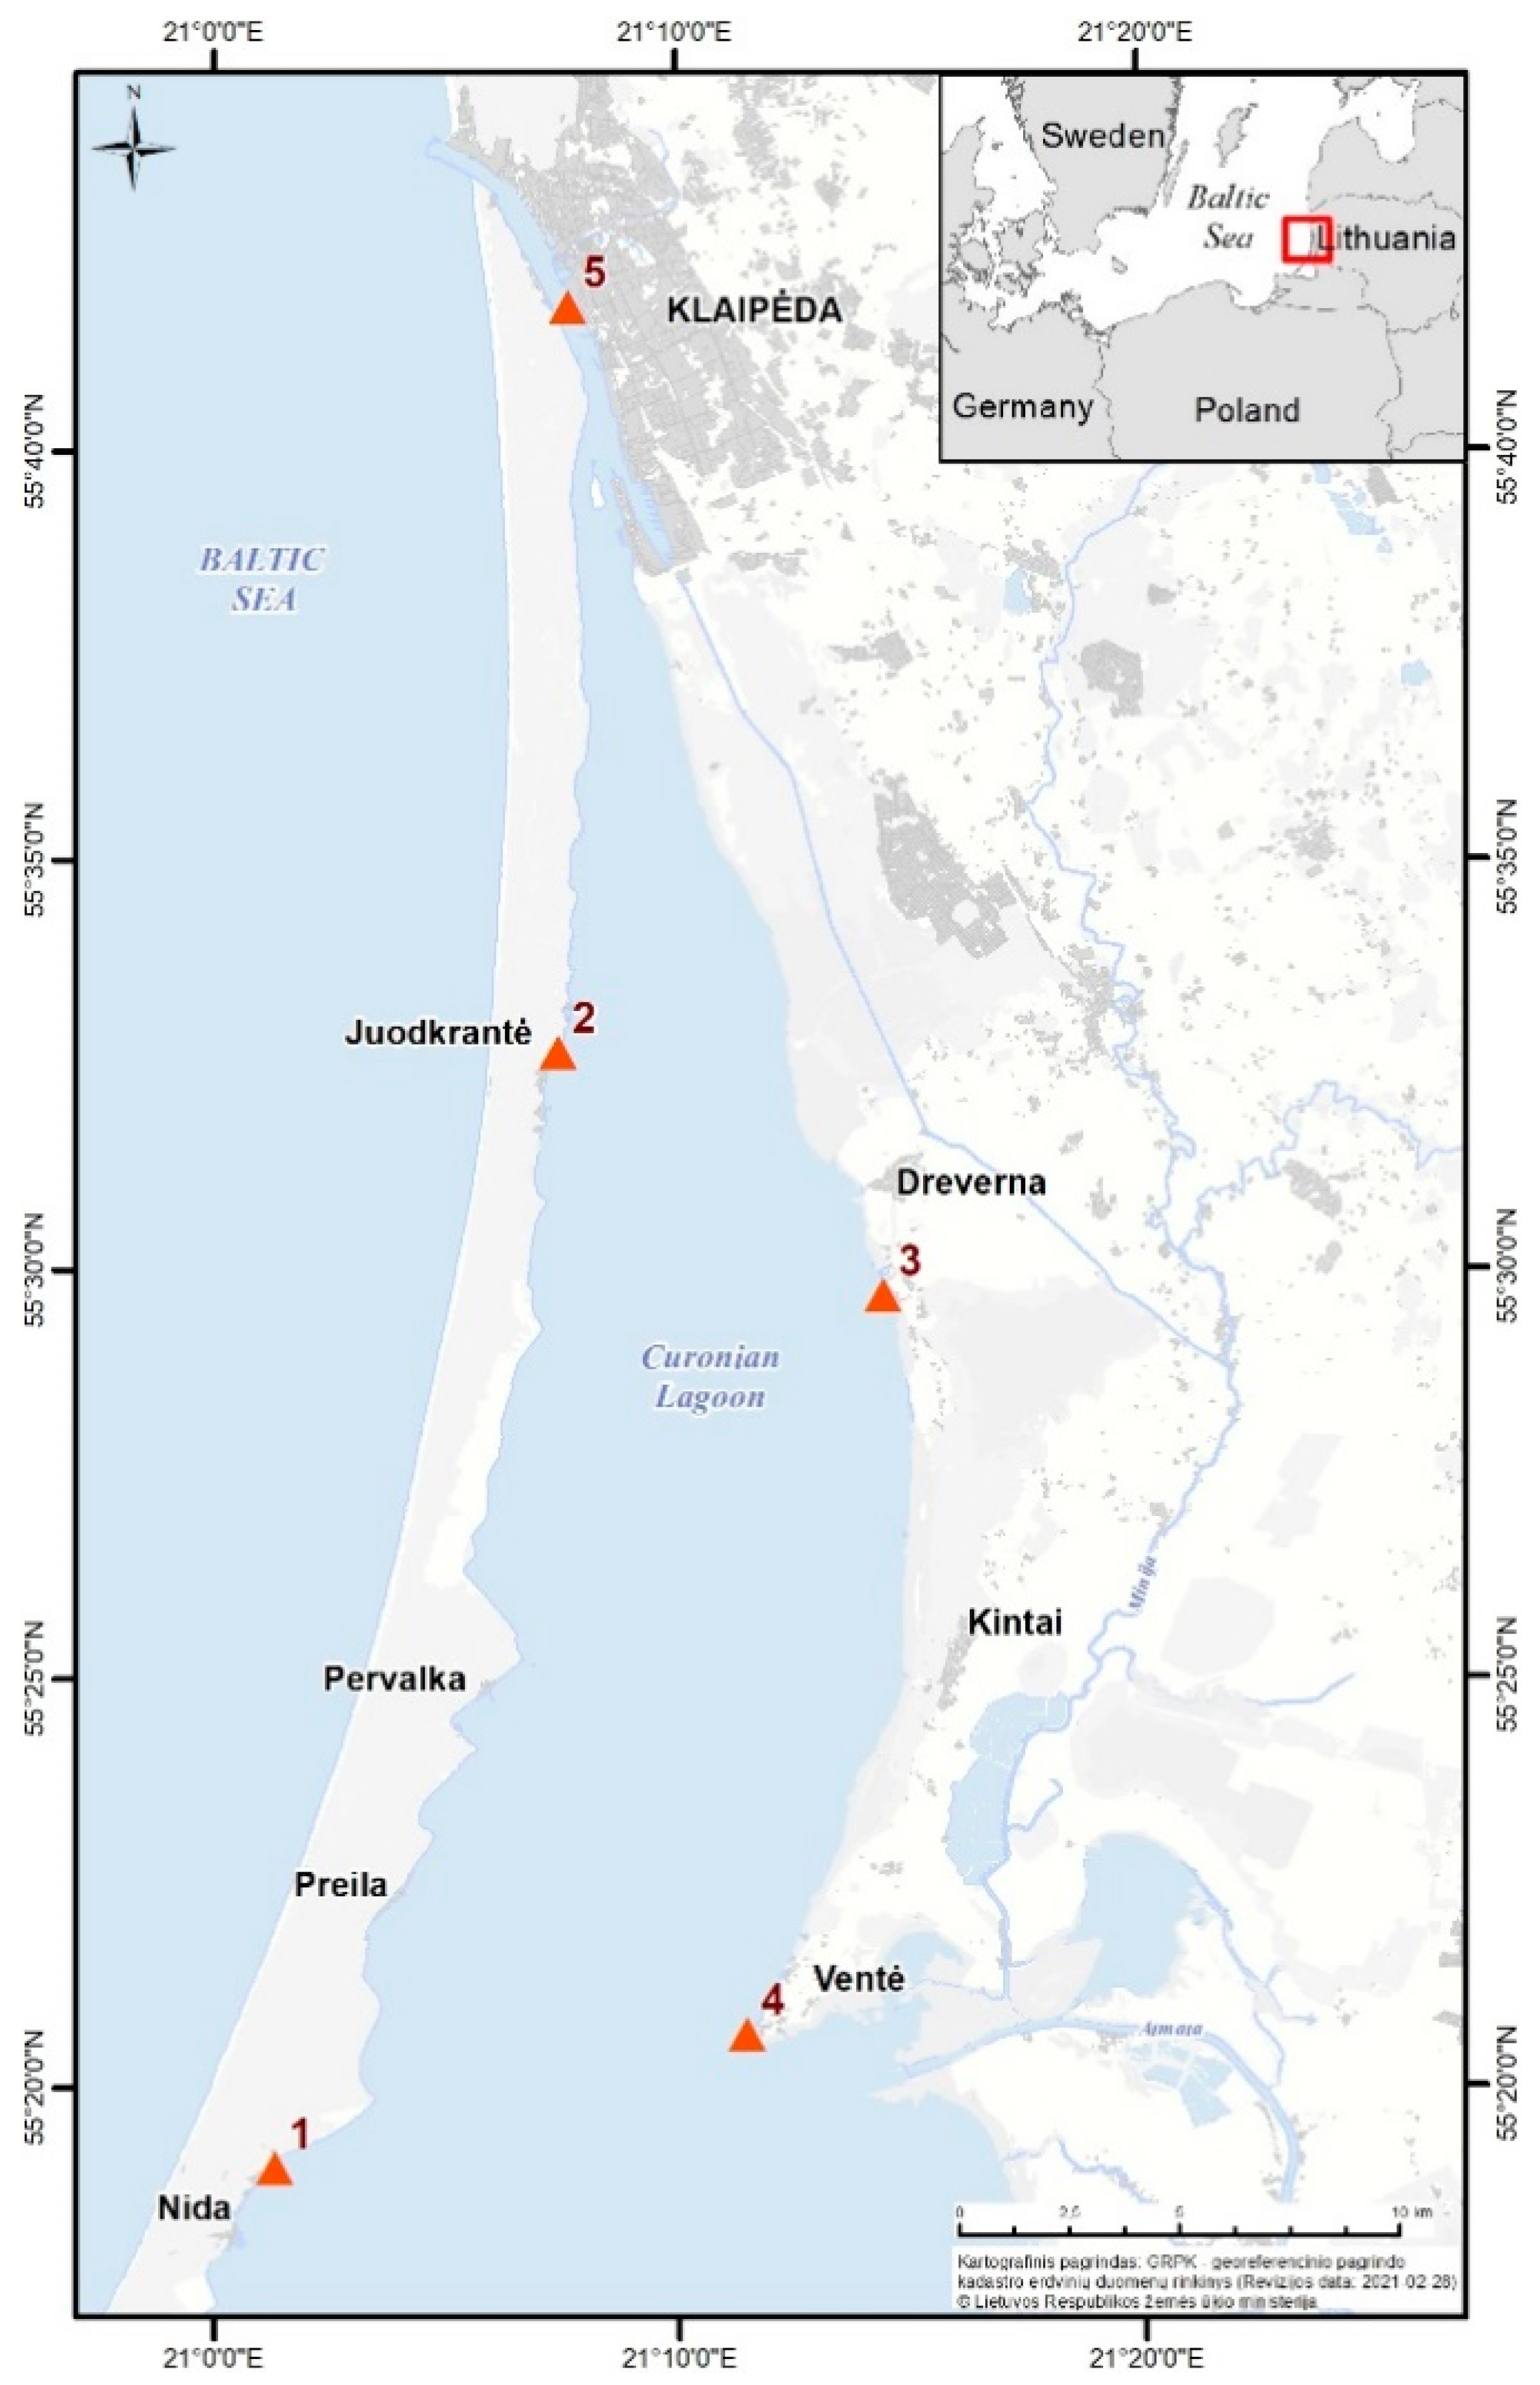
The Curonian Lagoon is a large (surface area 1584 km2) and shallow (mean depth ~3.8 m) estuarine lagoon in the south-eastern (SE) Baltic Sea. The lagoon is mainly a freshwater body connected with the sea by a narrow Klaipėda Strait; brackish water intrusions enter the lagoon irregularly and the salinity in the northern part fluctuates from 0 to 7 psu [35]. The highest annual average salinities of 3–5.5 psu are determined in the Klaipeda Strait. It gradually decreases towards the south and reaches a freshwater salinity level (0.5 psu) at a distance of approximately 35 km from the sea entrance [35]. The highest water temperature is observed in July–August with a monthly average of 20.2 °C [36].
In the Curonian Lagoon, five stations were selected, representing different hydrological conditions. Station 1 (Nida) is situated in the sheltered zone of the central part of the lagoon (Figure 1); the Juodkrantė (St. 2) and Dreverna (St. 3) stations represent the transitional area of the lagoon and the former is situated in the western part and the latter is situated in the eastern part; the Ventė (St. 4) station is strongly influenced by the runoff of the Nemunas River; Station 5, situated in the strait, has the largest influence of the Baltic Sea water (Figure 1).
2.2. Sampling and Measurement of Environmental Parameters
Sub-surface samples were collected every 1–3 weeks in the Lithuanian part of the Curonian Lagoon. In 2013, samples were collected from August to October, and in 2014 from July to November (63 samples in total) during the cyanobacteria vegetation period (stations 1–4), while from 2015 (starting from October) to 2017 samples were collected all year round (64 samples in total) at two stations (St. 1 and St. 5) (Figure 1). Phytoplankton samples were fixed with acidic Lugol’s iodine solution and analysed using the Utermöhl method up to species or a higher taxonomic level; phytoplankton abundance and biomass (wet weight) according to the closest geometrical shape were calculated based on HELCOM recommendations [37]. Physical water parameters: water temperature (in situ using Eco-Sense® ODO200) and salinity (after transporting samples into the laboratory, using Mettler Toledo, FiveEasy Cond meter F30) were measured during each sampling. Ice presence/absence was recorded as well. Chlorophyll a (Chl a), including all phytoplankton taxa, was measured in situ using a Fluorometer (FluoroProbeII, bbe Moldaenke).
2.3. Analysis of Cyanometabolites
For the analyses of cyanometabolites, water samples of 100–1000 mL (depending on algae density) were filtered on GF/F filters (ø 47 mm). The material on the filter was extracted with 75% methanol (3 mL) and sonicated with an ultrasonic disruptor for 1 min (HD 2070 Sonopuls, Bandeline, Berlin, Germany; 20 kz, 25% duty cycle) [38], followed by a 10 min sonication in a water bath (Sonorex, Bandelin, Berlin, Germany) [39]. After centrifugation at 12,000 g for 15 min the supernatant was separated and analysed with a Agilent HPLC system (Agilent technologies, Waldboronn, Germany) coupled to a hybrid triple quadrupole/linear ion trap mass spectrometer QTRAP LC-MS/MS (QTRAP5500, Applied Biosystems, Sciex; Canada) as described in [40]. Peptides were separated on a Zorbax Eclipse XDB-C18 column (4.6 × 150 mm; 5 µm) (Agilent Technologies, Santa Clara, California, USA) by gradient elution with a mixture of 5% acetonitrile in water and 100% acetonitrile, both with 0.1% formic acid. To determine the profile of peptides in the samples, an information dependent acquisition mode (IDA) was used. The structure of the detected peptides was suggested based on collected fragmentation spectra and the spectra published by other authors (e.g., [20,41,42], (Table S1)), while their relative quantities were estimated based on peak areas in the LC-MS chromatogram. For the quantitative analysis of microcystins, nodularin (NOD), and anatoxin-a, for whom standards were available, the multiple reaction monitoring mode (MRM) with the following transitions was used: 1038 → 135q (q-quantifier), 1038 → 103 (dmMC-RR), 1024 → 135q, 1024 → 105 (MC-RR), 1045 → 135q, 1045 → 213 (MC-YR), 981 → 135q, 981 → 213 (dmMC-LR), 995 → 135q, 995 → 213 (MC-LR), 910 → 135q, 910 → 213 (MC-LA), 1002 → 135q, 1002 → 446 (MC-LY), 1025 → 135q, 1025 → 446 (MC-LW), 986 → 135q, 986 → 376 (MC-LF), 825 → 135q, 825 → 389, 825 → 227 (NOD); 166 → 149q, 166 → 131, 166 → 107, 166 → 91 (ANTX-a).
2.4. Data Analyses
For phytoplankton data analysis, potentially toxic cyanobacteria species were pooled into main genera: Aphanizomenon (A. flosaquae, A. gracile, A. issatschenkoi (=Cuspidothrix issatschenkoi), Dolichospermum (D. affine, D. circinale, D. crassum, D. flosaquae, D. lemmermannii), Microcystis (M. aeruginosa, M. flosaquae, M. viridis, M. wesenbergii), and Woronichinia (W. compacta and W. naegeliana).
The redundancy analysis (RDA) was applied using Brodgar (2.7.5) and R (3.3.3) packages to test the relationships between the abiotic factors (water temperature, salinity), the biomass of the different cyanobacteria species (used as explanatory variables) and cyanometabolites produced by cyanobacteria as response variables. All response and biological explanatory variable data were square root-transformed. The Brodgar generated RDA biplots that were interpreted were based on explanatory factor line directions and lengths and response variable lines [43]. Only the most abundant cyanometabolites (found in more than 12% of the samples and NOD) were applied for the statistical analyses.
3. Results
3.1. Abiotic Conditions
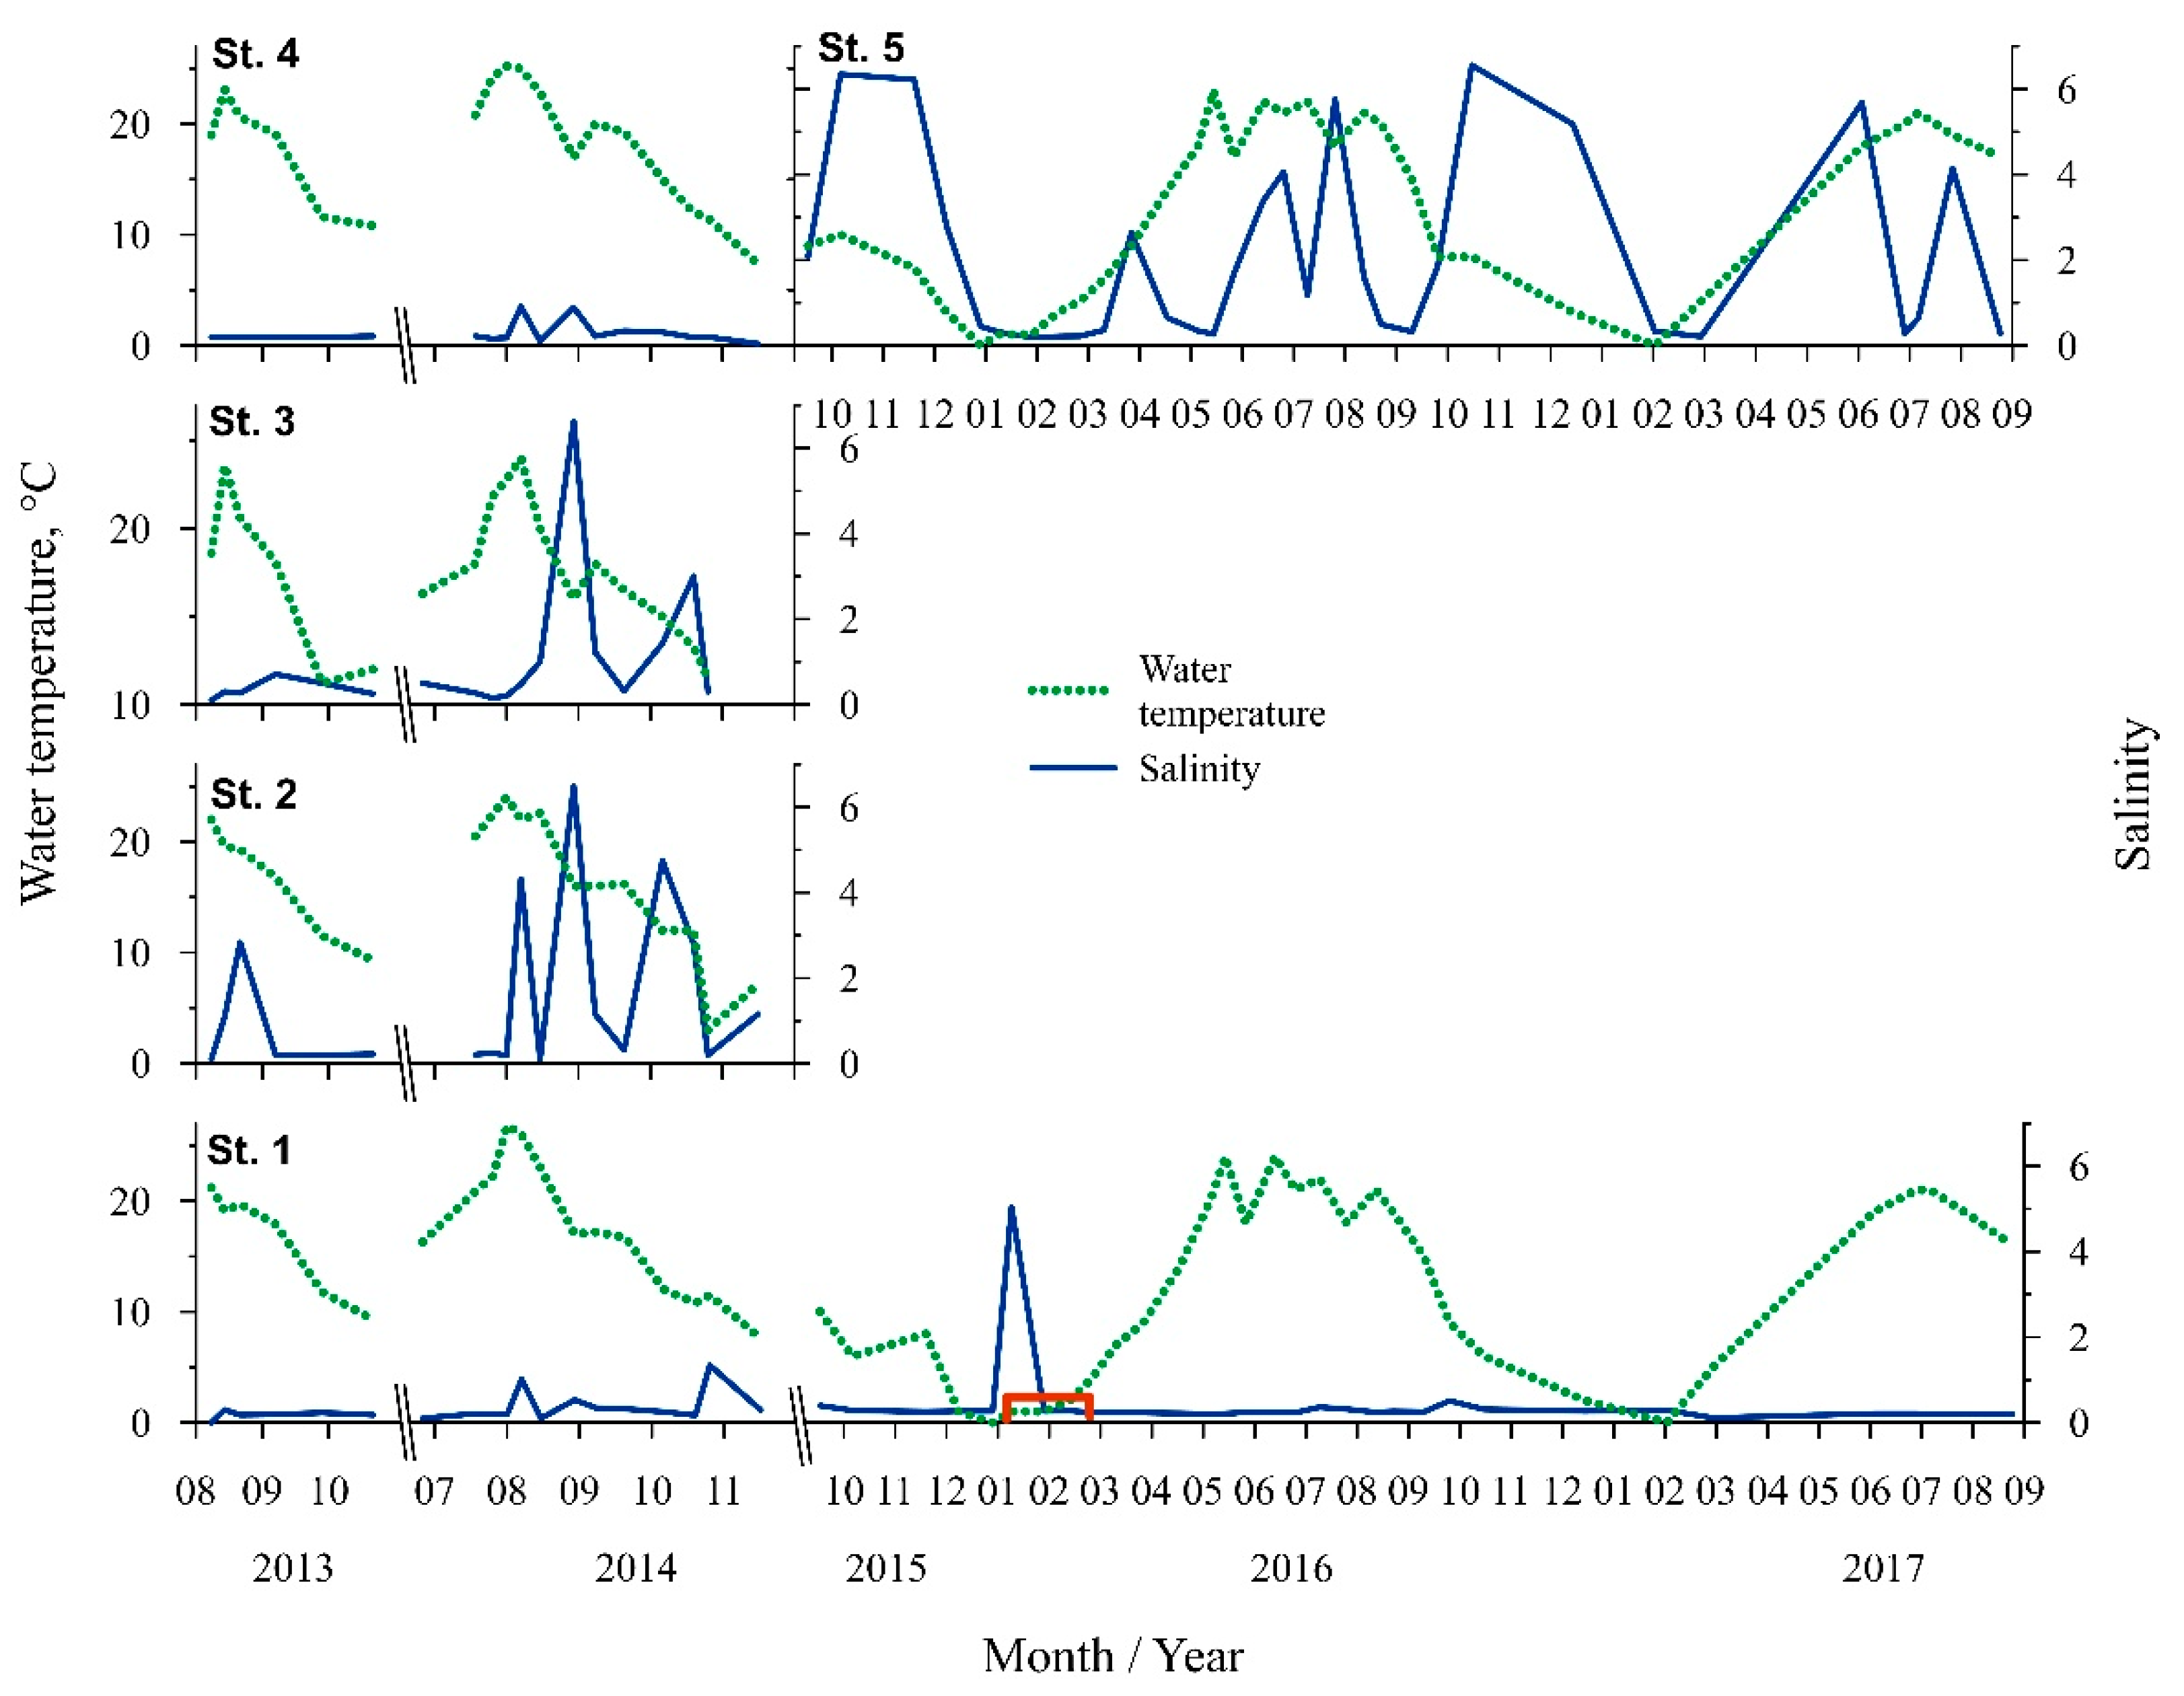
The highest water temperature was recorded in July 2014 (26.8 °C, St. One, Figure 2). The average annual water temperature during spring (March–May) was 9 ± 5.8 °C, summer (June–August)—21 ± 2.5 °C, autumn (September–October)—13 ± 4.4 °C, while during winter (December–February) the water temperature was 2 ± 2.5 °C. Ice cover was observed in January–February 2016 (St. One, Figure 2).
The Baltic Sea water intrusions into the Curonian Lagoon were defined by salinity changes and periodically observed at the stations near the Klaipeda strait. Salinity fluctuations at St. Two and St. Three were dynamic during the summer–autumn period (ranged from 0.1 to 6.6), while at St. Five the fluctuations occurred very often and periodically throughout all the periods of investigation (from 0.2 to 6.6 psu) (Figure 2).
3.2. Diversity of Cyanometabolites at the Study Sites
In total, 48 variants of cyanobacteria metabolites were detected in the Curonian Lagoon during the study period. The compounds belonged to six different peptide classes: microcystins (MC) (including nodularin (NOD), anabaenopeptins (AP), aeruginosines (AER), cyanopeptolins (CP), microginins (Mg), aeruginosamide (AEG), and one alkaloid class—anatoxin (ANTX) (Table S1). Microcystins, anabaenopeptins, and aeruginosins accounted for the highest variety of cyanopeptides, while the lowest variety was observed for the remaining ones. The lowest numbers of peptides were found in the samples collected from the stations influenced by the Nemunas River (St. Four; 21 compounds) and the Baltic Sea (St. Five; 23 compounds), while the highest numbers were detected at the stations situated along the western coast of the lagoon (St. One and St. Two; 35 and 31 compounds, respectively) (Table S1). The highest diversity of metabolites (40 compounds) was detected in 2014.
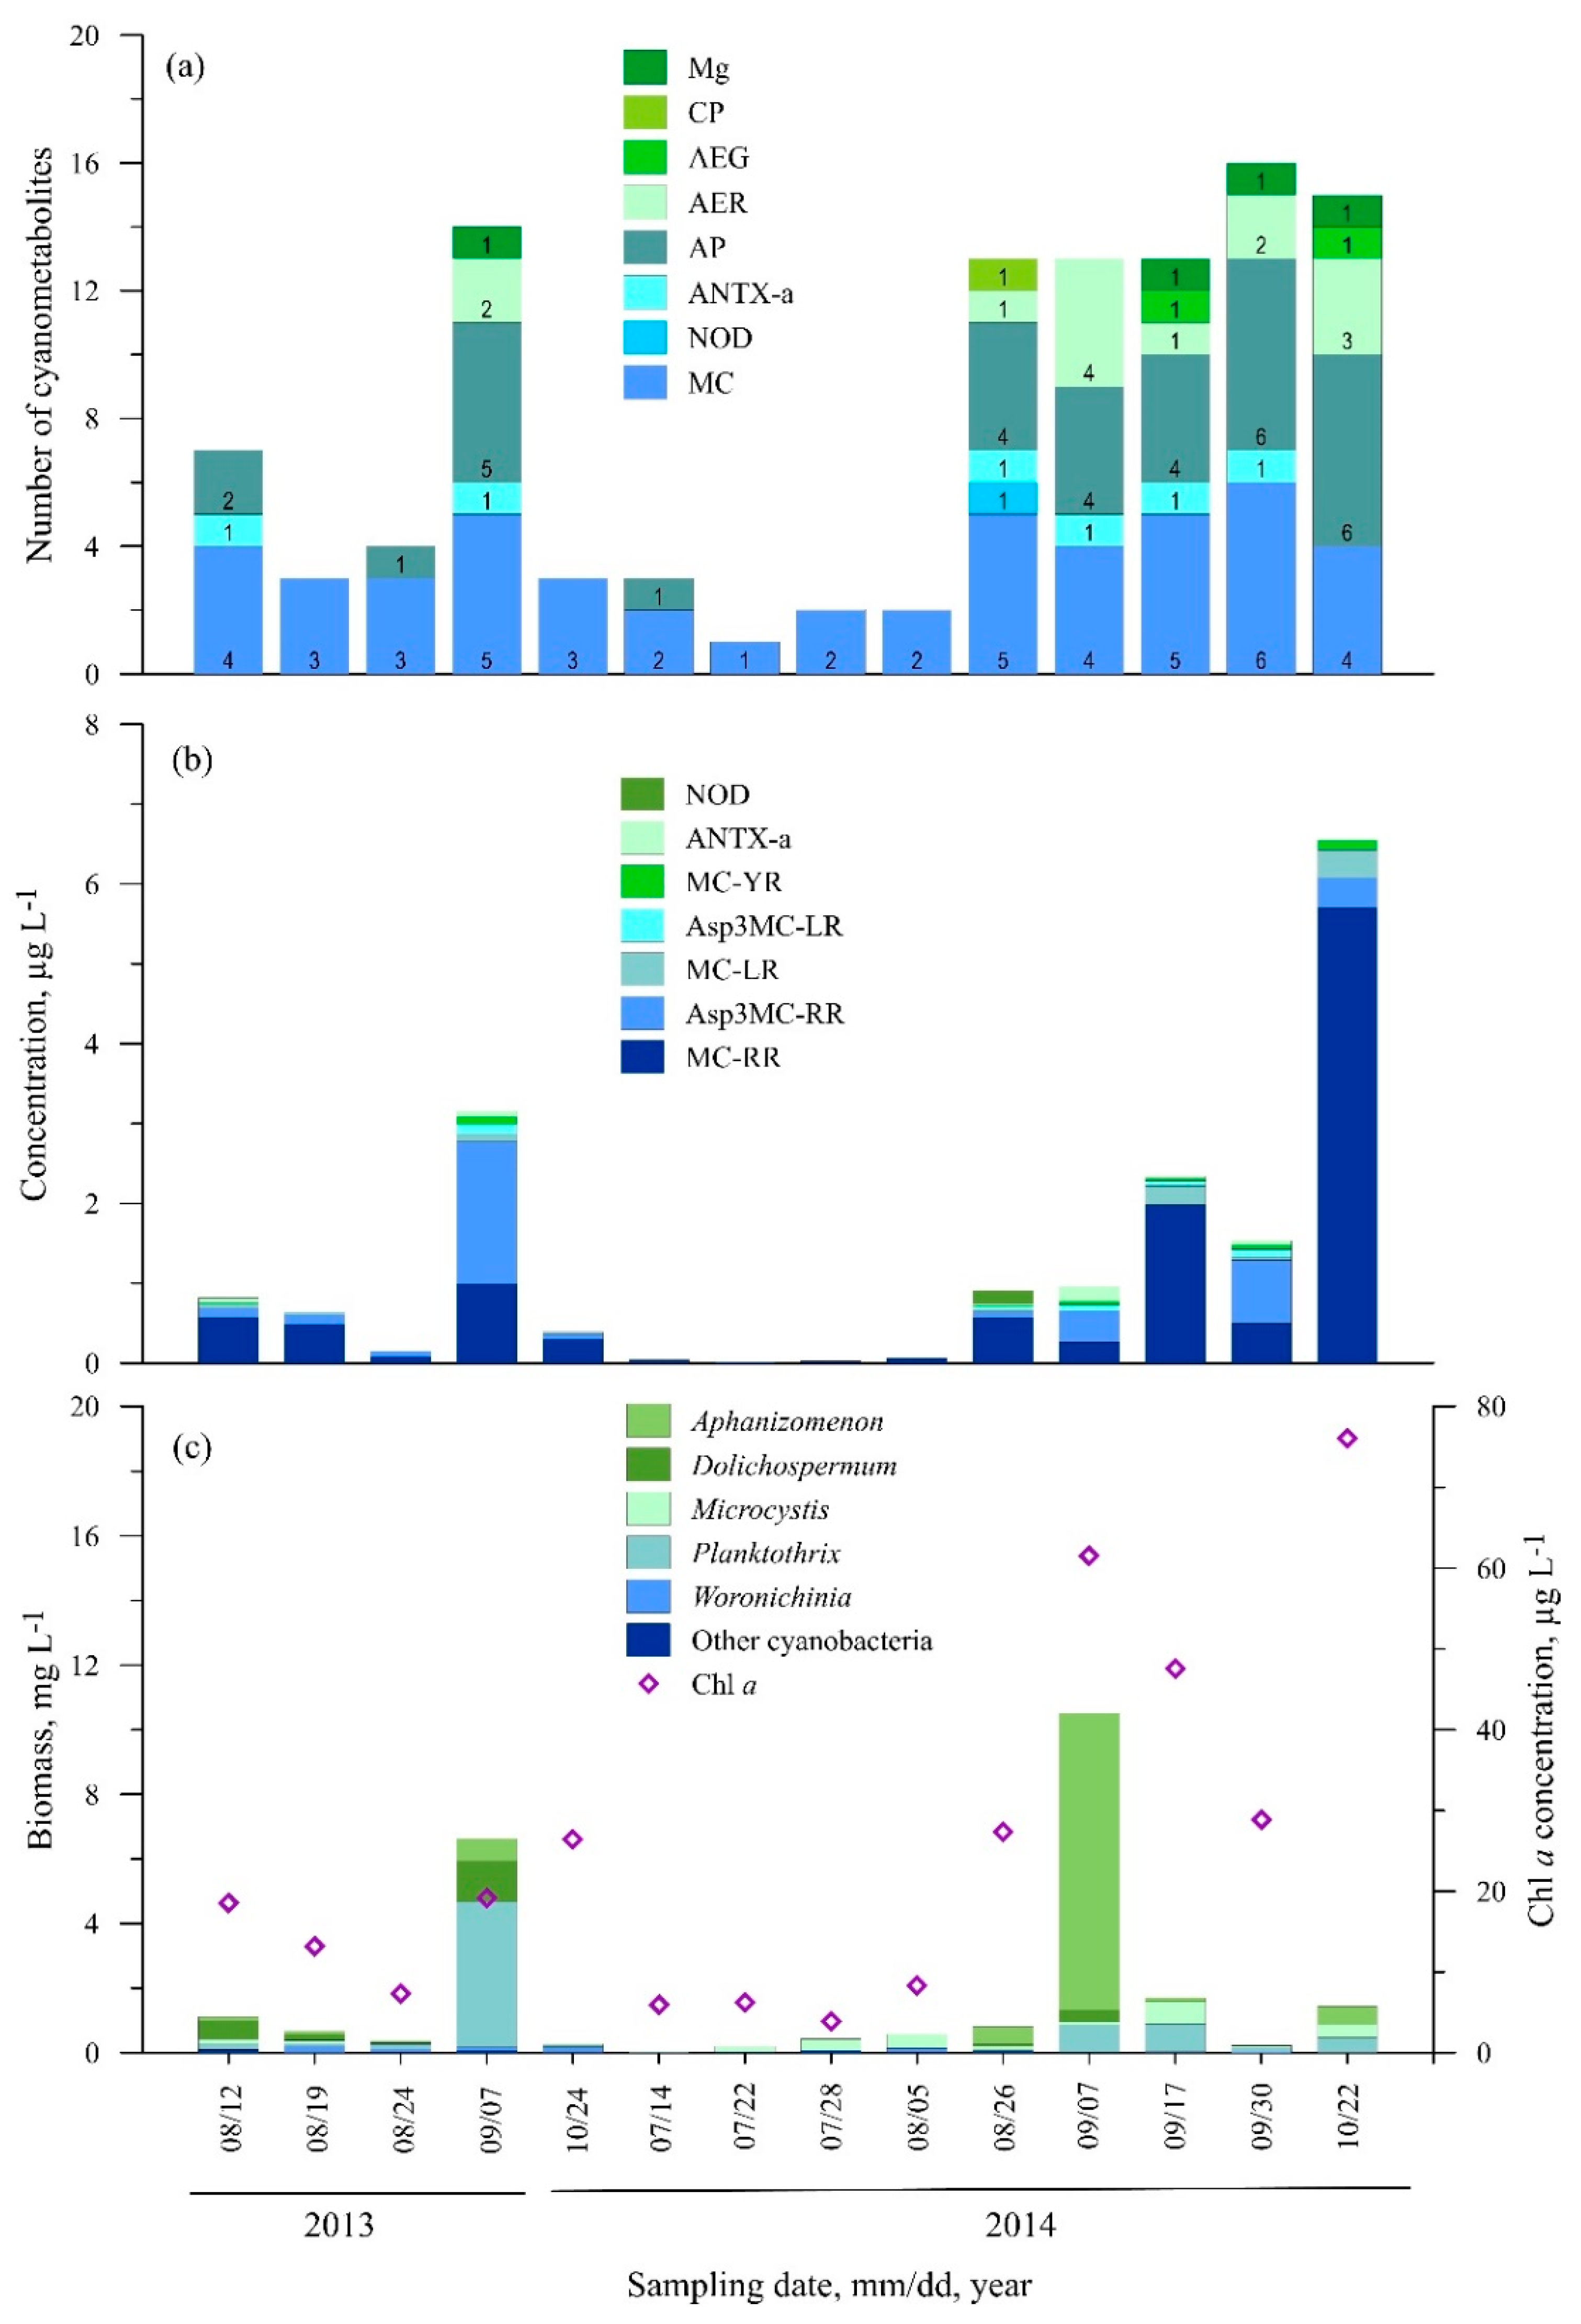
3.2.1. Station One (Nida)
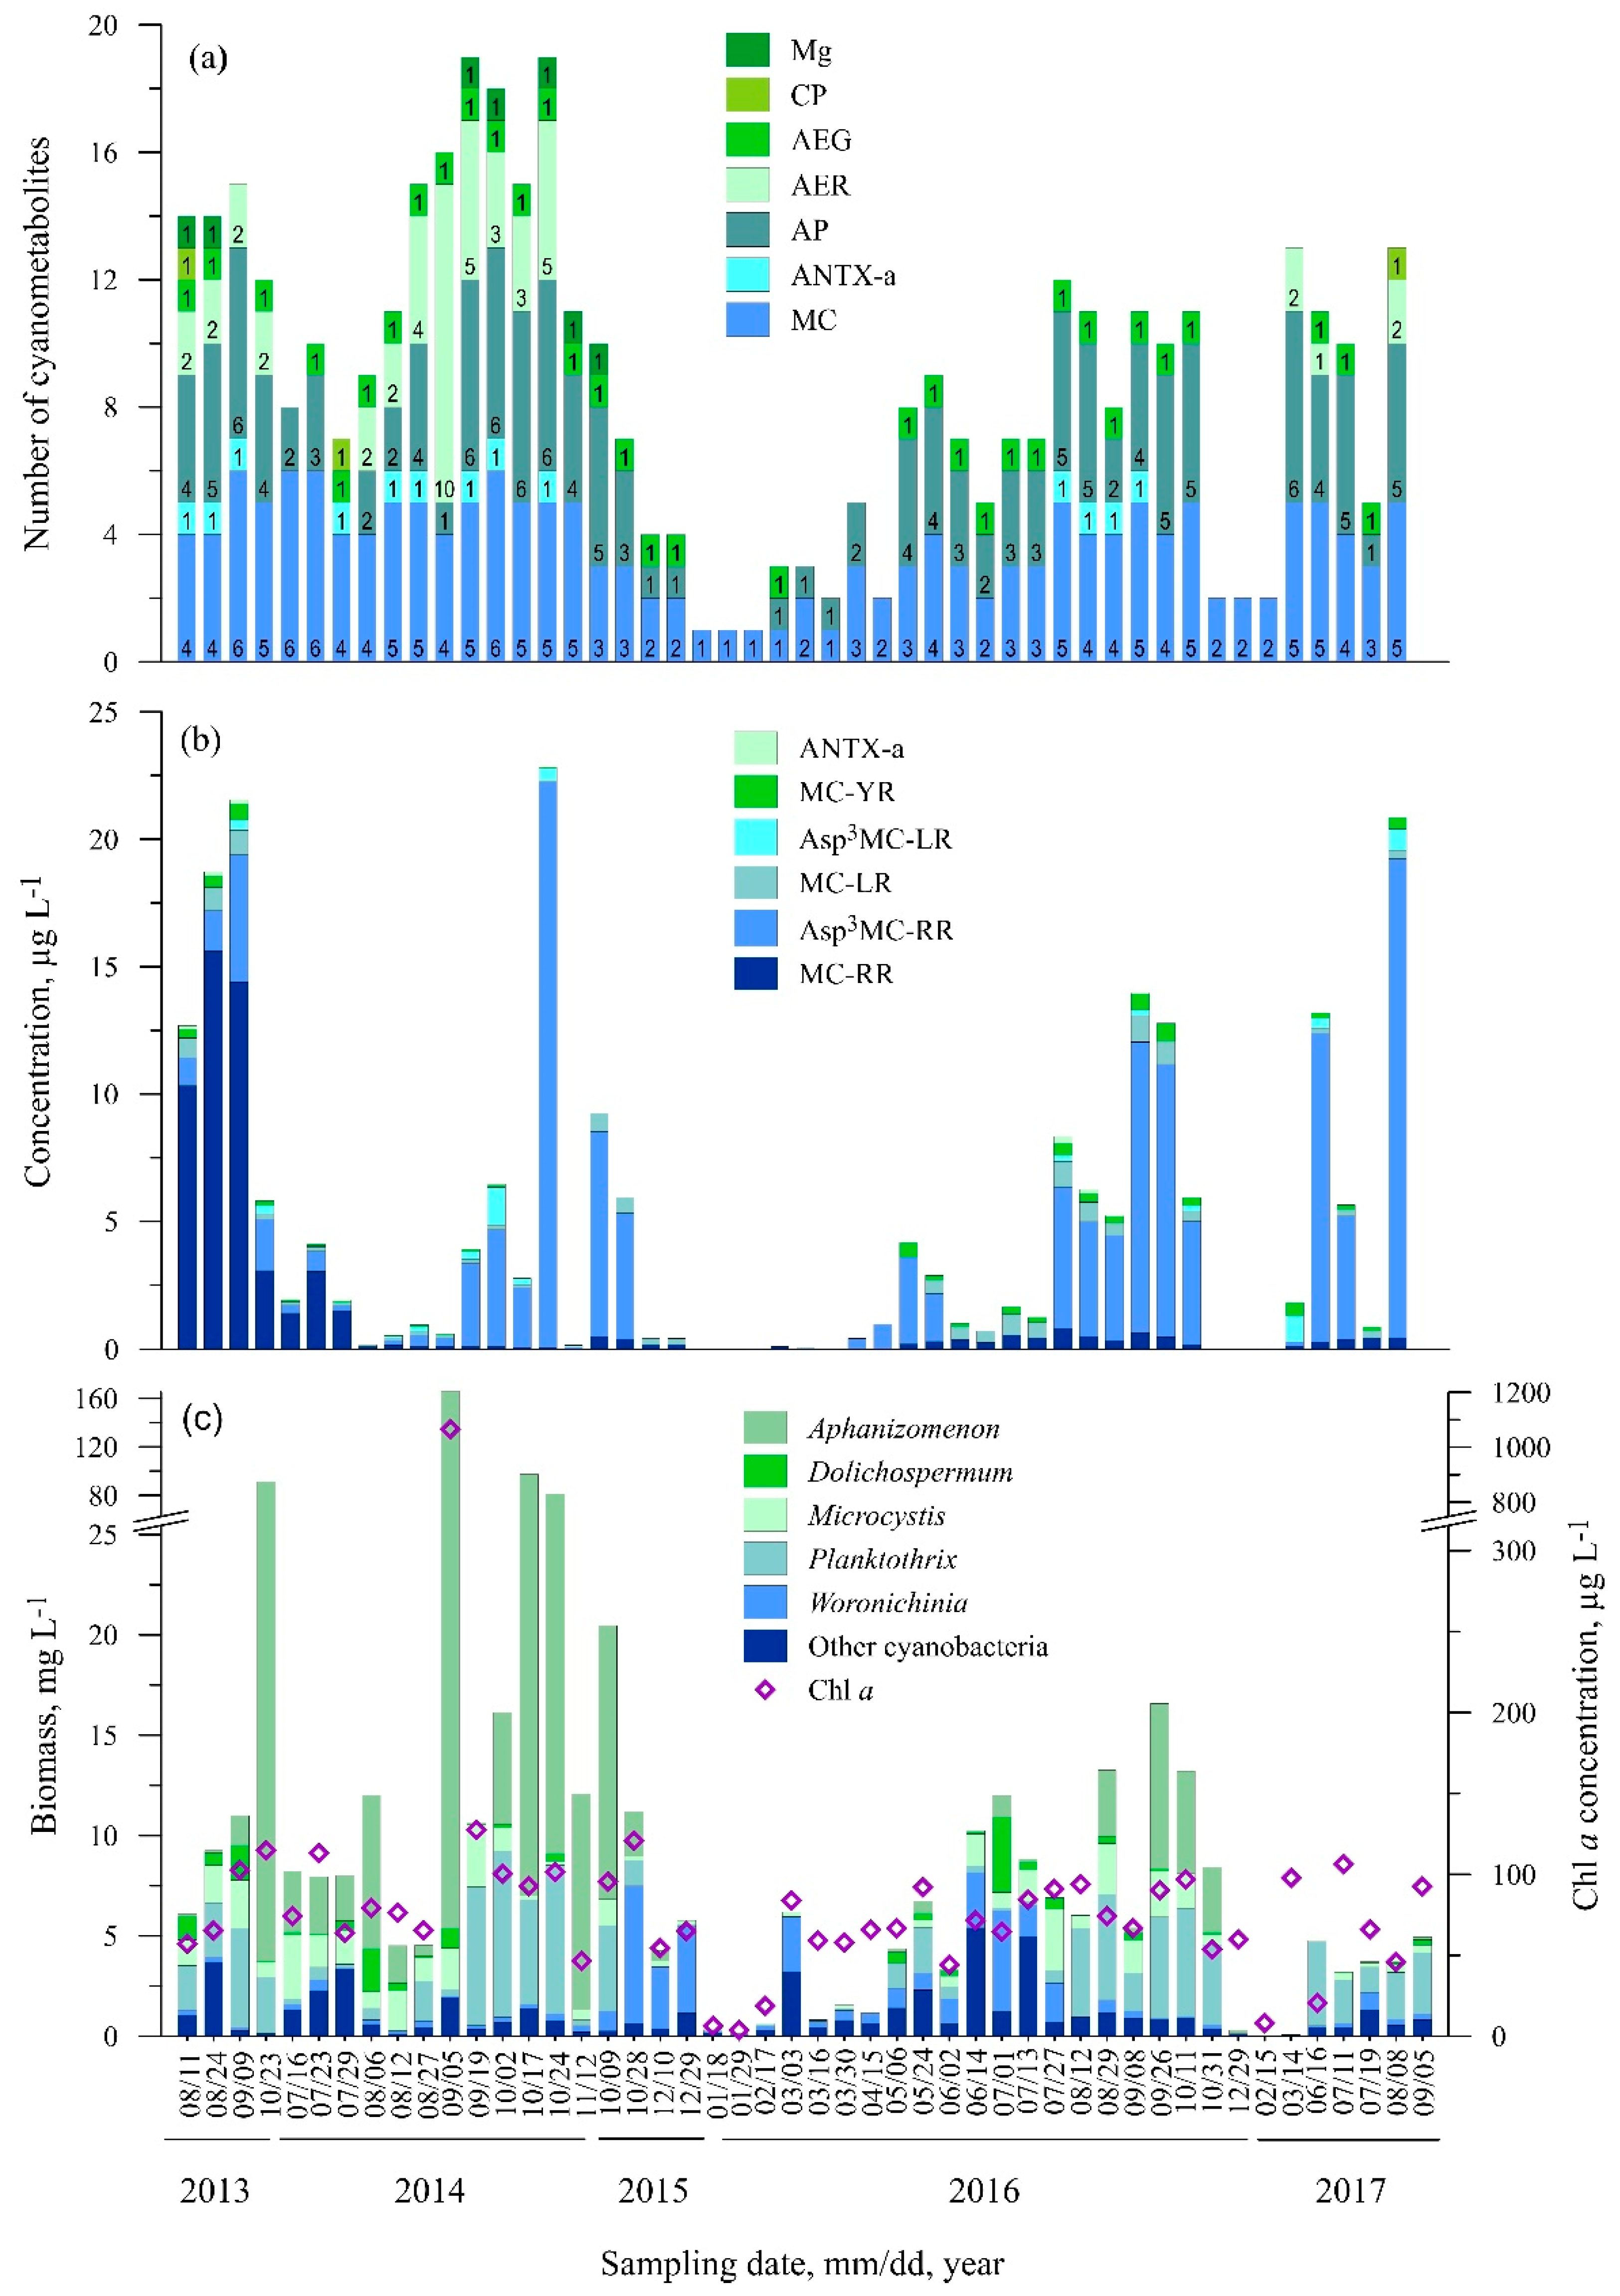
In total, 34 metabolites were found at St. One with a maximum of 19 different compounds per sample (Figure 3a, Table S1). The highest diversity of cyanometabolites, including the highest number of aeruginosins (up to 10 variants), was observed in 2014. The most common metabolites throughout the study were AEG-A and AP-A (70% of all samples), Osc-Y (58%), AP-B, AP-F, and AP662 in 43% all samples (Table S1).
Nine microcystins and anatoxin-a were found at Station One during the whole study period (Table S1). Evident of the dominance of microcystin MC-RR was observed in 2013 and July 2014, while [Asp3]MC-RR dominated the rest of time. MC-RR was found in all the samples, while [Asp3]MC-RR was found in 67% of the samples (Figure 3b). The highest concentrations of these variants were measured during August–October: MC-RR—15.61 µg L−1 in 2013, [Asp3]MC-RR—22.19 µg L−1 in 2014 and 18.77 µg L−1 in 2017. The lowest concentrations of MC-RR (up to 0.11 µg L−1) were detected during the January–March period. Microcystins MC-LR and [Asp3]MC-LR were found in 83% and 35% of the samples, respectively, but at low concentrations (<1.5 µg L−1). Microcystin MC-YR was found in all of the samples except during the cold period (October 2015–April 2016 and December 2016–March 2017), and the highest concentration was detected in 2016 (0.72 µg L−1). Microcystins MC-LY, MC-LF, [Asp3MeSer7]MC-RR, and [Dha7]MC-HtyR were found very rarely during the study period (<4% of the samples). Anatoxin ANTX-a was found in July–October in 2013, 2014, and 2016; its concentrations ranged from 0.01 µg L−1 to 0.25 µg L−1.
The highest cyanobacteria biomass (166 mg L−1) and Chl a (1065 µg L−1) was recorded in September 2014 (Figure 3c). Microcystis spp. and Planktothrix agardhii were found in all of the samples, including the winter period. P. agardhii constituted about a quarter of the total cyanobacteria biomass on average. The highest biomass of P. agardhii was recorded in October 2014 (8.3 mg L−1), while the Microcystis spp. biomass was only 3.2 mg L−1 (July 2014). These cyanobacteria accounted for 26% and 12%, respectively of the total cyanobacteria biomass on average. Aphanizomenon spp. was found in 80% of the samples and accounted for more than 90% of the total cyanobacteria biomass in September–October. Aphanizomenon was more abundant in 2013–2014 as compared to all the investigated periods. The highest biomass was recorded in September 2014 (160.4 mg L−1). Woronichinia was found in 97.9% of the total samples; the largest part of the total cyanobacteria biomass occurred in October–March. The highest biomass of Woronichinia was observed in October 2015 (6.9 mg L−1).
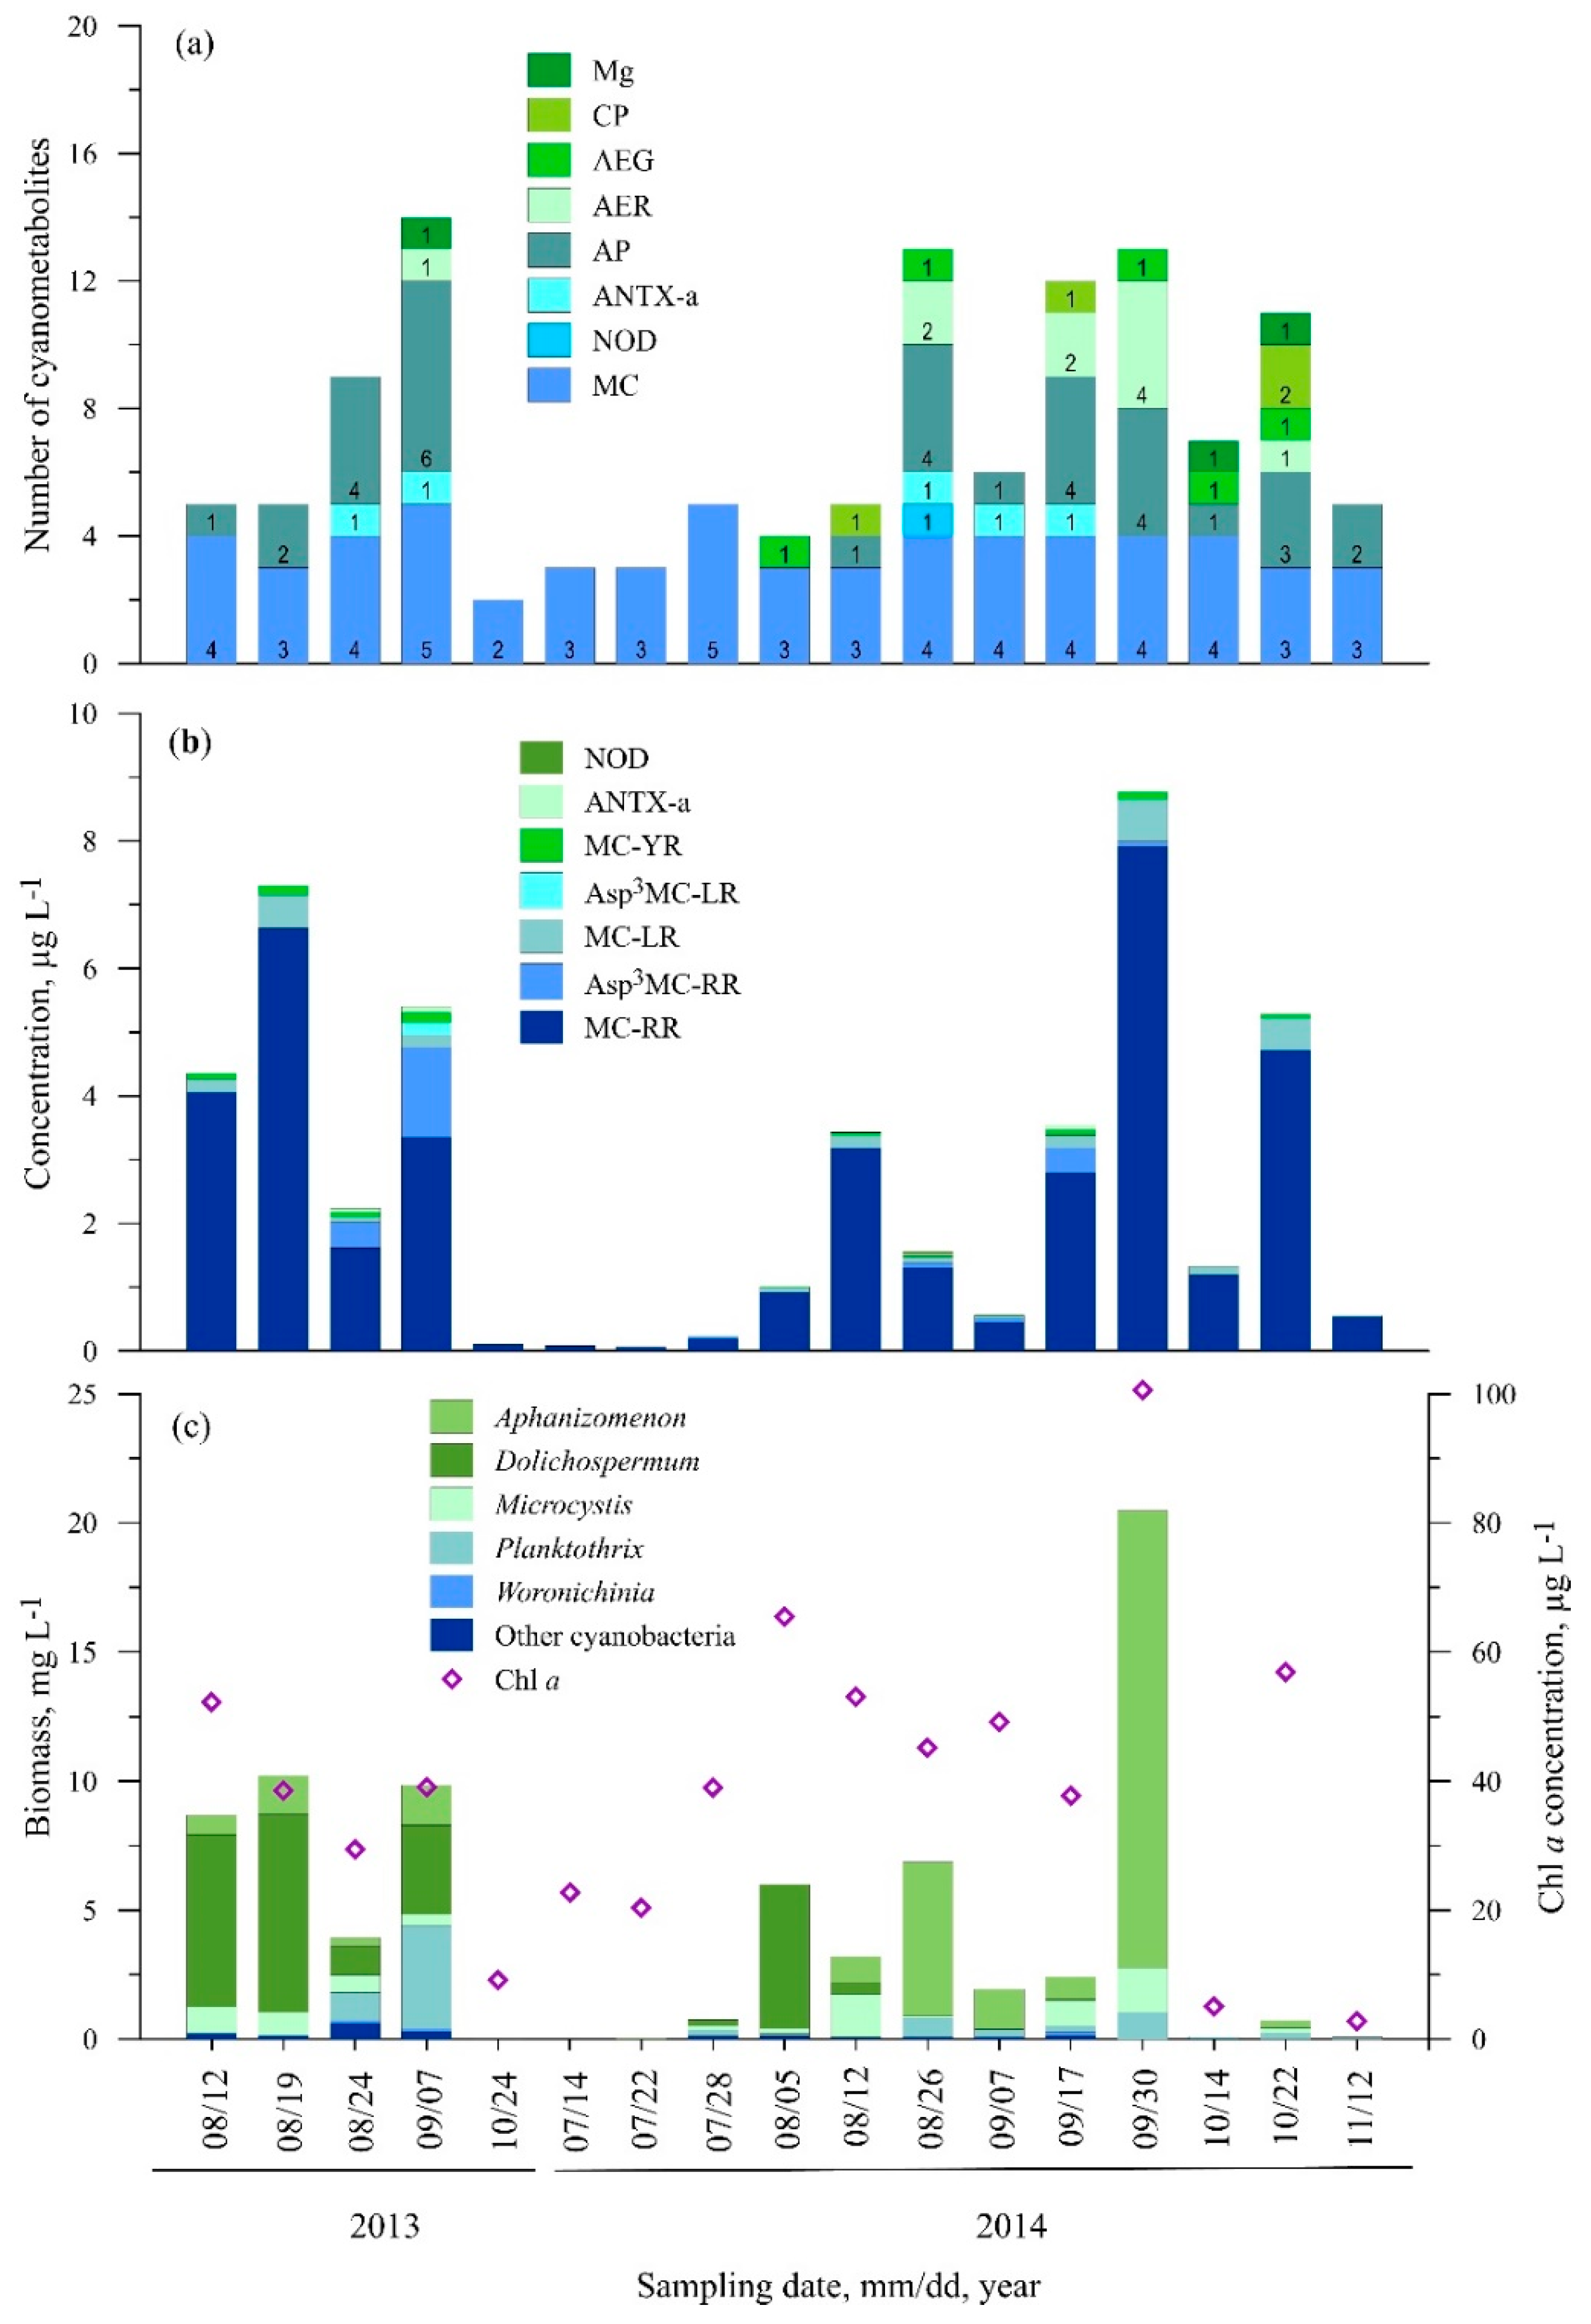
3.2.2. Station Two (Juodkrantė)
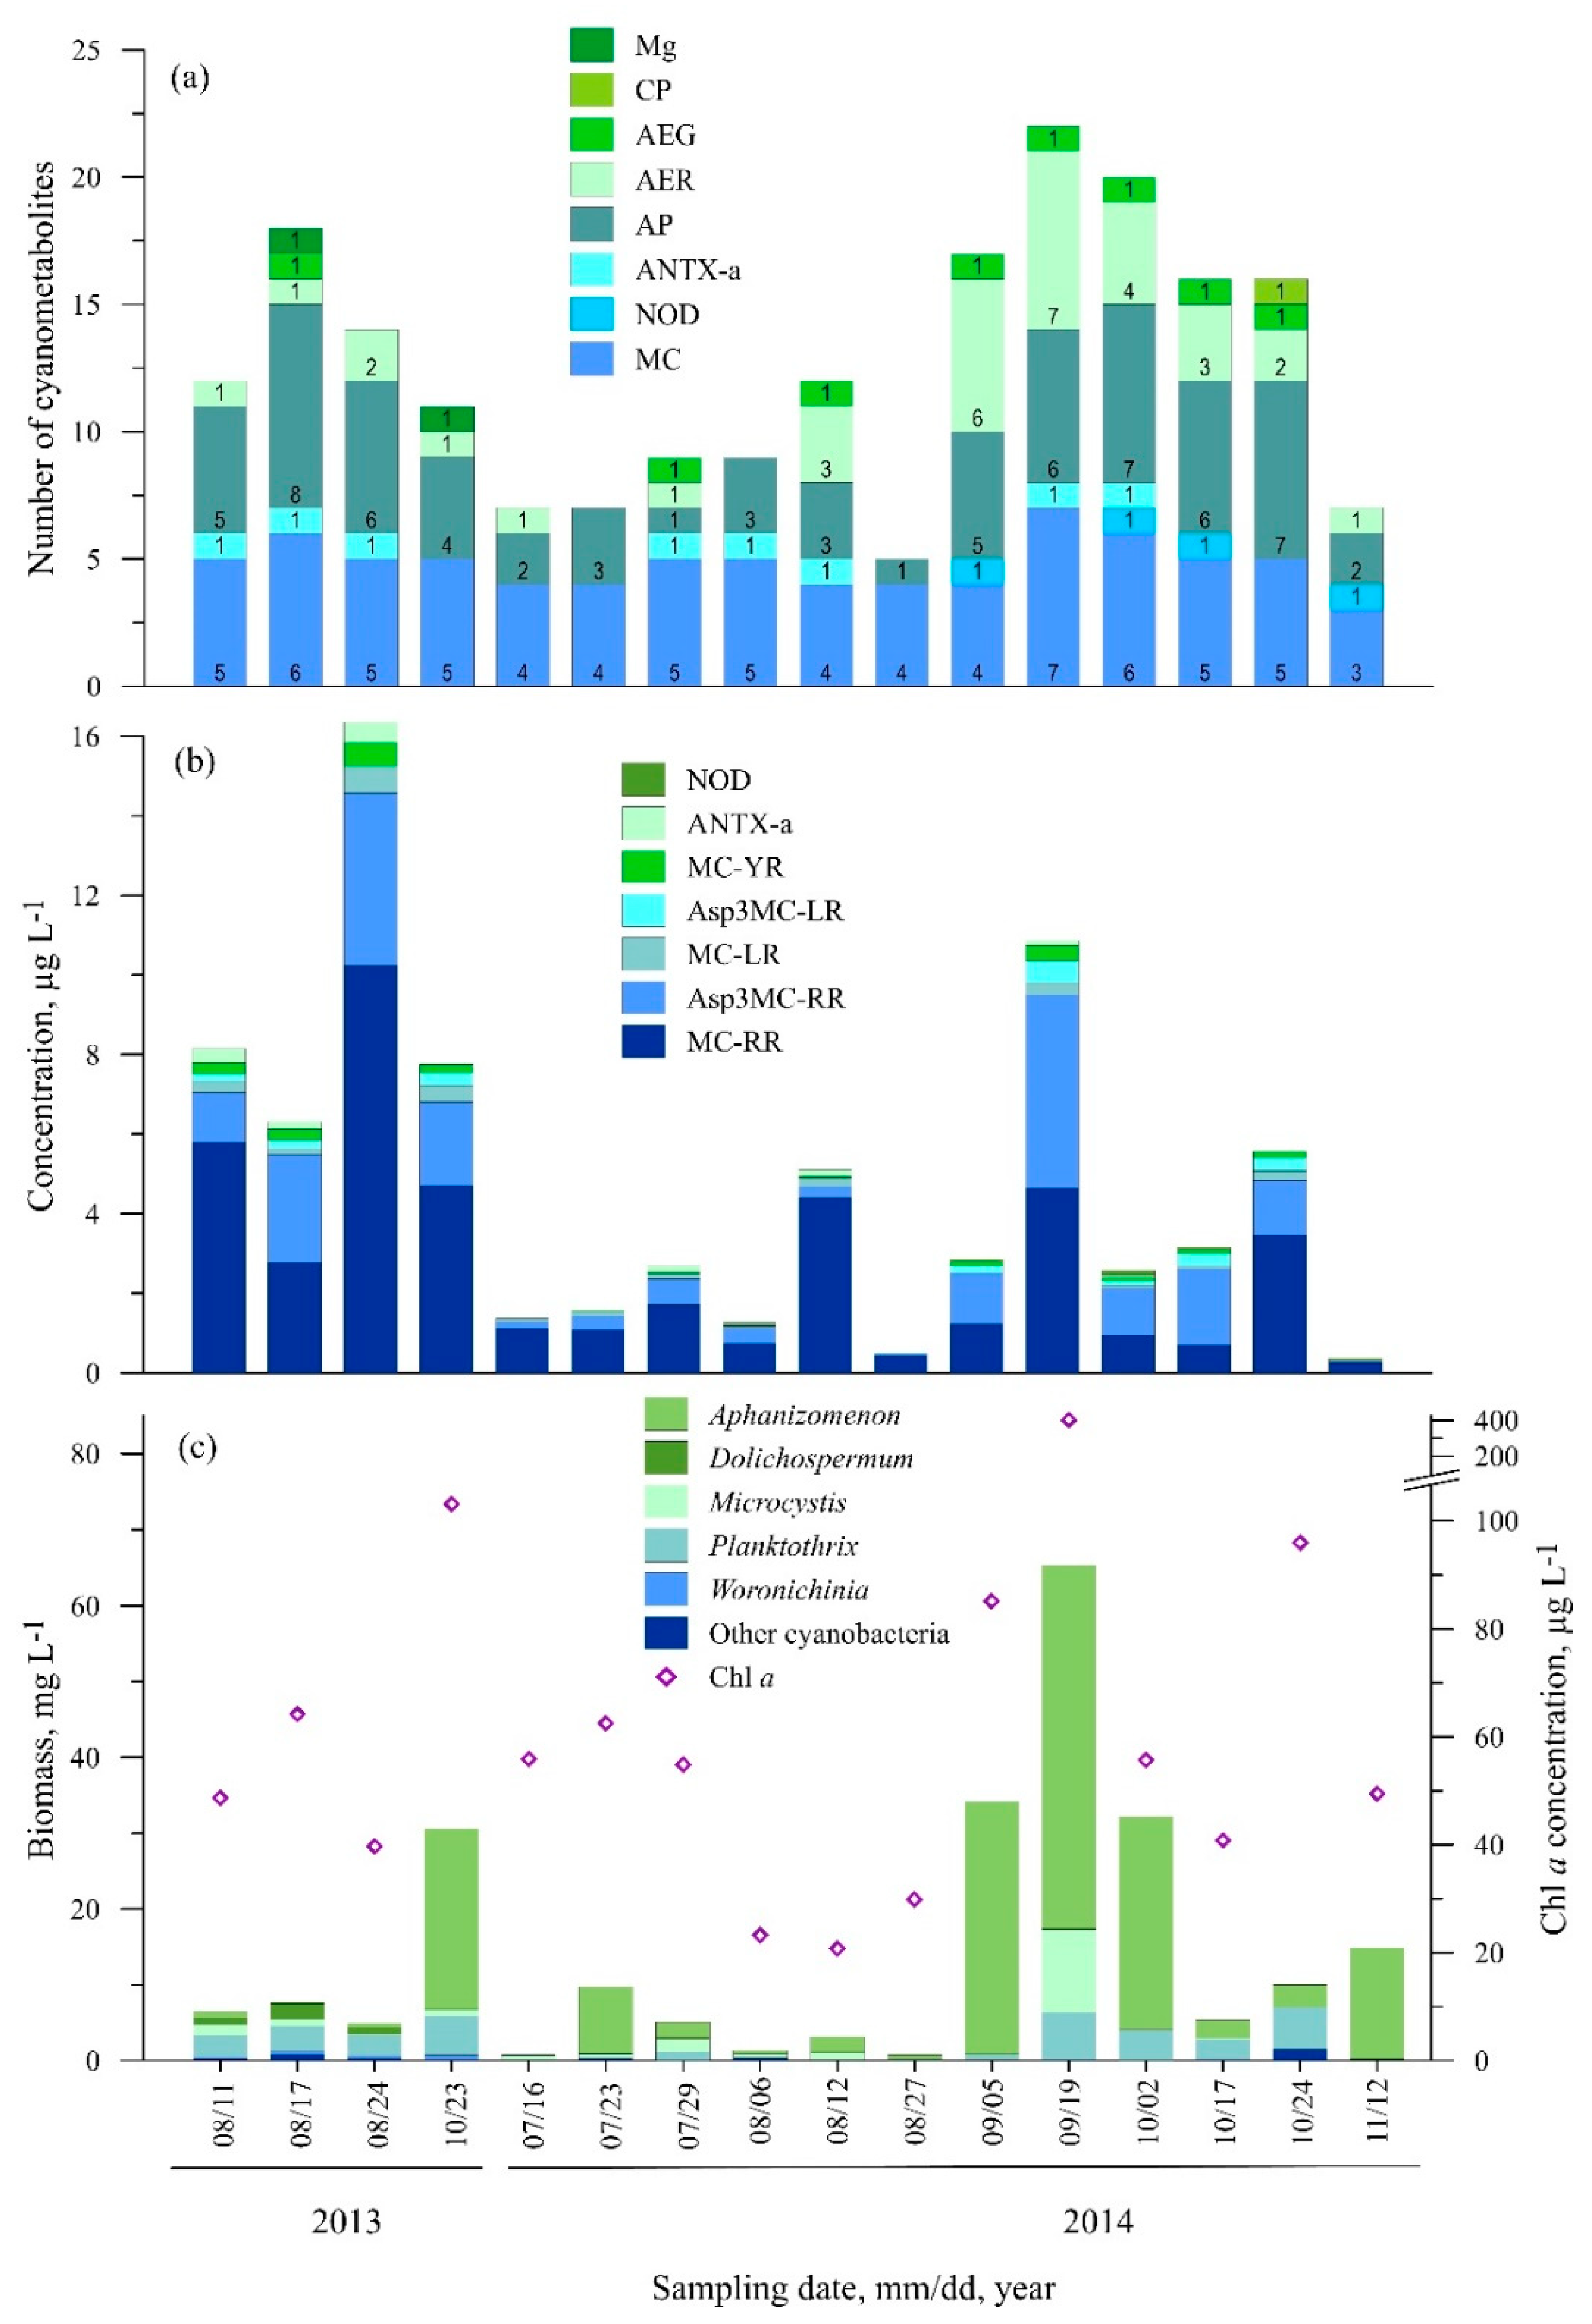
In total, 31 cyanometabolites were found at St. Two with a maximum of 22 different compounds per sample in 2014 (Figure 4a, Table S1). In terms of toxic cyanometabolites, ten different variants were detected: eight microcystins, anatoxin, and nodularin. Microcystins [Asp3]MC-RR and MC-RR were predominant and found in all of the samples (Figure 4b). The highest concentration of MC-RR was measured in August 2013 (10.20 µg L−1) while the highest concentration of [Asp3]MC-RR was measured in August (4.35 µg L−1) and September 2014 (4.85 µg L−1). MC-YR also was found in all of the samples; however, its concentrations did not exceed 1 µg L−1. In comparison to other microcystins, MC-LR and [Asp3]MC-LR were less abundant (88% and 63% of the samples, respectively) and their concentrations did not exceed 0.70 µg L−1. Microcystins [Asp3]MC-RY, [Asp3MeSer7]MC-RR, and [Dha7]MC-HtyR were found very rarely over the study period (<13% of the samples) (Table S1). Nodularin was detected in September–November 2014; the concentrations varied from 0.06 to 0.12 µg L−1. ANTX-a was detected in half of the samples, with the highest concentration (0.51 µg L−1) measured in August 2013.
In terms of other cyanopeptides, 10 anabaenopeptin variants were detected (Table S1). The most common were Osc-Y (found in all of the same samples, except November 2014) and AP-A (found in 81.3% of the samples). Other metabolites were much less common: AP-F, AP-B, and AER 126A were found in 56.3% of the samples, AEG-A and AP676 were found in 50% of the samples (Table S1). Mg 591B was found twice in August and October 2013, while CP978 was found once in October 2014.
The highest phytoplankton biomass and Chl a concentrations were measured in September 2014 (65.3 mg L−1 and 402.5 µg L−1, respectively), when Aphanizomenon dominated (47.7 mg L−1) (Figure 4c). Compared to other cyanobacteria, Aphanizomenon constituted the highest contribution to the total cyanobacteria biomass (up to 97% of the total cyanobacteria biomass). Microcystis spp. and P. agardhii were found in all of the samples. Microcystis constituted from 0.2% to 87.4% of the total cyanobacteria biomass, and the highest biomass was measured in September 2014 (10.9 mg L−1). P. agardhii constituted up to 63.8% of the total biomass and reached the maximum of 6.3 mg L−1 in September 2014 as well. Woronichinia was found mainly in 2013, and its highest biomass was observed in October 2013 (0.55 mg L−1).
3.2.3. Station Three (Dreverna)
In total, 27 cyanometabolites were found at St. Three with a maximum diversity of 16 different compounds per sample (Figure 5a, Table S1). Microcystin MC-RR was detected in all of the samples and the highest concentration was measured in October 2014 (5.7 µg L−1) while [Asp3]MC-RR reached its maximum in September 2013 (1.78 µg L−1) (Figure 5b). Microcystins MC-LR and MC-YR were found in 85.7% and 50% of the samples, respectively; their concentrations did not exceed 0.5 µg L−1 (Table S1). Microcystins [Asp3]MC-LR, [Asp3]MC-RY and nodularin were rarely found over the investigated period, and the concentrations of each of these variants did not exceed 0.17 µg L−1. ANTX-a was detected in 43% of the samples; the highest concentration was measured in September 2014 (0.18 µg L−1) (Figure 5b).
In terms of other cyanopeptides, nine anabaenopeptins and six aeruginosins were found. The most common anabaenopeptins were AP-A, Osc-Y, and AP-F found in 42.3%, 42.3% and 35.7% of the samples, respectively. The Mg 591B was found in September 2013 and from September to October 2014, while CP978 was found only in August 2014.
Station Three is characterised by the lowest phytoplankton biomass and Chl a concentration (Figure 5c). The highest Chl a concentration was recorded in October 2014 (76 µg L−1), while the highest cyanobacteria biomass (10.5 mg L−1), dominated by Aphanizomenon (9.2 mg L−1), was recorded in early September 2014. During the study period, the total biomass of P. agardhii did not exceed 1.8 mg L−1, except September 2013 (4.5 mg L−1).
3.2.4. Station Four (Ventė)
Out of all of the investigated stations, the lowest variety of cyanometabolites was found in samples from Station Four, where only 21 compounds in total and a maximum of 14 different metabolites per sample were detected (Figure 6a). The MC-RR variant constituted the largest contribution to the overall bioactive cyanometabolite concentration (Figure 6b). The highest concentration of this microcystin was measured in October 2014 (7.90 µg L−1). The MC-LR and MC-YR variants were also common. The highest concentrations were measured in October 2014 (0.65 µg L−1) and in September 2013 (0.17 µg L−1), respectively. The predominance of [Asp3]MC-RR was observed only in September 2013 and its concentration reached 1.40 µg L−1. Microcystin [Dha7]MC-HtyR, ANTX-a and nodularin were found rarely over the investigated period; the concentrations of ANTX-a and nodularin did not exceed 0.08 µg L−1 (Figure 6b).
Among other cyanopeptides, anabaenopeptins were the most dominant compounds—in total, seven anabaenopeptin variants were detected (Figure 6a). The most found anabaenopeptins were AP662, AP676 and Osc-Y (47.1%, 35.3% and 35.3% of the samples, respectively). The aeruginosin and cyanopeptolin variants were found only in 2014.
Aphanizomenon and Microcystis were found in 88.2% of the samples (Figure 6c). The highest biomass of Aphanizomenon was measured in October 2014 (17.7 mg L−1) and this coincided with the highest Chl a concentration (101 µg L−1). The biomass of Microcystis was much lower compared to Aphanizomenon and did not exceed 2.0 mg L−1. Dolichospermum was found in 58.8% of the samples. The highest biomass of this genus was measured in August–September 2013 and early August 2014 (about 7.7 mg L−1). P. agardhii was found in 76.5% of the samples, and the highest biomass was measured in September 2013 (4.0 mg L−1).
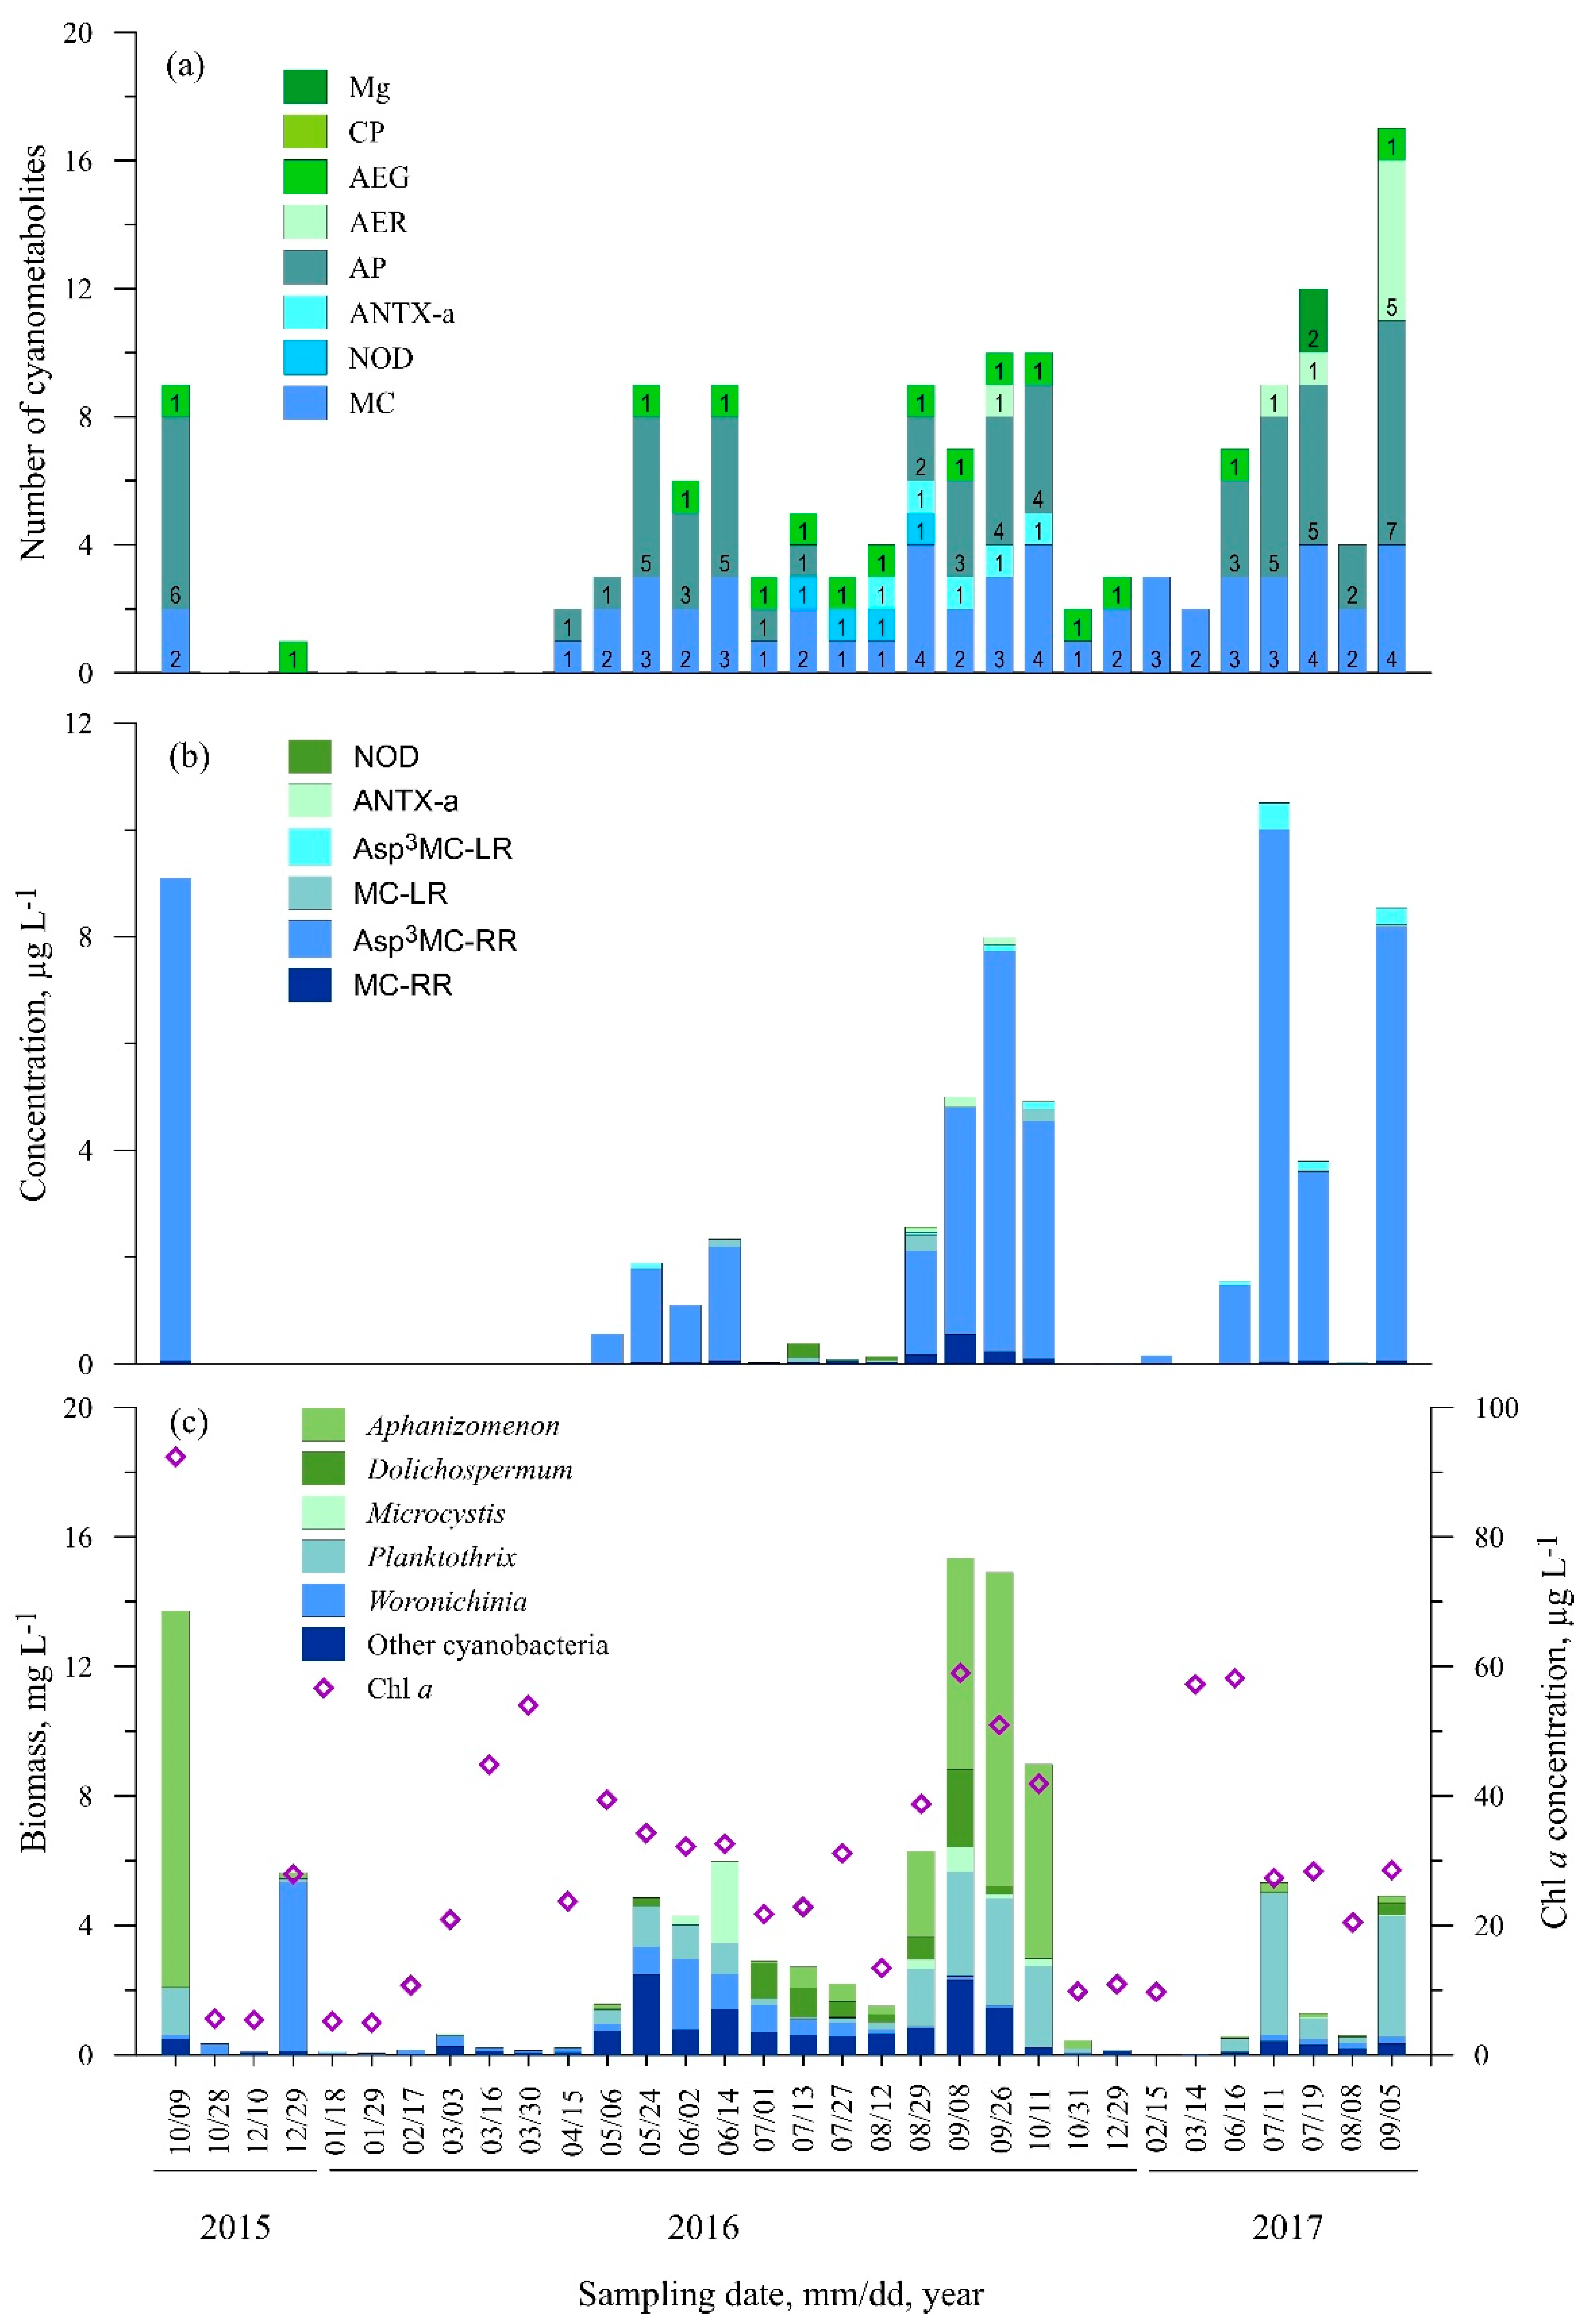
3.2.5. Station Five (Smiltynė)
A relatively low diversity of cyanometabolites (23) was also characteristic for Station Five; in total six different microcystin variants were detected (Table S1). The microcystin [Asp3]MC-RR variant dominated and was found in 46.8% of the samples (Figure 7b). The highest concentrations of [Asp3]MC-RR were recorded in the autumn months: October 2015 (9.04 µg L−1), September 2016 (7.48 µg L−1), and September 2017 (8.13 µg L−1). The MC-RR variant was more common. It was found in 72% of the samples; however, the concentrations did not exceed 0.56 µg L−1. MC-LR and [Asp3]MC-LR were rarely found (31% and 25% of the samples, respectively); the highest concentrations of these variants were measured accordingly in August 2016 (0.29 µg L−1) and July 2017 (0.49 µg L−1). Nodularin was found only during the short period from July to August 2016, and its concentration ranged from 0.02 to 0.28 µg L−1. ANTX-a was found only in 2016 from August to mid-October with concentrations ranging from 0.02 to 0.19 µg L−1.
In terms of other cyanopeptides, AEG-A, AP-A and Osc-Y were the most common compounds (53.1%, 43.8%, and 40.6% of all samples, respectively). No metabolites were found from late October 2015 to May 2016 except from AEG-A which was detected in December (Figure 7a, Table S1).
Planktothrix and Woronichinia were the most common cyanobacteria species at Station Five (100% and 96.9% of the samples, respectively) (Figure 7c). The highest biomasses of Woronichinia and Planktothrix were recorded accordingly in late December 2015 (5.2 mg L−1) and June 2017 (4.4 mg L−1). Aphanizomenon was found in 75% of samples and was the dominant species during the August–October months. The highest biomass was measured in October 2015 (11.6 mg L−1) and in September 2017 (9.7 mg L−1). The highest Chl a concentration (92.3 µg L−1) was recorded in October 2015.
3.3. Statistical Analysis
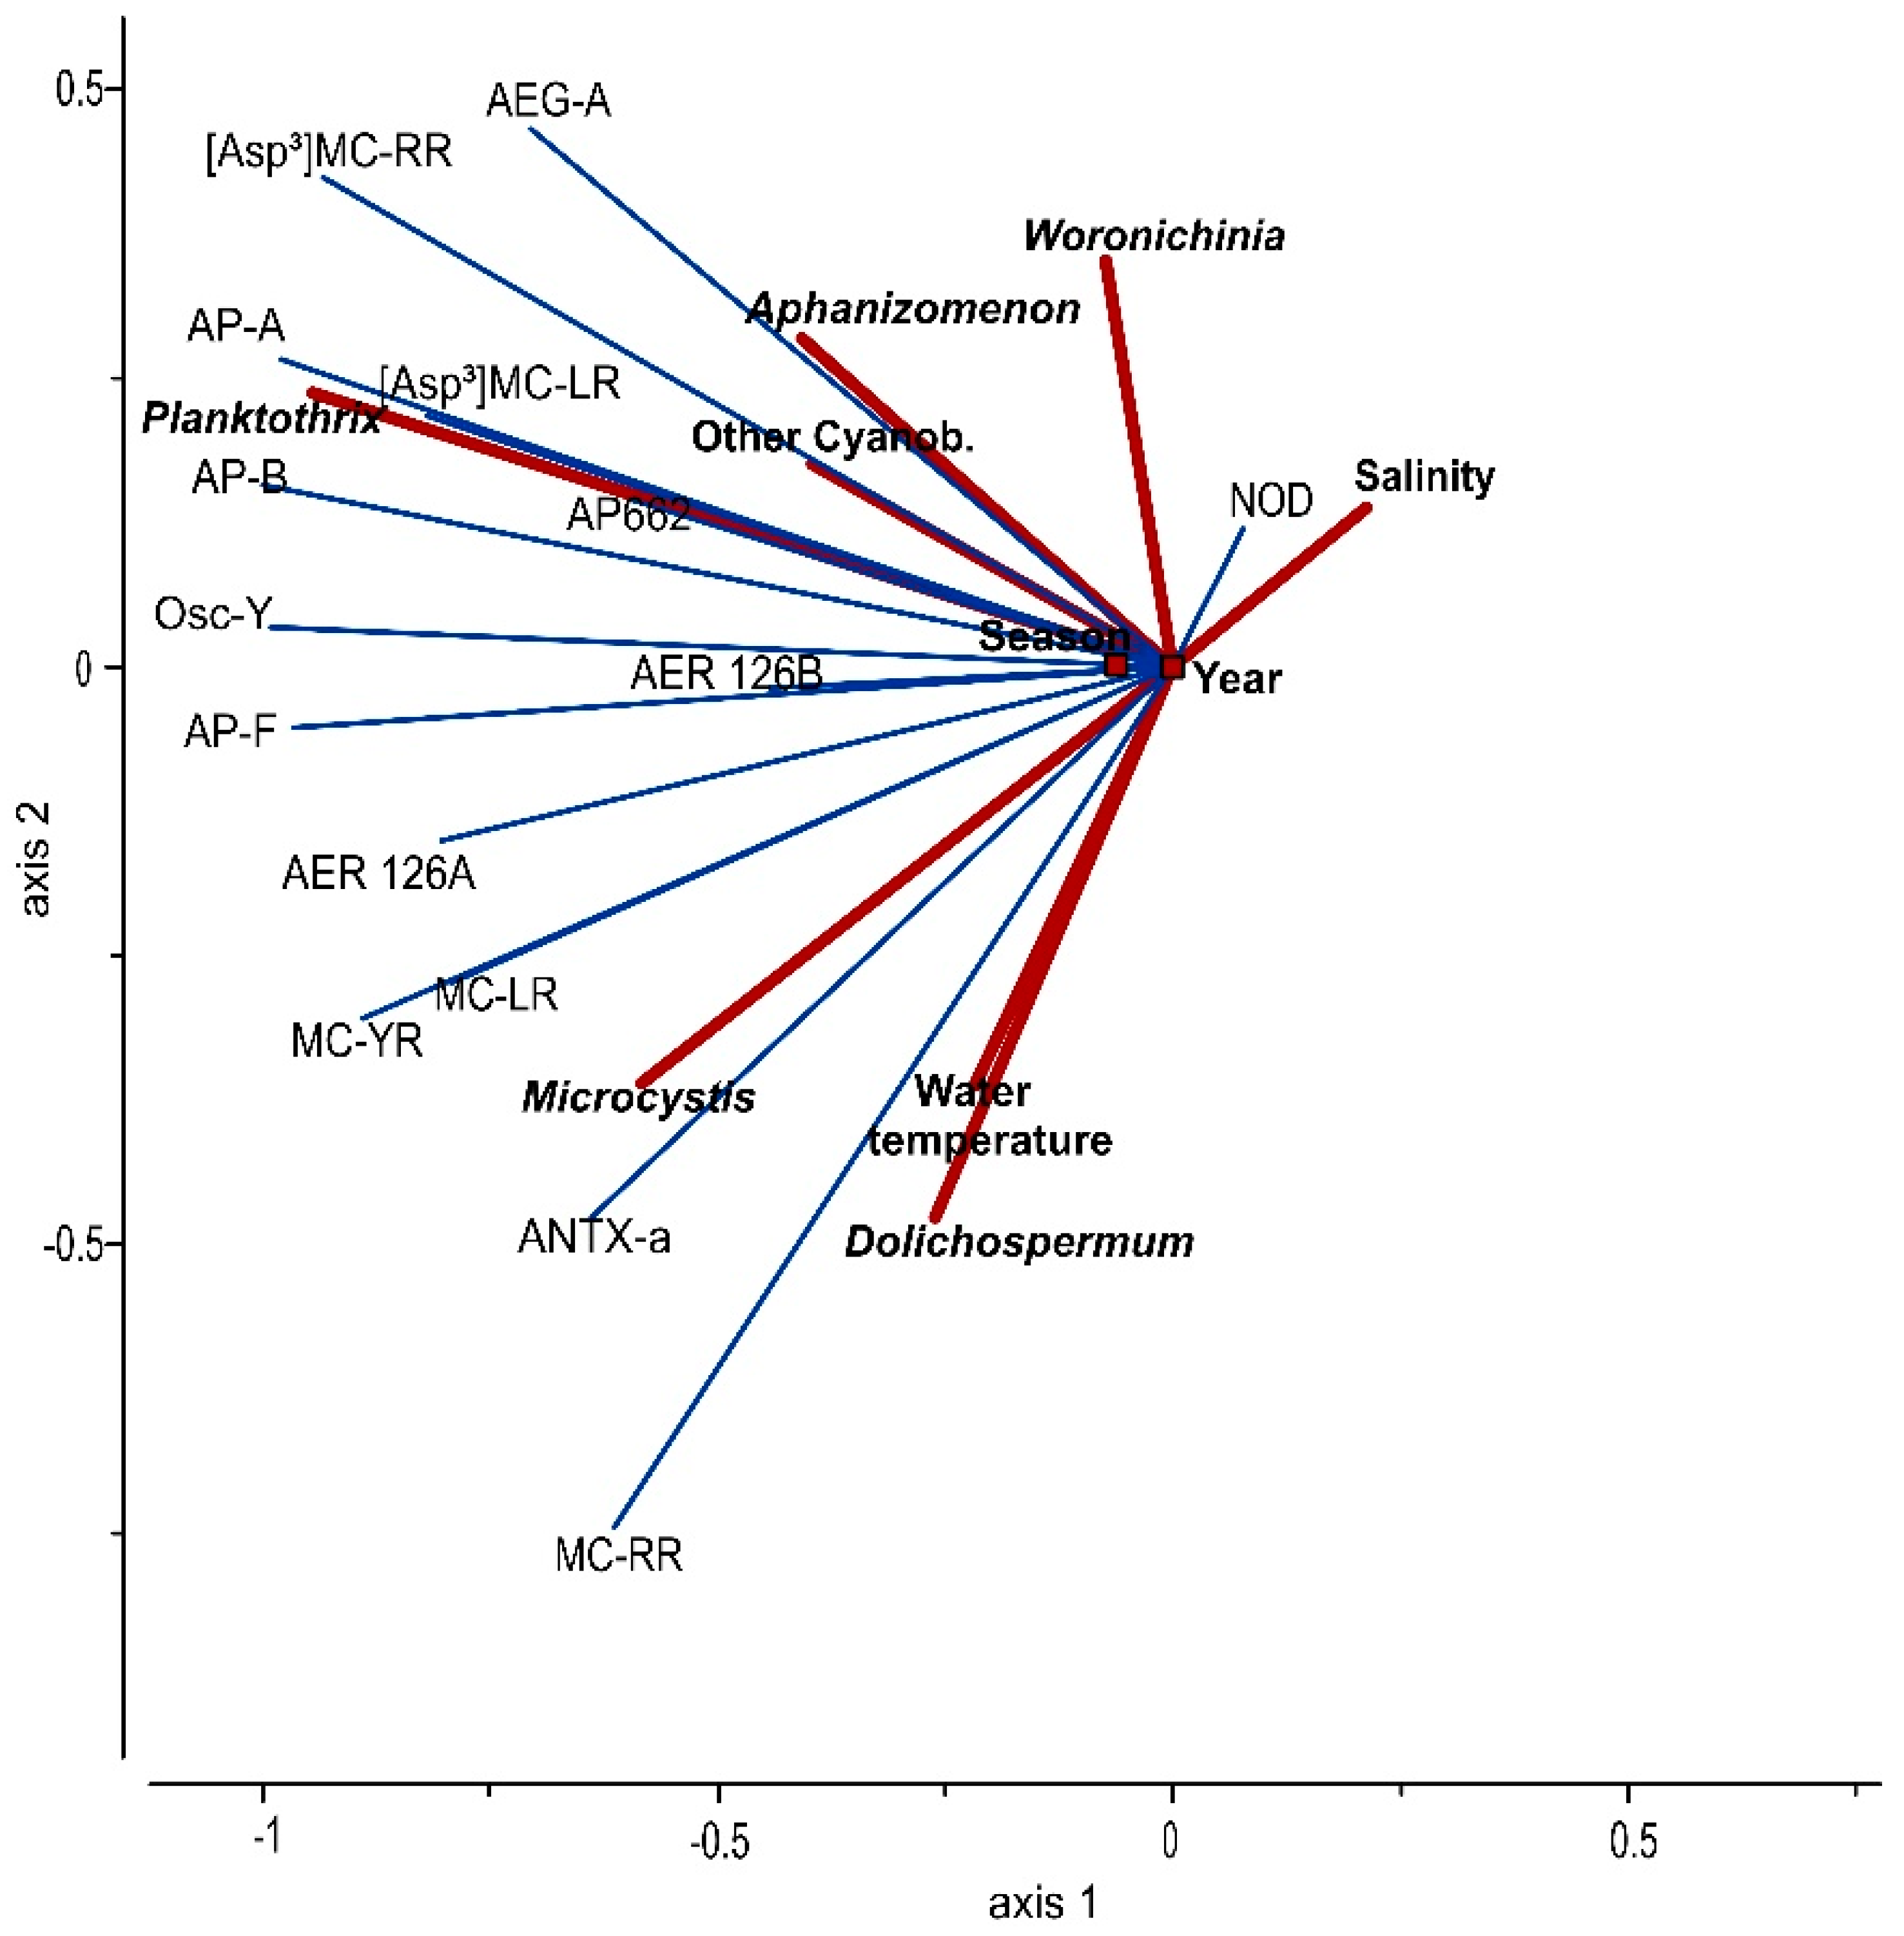
According to the RDA analysis, the environmental factors in combination with the dominant cyanobacteria biomass accounted for 52% of the variance in the concentration of cyanometabolites from the samples taken from the Curonian Lagoon, while two axes explained 83% of the variation (Figure 8). Demethylated variants of MC ([Asp3]MC-RR and [Asp3]MC-LR) had a close statistical relationship with P. agardhii distribution. The occurrences of AP-A, AP-B, AP662, and Osc-Y were also closely associated with the presence of P. agardhii. This species explains 57.33% (F = 52, p = 0.001) of the variation in the concentrations of the metabolites in the lagoon.
Bioactive cyanopeptides (MC-RR, MC-LR, MC-YR) and anatoxin ANTX-a were closely associated with the occurrence of Microcystis spp., Dolichospermum spp., and water temperature. All statistical relationships were statistically significant (p < 0.05), however, Microcystis spp. explains 27.73% (F = 14), Dolichospermum spp.—10.02% (F = 3) and water temperature—8.67% (F = 7) of the variation in peptide concentrations. AEG-A had the closest relationship with the genus Aphanizomenon, while the contribution of Aphanizomenon to the variation was 10.76% (F = 5, p < 0.05).
The presence of nodularin in the Curonian Lagoon was very closely connected to the presence of brackish water, which explains 7.17% (F = 6, p = 0.001) of the data distribution; and both of them were negatively related with the water temperature. The impact of different years and Woronichinia had small though statistically significant contributions to the variation of data (contribution 10.45%, F = 6, p = 0.001 and contribution 3.57%, F = 3, p < 0.05, accordingly).
4. Discussion
In the present study, we provide the first detailed description of the occurrence and the diversity of cyanopeptides and anatoxin in the Curonian Lagoon (Lithuanian part). Cyanobacteria usually produce toxins and other secondary cyanometabolites as a potential defence mechanism against surrounding aquatic organisms. Cyanometabolites could inhibit the growth of some bacteria and can be toxic to zooplankton ([11,23] and references therein). As many of the compounds are biologically active and frequently toxic, they can pose a risk to the aquatic ecosystem and human health. The problem is global, therefore extended knowledge about cyanobacteria occurrence and metabolic diversity is needed [44]. Studies on cyanobacteria have been carried out in the Curonian Lagoon for many years, but they have been limited to the structure of the cyanobacterial community and the occurrence of microcystins, nodularin and anatoxin [28,30]. In terms of water quality, the concentrations of microcystins are the parameters for which, according to the WHO and EPA, the recreational values of water bodies are assessed [17,45]. However, other metabolites such as cyanopeptolins, microginins, aeruginosines sometimes have equivalent or even stronger bioactive effects compared to microcystins [11]. Moreover, the water quality in coastal areas can be affected by the water outflows from the eutrophic estuaries/lagoons [32,46]; therefore, an assessment of the diversity and seasonal variation of cyanometabolites can help to improve the estimation of associated risks.
In total, 48 variants of cyanometabolites belonging to seven different classes were identified. Microcystins were the most frequently found cyanopeptides in the Curonian Lagoon, with MC-RR, MC-LR, MC-YR, and [Asp3]MC-RR being the most common. A similar pattern of microcystin variants has been observed in previous studies conducted in the Curonian Lagoon [28,30,31,32] and in other freshwater bodies, e.g., in Latvia [47,48], Russia [49], Poland [40,50], Greece [51,52], Bulgaria [53], Estonia [54], France [55], Germany [56], USA [57] or in estuaries and coastal waters ([46,49,58,59] and references therein). According to Mantzouki et al. [60], MC-YR, MC-LR and dmMC-LR variants are the most frequent in European freshwater bodies, while dmMC-RR is less abundant and found in 38% of the investigated lakes. On the other hand, the cell-bound concentration of microcystins falls within the range of concentrations reported from other European water bodies [60], except in some cases (scums) and/or some places, where high microcystin concentrations have been recorded (e.g., 134 µg L−1 in the Curonian lagoon [28], >10,000 µg L−1 in Lakes Kastoria and Pamvotis (Greece [51]), 1070 µg L−1 in Vaya quay (Bulgaria [53]), 25,000 µg L−1 in Havel River (Berlin, Germany [61]).
In our study, a shift from the dominance of MC-RR in 2013 and 2014 to the dominance of [Asp3]MC-RR in 2015–2017 was observed (Figure 3, Figure 4, Figure 5 and Figure 6). However, the highest microcystin concentration was of [Asp3]MC-RR in 2014 (St. One). Microcystin [Asp3]MC-RR is almost by 3-fold more toxic than its methylated variant MC-RR [17]; therefore, this shift can affect the water quality. Microcystin MC-RR was strongly linked with the presence of Microcystis spp. and Dolichopermum spp., while [Asp3]MC-RR is strongly linked with the presence of Planktothrix (Figure 8). Our results confirm the previous findings that Microcystis and Dolichospermum species are the main producers of non-demethylated microcystins, while Planktothrix is usually linked with demethylated forms of microcystins [40,62]. Moreover, previous studies have shown that Microcystis from the Curonian Lagoon contain the mcyE gene responsible for microcystins synthesis [63]. Moreover, concentrations of [Asp3]MC-RR were high in the Curonian Lagoon throughout the study period and are also the highest in other European lakes [60]. The total microcystin concentration recorded in this work exceeded the recommended guideline values for recreational waters provided by US Environmental Protection Agency (US EPA) (8 µg L−1) in 12.6 % of cases. The guideline levels were exceeded at all stations except Station Three. However, these concentrations were within the limits provided by the World Health Organization (24 µg L−1); the highest total microcystin concentration recorded in the lagoon was 22.8 µg L−1. Climatic conditions play an important role in shaping the composition of cyanobacteria species in the water body [64]. Calm and hot weather favour A. flosaquae blooms (this study in 2014, [24,64]). On the other hand, during rainy and windy summers, water mixing, and turbidity increases, resulting in A. flosaquae replacement by other cyanobacteria species (this study, y. 2017 [24,64]). Despite the low biomass of cyanobacteria in 2017 (summer maximum 5.1 mg L−1), the number of detected metabolites was similar to other years (Table S1). Therefore, it is likely that A. flosaquae has no significant contribution to the number of metabolites detected in the samples. Despite the dominance of A. flosaquae, other species, particularly P. agardhii, Dolichospermum spp., and Microcystis spp. were considered as the main producers of cyanometabolites.
Cyanobacteria of the main genera recorded in the Curonian Lagoon, Aphanizomenon, Microcystis, Planktothrix, and Woronichinia, were also observed during the cold period, and even under the ice cover (this study Figure 3 and Figure 7, [5,6,65,66,67]. Low concentrations of [Asp3]MC-RR, MC-RR, and MC-LR, as well as AP-A and AEG-A, indicating the presence of cyanobacteria, were found in the Curonian Lagoon during the December–March period at water temperature 2.9 °C, on average. It is known that microcystins accumulate in the tissues of a wide range of aquatic consumers [68,69]. Therefore, it is not surprising that microcystins have been found in sediments, fish, and mussel tissues in the spring [29,33].
The presence of nodularin at concentrations in the range of 0.01 to 0.28 µg L−1, in the Curonian Lagoon was associated with higher water salinity values. It is known that N. spumigena, the only nodularin producer in the Baltic Sea [70,71], could live both in brackish and fresh waters [41,60]. The presence of N. spumigena and nodularin in the Curonian Lagoon is associated with Baltic Sea water intrusions to the lagoon [28,32]. According to Zemlys et al. [35], saline water intrusions are more frequent in the northern part of the lagoon, while in extreme cases they could reach the central part. During our study, the farthest station where nodularin was detected was near the Nemunas river avandelta (St. Four). Although Baltic Sea strains of Nodularia can grow in culture at 0 g L−1 NaCl at least for 70 h [72], it seems that this species has not established a permanent population in the Curonian Lagoon. The detection of the cell-bound nodularin did not always coincide with the detection of N. spumigena. Therefore, we can assume that the microscopy method may not reveal the presence of rare species of cyanobacteria.
ANTX-a is a relatively less common bioactive cyanometabolite present in waterbodies worldwide. According to Mantzouki et al. [60], it was found in 39% of the investigated 137 European lakes. In the Baltic Sea region, ANTX-a was found in the Gulf of Finland [49], the Gulf of Gdansk [73], and the south-eastern Baltic coast [32], while it was absent in the Baltic Proper [74,75], the Danish straits [76], and the Vistula Lagoon [77]. In the Curonian Lagoon, anatoxin was not found during the snapshot surveys, even during the blooms of different cyanobacteria (e.g., M. aeruginosa, A. flosaquae, P. agardhii) [30,31], while during long-term surveys, the toxin was reported to be present in 31% (this study) or 47% [32] of the investigated samples. During our study, ANTX-a was found in the lagoon from July to October, but not every year. According to the statistical analysis, the closest relationship of this cyanomethabolite was established with the Microcystis genus. However, only few Microcystis strains from Japan and Portugal have been found to produce ANTX-a so far [78,79,80]. It is known that ANTX-a can be also produced by Aphanizomenon, Dolichospermum (previously known as Anabaena), Gomphosphaeria, Limnothrix, Lyngbya, Planktothrix, Planktolyngbia, Pseudanabaena, and Synechocystis ([81,82] and references therein). In the Lithuanian lakes, the presence of ANTX-a significantly correlated only with the C. issatschenkoi; however, none of the isolated strains of the species showed ANTX-a production [83]. The concentrations of ANTX-a (0–0.515 µg L−1) detected in the Curonian Lagoon are similar to the concentrations determined in Lithuanian lakes [83] and other European lakes [60].
There are numerous references on the composition of cyanopeptides in lakes, while estuaries are poorly studied. Estuaries could be more diverse in species composition, because of the presence of both fresh and fresh-brackish water organisms [6]; therefore, we could expect more potential cyanopeptide producers. In many estuaries and coastal waters, Microcystis spp. and Dolichospermum (previously known as Anabaena) are considered as the main potential microcystin producers ([46] and references therein). Species representing Aphanizomenon and Planktothrix genera are less common in estuaries, despite the fact that Aphanizomenon thrive in brackish waters (e.g., Baltic Sea, [84]), meanwhile Planktothrix can grow and produce toxins in waters up to 7.5 g L−1 of NaCl [85]. In the Curonian lagoon, depending on the year and season, Aphanizomenon, Planktothrix, Microcystis, Dolichospermum or Woronichinia can have the largest contribution to the total cyanobacterial biomass.
Until recently, P. agardhii was observed only occasionally in the Curonian Lagoon and reached less than 5% of the total phytoplankton abundance ([86] and references therein). Based on the available literature, from the late 1990s, P. agardhii are found all year round (this study, [6,65]) and could account for 13–57% of the total cyanobacteria biomass [25,33,87]. Planktothrix tolerates fluctuations in fresh-brackish waters, turbid and or shady conditions [5,64], which are characteristic to the Curonian Lagoon too. Demethylated microcystin variants ([Asp3]MC-RR and [Asp3]MC-LR) are usually associated with the presence of P. agardhii [40,62]. In previous studies [28,30], only [Asp3]MC-RR was found in the Curonian Lagoon during the dominance of Planktothrix. Microcystins [Asp3]MC-RR and [Asp3]MC-LR were the most common toxins in our study. However, we cannot unequivocally attribute the presence of the compounds to a particular cyanobacterium. It has been shown that P. agardhii from the Curonian Lagoon has the mcyE gene, responsible for toxin production [88].
Usually, more attention is given to widely known bioactive cyanopeptides (e.g., microcystins) and anatoxins, their composition, quantity, and production regulation, etc. Nevertheless, other cyanopeptides could be more harmful to humans and aquatic organisms [11]. In the Curonian Lagoon, anabaenopeptins showed the closest statistical coincidence with P. agardhii and had the highest number of variants, of which the most frequent were AP-A, AP-B, AP-F, and Osc-Y. These peptides are also commonly detected in other freshwater bodies dominated by P. agardhii [40,89], Microcystis spp. [89,90,91], Coelosphaeriaceae (e.g., Woronichinia compacta) [92], in the strain of Anabaena90 isolated from the fresh environment [93]. The same metabolites AP-A, Osc-Y, AP915, AP807, and AP-D were found in the brackish environment (Gulf of Gdansk, south Baltic Sea), dominated by N. spumigena (50% of the cyanobacterial biomass), A. flosaquae (40%), and Dolichospermum spp. (10%) [94]. According to Janssen ([11] and references therein), in European lakes the concentration of anabaenopeptins usually is higher as compared to microcystins.
A. flosaquae is responsible for the largest and longest cyanobacteria blooms in the Curonian Lagoon (e.g., this study, [6,24,95]). So far, there are no data on its ability to produce microcystins either in the Baltic Sea, or in the Curonian Lagoon [12,30], meanwhile, it is considered as the producer of other classes of bioactive metabolites [12]. Despite the weak relationship between Aphanizomenon abundance and concentrations of cyanopeptides, the highest correlation based on the RDA analysis was observed with the aeruginosamide AEG-A. This confirms the findings indicating that A. flosaquae and C. issatschenkoi are correlated with aeruginosamide [96]. During previous studies in the Curonian Lagoon, AEG-A was found in both samples from A. flosaquae and in M. aeruginosa dominated communities [31]. However, in that study, AEG-A was found in 52% of the samples collected all year round and in samples dominated by different cyanobacteria: Aphanizomenon, Dolichospermum, Microcystis, P. agardhii, Woronichinia. Aeruginosamide is also commonly found in waterbodies dominated by Microcystis spp. [56,89]. In Poland aeruginosamide was found in several freshwater samples dominated by P. agardhii [40]. Recently, 18 different aeruginosamide variants were found in a Limnoraphis CCNP1324 culture isolated from the brackish Baltic Sea [97].
Aeruginosins also have a number of structural variants. To date, about 80 variants of the compound from Microcystis, Nodularia, and Planktothrix have been described [10,98]. In phytoplankton samples collected from the Curonian Lagoon, 12 different aeruginosin variants were detected in the summer–autumn period, but they were not common. Typically, the highest number of aeruginosin variants were recorded when Aphanizomenon had the highest biomass. Aeruginosins with m/z 618 and m/z 568 were found in previous research conducted in the Curonian Lagoon during the dominance of A. flosaquae and M. aeruginosa [31]. Recently, it was found that A. flosaquae strains from USA and Finland have aeruginosin biosynthetic gene clusters [99]; therefore, it is possible that in the Curonian Lagoon, A. flosaquae is one of the aeruginosin producers as well. The other two species, P. agardhii and Microcystis spp., which are known to produce aeruginosins [10,98], usually coexist as subdominant species in the Curonian Lagoon. The most common, AER 126A and AER 126B, were previously isolated from P. agardhii [100] and were found in a P. agardhii dominated freshwater pond as well (Poland, [40]).
Cyanopeptolins and microginins are two other groups with approximately 210 and 72 variants, respectively [12,101]. According to the literature, there are several species in the Curonian Lagoon that can synthesize cyanopeptolins, namely Microcystis, Planktothrix, and Dolichospermum [12], while microginins are synthesized mainly by Microcystis, Planktothrix, Synechococcus, and Woronichinia naegeliana [12,101,102]. The amount of data on the occurrence of these two groups of peptides is rapidly increasing in recent years (e.g., [99] and references therein, [40,56,89,103]), however, they are still under-researched compounds [11,101]. During the whole period of our study, we found only three cyanopeptolins of different variants and four microginin variants. Moreover, both cyanopeptolins and microginins were found in the Curonian Lagoon, only occasionally in the summer–autumn period and in less than 4% of all samples, except for microginin Mg 591B, which was identified in 12% of the samples. M. aeruginosa strains isolated from Portuguese freshwaters were the source/producers of 11 cyanopeptolins and three microginin variants [104]; from Greek freshwaters, 51 different microginin variants were detected [101]. In the Curonian Lagoon, cyanopeptolins were detected during the dominance of Microcystis and P. agardhii, while microginins were present during the predominance of P. agardhii. The low number of cyanopeptolins and microginins found in the Curonian Lagoon might be attributed to the narrowly specific cyanobacteria species / strain’s ability to produce these two compounds, or to unfavourable estuarine conditions for the production of the compounds.
The eutrophic, dynamic, and heterogeneous environment of the Curonian Lagoon is favourable for the growth, diversity, and high abundance of different cyanobacteria species and, consequently, supports the diversity and high concentration of cyanopeptides. Over the past decades, a shorter or absent ice period and increasing water temperature have been observed during the winter in the Curonian Lagoon [105]. Due to this reason, cyanobacteria (especially overwintering species such as Planktothrix or Limnothrix) and their produced cyanometabolites may be present in water bodies during the winter period [5]. This, in turn, led to the detection of a greater variety and higher concentrations of cyanopeptides, also in winter. Moreover, aeruginosins, anabaenopeptins, cyanopeptolins, and microginins can be as toxic as microcystins [11]. These cyanopeptides may have synergistic effects on aquatic organisms when found together [11,89]. In general, the effects of cyanopeptides on human health have been more frequently investigated than the ecological function of these metabolites in the water ecosystems [106,107].
Despite the fact that Aphanizomenon was the dominant cyanobacterium species in our study of the Curonian Lagoon, it was Planktothrix, Microcystis, and Dolichospermum that were the main producers of cyanopeptides and anatoxin in the water body. The cyanometabolites richness shown in our work can form a good starting point for further studies on their role in ecosystem functioning, including their indirect impact on water quality at bathing sites. Knowledge of the effects of environmental conditions on the production and fate of these compounds are important to the general understanding of water ecosystem dynamics.
Supplementary Materials
The following are available online at https://www.mdpi.com/article/10.3390/w13131760/s1, Table S1: The presence of detected cyanometabolites (m/z of their [M + H]+ ion) and cyanobacteria in the Curonian Lagoon during the study period. + – present of the compound or cyanobacteria. AER—aeruginosin, AEG—aeruginosamide, ANTX—anatoxin, AP—anabaenopeptin, CP—cyanopeptolin, MC—microcystin, Mg—microginin, NOD—nodularin, Osc—oscillamide. Stations: 1st—Nida, 2nd—Juodkrantė, 3rd—Dreverna, 4th—Ventė, 5th—Smiltynė. T.s.—this study.
Author Contributions
Conceptualization, R.P., D.O., Z.R.G. and H.M.-M.; Formal analysis, R.P.; Funding acquisition, H.M.-M.; Investigation, R.P. and D.O.; Resources, R.P., D.O. and H.M.-M.; Supervision, Z.R.G. and H.M.-M.; Writing—original draft, R.P. and D.O.; Writing—review and editing, Z.R.G. and H.M.-M. All authors have read and agreed to the published version of the manuscript.
Funding
The preparation of the manuscript was supported by funding from the Lithuanian National Science Foundation, grant number S-MIP-20-31. This study was also financially supported by a statutory program of the University of Gdańsk (grant No. DS/D531-G260-D424-19).
Institutional Review Board Statement
Not applicable.
Informed Consent Statement
Not applicable.
Acknowledgments
We are grateful to two anonymous reviewers for very valuable remarks and to A. Razinkovas-Baziukas for language revision.
Conflicts of Interest
The authors declare no conflict of interest.
References
- Buratti, M.F.; Manganelli, M.; Vichi, S.; Stefanelli, M.; Scardala, S.; Testai, E.; Funari, E. Cyanotoxins: Producing organisms, occurrence, toxicity, mechanism of action and human health toxicological risk evaluation. Arch. Toxicol. 2017, 91, 1049–1130. [Google Scholar] [CrossRef]
- Meriluoto, J.; Blaha, L.; Bojadzija, G.; Bormans, M.; Brient, L.; Codd, A.G.; Drobac, D.; Faassen, J.E.; Fastner, J.; Hiskia, A.; et al. Toxic cyanobacteria and cyanotoxins in European waters—Recent progress achieved through the CYANOCOST Action and challenges for further research. Adv. Oceanogr. Limnol. 2017, 8, 161–178. [Google Scholar] [CrossRef] [Green Version]
- Olofsson, M.; Suikkanen, S.; Kobos, J.; Wasmund, N.; Karlson, B. Basin-specific changes in filamentous cyanobacteria community composition across four decades in the Baltic Sea. Harmful Algae 2020, 91, 101685. [Google Scholar] [CrossRef]
- Paerl, W.H. Mitigating Harmful Cyanobacterial Blooms in a Human- and Climatically-Impacted World. Life 2014, 4, 988–1012. [Google Scholar] [CrossRef] [Green Version]
- Wejnerowski, Ł.; Rzymski, P.; Kokociński, M.; Meriluoto, J. The structure and toxicity of winter cyanobacterial bloom in a eutrophic lake of the temperate zone. Ecotoxicology 2018, 27, 752–760. [Google Scholar] [CrossRef] [PubMed] [Green Version]
- Olenina, I. Identification of Algae Species in the Curonian Lagoon. Submar. Rep. 2012, 17, 1–14. [Google Scholar]
- Laamanen, M.J.; Forsstrom, L.; Sivonen, K. Diversity of Aphanizomenon flosaquae (Cyanobacterium) Populations along a Baltic Sea Salinity Gradient. Appl. Environ. Microbiol. 2002, 68, 5296–5303. [Google Scholar] [CrossRef] [PubMed] [Green Version]
- Salmaso, N.; Bernard, C.; Humbert, J.-F.; Akçaalan, R.; Albay, M.; Ballot, A.; Catherine, A.; Fastner, J.; Häggqvist, K.; Horecká, M.; et al. Basic guide to detection and monitoring of potentially toxic cyanobacteria. In Handbook of Cyanobacterial Monitoring and Cyanotoxin Analysis; John Wiley & Sons, Ltd.: Chichester, UK, 2017; pp. 46–69. ISBN 978-1-119-06868-6. [Google Scholar]
- Demay, J.; Bernard, C.; Reinhardt, A.; Marie, B. Natural Products from Cyanobacteria: Focus on Beneficial Activities. Mar. Drugs 2019, 17, 320. [Google Scholar] [CrossRef] [Green Version]
- Jones, R.M.; Pinto, E.; Torres, A.M.; Dörr, F.; Mazur-Marzec, H.; Szubert, K.; Tartaglione, L.; Dell’Aversano, C.; Miles, O.C.; Beach, G.D.; et al. CyanoMetDB, a comprehensive public database of secondary metabolites from cyanobacteria. Water Res. 2021, 196, 117017. [Google Scholar] [CrossRef]
- Janssen, E.M. Cyanobacterial peptides beyond microcystins—A review on co-occurrence, toxicity, and challenges for risk assessment. Water Res. 2019, 151, 488–499. [Google Scholar] [CrossRef] [PubMed]
- Welker, M.; von Döhren, H. Cyanobacterial peptides—Nature’s own combinatorial biosynthesis. FEMS Microbiol. Rev. 2006, 30, 530–563. [Google Scholar] [CrossRef] [PubMed] [Green Version]
- Spoof, L.; Catherine, A. Appendix 3 Tables of Microcystins and Nodularins. In Handbook of Cyanobacterial Monitoring and Cyanotoxin Analysis; Meriluoto, J., Spoof, L., Codd, G.A., Eds.; John Wiley & Sons, Ltd.: Chichester, UK, 2017; pp. 526–537. [Google Scholar]
- Miles, C.O.; Stirling, D. Toxin Mass List, Version 15b. Available online: https://www.researchgate.net/publication/324039408_Toxinmasslist_COM_v15b (accessed on 18 January 2021).
- Huang, I.-S.; Zimba, V.P. Cyanobacterial bioactive metabolites—A review of their chemistry and biology. Harmful Algae 2019, 83, 42–94. [Google Scholar] [CrossRef] [PubMed]
- Codd, G.A.; Morrison, L.F.; Metcalf, J.S. Cyanobacterial toxins: Risk management for health protection. Toxicol. Appl. Pharmacol. 2005, 203, 264–272. [Google Scholar] [CrossRef]
- Chorus, I.; Welker, M. Exposure to cyanotoxins. Understanding it and short-term interventions to prevent it. In Toxic Cyanobacteria in Water, 2nd ed.; Chorus, I., Welker, M., Eds.; CRC Press: Boca Raton, FL, USA, 2021. [Google Scholar]
- Machado, J.; Azevedo, J.; Vasconcelos, V.; Campos, A. Mode of Action and Toxicity of Major Cyanobacterial Toxins and Corresponding Chemical Variants. In Microbial Toxins. Toxinology; Gopalakrishnakone, P., Stiles, B., Alape-Girón, A., Dubreuil, J., Mandal, M., Eds.; Springer: Dordrecht, The Netherlands, 2018. [Google Scholar] [CrossRef]
- Current Approaches to Cyanotoxin Risk Assessment, Risk Management and Regulations in Different Countries 2012/63. Available online: https://www.umweltbundesamt.de/en/publikationen/current-approaches-to-cyanotoxin-risk-assessment-0 (accessed on 2 December 2020).
- Sano, T.; Kaya, K. Oscillamide Y, a chymotrypsin inhibitor from toxic Oscillatoria agardhii. Tetrahedron Lett. 1995, 36, 5933–5936. [Google Scholar] [CrossRef]
- Ersmark, K.; Del Valle, J.R.; Hanessian, S. Chemistry and biology of the aeruginosin family of serine protease inhibitors. Angew. Chem. Int. Ed. 2008, 47, 1202–1223. [Google Scholar] [CrossRef] [PubMed]
- Mazur-Marzec, H.; Cegłowska, M.; Konkel, R.; Pyrć, K. Antiviral Cyanometabolites—A Review. Biomolecules 2021, 11, 474. [Google Scholar] [CrossRef] [PubMed]
- Elersek, T.; Bláha, L.; Mazur Marzec, H.; Schmidt, W.; Carmeli, S. Other Cyanobacterial Bioactive Substances. In Handbook of Cyanobacterial Monitoring and Cyanotoxin Analysis; Meriluoto, J., Spoof, L., Codd, G.A., Eds.; Wiley: Hoboken, NJ, USA, 2017; pp. 179–195. ISBN 978-1-119-06868-6. [Google Scholar]
- Pilkaitytė, R.; Razinkovas, A. Factors controlling phytoplankton blooms in a temperate estuary: Nutrient limitation and physical forcing. Hydrobiologia 2006, 555, 41–48. [Google Scholar] [CrossRef]
- Pilkaitytė, R.; Razinkovas, A. Seasonal changes in phytoplankton composition and nutrient limitation in a shallow Baltic lagoon. Boreal Environ. Res. 2007, 12, 551–559. [Google Scholar]
- Rashleigh, B.; Razinkovas, A.; Pilkaitytė, R. Ecosystem services assessment of the Nemunas River delta. Trans. Waters Bull. 2011, 5, 75–84. [Google Scholar] [CrossRef]
- Ernst, B.; Hitzfeld, B.; Dietrich, B. Presence of Planktothrix sp. and cyanobacterial toxins in lake Ammersee, Germany and their impact on whitefish (Coregonus lavaretus L.). Environ. Toxicol. 2001, 16, 483–488. [Google Scholar] [CrossRef]
- Paldavičienė, A.; Mazur-Marzec, H.; Razinkovas, A. Toxic cyanobacteria blooms in the Lithuanian part of the Curonian lagoon. Oceanologia 2009, 51, 203–216. [Google Scholar] [CrossRef] [Green Version]
- Paldavičienė, A.; Zaiko, A.; Mazur-Marzec, H.; Razinkovas-Baziukas, A. Bioaccumulation of microcystins in invasive bivalves: A case study from the boreal lagoon ecosystem. Oceanologia 2015, 57, 93–101. [Google Scholar] [CrossRef] [Green Version]
- Šulčius, S.; Pilkaitytė, R.; Mazur-Marzec, H.; Kasperovičienė, J.; Ezhova, E.; Błaszczyk, A.; Paškauskas, R. Increased risk of exposure to microcystins in the scum of the filamentous cyanobacterium Aphanizomenon flos-aquae accumulated on the western shoreline of the Curonian Lagoon. Mar. Pollut. Bull. 2015, 99, 264–270. [Google Scholar] [CrossRef] [PubMed]
- Šulčius, S.; Montvydienė, D.; Mazur-Marzec, H.; Kasperovičienė, J.; Rulevičius, R.; Cibulskaitė, Ž. The profound effect of harmful cyanobacterial blooms: From food-web and management perspectives. Sci. Total Environ. 2017, 609, 1443–1450. [Google Scholar] [CrossRef]
- Overlingė, D.; Kataržytė, M.; Vaičiūtė, D.; Gyraitė, G.; Gečaitė, I.; Jonikaitė, E.; Mazur-Marzec, H. Are there concerns regarding cHAB in coastal bathing waters affected by freshwater-brackish continuum? Mar. Pollut. Bull. 2020, 159, 111500. [Google Scholar] [CrossRef] [PubMed]
- Bukaveckas, P.A.; Lesutienė, J.; Gasiūnaitė, Z.R.; Ložys, L.; Olenina, I.; Pilkaitytė, R.; Pūtys, Ž.; Tassone, S.; Wood, J. Microcystin in aquatic food webs of the Baltic and Chesapeake Bay regions. Estuar. Coast. Shelf Sci. 2017, 191, 50–59. [Google Scholar] [CrossRef] [Green Version]
- Lesutienė, J.; Ložys, L.; Dainys, J.; Karosienė, J.; Pilkaitytė, R.; Pūtys, Ž.; Bukaveckas, P.A.; Gasiūnaitė, Z.R. Migratory patterns and cyanotoxin concentrations of pikeperch (Sander lucioperca) in the coastal waters of the Baltic Sea. Boreal Environ. Res. 2018, 23, 314–327. [Google Scholar]
- Zemlys, P.; Ferrarin, C.; Umgiesser, G.; Gulbinskas, S.; Bellafiore, D. Investigation of saline water intrusions into the Curonian Lagoon (Lithuania) and two-layer flow in the Klaipeda Strait using finite element hydrodynamic model. Ocean Sci. 2013, 9, 573–584. [Google Scholar] [CrossRef] [Green Version]
- Razinkovas, A.; Dailidienė, I.; Pilkaitytė, R. Reduction of the Land-Based Discharges to the Curonian Lagoon in a View of a Climate Change Perspective. In Sustainable Use and Development of Watersheds; Gönenç, E., Vadineanu, A., Wolflin, J.P., Russo, R.C., Eds.; NATO Science for Peace and Security Series C: Environmental Security; Springer: Berlin/Heidelberg, Germany, 2008; pp. 403–413. [Google Scholar]
- HELCOM: Guidelines for Monitoring Phytoplankton Species Composition, Abundance and Biomass. Available online: https://helcom.fi/media/publications/Guidelines-for-monitoring-phytoplankton-species-composition-abundance-and-biomass.pdf (accessed on 3 November 2020).
- Grabowska, M.; Mazur-Marzec, H. Vertical distribution of cyanobacteria biomass and cyanotoxin production in the polymictic Siemianówka Dam Reservoir (eastern Poland). Fish. Aquat. Life 2014, 22, 41–51. [Google Scholar] [CrossRef]
- Kaloudis, T.; Zervou, S.-K.; Tsimeli, K.; Triantis, T.M.; Fotiou, T.; Hiskia, A. Determination of microcystins and nodularin (cyanobacterial toxins) in water by LC–MS/MS. Monitoring of Lake Marathonas, a water reservoir of Athens, Greece. J. Hazard. Mater. 2013, 263, 105–115. [Google Scholar] [CrossRef] [PubMed]
- Grabowska, M.; Kobos, J.; Toruńska-Sitarz, A.; Mazur-Marzec, H. Non-ribosomal peptides produced by Planktothrix agardhii from Siemianówka Dam Reservoir SDR (northeast Poland). Arch. Microbiol. 2014, 196, 697–707. [Google Scholar] [CrossRef] [Green Version]
- Mazur-Marzec, H.; Kaczkowska, M.J.; Błaszczyk, A.; Reyhan, A.; Spoof, L.; Meriluoto, J. Diversity of peptides produced by Nodularia spumigena from various geographical regions. Mar. Drugs 2013, 11, 1–19. [Google Scholar] [CrossRef] [PubMed] [Green Version]
- Botes, D.P.; Wessels, P.L.; Kruger, H.; Runnegar, M.T.C.; Satikarn, S.; Smith, R.J.; Barba, J.C.J.; Williams, D.H. Structural studies on cyanoginosins-LR, YR, YA, and YM, peptide toxins from Microcystis aeruginosa. J. Chem. Soc. Perkin Trans. 1985, 2747–2748. [Google Scholar] [CrossRef]
- Zuur, A.F.; Ieno, E.N.; Smith, G.M. Analysing Ecological Data; Springer: New York, NY, USA, 2007. [Google Scholar]
- Paerl, H.W.; Fulton, R.S., 3rd; Moisander, P.H.; Dyble, J. Harmful freshwater algal blooms, with an emphasis on cyanobacteria. Sci. World J. 2001, 1, 76–113. [Google Scholar] [CrossRef]
- Environmental Protection Agency. Recommended human health recreational ambient water quality criteria or swimming advisories for Microcystins and Cylindrospermopsin. Fed. Regist. 2019, 84, 26413–26414. [Google Scholar]
- Preece, E.P.; Hardy, F.J.; Moore, B.C.; Bryan, M. A review of microcystin detections in Estuarine and Marine waters: Environmental implications and human health risk. Harmful Algae 2017, 61, 31–45. [Google Scholar] [CrossRef] [Green Version]
- Eynard, F.; Mez, K.; Walther, J.-L. Risk of cyanobacterial toxins in Riga waters (Latvia). Water Res. 2000, 34, 2979–2988. [Google Scholar] [CrossRef]
- Balode, M.; Purina, I.; Strake, S.; Purvina, S.; Pfeifere, M.; Barda, I.; Povidisa, K. Toxic cyanobacteria in the lakes located in Rīga (the capital of Latvia) and its surroundings: Present state of knowledge. Afr. J. Mar. Sci. 2006, 28, 225–230. [Google Scholar] [CrossRef]
- Chernova, E.; Sidelev, S.; Russkikh, I.; Voyakina, E.; Zhakovskaya, Z. First observation of microcystin- and anatoxin-a-producing cyanobacteria in the easternmost part of the Gulf of Finland (the Baltic Sea). Toxicon 2019, 157, 18–24. [Google Scholar] [CrossRef] [PubMed]
- Kobos, J.; Błaszczyk, A.; Hohlfeld, N.; Torunska-Sitarz, A.; Krakowiak, A.; Hebel, A.; Sutryk, K.; Grabowska, M.; Toporowska, M.; Kokocinski, M.; et al. Cyanobacteria and cyanotoxins in Polish freshwater bodies. Oceanol. Hydrobiol. Stud. 2013, 42, 358–378. [Google Scholar] [CrossRef] [Green Version]
- Gkelis, S.; Lanaras, T.; Sivonen, K. Cyanobacterial Toxic and Bioactive Peptides in Freshwater Bodies of Greece: Concentrations, Occurrence Patterns, and Implications for Human Health. Mar. Drugs 2015, 13, 6319–6335. [Google Scholar] [CrossRef] [PubMed] [Green Version]
- Christophoridis, C.; Zervou, S.K.; Manolidi, K.; Katsiapi, M.; Moustaka-Gouni, M.; Kaloudis, T.; Triantis, T.M.; Hiskia, A. Occurrence and diversity of cyanotoxins in Greek lakes. Sci. Rep. 2018, 8, 17822–17877. [Google Scholar] [CrossRef] [PubMed] [Green Version]
- Stoyneva-Gärtner, M.; Descy, J.; Latli, A.; Uzunov, B.; Pavlova, V.; Bratanova, Z.; Babica, P.; Marsálek, B.; Meriluoto, J.; Spoof, L. Assessment of cyanoprokaryote blooms and of cyanotoxins in Bulgaria in a 15-years period (2000-2015). Adv. Oceanogr. Limnol. 2017, 8, 36–57. [Google Scholar] [CrossRef] [Green Version]
- Tanner, R.; Kangur, K.; Spoof, L.; Meriluoto, J. Hepatotoxic cyanobacterial peptides in Estonian freshwater bodies and inshore marine water. Proc. Est. Acad. Sci. Biol. Ecol. 2005, 54, 40–52. [Google Scholar]
- Pitois, F.; Fastner, J.; Pagotto, C.; Dechesne, M. Multi-Toxin Occurrences in Ten French Water Resource Reservoirs. Toxins 2018, 10, 283. [Google Scholar] [CrossRef] [Green Version]
- Welker, M.; Brunke, M.; Preussel, K.; Lippert, I.; von Döhren, H. Diversity and distribution of Microcystis (Cyanobacteria) oligopeptide chemotypes from natural communities studied by single-colony mass spectrometry. Microbiology 2004, 150, 1785–1796. [Google Scholar] [CrossRef] [PubMed] [Green Version]
- Beversdorf, L.J.; Weirich Chelsea, A.; Miller Todd, R.; Bartlett Sarah, L. Variable cyanobacterial toxin and metabolite profiles across six eutrophic lakes of differing physiochemical characteristics. Toxins 2017, 9, 62. [Google Scholar] [CrossRef] [Green Version]
- Spoof, L.; Vesterkvist, P.; Lindholm, T.; Meriluoto, J. Screening for cyanobacterial hepatotoxins, microcystins and nodularin in environmental water samples by reversed-phase liquid chromatography–electrospray ionisation mass spectrometry. J. Chromatogr. A 2003, 1020, 105–119. [Google Scholar] [CrossRef]
- Bormans, M.; Amzil, Z.; Mineaud, E.; Brient, L.; Savar, V.; Robert, E.; Lance, E. Demonstrated transfer of cyanobacteria and cyanotoxins along a freshwater-marine continuum in France. Harmful Algae 2019, 87, 101639. [Google Scholar] [CrossRef]
- Mantzouki, E.; Lürling, M.; Fastner, J.; de Senerpont Domis, L.; Wilk-Woźniak, E.; Koreivienė, J.; Seelen, L.; Teurlincx, S.; Verstijnen, Y.; Krztoń, W.; et al. Temperature Effects Explain Continental Scale Distribution of Cyanobacterial Toxins. Toxins 2018, 13, 156. [Google Scholar] [CrossRef] [PubMed] [Green Version]
- Fastner, J.; Neumann, U.; Wirsing, B.; Weckesser, J.; Wiedner, C.; Nixdorf, B.; Chorus, I. Microcystins (hepatotoxic heptapeptides) in German fresh water bodies. Environ. Toxicol. Int. J. 1999, 14, 13–22. [Google Scholar] [CrossRef]
- Christiansen, G.; Fastner, J.; Erhard, M.; Börner, T.; Dittmann, E. Microcystin biosynthesis in Planktothrix: Genes, evolution, and manipulation. J. Bacteriol. 2003, 185, 564–572. [Google Scholar] [CrossRef] [Green Version]
- Belykh, O.I.; Dmitrieva, O.A.; Gladkikh, A.S.; Sorokovikova, E.G. Identification of toxigenic Cyanobacteria of the genus Microcystis in the Curonian Lagoon (Baltic Sea). Oceanology 2013, 53, 71–79. [Google Scholar] [CrossRef]
- Noges, T.; Noges, P. The effect of extreme water level decrease on hydrochemistry and phytoplankton in a shallow eutrophic Lake. Hydrobiologia 1999, 408/409, 277–283. [Google Scholar] [CrossRef]
- Lange, E.K. Structure and spatial distribution of winter phytoplankton of the Curonian Lagoon (Baltic sea). Ekologija 2011, 57, 121–127. [Google Scholar] [CrossRef] [Green Version]
- Kokociński, M.; Stefaniak, K.; Izydorczyk, K.; Jurczak, T.; Mankiewicz-Boczek, J.; Soininen, J. Temporal variation in microcystin production by Planktothrix agardhii (Gomont) Anagnostidis and Komárek (Cyanobacteria, Oscillatoriales) in a temperate lake. Ann. Limnol. Int. J. Lim. 2011, 47, 363–371. [Google Scholar] [CrossRef] [Green Version]
- Walls, J.T.; Wyatt, K.H.; Doll, J.C.; Rubenstein, E.M.; Rober, A.R. Hot and toxic: Temperature regulates microcystin release from cyanobacteria. Sci. Total Environ. 2018, 610–611, 786–795. [Google Scholar] [CrossRef]
- Lehman, P.W.; Teh, S.J.; Boyer, G.L.; Nobriga, M.L.; Bass, E.; Hogle, C. Initial impacts of Microcystis aeruginosa blooms on the aquatic food web in the San Francisco Estuary. Hydrobiologia 2010, 637, 229–248. [Google Scholar] [CrossRef] [Green Version]
- Wood, J.D.; Bukaveckas, P.A. Increasing severity of phytoplankton nutrient limitation following reductions in point source inputs to the tidal freshwater segment of the James River Estuary. Estuaries Coasts 2014, 37, 1188–1201. [Google Scholar] [CrossRef]
- Mazur-Marzec, H.; Krezel, A.; Kobos, J.; Plinski, M. Toxic Nodularia spumigena blooms in the coastal waters of the Gulf of Gdańsk: A ten-year survey. Oceanologia 2006, 48, 255–273. [Google Scholar]
- Karlsson, K.M.; Kankaanpää, H.; Huttunen, M.; Meriluoto, J. First observation of microcystin LR in pelagic cyanobacterial blooms in the northern Baltic Sea. Harmful Algae 2005, 4, 163–166. [Google Scholar] [CrossRef]
- Moisander, P.H.; McClinton, E.; Paerl, H. Salinity effects on growth photosynthetic parameters and nitrogenase activity in estuarine planktonic cyanobacteria. Microb. Ecol. 2002, 43, 432–442. [Google Scholar] [CrossRef]
- Mazur-Marzec, H.; Lewandowska, J.; Błaszczyka, A.; Kot, A.; Pliński, M. Cyanobacterial toxins in fresh and brackish waters of Pomorskie province (northern Poland). Oceanol. Hydrobiol. Stud. 2003, XXXII, 15–26. [Google Scholar]
- Mazur-Marzec, H.; Sutryk, K.; Kobos, J.; Hebel, A.; Hohlfeld, N.; Błaszcyk, A.; Toruńska, A.; Kaczkowska, J.M.; Pastuszak-Łysiak, E.; Kraśniewski, W.; et al. Occurrence of cyanobacteria and cyanotoxin in the Southern Baltic Proper. Filamentous cyanobacteria versus single-celled picocyanobacterial. Hydrobiologia 2013, 701, 235–252. [Google Scholar] [CrossRef] [Green Version]
- Kankaanpää, T.H.; Sjövall, O.; Huttunen, M.; Olin, M.; Karlsson, K.; Hyvärinen, K.; Sneitz, L.; Härkönen, J.; Sipiä, O.V.; Meriluoto, A.O.J. Production and sedimentation of peptide toxins nodularin-R and microcystin-LR in the northern Baltic Sea. Environ. Pollut. 2009, 157, 1301–1309. [Google Scholar] [CrossRef]
- Henriksen, P. Estimating nodularin content of cyanobacterial blooms from abundance of Nodularia spumigena and its characteristic pigments—A case study from the Baltic entrance area. Harmful Algae 2005, 4, 167–178. [Google Scholar] [CrossRef]
- Mazur-Marzec, H.; Browarczyk-Matusiak, G.; Forycka, K.; Kobos, J.; Pliński, M. Morphological, genetic, chemical and ecophysiological characterization of two Microcystis aeruginosa isolates from the Vistula Lagoon, southern Baltic. Oceanologia 2010, 52, 127–146. [Google Scholar] [CrossRef] [Green Version]
- Park, H.; Watanabe, M.; Harda, K.; Nagai, H.; Suzuki, M.; Hayashi, H. Hepatotoxin (microcystin) and neurotoxin (anatoxin-a) contained in natural blooms and strains of cyanobacteria from Japanese freshwaters. Nat. Toxins 1993, 16, 353–360. [Google Scholar] [CrossRef] [PubMed]
- Harada, K.-I.; Nagai, H.; Kimura, Y.; Suzuki, M.; Park, H.-D.; Watanabe, M.F.; Luukkainen, R.; Sivonen, K.; Carmichael, W.W. Liquid chromatography/mass spectrometric detection of anatoxin-a, a neurotoxin from cyanobacteria. Tetrahedron 1993, 49, 9251–9260. [Google Scholar] [CrossRef]
- Osswald, J.; Rellán, S.; Gago-Martinez, A.; Vasconcelos, V. Production of anatoxin-a by cyanobacterial strains isolated from Portuguese fresh water systems. Ecotoxicology 2009, 18, 1110–1115. [Google Scholar] [CrossRef]
- Osswald, J.; Rellán, S.; Gago, A.; Vasconcelos, V. Toxicology and detection methods of the alkaloid neurotoxin produced by cyanobacteria, anatoxin-a. Environ. Int. 2007, 33, 1070–1089. [Google Scholar] [CrossRef] [PubMed]
- Christensen, V.G.; Khan, E. Freshwater neurotoxins and concerns for human, animal, and ecosystem health: A review of anatoxin-a and saxitoxin. Sci. Total Environ. 2020, 736, 139515. [Google Scholar] [CrossRef]
- Karosienė, J.; Savadova-Ratkus, K.; Toruńska-Sitarz, A.; Koreivienė, J.; Kasperovičienė, J.; Vitonytė, I.; Błaszczyk, A.; Mazur-Marzec, H. First report of saxitoxins and anatoxin-a production by cyanobacteria from Lithuanian lakes. Eur. J. Phycol. 2020, 55, 327–338. [Google Scholar] [CrossRef]
- Thamm, R.; Schernewski, G.; Wasmund, N.; Neumann, T. Spatial phytoplankton pattern in the Baltic Sea; Baltic Sea Typology; Coastline Reports 4; Schernewski, G., Wielgat, M., Eds.; Die Küsten Union Deutschlands eV: Warnemünde, Germany, 2004; pp. 85–109. [Google Scholar]
- Vergalli, J.; Fayolle, S.; Combes, A.; Franquet, E.; Comte, K. Persistence of microcystin production by Planktothrix agardhii (Cyanobacteria) exposed to different salinities. Phycologia 2020, 59, 24–34. [Google Scholar] [CrossRef]
- Olenina, I. Phytoplankton and Its Development in the South-Eastern Coastal Baltic and the Curonian Lagoon. Ph.D. Thesis, Vilnius University, Vilnius, Lithuania, 1997. (In Russian). [Google Scholar]
- Jaanus, A.; Andersson, A.; Olenina, I.; Toming, K.; Kaljurand, K. Changes in phytoplankton communities along a north-south gradient in the Baltic Sea between 1990 and 2008. Boreal Environ. Res. 2011, 16, 191–208. [Google Scholar]
- Overlingė, D.; Samuilovienė, A.; Klaipėda University, Klaipėda, Lithuania. Personal communication, 2017.
- Pawlik-Skowrońska, B.; Toporowska, M.; Mazur-Marzec, H. Effects of secondary metabolites produced by different cyanobacterial populations on the freshwater zooplankters Brachionus calyciflorus and Daphnia pulex. Environ. Sci. Pollut. Res. 2019, 26, 11793–11804. [Google Scholar] [CrossRef] [PubMed] [Green Version]
- Fastner, J.; Erhard, M.; von Dohren, H. Determination of oligopeptide diversity within a natural population of Microcystis spp. (cyanobacteria) by typing single colonies by matrix-assisted laser desorption ionizationtime of flight mass spectrometry. Appl. Environ. Microbiol. 2001, 67, 5069–5076. [Google Scholar] [CrossRef] [Green Version]
- Saker, M.L.; Fastner, J.; Dittmann, E.; Christiansen, G.; Vasconcelos, V.M. Variation between strains of the cyanobacterium Microcystis aeruginosa isolated from a Portuguese river. J. Appl. Microbiol. 2005, 99, 749–757. [Google Scholar] [CrossRef]
- Häggqvist, K.; Toruńska-Sitarz, A.; Błaszczyk, A.; Mazur-Marzec, H.; Meriluoto, J. Morphologic, Phylogenetic and Chemical Characterization of a Brackish Colonial Picocyanobacterium (Coelosphaeriaceae) with Bioactive Properties. Toxins 2016, 8, 108. [Google Scholar] [CrossRef] [Green Version]
- Tonk, L.; Welker, M.; Huisman, J.; Visser, P.M. Production of cyanopeptolins, anabaenopeptins, and microcystins by the harmful cyanobacteria Anabaena 90 and Microcystis PCC 7806. Harmful Algae 2009, 8, 219–224. [Google Scholar] [CrossRef]
- Spoof, L.; Błaszczyk, A.; Meriluoto, J.; Cegłowska, M.; Mazur-Marzec, H. Structures and Activity of New Anabaenopeptins Produced by Baltic Sea Cyanobacteria. Mar. Drugs 2015, 14, 8. [Google Scholar] [CrossRef] [PubMed] [Green Version]
- Gasiūnaitė, Z.R.; Daunys, D.; Olenin, S.; Razinkovas, A. The Curonian Lagoon. In Ecology of Baltic Coastal Waters. Ecological studies 197; Schiewer, U., Ed.; Springer: Berlin/Heidelberg, Germany, 2008; pp. 197–215. [Google Scholar]
- Kust, A.; Řeháková, K.; Vrba, J.; Maicher, V.; Mareš, J.; Hrouzek, P.; Chiriac, M.-C.; Benedová, Z.; Tesařová, B.; Saurav, K. Insight into Unprecedented Diversity of Cyanopeptides in Eutrophic Ponds Using an MS/MS Networking Approach. Toxins 2020, 12, 561. [Google Scholar] [CrossRef]
- Cegłowska, M.; Szubert, K.; Wieczerzak, E.; Kosakowska, A.; Mazur-Marzec, H. Eighteen New Aeruginosamide Variants Produced by the Baltic Cyanobacterium Limnoraphis CCNP1324. Mar. Drugs 2020, 18, 446. [Google Scholar] [CrossRef] [PubMed]
- Le Manach, S.; Duval, C.; Marie, A.; Djediat, C.; Catherine, A.; Edery, M.; Bernard, C.; Marie, B. Global Metabolomic Characterizations of Microcystis spp. Highlights Clonal Diversity in Natural Bloom-Forming Populations and Expands Metabolite Structural Diversity. Front. Microbiol. 2019, 10, 791. [Google Scholar] [CrossRef] [PubMed] [Green Version]
- Österholm, J.; Popin, R.V.; Fewer, D.P.; Sivonen, K. Phylogenomic Analysis of Secondary Metabolism in the Toxic Cyanobacterial Genera Anabaena, Dolichospermum and Aphanizomenon. Toxins 2020, 12, 248. [Google Scholar] [CrossRef] [Green Version]
- Ishida, K.; Okita, Y.; Matsuda, H.; Okino, T.; Murakami, M. Aeruginosins, protease inhibitors from the cyanobacterium Microcystis aeruginosa. Tetrahedron 1999, 55, 10971–10988. [Google Scholar] [CrossRef]
- Zervou, S.-K.; Gkelis, S.; Kaloudis, T.; Hiskia, A.; Mazur-Marzec, H. New microginins from cyanobacteria of Greek freshwaters. Chemosphere 2020, 248, 125961. [Google Scholar] [CrossRef]
- Bober, B.; Lechowski, Z.; Bialczyk, J. Determination of some cyanopeptides synthesized by Woronichinia naegeliana (Chroococcales, Cyanophyceae). Phycol. Res. 2011, 59, 286–294. [Google Scholar] [CrossRef]
- Mazur-Marzec, H.; Błaszczyk, A.; Felczykowska, A.; Hohlfeld, N.; Kobos, J.; Toruńska-Sitarz, A.; Prabha, D.; Montalvão, S.; D’Souza, L.; Tammela, P.; et al. Baltic cyanobacteria—A source of biologically active compounds. Eur. J. Phycol. 2015, 50, 343–360. [Google Scholar] [CrossRef] [Green Version]
- Martins, J.; Saker, M.L.; Moreira, C.; Welker, M.; Fastner, J.; Vasconcelos, V.M. Peptide diversity in strains of the cyanobacterium Microcystis aeruginosa isolated from Portuguese water supplies. Appl. Microbiol. Biotechnol. 2009, 82, 951–961. [Google Scholar] [CrossRef]
- Dailidienė, I.; Davulienė, L.; Kelpšaitė, L.; Razinkovas, A. Analysis of the Climate Change in Lithuanian Coastal Areas of the Baltic Sea. J. Coast. Res. 2012, 28, 557–569. [Google Scholar] [CrossRef]
- Codd, G.A.; Testai, E.; Funari, E.; Svircev, Z. Cyanobacteria, Cyanotoxins, and Human Health. In Water Treatment for Purification from Cyanobacteria and Cyanotoxins; Hiskia, A.E., Triantis, T.M., Antoniou, M.G., Kaloudis, T., Dionysiou, D.D., Eds.; John Wiley & Sons Ltd.: Hoboken, NJ, USA, 2020; pp. 37–68. [Google Scholar]
- Zanchett, G.; Oliveira-Filho, E.C. Cyanobacteria and Cyanotoxins: From Impacts on Aquatic Ecosystems and Human Health to Anticarcinogenic Effects. Toxins 2013, 5, 1896–1917. [Google Scholar] [CrossRef] [PubMed]
Figure 1.
Study sites in the Curonian Lagoon. The numbers indicate the sampling stations: Station 1—Nida, Station 2—Juodkrantė, Station 3—Dreverna, Station 4—Ventė, Station 5—Smiltynė.
Figure 1.
Study sites in the Curonian Lagoon. The numbers indicate the sampling stations: Station 1—Nida, Station 2—Juodkrantė, Station 3—Dreverna, Station 4—Ventė, Station 5—Smiltynė.

Figure 2.
Seasonal fluctuation of water temperature and salinity at different stations. Red line on the axes indicates the presence of ice cover in the Curonian lagoon.
Figure 2.
Seasonal fluctuation of water temperature and salinity at different stations. Red line on the axes indicates the presence of ice cover in the Curonian lagoon.

Figure 3.
Seasonal changes in the number of cyanometabolites (a), concentration of microcystin and anatoxin variants (b), cyanobacteria biomass and Chl a concentration (c) at St. 1.
Figure 3.
Seasonal changes in the number of cyanometabolites (a), concentration of microcystin and anatoxin variants (b), cyanobacteria biomass and Chl a concentration (c) at St. 1.

Figure 4.
Seasonal changes in the number of cyanometabolites (a), concentration of microcystin and anatoxin variants (b), cyanobacteria biomass and Chl a concentration (c) at St. 2.
Figure 4.
Seasonal changes in the number of cyanometabolites (a), concentration of microcystin and anatoxin variants (b), cyanobacteria biomass and Chl a concentration (c) at St. 2.

Figure 5.
Seasonal changes in the number of cyanometabolites (a), concentration of microcystin and anatoxin variants (b), cyanobacteria biomass and Chl a concentration (c) at St. 3.
Figure 5.
Seasonal changes in the number of cyanometabolites (a), concentration of microcystin and anatoxin variants (b), cyanobacteria biomass and Chl a concentration (c) at St. 3.

Figure 6.
Seasonal changes in the number of cyanometabolites (a), concentration of microcystin and anatoxin variants (b), cyanobacteria biomass and Chl a concentration (c) at St. 4.
Figure 6.
Seasonal changes in the number of cyanometabolites (a), concentration of microcystin and anatoxin variants (b), cyanobacteria biomass and Chl a concentration (c) at St. 4.

Figure 7.
Seasonal changes in the number of cyanometabolites (a), concentration of microcystin and anatoxin variants (b), cyanobacteria biomass and Chl a concentration (c) at St. 5.
Figure 7.
Seasonal changes in the number of cyanometabolites (a), concentration of microcystin and anatoxin variants (b), cyanobacteria biomass and Chl a concentration (c) at St. 5.

Figure 8.
The distribution of the NRPs (response variables, thin blue lines) in relation with the main potentially toxic cyanobacteria and abiotic factors (explanatory variables, solid red lines).
Figure 8.
The distribution of the NRPs (response variables, thin blue lines) in relation with the main potentially toxic cyanobacteria and abiotic factors (explanatory variables, solid red lines).

Publisher’s Note: MDPI stays neutral with regard to jurisdictional claims in published maps and institutional affiliations. |
© 2021 by the authors. Licensee MDPI, Basel, Switzerland. This article is an open access article distributed under the terms and conditions of the Creative Commons Attribution (CC BY) license (https://creativecommons.org/licenses/by/4.0/).
Share and Cite
MDPI and ACS Style
Pilkaitytė, R.; Overlingė, D.; Gasiūnaitė, Z.R.; Mazur-Marzec, H. Spatial and Temporal Diversity of Cyanometabolites in the Eutrophic Curonian Lagoon (SE Baltic Sea). Water 2021, 13, 1760. https://doi.org/10.3390/w13131760
AMA Style
Pilkaitytė R, Overlingė D, Gasiūnaitė ZR, Mazur-Marzec H. Spatial and Temporal Diversity of Cyanometabolites in the Eutrophic Curonian Lagoon (SE Baltic Sea). Water. 2021; 13(13):1760. https://doi.org/10.3390/w13131760
Chicago/Turabian StylePilkaitytė, Renata, Donata Overlingė, Zita Rasuolė Gasiūnaitė, and Hanna Mazur-Marzec. 2021. "Spatial and Temporal Diversity of Cyanometabolites in the Eutrophic Curonian Lagoon (SE Baltic Sea)" Water 13, no. 13: 1760. https://doi.org/10.3390/w13131760
Note that from the first issue of 2016, this journal uses article numbers instead of page numbers. See further details here.