
Hydroenergy Harvesting Assessment: The Case Study of Alviela River


1
CERIS, Instituto Superior Técnico, Universidade de Lisboa, 1049-001 Lisboa, Portugal
2
EPAL, Empresa Portuguesa de Águas Livres, 1800-031 Lisboa, Portugal
*
Author to whom correspondence should be addressed.
†
These authors contributed equally to this work.
Water 2021, 13(13), 1764; https://doi.org/10.3390/w13131764
Submission received: 12 May 2021
/
Revised: 17 June 2021
/
Accepted: 24 June 2021
/
Published: 26 June 2021
(This article belongs to the Special Issue Energy Recovery and Hybrid Solutions in the Water Sector)
Abstract
:The current paper aims to develop and to apply a methodology for assessing the hydroenergy harvesting potential in water systems taking into account both technical and economic aspects. The methodology is a five-step procedure: (i) data collection and analysis; (ii) technology identification; (iii) energy harvesting assessment; (iv) economic analysis; and (v) final recommendation of the technological solution. The case study is located in the water source of the Alviela River, in Portugal. The energy harvesting potential is assessed for three turbine types, adequate for the 2.5 m available head: two propeller turbines, with and without adjustable blades, and the Archimedes screw turbine. Results show that the most feasible solution is the Archimedes screw turbine, with 3 m/s rated discharge and 55 kW rated power, the capital cost of 160 k€, the internal rate of return above 10% and the payback period of eight years. This solution has the potential for harvesting energy in low-head sites with a wide range of flow rates.
1. Introduction
Residential, commercial and industrial water consumers rely on water supply system (WSS) to transport, treat, and distribute water from sources to consumers, in the required amount and adequate pressure, in order to maintain their daily activities [1]. In the processes of transport, treatment and distribution of water, WSS spend around 7% of the global energy consumption worldwide [2], being considered one of the most energy intensive sectors in industrialized regions [3]. Therefore, optimisation techniques, focusing on minimising the capital and maintenance costs, are commonly used in the planning and design of complex and large scale WSS [4]. As a result, optimised implementation techniques support the decisions of WSS managers in meeting daily operational objectives for reducing: the energy consumption [5], the chemical usage [6], the sludge disposal [7] and the green house gas (GHG) emissions [8]. Furthermore, water management towards smart cities is a growing issue bringing environmental sustainability for the sector [9].
Many water and wastewater utilities have already made an effort to assess energy efficiency through the calculation of water energy balances [10,11], and to reduce the consumption in the most energy-demanding processes, such as pumping and treatment, leaving a small margin for energy efficiency improvements. Even so, utility managers concerned with the environment and the sustainability of the planet are still looking for measures and opportunities to become more sustainable and environmentally friendlier. A very promising solution is the harvesting of the energy in excess by installing mini (100 kW–1 MW) or micro-hydropower plants (MHPs) (5–100 kW) [12]. These solutions should be considered in locations that combine excessive head, available physical space and, if possible, high and constant discharge [13]. The MHP convert the potential energy in free-surface flows, or the excessive pressure-head in pressurised systems, into kinetic energy and, then, into electric energy. Potential locations with excess energy in water [14] and wastewater [15] systems are: water sources; storage tanks inlets [16]; pressure reducing valves locations; and at the inlet, outlet or between processes in water and wastewater treatment plants [17].
Several hydro-turbine technologies can be used in MHP that can be divided into impulse turbines, which operate at atmospheric pressure (e.g., Pelton, Cross-flow or Archimedes screw turbines), and reaction turbines, which operate under pressure (e.g., Francis, propeller with fixed blades, Kaplan and Pump running as turbine). In addition, several unconventional solutions have been studied, such as: the use of tubular propeller turbine in pressurized systems [18] and the replacement of the pressure reducing valves by Pump running as turbine (PAT) [19]. Also, PATs have demonstrated to have capital costs of the MHP than the conventional turbines [20].
The turbine selection must attend to the range of available heads and discharges [21]. Turbines are characterised by hill charts with efficiency curves that specify the range of pressure head and discharge operation [22], being this curves described by Hermite polynominals [23]. The turbine selection should consider the best turbine type and rated conditions to meet the head and the discharge variation, since it affects the annual energy production and, consequently, the total revenues over the project lifetime [24].
WSS are complex systems in which the pressure head and discharge vary continuously and, for this reason, the chosen turbine operating range must fit these variations [25], being of the utmost importance to consider discharge variation and the respective effect on the available head and the turbine efficiency [26]. A very cost-effective technological solution for energy harvesting in water systems with low available head, for a wide range of discharges is the Archimedes screw turbine (AST) [27]. The AST is considered one of the first hydraulics machines, composed of a helical array of simple blades that wound on a central cylinder [4]. This solution is particularly adequate in locations with low heads (up to 10 m), very large discharge (up to 10 m/s per turbine), along with a large space for construction, being a particularly adequate solution for liquids transporting solid material [28].
The current paper aims to develop and demonstrate a detailed technical-economic feasibility study for installing a MHP. It includes a description of the proposed methodology for assessing energy harvesting potential and the expected capital costs and net revenues for the analysed solutions. The methodology is applied to a real-life case study located in a 2.5 m height weir in Alviela river at the WSS source. The AST solution is compared with other technologies typically used for energy harvesting for small heads. Several economic indicators are calculated. The main conclusions are drawn concerning the use of this solution in systems with low heads. The key innovative features are: (i) the description of a comprehensive methodology for energy harvesting assessment applicable to any water system, taking into account data records of available head and discharge, as well as, the turbine discharge-head-efficiency curves, (ii) the demonstration of the methodology in a real case study for three technological solutions (i.e., AST, Kaplan and the Propeller), particularly appropriate for low-heads; and (iii) the discussion of the advantages and drawbacks of each technological solution.
2. Methodology
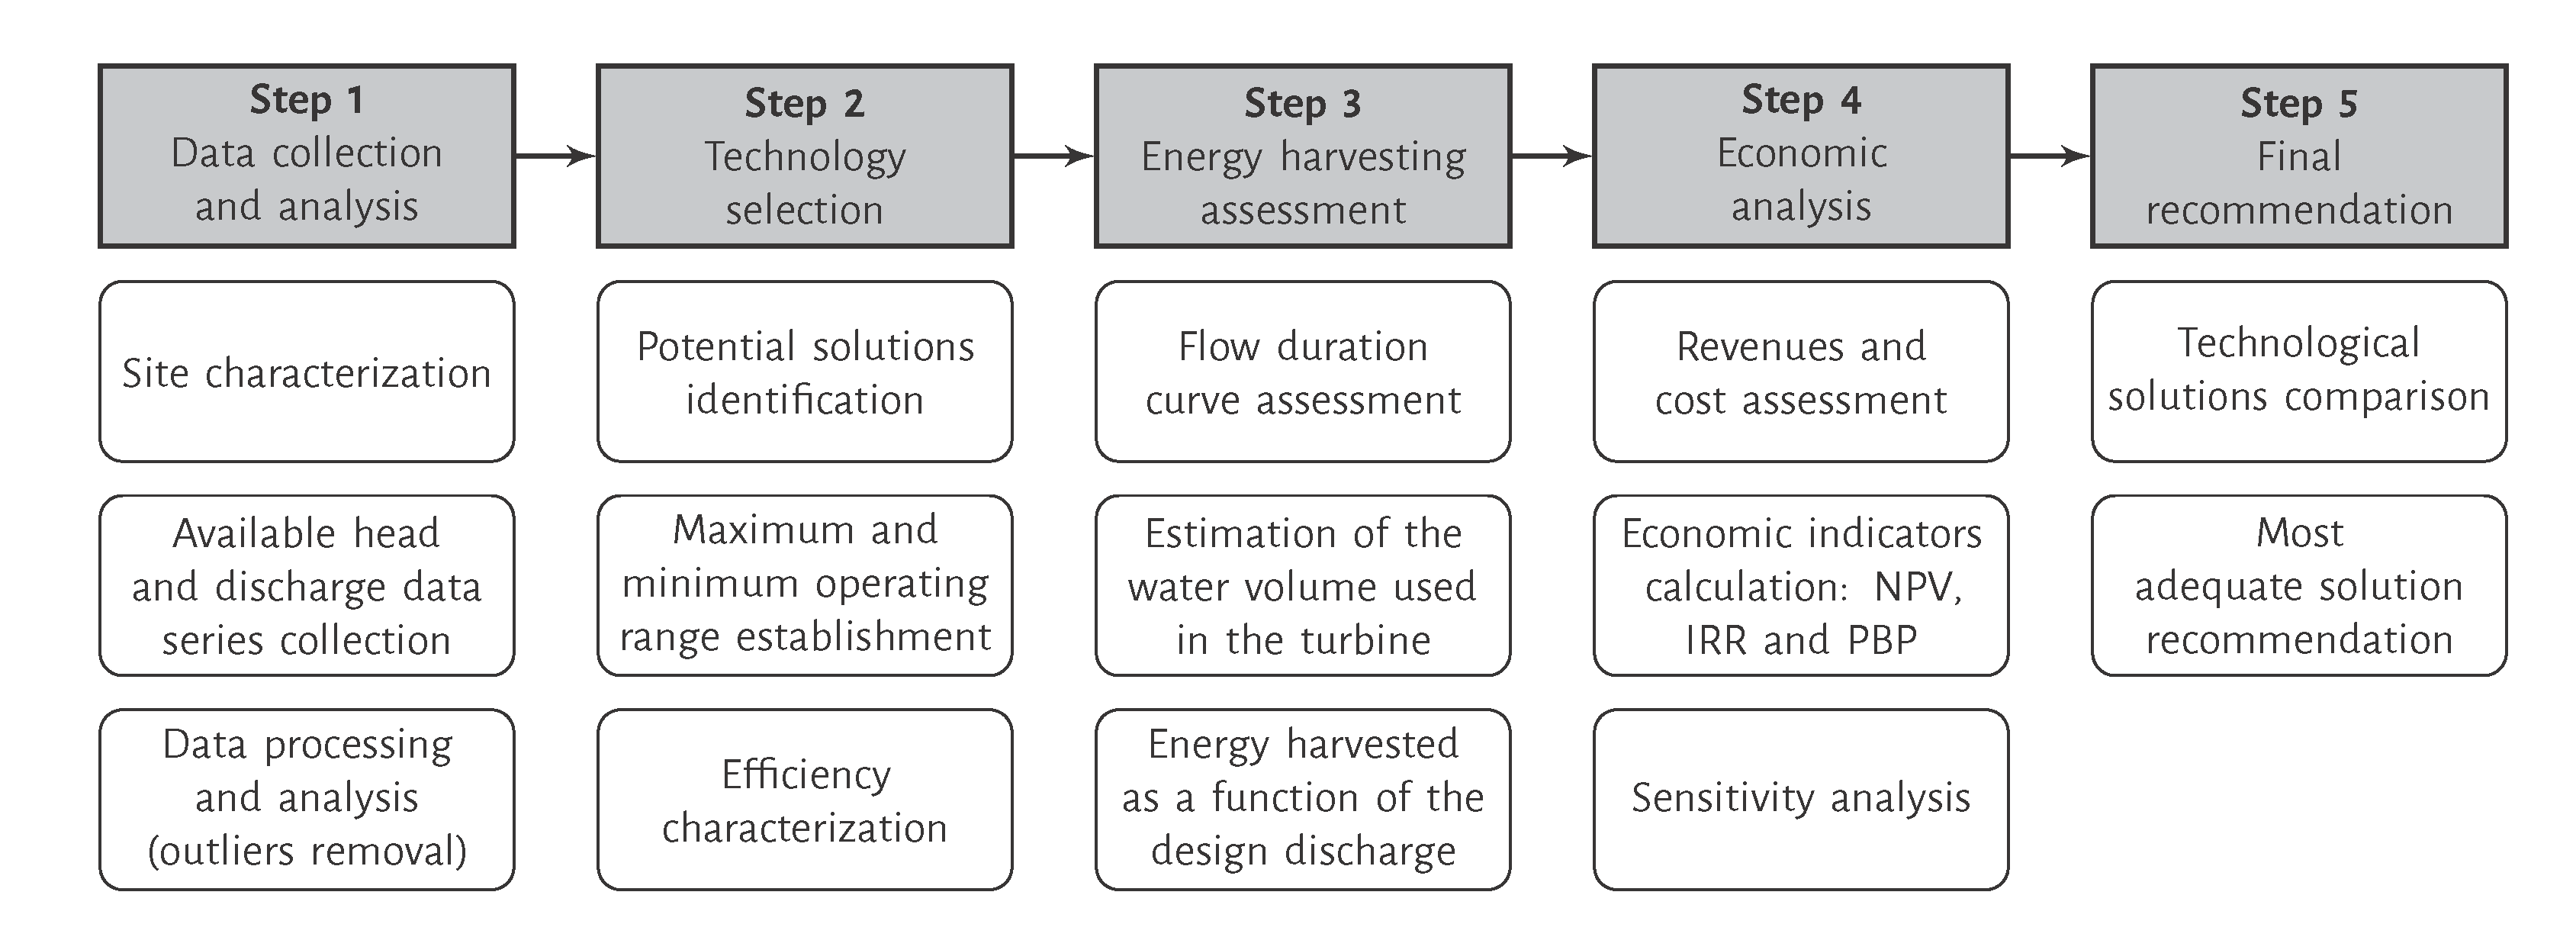
A comprehensive methodology for assessing the potential of hydroenergy harvesting in water and wastewater systems and for selecting the most adequate energy recovery technology, taking into account the technical and economic aspects is presented herein. The methodology is a five-step procedure (Figure 1): (i) data collection and analysis; (ii) technology selection; (iii) energy harvesting assessment; (iv) economic analysis; and (v) final recommendation. These steps are further described in the following paragraphs.
- Step 1
- consists of identifying the primary purpose of the water supply or collectors system, its main characteristics and the potential locations for energy harvesting, which must combine excessive head, large discharges and sufficient available space to install the powerhouse and the turbine. For the identified locations, available head and discharge data must be collected and should include, at least, three consecutive years representative of the system operation. If necessary, it should be identified, the derived discharge that cannot be turbined. Above all, the construction of MHP cannot compromise the primary purpose of the system, which can be the water supply or the wastewater drainage or treatment.
- Step 2
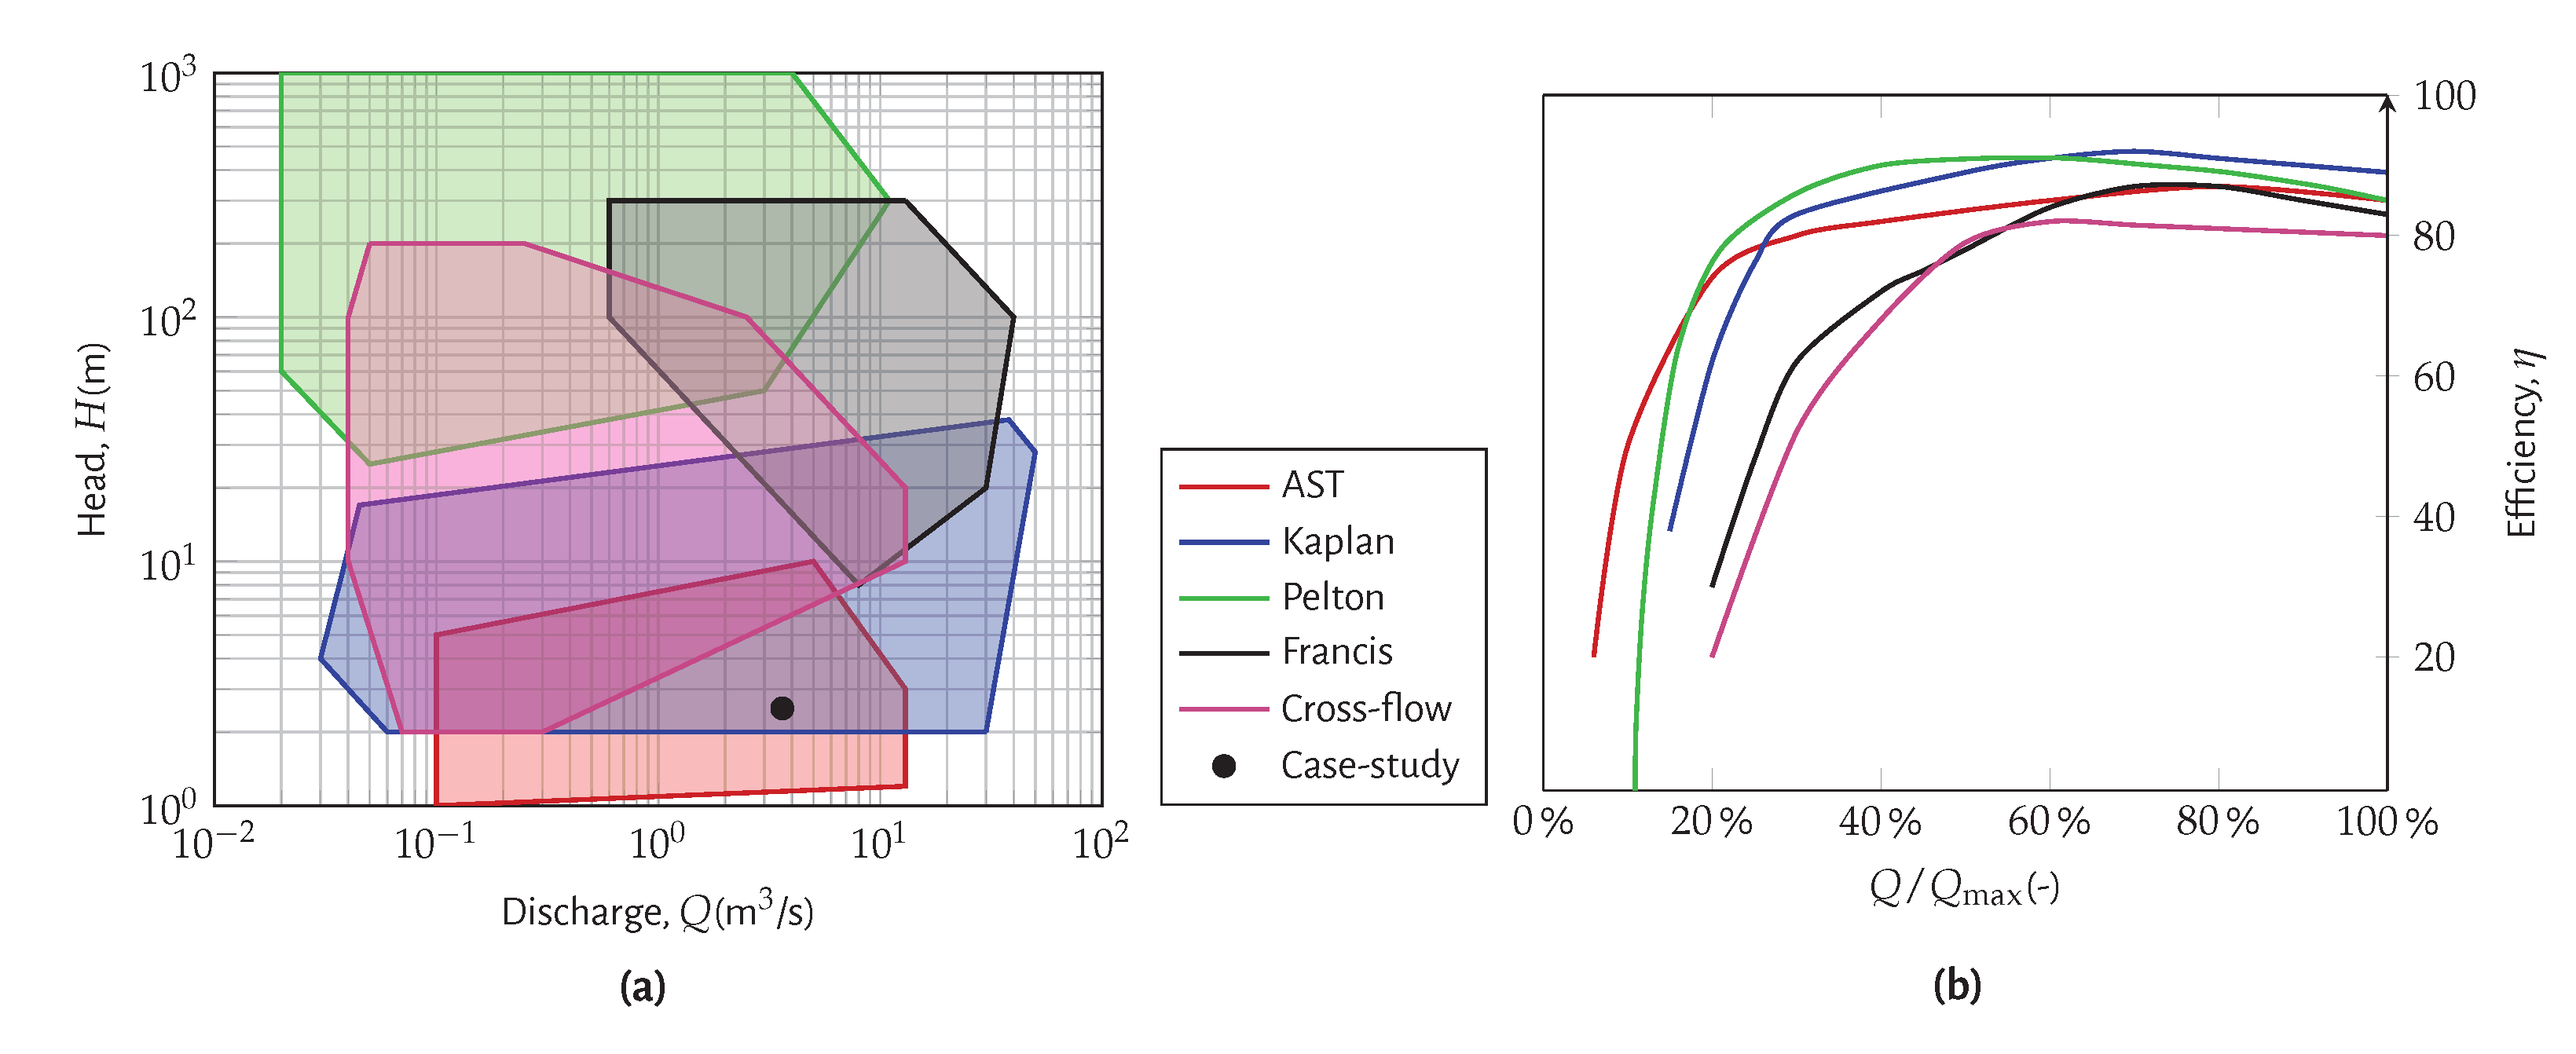
- focuses on the selection of possible technological solutions based on the available head and discharges range and the technical features of each solution. For this purpose, Figure 2a), which presents performance characteristics of possible solutions, can be used. Usually, the best solutions are: the AST, Kaplan, PAT, Cross-flow and waterwheel turbines for low-heads (1–20 m) [29]; PAT, Francis and Cross-flow turbines for medium heads (20–100 m); and Francis and Pelton turbines for high heads (>100 m). For each solution, the maximum and minimum operating ranges of heads and discharges as well as the efficiency curve versus discharge should be defined. Figure 2b) presents the variation of the turbine efficiency with the maximum discharge percentage for several turbines.
- Step 3
- consists of the simulation of the energy harvesting over one year for each energy recovery solution, considering the head and discharge data and different values of design discharge. The proposed method requires the following input data: the pressure head and discharge data over at least three consecutive years with a time-stamp that can vary between 15 min, in systems highly demand dependent (e.g., networks), and 1–5 days, in systems with high seasonal variation (e.g., transmission systems, storage tanks); the interval of acceptable design discharges; and the discharge range of operation of the turbine (Figure 2a).Initially, the discharge probability of occurrence curve is calculated over the assessment period (e.g., three years) based on discharge time history, and used to define the range of design discharges, . The annual energy harvesting is calculated for each design discharge, , taking into account the probability of occurrence curve.The turbined discharge at simulated time step is determined considering the following rules: (i) if the available discharge, , is higher than the maximum for the considered design discharged, than the turbine will only operate with and the remaining discharge will be derived through a bypass; (ii) if the available discharge, , is within the operating range of the turbine, , the turbine will use for energy production; and (iii) if the available discharge is lower than the minimum, the turbine will not operate.The annual harvested energy, E (kWh), for each design discharge, , is calculated by the time integration of the product of the available power, , by the respective efficiency for each discharge over one year:being the specific weight of water (9800 N/m), Q the turbined discharge (m/s), H the available net head (m), the efficiency of the turbine for the turbined discharge. The installed power, P(kW), is calculated as a function of the design discharge, , and design net head, :where is the efficiency for the design discharge and design net head.The annual volume used by the turbine, the annual harvested energy and the total power are calculated for each design discharge.
- Step 4
- consists of the economic analysis of the project based on the annual harvested energy for each design discharge. Capital costs, operation and maintenance (O&M) costs and gross and net revenues are calculated. Three economic indicators are typically used to evaluate the feasibility of the project: the net present value (NPV), the payback period (PBP) and the internal rate of return (IRR). These are calculated for each design discharge and for each selected turbine. The additional input data to calculate these indicators are: the discount rate, ; the project lifetime, n (years); the energy cost unit, (€/kWh); the capital cost (CC); and the annual O&M costs described as a percentage of CC. The CC includes the equipment control, management, civil works and turbine generator setup. The civil works and equipment costs can be estimated by using empirical equations for the initial costs [31] or cost estimations based on similar projects [32]. When only the turbine cost is known, the civil works’ cost can be estimated based on its weight on the total cost of the project and, then, estimated the CC [33]. The CC, net revenue, accumulated revenues over the period of analysis and the referred economic indicators are calculated for each design discharge and for each technological solution. These indicators will contribute to finding the best solution which corresponds to the maximum NPV of the project. Finally, a sensitivity analysis to the main uncertain parameters, such as the capital cost, the O&M costs and the discount rate, should be carried to assess their impact on the final decision.
- Step 5
- consists of the comparison of analysed technological solutions to select the best technical and economical option for energy harvesting in the analysed water system. The main parameters to be compared for each design discharge scenario are harvested energy, CC, PBP, NPV and IRR. The final solution is the one that leads to the highest NPV with an acceptable IRR (>10%) and an adequate payback period ideally lower than 10 years [34]. The project is only feasible, if the NPV is higher than zero, which means that the investment is recovered within the project lifetime. If the NPV is equal to zero, the investment cost is retrieved and the minimum rate of return of capital is achieved, so the profitability of the project is doubtful. If the NPV is negative, the project is financially impractical.It should be highlighted that the project design discharge depends not only on the energy harvested but also on the economic analysis, since higher discharges not only lead to higher revenues but also to higher capital and O&M costs.A computational tool has been implemented in MATLAB for carrying out the described simulations.
3. Case Study: Alviela River Source
3.1. Data Collection and Analysis
Empresa Portuguesa de Águas Livres (EPAL), the water utility responsible for supplying Lisbon, is concern with the environment and aims to be increasingly a Zero-Energy consumer. It has identified the water source of the Alviela transmission system, as a potential location for energy harvesting with a high seasonal discharge and 2–3 m of available head.
The Alviela river source, located in Santarém district, Portugal, is currently managed by EPAL. The Alviela transmission system, built in 1880, represented a significant water source for Lisbon and other neighbouring municipalities 40 years ago. The system includes the Alviela transmission system, with over 100 km of length and a transport capacity of 0.8 m/s. This system reduced its contribution to the Lisbon supply system when another transmission system, located closer to Lisbon, Castelo de Bode system, was built in 1987. Currently, the Alviela transmission system is operated only as a supply alternative in case of emergency, maintaining the ecological discharge in the river of 0.1 m/s (EPAL protocol, DRGN 1992). Nowadays, the created reservoir area is used for recreational purposes, as a fluvial beach.
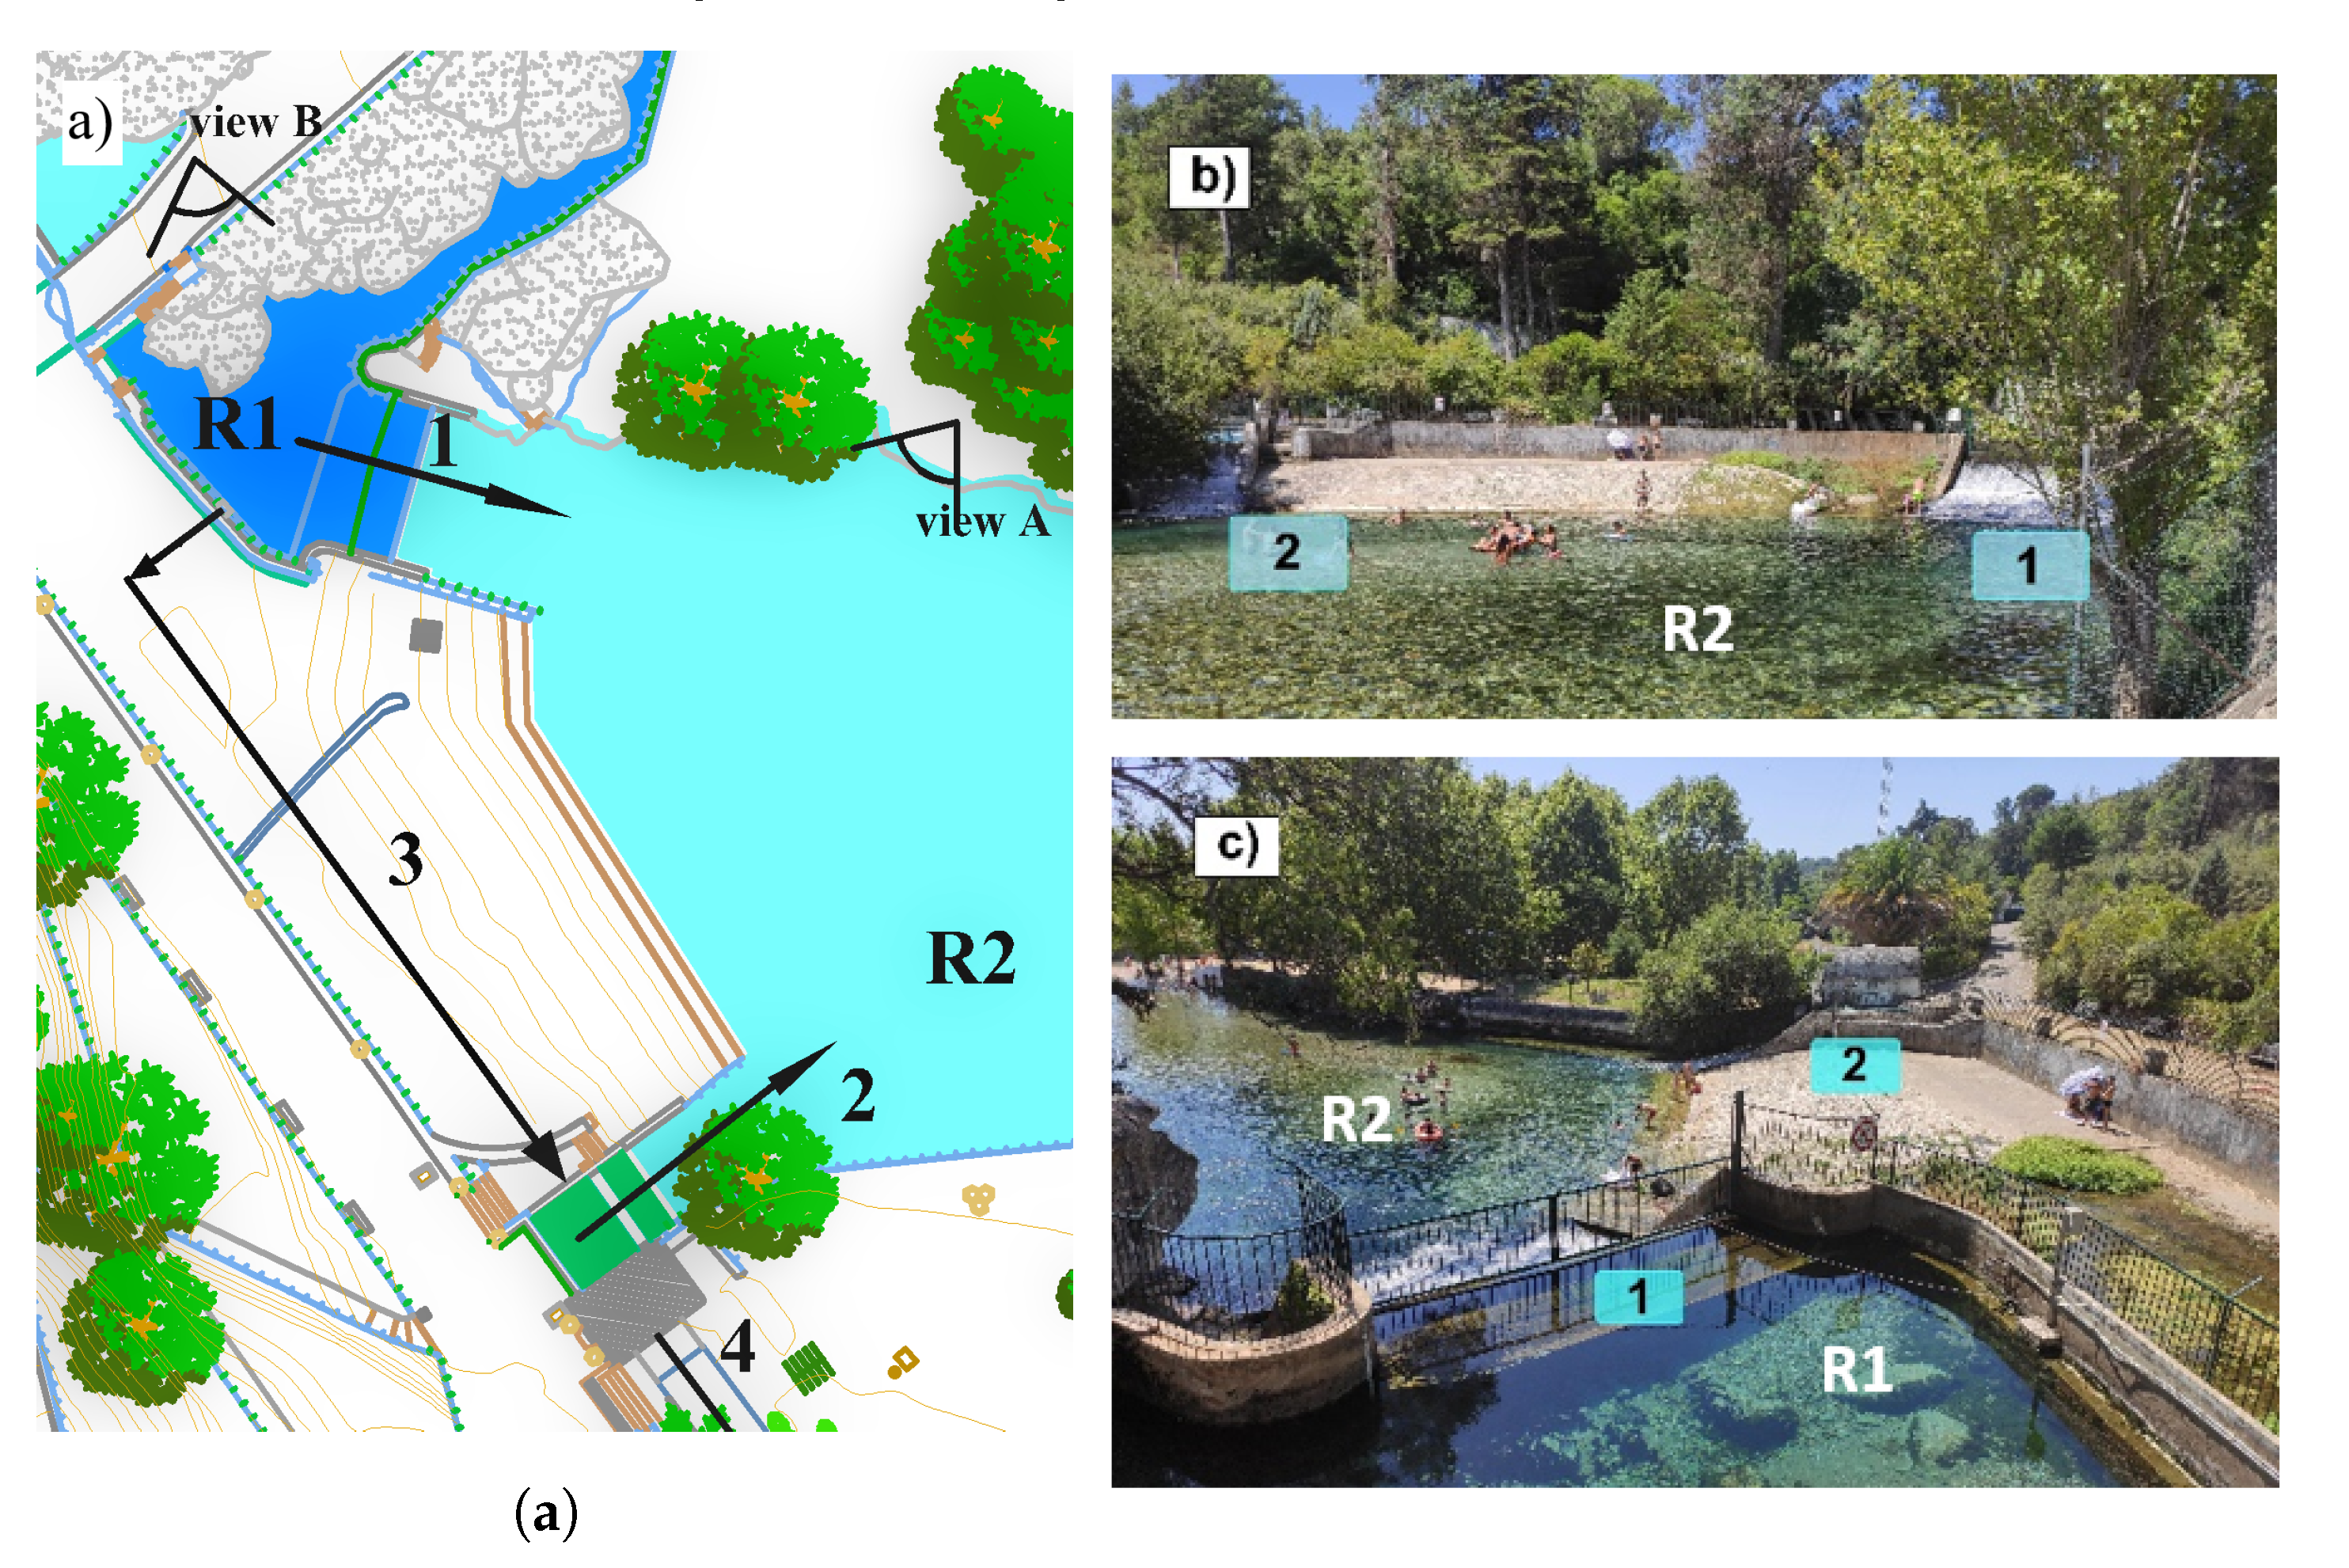
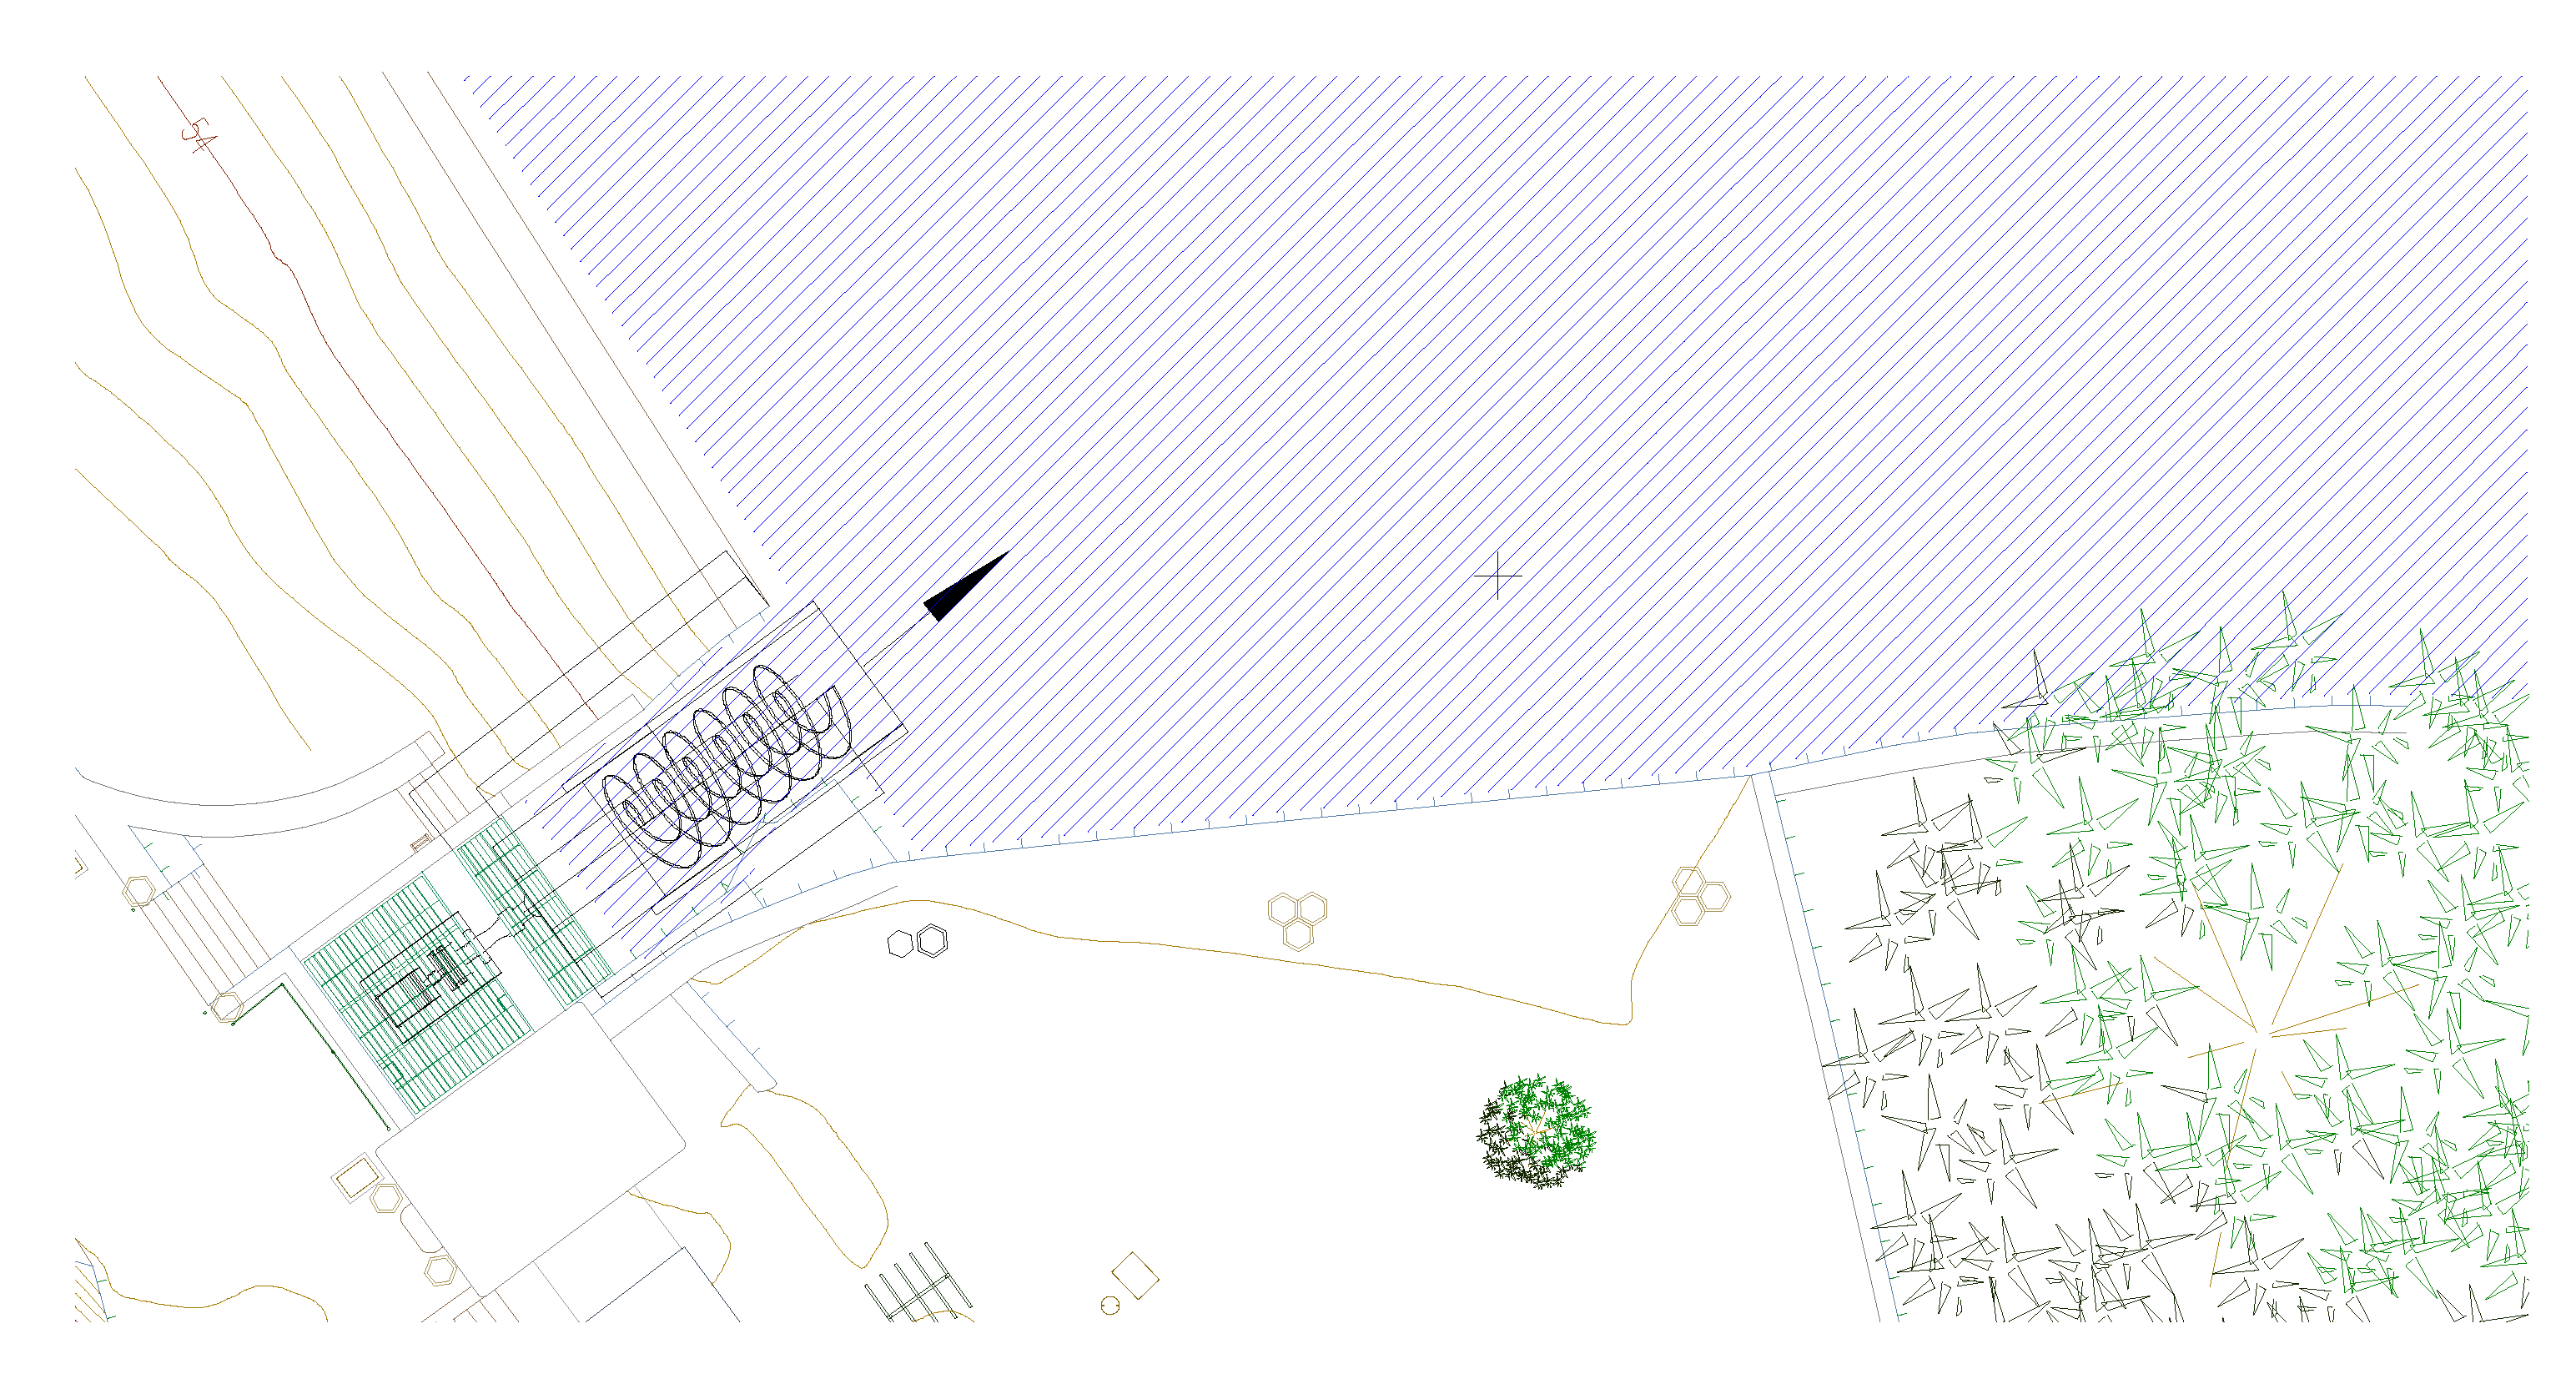
During this study, a topographic survey of the Alviela source area was carried out (Figure 3a). The Alviela river source has two small reservoirs (R1 and R2) and two weirs (1 and 2). Reservoir R1 has a weir (1) that discharges to the recreational area and is connected to the transmission system chamber by a 50 m pipe with 700 mm of diameter and controlled by a sluice-gate. The chamber has a valve to control the water that goes to the transmission system (4) and also a weir (2) that discharges the water in excess to the river. The location to install the MHP is in the second weir (2) that has 2.5 m of available head between the inlet chamber and the reservoir R2. Since the chamber elevation is higher than that of R2, the water used in energy harvesting cannot supply the transmission system.
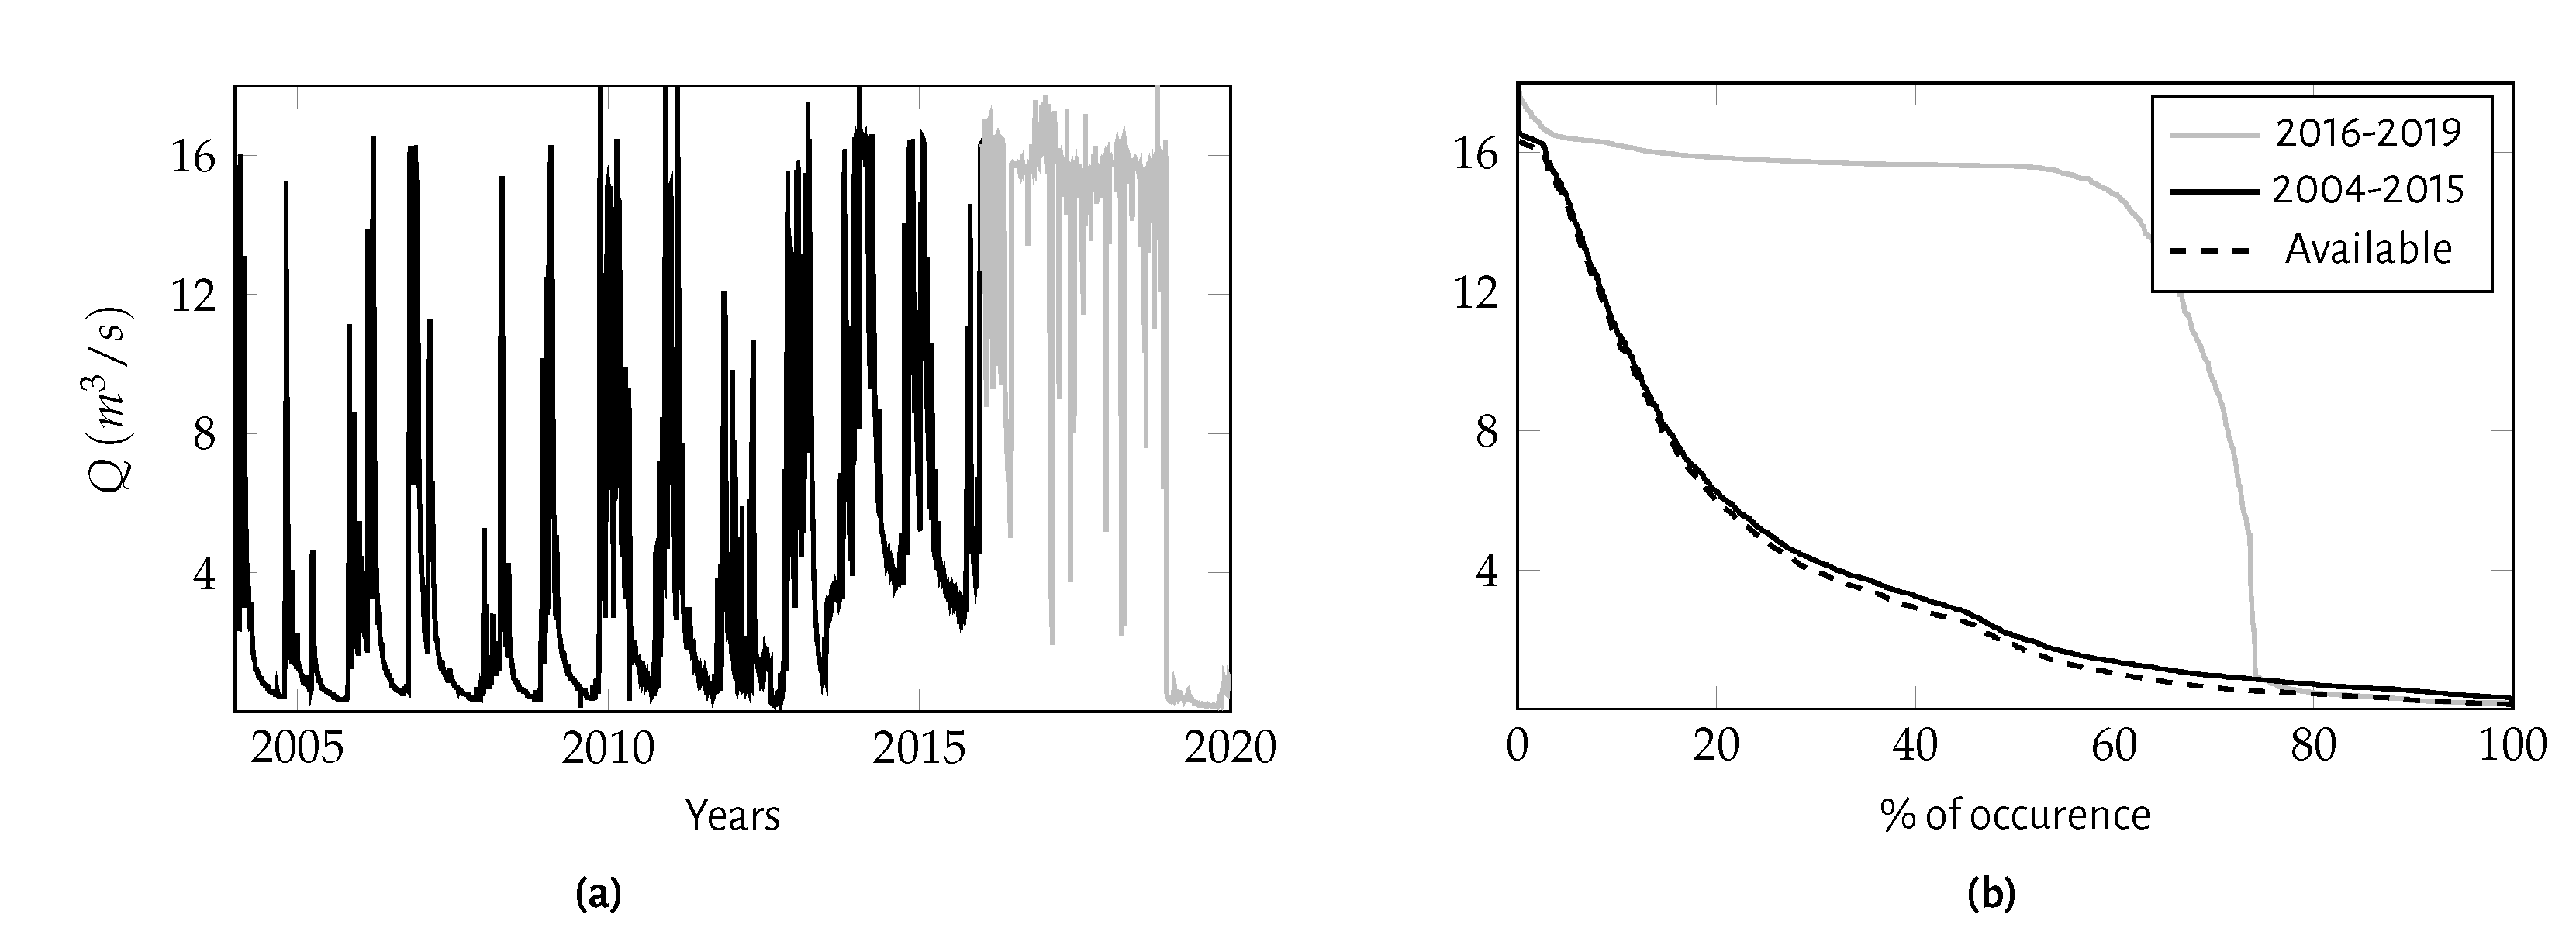
The analysis of the discharge data series between 2004–2019, provided by EPAL, has shown that the period of 2016–2019 had an anomalous behaviour (Figure 4), with an extremely high discharge in the summer season, not coherent with the precipitation data observed in nearby locations. Additionally, EPAL confirmed that the flowmeter had fallen from the support which has been repaired meanwhile. Thus, only the period 2004–2015 is considered in the analysis.
Four scenarios were considered for the water derived to the transmission system that could not be used for energy harvesting. The derived discharge is described as a percentage of the maximum capacity of the transmission system ( = 0.8 m/s), for dry and wet seasons. The available discharge for energy harvesting is given by difference between the observed discharge in 2004–2015 and the derived discharge for the transmission system considered equal to 50% and 75% of , in the wet and in the dry season, respectively. Other scenarios of derived discharges have been analysed, though the final results are scenario-independent.
The probability of occurrence curve obtained for the total discharge and for the potentially turbined discharges (available discharge) in the period 2004–2015 are depicted in Figure 4b). Minor differences are observed between these two curves since derived discharges to the transmission system (0.20 m/s in the wet season and 0.41 m/s in the dry season) are small compared with average discharge values (4 m/s).
3.2. Technology Selection
The technological solutions adequate for the available head (H = 2.5 m) and the available discharge range (0.5–16 m/s) can be obtained by using Figure 2a) (see black dot), resulting in Kaplan, Propeller and Archimedes screw turbines.
Based on turbiune manufacturer information, the AST turbine efficiency is high (80–85%) for a wide range of discharges (40–100% ); however, experience shows lower efficiencies in real systems (ca. 75%) [35]. Therefore, a constant efficiency of 75% is considered for 40–100% . Additionally, the AST does not operate for discharges lower than 20% , and in between 20–40% the efficiency varies linearly from 20–75%. The Kaplan turbine part-flow efficiency is estimated also based on manufacturers: the turbine can maintain a high efficiency (90%) for discharge ranges from 30 to 100% of the rated discharge. The Propeller has a high efficiency (90%) around the rated discharge; however, this efficiency drops very fast when the discharge deviates from this value. The considered efficiency curves for the referred three turbines correspond to those presented in Figure 2b).
3.3. Energy Harvesting Assessment
The developed technical-economical model is run to estimate the harvested energy for the design discharges between 1.5 to 15 m/s. Figure 5a) presents the available power, , probability of occurrence curves for one of the analysed technological solutions, the AST. For example, an AST with a design discharge of 1.5 m/s has an available power of 30.3 kW and can operate for more than 80% of the year, while a turbine with 15 m/s has an available power of 299.6 kW, though it can operate for less than 40% of the same period. The frequency of occurrence of 50% corresponds to 9.0 m/s and a maximum power of 182 kW.
The annual harvested energy, E, and the respective turbine operating time for each design discharge of the AST are presented in Figure 5b). The maximum value of harvested energy (E = 472 MWh/year) corresponds to a design discharge of 12 m/s and to more than 2200 h of operation. Despite = 12 m/s leading to the maximum energy harvesting, the optimal design discharge also depends on capital costs and on O&M benefits.
3.4. Economic Analysis
Economic analysis requires the calculation of the capital and O&M costs, gross and net revenues, as well as the economic indicators NPV, PBP, and IRR. Several assumptions are considered herein: (i) discount rate = 5%; (ii) project lifetime = 20 years; (iii) energy unit cost = 0.08753 €/kWh; (iv) annual O&M = defined as a percentage of the capital cost in MHP. The discount rate, project lifetime and unit energy cost are typical values used by EPAL. Different turbine manufacturers have been consulted to obtain the quotations for the electromechanics equipment (turbine-generator setup), for power ranges up to 150 kW. It was considered that the equipment corresponded to a percentage of the CC of the project [36]: ca. 50%, for the propeller, and to ca. 60% for the AST and the Kaplan turbine. This results in different unit CC for each turbine: 2, 3 and 4 k€/kW for the AST, the propeller turbine and the Kaplan turbine, respectively. Also, different annual O&M costs were established as a percentage of the CC based on EPAL experience for pumping equipment: 0.5% for the AST (as this requires very low maintenance), 2% for the propeller turbine (similar to small power pumps) and 4% for the Kaplan (similar to high power pumps).
In addition to the hydropower plant construction, it is also necessary to build a new 50-m pipe between reservoir R1 and the transmission system chamber for design discharges higher than 1.5 m/s, since this is the maximum transportation capacity of the existing 755 mm pipe.
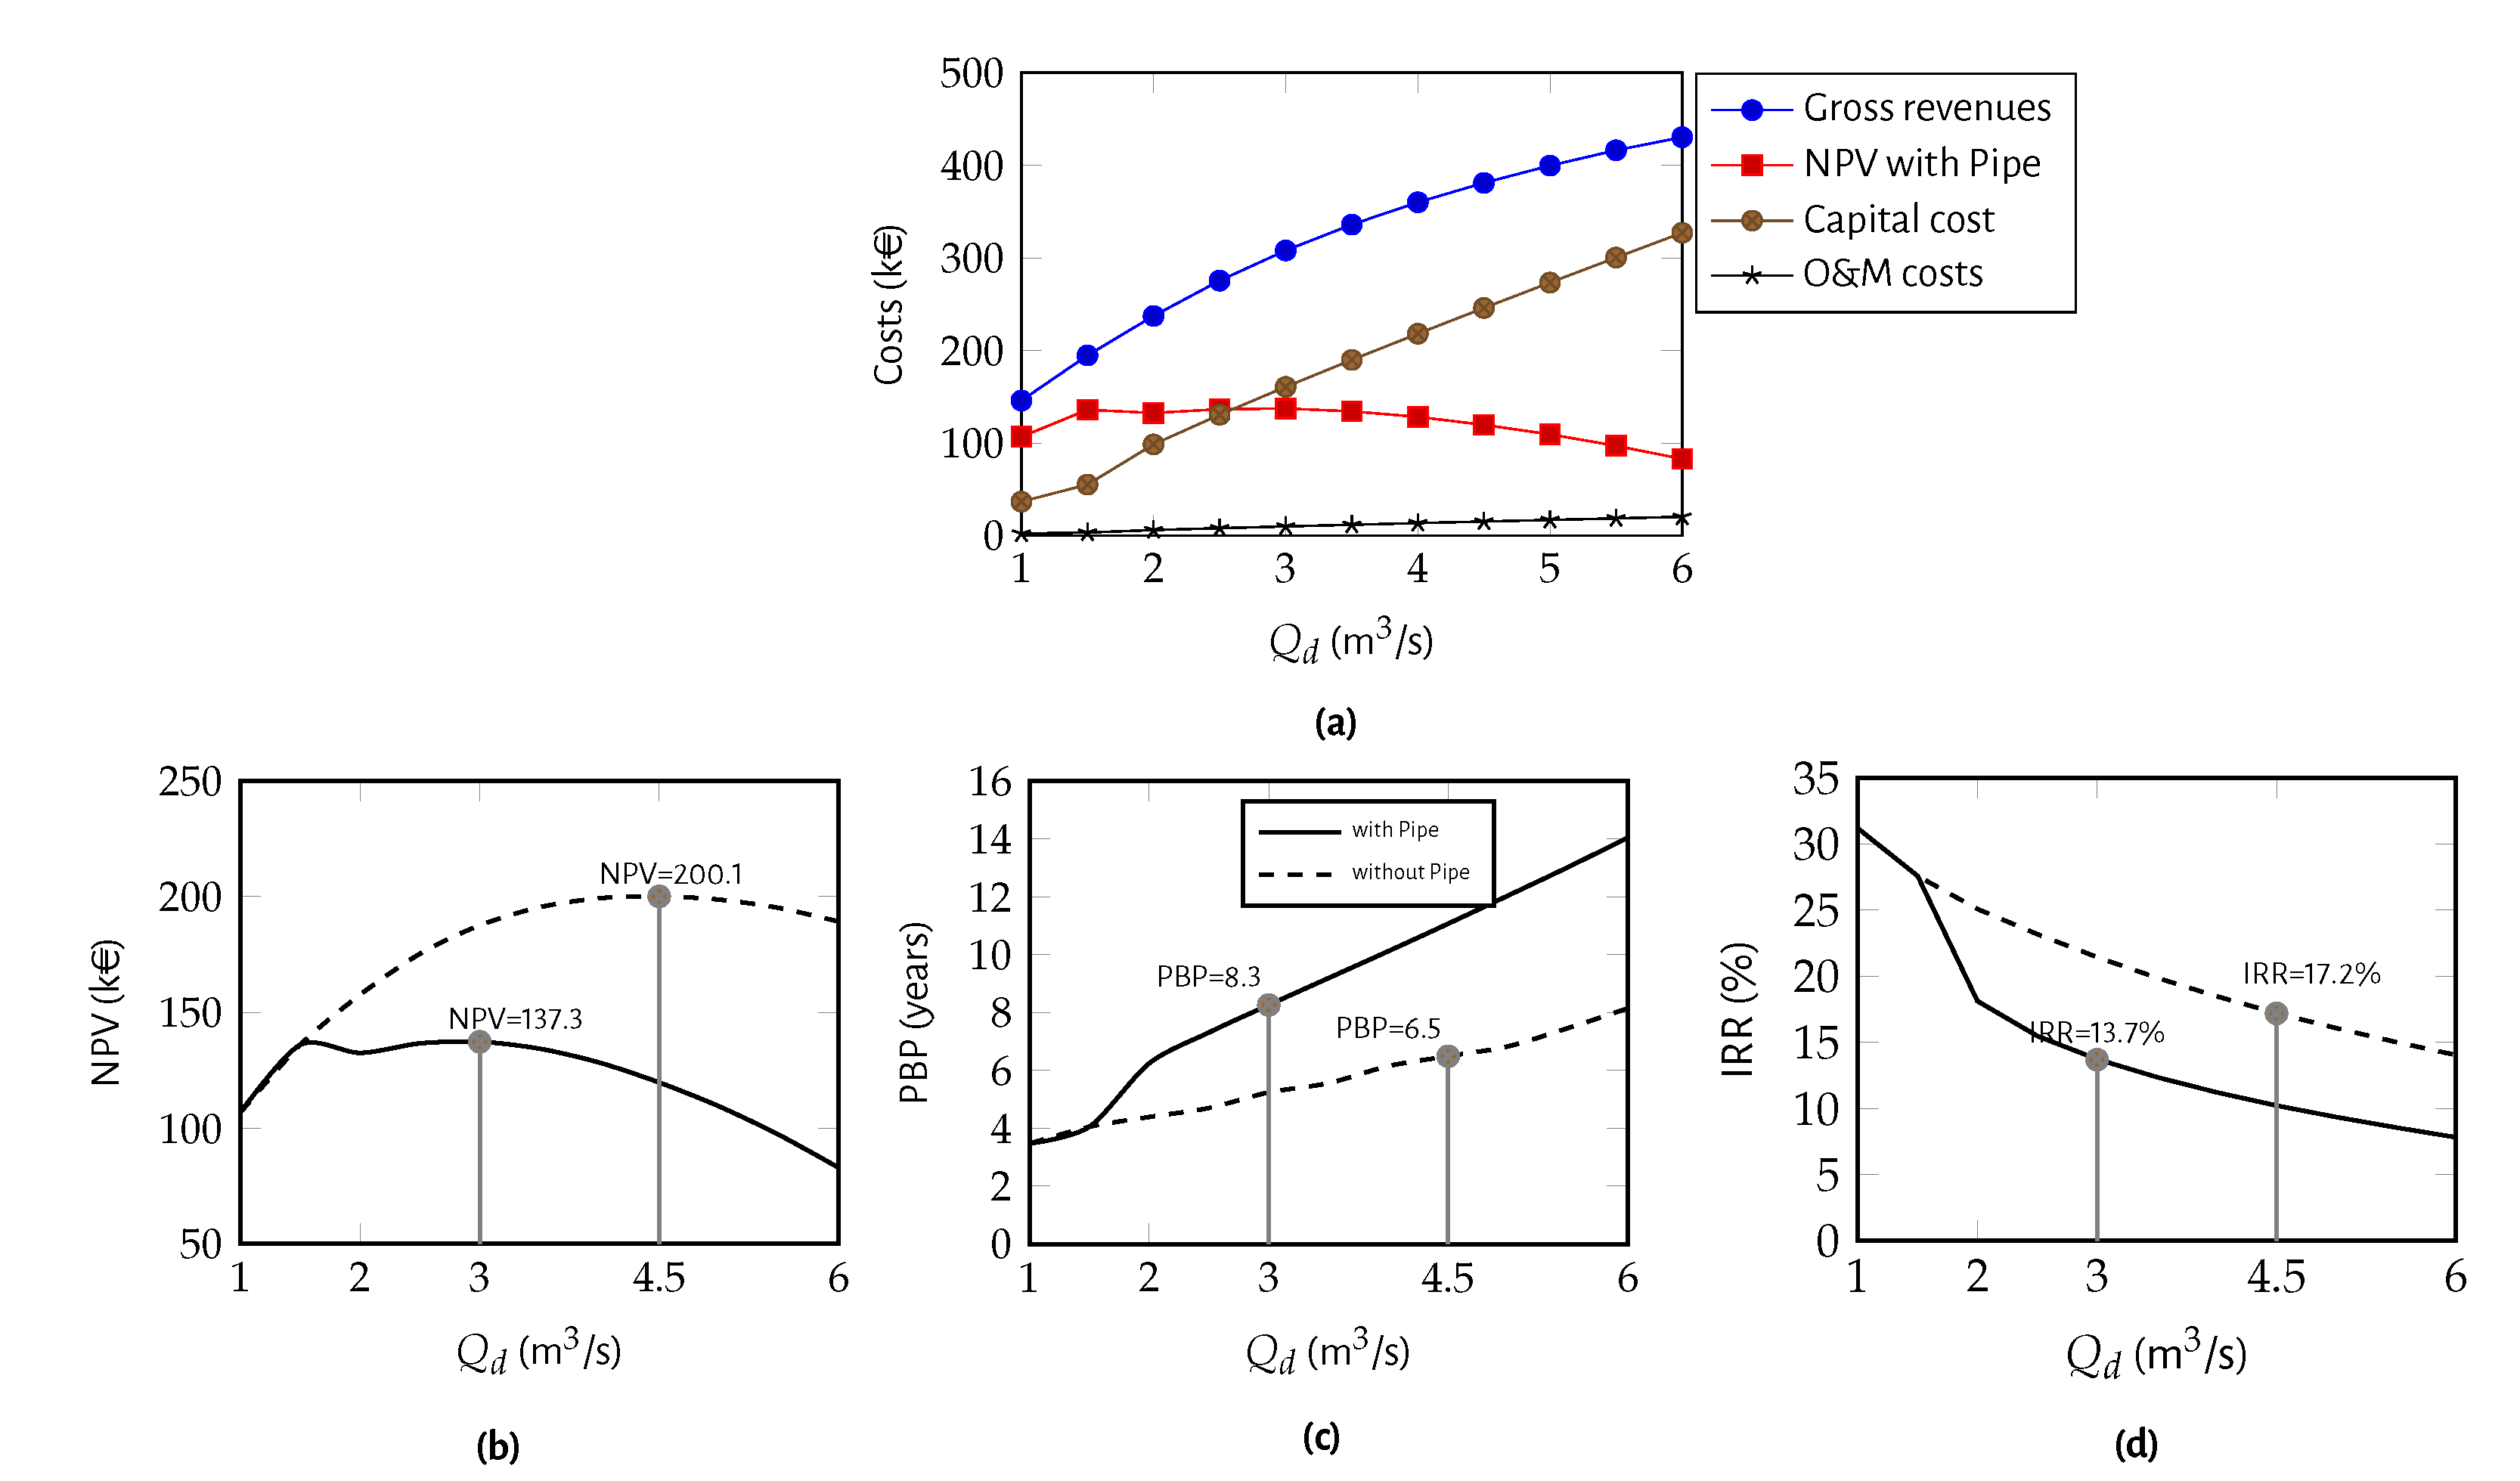
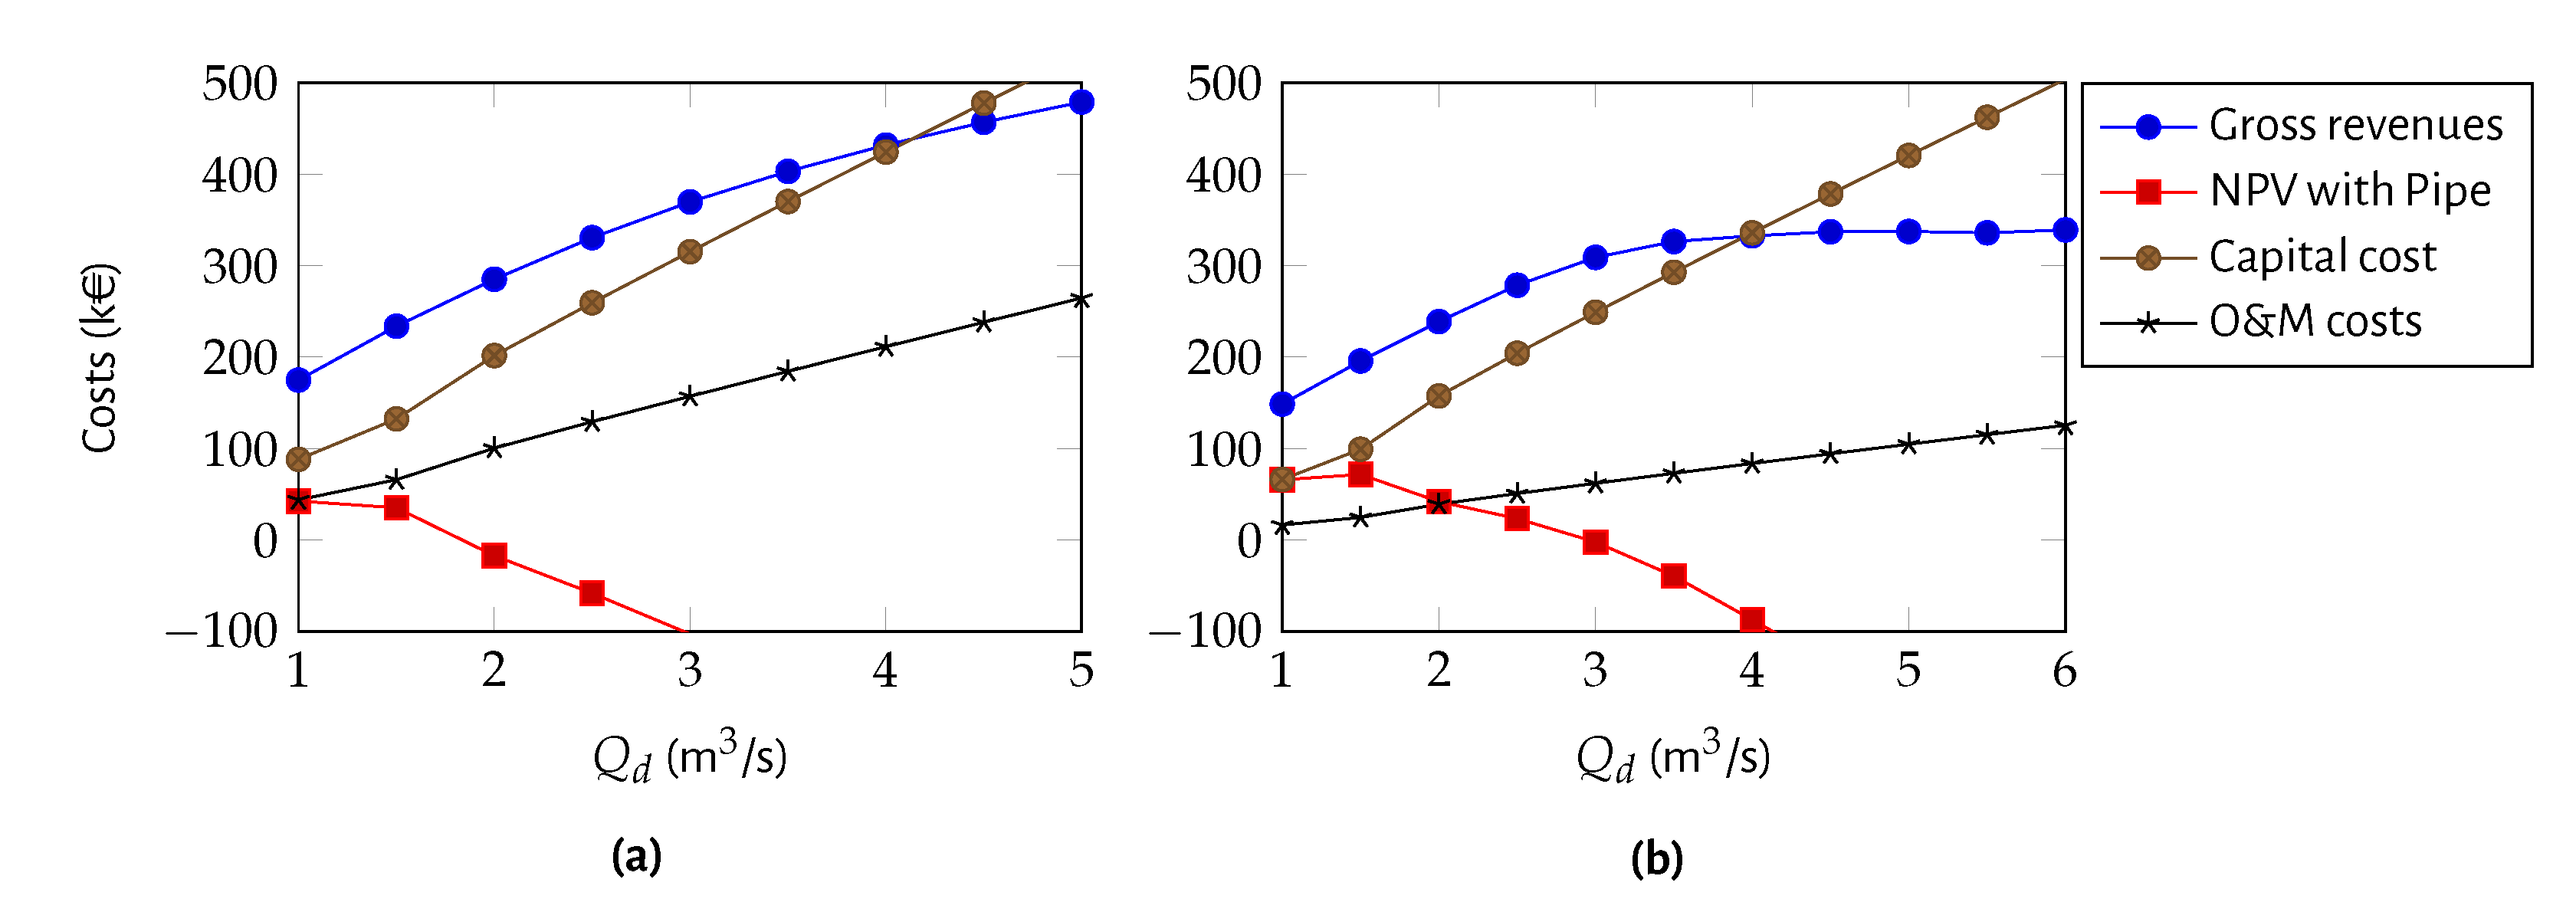
The obtained capital costs, O&M costs and gross revenues for the AST solution are presented in Figure 6a) as function of the design discharge, , and the respective NPV, PBP and IRR are presented in Figure 6b–d). These figures show the results with and without the construction of the pipe to better understand the effect of the pipe construction on the results for discharges higher than 1.5 m/s. The discharge that leads to the maximum NPV over 20 year-period (including the pipe construction) is 3 m/s, a value significantly lower than the one that allows the maximum energy harvesting (12 m/s). The corresponding PBP is 8 years (lower than 10 years, established as a threshold by EPAL) and the IRR is 13.74% (higher than 8%). If it was not necessary to build the 50 m pipe between R1 and the transmission system intake, the best design discharge would be higher (4.5 m/s) (see Figure 6b–d). The obtained capital costs, O&M costs, gross revenues and NPV for the Propeller and the Kaplan turbine solution are presented in Figure 7 as function of the design discharge. The MHP project is unfeasible for design discharges higher than 3 and 4 m/s, for the Propeller and the Kaplan solutions, respectively, being the respective design discharges 1.0 and 1.50 m/s.
3.5. Final Recommendation
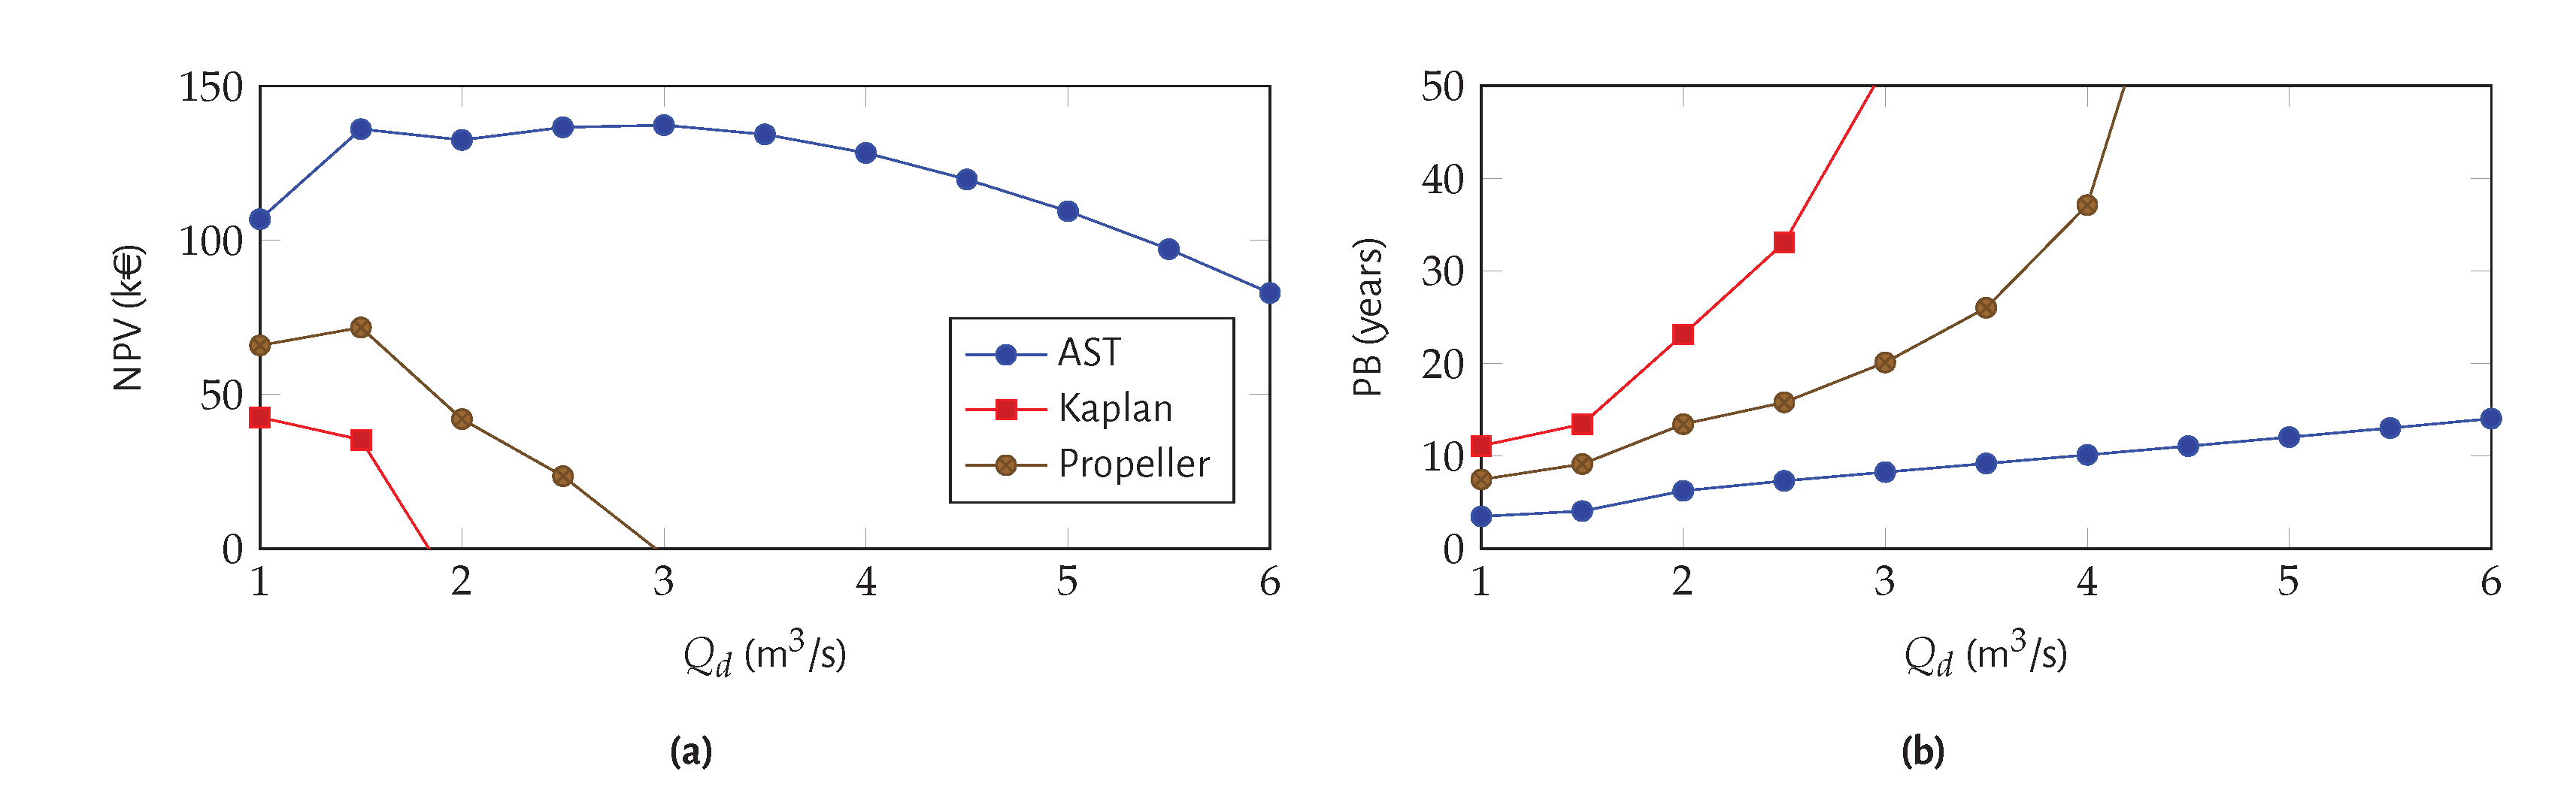
The three technological solutions have been calculated for design discharges between 1 and 6 m/s: AST and Kaplan and Propeller turbines. The latter two technologies have a higher efficiency than the AST, however these projects have higher associated capital and O&M costs. The comparison of obtained results in terms of NPV and PBP is presented in Figure 8 and in Table 1. The maximum NPV (Figure 8a) occurs for different design discharges depending on the technology, namely = 3 m/s for AST, = 1.0 m/s for Kaplan turbine and = 1.5 m/s for Propeller turbine. The Archimedes screw and the Propeller turbines are the options that fulfil the 10 years maximum payback period (Figure 8b) established by the water utility; thus, the Kaplan turbine solution is discarded. The AST is the one that has the highest capital cost, but also the highest NPV at the end of the project lifetime.
The best solution obtained for each technology is presented in Table 1. The Kaplan turbine is the technology that operates more time, due to its wide range of discharges, yet, it has the lowest NPV, the highest PBP and the lowest IRR due to its high capital and O&M costs. The Propeller turbine solution recovers almost the same energy as AST, but operates less time, due to the limited range of discharge. The AST solution is the one that has the lowest capital cost, the highest NPV and IRR and the lowest PBP. The AST with a design discharge of 3.0 m/s leads to a NPV of 137.3 k€ in 20 years with a PBP of 8.3 years and an IRR of 13.7% (Figure 6). This solution corresponds to a rated power of 55 kW, harvested energy of 282 MWh/year and a capital cost of 160.7 k€. Figure 5b) shows that the turbine can operate with a maximum power of 61 kW during 36% of the year and this power gradually decreases until 71% of the time. This means that the turbine will not be used during 29% of the year.
Despite having a lower efficiency, the AST has a lower unit capital cost (2 M€/MW) and also a lower annual O&M costs (0.5% of capital cost/year) than the other two propeller turbines. The increased harvested energy of Kaplan and Propeller turbines due to the higher efficiency (Figure 2a) does not compensate the increase of investment when compared to the AST.
Since the capital cost increases with the turbine power, the technical analysis results in higher discharges maximizing the harvested energy, while the economic analysis maximizes the net cash flows (revenues minus costs). Despite the produced energy increasing with the discharge until it reaches 12.0 m/s, the capital cost increases faster. The final design discharge should be decided by the water utility manager based on the overall analysis.
Concerning the physical characteristics of the AST, based on manufacturer information of 3.0 m/s, the diameter can vary from 2.6 and 2.8 m for the angles of the turbine axis with the horizontal plane of 22° and 30°, respectively. The values for length and axis angle depend on the local characteristics and on the turbine manufacturer. According to the topographic survey, the weir width in Alviela water source is 4.2 m and the available length is around 13.0 m, so that the AST can be installed in any of the referred diameters or angles. (Figure 9 presents a schematic view of the Archimedes screw installation in the site. The project is not constructed yet and this research has been carried out in scope of a Master Thesis to support the strategic decision plan of EPAL.
4. Conclusions
This research work describes and demonstrates with a case study the application of a methodology for assessing the technical and economic feasibility of energy recovery in water systems. The recommended solution, the AST, has a rated power of 55 kW, a rated discharge of 3 m/s and a rated head of 2.5 m. Assuming an average efficiency of 75%, this turbine can harvest 282 MWh of energy per year, even when observing a considerable discharge variation, and the project involves 160 k€ investment. Despite the Archimedes screw turbine lower efficiency and the need of more space for installation when compared with the other two solutions, Kaplan and Propeller, this turbine can operate for a wide range of discharges and is available for very-low heads, making it a desirable option for water systems and for wastewater treatment plants. Additionally, this solution has lower unit costs and lower O&M costs, making it a promising technology to explore the energy harvesting potential in the existing water systems with low heads.
Energy harvesting in the water industry is a growing area, that has raised interest of many recent research studies and real life projects. This is due to the existing energy harvesting potential and the need for making the industry more sustainable and energy-effcient. The most promising technology for the case study of Alviela is the Archimedes screw turbine, which is a relatively new technology, when operating as a turbine and not as a pump, never applied in Portugal.
The Águas de Portugal (AdP) Group, being EPAL one of its holdings, operates nationwide providing services to the municipalities, managing the multi-municipal systems and directly serving their populations for water supply and sanitation. The AdP Group has established a goal to achieve carbon neutrality by 2030 and has developed a ZERO Energy Neutrality Programme to reduce energy consumption and to boost the renewable energy production from biogas, wind, hydro and solar power. This programme includes the installation of hydropower plants with a total capacity of 6.9 MW with an estimated production of 45.0 GWh/year. Many of these hydropower plant locations have high discharges and low heads, like the presented case study. This paper compares traditional turbine solutions with the AST, highlighting the main differences and showing that the AST is a promising and cost effective technology for harvesting energy at locations with low heads (up to 10 m) and high discharges, such as, water river intakes and water and wastewater treatment facilities.
Author Contributions
Conceptualization, P.F.G.O., N.M.C.M. and D.C.; methodology, P.F.G.O. and D.C.; software, P.F.G.O., N.M.C.M. and D.C.; validation, P.F.G.O., N.M.C.M., P.F. and D.C.; formal analysis, N.M.C.M. and D.C.; investigation, P.F.G.O., N.M.C.M., P.F. and D.C.; resources, P.F. and D.C.; data curation, N.M.C.M.; writing—original draft preparation, P.F.G.O.; writing—review and editing, P.F.G.O., N.M.C.M., P.F. and D.C.; visualization, P.F., N.M.C.M. and D.C.; supervision, N.M.C.M. and D.C.; project administration, D.C.; funding acquisition, D.C. All authors have read and agreed to the published version of the manuscript.
Funding
The authors acknowledge Fundação para a Ciência e Tecnologia (FCT) for funding the research Projects PTDC/ECI-EGC/32102/2017, iMIST—Improving Mixing in Storage Tanks for Safer Water Supply, and PTDC/HAR-HIS/28627/2017, HORTO AQUAM SALUTAREM—Water Wise in Gardens in the Early Modern Period.
Institutional Review Board Statement
Not applicable.
Data Availability Statement
The data presented in this study are available on request from the corresponding author.
Conflicts of Interest
The authors declare no conflict of interest.
References
- Panguluri, S.; Grayman, W.M.; Clark, R.M. Water Distribution System Analysis: Field Studies, Modeling and Management: A Reference Guide for Utilities; Report; U. S. Environmental Protection Agency: Washington, DC, USA, 2005.
- Coelho, B.; Andrade-Campos, A. Efficiency achievement in water supply systems—A review. Renew. Sustain. Energy Rev. 2014, 30, 59–84. [Google Scholar] [CrossRef]
- Carravetta, A.; Fecarotta, O.; Ramos, H.M.; Mello, M.; Rodriguez-Diaz, J.A.; Morillo, J.G.; Adeyeye, K.; Coughlan, P.; Gallagher, J.; McNabola, A. Reducing the Energy Dependency of Water Networks in Irrigation, Public Drinking Water, and Process Industry: REDAWN Project. Proceedings 2018, 2, 681. [Google Scholar] [CrossRef] [Green Version]
- Blinco, L.J.; Simpson, A.R.; Lambert, M.F.; Marchi, A. Comparison of pumping regimes for Water Distribution Systems to minimize cost and greenhouse gases. J. Water Resour. Plan. Manag. 2016. [Google Scholar] [CrossRef] [Green Version]
- Vieira, F.; Ramos, H.M. Hybrid solution and pump-storage optimization in water supply system efficiency: A case study. Energy Policy 2008, 36, 4142–4148. [Google Scholar] [CrossRef]
- Musz-Pomorska, A.; Widomski, M.K. Modelling Studies of Water Chlorination Efficiency in Municipal Water Supply Network. Ecol. Chem. Eng. A 2020, 27, 1–13. [Google Scholar] [CrossRef]
- Samaras, K.; Zouboulis, A.; Karapantsios, T.; Kostoglou, M. A CFD-based simulation study of a large scale flocculation tank for potable water treatment. Chem. Eng. J. 2010, 162, 208–216. [Google Scholar] [CrossRef]
- Wu, W.; Simpson, A.R.; Maier, H.R. Accounting for Greenhouse Gas Emissions in Multiobjective Genetic Algorithm Optimization of Water Distribution Systems. J. Water Resour. Plan. Manag. 2010, 136, 146–155. [Google Scholar] [CrossRef] [Green Version]
- Ramos, H.M.; McNabola, A.; López-Jiménez, P.A.; Pérez-Sánchez, M. Smart Water Management towards Future Water Sustainable Networks. Water 2019, 12, 58. [Google Scholar] [CrossRef] [Green Version]
- Mamade, A.; Loureiro, D.; Alegre, H.; Covas, D. A comprehensive and well tested energy balance for water supply systems. Urban Water J. 2017, 14, 853–861. [Google Scholar] [CrossRef]
- Mamade, A.; Loureiro, D.; Alegre, H.; Covas, D. Top-Down and Bottom-Up Approaches for Water-Energy Balance in Portuguese Supply Systems. Water 2018, 10, 577. [Google Scholar] [CrossRef] [Green Version]
- Mitrovic, D.; Chacón, M.C.; García, A.M.; Morillo, J.G.; Diaz, J.A.R.; Ramos, H.M.; Adeyeye, K.; Carravetta, A.; McNabola, A. Multi-Country Scale Assessment of Available Energy Recovery Potential Using Micro-Hydropower in Drinking, Pressurised Irrigation and Wastewater Networks, Covering Part of the EU. Water 2021, 13, 899. [Google Scholar] [CrossRef]
- Pérez-Sánchez, M.; Sánchez-Romero, F.; Ramos, H.; López-Jiménez, P. Energy Recovery in Existing Water Networks: Towards Greater Sustainability. Water 2017, 9, 97. [Google Scholar] [CrossRef] [Green Version]
- McNabola, A.; Coughlan, P.; Williams, A.P. Energy recovery in the water industry: An assessment of the potential of micro-hydropower. Water Environ. 2014, 294–304. [Google Scholar] [CrossRef]
- Mérida García, A.; Rodríguez Díaz, J.; García Morillo, J.; McNabola, A. Energy Recovery Potential in Industrial and Municipal Wastewater Networks Using Micro-Hydropower in Spain. Water 2021, 13, 691. [Google Scholar] [CrossRef]
- Monteiro, L.; Delgado, J.; Covas, D. Improved Assessment of Energy Recovery Potential in Water Supply Systems with High Demand Variation. Water 2018, 10, 773. [Google Scholar] [CrossRef] [Green Version]
- Power, C.; Coughlan, P.; McNabola, A. Microhydropower Energy Recovery at Wastewater-Treatment Plants: Turbine Selection and Optimization. J. Hydraul. Eng. ASCE 2016. [Google Scholar] [CrossRef]
- Samora, I.; Hasmatuchi, V.; Münch-Alligné, C.; Franca, M.J.; Schleiss, A.J.; Ramos, H.M. Experimental characterization of a five blade tubular propeller turbine for pipe inline installation. Renew. Energy 2016, 95, 356–366. [Google Scholar] [CrossRef]
- Fecarotta, O.; Aricò, C.; Carravetta, A.; Martino, R.; Ramos, H.M. Hydropower Potential in Water Distribution Networks: Pressure Control by PATs. Water Resour. Manag. 2014, 29, 699–714. [Google Scholar] [CrossRef]
- Carravetta, A.; Houreh, S.D.; Ramos, H.M. Pumps as Turbines—Fundamentals and Applications; Springer: Berlin, Germany, 2018. [Google Scholar]
- Crespo Chacón, M.; Rodríguez Díaz, J.A.; García Morillo, J.; McNabola, A. Hydropower energy recovery in irrigation networks: Validation of a methodology for flow prediction and pump as turbine selection. Renew. Energy 2020, 147, 1728–1738. [Google Scholar] [CrossRef]
- Delgado, J.; Ferreira, J.P.; Covas, D.I.C.; Avellan, F. Variable speed operation of centrifugal pumps running as turbines. experimental investigation. Renew. Energy 2019. [Google Scholar] [CrossRef]
- Delgado, J.; Andolfattoa, L.; Covas, D.I.C.; Avellan, F. Hill chart modelling using the Hermite polynomial chaos expansion for the performance prediction of pumps running as turbines. Energy Convers. Manag. 2019, 187, 578–592. [Google Scholar] [CrossRef]
- Elbatran, A.; Yaakob, O.; Ahmed, Y.M.; Shabara, H. Operation, performance and economic analysis of low head micro-hydropower turbines for rural and remote areas: A review. Renew. Sustain. Energy Rev. 2015, 40–50. [Google Scholar] [CrossRef]
- Bousquet, C.; Samora, I.; Manso, P.; Rossi, L.; Heller, P.; Schleiss, A.J. Assessment of hydropower potential in wastewater systems and application to Switzerland. Renew. Energy 2017, 113, 64–73. [Google Scholar] [CrossRef]
- Kaunda, C.S.; Kimambo, C.Z.; Nielsen, T.K. A technical discussion on microhydropower technology and its turbines. Renew. Sustain. Energy Rev. 2014, 35, 445–459. [Google Scholar] [CrossRef]
- Simmons, S.; Dellinger, G.; Lyons, M.; Terfous, A.; Ghenaim, A.; Lubitz, W.D. Effects of Inclination Angle on Archimedes Screw Generator Power Production with Constant Head. J. Hydraul. Eng. 2021, 147. [Google Scholar] [CrossRef]
- YoosefDoost, A.; Lubitz, W.D. Archimedes Screw Turbines: A Sustainable Development Solution for Green and Renewable Energy Generation—A Review of Potential and Design Procedures. Sustainability 2020, 12, 7352. [Google Scholar] [CrossRef]
- Loots, I.; Dijk, M.V.; Barta, B.; Vuuren, S.V.; Bhagwan, J. A review of low head hydropower technologies and applications in a South African context. Renew. Sustain. Energy Rev. 2015, 50, 1254–1268. [Google Scholar] [CrossRef] [Green Version]
- Waters, S.; Aggidis, G.A. Over 2000 years in review: Revival of the Archimedes Screw from Pump to Turbine. Renew. Sustain. Energy Rev. 2015, 51, 497–505. [Google Scholar] [CrossRef] [Green Version]
- Agarwal, S.S.; Kansal, M.L. Risk based initial cost assessment while planning a hydropower project. Energy Strategy Rev. 2020, 31. [Google Scholar] [CrossRef]
- Intralawan, A.; Smajgl, A.; McConnell, W.; Ahlquist, D.B.; Ward, J.; Kramer, D.B. Reviewing benefits and costs of hydropower development evidence from the Lower Mekong River Basin. Wiley Interdiscip. Rev. Water 2019. [Google Scholar] [CrossRef]
- Ramos, H. Guidelines for Design of Small Hydropower Plants; WREAN (Western Regional Energy Agency & Network) and DED (Department of Economic Development): Belfast, North Ireland, 2000; p. 210. [Google Scholar]
- Castro, R. Uma Introdução às Energias Renováveis: Eólica, Fotovoltaica e Minihídrica, 3rd ed.; IST Press: Palo Alto, CA, USA, 2018. (In Portuguese) [Google Scholar]
- Lashofer, A.; Hawle, W.; Kaltenberger, F.; Pelikan, B. Die Wasserkraftschnecke—Praxis, Prüfstand und Potenzial. Österreichische Wasser-und Abfallwirtschaft 2013, 65, 339–347. [Google Scholar] [CrossRef]
- Ogayar, B.; Vidal, P.G. Cost determination of the electro-mechanical equipment of a small hydro-power plant. Renew. Energy 2009, 34, 6–13. [Google Scholar] [CrossRef]
Figure 1.
Proposed methodology for energy harvesting assessment and technology selection.

Figure 2.
(a) Turbine range of operation; and (b) turbine efficiency curves (adapted from [30]).
Figure 2.
(a) Turbine range of operation; and (b) turbine efficiency curves (adapted from [30]).

Figure 3.
Alviela river source (a) catchments scheme; (b) view A and (c) view B (1—Weir 1; 2—Weir 2; 3—Pipe; 4—Alviela aqueduct inlet; R1-Upstream reservoir; R2-Downstream reservoir.
Figure 3.
Alviela river source (a) catchments scheme; (b) view A and (c) view B (1—Weir 1; 2—Weir 2; 3—Pipe; 4—Alviela aqueduct inlet; R1-Upstream reservoir; R2-Downstream reservoir.

Figure 4.
(a) Flow-rate data series and (b) duration flow-rate curves.

Figure 5.
Results for the AST: (a) operating discharge; and (b) annual harvested and operating time.
Figure 5.
Results for the AST: (a) operating discharge; and (b) annual harvested and operating time.

Figure 6.
AST economic analysis results as a function of the design discharge with and without the pipe cost: (a) CC, O&M costs, revenues and NPV; (b) NPV; (c) PBP; (d) IRR.
Figure 6.
AST economic analysis results as a function of the design discharge with and without the pipe cost: (a) CC, O&M costs, revenues and NPV; (b) NPV; (c) PBP; (d) IRR.

Figure 7.
Economic analysis results as a function of the design discharge with and without the pipe cost: (a) Kaplan, (b) Propeller.
Figure 7.
Economic analysis results as a function of the design discharge with and without the pipe cost: (a) Kaplan, (b) Propeller.

Figure 8.
Parameters comparison between AST, Kaplan and Propeller turbines; (a) NPV; (b) PBP.

Figure 9.
AST schematic installation–top view.


Table 1.
Technical and economic parameters comparison of optimal solutions for each turbine.
| Turbine | Qd (m3/s) | P (kW) | E (MWh/year) | Operation (h/year) | V (hm3) | Pipe (k€) | CC (k€) | O&M (k€/year) | Net Revenue (k€/year) | NPV (k€) | PBP (years) | IRR (%) |
|---|---|---|---|---|---|---|---|---|---|---|---|---|
| AST | 3 | 55 | 282 | 5183 | 55.98 | 50.4 | 160.7 | 0.8 | 23.9 | 137.3 | 8.3 | 13.7 |
| Kaplan | 1 | 22 | 160 | 7326 | 26.37 | 0 | 88.3 | 3.5 | 10.5 | 42.6 | 11.1 | 10.2 |
| Propeller | 1.5 | 33 | 179 | 5479 | 29.58 | 0 | 99.3 | 2.0 | 13.7 | 71.7 | 9.13 | 12.5 |
Publisher’s Note: MDPI stays neutral with regard to jurisdictional claims in published maps and institutional affiliations. |
© 2021 by the authors. Licensee MDPI, Basel, Switzerland. This article is an open access article distributed under the terms and conditions of the Creative Commons Attribution (CC BY) license (https://creativecommons.org/licenses/by/4.0/).
Share and Cite
MDPI and ACS Style
Oliveira, P.F.G.; Martins, N.M.C.; Fontes, P.; Covas, D. Hydroenergy Harvesting Assessment: The Case Study of Alviela River. Water 2021, 13, 1764. https://doi.org/10.3390/w13131764
AMA Style
Oliveira PFG, Martins NMC, Fontes P, Covas D. Hydroenergy Harvesting Assessment: The Case Study of Alviela River. Water. 2021; 13(13):1764. https://doi.org/10.3390/w13131764
Chicago/Turabian StyleOliveira, Pedro F. G., Nuno M. C. Martins, Pedro Fontes, and Dídia Covas. 2021. "Hydroenergy Harvesting Assessment: The Case Study of Alviela River" Water 13, no. 13: 1764. https://doi.org/10.3390/w13131764
Note that from the first issue of 2016, this journal uses article numbers instead of page numbers. See further details here.