
The Benthic Trophic Corner Stone Compartment in POPs Transfer from Abiotic Environment to Higher Trophic Levels—Trichoptera and Ephemeroptera Pre-Alert Indicator Role


Abstract
:1. Introduction
2. Materials and Methods
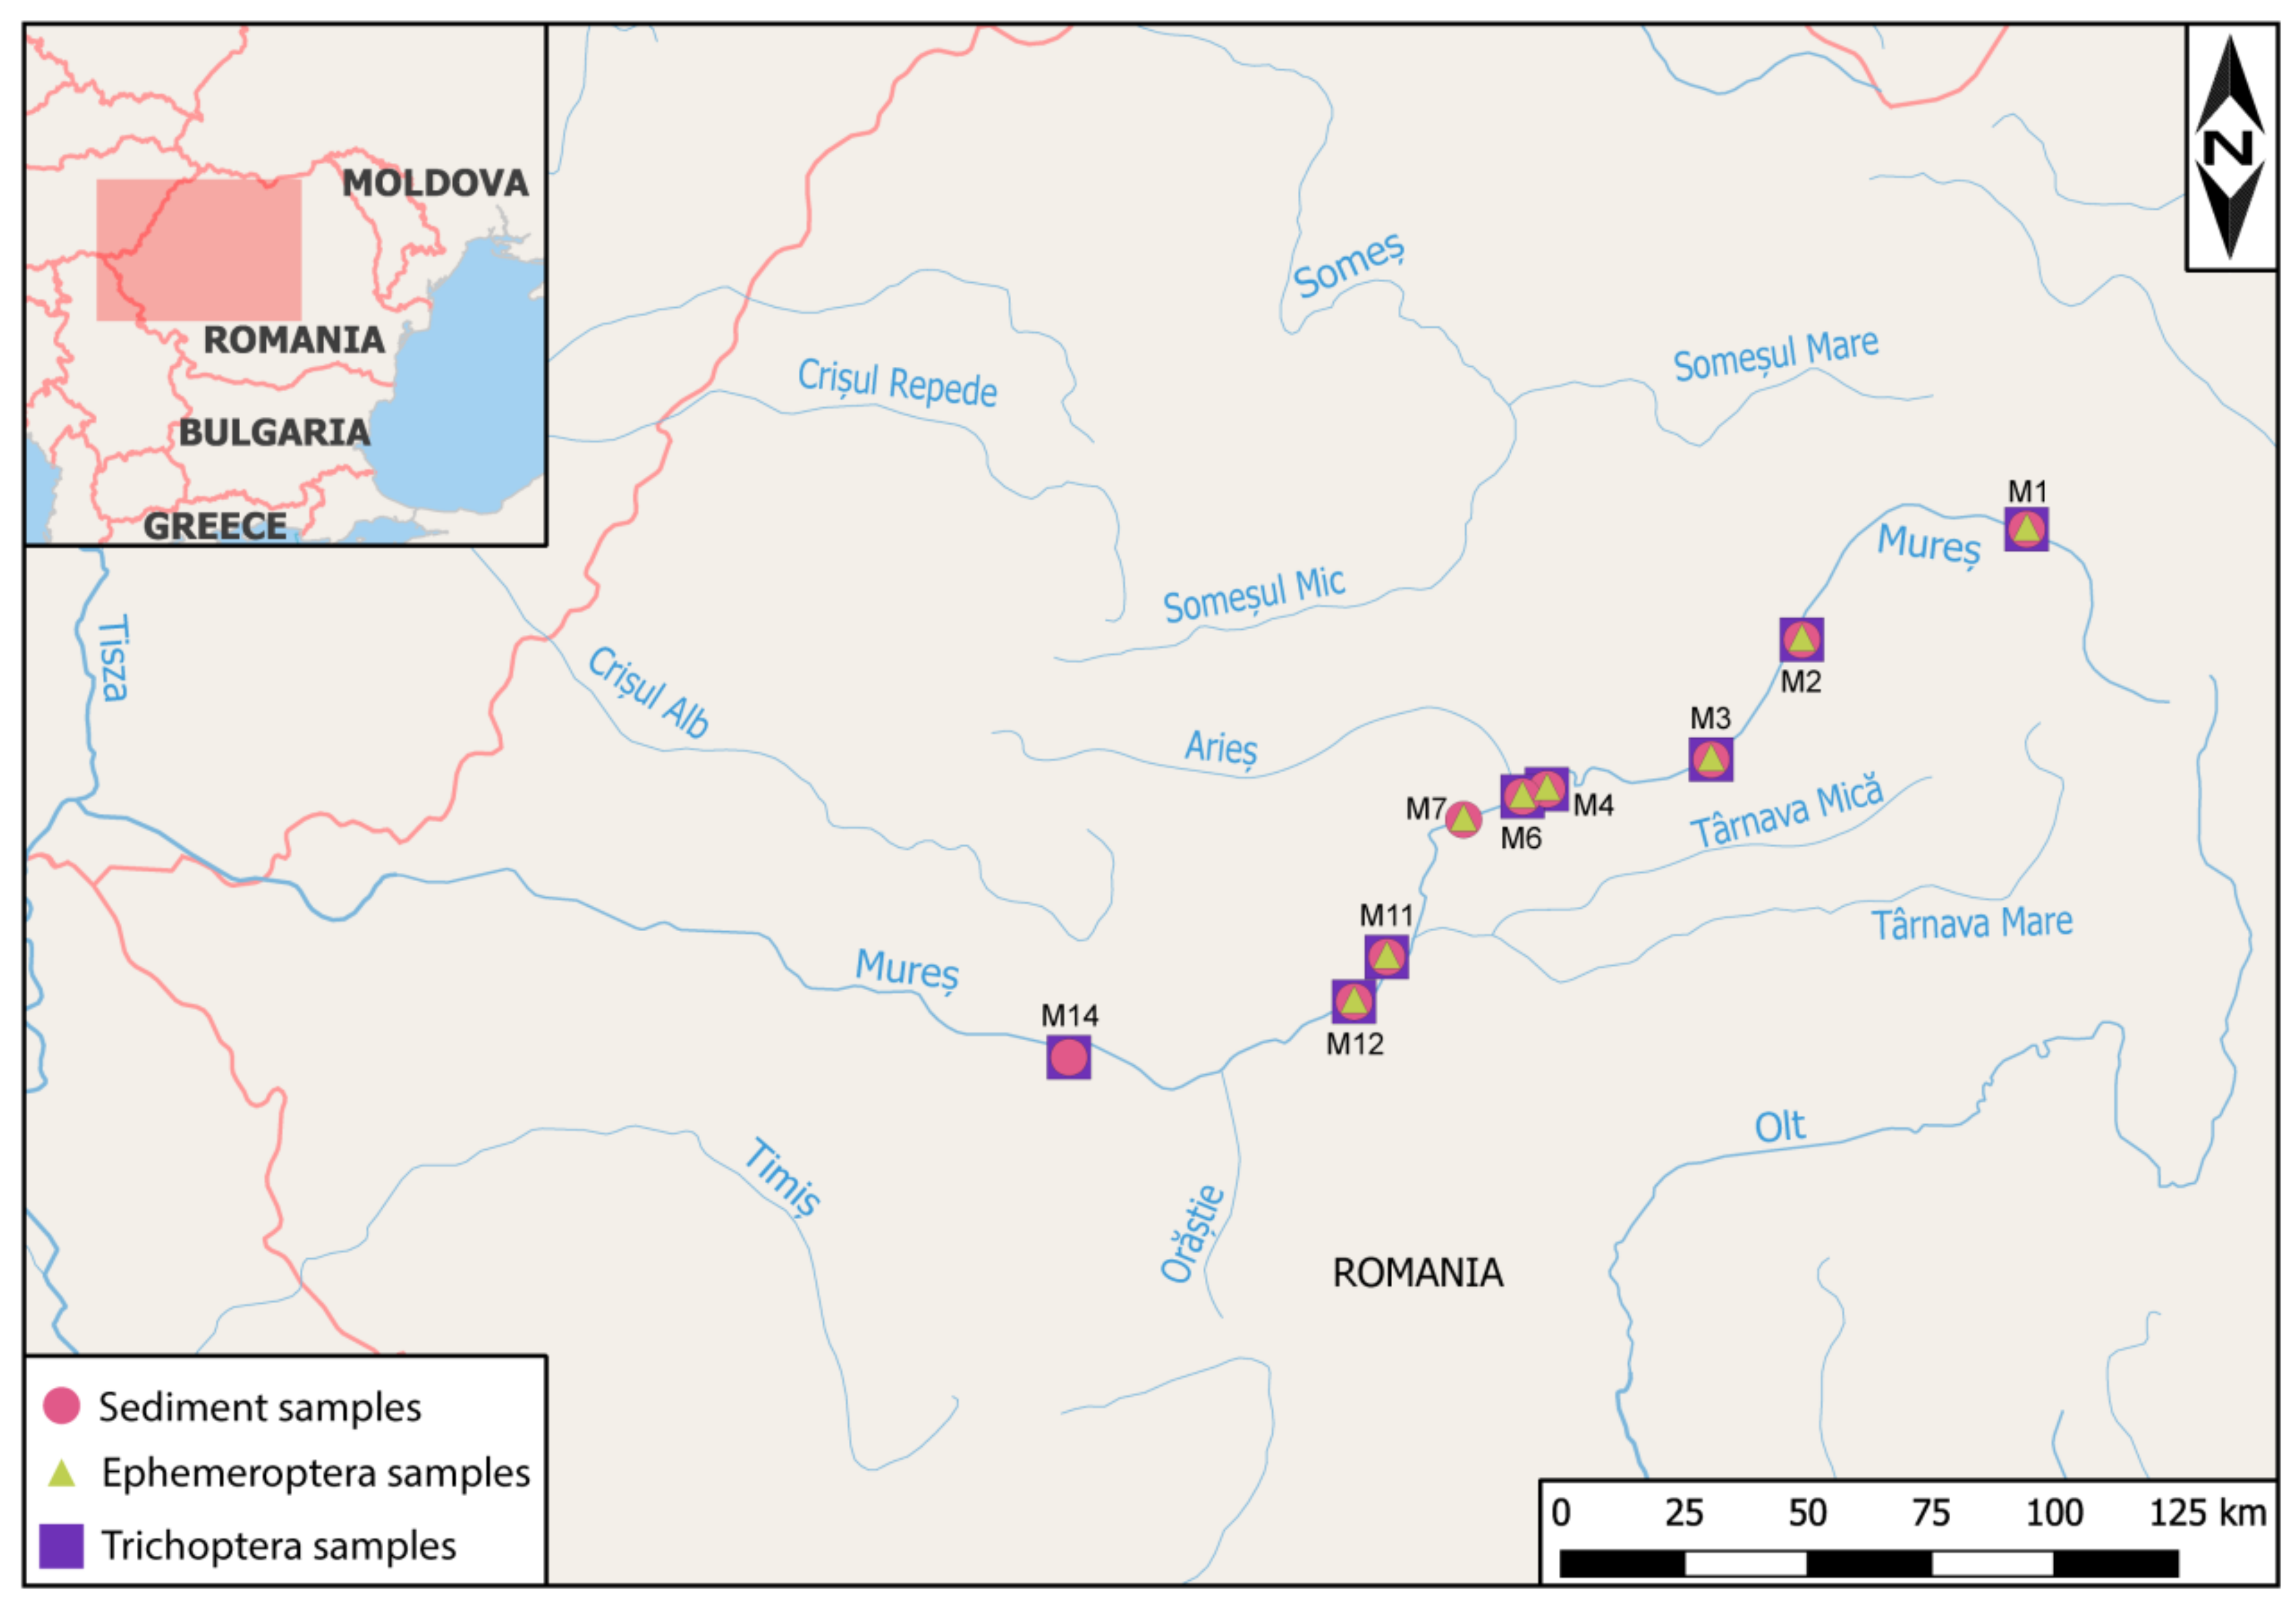
2.1. Study Area and Sample Collection
2.2. Reagents and Standards
2.3. Sample Preparation
2.4. Instrument Analysis
2.5. Quality Control
2.6. Data Analysis
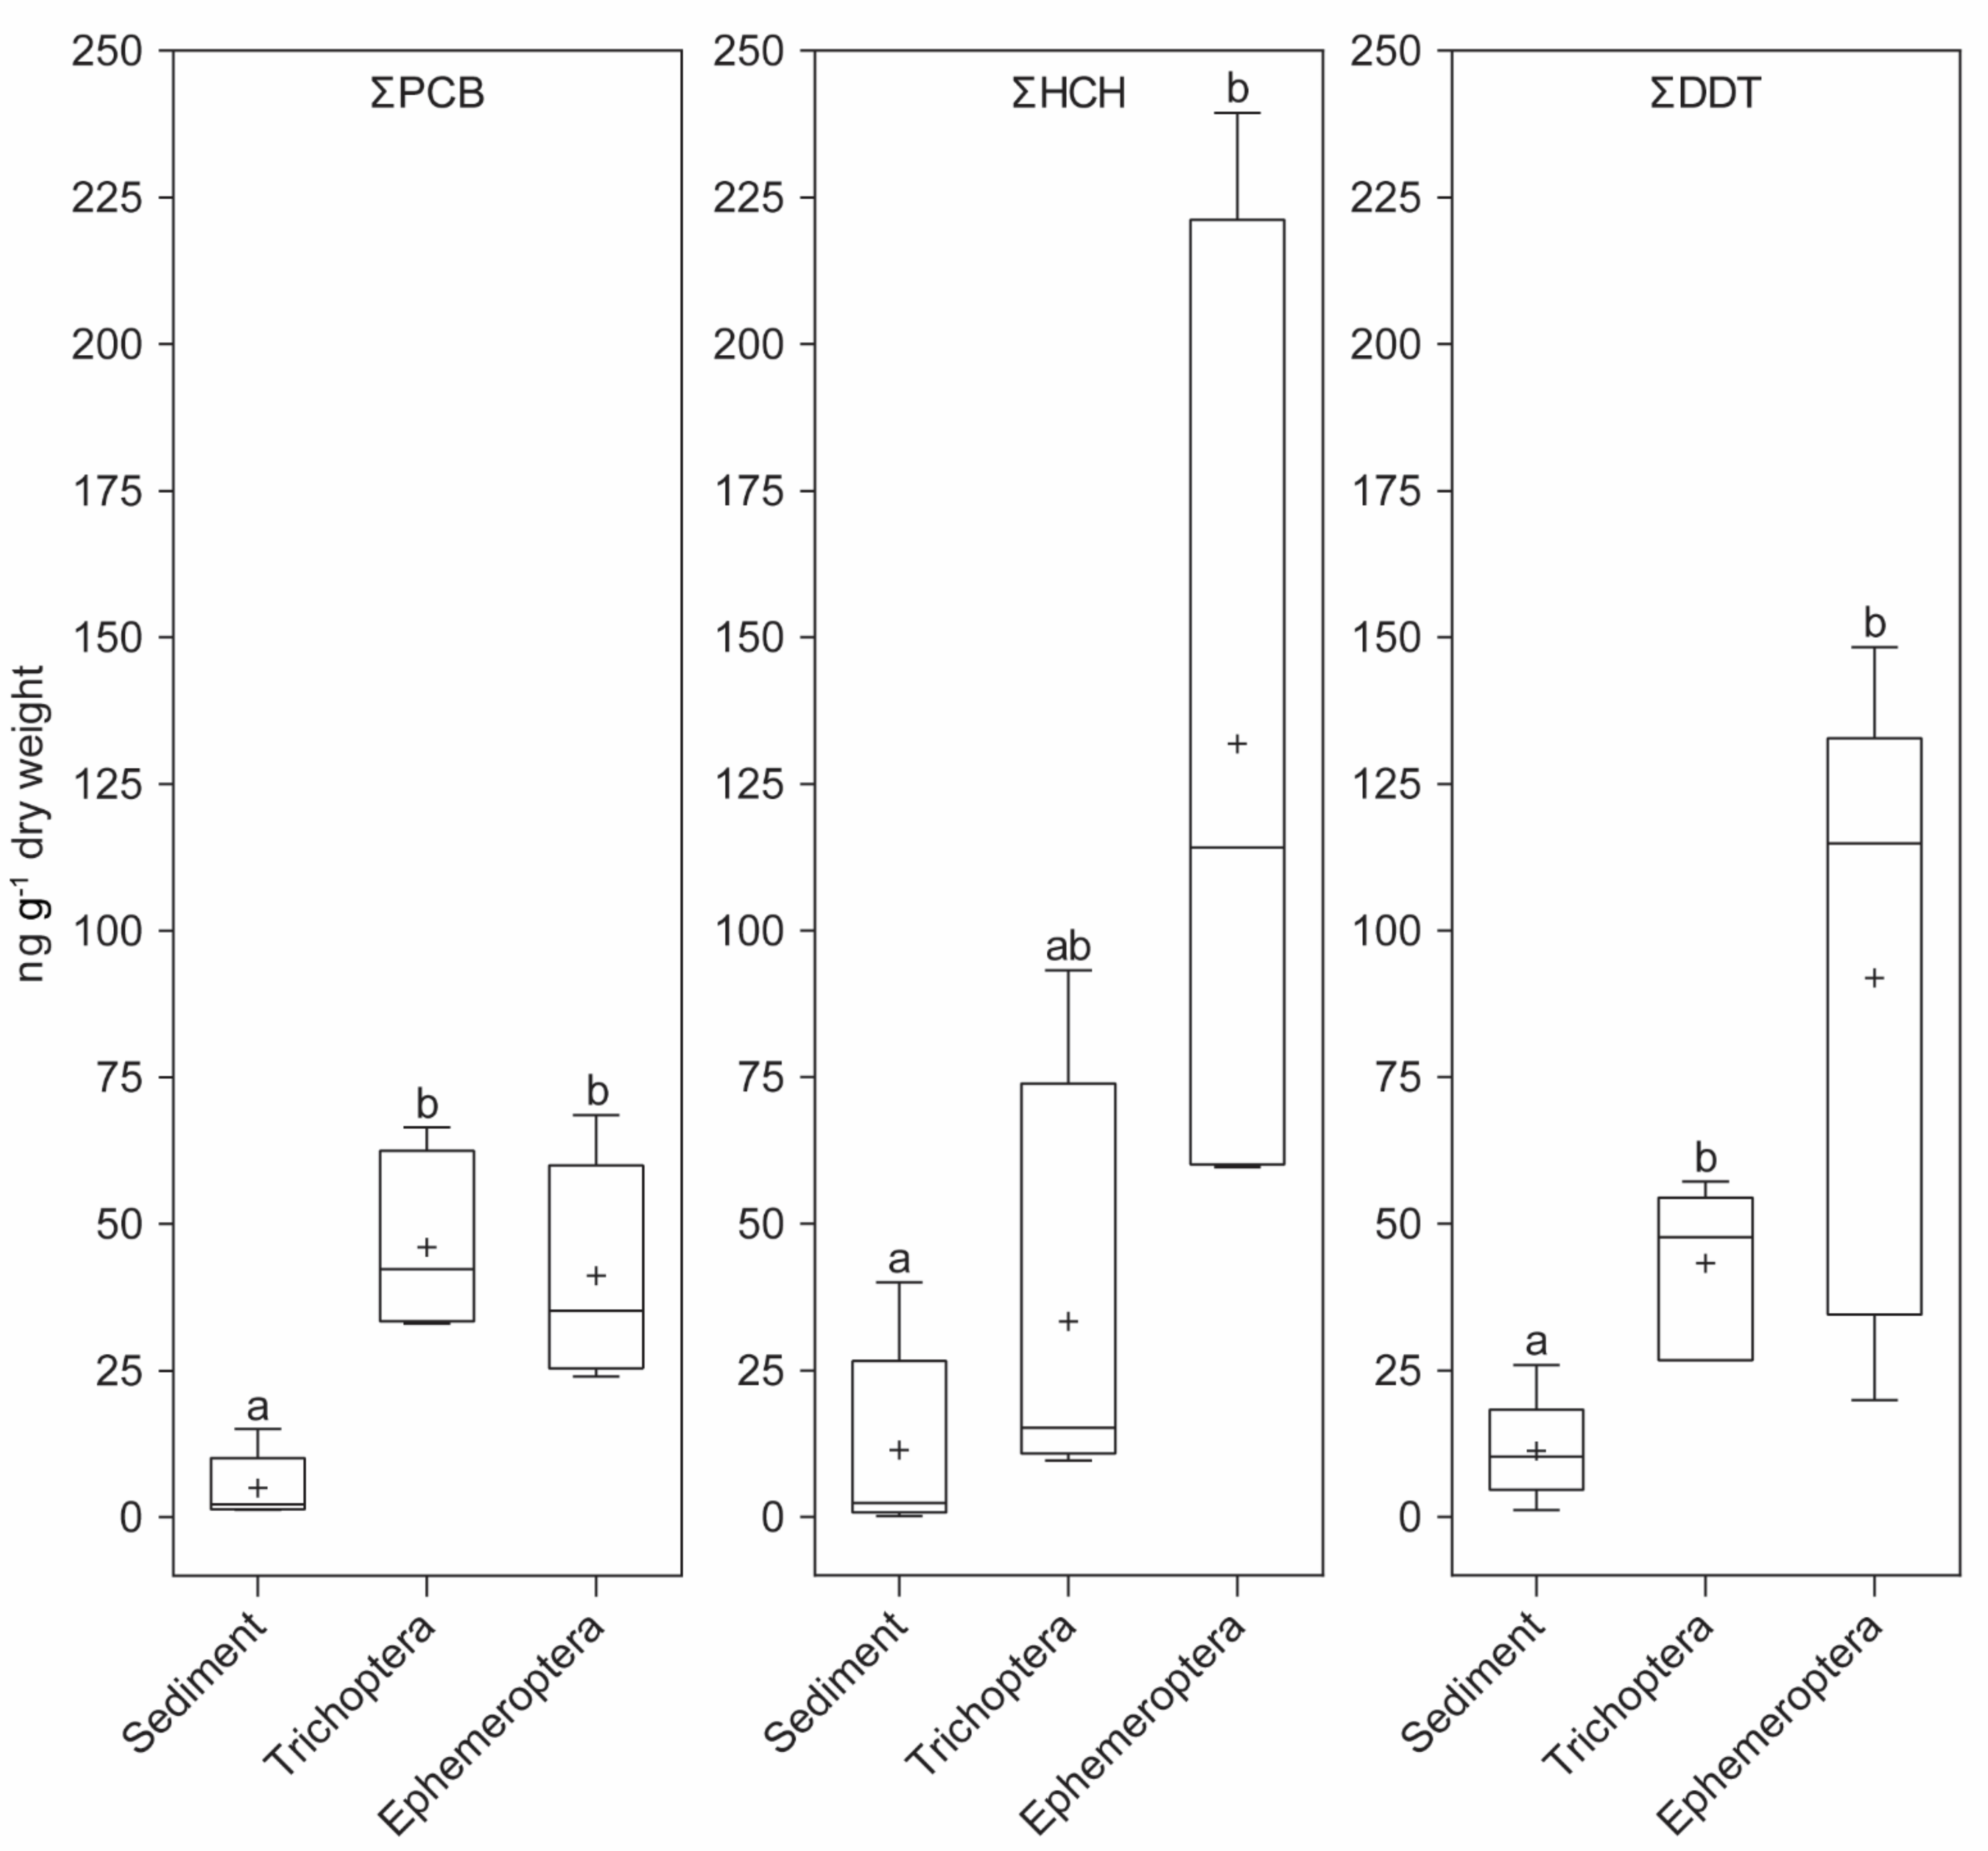
3. Results
4. Discussion
5. Conclusions
Author Contributions
Funding
Institutional Review Board Statement
Informed Consent Statement
Data Availability Statement
Acknowledgments
Conflicts of Interest
References
- Bănăduc, D.; Rey, S.; Trichkova, T.; Lenhardt, M.; Curtean-Bănăduc, A. The Lower Danube River-Danube Delta-North West Black Sea: A pivotal area of major interest for the past, present and future of its fish fauna–A short review. Sci. Total Environ. 2016, 545, 137–151. [Google Scholar] [CrossRef] [PubMed]
- Bănăduc, D.; Joy, M.; Olosutean, H.; Afanasyev, S.; Curtean-Bănăduc, A. Natural and anthropogenic driving forces as key elements in the Lower Danube Basin-South-Eastern Carpathians-North-Western Black Sea coast area lakes, a broken stepping stones for fish in a climatic change scenario? Environ. Sci. Eur. 2020, 32, 1–14. [Google Scholar] [CrossRef]
- Marić, S.; Stanković, D.; Wazenbök, J.; Šanda, R.; Erös, T.; Takács, A.; Specziár, A.; Sekulić, A.; Sekulić, N.; Bănăduc, D.; et al. Phylogeography and population genetics of the European mudminnow (Umbra krameri) with a time-calibrated phylogeny for the family Umbridae. Hydrobiologia. 2017, 792, 151–168. [Google Scholar] [CrossRef] [Green Version]
- Cianfaglione, K.; Pedrotti, F. Italy in the Danube Geography: Territory, Landscape, Environment, Vegetation, Fauna, Culture, Human Management and Outlooks for the Future. In Human Impact on Danube Watershed Biodiversity in the XXI Century. Geobotany Studies (Basics, Methods and Case Studies); Bănăduc, D., Curtean-Bănăduc, A., Pedrotti, F., Cianfaglione, K., Akeroyd, J., Eds.; Springer: Cham, Switzerland, 2020; pp. 87–118. [Google Scholar]
- Lenhardt, M.; Snederevac-Lalić, M.; Hegediš, A.; Skorić, S.; Cvijanović, G.; Višnjić-Jeftić, Ž.; Djikanović, V.; Jovičić, K.; Jaćimović, M.; Jarić, I. Human Impacts on Fish Fauna in the Danube River in Serbia: Current Status and Ecological Implications. In Human Impact on Danube Watershed Biodiversity in the XXI Century. Geobotany Studies (Basics, Methods and Case Studies); Bănăduc, D., Curtean-Bănăduc, A., Pedrotti, F., Cianfaglione, K., Akeroyd, J., Eds.; Springer: Cham, Switzerland, 2020; pp. 257–280. [Google Scholar]
- Afanasyev, S.; Lyashenko, A.; Iarochevitch, A.; Lietytska, O.; Zorina-Sakharova, K.; Marushevska, O. Pressures and Impacts on Ecological Status of Surface Water Bodies in Ukrainian Part of the Danube River Basin. In Human Impact on Danube Watershed Biodiversity in the XXI Century. Geobotany Studies (Basics, Methods and Case Studies); Bănăduc, D., Curtean-Bănăduc, A., Pedrotti, F., Cianfaglione, K., Akeroyd, J., Eds.; Springer: Cham, Switzerland, 2020; pp. 327–359. [Google Scholar]
- Teodorescu, D.; van den Kommer, M. Economic decline, fishing bans, and obstructive politics: Is there a future for small-scale fisheries in Romania’s Danube Delta? In Small-Scale Fisheries in Europe: Status, Resilience and Governance. MARE Publication Series, 23th ed.; Pascual-Fernández, J., Pita, C., Bavinck, M., Eds.; Springer: Berlin/Heidelberg, Germany, 2020. [Google Scholar]
- Curtean-Bănăduc, A.; Didenko, A.; Guti, G.; Bănăduc, D. Telestes souffia (Risso, 1827) species conservation at the eastern limit of range—Vişeu River basin, Romania. Appl. Ecol. Environ. Res. 2018, 16, 91–303. [Google Scholar] [CrossRef]
- Curtean-Bănăduc, A.; Marić, S.; Gabor, G.; Didenko, A.Ş.; Rey Planellas, S.; Bănăduc, D. Hucho hucho (Linnaeus, 1758): Last natural viable population in the Eastern Carpathians—conservation elements. Turk. Zool. Derg. 2019, 43, 215–223. [Google Scholar] [CrossRef]
- Voicu, R.; Radecki-Pawlik, A.; Voicu, L.; Urbani, J.D.; Bănăduc, D. Innovative on-site adapted system for fish migration with flow divider and glass collector basin. Transylv. Rev. Syst. Ecol. Res. 2020, 22, 81–98. [Google Scholar]
- Curtean-Bănăduc, A.; Bănăduc, D. The Transylvanian Water Tower through history. Danub. News 2015, 32, 1–4. [Google Scholar]
- Curtean–Bănăduc, A.; Bănăduc, D.; Bucşa, C. Watersheds Management (Transylvania/Romania): Implications, risks, solutions, Strategies to enhance environmental Security in transition countries. In NATO Science for Peace and Security Series C-Environmental Security; Springer: Berlin/Heidelberg, Germany, 2007; pp. 225–238. [Google Scholar]
- Bănăduc, D.; Curtean–Bănăduc, A.; Cianfaglione, K.; Akeroyd, J.R.; Cioca, L.-I. Proposed environmental risk management elements in a Carpathian valley basin, within the Roşia Montană European historical mining area. Int. J. Environ. Res. Public Health 2021, 18, 4565. [Google Scholar] [CrossRef] [PubMed]
- Costea, G.; Push, M.T.; Bănăduc, D.; Cosmoiu, D.; Curtean-Bănăduc, A. A review of hydropower plants in Romania: Distribution, current knowledge, and their effects on fish in headwater streams. Renew. Sust. Energy Rev. 2021, 54, 111003. [Google Scholar]
- Burcea, A.; Boeraş, I.; Mihuţ, C.-M.; Bănăduc, D.; Matei, C.; Curtean-Bănăduc, A. Adding the Mureş River Basin (Transylvania, Romania) to the list of hotspots with high contamination with pharmaceuticals. Sustainability 2020, 12, 10197. [Google Scholar] [CrossRef]
- La Merrill, M.; Emond, C.; Kim, M.J.; Antignac, J.-P.; Le Bizec, B.; Clément, K.; Birnbaum, L.S.; Barouk, R. Toxicological function of adipose tissue: Focus on persistent organic pollutants. Environ. Health Perspect 2013, 121, 162–169. [Google Scholar] [CrossRef] [PubMed] [Green Version]
- Hung, H.; Katsoyiannis, A.A.; Brorström-Lunden, E.; Olaffsdottir, K.; Aas, W.; Breivik, K.; Bohlin-Nizzetto, P.; Sigurdsson, A.; Hakola, H.; Bossi, R.; et al. Temporal trends of persistent organic pollutants (POPs) in arctic air: 20 years of monitoring under the Arctic Monitoring and Assessment Programme (AMAP). Environ. Pollut. 2016, 217, 52–61. [Google Scholar] [CrossRef] [Green Version]
- Stockholm Convention 2001. Available online: http://chm.pops.int/ (accessed on 26 August 2019).
- Ritter, L.; Solomon, K.R.; Forget, J.; Stemeroff, M.; O’leary, C. A review of selected persistent organic pollutants. In International Programme on Chemical Safety (IPCS). PCS/95.39; World Health Organization: Geneva, Switzerland, 1995; Volume 65, p. 66. [Google Scholar]
- Gupta, V.K.; Ali, I. Environmental Water: Advances in Treatment, Remediation and Recycling; Newnes: Amsterdam, The Netherlands, 2012. [Google Scholar]
- Köhler, H.R.; Triebskorn, R. Wildlife ecotoxicology of pesticides: Can we track effects to the population level and beyond? Science 2013, 341, 759–765. [Google Scholar] [CrossRef] [PubMed] [Green Version]
- Fernández, P.; Grimalt, J.O. On the global distribution of persistent organic pollutants. Chimia 2003, 57, 514–521. [Google Scholar] [CrossRef] [Green Version]
- Montuori, P.; Cirillo, T.; Fasano, E.; Nardone, A.; Esposito, F.; Triassi, M. Spatial distribution and partitioning of polychlorinated biphenyl and organochlorine pesticide in water and sediment from Sarno River and Estuary, Southern Italy. Environ. Sci. Pollut. Res. 2014, 21, 5023–5035. [Google Scholar] [CrossRef] [PubMed] [Green Version]
- Sakan, S.; Ostojić, B.; Đorđević, D. Persistent organic pollutants (POPs) in sediments from river and artificial lakes in Serbia. J. Geochem. Explor. 2017, 180, 91–100. [Google Scholar] [CrossRef] [Green Version]
- Behroz, R.D.; Esmaili-Sari, A.; Chakraborty, P. Distribution and Eco-toxicological risk assessment of legacy persistent organic pollutants in surface water of Talar, Babolrood and Haraz rivers. Water 2020, 12, 3104. [Google Scholar] [CrossRef]
- Chicea, D.; Rei, S.M. Light scattering for monitoring the size of the suspended particles in wastewater. Transylv. Rev. Syst. Ecol. Res. 2019, 21, 1–10. [Google Scholar]
- Liu, M.; Cheng, S.; Ou, D.; Yang, Y.; Liu, H.; Hou, L.; Gao, L.; Xu, S. Organochlorine pesticides in surface sediments and suspended particulate matters from the Yangtze estuary, China. Environ. Pollut. 2008, 156, 168–173. [Google Scholar] [CrossRef]
- Cai, M.; Qiu, C.; Shen, Y.; Cai, M.; Huang, S.; Qian, B.; Sun, J.; Liu, X. Concentration and distribution of 17 organochlorine pesticides (OCPs) in seawater from the Japan Sea northward to the Arctic Ocean. Sci. China Chem. 2010, 53, 1033–1047. [Google Scholar] [CrossRef] [Green Version]
- Salem, D.M.A.; Khaled, A.; El Nemr, A. Assessment of pesticides and polychlorinated biphenyls (PCBs) in sediments of the Egyptian Mediterranean Coast. Egypt. J. Aquat. Res. 2013, 39, 141–152. [Google Scholar] [CrossRef] [Green Version]
- Zhang, Z.L.; Hong, H.S.; Zhou, J.L.; Huang, J.; Yu, G. Fate and assessment of persistent organic pollutants in water and sediment from Minjiang River Estuary, Southeast China. Chemosphere 2003, 52, 1423–1430. [Google Scholar] [CrossRef]
- Bettinetti, R.; Giarei, C.; Provini, A. Chemical analysis and sediment toxicity bioassays to assess the contamination of the River Lambro (Northern Italy). Arch. Environ. Contam. Toxicol. 2003, 45, 72–78. [Google Scholar] [CrossRef] [PubMed]
- Barhoumi, B.; Beldean-Galea, M.S.; Al-Rawabdeh, A.M.; Roba, C.; Martonos, I.M.; Bălc, R.; Kahlaoui, M.; Touil, S.; Tedetti, M.; Driss, M.R.; et al. Occurrence, distribution and ecological risk of trace metals and organic pollutants in surface sediments from a Southeastern European river (Someşu Mic River, Romania). Sci. Total Environ. 2019, 660, 660–676. [Google Scholar] [CrossRef] [PubMed]
- Kelly, B.C.; Ikonomou, M.G.; Blair, J.D.; Morin, A.E.; Gobas, F.A. Food web-specific biomagnification of persistent organic pollutants. Science 2007, 317, 236–239. [Google Scholar] [CrossRef] [PubMed]
- Alava, J.J.; Cheung, W.W.; Ross, P.S.; Sumaila, U.R. Climate change-contaminant interactions in marine food webs: Toward a conceptual framework. Glob. Chang. Biol. 2017, 23, 3984–4001. [Google Scholar] [CrossRef]
- Joy, M.; Death, R.G. Biological assessment of rivers in the Manawatu-Wanganui region of New Zealand using a predictive macroinvertebrate model. N. Z. J. Mar. Freshw. Res. 2003, 37, 367–379. [Google Scholar] [CrossRef]
- Curtean-Bănăduc, A.; Burcea, A.; Mihuţ, C.-M.; Berg, V.; Lyche, J.L.; Bănăduc, D. Bioaccumulation of persistent organic pollutants in the gonads of Barbus barbus (Linnaeus, 1758). Ecotox. Environ. Saf. 2020, 201, 110852. [Google Scholar] [CrossRef] [PubMed]
- Liu, Y.; Luo, X.J.; Huang, L.Q.; Yu, L.H.; Mai, B.X. Bioaccumulation of persistent halogenated organic pollutants in insects: Common alterations to the pollutant pattern for different insects during metamorphosis. Environ. Sci. Technol. 2018, 52, 5145–5153. [Google Scholar] [CrossRef]
- Vos, J.G.; Dybing, E.; Greim, H.A.; Ladefoged, O.; Lambré, C.; Tarazona, J.V.; Brandt, I.; Vethaak, A.D. Health effects of endocrine-disrupting chemicals on wildlife, with special reference to the European situation. Crit. Rev. Toxicol. 2000, 30, 71–133. [Google Scholar] [CrossRef]
- Adeola, F.O. Boon or bane? The environmental and health impacts of persistent organic pollutants (POPs). Hum. Ecol. Rev. 2004, 11, 27–35. [Google Scholar]
- Vasseur, P.; Cossu-Leguille, C. Linking molecular interactions to consequent effects of persistent organic pollutants (POPs) upon populations. Chemosphere 2006, 62, 1033–1042. [Google Scholar] [CrossRef] [PubMed]
- Qing Li, Q.; Loganath, A.; Seng Chong, Y.; Tan, J.; Philip Obbard, J. Persistent organic pollutants and adverse health effects in humans. J. Toxicol. Environ. Health A 2006, 69, 1987–2005. [Google Scholar] [CrossRef]
- Alharbi, O.M.; Khattab, R.A.; Ali, I. Health and environmental effects of persistent organic pollutants. J. Mol. Liq. 2018, 263, 442–453. [Google Scholar] [CrossRef]
- Pereira, L.R.; Cabette, H.S.; Juen, L. Trichoptera as bioindicators of habitat integrity in the Pindaíba river basin, Mato Grosso (Central Brazil). In Annales de Limnologie-International Journal of Limnology; EDP Sciences: Les Ulis, France, 2012; Volume 48, pp. 295–302. [Google Scholar]
- Curtean-Bănăduc, A.; Olosutean, H.; Bănăduc, D. Influence of environmental variables on the structure and diversity of Ephemeran communities: A case study of the Timiş River, Romania. Acta Zool. Bulg. 2016, 68, 215–224. [Google Scholar]
- Pastorino, P.; Bertoli, M.; Squadrone, S.; Brizio, P.; Piazza, G.; Noser, A.G.O.; Prearo, M.; Abete, M.C.; Pizzul, E. Detection of trace elements in freshwater macrobenthic invertebrates of different functional feeding guilds: A case study in Northeast Italy. Ecohydrol. Hydrobiol. 2019, 19, 428–440. [Google Scholar] [CrossRef]
- Pastorino, P.; Brizio, P.; Abete, M.C.; Bertoli, M.; Noser, A.G.O.; Piazza, G.; Prearo, M.; Elia, A.C.; Pizzul, E.; Squadrone, S. Macrobenthic invertebrates as tracers of rare earth elements in freshwater watercourses. Sci. Total Environ. 2020, 698, 134282. [Google Scholar] [CrossRef]
- Parker, T.J.; Haswell, W.A. Textbook of Zoology; Macmillan International Higher Education: London, UK, 1967. [Google Scholar]
- Rosenberg, D.M.; Danks, H.V.; Lehmkuhl, D.M. Importance of insects in environmental impact assessment. Environ. Manag. 1986, 10, 773–783. [Google Scholar] [CrossRef]
- Baxter, C.V.; Fausch, K.D.; Carl Saunders, W. Tangled webs: Reciprocal flows of invertebrate prey link streams and riparian zones. Freshw. Biol. 2005, 50, 201–220. [Google Scholar] [CrossRef]
- Pastorino, P.; Zaccaroni, A.; Doretto, A.; Falasco, E.; Silvi, M.; Dondo, A.; Elia, A.C.; Prearo, M.; Bona, F. Functional Feeding Groups of Aquatic Insects Influence Trace Element Accumulation: Findings for Filterers, Scrapers and Predators from the Po Basin. Biology 2020, 9, 288. [Google Scholar] [CrossRef]
- Holzenthal, R.W.; Thomson, R.E.; Ríos-Touma, B. Order Trichoptera. In Thorp and Covich’s Freshwater Invertebrates; Academic Press: Cambridge, MA, USA, 2015; pp. 965–1002. [Google Scholar]
- Morse, J.C. Trichoptera (caddisflies). In Encyclopedia of Insects; Academic Press: Cambridge, MA, USA, 2009; pp. 1015–1020. [Google Scholar]
- Hubbard, M.D.; Peters, W.L. Environmental Requirements and Pollution Tolerance of Ephemeroptera; Environmental Protection Agency, Office of Research and Development, Environmental Monitoring and Support Laboratory: Washington, DC, USA, 1978. [Google Scholar]
- Bauernfeind, E.; Moog, O. Mayflies (Insecta: Ephemeroptera) and the assessment of ecological integrity: A methodological approach. In Assessing the Ecological Integrity of Running Waters; Springer: Dordrecht, The Netherlands, 2000; pp. 71–83. [Google Scholar]
- Barber-James, H.M.; Gattolliat, J.L.; Sartori, M.; Hubbard, M.D. Global diversity of mayflies (Ephemeroptera, Insecta) in freshwater. In Freshwater Animal Diversity Assessment; Springer: Dordrecht, The Netherlands, 2007; pp. 339–350. [Google Scholar]
- Edmunds, G.F., Jr.; Jensen, S.L.; Berner, L. (Eds.) The Mayflies of North and Central America; U of Minnesota Press: Minneapolis, MN, USA, 1976. [Google Scholar]
- Bauernfeind, E.; Soldan, T. The Mayflies of Europe (Ephemeroptera); Brill: Leiden, The Netherlands, 2012. [Google Scholar]
- Mwanamoki, P.M.; Devarajan, N.; Thevenon, F.; Birane, N.; De Alencastro, L.F.; Grandjean, D.; Mpiana, P.T.; Prabakar, K.; Mubedi, J.I.; Kabele, C.G.; et al. Trace metals and persistent organic pollutants in sediments from river-reservoir systems in Democratic Republic of Congo (DRC): Spatial distribution and potential ecotoxicological effects. Chemosphere 2014, 111, 485–492. [Google Scholar] [CrossRef] [PubMed]
- Berg, V.; Lyche, J.L.; Karlsson, C.; Stavik, B.; Nourizadeh-Lillabadi, R.; Hårdnes, N.; Skaare, J.U.; Alestrøm, P.; Lie, E.; Ropstad, E. Accumulation and effects of natural mixtures of persistent organic pollutants (POP) in zebrafish after two generations of exposure. J. Toxicol. Environ. Health A 2011, 74, 407–423. [Google Scholar] [CrossRef]
- Berg, V.; Kraugerud, M.; Nourizadeh-Lillabadi, R.; Olsvik, P.A.; Skåre, J.U.; Alestrom, P.; Ropstad, E.; Zimmer, K.; Lyche, J.L. Endocrine effects of real-life mixtures of persistent organic pollutants (POP) in experimental models and wild fish. J. Toxicol. Environ. Health Part A 2016, 79, 538–548. [Google Scholar] [CrossRef] [PubMed]
- Kraugerud, M.; Doughty, R.W.; Lyche, J.L.; Berg, V.; Tremoen, N.H.; Alestrøm, P.; Alexandersen, M.; Ropstad, E. Natural mixtures of persistent organic pollutants (POPs) suppress ovarian development, liver vitellogenin immunostaining and hepatocyte proliferation in female zebrafish (Danio rerio). Aquat. Toxicol. 2012, 116, 16–23. [Google Scholar] [CrossRef]
- Lyche, J.L.; Nourizadeh-Lillabadi, R.; Almaas, C.; Stavik, B.; Berg, V.; Skåre, J.U.; Alestrøm, P.; Ropstad, E. Natural mixtures of persistent organic pollutants (POP) increase weight gain, advance puberty, and induce changes in gene expression associated with steroid hormones and obesity in female zebrafish. J. Toxicol. Environ. Health A 2010, 73, 1032–1057. [Google Scholar] [CrossRef] [PubMed]
- Lyche, J.L.; Nourizadeh-Lillabadi, R.; Karlsson, C.; Stavik, B.; Berg, V.; Skaare, J.U.; Alestrøm, P.; Ropstad, E. Natural mixtures of POPs affected body weight gain and induced transcription of genes involved in weight regulation and insulin signalling. Aquat. Toxicol. 2011, 102, 197–204. [Google Scholar] [CrossRef] [PubMed]
- Lyche, J.L.; Grześ, I.M.; Karlsson, C.; Nourizadeh-Lillabadi, R.; Berg, V.; Kristoffersen, A.B.; Skåre, J.U.; Alestrøm, P.; Ropstad, E. Parental exposure to natural mixtures of POPs reduced embryo production and altered gene transcription in zebrafish embryos. Aquat. Toxicol. 2013, 126, 424–434. [Google Scholar] [CrossRef] [PubMed]
- Nourizadeh-Lillabadi, R.; Lyche, J.L.; Almaas, C.; Stavik, B.; Moe, S.J.; Alexandersen, M.; Berg, V.; Jakobsen, K.S.; Stenseth, N.C.; Skaare, J.U.; et al. Transcriptional regulation in liver and testis associated with developmental and reproductive effects in male zebrafish exposed to natural mixtures of persistent organic pollutants (POP). J. Toxicol. Environ. Health A 2009, 72, 112–130. [Google Scholar] [CrossRef]
- Antipa, G. Fauna Ihtiologică a României; Academia Romana, Publicatiunile Fondului Vasile Adamachi: Bucureşti, Romania, 1909; p. 294. [Google Scholar]
- Băcescu, M. Peştii, Aşa Cum îi Vede Ţăranul Pescar Român, Institutul de Cercetări Piscicole al României, Monographia, 3th ed.; Monitorul Oficial şi Imprimeriile Statului Imprimeria Naţională Bucureşti: Bucureşti, Romania, 1946; p. 218. [Google Scholar]
- Bănărescu, P.M. Pisces-Osteichthyes, 13th ed.; Fauna, R.P., Acad, R.P.R., Eds.; Acad, R.P.R.: Bucureşti, Romania, 1964; Volume XIII, p. 959. [Google Scholar]
- Posea, G. Enciclopedia Geografică a României; Ştiinţifică şi Enciclopedică: Bucureşti, Romania, 1982; p. 262. [Google Scholar]
- Curtean-Bănăduc, A.; Bănăduc, D.; Burcea, A.; Berg, V.; Lyche, J.L.; Gheorghe, L.M. Persistent organic pollutants in Mureş watershed. In The Impact of Persistent Organic Pollutants on Freshwater Ecosystems and Human Health; Curtean-Bănăduc, A., Ed.; Editura Universității Lucian Blaga: Sibiu, Romania, 2016; pp. 119–154. [Google Scholar]
- Collings, A.F.; Farmer, A.D.; Gwan, P.B.; Pintos, A.S.; Leo, C.J. Processing contaminated soils and sediments by high power ultrasound. Miner. Eng. 2006, 19, 450–453. [Google Scholar] [CrossRef]
- Wylie, P.L.; Meng, C.K. A Method for the Trace Analysis of 175 Pesticides Using the Agilent Triple Quadrupole GC/MS/MS; Agilent Technologies Publication: Santa Clara, CA, USA, 2009; Volume 92, pp. 123–137. [Google Scholar]
- Mariappan, M.; Kumar, H.; Kandaswamy, C.; Kulkurni, S. Determination of Multi-Pesticide Residues in Red Chili Powder Using QuEChERS and the Agilent 7000 Series Triple Quadrupole GC/MS System. Application Note. Food Safety. 5991-4193EN. 2014, p. 10. Available online: http://www.ingenieria-analitica.com/downloads/dl/file/id/3128/product/360/determination_of_multi_pesticide_residues_in_red_chili_powder_using_quechers_and_the_agilent_7000_series_triple_quadrupole_gc_ms_system.pdf (accessed on 22 February 2021).
- Ciscato, C.; Barbosa, C.; Gebara, A. Analysis of Pesticide Residues in Mango by GC/MS/MS with Bond Elut QuEChERS EN Kits; Agilent Technologies Publication: Santa Clara, CA, USA, 2015. [Google Scholar]
- Ripp, J. PUBL-TS-056-96 Laboratory Certification Program. In Analytical Detection Limit Guidance & Amp. Laboratory Guide for Determining Method Detection Limits; Wisconsin Department of Natural Resources: Madison, WI, USA, 1996; p. 24. [Google Scholar]
- Pinkney, A.E.; McGowan, P.C. Use of the p, p’-DDD: P, p’-DDE concentration ratio to trace contaminant migration from a hazardous waste site. Environ. Monit. Assess. 2006, 120, 559–574. [Google Scholar] [CrossRef]
- Zhang, C.; Liu, L.; Ma, Y.; Li, F. Using isomeric and metabolic ratios of DDT to identify the sources and fate of DDT in Chinese agricultural topsoil. Environ. Sci. Technol. 2018, 52, 1990–1996. [Google Scholar] [CrossRef]
- Wickham, H. ggplot2: Elegant Graphics for Data Analysis; Springer: New York, NY, USA, 2016; Available online: https://ggplot2.tidyverse.org (accessed on 22 February 2021).
- QGIS Development Team, QGIS Geographic Information System. Open Source Geospatial Foundation. 2019. Available online: http://qgis.org (accessed on 11 August 2020).
- Ren, J.; Wang, X.; Wang, C.; Gong, P.; Wang, X.; Yao, T. Biomagnification of persistent organic pollutants along a high-altitude aquatic food chain in the Tibetan Plateau: Processes and mechanisms. Environ. Pollut. 2017, 220, 636–643. [Google Scholar] [CrossRef]
- Ferry, E.E.; Hopkins, G.R.; Stokes, A.N.; Mohammadi, S.; Brodie, E.D., Jr.; Gall, B.G. Do all portable cases constructed by caddisfly larvae function in defense? J. Insect Sci. 2013, 13, 5. [Google Scholar] [CrossRef] [PubMed] [Green Version]
- Parmar, T.K.; Rawtani, D.; Agrawal, Y.K. Bioindicators: The natural indicator of environmental pollution. Front. Life Sci. 2016, 9, 110–118. [Google Scholar] [CrossRef] [Green Version]
- Díaz-Jaramillo, M.; Laitano, M.V.; Gonzalez, M.; Miglioranza, K.S.B. Spatio-temporal trends and body size differences of OCPs and PCBs in Laeonereis culveri (Polychaeta: Nereididae) from Southwest Atlantic estuaries. Mar. Pollut. Bull. 2018, 136, 107–113. [Google Scholar] [CrossRef] [PubMed] [Green Version]
- Barinova, S. On the Classification of Water Quality from an Ecological Point of View. IJESNR 2017, 2, 1–8. [Google Scholar] [CrossRef]


| Sample | Sediment | Trichoptera | Ephemeroptera | ||||||
|---|---|---|---|---|---|---|---|---|---|
| POPs | ΣPCB | ΣHCH | ΣDDT | ΣPCB | ΣHCH | ΣDDT | ΣPCB | ΣHCH | ΣDDT |
| Min (ng g−1 dry weight) | 1.27 | 0.19 | 1.21 | 33.06 | 9.64 | 26.73 | 23.99 | 59.65 | 19.94 |
| Max (ng g−1 dry weight) | 15.04 | 40.02 | 25.95 | 66.51 | 93.25 | 57.17 | 68.56 | 239.39 | 148.31 |
| Mean (ng g−1 dry weight) | 5.01 | 11.39 | 11.23 | 46.03 | 33.31 | 43.27 | 41.21 | 131.83 | 91.86 |
| Median (ng g−1 dry weight) | 2.20 | 2.34 | 10.29 | 42.27 | 15.18 | 47.71 | 35.17 | 114.14 | 114.86 |
| Number of occurrences | 5 | 5 | 5 | 4 | 4 | 6 | 5 | 4 | 8 |
| Frequency of detection * | 31.3% | 31.3% | 31.3% | 50.0% | 50.0% | 75.0% | 62.5% | 50.0% | 100.0% |
Publisher’s Note: MDPI stays neutral with regard to jurisdictional claims in published maps and institutional affiliations. |
© 2021 by the authors. Licensee MDPI, Basel, Switzerland. This article is an open access article distributed under the terms and conditions of the Creative Commons Attribution (CC BY) license (https://creativecommons.org/licenses/by/4.0/).
Share and Cite
Curtean-Bănăduc, A.; Burcea, A.; Mihuţ, C.-M.; Bănăduc, D. The Benthic Trophic Corner Stone Compartment in POPs Transfer from Abiotic Environment to Higher Trophic Levels—Trichoptera and Ephemeroptera Pre-Alert Indicator Role. Water 2021, 13, 1778. https://doi.org/10.3390/w13131778
Curtean-Bănăduc A, Burcea A, Mihuţ C-M, Bănăduc D. The Benthic Trophic Corner Stone Compartment in POPs Transfer from Abiotic Environment to Higher Trophic Levels—Trichoptera and Ephemeroptera Pre-Alert Indicator Role. Water. 2021; 13(13):1778. https://doi.org/10.3390/w13131778
Chicago/Turabian StyleCurtean-Bănăduc, Angela, Alexandru Burcea, Claudia-Maria Mihuţ, and Doru Bănăduc. 2021. "The Benthic Trophic Corner Stone Compartment in POPs Transfer from Abiotic Environment to Higher Trophic Levels—Trichoptera and Ephemeroptera Pre-Alert Indicator Role" Water 13, no. 13: 1778. https://doi.org/10.3390/w13131778