Article

A Stable Isotope Approach for Estimating the Contribution of Recycled Moisture to Precipitation in Lanzhou City, China

1
College of Geography and Environmental Science, Northwest Normal University, Lanzhou 730070, China
2
Key Laboratory of Resource Environment and Sustainable Development of Oasis of Gansu Province, Lanzhou 730070, China
3
Laboratory of Atmospheric Physics, Department of Physics, University of Patras, GR-265 00 Patras, Greece
*
Author to whom correspondence should be addressed.
Water 2021, 13(13), 1783; https://doi.org/10.3390/w13131783
Submission received: 2 June 2021 / Revised: 23 June 2021 / Accepted: 24 June 2021 / Published: 28 June 2021
(This article belongs to the Section Hydrology)

Abstract

:
The proportional contribution of recycled moisture to local precipitation is a geographically dependent parameter that cannot be ignored in water budgets. Stable hydrogen and oxygen isotopes are sensitive to environmental changes and can be applied to investigate the modern water cycle. In this study, a three-component mixing model is used to calculate the contribution of different water vapors (advection, evaporation and transpiration) to summer precipitation in Lanzhou city, Northwest China. The results show that for all sampling sites in Lanzhou, the contribution of advection vapor to precipitation is the largest, followed by the plant transpiration vapor, and the contribution of surface evaporation water vapor is usually the least, with the average values of 87.96%, 9.1% and 2.9%, respectively. The spatial differences of plant transpiration vapor are generally larger than those of advection vapor and surface evaporation vapor, and the high values appear in Yongdeng, Daheng and Gaolan.

1. Introduction

Terrestrial moisture that is produced by evapotranspiration, including surface evaporation and transpiration, plays a critical role in hydrological processes [1,2,3,4], especially in arid and semi-arid regions in inland Asia [5,6,7,8]. The contribution of surface evaporation and transpiration to precipitation, also known as recycling fraction or recycling ratio, is a geographically dependent parameter that cannot be ignored in water budgets. Generally speaking, the recycling fraction is subject to seasonal and interannual climatic variations as well as the spatial scale of the study area [9,10,11,12]. Additionally, land surface conditions such as vegetation and moisture availability are also important aspects influencing recycled moisture [13,14,15]. Logically, the recycling fraction for regions with high vegetation coverage is larger than that of bare soil, and the growing season has larger moisture recycling fraction than the nongrowing season with low temperature [16,17,18].
Although the water budget approach and empirical models are applied to measure evapotranspiration, many field measurements are needed to determine the contribution of surface evaporation and transpiration to local moisture [19,20,21]. These uncertainties from insufficient observations and low accuracy of a gridded database may bring a number of problems in estimating the contribution of local recycled moisture, especially in the areas with diverse land-cover types. Moreover, the moisture from evapotranspiration calculated through conventional methods cannot entirely convert to precipitation in many actual situations.
Stable hydrogen and oxygen in precipitation can provide useful information of hydrological processes due to fractionation, leaving a characteristic imprint on stable water isotopes [22]. In past decades, stable water isotope compositions are used for estimating the proportions of recycled moisture plant transpiration vapor, surface evaporation vapor and advected vapor to precipitation [5,12]. According to the number of fluxes (such as surface evaporation and transpiration), the models can be generally classified into two-component mixing models [13] and three-component mixing models [5,16]. The three-component models are widely used under various environments with different vegetation coverages, and the potential fluxes usually include advection, surface evaporation and transpiration. The two-component models usually reflect the influence of surface evaporation only and ignore the possible contribution of transpiration [13]. In many areas, the contribution of plant transpiration to water vapor recycling is far greater than that of surface evaporation [8,19].
Water is an important resource to support a city’s development. Located in the marginal zone of monsoon Asia, the Loess Plateau is a critical area in moisture sources diagnostics [23,24,25]. As a semi-arid city in the western Loess Plateau, Lanzhou city is a hot spot in precipitation isotopes studies during recent years [26,27,28,29,30]. Based on these in situ observations of precipitation isotopes, previous studies focused on the below-cloud evaporation [27,29] and moisture trajectories [28,30] in Lanzhou city. However, an isotope-based integrated assessment of recycled moisture is still needed for this region. In this study, we used the compiled database of stable isotopic compositions in precipitation during recent years, and assessed the moisture recycling fraction in Lanzhou city using a three-component mixing model. This research is of great help to understand the precipitation regimes in the western Loess Plateau at the marginal area of monsoon Asia.
In Section 2, we describe the data and method, and in Section 3 we compare the relative contribution of plant transpiration, surface evaporation and advection vapor to precipitation in several sampling stations in Lanzhou city. In Section 4, we discuss the main drivers for the identified patterns regarding changes in water vapor monthly isotopic contributions. In Section 5, we provide a summary.

2. Data and Method

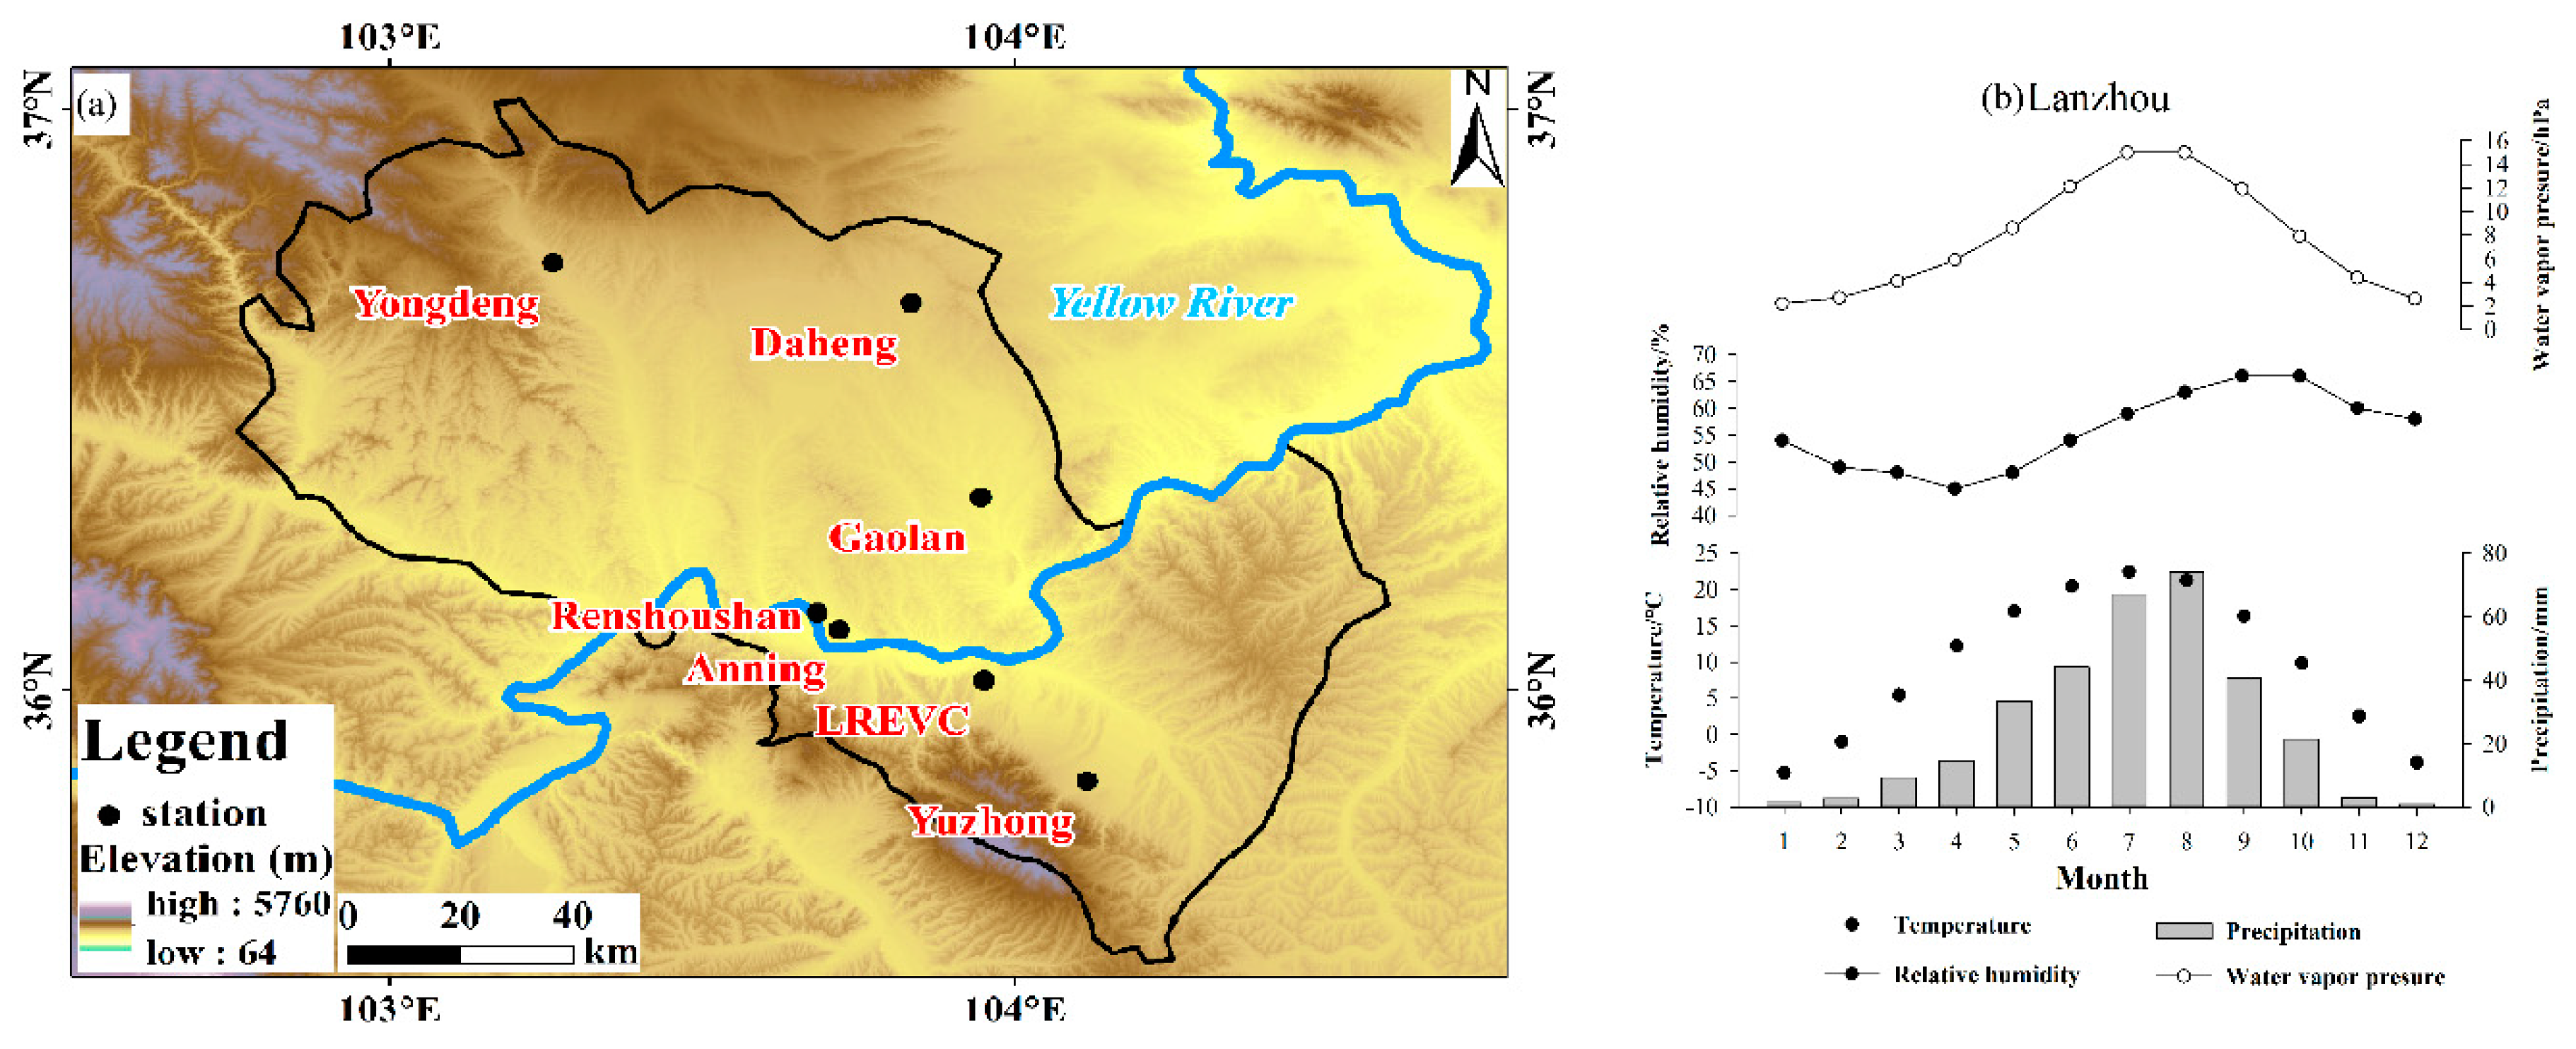
2.1. Sampling Network

Lanzhou city, ranging from 35°34′ to 37°07′ N and from 102°35′ to 104°34′ E, is situated in the east of Northwest China (Figure 1a). It is the provincial capital of Gansu, and the total area is 13,085.6 km2. The Yellow River goes across the urban area from southwest to northeast. The seasonal distribution of precipitation is uneven and mainly concentrates in the summer (Figure 1b). The temperature, relative humidity and vapor pressure are all the highest in summer and the lowest in winter.
In 2011, a city-scale network was established to collect event-based precipitation samples across Lanzhou city, and the database from 2011 to 2014 was compiled in Chen et al. [26]. The liquid precipitation samples collected were stored in 50 mL HDPE bottles, and then these bottles were placed in the refrigerator; the solid samples were filled into sealed bottles before they were melted at indoor temperature in zip-lock LDPE bags. Precipitation amount was measured by manual work, and air temperature, relative humidity during precipitation events were observed using the automatic weather stations. See the previous studies [26] for the basic characteristics of isotopic data during the period 2011–2014. In this study, we used the isotopic data in the seven stations, including Renshoushan, Anning, LREVC (Lanzhou Resources & Environment Voc-Tech College), Yuzhong, Yongdeng, Daheng and Gaolan (Table 1 and Figure 1), and the isotopic values in summer (June to August) to reexamine the moisture recycling in Lanzhou city.

2.2. Laboratory Testing

The precipitation samples were analyzed using a liquid water isotope analyzer LGR DLT-100 at the Stable Isotope Laboratory in Northwest Normal University. Of the six values measured for each sample, the first two values were discarded so as to eliminate the memory effect, and the means of the last four injections were used in the study. The experiment values are expressed as delta-values and relative to the Vienna Standard Mean Ocean Water (V-SMOW):
δ sample = R sample R standard δ standard × 1000
where δsample stands for ratio of 2H/1H or18O/16O in the samples relative to V-SMOW, Rsample stands for the ratio of 2H/1H or18O/16O in V-SMOW. The accuracy of measurement is ±0.6% for δ2H and ±0.2% for δ18O. See Chen et al. [26] for the details of laboratory testing.

2.3. Three-Component Mixing Model

The recycling fraction in precipitation (fre) usually includes plant transpiration (from plant stomata) and surface evaporation [16,31]:
f r e = P t r + P e v P t r + P e v + P a d v
where Ptr is the precipitation formed by transpiration vapor, Pev is the precipitation formed by surface evaporation vapor, and Padv is the precipitation formed by advection vapor. Considering the stable isotopic compositions in these vapor fluxes, the three-component mixing model can be expressed as follows:
δ 2 p v = δ 2 t r f t r + δ 2 e v f e v + δ 2 a d v f a d v
δ 18 p v = δ 18 t r f t r + δ 18 e v f e v + δ 18 a d v f a d v
1 = f t r + f e v + f a d v
where ftr, fev and fadv stand for the contribution rates to precipitation from transpiration, surface evaporation and advection, and δpv, δtr, δev and δadv stand for δ2H or δ18O in precipitating vapor, transpiration vapor, surface evaporation vapor and advection vapor.
The solutions for ftr, fev and fadv in terms of delta values can be expressed as follows [16]:
f t r = δ 18 p v δ 2 e v δ 18 p v δ 2 a d v + δ 18 e v δ 2 a d v δ 18 e v δ 2 p v + δ 18 a d v δ 2 p v δ 18 a d v δ 2 e v δ 18 t r δ 2 e v δ 18 t r δ 2 a d v + δ 18 e v δ 2 a d v δ 18 e v δ 2 t r + δ 18 a d v δ 2 t r δ 18 a d v δ 2 e v
f e v = δ 18 p v δ 2 a d v δ 18 p v δ 2 t r + δ 18 t r δ 2 p v δ 18 t r δ 2 a d v + δ 18 a d v δ 2 t r δ 18 a d v δ 2 p v δ 18 t r δ 2 e v δ 18 t r δ 2 a d v + δ 18 e v δ 2 a d v δ 18 e v δ 2 t r + δ 18 a d v δ 2 t r δ 18 a d v δ 2 e v
f a d v = δ 18 p v δ 2 t r δ 18 p v δ 2 e v + δ 18 t r δ 2 e v δ 18 t r δ 2 p v + δ 18 e v δ 2 p v δ 18 e v δ 2 t r δ 18 t r δ 2 e v δ 18 t r δ 2 a d v + δ 18 e v δ 2 a d v δ 18 e v δ 2 t r + δ 18 a d v δ 2 t r δ 18 a d v δ 2 e v
Under equilibrium fractionation, the isotopic compositions in precipitating vapor (δpv) are calculated using the measured stable isotopes in precipitation (δp) [32]. The equations can be expressed as follows:
2 δ P V 2 δ P 10 3 ( α W V 2 1 )
18 δ P V 18 δ P 10 3 ( α W V 18 1 )
where 2αwv and 18αwv stand for the equilibrium fractionation factors of stable isotopes between water and vapor, respectively. The values of 2αwv and 18αwv can be expressed as follows [33]:
α 2 = exp ( 24.844 × 10 3 T 2 76.248 T + 52.612 × 10 3 )
α 18 = exp ( 1.137 × 10 3 T 2 0.4156 T 2.0667 × 10 3 )
where T is condensing temperature in K. T is calculated using air temperate of lifting condensation level (LCL) [34]:
T L C T = T d ( 0.001296 T d + 0.1963 ) ( T T d )
where Td and T are dew point temperature and air temperature in °C at sampling site, respectively.
The isotopic composition of transpired vapor (δtr) is estimated using the average value of isotope values at the sampling sites for a long time (δp) [5,16].
δ t r δ P
The isotope compositions of the evaporated moisture (δev) are calculated by using a modified Craig–Gordon model [35,36]:
δ e v δ s h δ a d v ε * Δ ε 1 h
where δs represents isotopic composition of local surface water, which is the ratio of isotopes in precipitation at the sampling sites in summer; δadv represents isotopic composition of advection vapor, and h is the mean relative humidity in summer; ε* and Δε are equilibrium fractionation factor and kinetic fractionation factor, respectively; ε* and Δε can be expressed as follows [35,36]:
ε 2 * ( ) = 10 3 × ( 1 1 α 2 w v )
ε 18 * ( ) = 10 3 × ( 1 1 α 18 w v )
Δ ε 2 ( ) = 12.5 ( 1 h )
Δ ε 18 ( ) = 14.2 ( 1 h )
The isotope values of advection vapor (δadv) from the upwind site to target site are expressed as follows [16]:
δ a d v = δ p v a d v + 10 3 ( α w v 1 ) ln F
where δpvadv is isotope value of water vapor calculated using stable isotope in precipitation at upwind site, which can be expressed in Equations (8) and (9); F is the ratio of water vapor pressure from upwind site to target site [5,16].

3. Results

According to the simulated backward air trajectory [26,28], the upwind site can be determined in the study area. In this study, we divided the seven stations into two groups. For the southern group along the path of Renshoushan–Anning–LREVC–Yuzhong, Renshoushan was selected as the upwind site for Anning, Anning was selected for LREVC, and then LREVC was selected for Yuzhong. For the northern group along the path of Yongdeng–Daheng/Gaolan, Yongdeng was selected for Daheng and Gaolan. Based on stable isotope compositions (δ2H and δ18O) of precipitation and related meteorological parameters at each sampling station, the proportional contributions of advection, surface evaporation and transpiration to precipitation were calculated using a three-component mixing model.

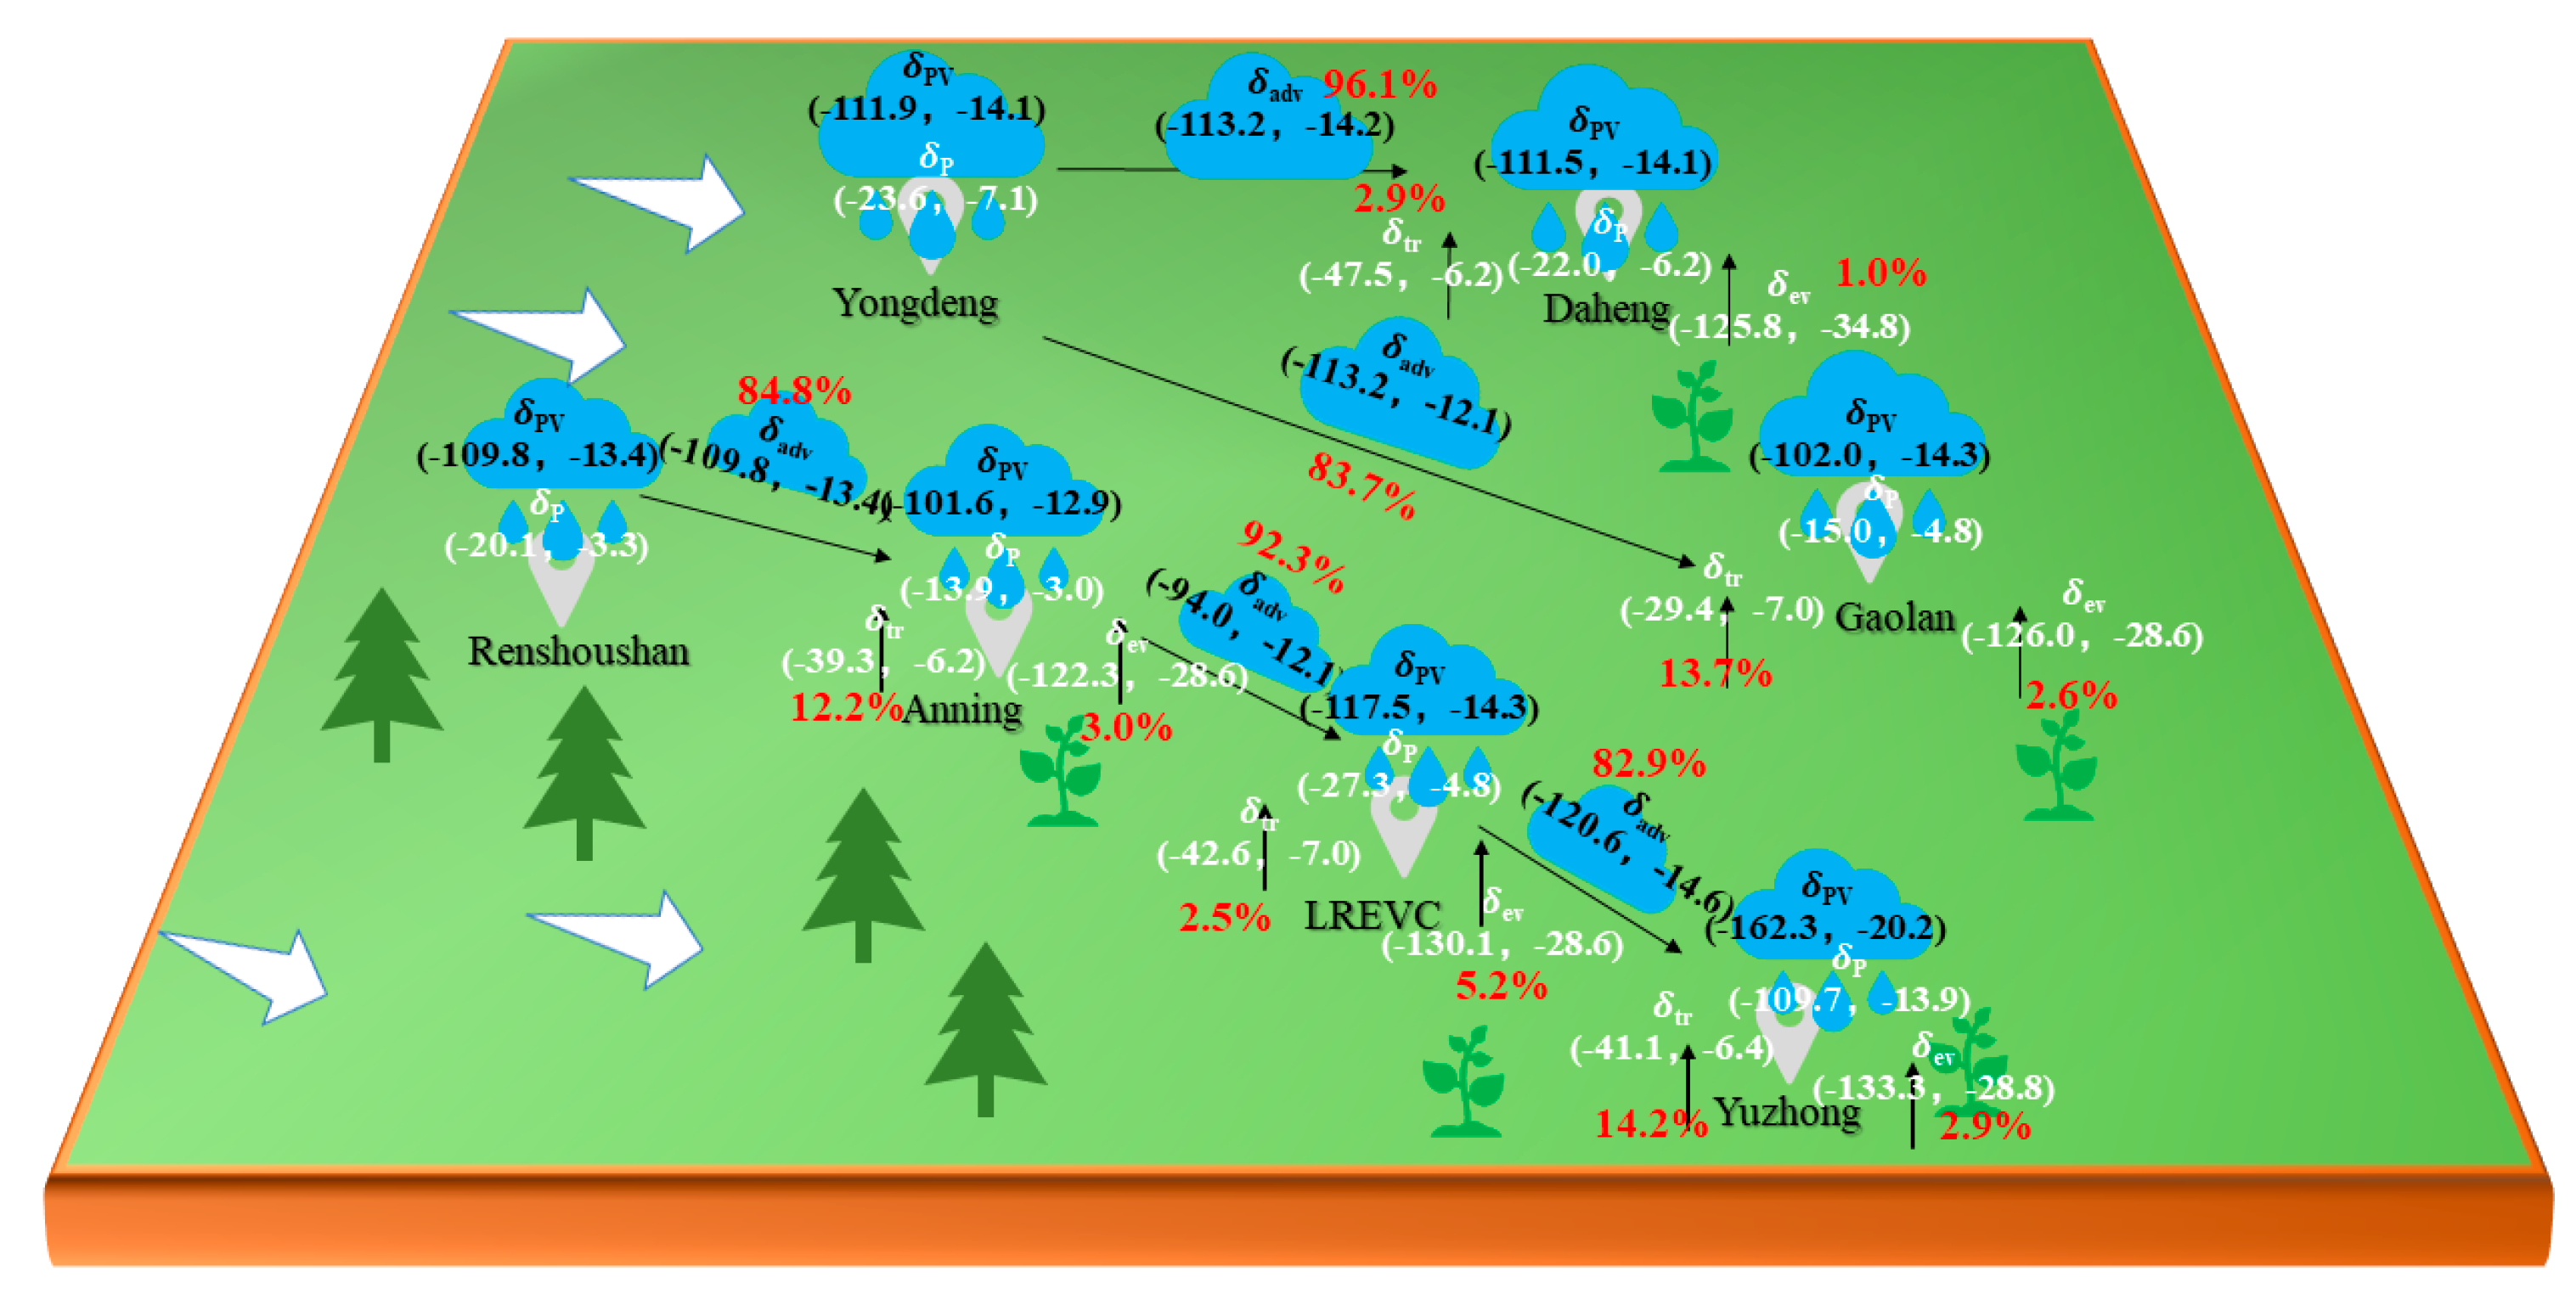
3.1. The Path of Renshoushan—Anning—LREVC—Yuzhong

Based on the stable isotopic compositions in precipitation at Renshoushan (2δp = −20.1‰, and 18δp = −3.3‰) and corresponding meteorological parameters (T = 16.2 °C), the isotope values of precipitating vapor at Renshoushan were calculated using Equations (9) and (10), that is, the δpv values were −109.8‰ for δ2H and −13.4‰ for δ18O, respectively. A similar procedure was applied to the rest of the stations. The δpv values for δ2H and δ18O were not the same at each station (Table 2); therefore, the Rayleigh distillation equation was applied. The stable isotopic values in advection vapor (δadv) were estimated using Equation (20). The value f was estimated using the ratio of water vapor pressure from upwind site to target site. For example, the value f at LREVC is a ratio of surface vapor pressure at LREVC (14.5 hPa) and Anning (15.8 hPa).
As shown in Table 2 and Figure 2, the proportional contributions for the three components (advection, surface evaporation and transpiration) in precipitation along the path from Renshoushan to Anning can be calculated, that is, the ftr value is 12.2%, the fev value is 3.0% and the fadv value is 84.8% at Anning. The contribution of transpiration in precipitation along the path from Renshoushan to Anning is more than that of evaporation in summer. On the contrary, in LREVC, the contribution of evaporation (fev = 5.2%) is higher than that of transpiration (ftr = 2.5%) from Anning to LREVC. The results from LREVC to Yuzhong (ftr = 14.2%, fev = 2.9%, and fadv = 82.9%) are similar to those from Renshoushan to Anning. The phenomenon above conforms to the regional characteristics in semi-arid arid settings. The building and population densities in Anning are much larger than those in LREVC, and the moisture contribution of transpiration is less than that of evaporation.

3.2. The Path of Yongdeng–Daheng/Gaolan

The isotope values of precipitating vapor at Yongdeng are estimated as 2δpv = −111.9‰ and 18δpv = −14.1‰. A similar procedure was applied to Daheng and Gaolan, respectively, and the isotope values in precipitating vapor at Daheng (2δpv = −111.5‰, and 18δpv = −14.1‰) and Gaolan (2δpv = −102.0‰, and 18δpv = −14.3‰) are slightly depleted relative to the upwind station Yongdeng. The stable isotope ratios in advection vapor at Daheng and Gaolan are listed in Table 3.
The contributions of transpiration and surface evaporation at Gaolan (ftr = 13.7%, and fev = 2.6%) are larger than those at Daheng (ftr = 2.9%, and fev = 1.0%) (Table 3 and Figure 2). The recycling fraction increases with the size of the study area. Figure 1 shows that the linear distance between Yongdeng and Gaolan is longer than that between Yongdeng and Daheng. The proportional contributions of transpiration in precipitation at Gaolan and Daheng are more than those of evaporation in summer. Taking the two paths in Figure 2 into consideration, although the contributions for the three components (advection, surface evaporation and transpiration) in precipitation are not the same along the different paths, the contribution of advection moisture is the largest of the three. The contributions of advection (fadv) are all more than 82.0%. The regional average contributions of advection (fadv) is 87.9% in summer. The regional average ftr and fev values are 9.1% and 2.9%, respectively.

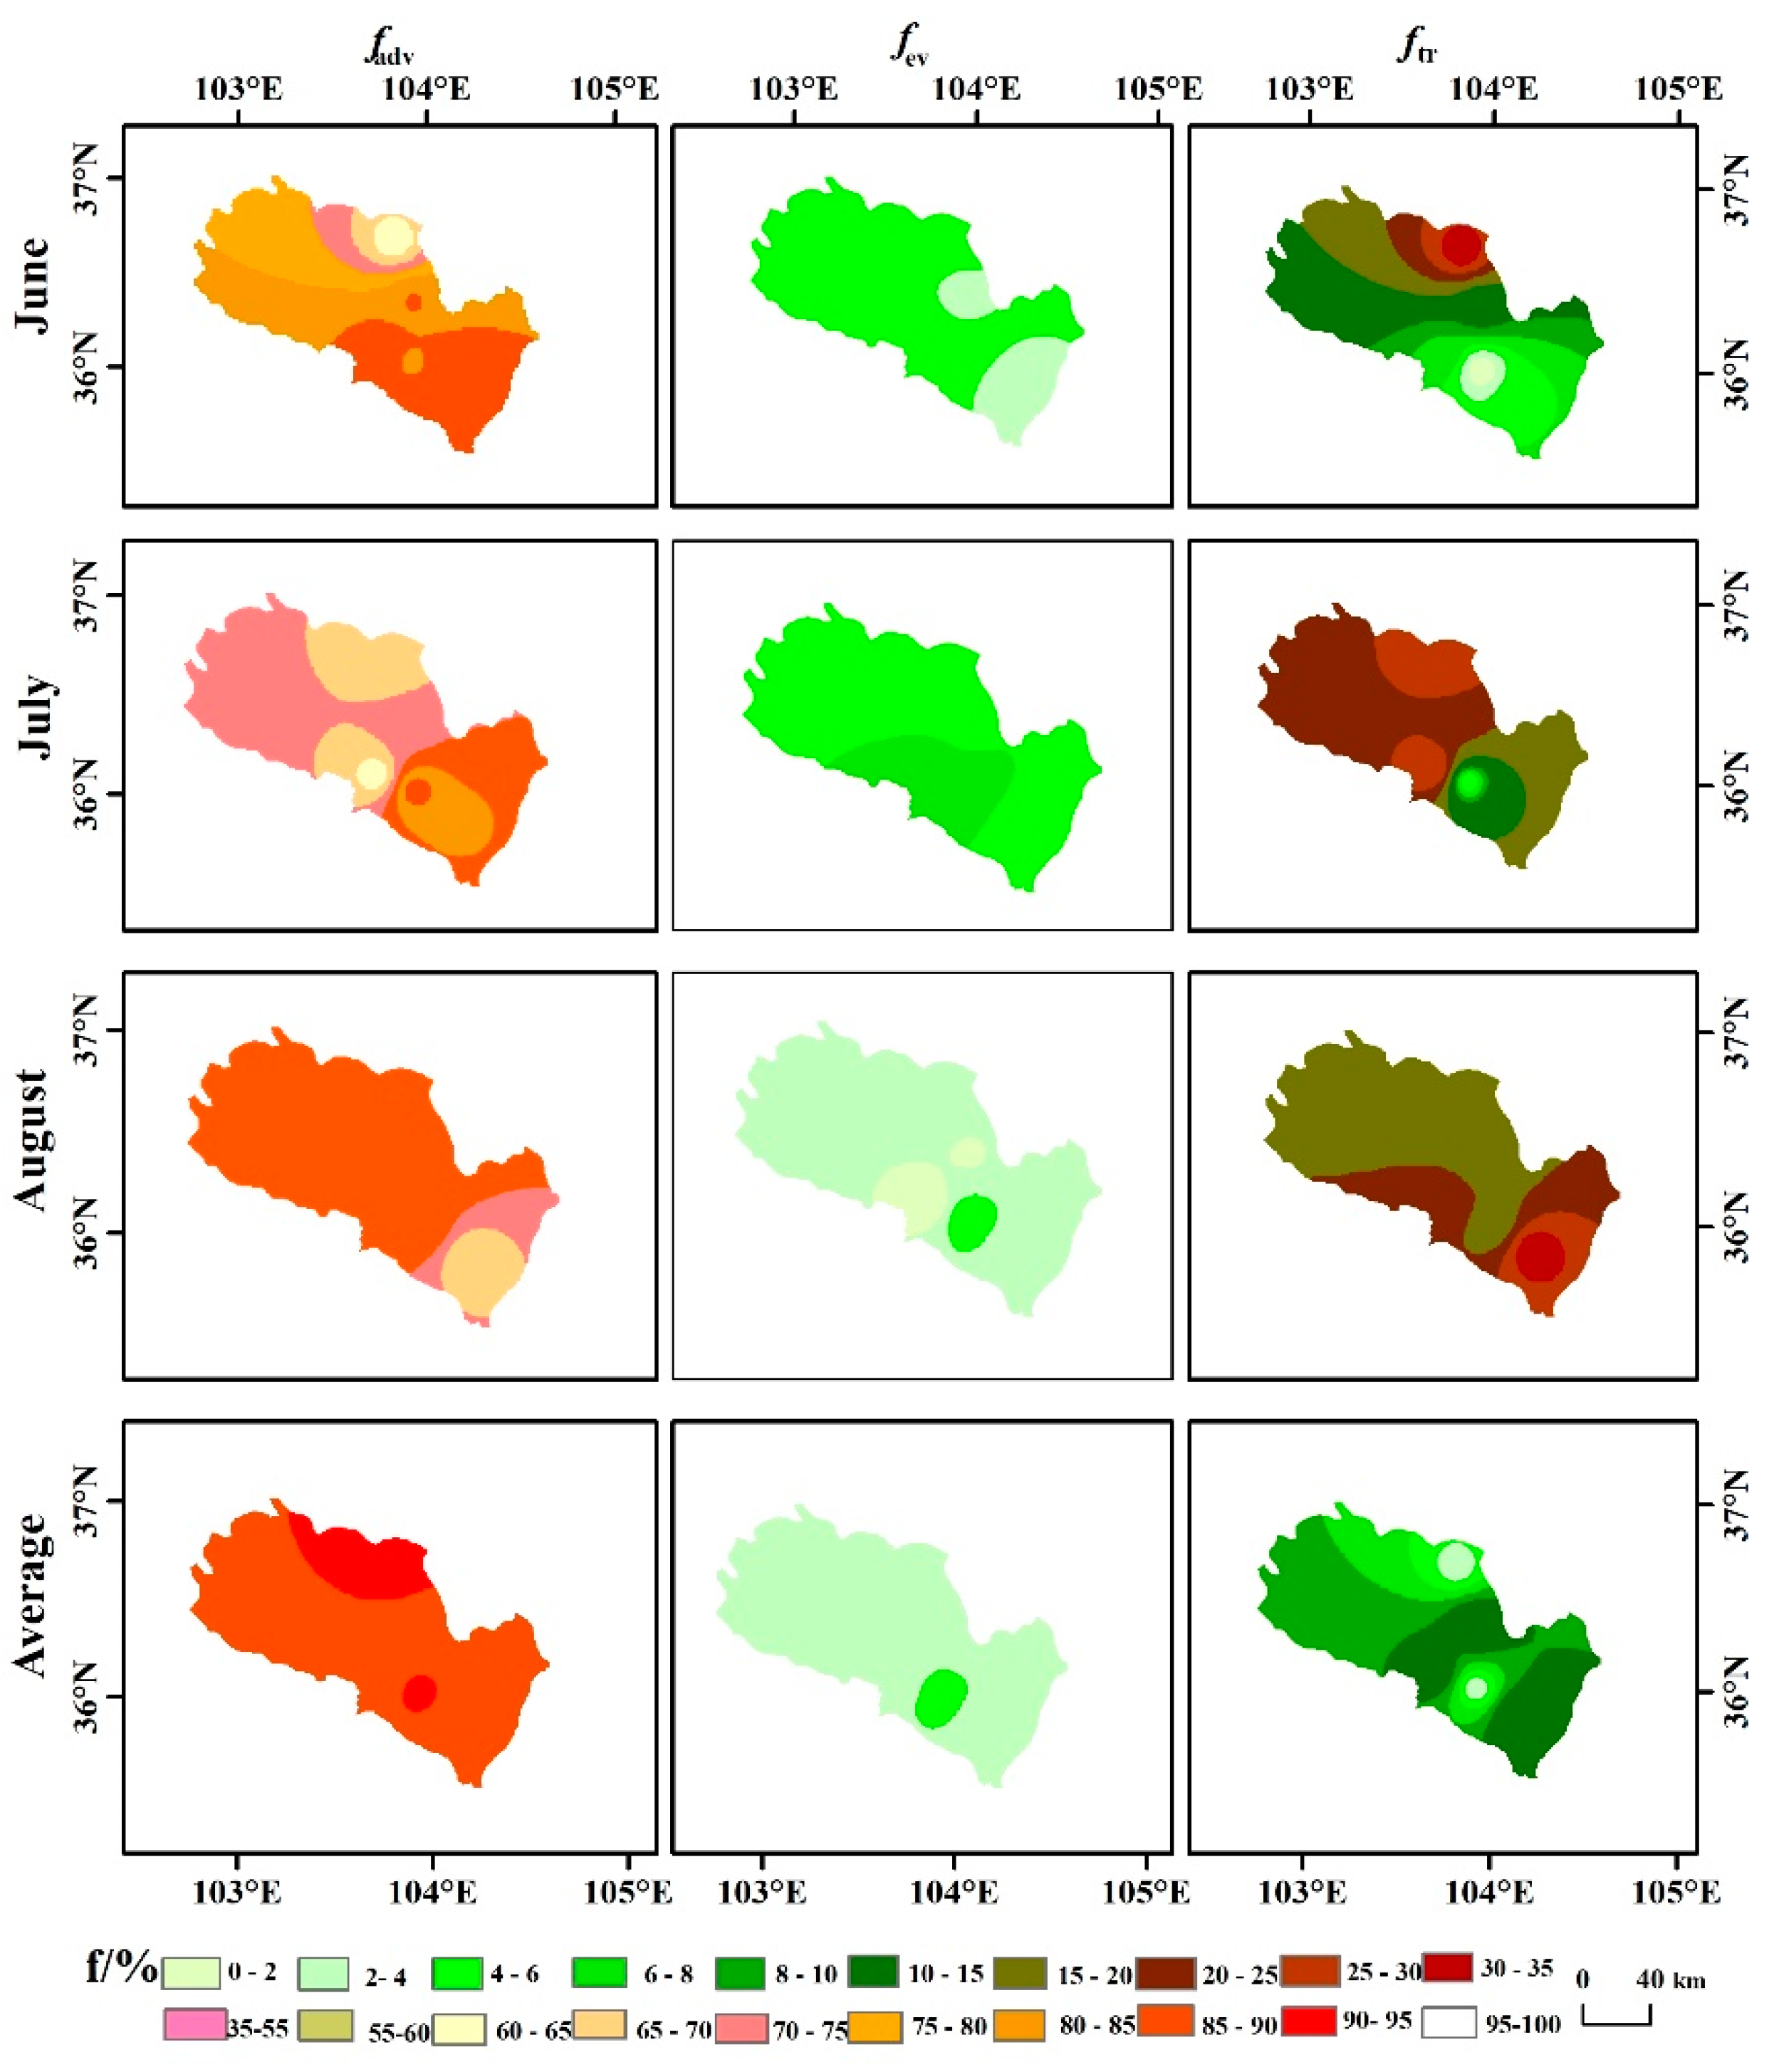
3.3. Spatial and Monthly Patterns of Recycling Fraction

The spatial patterns of recycling fractions are helpful to understand the potential controls of the local water cycle. Here, we focus on summer (June, July and August) when the evapotranspiration is relatively strong. As shown in Table 4, the proportional contributions of transpiration in precipitation at Anning, Yuzhong, Gaolan and Daheng are more than those of evaporation in each month. However, the proportional contributions of transpiration at LREVC are less than those of evaporation in June and July. As far as the overall contributions are concerned, advection vapor to precipitation is the largest in the study area, but the contribution of different water vapors to precipitation is unevenly distributed.
We also map the proportional contribution for each month using the inverse distance weighted interpolation in Figure 3. The contributions of advection vapor to precipitation in July and August are higher than those in June, and the high values are mostly distributed along the Yongdeng–Daheng/Gaolan path, and the low values are mainly distributed near Yuzhong. The proportional contributions of surface evaporation vapor to precipitation in June and July are significantly higher than those in August, and the high value is mainly distributed near Anning. Additionally, the contribution of transpiration vapor spatially varies. In June, the high value for transpiration is mainly distributed along the Yongdeng–Daheng/Gaolan path, and the high values in July and August are mainly distributed near Anning.

4. Discussion

4.1. Potential Spatial Controls of Recycling Fraction

The contributions for recycled moisture to local precipitation are logically related to the meteorological conditions (e.g., air temperature, precipitation amount and relative humidity), land cover (bare soil, water body, vegetation and so on) and spatial domain. As shown in previous case studies, the recycling fraction in the forest mountain area is usually higher than that in coastal plain area [16], and there is a significant correlation between relative humidity and moisture recycling fraction [37]. Figure 3 shows that the recycling fraction of the Yongdeng–Daheng/Gaolan path is high in June and July. As far as the Yongdeng station is concerned, there are the Tulugou National Forest Park and Qinglong Mountain in the Yongdeng county, and local vegetation coverage is relatively high. At the same time, for the Gaolan county, the Yellow River goes through its whole territory and there are many rivers in the region, which makes the relative humidity keep a relatively high level. However, due to the lack of the longer time series, the relationship between the recycling fraction and meteorological parameters, including air temperature, precipitation amount and relative humidity, should be carefully considered in the future.

4.2. Model Uncertainty Analysis

In a three-component mixing model, the water vapor isotope value of the upwind station is used to replace the advection vapor isotope value of the target station [16]. For the study region, the westerlies affect the air regime all year round, so we selected the western stations as the upwind station in the mixing model. That is, the influence of other upwind stations on the advection vapor isotopes was ignored. Regarding the transpiration moisture isotopic values, it is difficult to acquire a regional mean value of isotope ratios in xylem or stem water, as indicated in many in situ observations across Lanzhou city [38,39,40]. In the isotopic mixing model, the xylem water isotope values were usually replaced by the isotope values of precipitation or surface water available to plants [5,16], but the interannual variations of stable water isotopes do exist [15].
In addition, we present a map showing the spatial distribution of recycling fraction in Figure 3. Here, the spatial interpolation is based on the inverse distance weighting (IDW) method. This map is just a rough visualization of the recycling fraction, and many details cannot be well predicted in such a large domain. In our previous investigation about precipitation isoscape in Lanzhou city [26], the topography greatly impacted the spatial distribution of isotopic values. However, the main pattern can be described in Figure 3, and the IDW method has been widely applied in geoscience interpolation [41,42,43]. In the future, more attention should be paid to uncertainty on a spatial basis, although some recent error analysis focused on the linear mixing model or Bayesian estimation [5,7,37].

5. Conclusions

In this study, the moisture recycling fraction in Lanzhou city at the western Loess Plateau was analyzed by using a three-component mixing model.
(1) The results show that in the path of Renshoushan–Anning–LREVC–Yuzhong, the contributions of recycled moisture were about 15% for Anning and Yuzhong, while the contribution at LREVC was relatively low, which accounted for 7.7%. In the path of Yongdeng–Daheng/Gaolan, the proportional contribution of recycled moisture to precipitation in Daheng was lower than that in Gaolan, which was 3.9% and 16.3%, respectively.
(2) We mapped the fractions of different water vapor to precipitation in Lanzhou city in summer. The spatial differences of surface evaporation vapors were smaller than those of advected vapor and plant transpiration vapor. The high value of plant transpiration vapor was located in the Yongdeng–Daheng/Gaolan path in June and July, while the low value was located near Anning. On the contrary, the high contribution ratio of advected vapor to precipitation was located near Anning. The spatial differences of contribution rates of different water vapors to precipitation in August were smaller than those in June and July.

Author Contributions

Conceptualization, M.Z. and S.W.; software, F.C.; validation, F.C.; formal analysis, F.C.; investigation, F.C.; methodology, X.W. and A.A.A.; resources, S.W., X.Z. and J.C.; data curation, F.C.; writing—original draft preparation, F.C.; writing—review and editing, F.C., M.Z. and S.W.; supervision, M.Z.; funding acquisition, M.Z. and S.W. All authors have read and agreed to the published version of the manuscript.

Funding

The study has financially supported by National Natural Science Foundation of China (42071047, 41771035, 41867030 and 41971036), the Foundation for Distinguished Young Scholars of Gansu Province (20JR10RA112), and the Scientific Research Program of Higher Education Institutions of Gansu Province (No. 2018C-02).

Institutional Review Board Statement

This study is not applicable for ethical review and approval.

Acknowledgments

The authors thank the colleagues of the Northwest Normal University for their help in field work, laboratory analyses, data processing and so on.

Conflicts of Interest

The authors declare no conflict of interest. The work described here has not been submitted elsewhere for publication, in whole or in part, and all the authors listed have approved the manuscript that is enclosed.

References

  1. Savenije, H.H. New definitions for moisture recycling and the relationship with land-use changes in the Sahel. J. Hydrol. 1995, 167, 57–78. [Google Scholar] [CrossRef]
  2. Dominguez, F.; Kumar, P.; Liang, X.-Z.; Ting, M. Impact of Atmospheric Moisture Storage on Precipitation Recycling. J. Clim. 2006, 19, 1513–1530. [Google Scholar] [CrossRef]
  3. Van der Ent, R.J.; Savenije, H.H.G.; Schaeflfli, B.; Steele-Dunne, S.C. Origin and fate of atmospheric moisture over continents. Water Resour. Res. 2010, 46, W09525. [Google Scholar] [CrossRef] [Green Version]
  4. Gao, Y.; Chen, F.; Miguez-Macho, G.; Li, X. Understanding precipitation recycling over the Tibetan Plateau using tracer analysis with WRF. Clim. Dyn. 2020, 55, 2921–2937. [Google Scholar] [CrossRef]
  5. Wang, S.; Zhang, M.; Che, Y.; Chen, F.; Qiang, F. Contribution of recycled moisture to precipitation in oases of arid central Asia: A stable isotope approach. Water Resour. Res. 2016, 52, 3246–3257. [Google Scholar] [CrossRef] [Green Version]
  6. Wu, P.; Ding, Y.; Liu, Y.; Li, X. The characteristics of moisture recycling and its impact on regional precipitation against the background of climate warming over Northwest China. Int. J. Clim. 2019, 39, 5241–5255. [Google Scholar] [CrossRef]
  7. Qiu, X.; Zhang, M.; Dong, Z.; Wang, S.; Yu, X.; Meng, H.; Che, C. Contribution of recycled moisture to precipitation in Northeastern Tibetan Plateau: A case study based on Bayesian estimation. Atmosphere 2021, 12, 731. [Google Scholar] [CrossRef]
  8. Zhang, M.; Wang, S. A review of precipitation isotope studies in China: Basic pattern and hydrological process. J. Geogr. Sci. 2016, 26, 921–938. [Google Scholar] [CrossRef] [Green Version]
  9. Li, R.; Wang, C.; Wu, D. Changes in precipitation recycling over arid regions in the Northern Hemisphere. Theor. Appl. Clim. 2018, 131, 489–502. [Google Scholar] [CrossRef] [Green Version]
  10. Hua, L.; Zhong, L.; Ke, Z. Characteristics of the precipitation recycling ratio and its relationship with regional precipitation in China. Theor. Appl. Climatol. 2015, 127, 513–531. [Google Scholar] [CrossRef]
  11. Aemisegger, F.; Pfahl, S.; Sodemann, H.; Lehner, I.; Seneviratne, S.I.; Wernli, H. Deuterium excess as a proxy for continental moisture recycling and plant transpiration. Atmos. Chem. Phys. Discuss. 2014, 14, 4029–4054. [Google Scholar] [CrossRef] [Green Version]
  12. Li, X.; Lu, A.; Feng, Q.; Li, Z.; Liu, W.; Wang, S.; Tripathee, L.; Wang, X.; Cao, J. Recycled moisture in an enclosed basin, Guanzhong Basin of Northern China, in the summer: Contribution to precipitation based on a stable isotope approach. Environ. Sci. Pollut. Res. 2020, 27, 27926–27936. [Google Scholar] [CrossRef]
  13. Kong, Y.; Pang, Z.; Froehlich, K. Quantifying recycled moisture fraction in precipitation of an arid region using deuterium excess. Tellus B Chem. Phys. Meteorol. 2013, 65, 19251. [Google Scholar] [CrossRef]
  14. Corcoran, M.C.; Thomas, E.K.; Boutt, D.F. Event-based precipitation isotopes in the Laurentian Great Lakes region reveal spatiotemporal patterns in moisture recycling. J. Geophys. Res. Atmos. 2019, 124, 5463–5478. [Google Scholar] [CrossRef]
  15. Zhang, M.J.; Wang, S.J. Precipitation isotopes in the Tianshan Mountains as a key to water cycle in arid central Asia. Sci. Cold Arid. Reg. 2018, 10, 27–37. [Google Scholar]
  16. Peng, T.R.; Liu, K.K.; Wang, C.H.; Chuang, K.H. A water isotope approach to assessing moisture recycling in the island-based precipitation of Taiwan: A case study in the western Pacific. Water Resour. Res. 2011, 47, W08507. [Google Scholar] [CrossRef]
  17. Sun, C.; Chen, Y.; Li, J.; Chen, W.; Li, X. Stable isotope variations in precipitation in the northwesternmost Tibetan Plateau related to various meteorological controlling factors. Atmos. Res. 2019, 227, 66–78. [Google Scholar] [CrossRef]
  18. Li, Z.; Feng, Q.; Wang, Q.J.; Yanlong, K.; Aifang, C.; Song, Y.; Yongge, L.; Jianguo, L.; Xiaoyan, G. Contributions of local terrestrial evaporation and transpiration to precipitation using δ18O and D-excess as a proxy in Shiyang inland river basin in China. Global Planet. Chang. 2016, 146, 140–151. [Google Scholar]
  19. Good, S.P.; Noone, D.; Bowen, G. Hydrologic connectivity constrains partitioning of global terrestrial water fluxes. Science 2015, 349, 175–177. [Google Scholar] [CrossRef] [Green Version]
  20. Li, X.; Gentine, P.; Lin, C.; Zhou, S.; Sun, Z.; Zheng, Y.; Liu, J.; Zheng, C. A simple and objective method to partition evapotranspiration into transpiration and evaporation at eddy-covariance sites. Agric. For. Meteorol. 2019, 265, 171–182. [Google Scholar] [CrossRef]
  21. Tian, F.; Qiu, G.; Yang, Y.; Lü, Y.; Xiong, Y. Estimation of evapotranspiration and its partition based on an extended three-temperature model and MODIS products. J. Hydrol. 2013, 498, 210–220. [Google Scholar] [CrossRef]
  22. Yoshimura, K. Stable Water Isotopes in Climatology, Meteorology, and Hydrology: A Review. J. Meteorol. Soc. Jpn. 2015, 93, 513–533. [Google Scholar] [CrossRef] [Green Version]
  23. Hu, Q.; Jiang, D.; Lang, X.; Xu, B. Moisture sources of the Chinese Loess Plateau during 1979–2009. Palaeogeogr. Palaeoclim. Palaeoecol. 2018, 509, 156–163. [Google Scholar] [CrossRef]
  24. Zhang, C.; Zhao, C.; Yu, Z.; Zhang, H.; Zhou, A.; Zhang, X.; Feng, X.; Sun, X.; Shen, J. Western Pacific Ocean influences on monsoon precipitation in the southwestern Chinese Loess Plateau since the mid-Holocene. Clim. Dyn. 2020, 54, 3121–3134. [Google Scholar] [CrossRef]
  25. Tan, L.; An, Z.; Huh, C.-A.; Cai, Y.; Shen, C.-C.; Shiau, L.-J.; Yan, L.; Cheng, H.; Edwards, R.L. Cyclic precipitation variation on the western Loess Plateau of China during the past four centuries. Sci. Rep. 2015, 4, 6381. [Google Scholar] [CrossRef] [Green Version]
  26. Chen, F.; Zhang, M.; Wang, S.; Qiu, X.; Du, M. Environmental controls on stable isotopes of precipitation in Lanzhou, China: An enhanced network at city scale. Sci. Total Environ. 2017, 609, 1013–1022. [Google Scholar] [CrossRef] [PubMed]
  27. Chen, F.; Zhang, M.; Wang, S.; Ma, Q.; Zhu, X.; Dong, L. Relationship between sub-cloud secondary evaporation and stable isotopes in precipitation of Lanzhou and surrounding area. Quat. Int. 2015, 380–381, 68–74. [Google Scholar] [CrossRef]
  28. Chen, F.; Zhang, M.; Argiriou, A.A.; Wang, S.; Zhou, X.; Liu, X. Deuterium Excess in Precipitation Reveals Water Vapor Source in the Monsoon Margin Sites in Northwest China. Water 2020, 12, 3315. [Google Scholar] [CrossRef]
  29. Chen, F.; Zhang, M.; Argiriou, A.A.; Wang, S.; Ma, Q.; Zhou, X.; Wu, X.; Chen, J. Modeling Insights into Precipitation Deuterium Excess as an Indicator of Raindrop Evaporation in Lanzhou, China. Water 2021, 13, 193. [Google Scholar] [CrossRef]
  30. Ma, Q.; Zhang, M.; Wang, S.; Wang, Q.; Liu, W.; Li, F.; Chen, F. An investigation of moisture sources and secondary evaporation in Lanzhou, Northwest China. Environ. Earth Sci. 2013, 71, 3375–3385. [Google Scholar] [CrossRef]
  31. Brubaker, K.L.; Entekhabi, D.; Eagleson, P.S. Estimation of continental precipitation recycling. J. Clim. 1993, 6, 1077–1089. [Google Scholar] [CrossRef] [Green Version]
  32. Friedman, I.; O’Neil, J.R. Compilation of Stable Isotope Fractionation Factors of Geochemical Interest; Data of Geochemistry; U. S. Department of the Interior: Washington, DC, USA, 1977. [CrossRef] [Green Version]
  33. Criss, R.E. Principles of Stable Isotope Distribution; Oxford University: New York, NY, USA, 1999. [Google Scholar]
  34. Barnes, S.L. An empirical shortcut to the calculation of temperature and pressure at the lifted condensation level. J. Appl. Meteorol. 1968, 7, 511. [Google Scholar] [CrossRef] [Green Version]
  35. Craig, H.; Gordon, L.I. Deuterium and Oxygen 18 Variations in the Ocean and the Marine Atmosphere in Stable Isotopes in Oceanographic Studies and Paleotemperatures; Laboratory of Geology and Nuclear Science: Pisa, France, 1965; pp. 9–130. [Google Scholar]
  36. Gat, J.R. Oxygen and hydrogen isotopes in the hydrologic cycle. Annu. Rev. Earth Planet. Sci. 1996, 24, 225–262. [Google Scholar] [CrossRef] [Green Version]
  37. Zhao, L.; Liu, X.; Wang, N.; Kong, Y.; Song, Y.; He, Z.; Liu, Q.; Wang, L. Contribution of recycled moisture to local precipitation in the inland Heihe River Basin. Agric. For. Meteorol. 2019, 271, 316–335. [Google Scholar] [CrossRef]
  38. Zhang, Y.; Zhang, M.; Qu, D.; Duan, W.; Wang, J.; Su, P.; Guo, R. Water use strategies of dominant species (Caragana korshinskii and Reaumuria soongorica) in natural shrubs based on stable isotopes in the Loess Hill, China. Water 2020, 12, 1923. [Google Scholar] [CrossRef]
  39. Du, Q.; Zhang, M.; Wang, S.; Argiriou, A.A.; Che, C.; Zhao, P.; Ma, Z.; Su, P. Plant water resource partitioning and xylem-to-leaf deuterium enrichment in Lanzhou, northwest China. Water Supply 2020, 20, 1127–1140. [Google Scholar] [CrossRef]
  40. Che, C.; Zhang, M.; Argiriou, A.A.; Wang, S.; Du, Q.; Zhao, P.; Ma, Z.; Yung, P. The Stable Isotopic Composition of Different Water Bodies at the Soil–Plant–Atmosphere Continuum (SPAC) of the Western Loess Plateau, China. Water 2019, 11, 1742. [Google Scholar] [CrossRef] [Green Version]
  41. Li, Z.L. An enhanced dual IDW method for high-quality geospatial interpolation. Sci. Rep. 2021, 11, 9903. [Google Scholar] [CrossRef]
  42. Huang, F.; Liu, D.S.; Tan, X.C.; Wang, J.; Chen, Y.P.; He, B.B. Explorations of the implementation of a parallel IDW interpolation algorithm in a Linux cluster-based parallel GIS. Comput. Geosci. 2011, 37, 426–434. [Google Scholar] [CrossRef]
  43. Wu, J.; Zheng, C.; Chien, C.C. Cost-effective sampling network design for contaminant plume monitoring under general hydrogeological conditions. J. Contam. Hydrol. 2005, 77, 41–65. [Google Scholar] [CrossRef]
Figure 1. (a) Spatial distribution of sampling sites in Lanzhou city; (b) Monthly variation of air temperature, precipitation amount, relative humidity and water vapor pressure in Lanzhou city during 1981–2010.
Water 13 01783 g001
Figure 2. Moisture recycling pattern along the trajectories of Renshoushan–Anning–LREVC–Yuzhong and Yongdeng–Daheng/Gaolan based on a three-component mixing model.
Water 13 01783 g002
Figure 3. Spatial distribution of proportional contribution of each water vapor fluxes to precipitation in Lanzhou city.
Water 13 01783 g003
Table 1. Latitude, longitude and altitude of sampling stations in Lanzhou city used in this study.
StationLatitude NLongitude EAltitude/m
Renshoushan36°08′103°41′1657
Anning36°06′103°44′1548
LREVC36°01′103°57′1725
Yuzhong35°52′104°09′1874
Yongdeng36°45′103°15′2119
Daheng36°40′103°50′2029
Gaolan36°21′103°56′1669
Table 2. Proportions of advected and recycled water vapor along the path of Renshoushan–Anning–LREVC–Yuzhong in summer.
AnningLREVCYuzhong
δ2Hδ18Oδ2Hδ18Oδ2Hδ18O
δp/‰−13.9−3.0−27.3−4.8−19.8−3.7
δpv/‰−101.6−12.9−117.5−14.3−109.7−13.9
δtr/‰−39.3−6.2−42.6−7.0−41.1−6.4
δev/‰−122.3−28.6−130.1−28.6−133.3−28.8
δadv/‰−109.8−13.4−94.0−12.1−120.6−14.6
ftr/%12.22.514.2
fev/%3.05.22.9
fadv/%84.892.382.9
Table 3. Proportions of advected and recycled water vapor over the path of Yongdeng–Daheng/Gaolan in summer.
DahengGaolan
δ2Hδ18Oδ2Hδ18O
δp/‰−22.0−6.2−15.0−4.8
δpv/‰−111.5−14.1−102.0−14.3
δtr/‰−47.5−6.2−29.4−7.0
δev/‰−125.8−34.8−126.0−28.6
δadv/‰−113.2−14.2−113.2−12.1
ftr/%2.913.7
fev/%1.02.6
fadv/%96.183.7
Table 4. Proportion of advected and recycled water vapor during summer months based on three-component mixing model.
Upwind StationTarget StationMonthftr/%fev/%fadv/%
RenshoushanAnningJune7.45.287.4
July32.06.461.6
August24.40.375.3
LREVCJune0.25.284.6
July4.07.988.1
August13.96.279.9
YuzhongJune5.43.191.5
July15.04.081.0
August34.22.163.7
YongdengDahengJune33.64.761.7
July30.54.565.5
August14.54.081.5
GaolanJune11.33.485.3
July20.95.873.3
August16.01.782.3
Publisher’s Note: MDPI stays neutral with regard to jurisdictional claims in published maps and institutional affiliations.

