Assessment of Heavy Metal Pollution Levels in Sediments and of Ecological Risk by Quality Indices, Applying a Case Study: The Lower Danube River, Romania

 , and
, and
Abstract
:1. Introduction
2. Materials and Methods
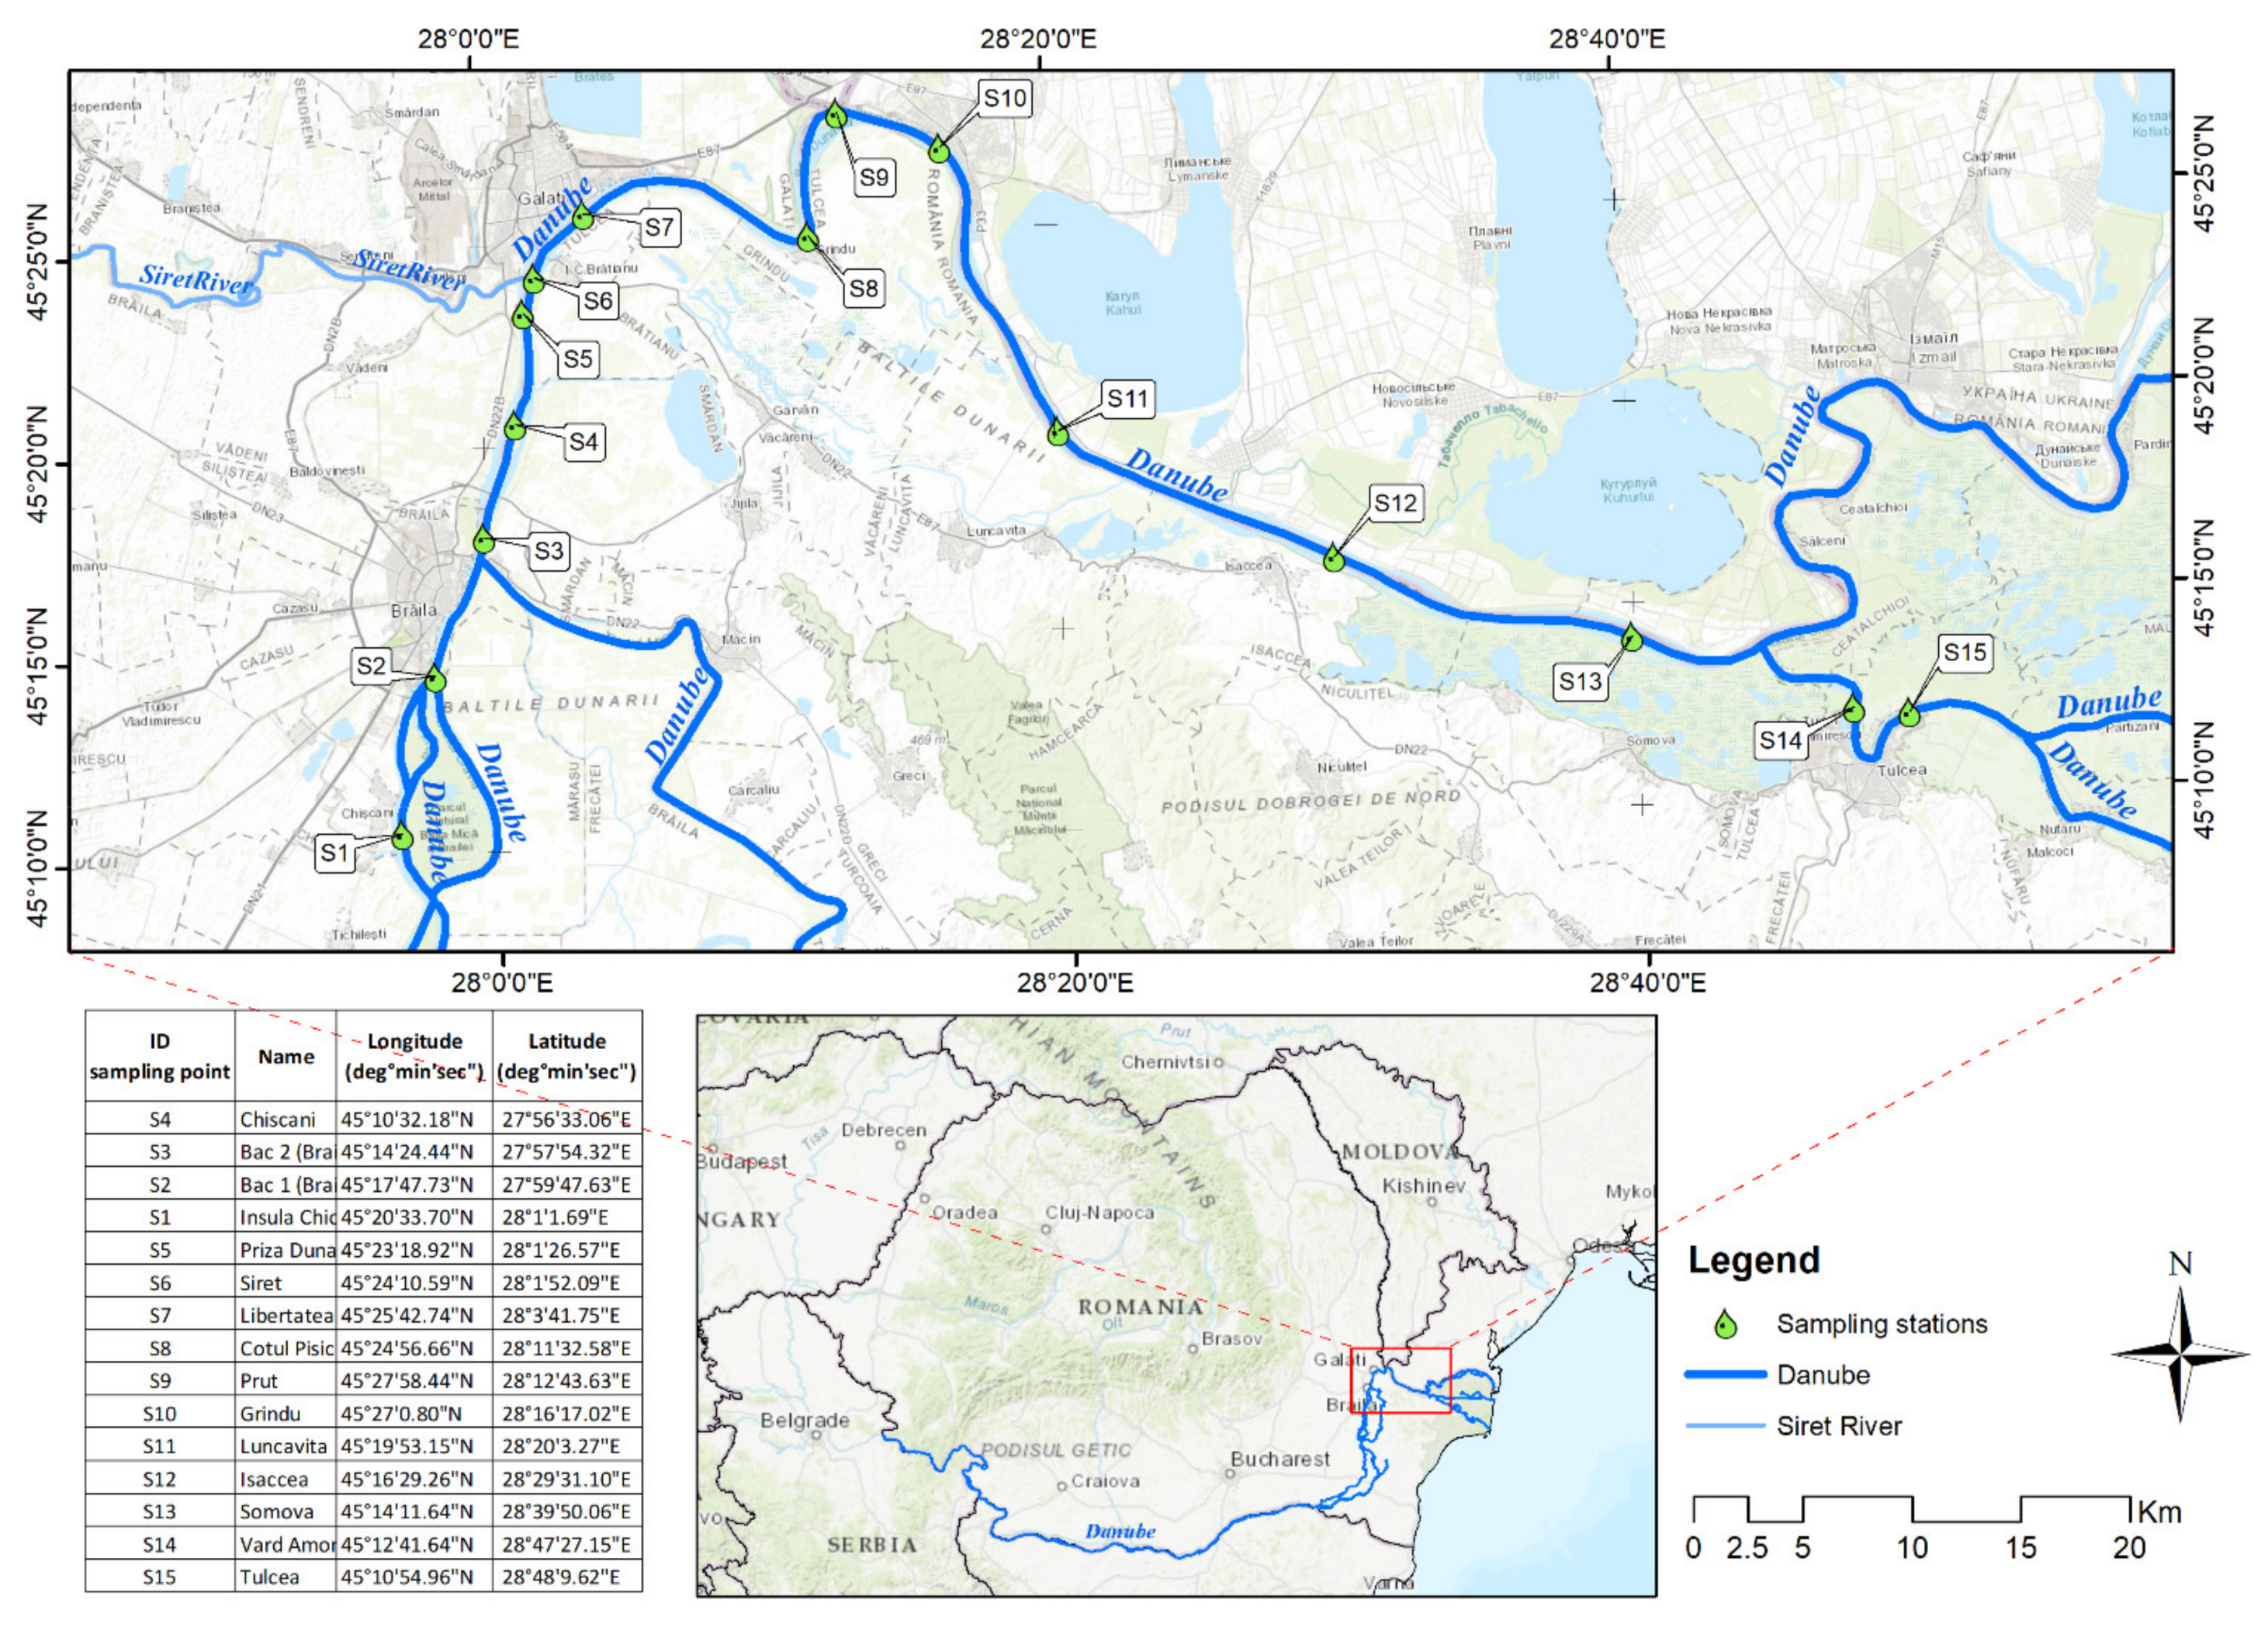
2.1. Study Area
2.2. Sample Collection and Analysis
2.3. Methods for Assessing Anthropogenic Contributions to Heavy Metal Sediment Pollution
2.3.1. Calculation of the Geo–Accumulation Index (Igeo)
2.3.2. Calculation of the Contamination Factor (CF)
2.3.3. Calculation of the Pollution Load Index (PLI)
2.4. Method for Assessing the Potential Risks of Heavy Metals
Calculation of Potential Ecological Risk Index (RI)
3. Results and Discussion
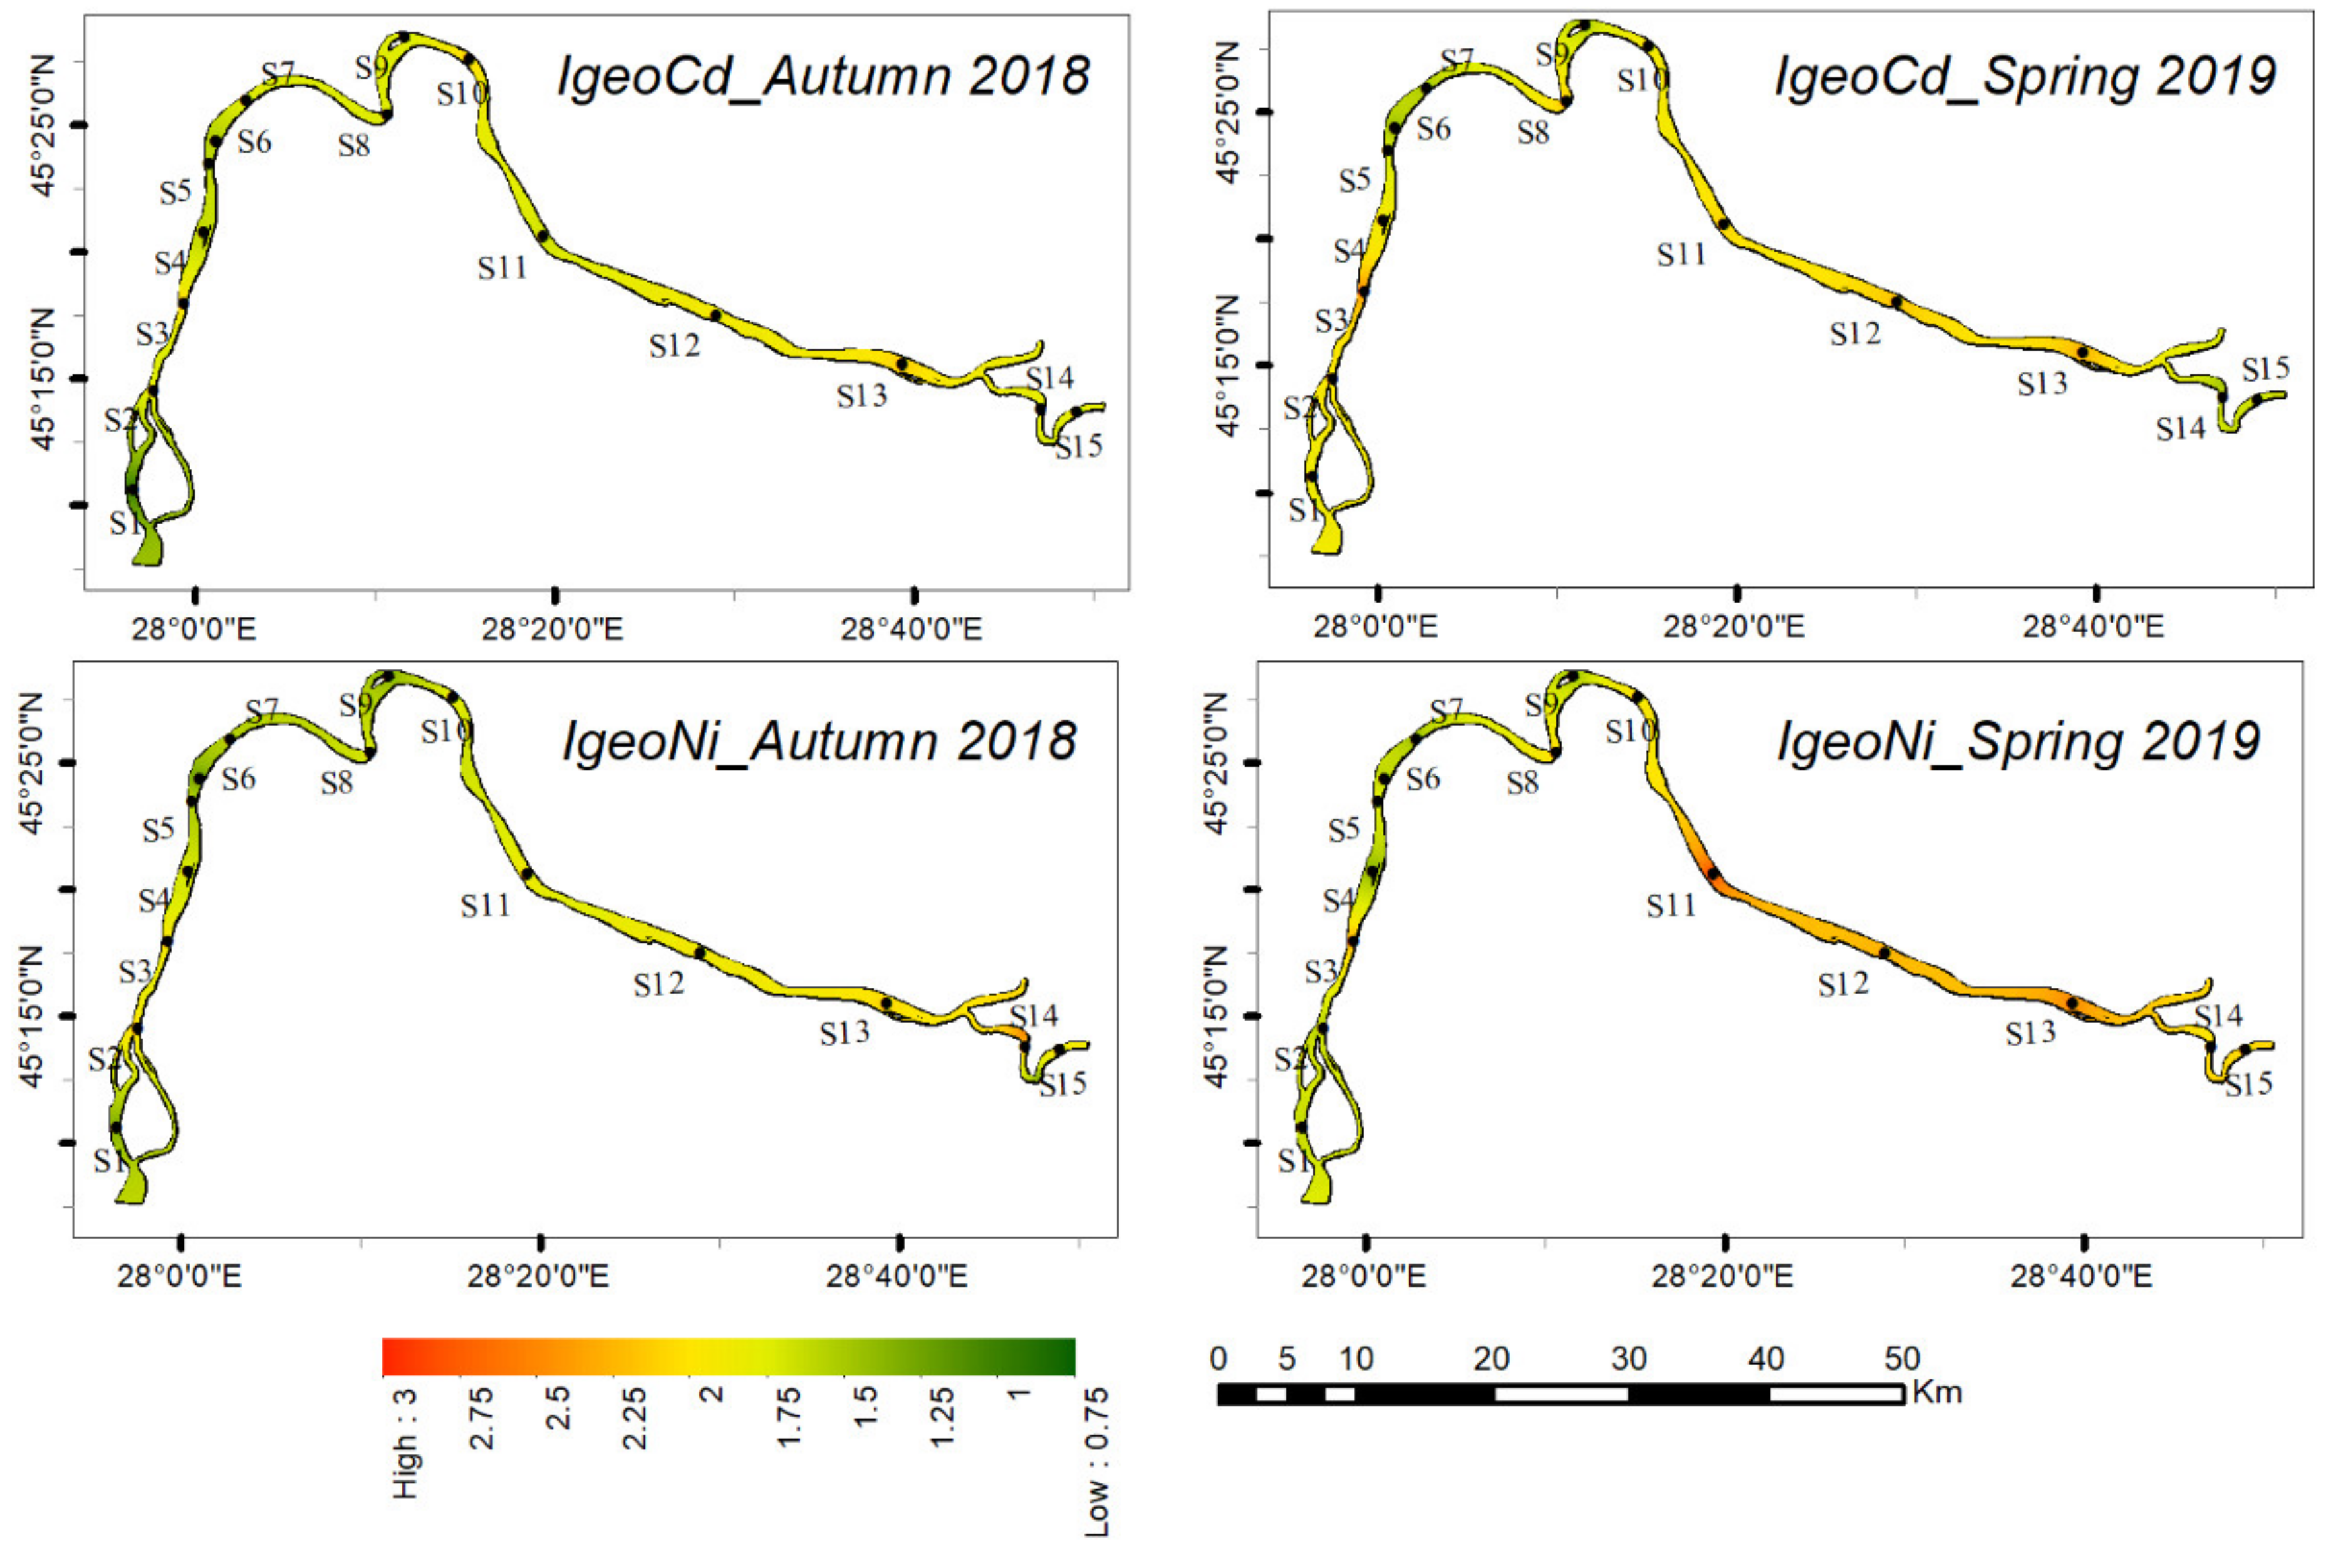
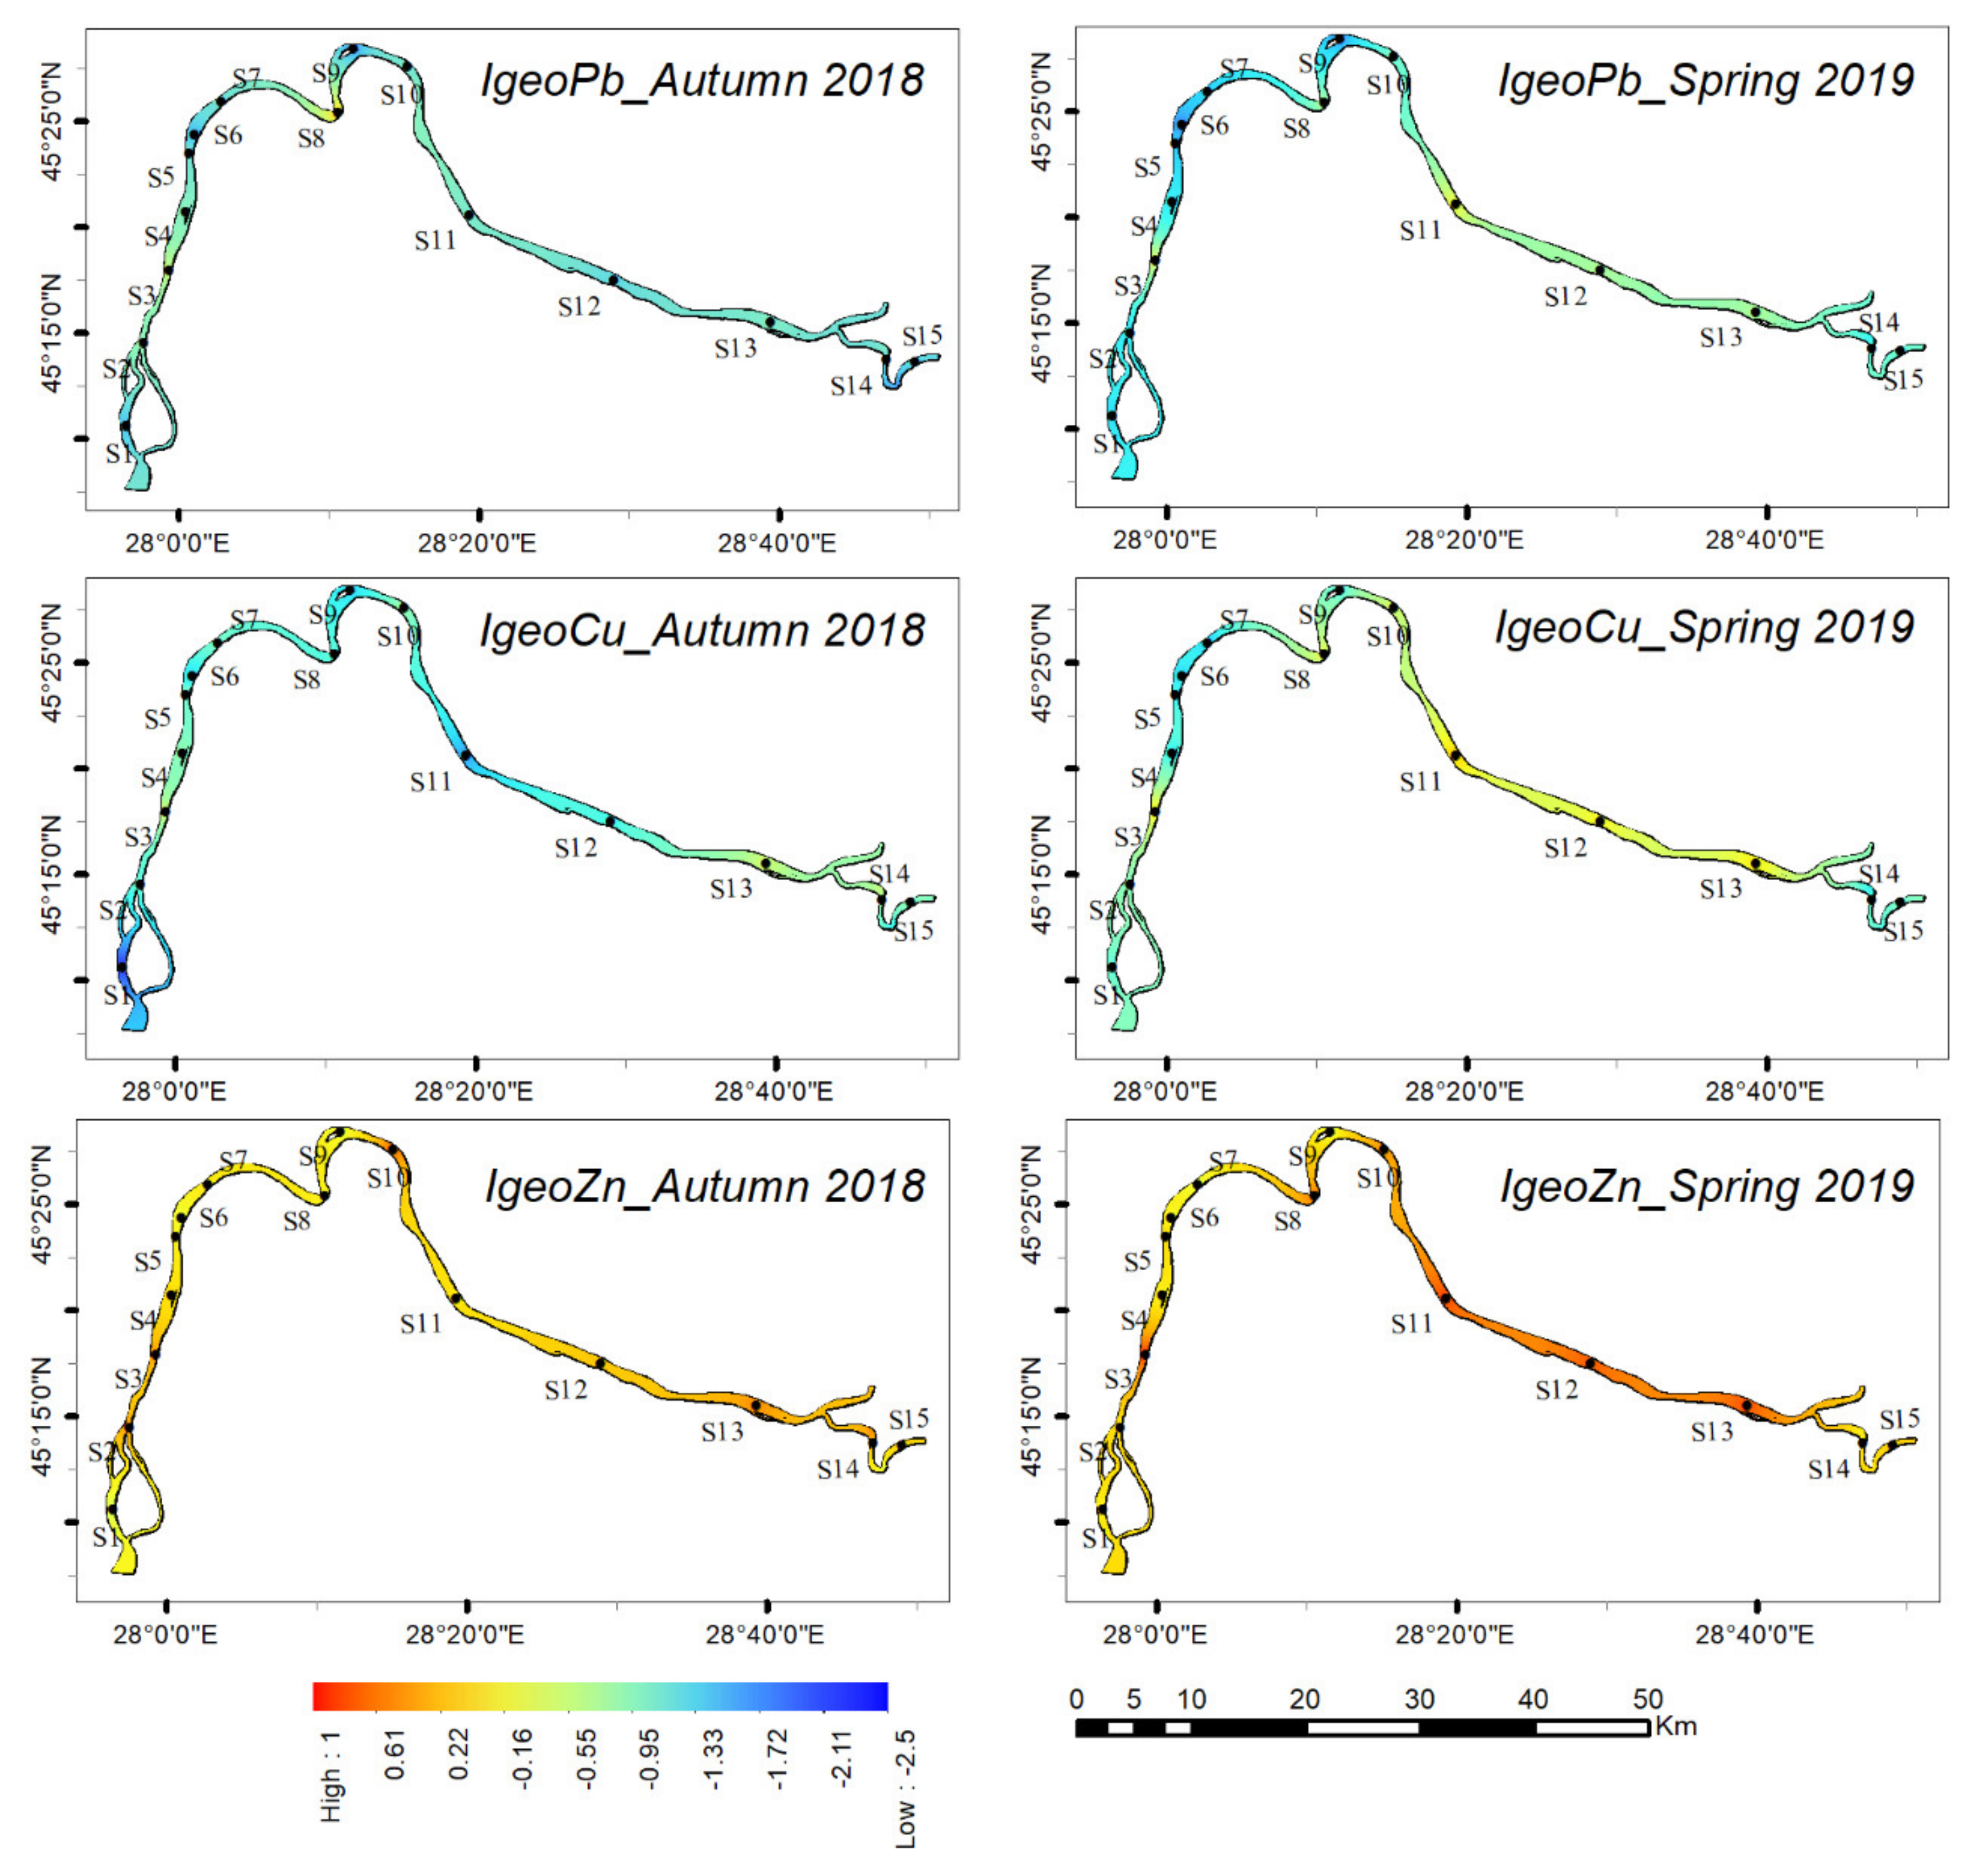
3.1. Spatial Distribution of Geo–Accumulation Index (Igeo)
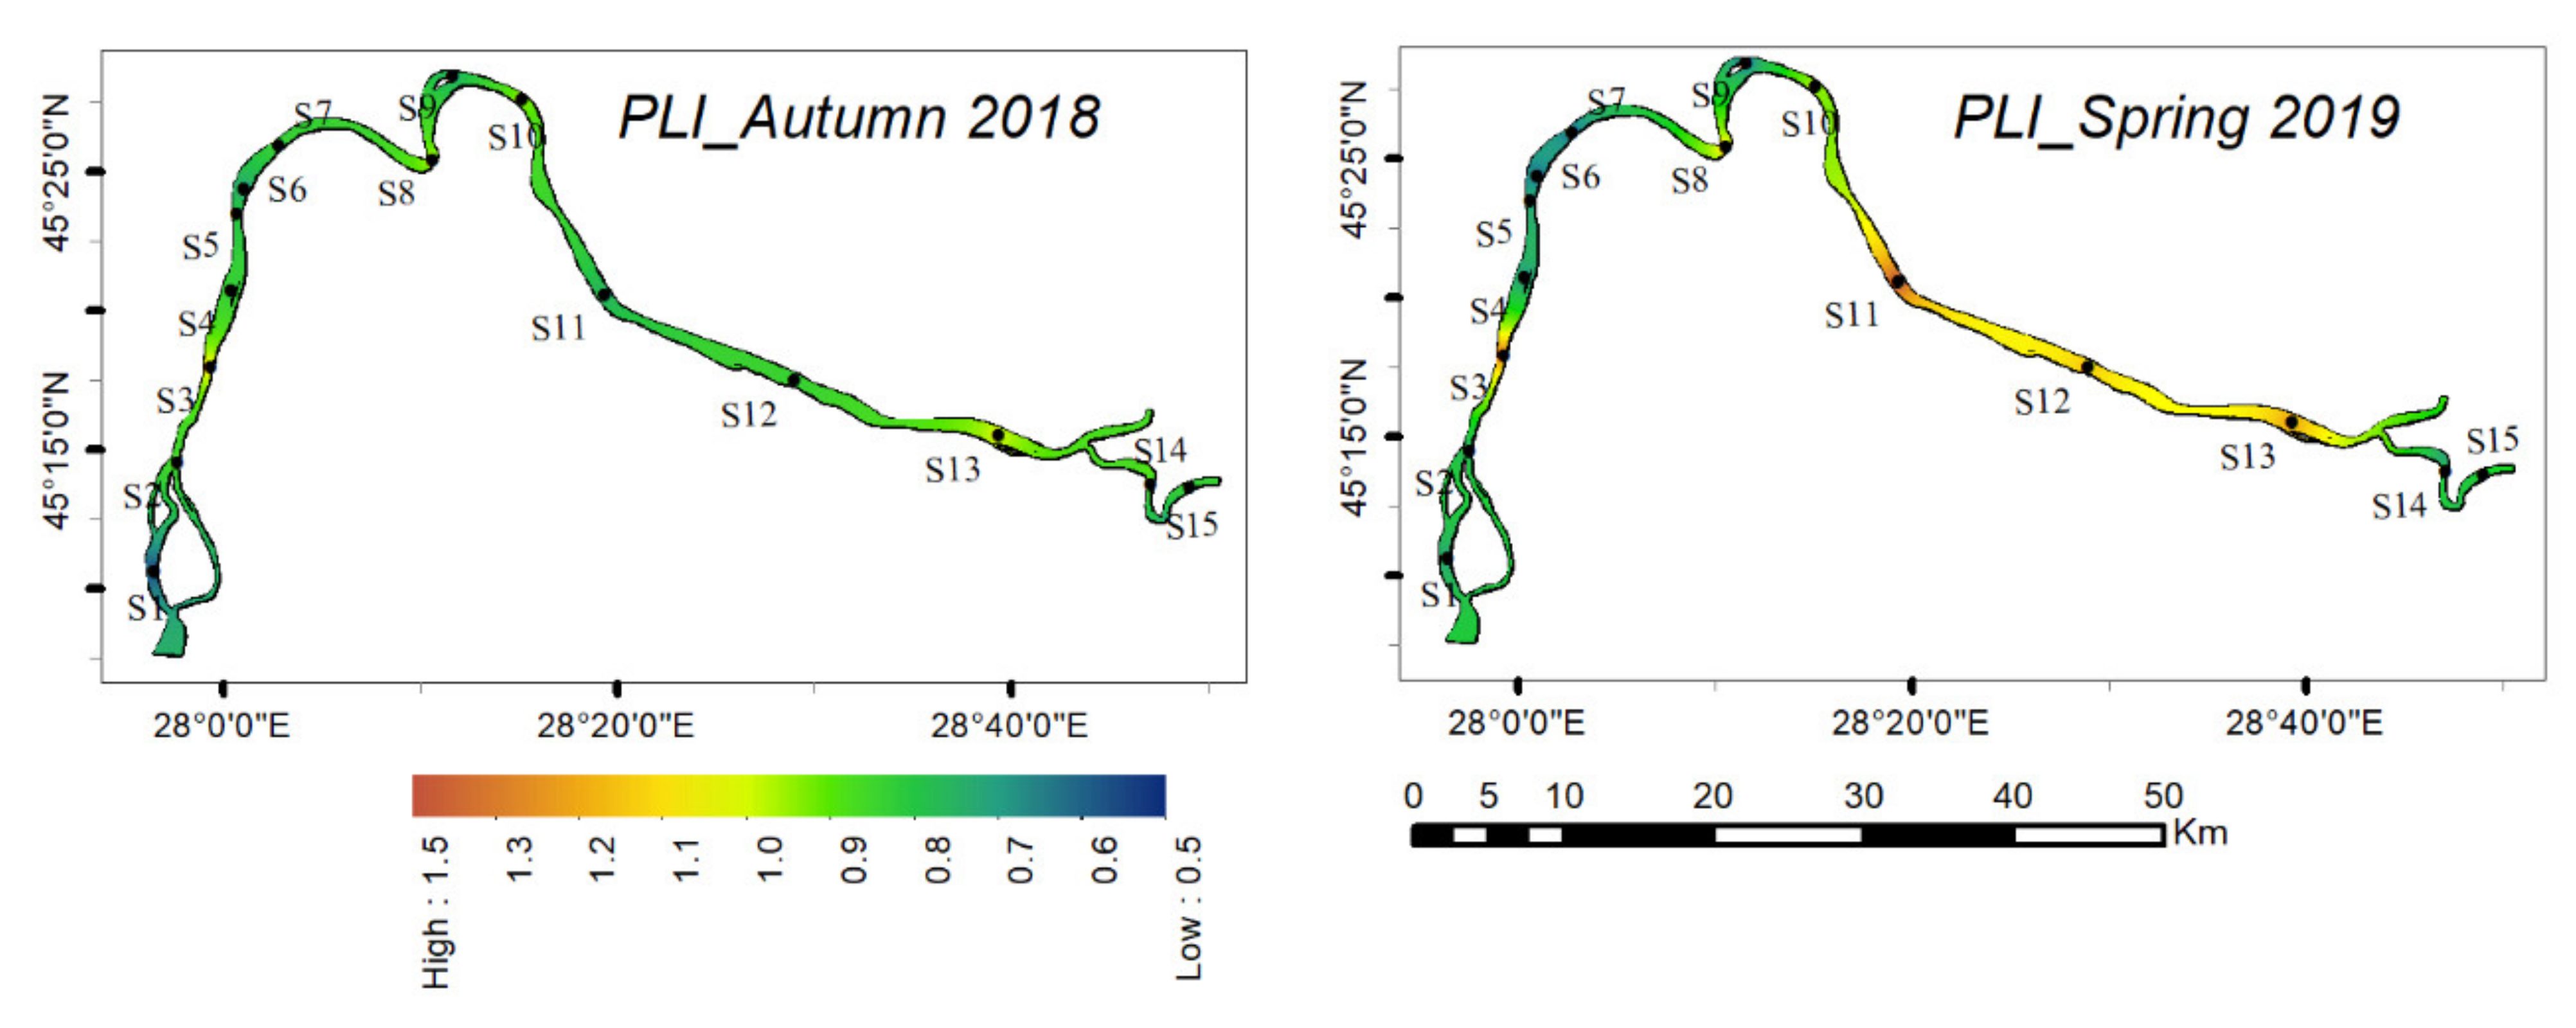
3.2. Contamination Factor (CF) and Pollution Load Index (PLI)
3.3. Spatial Distribution of Potential Ecological Risk Index (RI)
4. Conclusions
Author Contributions
Funding
Institutional Review Board Statement
Informed Consent Statement
Data Availability Statement
Acknowledgments
Conflicts of Interest
References
- Burada, A.; Topa, C.M.; Georgescu, L.P.; Teodorof, L.; Nastase, C.; Seceleanu–Odor, D.; Iticescu, C. Heavy metals environment accumulation in Somova-Parches aquatic complex from the Danube Delta area. Reveista Chim. 2015, 66, 48–54. [Google Scholar]
- Javed, T.; Ahmad, N.; Mashiatullah, A. Heavy metals contamination and ecological risk assessment in surface sediments of Namal Lake, Pakistan. Pol. J. Environ. Stud. 2018, 27, 675–688. [Google Scholar] [CrossRef]
- Kumar, R.N.; Solanki, R.; Kumar, J.I.N. Seasonal variation in heavy metal contamination in water and sediments of river sabarmati and Kharicut Canal at Ahmedabad, Gujarat. Environ. Monit. Assess. 2013, 185, 359–368. [Google Scholar] [CrossRef]
- Jaishankar, M.; Tseten, T.; Anbalagan, N.; Mathew, B.B.; Beeregowda, K.N. Toxicity, mechanism and health effects of some heavy metals. Interdiscip. Toxicol. 2014, 7, 60–72. [Google Scholar] [CrossRef] [Green Version]
- Malassa, H.; Al-Qutob, M.; Al-Khatib, M.; Al-Rimawi, F. Determination of different trace heavy metals in ground water of South West Bank/Palestine by ICP/MS. J. Environ. Prot. Sci. 2013, 4, 720–726. [Google Scholar] [CrossRef] [Green Version]
- Faroon, O.; Ashizawa, A.; Wright, S.; Tucker, P.; Jenkins, K.; Ingerman, L.; Rudisill, C. Toxicological Profile for Cadmium; Agency for Toxic Substances and Disease Registry (US): Atlanta, GA, USA, 2012. [Google Scholar]
- Buxton, S.; Garman, E.; Heim, K.E.; Lyons-Darden, T.; Schlekat, C.E.; Taylor, M.D.; Oller, A.R. Concise review of nickel human health toxicology and ecotoxicology. Inorganics 2019, 7, 89. [Google Scholar] [CrossRef] [Green Version]
- Roney, N.; Osier, M.; Paikoff, S.J.; Smith, C.V.; Williams, M.; De Rosa, C.T. ATSDR evaluation of the health effects of zinc and relevance to public health. Toxicol. Ind. Health 2006, 22, 423–493. [Google Scholar] [CrossRef]
- Abadin, H.; Ashizawa, A.; Stevens, Y.-W.; Llados, F.; Diamond, G.; Sage, G.; Citra, M.; Quinones, A.; Bosch, S.J.; Swarts, S.G. Toxicological Profile for Lead; Agency for Toxic Substances and Disease Registry (US): Atlanta, GA, USA, 2007. [Google Scholar]
- Taylor, A.A.; Tsuji, J.S.; Garry, M.R.; McArdle, M.E.; Goodfellow, W.L.; Adams, W.J.; Menzie, C.A. Critical review of exposure and effects: Implications for setting regulatory health criteria for ingested copper. Environ. Manag. 2020, 65, 131–159. [Google Scholar] [CrossRef] [Green Version]
- Briffa, J.; Sinagra, E.; Blundell, R. Heavy metal pollution in the environment and their toxicological effects on humans. Heliyon 2020, 6, e04691. [Google Scholar] [CrossRef]
- Singh, J.; Kalamdhad, A.S. Effects of heavy metals on soil, plants, human health and aquatic life. Int. J. Res. Chem. Environ. 2011, 1, 15–21. [Google Scholar]
- Calmuc, M.; Calmuc, V.; Arseni, M.; Topa, C.; Timofti, M.; Georgescu, L.P.; Iticescu, C. A comparative approach to a series of physico-chemical quality indices used in assessing water quality in the Lower Danube. Water 2020, 12, 3239. [Google Scholar] [CrossRef]
- Milenkovic, N.; Damjanovic, M.; Ristic, M. Study of heavy metal pollution in sediments from the Iron Gate (Danube River), Serbia and Montenegro. Pol. J. Environ. Stud. 2005, 14, 781–787. [Google Scholar]
- Yaroshenko, I.; Kirsanov, D.; Marjanovic, M.; Lieberzeit, P.A.; Korostynska, O.; Mason, A.; Frau, I.; Legin, A. Real-Time water quality monitoring with chemical sensors. Sensors 2020, 20, 3432. [Google Scholar] [CrossRef]
- Sambito, M.; Freni, G. Strategies for improving optimal positioning of quality sensors in urban drainage systems for non-conservative contaminants. Water 2021, 13, 934. [Google Scholar] [CrossRef]
- Peyravi, M.; Jahanshahi, M.; Tourani, H. Chapter 6—Analytical methods of water pollutants detection. In Inorganic Pollutants in Water; Devi, P., Singh, P., Kansal, S.K., Eds.; Elsevier: Amsterdam, The Netherlands, 2020; pp. 97–113. ISBN 978-0-12-818965-8. [Google Scholar]
- Iticescu, C.; Georgescu, L.P.; Topa, C.; Murariu, G. Monitoring the Danube water quality near the Galati City. J. Environ Prot. Ecol. 2014, 15, 30–38. [Google Scholar]
- Iticescu, C.; Georgescu, L.; Maria-Catalina, T. Assessing the Danube water quality index in the city of Galati, Romania. Carpath. J. Earth Environ. Sci. 2013, 8, 155–164. [Google Scholar]
- Gasparotti, C. The Main Factors of Water Pollution in Danube River Basin. Euro Econ. 2014, 33, 93–106. [Google Scholar]
- Iticescu, C.; Murariu, G.; Georgescu, L.P.; Burada, A.; Țopa, M.C. Seasonal variation of the physico-chemical parameters and water quality index (WQI) of Danube Water in the transborder Lower Danube area. Revista Chim. 2016, 67, 1843–1849. [Google Scholar]
- Iordache, M.; Popescu, L.R.; Pascu, L.; Ioan, I. Environmental risk assessment in sediments from Jiu River, Romania. Revista Chim. 2015, 66, 1247–1252. [Google Scholar]
- Al Naggar, Y.; Khalil, M.; Ghorab, M. Environmental pollution by heavy metals in the aquatic ecosystems of Egypt. Open Acess J. Toxicol. 2018, 3. [Google Scholar] [CrossRef]
- Iticescu, C.; Georgescu, L.; Murariu, G.; Maria-Catalina, T.; Mihaela, T.; Pintilie, V.; Arseni, M. Lower Danube water quality quantified through WQI and multivariate analysis. Water 2019, 11, 1305. [Google Scholar] [CrossRef] [Green Version]
- Demirak, A.; Yilmaz, F.; Tuna, A.L.; Ozdemir, N. Heavy metals in water, sediment and tissues of leuciscus cephalus from a stream in southwestern Turkey. Chemosphere 2006, 63, 1451–1458. [Google Scholar] [CrossRef]
- Takarina, N.D.; Adiwibowo, A. Impact of heavy metals contamination on the biodiversity of marine benthic organisms in Jakarta Bay. J. Coast. Zone Manag. 2011, 14, 168–171. [Google Scholar]
- Muller, G. Index of geoaccumulation in sediments of the Rhine River. Geojournal 1969, 2, 108–118. [Google Scholar]
- Zhiyuan, W.; Dengfeng, W.; Huiping, Z.; Zhiping, Q. Assessment of soil heavy metal pollution with principal component analysis and geoaccumulation index. Procedia Environ. Sci. 2011, 10, 1946–1952. [Google Scholar] [CrossRef] [Green Version]
- Fan, Z.; Wang, W.; Tang, C.; Li, Y.; Wang, Z.; Lin, S.; Zeng, F. Targeting remediation dredging by ecological risk assessment of heavy metals in lake sediment: A Case Study of Shitang Lake, China. Sustainability 2019, 11, 7251. [Google Scholar] [CrossRef] [Green Version]
- Literáthy, P.; László, F. Micropollutants in the Danube River basin. Water Sci. Technol. 1999, 40, 17–26. [Google Scholar] [CrossRef]
- Woitke, P.; Wellmitz, J.; Helm, D.; Kube, P.; Lepom, P.; Litheraty, P. Analysis and assessment of heavy metal pollution in suspended solids and sediments of the River Danube. Chemosphere 2003, 51, 633–642. [Google Scholar] [CrossRef]
- Ilie, M.; Marinescu, F.; Robert, S.; Ghita, G.; Deak, G.; Anghel, A.-M.; Petrescu, A.; Urițescu, B. Ecological risk assessment of heavy metals in surface sediments from the Danube River. Carpath. J. Earth Environ. Sci. 2017, 12, 437–445. [Google Scholar]
- Hounkpè, J.B.; Kèlomè, N.; Adèchina, R.; Rébecca, L. Assessment of heavy metals contamination in sediments at the Lake of Ahémé in southern of Benin (west Africa). J. Mater. Environ. Sci. 2017, 8, 4369–4377. [Google Scholar] [CrossRef]
- Cevik, F.; Göksu, M.Z.L.; Derici, O.B.; Findik, O. An assessment of metal pollution in surface sediments of Seyhan Dam by using enrichment factor, geoaccumulation index and statistical Analyses. Environ. Monit. Assess. 2009, 152, 309–317. [Google Scholar] [CrossRef]
- Ali, A.–E.; Strezov, V.; Davies, P.J.; Wright, I. River Sediment Quality Assessment Using Sediment Quality Indices for the Sydney Basin, Australia Affected by Coal and Coal Seam Gas Mining. Sci. Total Environ. 2018, 616–617, 695–702. [Google Scholar] [CrossRef]
- Huang, Z.; Liu, C.; Zhao, X.; Dong, J.; Zheng, B. Risk Assessment of heavy metals in the surface sediment at the drinking water source of the Xiangjiang River in South China. Environ. Sci. Eur. 2020, 32, 23. [Google Scholar] [CrossRef]
- Zhang, W.; Long, J.; Zhang, X.; Shen, W.; Wei, Z. Pollution and ecological risk evaluation of heavy metals in the soil and sediment around the HTM tailings pond, Northeastern China. Int. J. Environ. Res. Publ. Health 2020, 17, 7072. [Google Scholar] [CrossRef]
- Li, X.; Shen, H.; Zhao, Y.; Cao, W.; Hu, C.; Sun, C. Distribution and potential ecological risk of heavy metals in water, sediments, and aquatic macrophytes: A case study of the junction of four rivers in Linyi City, China. Int. J. Environ. Res. Publ. Health 2019, 16, 2861. [Google Scholar] [CrossRef] [PubMed] [Green Version]
- Ouchir, N.; Aissa, L.B.; Boughdiri, M.; Aydi, A. Assessment of heavy metal contamination status in sediments and identification of pollution source in Ichkeul Lake and rivers ecosystem, northern Tunisia. Arab. J. Geosci. 2016, 9, 1–12. [Google Scholar] [CrossRef]
- Chandrasekaran, A.; Mukesh, M.V.; Chidambaram, S.; Singarasubramanian, S.R.; Rajendran, S.; Muthukumarasamy, R.; Tamilselvi, M. Assessment of heavy metal distribution pattern in the sediments of Tamirabarani River and estuary, east coast of Tamil Nadu, India. Environ. Earth Sci. 2014, 73, 2441–2452. [Google Scholar] [CrossRef]
- Patel, P.; Raju, N.J.; Reddy, B.C.S.R.; Suresh, U.; Sankar, D.B.; Reddy, T.V.K. Heavy metal contamination in river water and sediments of the Swarnamukhi River Basin, India: Risk assessment and environmental implications. Environ. Geochem. Health 2018, 40, 609–623. [Google Scholar] [CrossRef]
- Jahan, S.; Strezov, V. Comparison of pollution indices for the assessment of heavy metals in the sediments of seaports of NSW, Australia. Mar. Polut. Bull. 2018, 128, 295–306. [Google Scholar] [CrossRef]
- Ganugapenta, S.; Nadimikeri, J.; Chinnapolla, B.R.R.S.; Lakshmanna, B.; Madiga, R.; Nirmala, K.; Tella, L. Assessment of heavy metal pollution from the sediment of Tupilipalem Coast, southeast coast of India. Int. J. Sediment Res. 2018, 33, 294–302. [Google Scholar] [CrossRef]
- Zhou, Z.; Wang, Y.; Teng, H.; Yang, H.; Liu, A.; Li, M.; Niu, X. Historical evolution of sources and pollution levels of heavy metals in the sediment of the Shuanglong Reservoir, China. Water 2020, 12, 1855. [Google Scholar] [CrossRef]
- Hakanson, L. An ecological risk index for aquatic pollution control.a sedimentological approach. Water Res. 1980, 14, 975–1001. [Google Scholar] [CrossRef]
- Xu, J.; Chen, Y.; Zheng, L.; Liu, B.; Liu, J.; Wang, X. Assessment of heavy metal pollution in the sediment of the main tributaries of Dongting Lake, China. Water 2018, 10, 1060. [Google Scholar] [CrossRef] [Green Version]
- Romanian Ministry of Research and Innovation. Order 161/2006, the normative on the classification of surface water quality in order to establish the ecological Romanian ministry of research and innovation. In Status of Water Bodies; Official Monitor: Bucharest, Romania, 2006. [Google Scholar]
- Wu, B.; Wang, G.; Wu, J.; Fu, Q.; Liu, C. Sources of heavy metals in surface sediments and an ecological risk assessment from two adjacent plateau reservoirs. PLoS ONE 2014, 9, e102101. [Google Scholar] [CrossRef] [Green Version]
- Teodorof, L.; Burada, A.; Despina, C.; Seceleanu-Odor, D.; Tudor, A.; Ibram, O.; Navodaru, I.; Tudor, M. Integrated indices for surface water and sediment quality, according to water framework directive. J. Environ. Prot. Ecol. 2016, 17, 42–52. [Google Scholar]
- Chen, M.; Li, F.; Tao, M.; Hu, L.; Shi, Y.; Liu, Y. Distribution and Ecological Risks of Heavy metals in river sediments and overlying water in typical mining areas of China. Mar. Polut. Bull. 2019, 146, 893–899. [Google Scholar] [CrossRef]
- Xiao, H.; Shahab, A.; Li, J.; Xi, B.; Sun, X.; He, H.; Yu, G. Distribution, ecological risk assessment and source identification of heavy metals in surface sediments of Huixian Karst Wetland, China. Ecotoxicol. Environ. Saf. 2019, 185, 109700. [Google Scholar] [CrossRef]
- Cui, S.; Zhang, F.; Hu, P.; Hough, R.; Fu, Q.; Zhang, Z.; An, L.; Li, Y.-F.; Li, K.; Liu, D.; et al. Heavy metals in Sediment from the Urban and Rural Rivers in Harbin City, Northeast China. Int. J. Environ. Res. Pub. Health 2019, 16, 4313. [Google Scholar] [CrossRef] [Green Version]
- Wan, L.; Xu, L.; Fu, Y. Contamination and risk assessment of heavy metals in lake bed sediment of a large lake scenic area in China. Int. J. Environ. Res. Pub. Health 2016, 13, 741. [Google Scholar] [CrossRef] [Green Version]
- Liu, P.; Zheng, C.; Wen, M.; Luo, X.; Wu, Z.; Liu, Y.; Chai, S.; Huang, L. Ecological risk assessment and contamination history of heavy metals in the sediments of Chagan Lake, northeast China. Water 2021, 13, 894. [Google Scholar] [CrossRef]
- Mar, S.S.; Okazaki, M. Investigation of cd contents in several phosphate rocks used for the production of fertilizer. Microchem. J. 2012, 104, 17–21. [Google Scholar] [CrossRef]
- Wu, Q.; Qi, J.; Xia, X. Long-Term Variations in sediment heavy metals of a reservoir with Changing Trophic States: Implications for the Impact of Climate Change. Sci. Total Environ. 2017, 609, 242–250. [Google Scholar] [CrossRef]
- Simionov, I.-A.; Cristea, D.S.; Petrea, S.-M.; Mogodan, A.; Nicoara, M.; Plavan, G.; Baltag, E.S.; Jijie, R.; Strungaru, S.-A. Preliminary investigation of Lower Danube pollution caused by potentially toxic metals. Chemosphere 2021, 264, 128496. [Google Scholar] [CrossRef]
- Harasim, P.; Filipek, T. Nickel in the environment. J. Elementol. 2015, 20, 525–534. [Google Scholar] [CrossRef] [Green Version]
- Arseni, M.; Rosu, A.; Calmuc, M.; Calmuc, V.A.; Iticescu, C.; Georgescu, L.P. Development of flood risk and hazard maps for the lower course of the Siret River, Romania. Sustainability 2020, 12, 6588. [Google Scholar] [CrossRef]
- Arseni, M.; Voiculescu, M.; Georgescu, L.P.; Iticescu, C.; Rosu, A. Testing different interpolation methods based on single beam echosounder river surveying. case Study: Siret River. ISPRS Int. J. Geo Inf. 2019, 8, 507. [Google Scholar] [CrossRef] [Green Version]
- Navarrete-Rodríguez, G.; Castañedaz-Chávez, M.d.R.; Lango-Reynoso, F. Geoacumulation of heavy metals in sediment of the fluvial-lagoon-deltaic system of the Palizada River, Campeche, Mexico. Int. J. Environ. Res. Pub. Health 2020, 17, 969. [Google Scholar] [CrossRef] [Green Version]


| Element | R2 |
|---|---|
| Pb | 0.9997 |
| Cu | 0.9998 |
| Cd | 0.9997 |
| Zn | 0.9999 |
| Ni | 0.9998 |
| Igeo Value | Class | Pollution Intensity |
|---|---|---|
| Igeo ≤ 0 | 0 | unpolluted |
| 0 < Igeo < 1 | 1 | unpolluted to moderately polluted |
| 1 < Igeo < 2 | 2 | moderately polluted |
| 2 < Igeo < 3 | 3 | moderately to strongly polluted |
| 3 < Igeo < 4 | 4 | strongly polluted |
| 4 < Igeo < 5 | 5 | strongly to very strongly polluted |
| Igeo ≥ 5 | 6 | very strongly polluted |
| CF Value | Contamination |
|---|---|
| CF < 1 | Low |
| 1 ≤ CF < 3 | Moderate |
| 3 ≤ CF < 6 | Considerable |
| CF > 6 | Very high |
| ErMe Value | RI Value | Ecological Risk Level |
|---|---|---|
| ErMe ≤ 40 | RI < 150 | Low |
| 40 < ErMe ≤ 80 | 150 ≤ RI < 300 | Moderate |
| 80 < ErMe ≤ 160 | 300 ≤ RI < 600 | Considerable |
| 160 < ErMe ≤ 320 | High | |
| ErMe > 320 | RI ≥ 600 | Very high |
| Heavy Metal | Standard Value (mg·kg−1) |
|---|---|
| Cd | 0.8 |
| Cu | 40 |
| Pb | 85 |
| Zn | 150 |
| Ni | 35 |
| Sites | S1 | S2 | S3 | S4 | S5 | S6 | S7 | S8 | S9 | S10 | S11 | S12 | S13 | S14 | S15 | |||
|---|---|---|---|---|---|---|---|---|---|---|---|---|---|---|---|---|---|---|
| Heavy metal concentrations (mg·kg−1) | Pb | Autumn | Mean | 5.90 | 8.96 | 12.57 | 8.49 | 7.93 | 5.17 | 7.28 | 21.14 | 4.84 | 7.55 | 7.83 | 6.84 | 8.29 | 8.11 | 5.34 |
| Std.dev | 0.15 | 0.64 | 0.82 | 0.56 | 0.26 | 0.21 | 0.45 | 1.60 | 0.48 | 0.12 | 0.42 | 0.52 | 0.57 | 0.63 | 0.38 | |||
| Spring | Mean | 6.02 | 6.05 | 13.78 | 6.41 | 5.70 | 4.17 | 5.68 | 10.35 | 4.31 | 8.33 | 14.64 | 9.87 | 9.90 | 6.76 | 8.01 | ||
| Std.dev | 0.44 | 0.23 | 0.55 | 0.18 | 0.43 | 0.28 | 0.32 | 0.63 | 0.27 | 0.50 | 0.22 | 0.39 | 0.61 | 0.59 | 0.52 | |||
| Cu | Autumn | Mean | 4.30 | 10.72 | 17.39 | 12.58 | 12.54 | 7.60 | 11.81 | 10.24 | 7.89 | 13.42 | 6.68 | 9.79 | 16.64 | 15.17 | 9.42 | |
| Std.dev | 0.11 | 0.87 | 0.72 | 0.39 | 0.68 | 0.46 | 0.34 | 0.49 | 0.25 | 1.06 | 0.38 | 0.44 | 0.53 | 0.49 | 0.27 | |||
| Spring | Mean | 10.31 | 11.65 | 25.01 | 8.97 | 10.08 | 7.55 | 7.47 | 19.47 | 9.29 | 17.18 | 27.50 | 20.75 | 23.29 | 9.29 | 10.07 | ||
| Std.dev | 0.80 | 0.41 | 0.49 | 0.40 | 0.64 | 0.44 | 0.72 | 0.28 | 0.33 | 1.11 | 0.88 | 0.39 | 0.68 | 0.48 | 0.66 | |||
| Cd | Autumn | Mean | 0.30 | 0.59 | 0.74 | 0.50 | 0.50 | 0.46 | 0.57 | 0.54 | 0.54 | 0.76 | 0.53 | 0.63 | 0.75 | 0.57 | 0.53 | |
| Std.dev | 0.006 | 0.025 | 0.053 | 0.016 | 0.044 | 0.012 | 0.028 | 0.036 | 0.015 | 0.023 | 0.044 | 0.028 | 0.034 | 0.016 | 0.019 | |||
| Spring | Mean | 0.59 | 0.65 | 0.99 | 0.63 | 0.57 | 0.41 | 0.46 | 0.78 | 0.46 | 0.65 | 0.72 | 0.77 | 0.82 | 0.48 | 0.52 | ||
| Std.dev | 0.027 | 0.015 | 0.032 | 0.04 | 0.043 | 0.036 | 0.019 | 0.029 | 0.035 | 0.041 | 0.043 | 0.036 | 0.033 | 0.027 | 0.038 | |||
| Zn | Autumn | Mean | 58.84 | 118.54 | 120.76 | 87.43 | 84.15 | 62.39 | 84.65 | 77.64 | 64.48 | 146.23 | 85.40 | 96.11 | 121.38 | 117.01 | 69.97 | |
| Std.dev | 1.34 | 1.27 | 1.32 | 0.98 | 1.46 | 1.55 | 1.68 | 1.32 | 1.08 | 1.56 | 0.98 | 1.44 | 1.39 | 1.70 | 1.03 | |||
| Spring | Mean | 78.69 | 84.21 | 177.33 | 73.57 | 95.67 | 71.27 | 63.21 | 131.50 | 66.06 | 121.05 | 161.24 | 146.53 | 154.34 | 81.26 | 86.43 | ||
| Std.dev | 0.78 | 1.22 | 0.96 | 0.87 | 1.33 | 1.62 | 1.39 | 0.85 | 0.52 | 1.31 | 0.99 | 1.63 | 1.28 | 1.75 | 1.08 | |||
| Ni | Autumn | Mean | 16.03 | 29.12 | 27.88 | 22.31 | 20.53 | 14.00 | 19.99 | 22.09 | 16.28 | 23.90 | 24.83 | 24.76 | 28.35 | 38.81 | 16.94 | |
| Std.dev | 0.96 | 1.69 | 0.98 | 1.77 | 1.32 | 1.24 | 0.96 | 1.08 | 1.37 | 1.54 | 1.80 | 1.30 | 1.96 | 1.33 | 1.04 | |||
| Spring | Mean | 20.17 | 19.33 | 35.80 | 16.04 | 24.58 | 19.09 | 17.65 | 28.49 | 17.40 | 27.41 | 50.46 | 32.55 | 39.03 | 25.85 | 28.13 | ||
| Std.dev | 0.85 | 0.98 | 1.32 | 0.96 | 0.58 | 1.36 | 1.26 | 1.44 | 1.28 | 1.63 | 1.82 | 0.96 | 1.22 | 1.14 | 0.85 | |||
| Sites | Metals | |||||||||
|---|---|---|---|---|---|---|---|---|---|---|
| Pb | Cu | Cd | Zn | Ni | ||||||
| Autumn | Spring | Autumn | Spring | Autumn | Spring | Autumn | Spring | Autumn | Spring | |
| S1 | 0.24 | 0.24 | 0.12 | 0.29 | 1.22 | 2.36 | 0.45 | 0.61 | 1.60 | 2.02 |
| S2 | 0.36 | 0.24 | 0.31 | 0.33 | 2.37 | 2.58 | 0.91 | 0.65 | 2.91 | 1.93 |
| S3 | 0.50 | 0.55 | 0.50 | 0.71 | 2.96 | 3.96 | 0.93 | 1.36 | 2.79 | 3.58 |
| S4 | 0.34 | 0.26 | 0.36 | 0.26 | 1.99 | 2.50 | 0.67 | 0.57 | 2.23 | 1.60 |
| S5 | 0.32 | 0.23 | 0.36 | 0.29 | 2.00 | 2.26 | 0.65 | 0.74 | 2.05 | 2.46 |
| S6 | 0.21 | 0.17 | 0.22 | 0.22 | 1.84 | 1.65 | 0.48 | 0.55 | 1.40 | 1.91 |
| S7 | 0.29 | 0.23 | 0.34 | 0.21 | 2.29 | 1.83 | 0.65 | 0.49 | 2.00 | 1.77 |
| S8 | 0.85 | 0.41 | 0.29 | 0.56 | 2.18 | 3.12 | 0.60 | 1.01 | 2.21 | 2.85 |
| S9 | 0.19 | 0.17 | 0.23 | 0.27 | 2.15 | 1.83 | 0.50 | 0.51 | 1.63 | 1.74 |
| S10 | 0.30 | 0.33 | 0.38 | 0.49 | 3.02 | 2.59 | 1.12 | 0.93 | 2.39 | 2.74 |
| S11 | 0.31 | 0.59 | 0.19 | 0.79 | 2.11 | 2.87 | 0.66 | 1.24 | 2.48 | 5.05 |
| S12 | 0.27 | 0.39 | 0.28 | 0.59 | 2.52 | 3.09 | 0.74 | 1.13 | 2.48 | 3.26 |
| S13 | 0.33 | 0.40 | 0.48 | 0.67 | 2.99 | 3.29 | 0.93 | 1.19 | 2.84 | 3.90 |
| S14 | 0.32 | 0.27 | 0.43 | 0.27 | 2.30 | 1.90 | 0.90 | 0.63 | 3.88 | 2.59 |
| S15 | 0.21 | 0.32 | 0.27 | 0.29 | 2.13 | 2.08 | 0.54 | 0.66 | 1.69 | 2.81 |
| Hydrometric Stations | Qm (m3 s−1) | |
|---|---|---|
| Autumn of 2018 | Spring of 2019 | |
| Brăila (km 170) | 3220 | 6263 |
| Galați (km 150) | 3677 | 6803 |
| Isaccea (km 103) | 3127 | 6673 |
| Tulcea (km 71) | 1627 | 3443 |
| Average flow | 2913 | 5796 |
| Sites | Metals | |||||||||
|---|---|---|---|---|---|---|---|---|---|---|
| Pb | Cu | Cd | Zn | Ni | ||||||
| Autumn | Spring | Autumn | Spring | Autumn | Spring | Autumn | Spring | Autumn | Spring | |
| S1 | 0.35 | 0.35 | 0.54 | 1.29 | 11.43 | 22.11 | 0.39 | 0.52 | 2.29 | 2.88 |
| S2 | 0.53 | 0.36 | 1.34 | 1.46 | 22.19 | 24.21 | 0.79 | 0.56 | 4.16 | 2.76 |
| S3 | 0.74 | 0.81 | 2.17 | 3.13 | 27.75 | 37.15 | 0.81 | 1.18 | 3.98 | 5.11 |
| S4 | 0.50 | 0.38 | 1.57 | 1.12 | 18.65 | 23.44 | 0.58 | 0.49 | 3.19 | 2.29 |
| S5 | 0.47 | 0.34 | 1.57 | 1.26 | 18.76 | 21.20 | 0.56 | 0.64 | 2.93 | 3.51 |
| S6 | 0.30 | 0.25 | 0.95 | 0.94 | 17.28 | 15.49 | 0.42 | 0.48 | 2.00 | 2.73 |
| S7 | 0.43 | 0.33 | 1.48 | 0.93 | 21.49 | 17.13 | 0.56 | 0.42 | 2.86 | 2.52 |
| S8 | 1.24 | 0.61 | 1.28 | 2.43 | 20.42 | 29.23 | 0.52 | 0.88 | 3.16 | 4.07 |
| S9 | 0.28 | 0.25 | 0.99 | 1.16 | 20.14 | 17.19 | 0.43 | 0.44 | 2.33 | 2.49 |
| S10 | 0.44 | 0.49 | 1.68 | 2.15 | 28.33 | 24.24 | 0.97 | 0.81 | 3.41 | 3.92 |
| S11 | 0.46 | 0.86 | 0.84 | 3.44 | 19.80 | 26.91 | 0.57 | 1.07 | 3.55 | 7.21 |
| S12 | 0.40 | 0.58 | 1.22 | 2.59 | 23.62 | 28.92 | 0.64 | 0.98 | 3.54 | 4.65 |
| S13 | 0.49 | 0.58 | 2.08 | 2.91 | 28.07 | 30.86 | 0.81 | 1.03 | 4.05 | 5.58 |
| S14 | 0.48 | 0.40 | 1.90 | 1.16 | 21.55 | 17.84 | 0.78 | 0.54 | 5.54 | 3.69 |
| S15 | 0.31 | 0.47 | 1.18 | 1.26 | 19.99 | 19.45 | 0.47 | 0.58 | 2.42 | 4.02 |
Publisher’s Note: MDPI stays neutral with regard to jurisdictional claims in published maps and institutional affiliations. |
© 2021 by the authors. Licensee MDPI, Basel, Switzerland. This article is an open access article distributed under the terms and conditions of the Creative Commons Attribution (CC BY) license (https://creativecommons.org/licenses/by/4.0/).
Share and Cite
Calmuc, V.A.; Calmuc, M.; Arseni, M.; Topa, C.M.; Timofti, M.; Burada, A.; Iticescu, C.; Georgescu, L.P. Assessment of Heavy Metal Pollution Levels in Sediments and of Ecological Risk by Quality Indices, Applying a Case Study: The Lower Danube River, Romania. Water 2021, 13, 1801. https://doi.org/10.3390/w13131801
Calmuc VA, Calmuc M, Arseni M, Topa CM, Timofti M, Burada A, Iticescu C, Georgescu LP. Assessment of Heavy Metal Pollution Levels in Sediments and of Ecological Risk by Quality Indices, Applying a Case Study: The Lower Danube River, Romania. Water. 2021; 13(13):1801. https://doi.org/10.3390/w13131801
Chicago/Turabian StyleCalmuc, Valentina Andreea, Madalina Calmuc, Maxim Arseni, Catalina Maria Topa, Mihaela Timofti, Adrian Burada, Catalina Iticescu, and Lucian P. Georgescu. 2021. "Assessment of Heavy Metal Pollution Levels in Sediments and of Ecological Risk by Quality Indices, Applying a Case Study: The Lower Danube River, Romania" Water 13, no. 13: 1801. https://doi.org/10.3390/w13131801