
Evaluating the Hydrologic Risk of n-Year Floods According to RCP Scenarios


1
Research Institute of Engineering and Technology, Hanyang University, Ansan 15588, Korea
2
Department of Smart City Engineering, Hanyang University, Seoul 04763, Korea
3
R&D Center, Burin Co., Ltd., Seoul 07014, Korea
4
Department of Civil and Environmental System Engineering, Hanyang University, Seoul 04763, Korea
5
Department of Civil and Environmental Engineering, Hanyang University, Ansan 15588, Korea
*
Author to whom correspondence should be addressed.
Water 2021, 13(13), 1805; https://doi.org/10.3390/w13131805
Submission received: 28 May 2021
/
Revised: 24 June 2021
/
Accepted: 27 June 2021
/
Published: 29 June 2021
(This article belongs to the Special Issue Assessing and Managing Risk of Flood and Drought in a Changing World)
Abstract
:Recent climate change has brought about irregular rainfall patterns along with an increased frequency of heavy rainfall, and flood damage in Korea is increasing accordingly. The increased rainfall amount and intensity during the rainy season lead to flood damage on a massive scale every year in Korea. In order to reduce such flood damage and secure the stability of hydraulic structures, evaluation of hydrologic risk corresponding to design floods is necessary. As Korea’s current climate change scenarios are generally applied to mid-sized watersheds, there is no practical application method to calculate the hydrologic risk of local floods corresponding to various future climate change scenarios. Using the design flood prediction model, this study evaluated the hydrologic risks of n-year floods according to 13 climate change scenarios. The representative concentration pathway (RCP) 8.5 scenario resulted in the 100-year floods increasing 134.56% on average, and 132.30% in the Han River, 132.81% in the Nakdong River, 142.42% in the Gum River, and 135.47% in the Seomjin-Youngsan River basin, compared with the RCP 4.5. The 100-year floods at the end of the 21st century increased by +3% and +13% according to the RCP 4.5 and 8.5, respectively. The corresponding hydrologic flood risk increased by 0.53% and 8.68% on average according to the RCP 4.5 and RCP 8.5, respectively, compared with the current level of hydrologic risk of a 100-year flood.
1. Introduction
Over the years, the Intergovernmental Panel on Climate Change (IPCC) has used a variety of climate change scenarios, ranging from simple scenarios in the early days to representative concentration pathway (RCP) scenarios in its Fifth Assessment Report, published in 2014, to assess future prospects of global warming and its effects, adaptation, and mitigation [1]. In Korea, based on the global climate change scenario with a resolution of 135 km using the HadGEM2-AO model of the UK Met Office, regional hydro-climatological variables are calculated with a resolution of 12.5 km for the Korean Peninsula. Global warming increases the magnitude and frequency of heavy rainfall, which subsequently leads to severe and extensive flooding in rivers. Past studies have shown that flooding frequency varies depending on the local climate and the watershed characteristics in different parts of the world [2,3,4]. Uncertainty about climate change’s effects on severe hydrological events is challenging at both the local and regional levels. To reduce the risk and effects of flooding, it is necessary to identify the flood-prone areas in current and predicted environmental conditions [4,5,6,7,8]. Recent studies related to climate change identified changes of flow regime, trend, and frequency of flood as well as investigated their causes through hydrological modeling for various spatio-temporal scales [9,10,11,12,13].
In order to establish national standards to be applied to disaster mitigation policies related to floods and heavy rains, the Korean Ministry of the Interior and Safety (MOIS) [14] has estimated the rate of rainfall increase due to future climate change, and determined disaster mitigation performance targets by region. These regional targets relate to the current design practice of hydraulic structures such as dam spillway, sewer pipes, stormwater detention, and reservoirs. Therefore, the hydraulic structures will be affected by the expected increase in rainfall and runoff according to projected climate change scenarios. In the comprehensive flood management plan of a large river basin, the design precipitation is calculated as a factor for the possible damage when setting the flood control area zone. These results can be used for determining the flood control safety of each river as the basic data in establishing flood prevention plans.
For these hydraulic structures, the return period is estimated according to the importance of each structure. However, there have not been many studies on the quantitative evaluation of the hydrologic risk according to the flood uncertainty and the life span of the structures. The comprehensive flood management plans in Korean watersheds estimate the potential flood damage when the flood mitigation is established. Here, the rainfall quantile is estimated as a factor for the possibility of damage, and these results are used as the basic data for establishing flood defense plans for each river. For example, Chungcheongnam-do [15], a provincial government located in the west-central part of Korea, proposed a measure to determine flood mitigation safety by combining rainfall characteristic factors considering climate change.
As the risk of flooding is expected to increase due to future climate change, relevant research is ongoing in Korea to determine exactly how much higher future risk is than the present. In this study, n-year floods were calculated for ungauged watersheds using the machine learning-based design flood prediction model we developed previously [16], and risk analysis for various climate change scenarios was performed to evaluate the change in the hydrologic risk of n-year floods. Our purpose was to understand how Korea’s greenhouse gas reduction policy, as reflected in various climate change scenarios, affects the hydrologic risk of flood in mid-sized basins in South Korea.
2. Materials and Methods
2.1. Climate Change Scenarios
Changes in the climate system due to artificial factors can be derived from mathematical formulas considering the major processes of the earth system. Global climate models (GCMs) are useful to represent such changes, but they are quite complex [17]. Therefore, we used statistical post-processing techniques that compensate the biased climate simulation for the climate conditions currently observed, considering the characteristics of the observation data. In Korea, using the 13 GCMs in Table 1, the Asia-Pacific Economic Cooperation Climate Center (APCC) provides 13 climate change scenarios approved by “Climate Change Adaptation for Water Resources” (https://www.climate.go.kr/). As climate change scenarios, RCPs include a stringent mitigation scenario (RCP 2.6), two intermediate scenarios (RCP 4.5 and RCP 6.0) and an extreme scenario with very high greenhouse gas (GHG) emissions (RCP 8.5). The use of RCPs takes advantage of allowing evaluating the mitigation and adaptation policies in the medium and long time scales. In this study, the RCP 4.5 was applied to investigate how much hydrologic risk would increase in the future comparing with the current level and the RCP 8.5.
The daily runoffs from 117 mid-sized watersheds of the five major Korean rivers (the Han, Nakdong, Gum, and Seomjin-Youngsan) were generated using a precipitation-runoff modeling system (PRMS) [16]. In this study, four data periods were established: P1 (2011–2040), P2 (2041–2070), P3 (2071–2099), and TP (Total Period) (2011–2099).
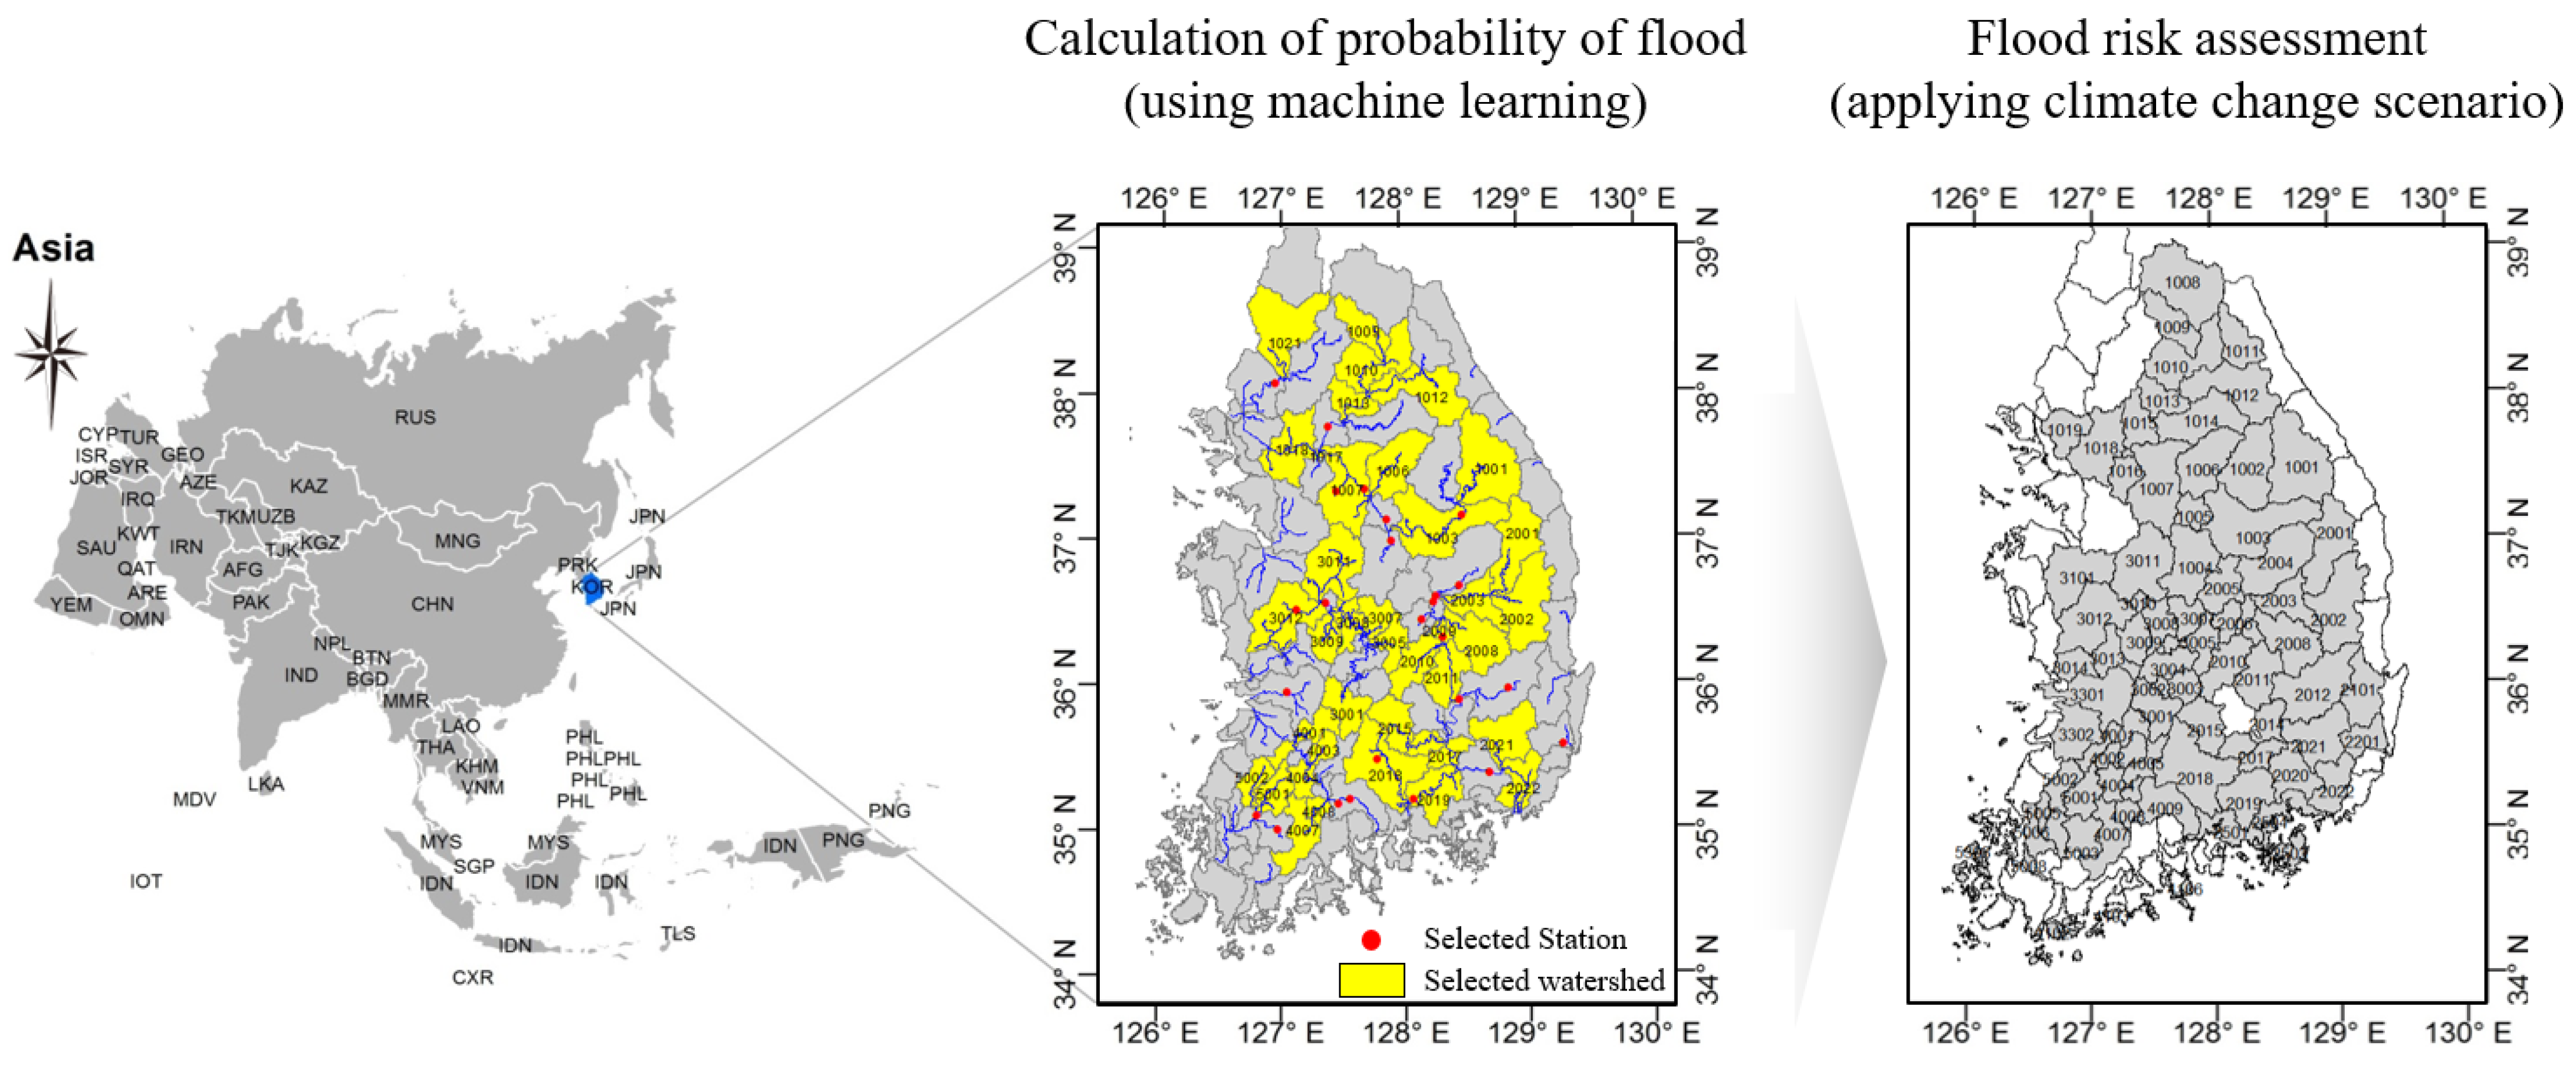
We selected 74 mid-sized watersheds to which climate change scenarios are applicable in South Korea. In order to improve data collection and model development and application, sustained efforts were made compared to Kim et al. [18], which applied only 12 mid-sized watersheds.
In our previous study [16], we collected pre-determined design floods for 64 watersheds in South Korea, as represented by yellow polygons in Figure 1; then we developed a design flood estimation model using machine learning techniques to calculate the design floods in ungauged watersheds, as represented by gray polygons in Figure 1. More details on this machine learning-based design flood prediction model are found in Lee et al. [16].
2.2. Hydrologic Risk of n-Year Flood Considering Climate Change Scenarios
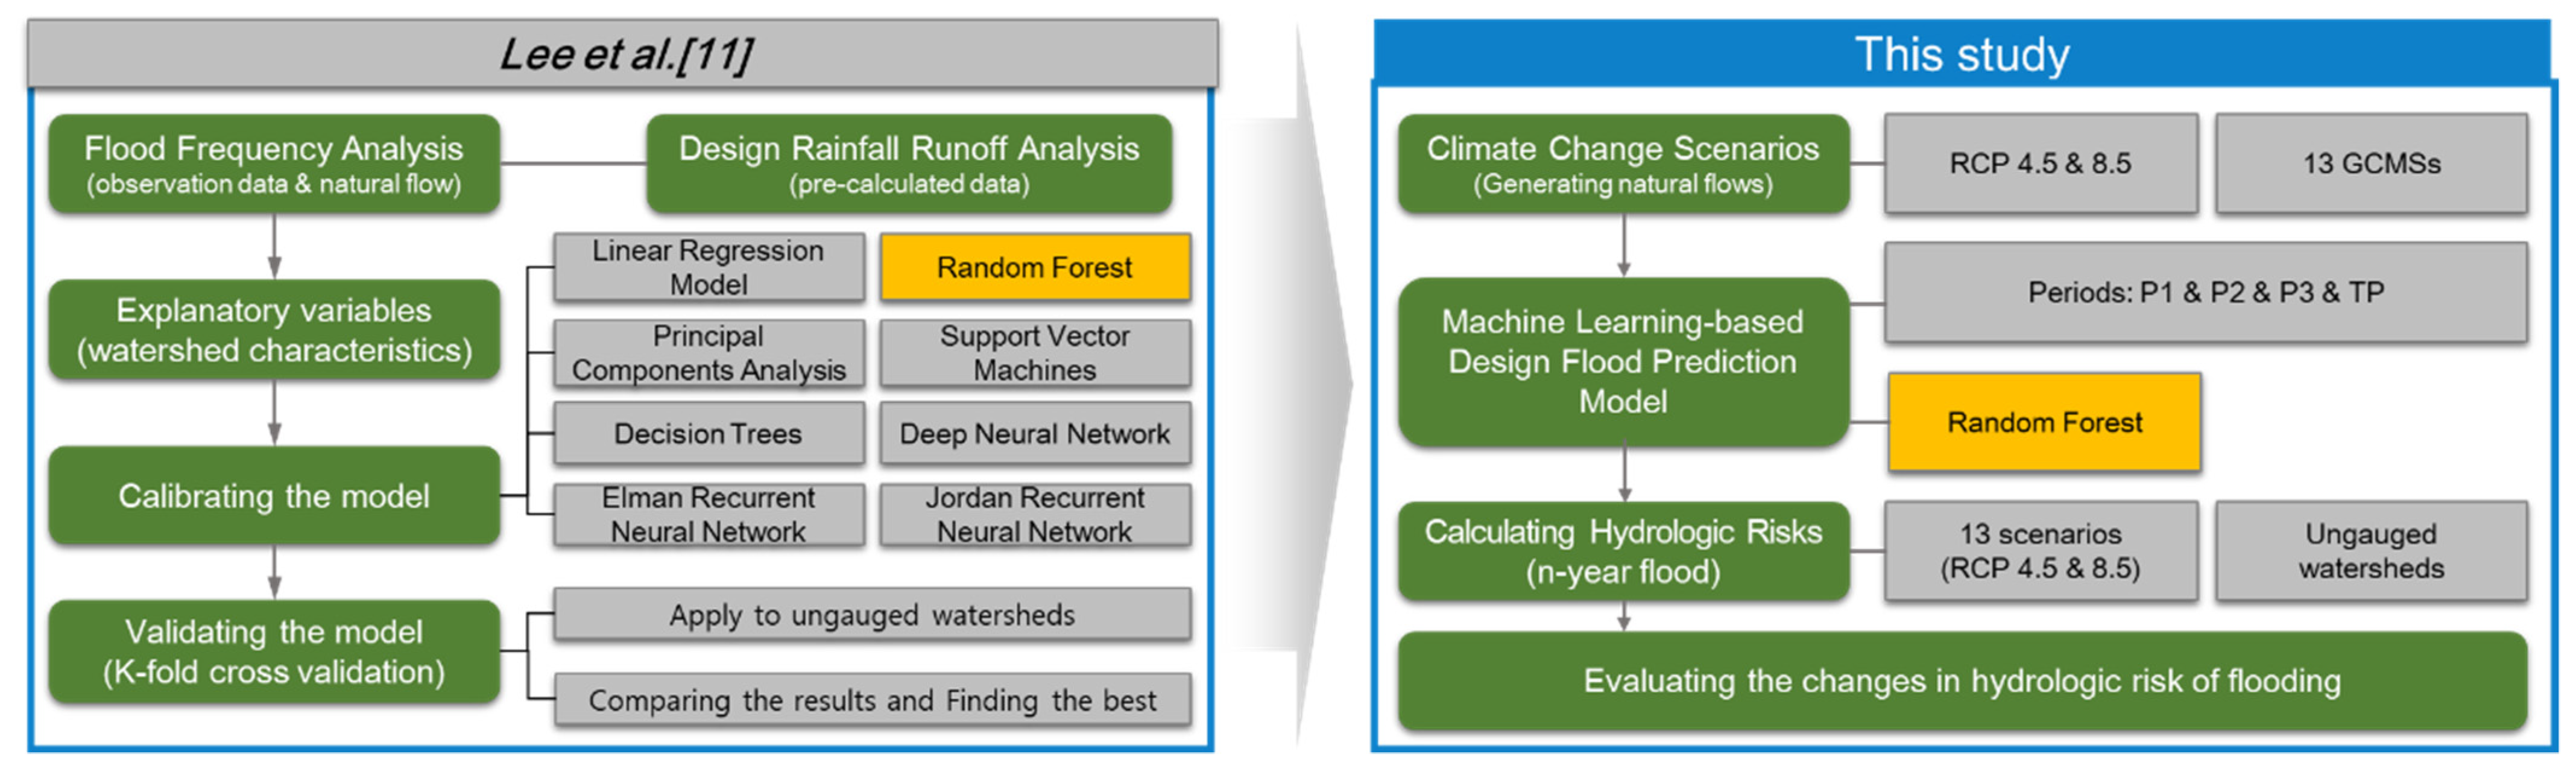
In this study, we used linear regression and six machine learning techniques (decision tree, random forest, support vector machine, deep neural network, Elman neural network, and Jordan neural network) using the characteristic factors of each watershed. By evaluating the applicability of each technique, we confirmed that the random forest had the best prediction performance. The comparatively better generalization ability of machine learning makes it attractive for predicting design floods of ungauged watersheds for future flood risk assessment. Referring to Lee et al. [16] for details on the development of a machine learning-based design flood prediction model and the selection of parameters and optimal techniques, Figure 2 shows how the machine learning-based design flood prediction model is applied to the evaluation of hydrologic risk of flood according to the RCP 4.5 and 8.5.
Hydrologic risk is the probability that a T-year hydrologic event will occur at least once during n-years. Therefore, flood control design requires consideration of this risk, and if a hydrologic event with a return period of T years occurs within the expected life span of the structure, the structure might be failed. The hydrological risk can be expressed by Equation (1):
where, R is the hydrologic risk, n is the specific period of the hydrologic event, and T is the return period. For example, the probability that a 100-year event will occur at least once over the next 100 years is 63.4%.
3. Results
3.1. Design Floods According to Various Climate Change Scenarios
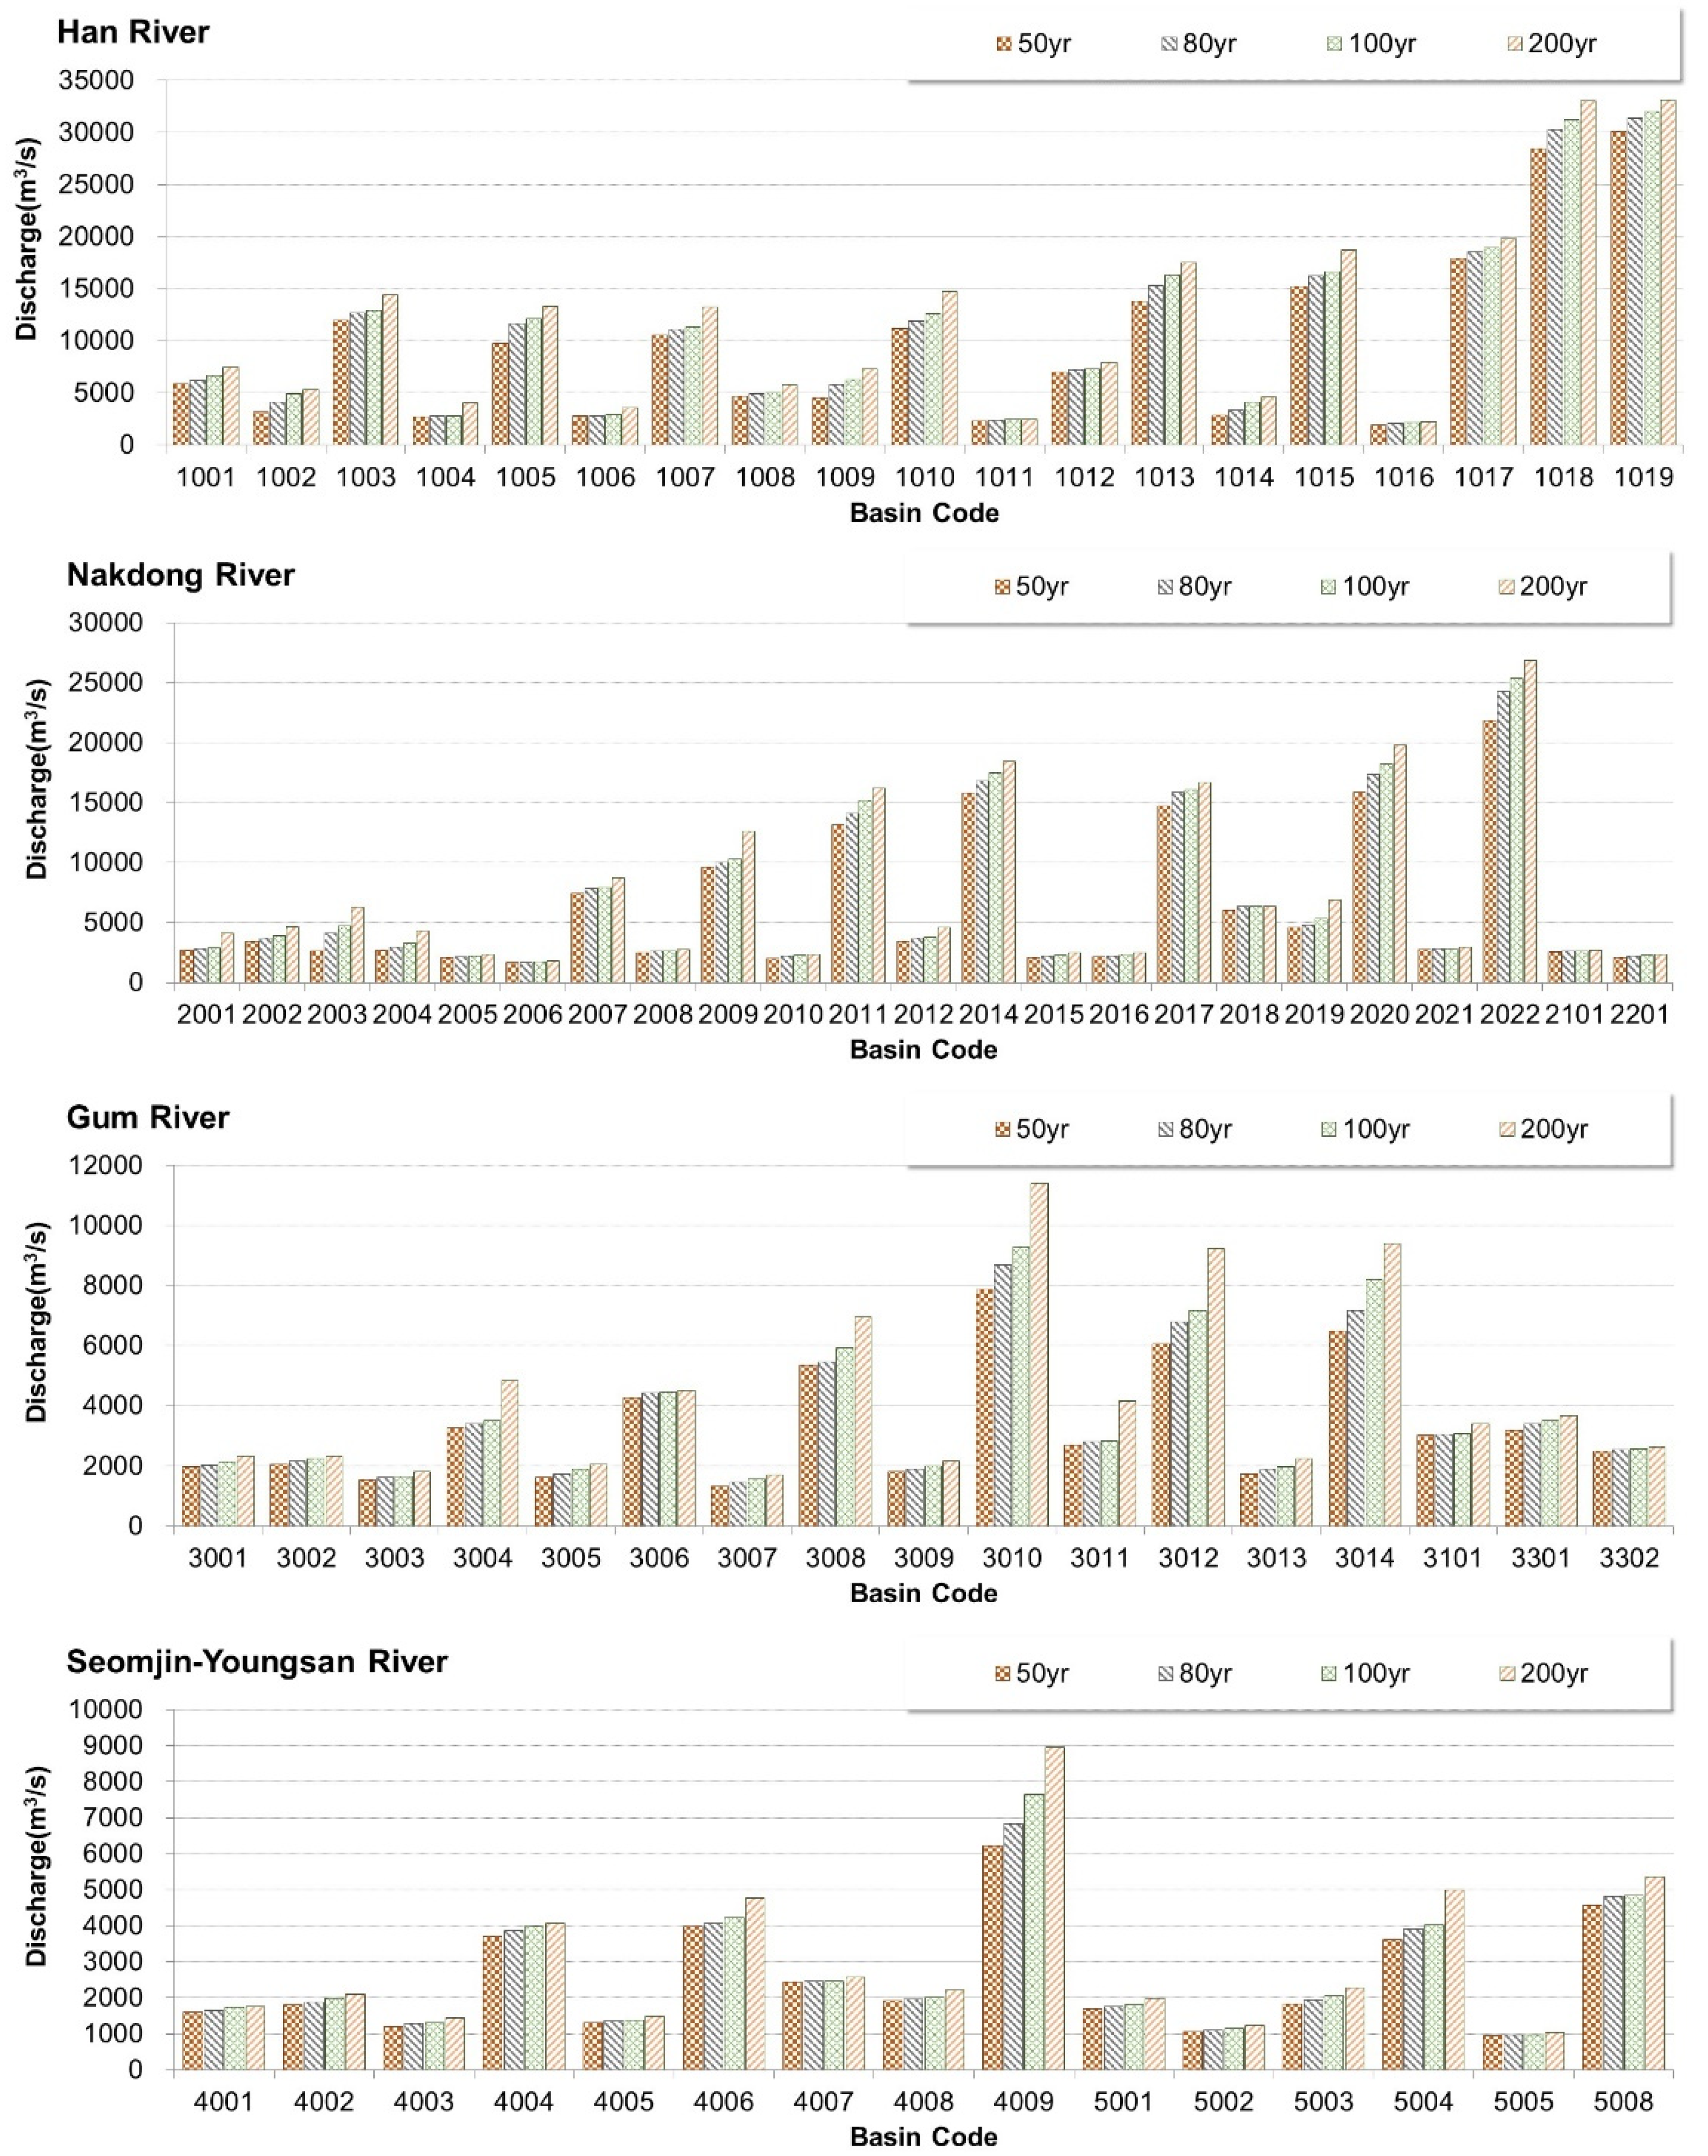
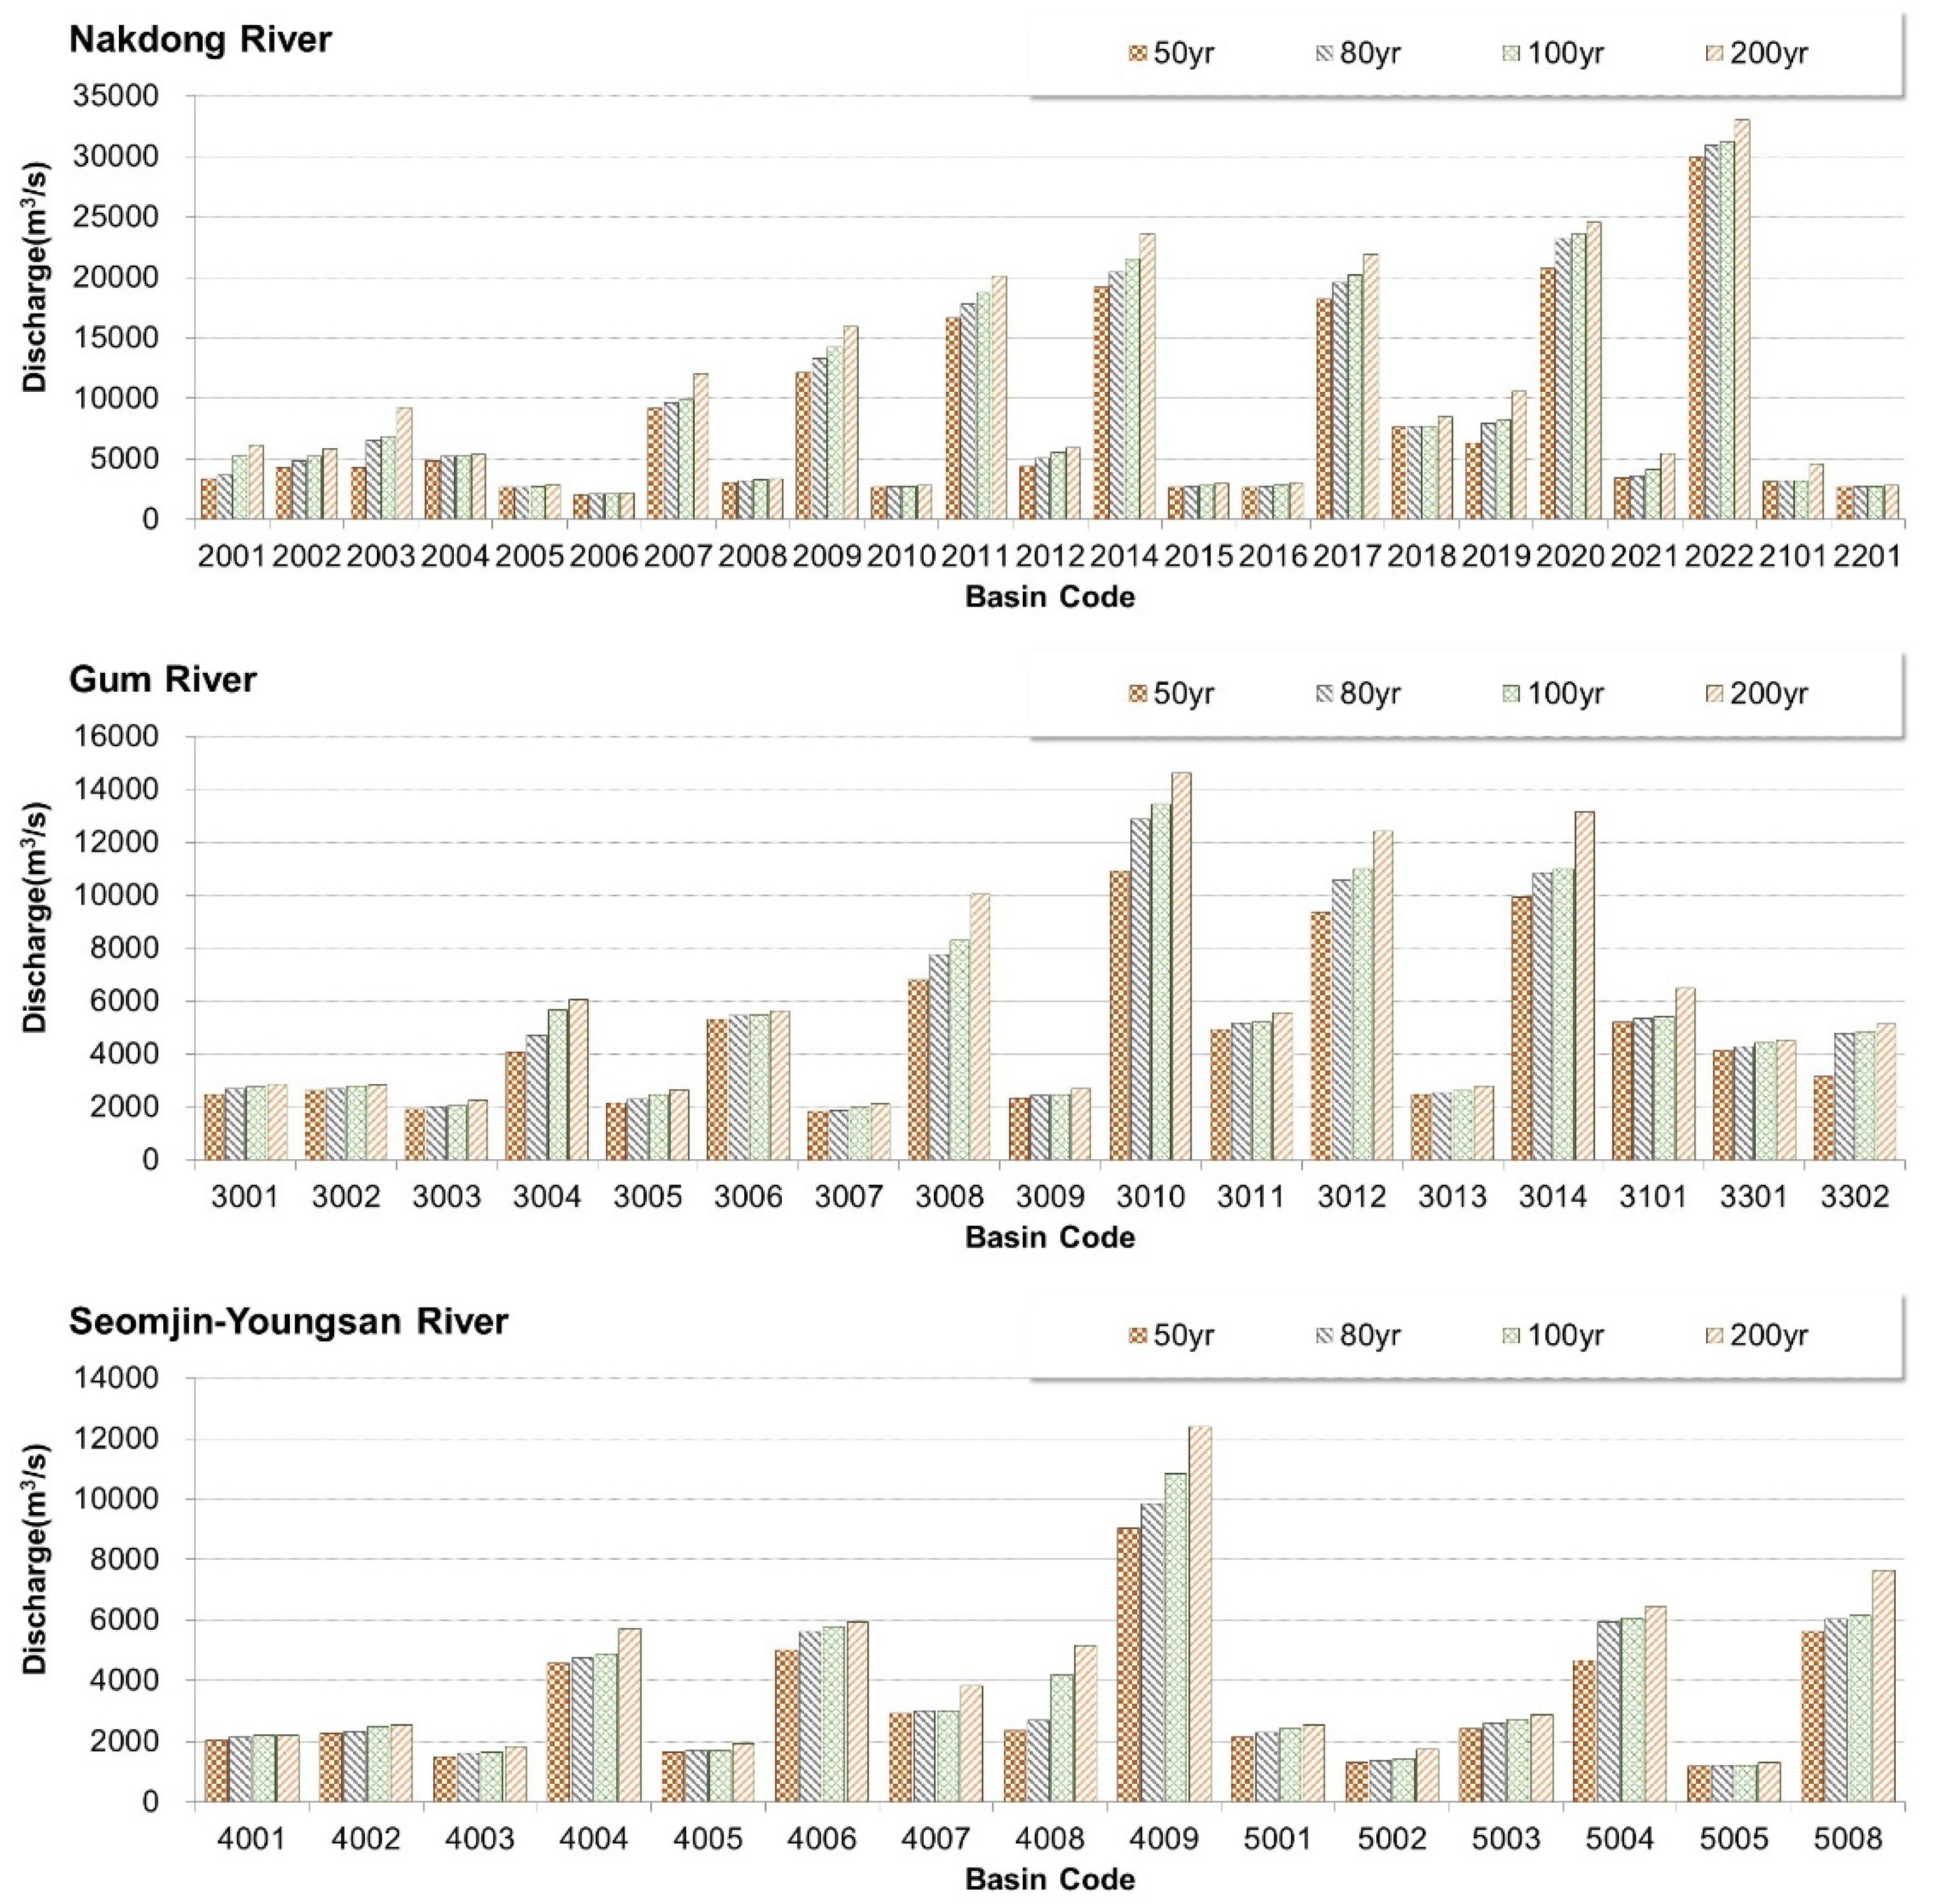
We applied the machine learning-based design flood prediction model with random forest to calculate design floods according to 13 climate change scenarios of RCP 4.5 and 8.5. Figure 3 and Figure 4 show the calculated n-year design floods using the CMCC-CM which has the best resolution. The basin codes of the mid-sized watershed were given as Figure 1; the 1000th for the Han River, the 2000th for the Nakdong River, the 3000th for Gum River, the 4000th for Seomjin River, and the 5000th for Youngsan River. Here, the lower down, the bigger number and the bigger design flood. The design floods of RCP 8.5 were calculated to be larger than those of RCP 4.5, as shown in Figure 3 and Figure 4.
From the results using 13 GCMs, the design floods in the Han River basin increased by 135.65%, 134.66%, 132.30%, and 130.75% for the 50-year, 80-year, 100-year, and 200-year floods, respectively. In addition, the design floods according to the RCP 8.5 were larger by 133.34% than the RCP 4.5 on average. The design floods in the Nakdong River basin increased by 130.61%, 131.64%, 132.81%, and 133.88% for the 50-year, 80-year, 100-year, and 200-year floods, respectively, and 133.11% on average. The design floods in the Geum River basin increased by 138.39%, 143.2%, 142.42%, and 135.50% for the 50-year, 80-year, 100-year, and 200-year floods, respectively, and 139.88% on average. The design floods in the Seomjin-Youngsan River basin increased by 126.71%, 130.73%, 135.47%, and 138.78% for the 50-year, 80-year, 100-year, and 200-year floods, respectively, and 132.92% on average. The RCP 8.5 scenarios increased the design flood by about 134.56% on average than the RCP 4.5.
3.2. Hydrologic Risk of Flooding According to Various Climate Change Scenarios
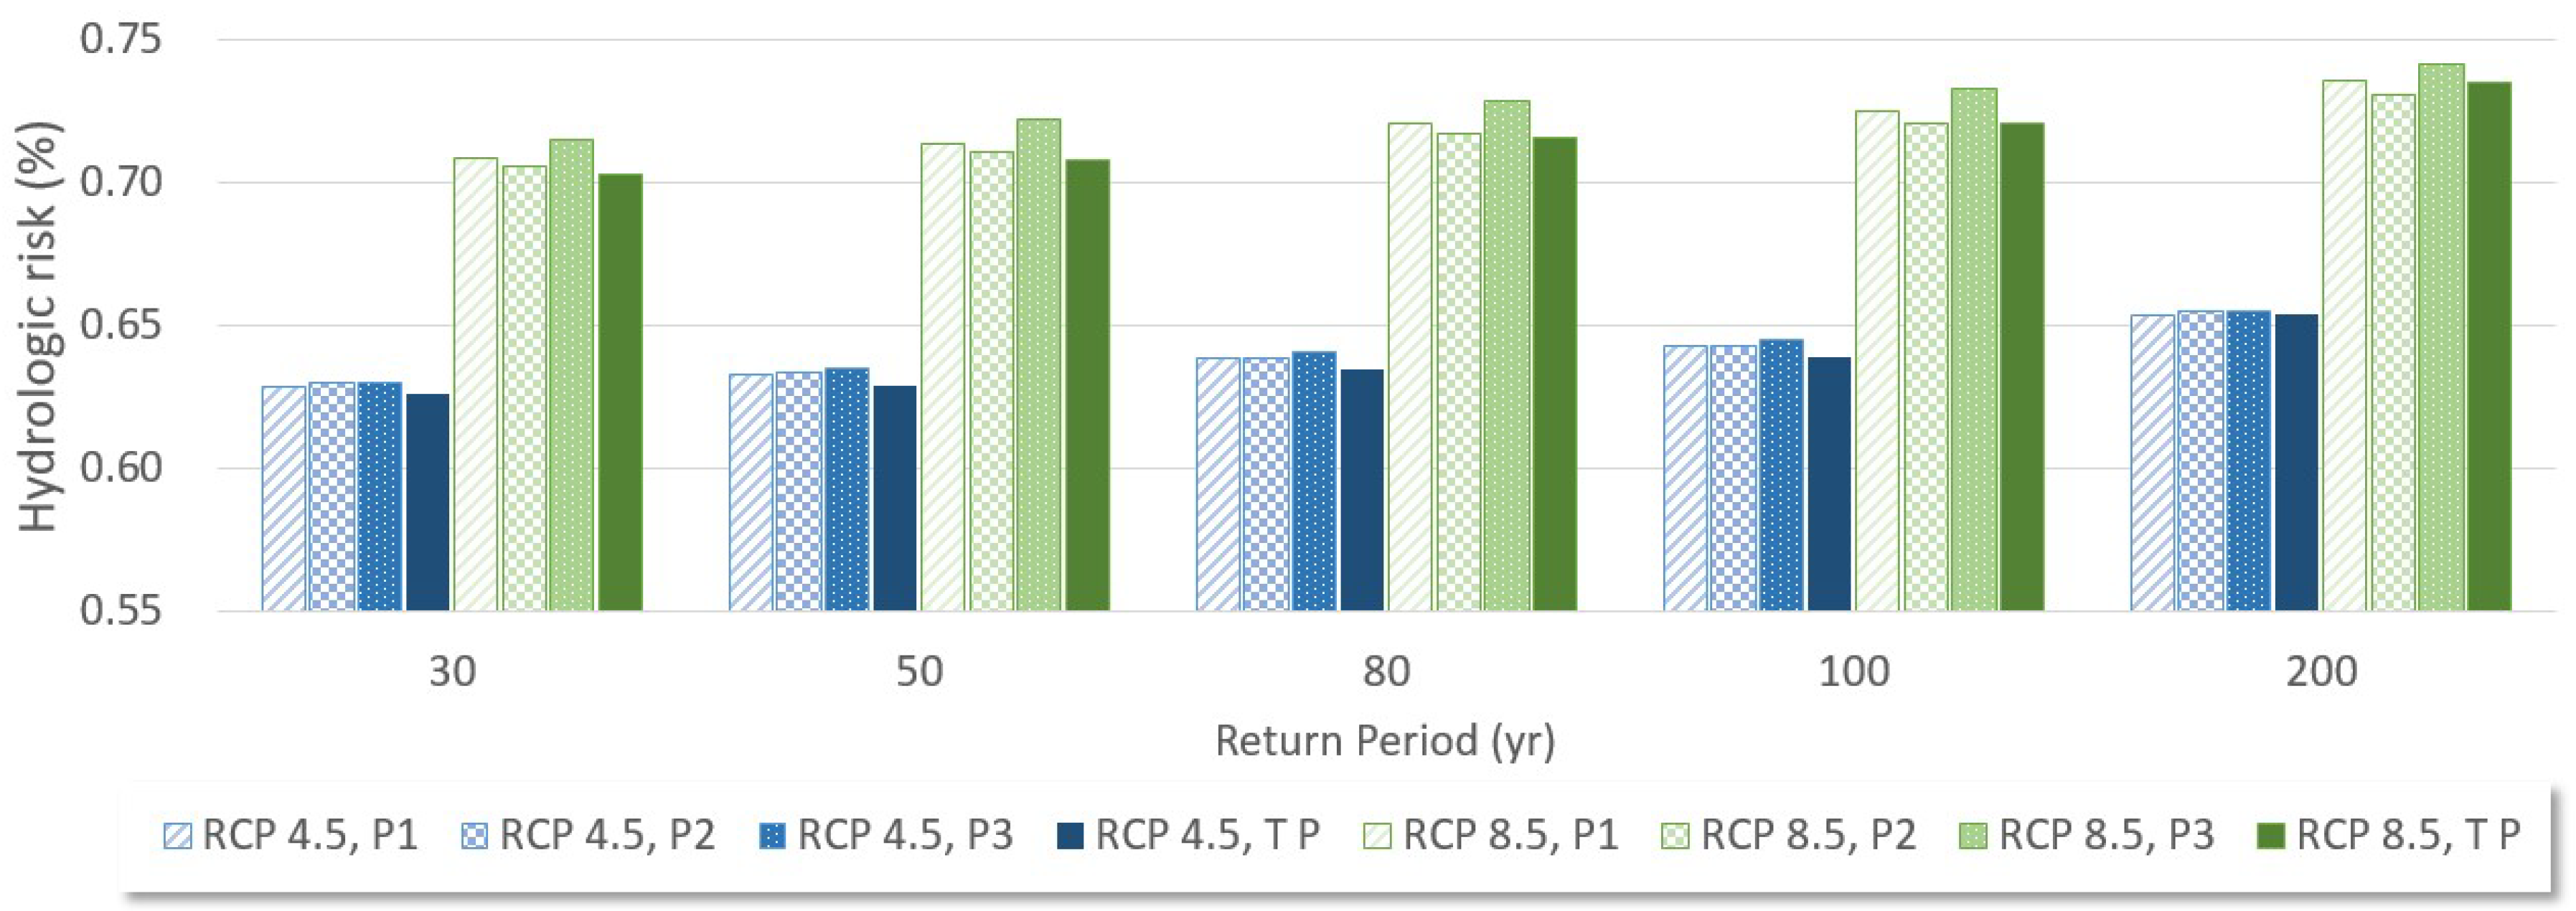
Hydrologic risks were estimated for 13 climate change scenarios and compared to the current risk. As discussed in Section 3.1, the design floods increased according to the RCPs which decreased corresponding return periods and resulted in an increase of hydrologic risk in the future. For example, the 100-year flood for #1001 according to the RCP 8.5 (CMCC-CM) was calculated as 10,188 m3/s, which corresponds to 73.9-year floods as the current period, resulting in the hydrologic risk of 0.744. Figure 5 shows the average results of risk estimation of RCP 4.5 and 8.5 for the 13 climate change scenarios. The probability of hydrologic failure with a 30-year design interval is approximately 63.8%, but this decreased to 62.9% (−0.89%) when a future climate change scenario is applied. The watershed runoffs of P1 and P3 are larger than those of P2, especially in RCP 8.5. For this reason, the hydrologic risk was also analyzed as being the lowest in the P2.
The hydrologic risks according to the RCP 4.5 were analyzed as an average of 0.639 (maximum of 0.655 and minimum of 0.626), and those according to the RCP 8.5 as an average of 0.721 (maximum of 0.742 and minimum of 0.703). Although not all risks in the 13 climate change scenarios were estimated to be significantly higher than at the current, the hydrologic risk of the RCP 4.5 scenario was the same as the current when considering the average risk for the mid-sized watersheds. The hydrologic risks of the RCP 8.5 were increased by +6.47% for 30-year, +7.22% for 50-year, +8.16% for 80-year, +8.70% for 100-year, and +10.20% for 200-year floods.
From the applications to the 74 mid-sized basins, the hydrologic risks according to the RCP 4.5 scenarios were found to be similar to those of the current level on average, although they ranged from a minimum of 0.479 to a maximum of 0.870. The hydrologic risks according to the RCP 8.5 scenario ranged from a minimum of 0.554 to a maximum of 0.916, with an average increase of 8.7% in the 100-year flood. The hydrologic risks of the 100-year floods for the entire period according to 13 climate change scenarios of the RCP 4.5 are shown in Table 2, and those according to RCP 8.5 are shown in Table 3. The hydrologic risk of the 100-year flood of each climate change scenario showed variabilities of −15.5% to +23.6% and an average 0.5% increase under the RCP 4.5, compared to variabilities of −8.0% to +28.2% and an average 8.7% increase under the RCP 8.5.
In previous studies, Condon et al. [19] determined that the risk increases by 10% to 20% in 2100, and Du et al. [20] found that there is an increasing trend in the risk from 14.1% to 18.3% for the 50-year frequency in the RCP 8.5 scenario. The risk analysis results for the 50-year frequency of the RCP 8.5 scenario averaged 7.4% (maximum of 22.7% and minimum of −5.5%) given that the average values of the 13 climate change scenarios were used in the analysis. In addition, Kim et al. [18] found that the risk increases up to a maximum of 19.3% for the 100-year frequency.
When comparing with Kim et al. [18] who used the same time frame, there is a maximum risk increase of 32.1% for the P3 (average +9.89%). Considering that we applied 13 climate change scenarios, this is not to be an overestimated result. As Kim et al. [18] discussed, overall hydrologic risks increased except for #1017 watershed where the large dam is located downstream.
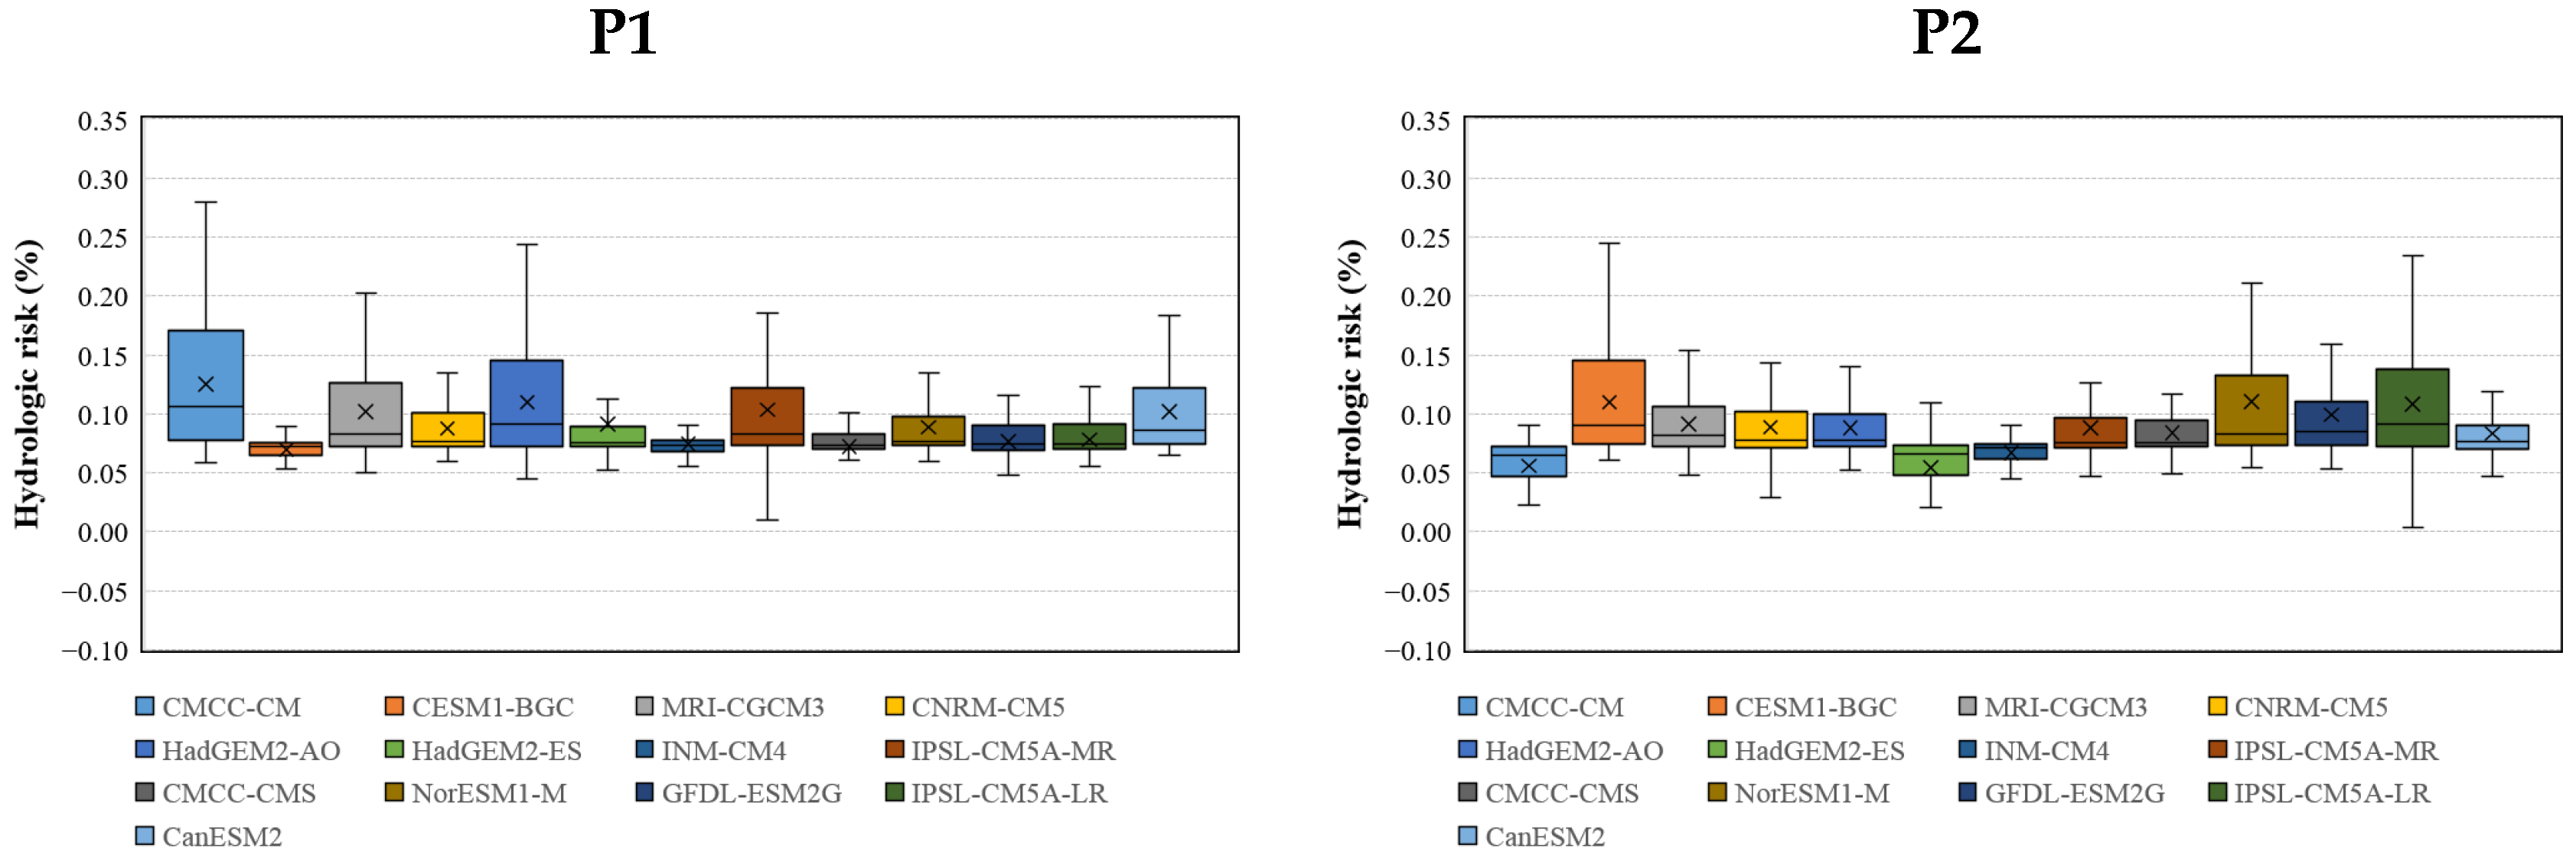
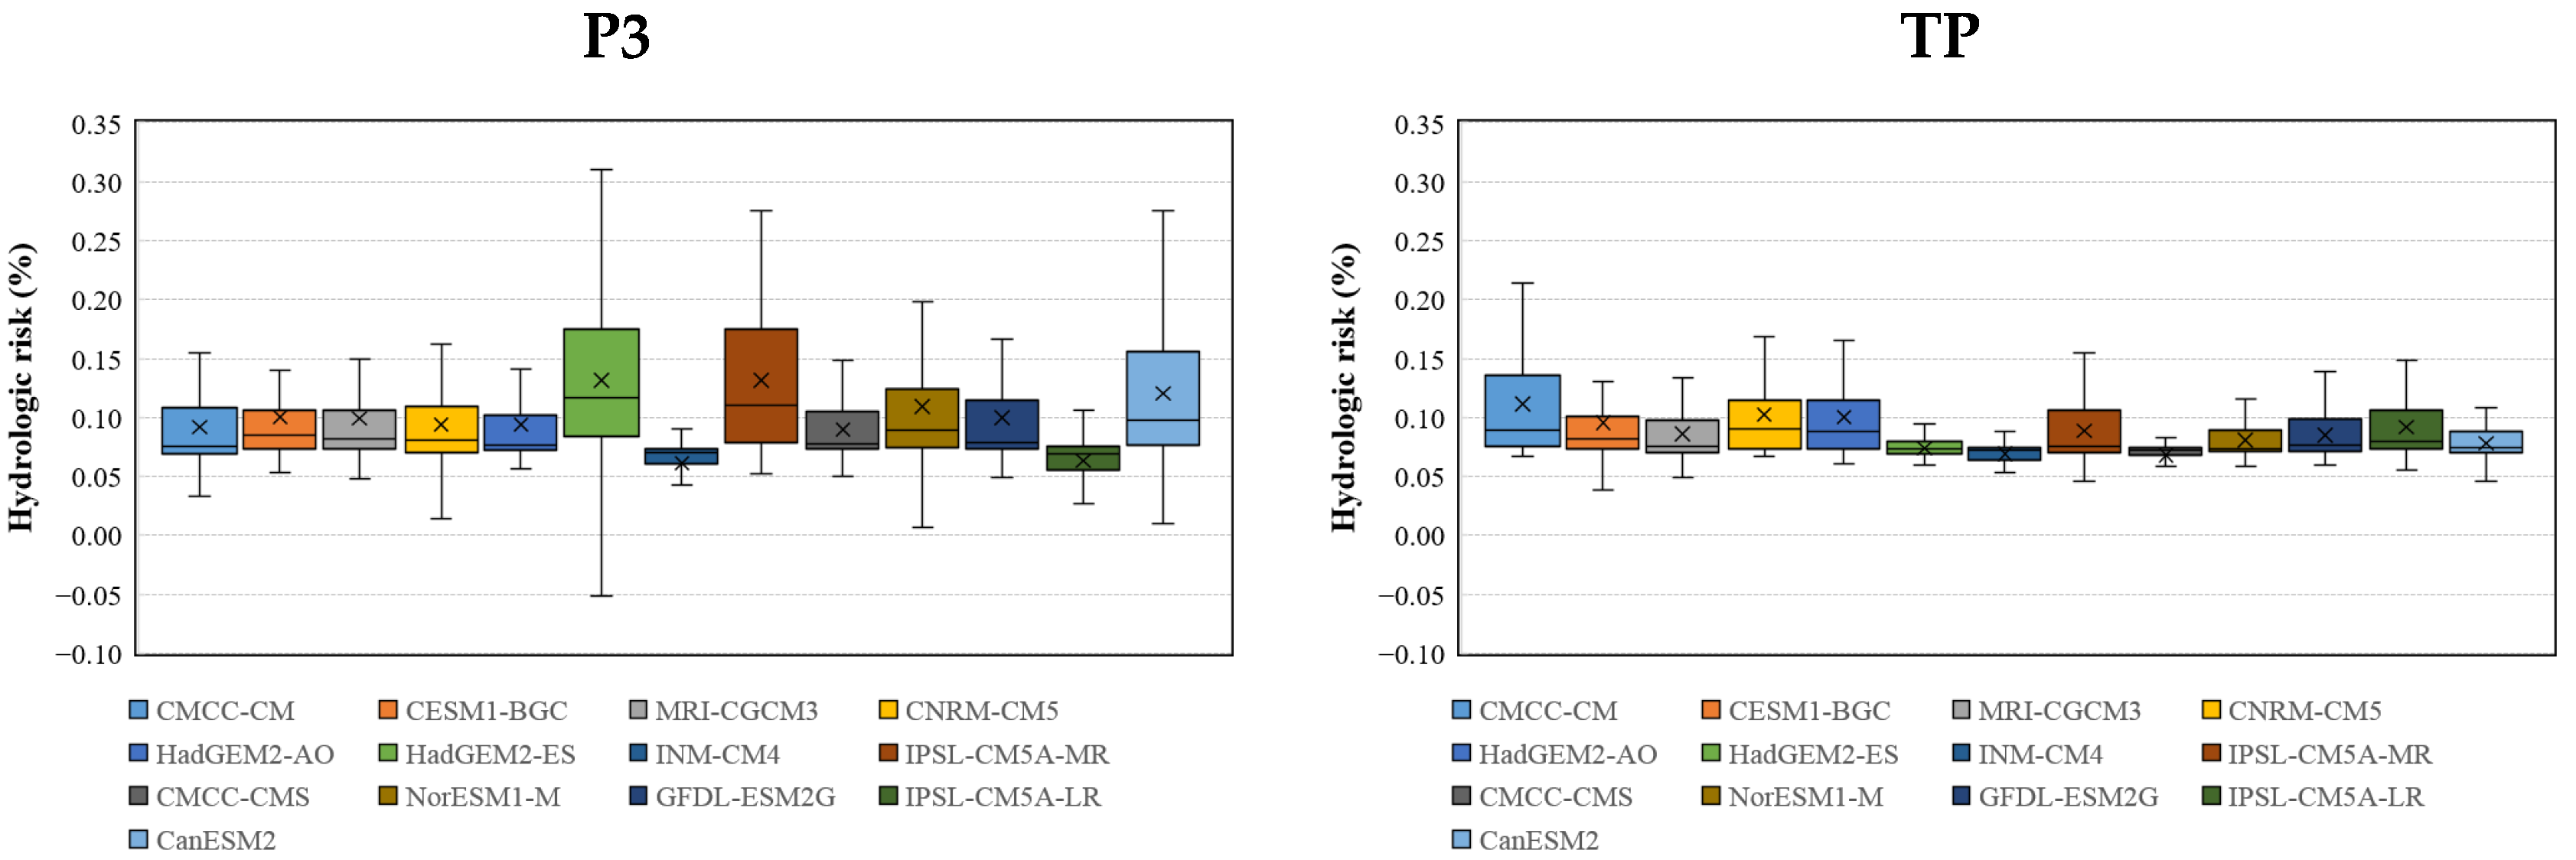
Using a box plot, the calculated hydrologic risks was categorized according to climate change scenarios into maximum, minimum, average, 25th percentile, 75th percentile, and outlier. Figure 6 and Figure 7 show the box plots of hydrologic risk of the 100-year flood according to the RCP 4.5 and 8.5, respectively. Looking at the box plots for the RCP 4.5, as shown in Figure 6, the variabilities were much larger in the P1 and relatively smaller in the P3. Looking at the box plots for the RCP 8.5, as shown in Figure 7, the variabilities increased compared with the RCP 4.5, and the hydrologic risk increased by about 10% for the TP.
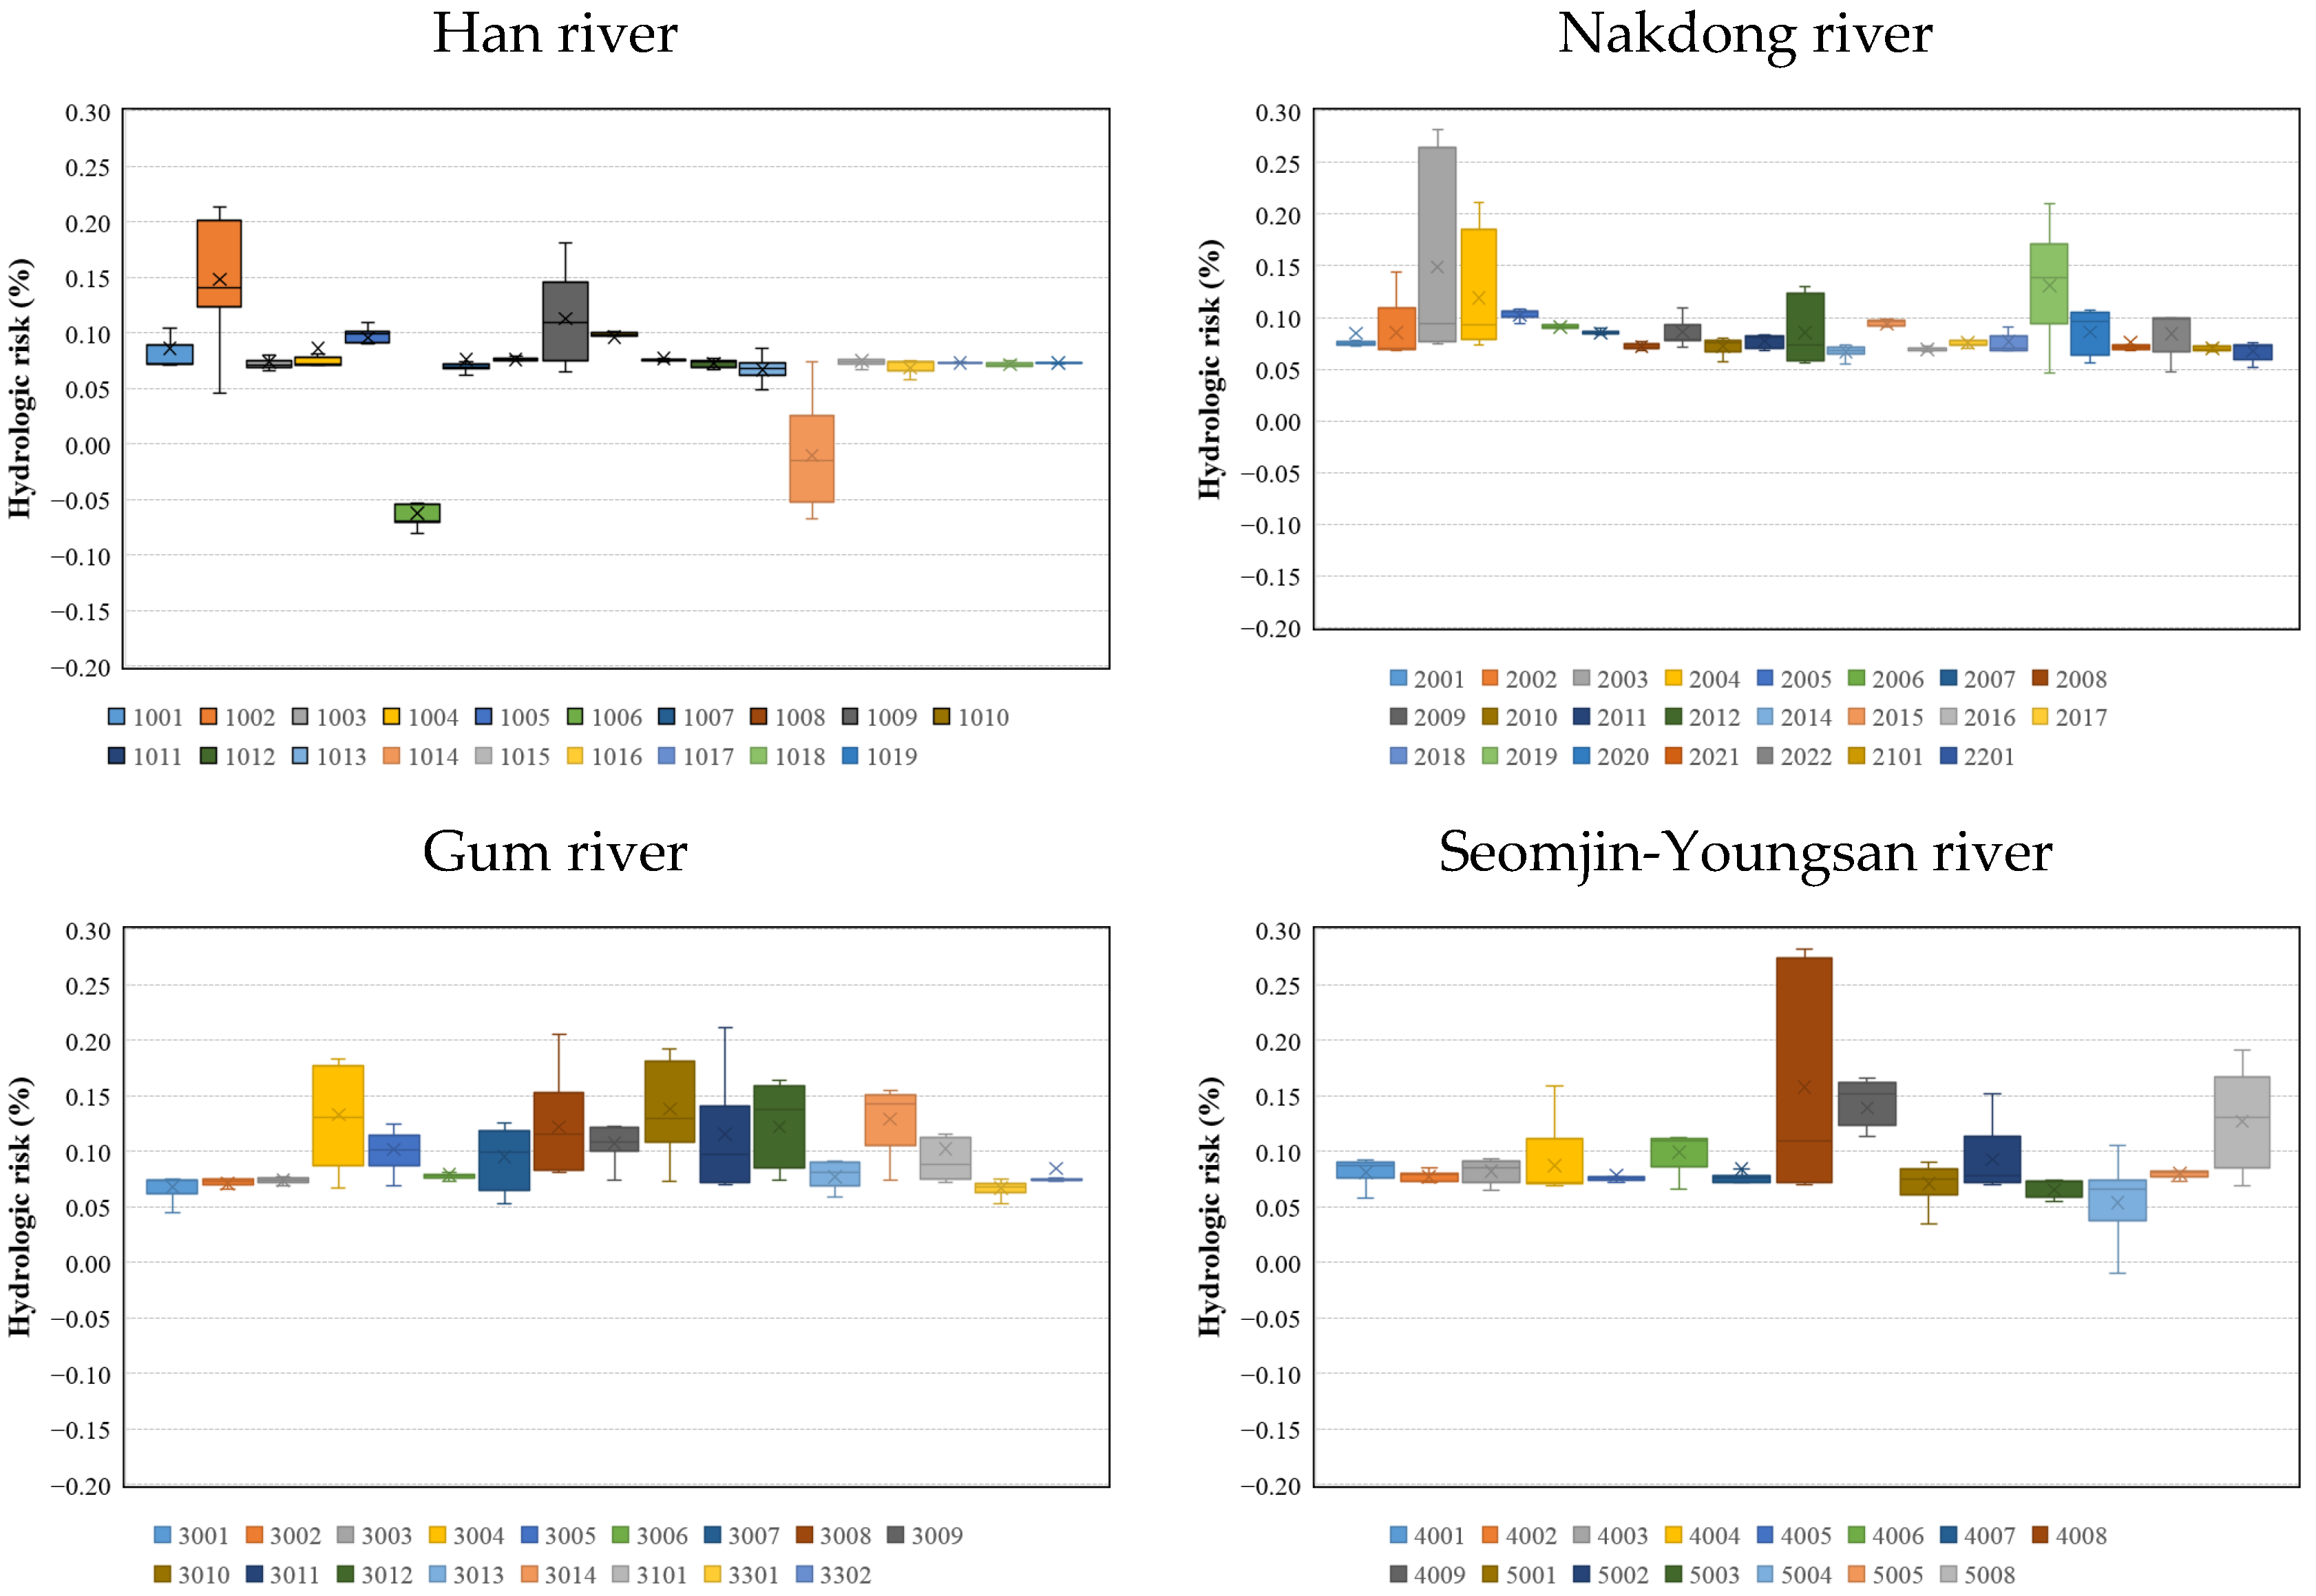
3.3. Hydrologic Risk for Individual Basins
The hydrologic risks are illustrated for the Han, Nakdong, Gum, and Seomjin-Youngsan rivers. Figure 8 and Figure 9 show box plots of hydrologic risks for individual basins according to the RCP 4.5 (TP) and the RCP 8.5 (TP), respectively, showing that the average level is the same as the current; 0.63 for the RCP 4.5 and 0.7 or higher for the RCP 8.5. The watersheds #1002, #1006, and #1014 of the Han River, #2019 of the Nakdong River, #3004, #3007, #3013 of the Gum River, and #4008 of the Seomjin-Youngsan river are tributary rivers and they were analyzed to be more variable than their main streams. In addition, in the case of #2003 and #3014, it is considered to have high variability because it is a dam basin.
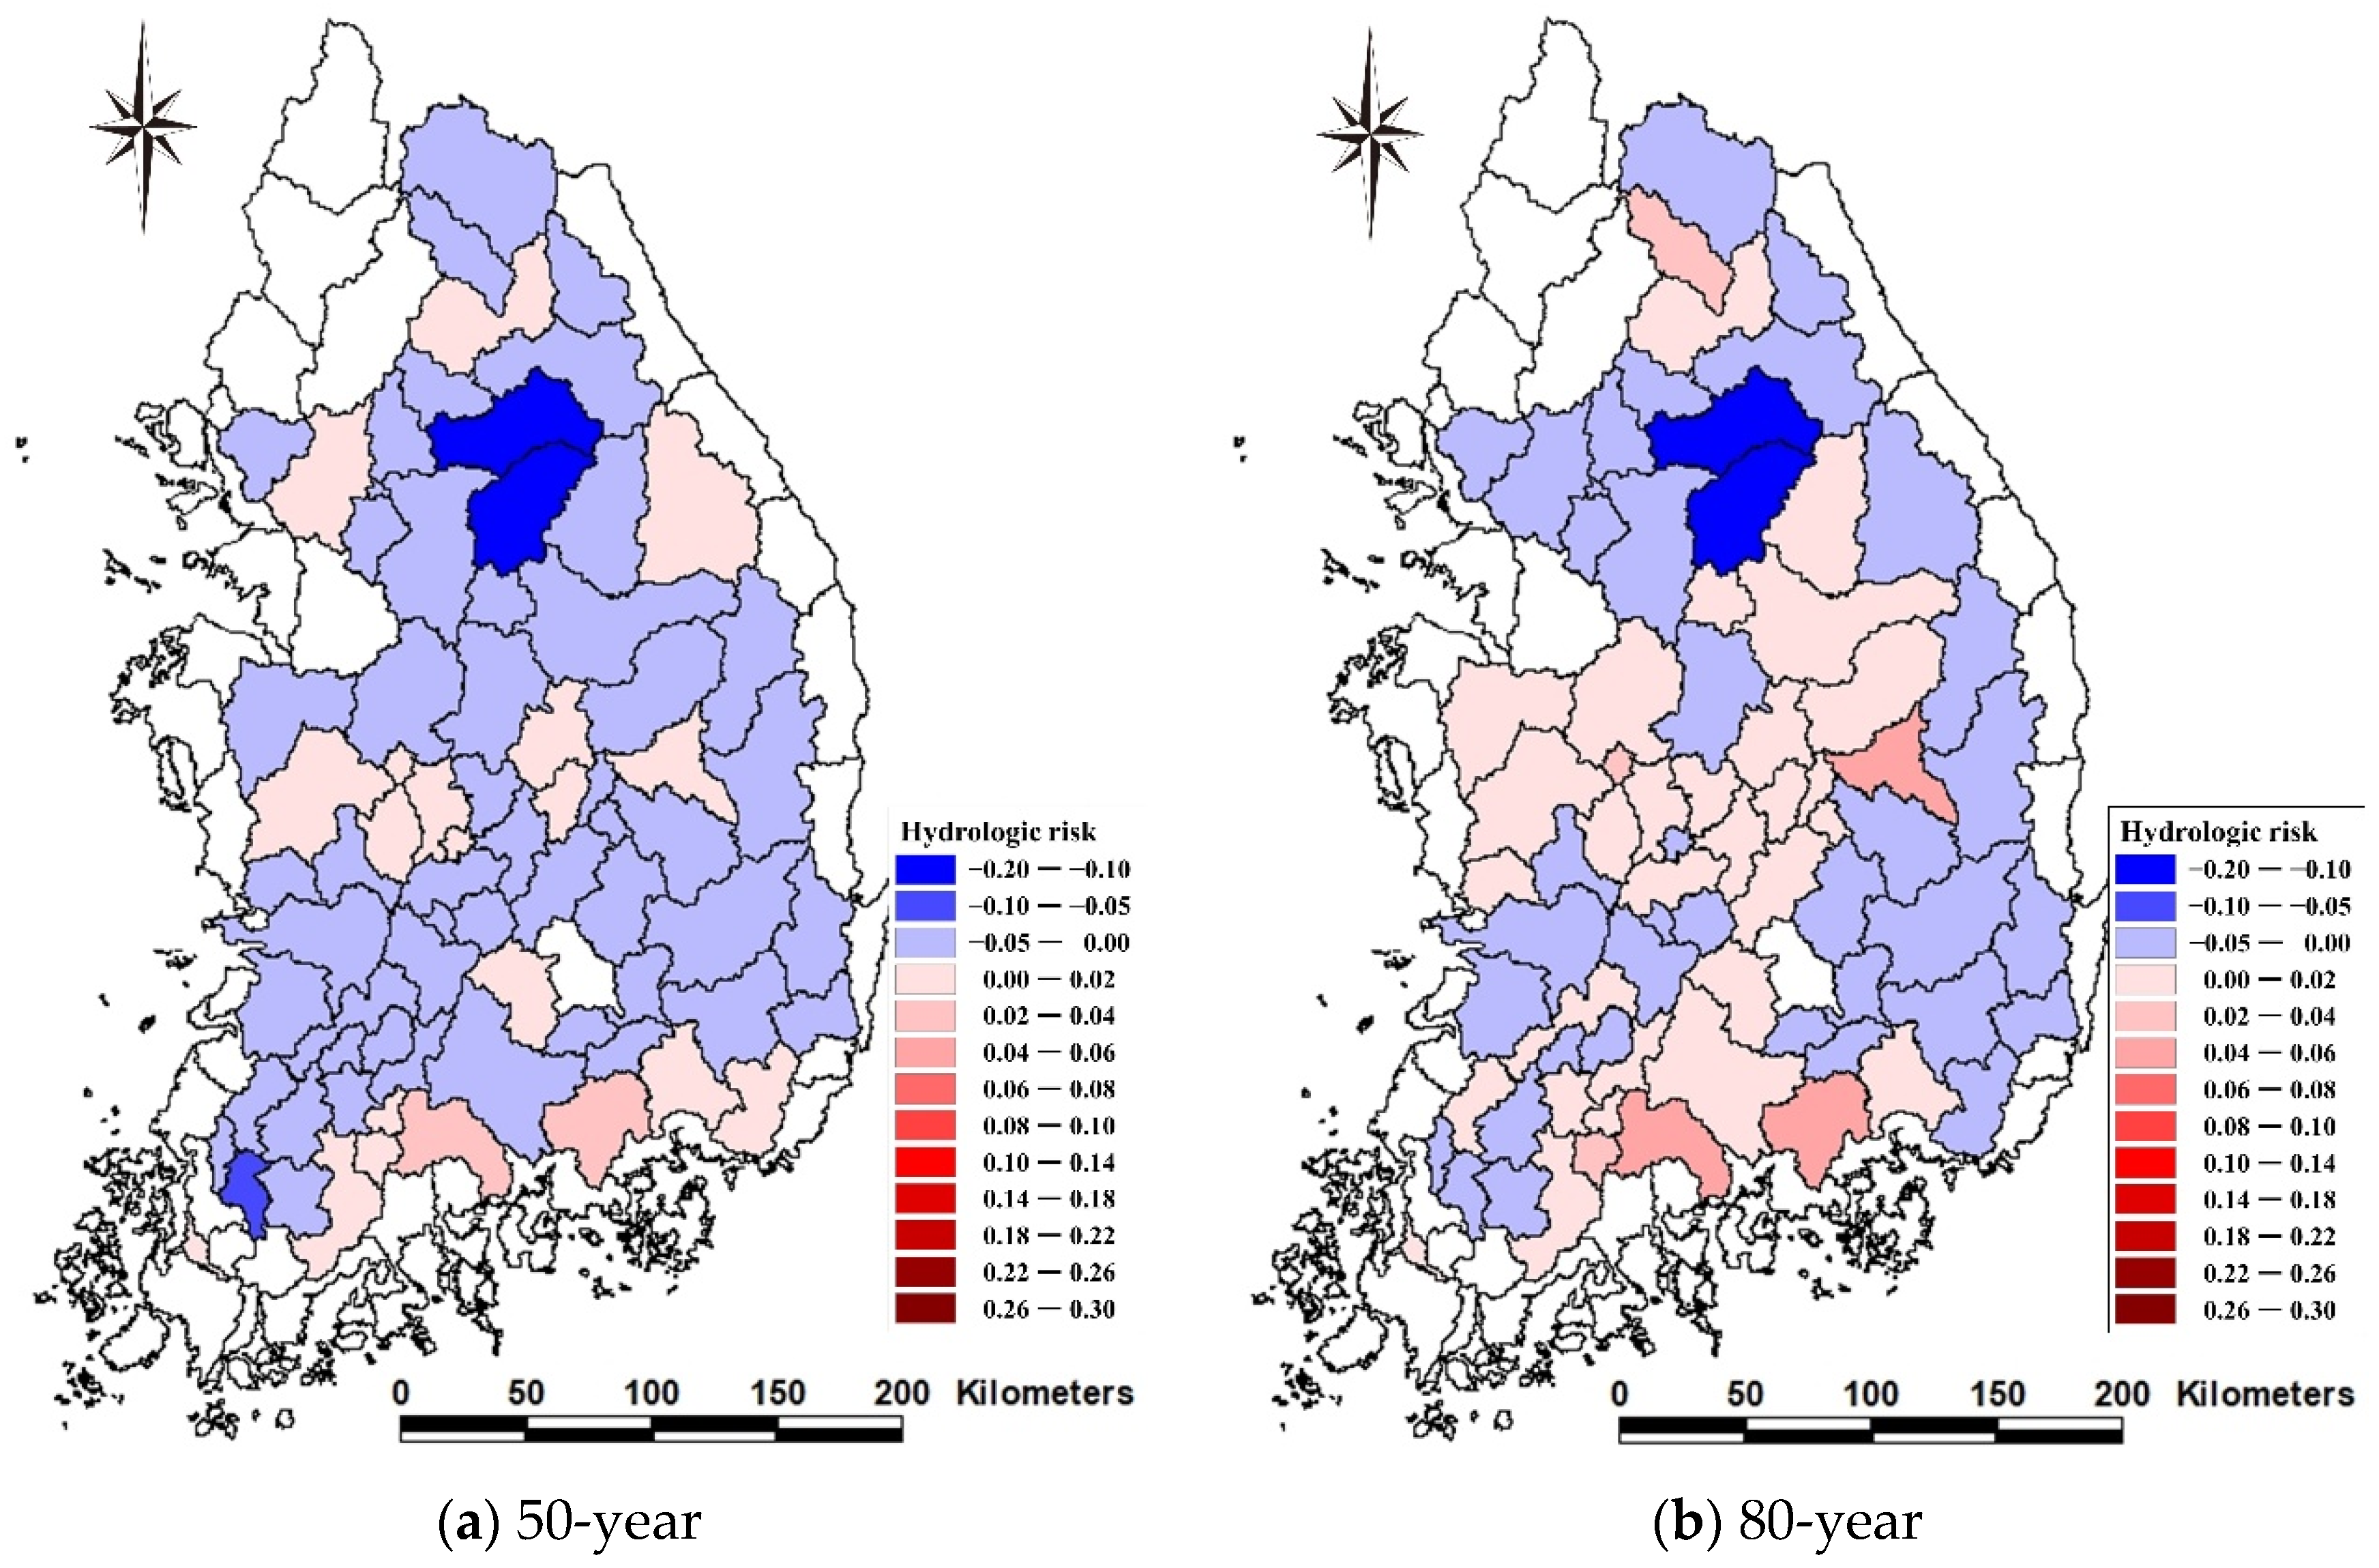
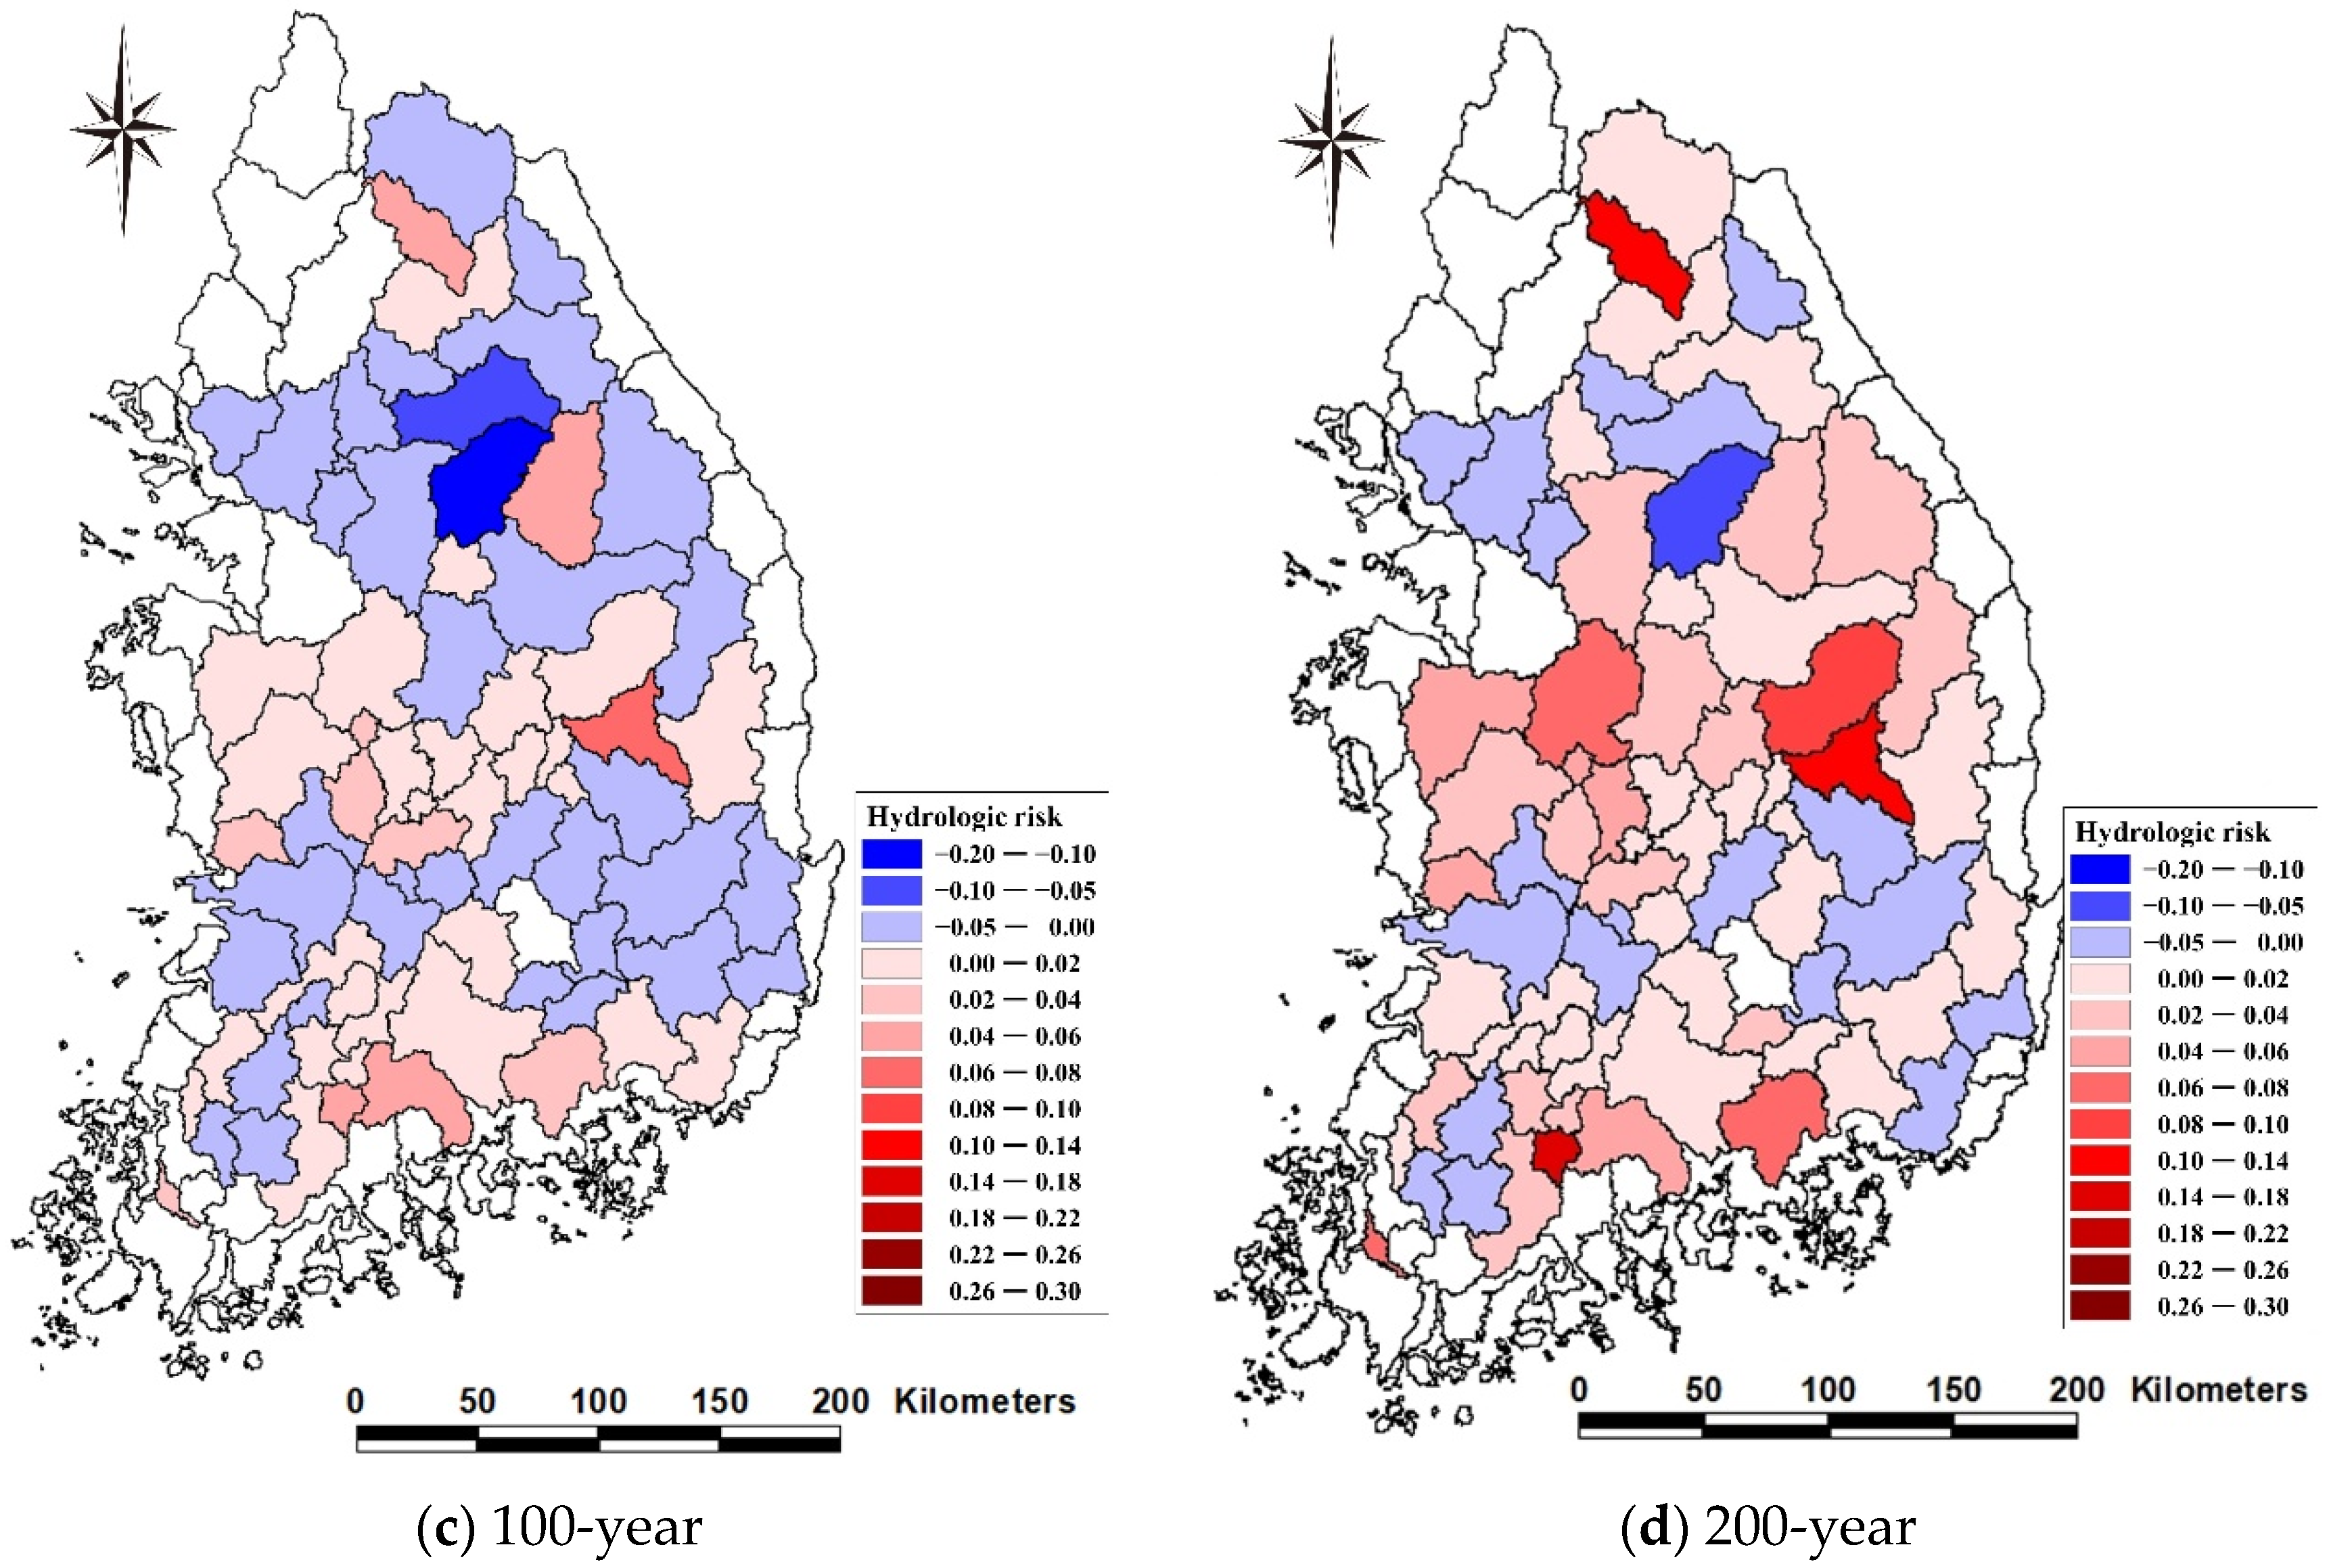
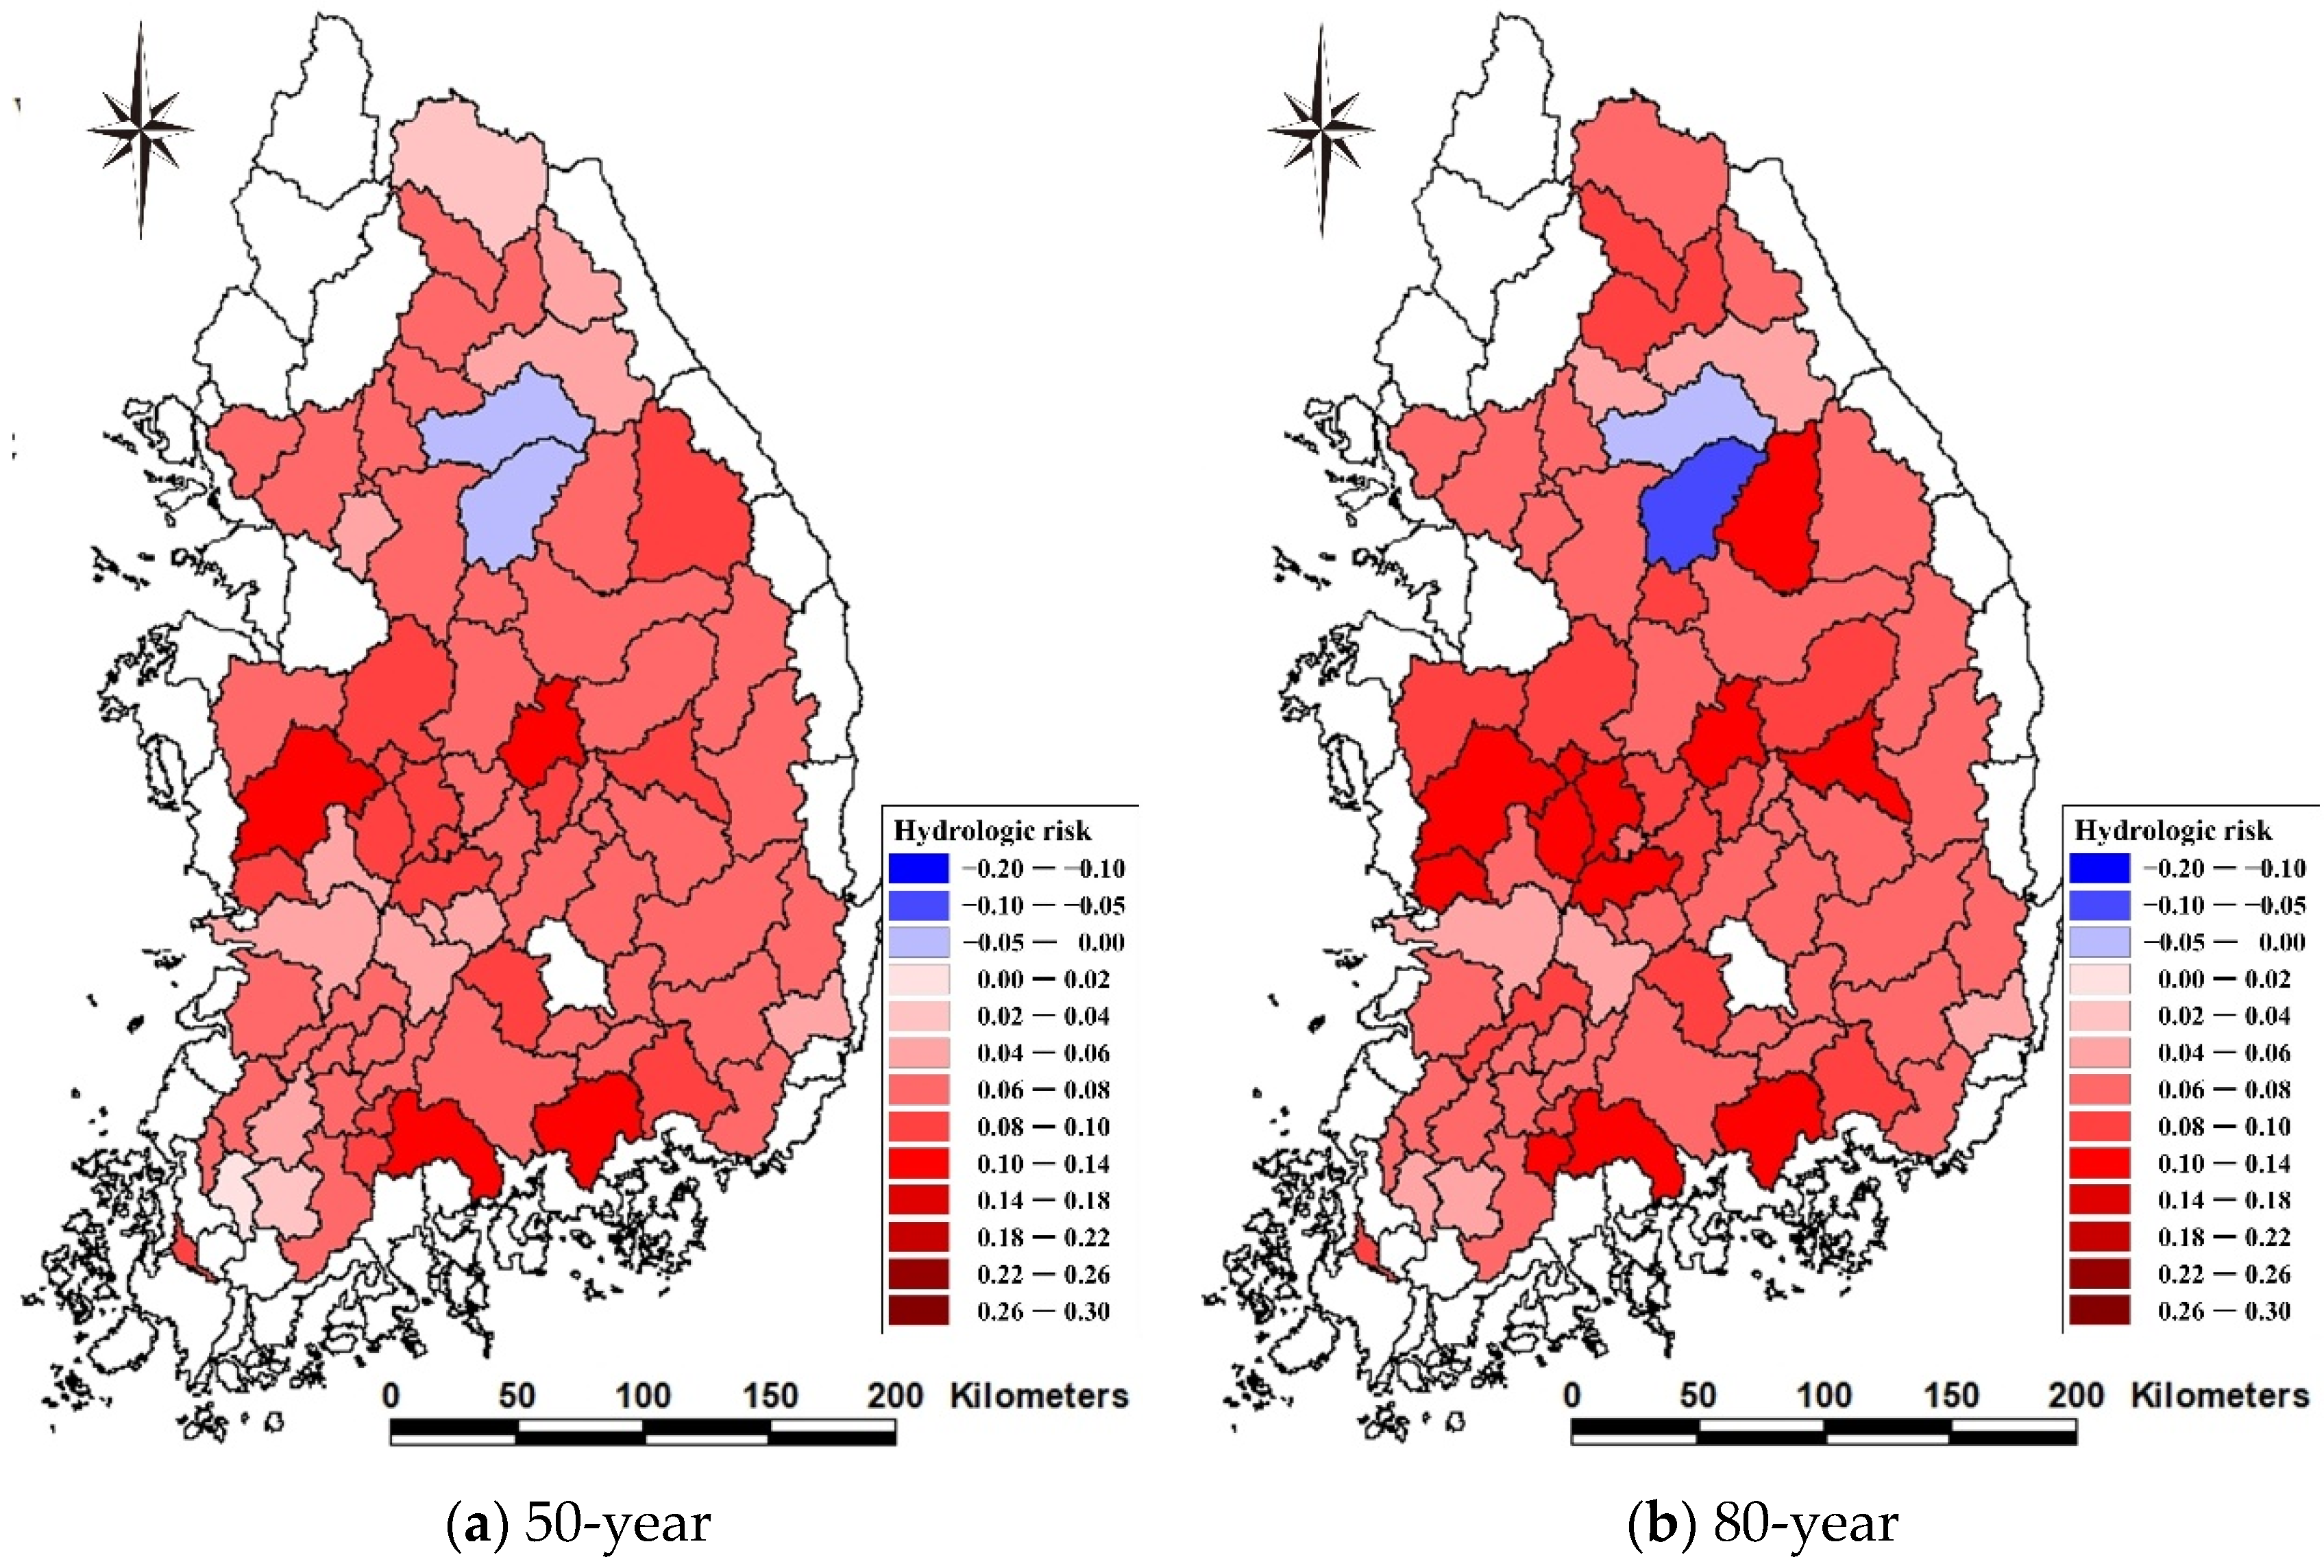
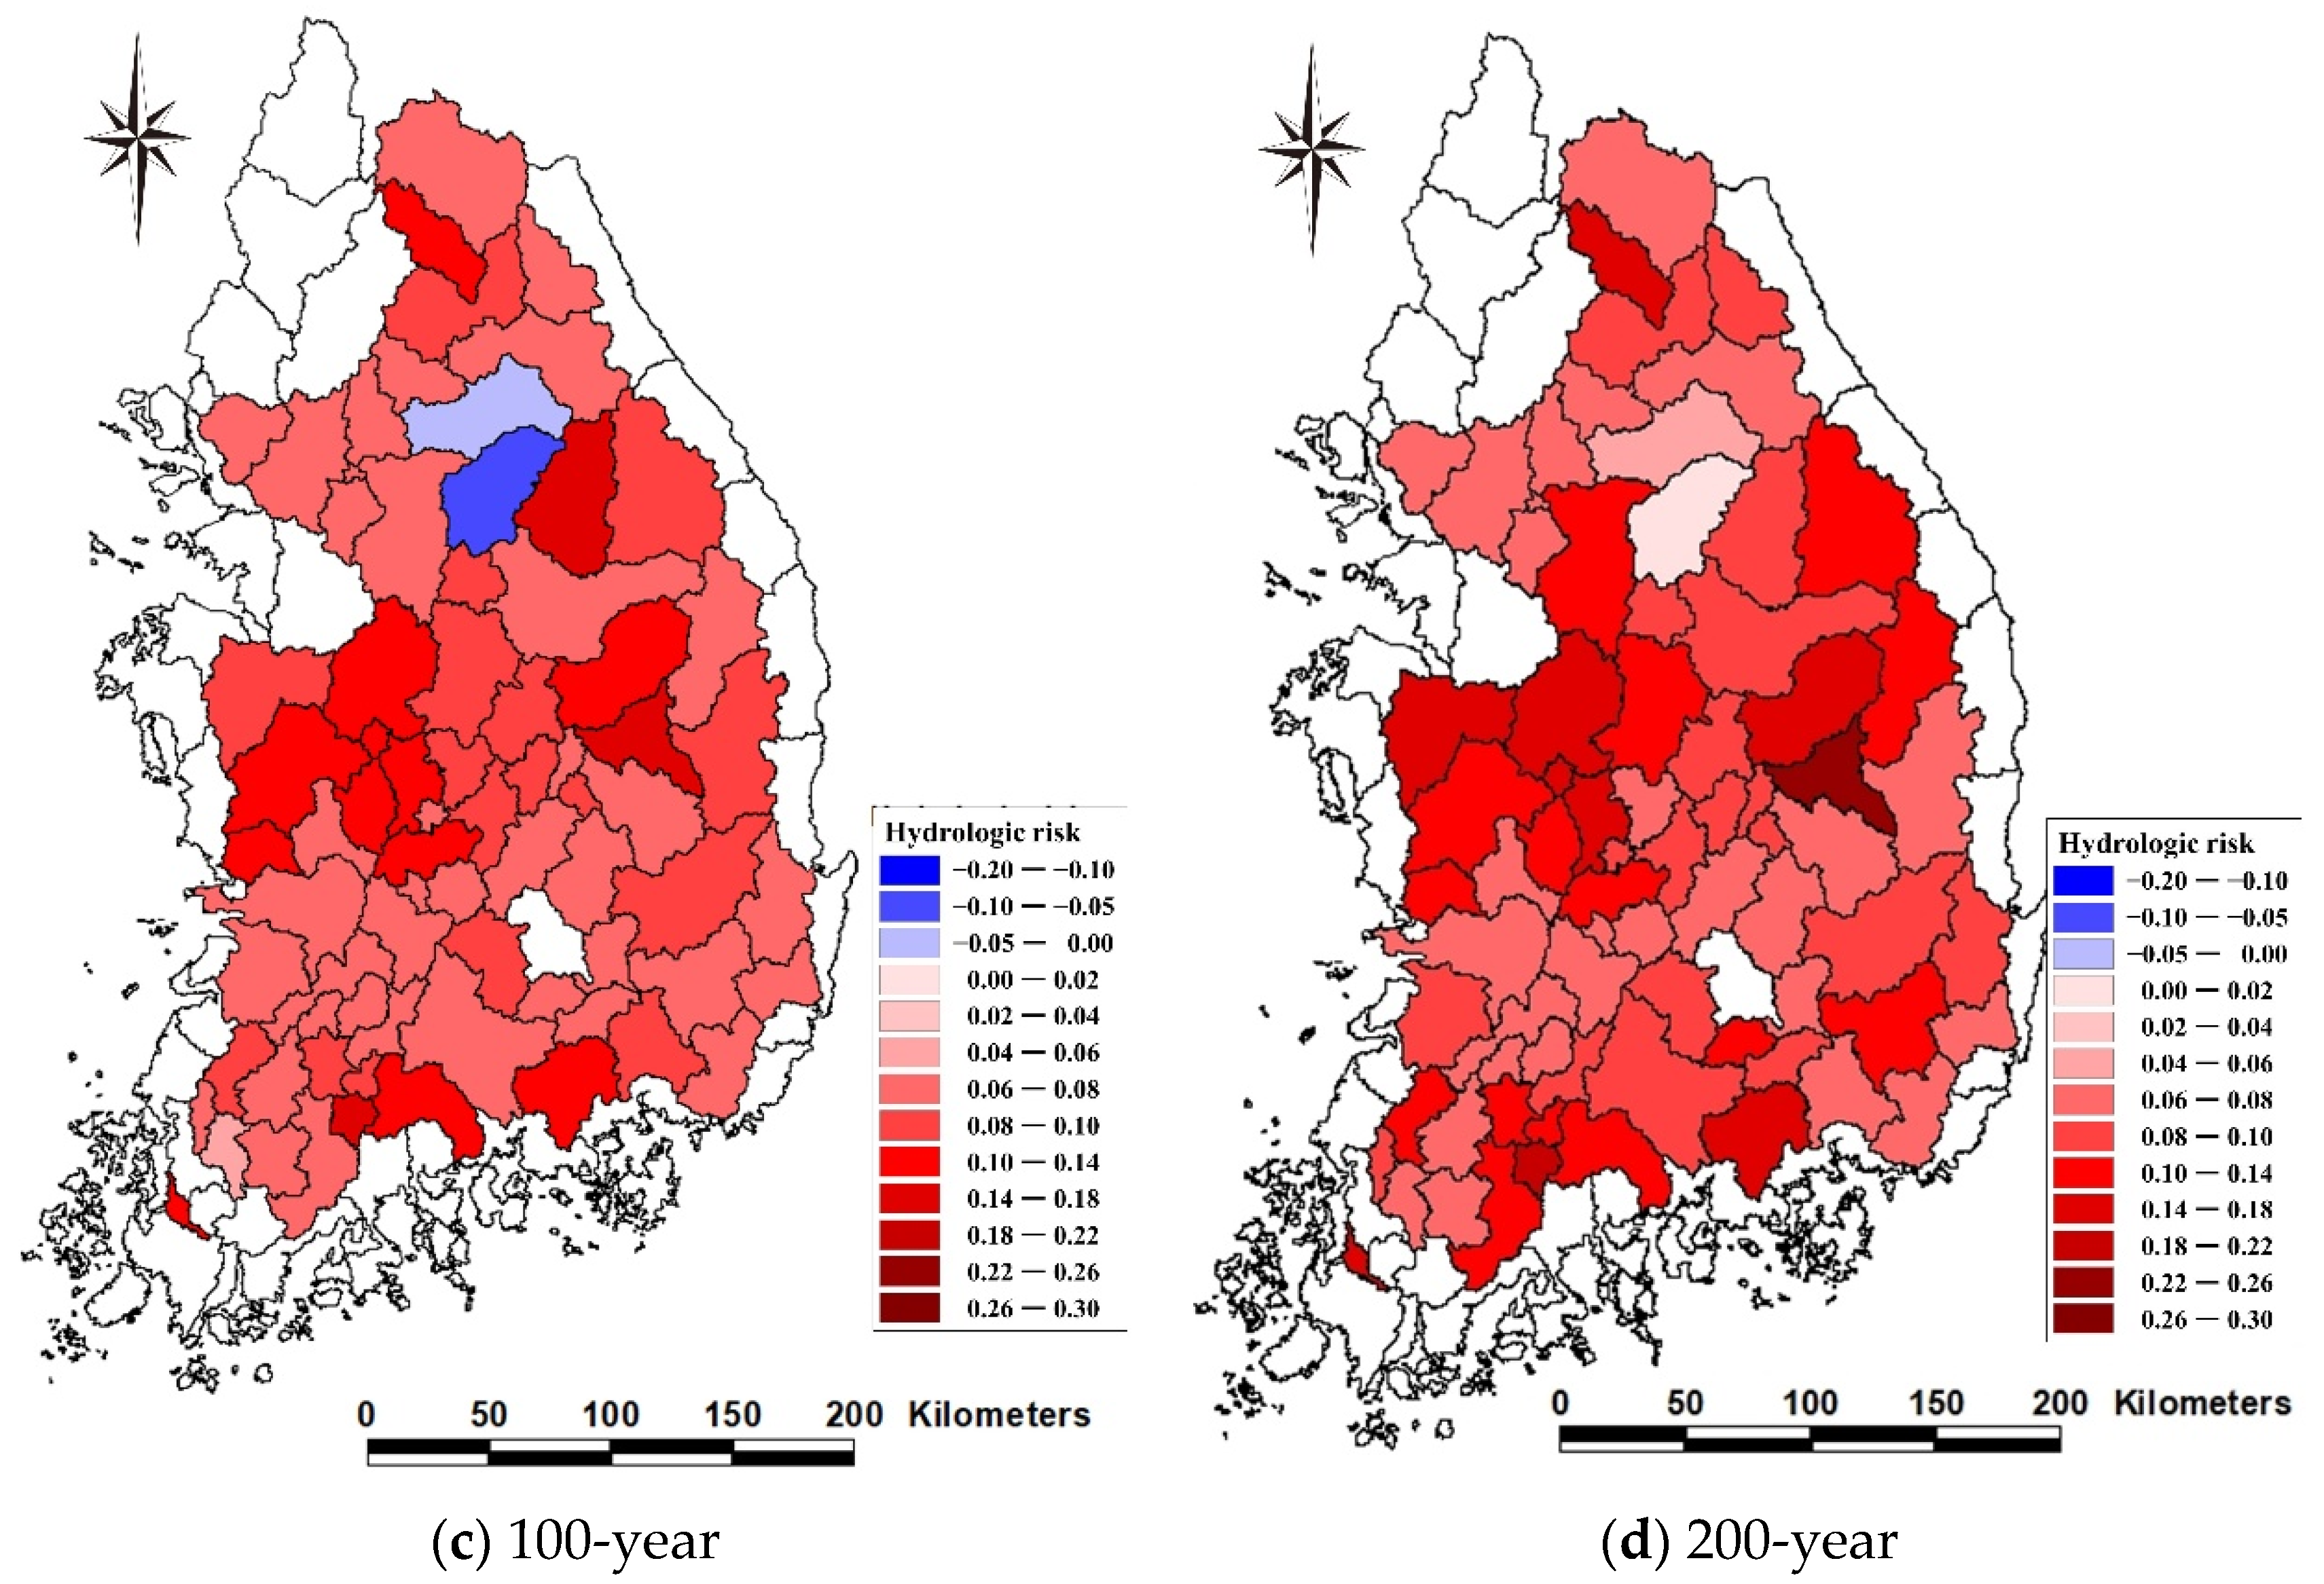
Figure 10 and Figure 11 illustrate frequency-specific risk maps of the TP of the RCP 4.5, and 8.5, respectively. Each map shows the average hydrologic risk of watershed. The blue color means that the hydrologic risk is lower than the present, and the red color means that the hydrologic risk is higher than the present. In the entire of South Korea, the hydrologic risk is higher for the RCP 8.5 than the RCP 4.5. The flood risk would increase by up to 30% for the RCP 8.5.
4. Conclusions
The machine learning-based design flood prediction model with random forest developed by Lee et al. [16] was applied to 13 climate change scenarios to evaluate hydrologic risks in South Korea. The separated time frames were established: P1 (2011–2040), P2 (2041–2070), P3 (2071–2099), and TP (Total Period, 2011–2099).
The RCP 4.5 resulted in the same level of design flood as that of the current, whereas the RCP 8.5 led to the larger design floods in most of the mid-sized watersheds compared to the present. The results indicated a higher occurrence probability of flood amount greater than that of the current, meaning less hydrologic stability and greater flood risk.
We found that although not all the hydrologic risks were estimated to be significantly higher than the current, the hydrologic risks according to the RCP 8.5 were found to be +10.20% for the 200-year flood, whereas the hydrologic risks of the RCP 4.5 were found to be the same as the current. These results indicate that in the future, hydraulic structures would have a higher probability of flooding than the current flood levels, and this reflects the need for proper preparation through accurate flood estimation.
The hydrological risks discussed in this study were the results of applying only the watershed characteristics and the estimated design floods. Therefore, it is necessary to further consider multifaceted socio-economic factors due to climate change, including population, assets, urbanization rate, and flood protection capacity.
The proposed method is to complement the current method of flood estimation in Korea and to estimate design floods in ungauged watersheds so as to evaluate the future flood risk according to the climate change scenarios. It is very convenient and practical to evaluate the hydrological risk and can be applied to other regions and scenarios. The novelty of this study is to employ the watershed characteristics to estimate flood risk and to inform the future increases in flood risk according to RCP 8.5.
Currently, in Korea, consideration of climate change is encouraged when all hydrologic working plans (rivers, dams, water and sewage systems, etc.) are established. However, considering the absence of a methodology to apply various climate change scenarios to design practice, the proposed method is useful to incorporate various climate change scenarios and design flood prediction models in ungauged watersheds to estimate the flood risk at any future point in time. Our results have great utility in that we can improve existing methods to calculate design floods as well as consider future flood risks according to climate change scenarios when planning and designing hydraulic structures.
Author Contributions
Conceptualization, T.-W.K.; Methodology, D.K.; Validation, H.-J.S. and D.K.; Formal Analysis, J.-Y.L.; Investigation, J.-H.R.; Resources, H.-J.S.; Data Curation, J.-Y.L.; Writing—Original Draft Preparation, J.-Y.L.; Writing—Review and Editing, T.-W.K.; Visualization, J.-H.R.; Supervision, T.-W.K. All authors have read and agreed to the published version of the manuscript.
Funding
This research was supported by a grant (2020-MOIS33-006) from the Lower-level and Core Disaster-Safety Technology Development Program funded by the Ministry of Interior and Safety (MOIS, Korea).
Institutional Review Board Statement
Not applicable.
Informed Consent Statement
Not applicable.
Data Availability Statement
Data sharing not applicable.
Conflicts of Interest
The authors declare no conflict of interest.
References
- Korea Meteorological Administration (KMA). Climate Change Scenario Use Casebook; KMA: Seoul, Korea, 2018. [Google Scholar]
- Liuzzo, L.; Bono, E.; Sammartano, V.; Freni, G. Analysis of spatial and temporal rainfall trends in Sicily during the 1921–2012 period. Appl. Clim. 2016, 126, 113–129. [Google Scholar] [CrossRef]
- Warming, G. Perceived community-based flood adaptation strategies under climate change in Nepal. Int. J. Glob. Warm. 2014, 6, 113–124. [Google Scholar]
- Avand, M.; Muradi, H.R.; Ramazanzadeh Lasboyee, M. Spatial prediction of future flood risk: An approach to the effects of climate change. Geoscience 2021, 11, 25. [Google Scholar] [CrossRef]
- Kordrostami, S.; Tao, Z.; Karim, F.; Rahman, A. Regional Flood Frequency Analysis Using an Artificial Neural Network Model. Geoscience 2020, 10, 127. [Google Scholar] [CrossRef] [Green Version]
- Akter, T.; Quevauviller, P.; Eisenreich, S.J.; Vaes, G. Impacts of climate and land use changes on flood risk management for the Schijn River, Belgium. Environ. Sci. Policy 2018, 89, 163–175. [Google Scholar] [CrossRef]
- Saber, M.; Abdrabo, K.I.; Habiba, O.M.; Kantosh, S.A.; Sumi, T. Impacts of triple factors on flash flood vulnerability in Egypt: Urban growth, extreme climate, and mismanagement. Geosciences 2020, 10, 24. [Google Scholar] [CrossRef] [Green Version]
- Ministry of the Interior and Safety (MOIS). Guideline for the Design Criteria of Structural Measures to Prevent Natural Disasters under Climate Change; MOIS: Sejong, Korea, 2014. [Google Scholar]
- Adnan, M.; Nabi, G.; Kang, S.; Zhang, G.; Adnan, R.M.; Anjum, M.N.; Iqbal, M.; Ali, A.F. Snowmelt runoff modelling under projected climate change patterns in the Gilgit river basin of Northern Pakistan. Pol. J. Environ. Stud. 2017, 26, 525–542. [Google Scholar] [CrossRef]
- Mehmood, A.; Jia, S.; Lv, A.; Zhu, W.; Mahmood, R.; Saifullah, M.; Adnan, R.M. Detection of spatial shift in flood regime of the Kabul river basin in Pakistan, causes, challenges, and opportunities. Water 2021, 13, 1276. [Google Scholar] [CrossRef]
- Najibi, N.; Devineni, N. Recent trends in the frequency and duration of global floods. Earth Syst. Dyn. 2018, 9, 757–783. [Google Scholar] [CrossRef] [Green Version]
- Mehmood, A.; Jia, S.; Mahmood, R.; Yan, J.; Ahsan, M. Non-stationary Bayesian modeling of annual maximum floods in a changing environment and implications for flood management in the Kabul river basin, Pakistan. Water 2019, 11, 1246. [Google Scholar] [CrossRef] [Green Version]
- Latif, Y.; Ma, Y.; Ma, W. Climatic trends variability and concerning flow regime of Upper Indus basin, Jehlum, and Kabul river basins Pakistan. Theor. Appl. Climatol 2021, 144, 447–468. [Google Scholar] [CrossRef]
- Ministry of the Interior and Safety (MOIS). Disaster Prevention Performance Establishment and Operation Standards by Region: Considering Future Climate Change Effects; MOIS: Sejong, Korea, 2017. [Google Scholar]
- Chungcheongnam-do. Determining the Design Frequency of Local Rivers in Chungcheongnam-do; Korea River Association: Chungcheongnam-do, Korea, 2017. [Google Scholar]
- Lee, J.-Y.; Choi, C.; Kang, D.; Kim, B.S.; Kim, T.-W. Estimating design floods at ungauged watersheds in South Korea using machine learning models. Water 2020, 12, 22. [Google Scholar] [CrossRef]
- Intergovernmental Panel on Climate Change (IPCC). Climate Change 2014: Synthesis Report. Contribution of Working Groups I, II and III to the Fifth Assessment Report of the Intergovernmental Panel on Climate Change; IPCC: Geneva, Switzerland, 2014. [Google Scholar]
- Kim, N.W.; Lee, J.-Y.; Park, D.H.; Kim, T.-W. Evaluation of future flood risk according to RCP scenarios using a regional flood frequency analysis for ungauged watersheds. Water 2019, 11, 992. [Google Scholar] [CrossRef] [Green Version]
- Condon, L.E.; Gangopadhyay, S.; Pruitt, T. Climate change and non-stationary flood risk for the upper Truckee River basin. Hydrol. Earth Syst. Sci. 2015, 19, 159–175. [Google Scholar] [CrossRef]
- Du, T.; Xiong, L.; Xu, C.Y.; Gippel, C.; Guo, S.; Liu, P. Return period and risk analysis of nonstationary low-flow series under climate change. J. Hydrol. 2015, 527, 234–250. [Google Scholar] [CrossRef] [Green Version]
Figure 1.
Range of application of flood prediction model.

Figure 2.
Extension of previous study to the hydrologic risk analysis.

Figure 3.
n-year floods according to the RCP 4.5 (CMCC-CM, Total Period).

Figure 4.
n-year floods according to the RCP 8.5 (CMCC-CM, Total Period).


Figure 5.
Average risks according to RCP scenarios and different time frames.

Figure 6.
Box plots of hydrologic risks of the 100-year flood according to the RCP 4.5.

Figure 7.
Box plots of hydrologic risks of the 100-year flood according to the RCP 8.5.


Figure 8.
Hydrologic risks of individual basins according to the RCP 4.5.

Figure 9.
Hydrologic risks of individual basins according to the RCP 8.5.

Figure 10.
Hydrologic risk map of the RCP 4.5 for the total period.


Figure 11.
Hydrologic risk map of the RCP 8.5 for the total period.


Table 1.
GCM models used for APCC’s climate scenarios.
| No. | GCMs | Resolution | Agency |
|---|---|---|---|
| 1 | CMCC-CM | 0.750 × 0.748 | Centro Euro-Mediterraneo per i Cambiamenti Climatici |
| 2 | CESM1-BGC | 1.250 × 0.942 | National Center for Atmospheric Research |
| 3 | MRI-CGCM3 | 1.125 × 1.122 | Meteorological Research Institute |
| 4 | CNRM-CM5 | 1.406 × 1.401 | Centre National de Recherches Meteorologiques |
| 5 | HadGEM2-AO | 1.875 × 1.250 | Met Office Hadley Centre |
| 6 | HadGEM2-ES | 1.875 × 1.250 | |
| 7 | INM-CM4 | 2.000 × 1.500 | Institute for Numerical Mathematics |
| 8 | IPSL-CM5A-MR | 2.500 × 1.268 | Institut Pierre-Simon Laplace |
| 9 | CMCC-CMS | 1.875 × 1.865 | Centro Euro-Mediterraneo per i Cambiamenti Climatici |
| 10 | NorESM1-M | 2.500 × 1.895 | Norwegian Climate Centre |
| 11 | GFDL-ESM2G | 2.500 × 2.023 | Geophysical Fluid Dynamics Laboratory |
| 12 | IPSL-CM5A-LR | 3.750 × 1.895 | Institut Pierre-Simon Laplace |
| 13 | CanESM2 | 2.813 × 2.791 | Canadian Centre for Climate Modelling and Analysis |
Table 2.
Hydrologic risks of the 100-year flood according to the RCP 4.5 (Total Period).
| Climate Change Scenario (GCM ID Number) | |||||||||||||
|---|---|---|---|---|---|---|---|---|---|---|---|---|---|
| 1 | 2 | 3 | 4 | 5 | 6 | 7 | 8 | 9 | 10 | 11 | 12 | 13 | |
| Ave | 0.64 | 0.65 | 0.64 | 0.64 | 0.67 | 0.63 | 0.62 | 0.63 | 0.64 | 0.63 | 0.64 | 0.64 | 0.64 |
| Max | 0.82 | 0.84 | 0.77 | 0.82 | 0.87 | 0.71 | 0.73 | 0.75 | 0.86 | 0.73 | 0.74 | 0.71 | 0.74 |
| Min | 0.49 | 0.48 | 0.49 | 0.50 | 0.50 | 0.48 | 0.48 | 0.50 | 0.49 | 0.51 | 0.48 | 0.49 | 0.49 |
Table 3.
Hydrologic risks of the 100-year flood according to the RCP 8.5 (Total Period).
| Climate Change Scenario (GCM ID Number) | |||||||||||||
|---|---|---|---|---|---|---|---|---|---|---|---|---|---|
| 1 | 2 | 3 | 4 | 5 | 6 | 7 | 8 | 9 | 10 | 11 | 12 | 13 | |
| Ave | 0.75 | 0.73 | 0.72 | 0.74 | 0.73 | 0.71 | 0.70 | 0.72 | 0.70 | 0.71 | 0.72 | 0.73 | 0.71 |
| Max | 0.92 | 0.92 | 0.84 | 0.91 | 0.91 | 0.79 | 0.78 | 0.84 | 0.76 | 0.78 | 0.80 | 0.91 | 0.83 |
| Min | 0.56 | 0.58 | 0.56 | 0.58 | 0.56 | 0.57 | 0.58 | 0.56 | 0.55 | 0.57 | 0.56 | 0.56 | 0.56 |
Publisher’s Note: MDPI stays neutral with regard to jurisdictional claims in published maps and institutional affiliations. |
© 2021 by the authors. Licensee MDPI, Basel, Switzerland. This article is an open access article distributed under the terms and conditions of the Creative Commons Attribution (CC BY) license (https://creativecommons.org/licenses/by/4.0/).
Share and Cite
MDPI and ACS Style
Lee, J.-Y.; Son, H.-J.; Kim, D.; Ryu, J.-H.; Kim, T.-W. Evaluating the Hydrologic Risk of n-Year Floods According to RCP Scenarios. Water 2021, 13, 1805. https://doi.org/10.3390/w13131805
AMA Style
Lee J-Y, Son H-J, Kim D, Ryu J-H, Kim T-W. Evaluating the Hydrologic Risk of n-Year Floods According to RCP Scenarios. Water. 2021; 13(13):1805. https://doi.org/10.3390/w13131805
Chicago/Turabian StyleLee, Jin-Young, Ho-Jun Son, Dongwook Kim, Jae-Hee Ryu, and Tae-Woong Kim. 2021. "Evaluating the Hydrologic Risk of n-Year Floods According to RCP Scenarios" Water 13, no. 13: 1805. https://doi.org/10.3390/w13131805
Note that from the first issue of 2016, this journal uses article numbers instead of page numbers. See further details here.