
The Role of Frost Processes in the Retreat of River Banks


Department of Geography, Pedagogical University of Cracow, ul. Podchorazych 2, 30-084 Krakow, Poland
*
Author to whom correspondence should be addressed.
Water 2021, 13(13), 1812; https://doi.org/10.3390/w13131812
Submission received: 12 May 2021
/
Revised: 26 June 2021
/
Accepted: 27 June 2021
/
Published: 30 June 2021
(This article belongs to the Section Water Erosion and Sediment Transport)
Abstract
:The rate of bank retreat was measured using erosion pins on the alluvial banks of the rivers in the Podhale region (the boundary zone between Central and Outer Carpathians) during the hydrological year 2013/2014. During the winter half-year (November–April), the bank retreat was mainly caused by processes related to the freezing and thawing of the ground (swelling, creep, downfall). During the summer half-year (May–October), fluvial processes and mass movements such as lateral erosion, washing out, and sliding predominated. The share of fluvial processes in the total annual amount of bank retreat (71 cm on average) was 4 times greater than that of the frost phenomena. Erosion on bank surfaces by frost phenomena during the cold half-year was greatest (up to 38 cm) on the upper parts of banks composed of fine-grained alluvium, while fluvial erosion during the summer half-year (exceeding 80 cm) mostly affected the lower parts of the banks, composed of gravel. The precise calculation of the relative role of frost phenomena in the annual balance of bank erosion was precluded at some stations by the loss of erosion pins in the summer flood.
1. Introduction
The retreat of river banks is the result of various inter-related natural and anthropogenic geomorphic processes [1,2,3]. Anthropogenic processes include the extraction of alluvium, the fragmentation and flow regulation of river systems, changes in river channels, the construction of dams, and the development of riverside land. Especially great is the influence of local modifications of channel geometry that may accelerate erosion in other sections of the channel banks [4,5]. Among natural processes, important are the activity of running water and rain, mass movements, and subaerial processes [1,2,6,7,8,9,10,11,12,13,14]. Most researchers treat subaerial processes as preparing river banks for actual fluvial erosion because they result in the loosening of material in the vicinity of river-bank margins [15,16,17,18,19,20]. Subaerial processes mainly include drying, wetting, freezing, and thawing, and they are controlled by the local climate [21].
The amount of river-bank erosion by exogenous processes in rivers varies locally. The banks of the Timber Creek (a river of similar length, gradient, and bank composition as those of the studied rivers in Podhale) were eroded at average rates of 2.7–15 cm in one year [7]. Lawler et al. [2], who studied erosion of the alluvial banks of the Swale and Ouse Rivers in northern England (similar in gradient, bank material, and climate to those of the rivers in Podhale) during the period from March 1996 to May 1997 found that bank surfaces had retreated by 7.7–42.4 cm. The uneven erosion of river banks cut into heterogeneous alluvial sediments was also found along rivers in the United States: from 2.4–52 cm along the Roanoke [22] to 1.1 m/year along the Green River [23]. These two rivers, though similar to those in Podhale (bank composition, uniformity, and gradient of longitudinal profiles; location in a similar climate) differ markedly in their bank-erosion rates. The extent of erosion was locally even greater along rivers with various lengths and discharges, highly variable discharges, and sinuous courses: up to 1.7 m in the western part of Tennessee [24] and, at some locations, even 2.1 m/year [25]. Lower values of bank erosion of up to 3 cm/year were found along rivers in Queensland (Australia) [26,27], locally even with the lateral accretion of alluvium; spatial differences in bank stability were related to the degree of their protection by vegetation [28]. These are similar in their gradient and bank composition to the rivers in Podhale, but differ in hydrological parameters (they have wider channels and their discharges vary with seasons). Some rivers of similar size flowing in the same climatic conditions have their banks intensely eroded. This is the case of highly meandering rivers. The banks of highly meandering rivers in the Netherlands retreat locally by even 1000 m/year [29]. The banks of these rivers are composed of poorly consolidated sediments, their channels are wider, and discharges greater, so that these rivers have much higher erosional power during floods.
The share of subaerial processes alone in river-bank erosion is evaluated in the literature within a broad range of values, though they are highly effective locally [8]. However, the intensity of these processes is locally uneven, depending on the hydrological, geological, and morphological characteristics of the study area [9,30]. Moreover, these processes are usually active simultaneously with other morphological processes. Lawler [11] accepted that subaerial processes, especially frost phenomena, are only responsible for bank retreat in small watersheds, while fluvial processes predominate in medium-sized watersheds, and mass movements in large ones. Abernethy and Rutherfurd [28] also demonstrated that subaerial processes at the banks of the Latrobe River in Australia only predominate in its upper reaches, farther downstream increases the role of fluvial erosion, and mass movements become predominant in its middle course. On river banks built of volcanic material in Japan, the share of subaerial processes is estimated to be 20–60%, similar to that of fluvial erosion [31]. Couper [16] estimated the value of bank erosion by subaerial processes at ca. 15 cm/year, indicating that this value increases in muddy sediments that are susceptible to frost phenomena.
A specially significant role in the destruction of river banks is ascribed to processes caused by multigelation (cyclic freezing and thawing) [1,32,33,34]. Teisseyre [35] considered frost erosion to be a major factor in the evolution of river banks, and Lawler [36] determined the share of needle ice in bank retreats at ca. 32–43%. Jahn [37] and Dutkiewicz [38] stressed that frost erosion affects cliffs more than abrasion does. Reid [39] calculated that frost phenomena at the alluvial banks of the Orwell Lake are responsible for 20–80% of their total erosion; for Sakakawea Lake, this proportion is 20–30% [40,41]. Field studies by Hill [42], Thorne and Lewin [43], and Reid [39] demonstrated that 20–90% of material detachment from river banks during winter and spring is due to frost phenomena.
The above values for subaerial, fluvial, and gravity processes, and for selected periods should not be directly compared with any place because they concern banks of varying lithology that is only partially similar in their hydrological regimes of the rivers and with various lengths of measurement periods. River-bank retreat is quite a complex process, and its values are dependent on many local factors.
The main aim of the paper is to determine the share of frost (including subaerial) processes in the general balance of river-bank erosion built with alluvium during one hydrological year. We compare the amounts of bank erosion during the winter half-year (November–April) with the loss of bank material caused by fluvial erosion and mass movements during the summer half-year (May–October). The role of mass-wasting processes in bank retreats was included, but is not separately considered, as their activity is usually enhanced by and contributes to the effects of both frost and fluvial action. The obtained results of measurements are discussed in reference to oscillations of air temperature near the ground in the cold season, and variations in water level in rivers in the course of the hydrological year. Erosion pins were inserted at straight and arcuate sections of channels into layers of alluvium differing in grain size (mud, sand, or gravel) at various elevations above the river level. We investigated which parts of the banks are periodically eroded faster by frost phenomena, fluvial processes, or mass movements. The similarity of geological and hydrological conditions in the study sites allowed for us to compare the intensity of erosion along their vertical extents on the banks, and to more confidently interpret differences between layers of alluvium of various grain sizes. By inserting the erosion pins at various heights within the banks, we examined which fragments of the banks were most effectively eroded by frost phenomena, fluvial processes, and mass movements.
We did not undertake a study on the impact of rivers meandering on the rate of the bank retreat because we had no reference data over the whole length of the river bends. We selected study sites considering their position in both straight and curved sections of river channels, and attempted to select sites with various lithological sequences in the banks.
2. Study Sites
The study was conducted during one hydrological year from 1 November 2013 to 31 October 2014 on river banks at Podhale, the northern foothills area of the Tatra Mountains (Podhale Depression, West Carpathians) (Figure 1). The Wielki Rogoźnik River and its tributaries in the low-relief part of Podhale were selected (Orawa Depression). The study area is elevated at 600–650 m above sea level. The vertical gradient of the Wielki Rogoźnik River channel over the studied section is low, at 0.5–0.8 ‰. The channel is sinuous with numerous erosional escarpments in banks. The river banks expose cross-sections of two alluvial terraces, locally with rock basement, elevated at 1.5–2 and 2.5–4 m above water level. The river channel is 7–10 m wide on average, and the mean discharge is ca. 1.9 m3/s.
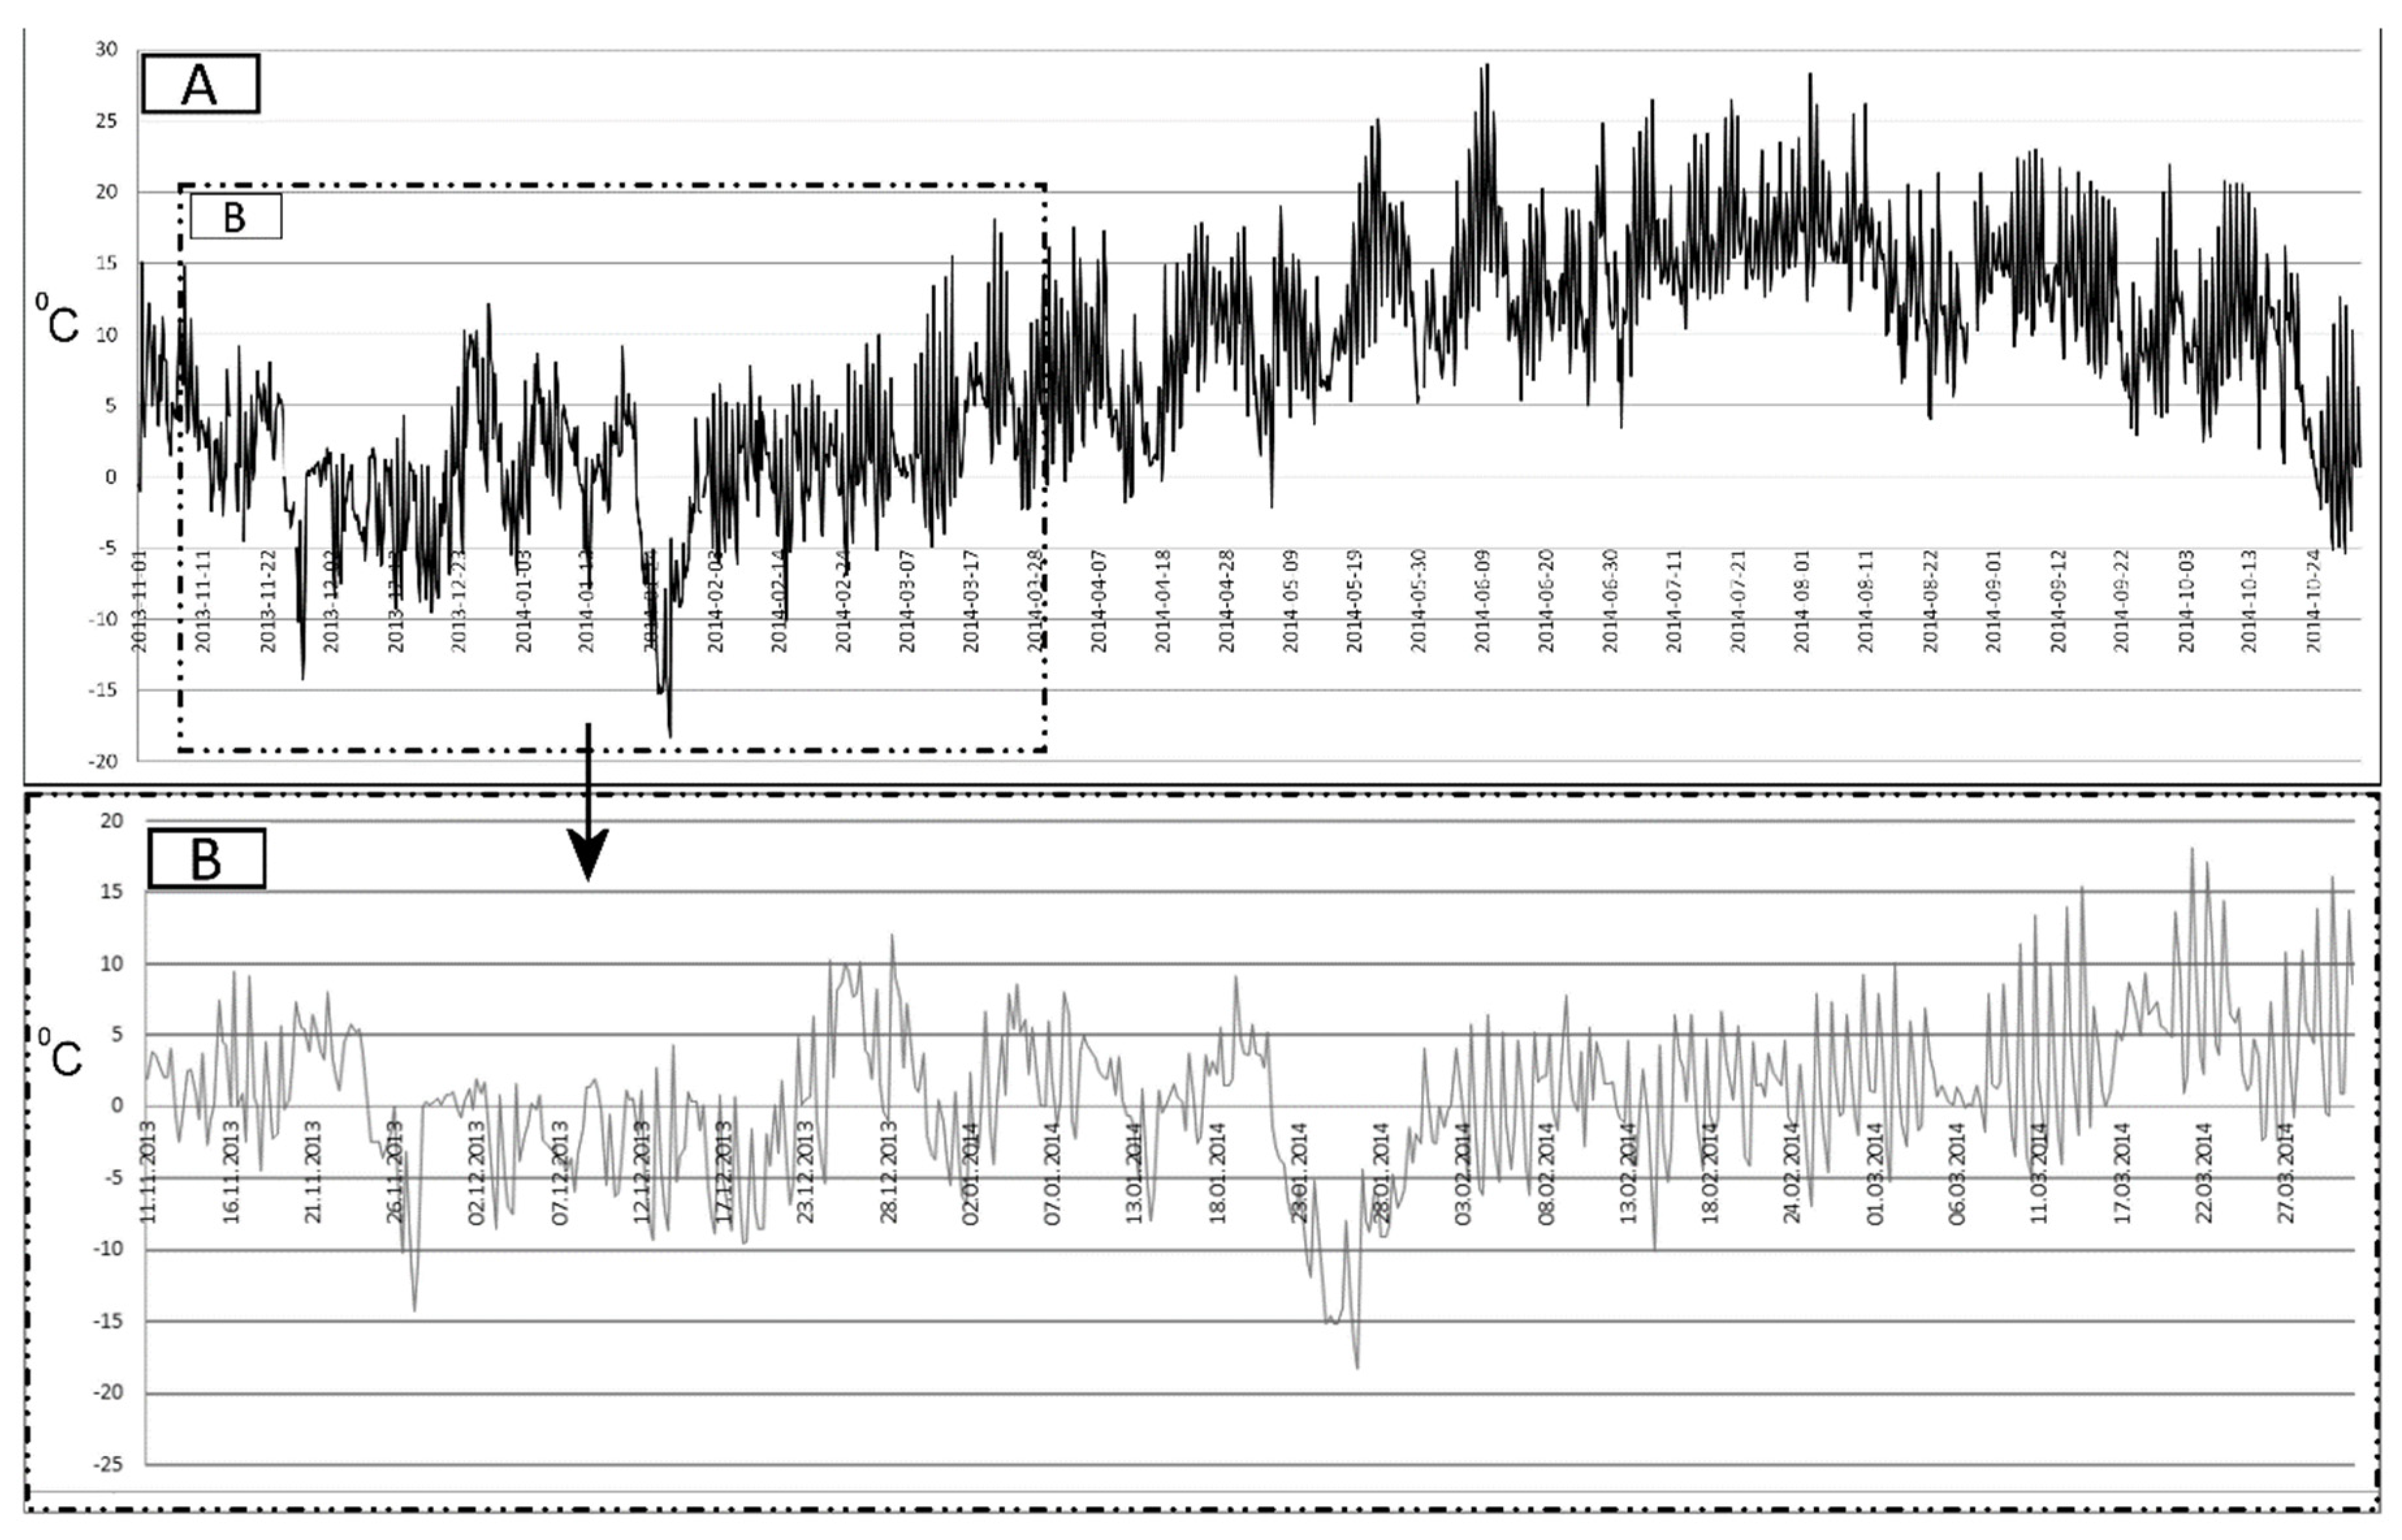
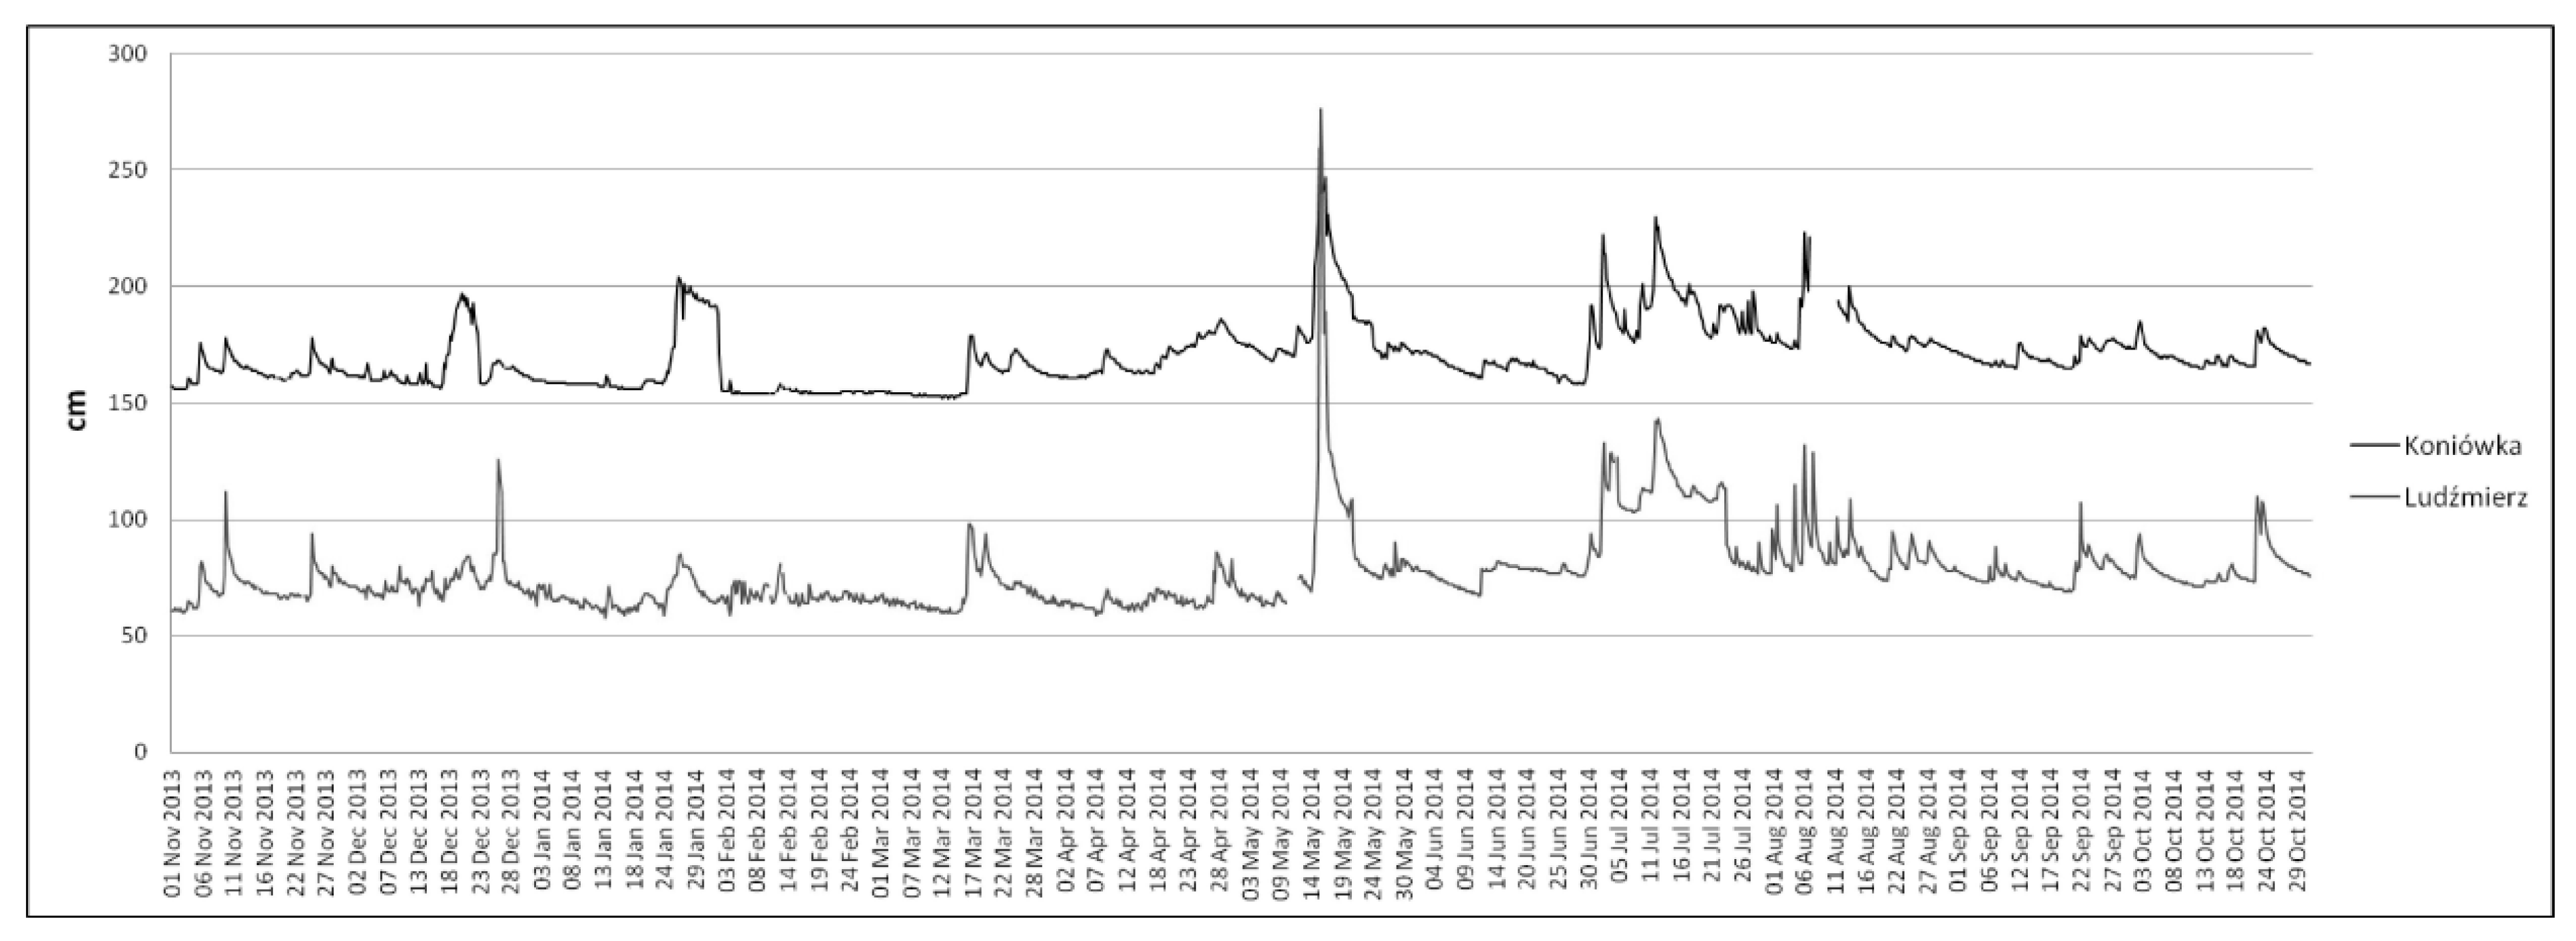
Winter air temperatures in this area often fall below −0 °C, and minimal temperatures are below −35 °C. [44]. During the winter half year (November–April) of 2013/2014, temperatures below 0 °C were noted on 152 days; on 89 days, these low temperatures persisted for the whole day. The average temperature for December 2013 was −9.3 °C (Figure 2). Frequent oscillations of temperature around 0 °C resulted in cyclical freezing and thawing of the ground. During prolonged periods of strong freeze, the ground may become frozen to the depth of 0.8–1.2 m [45]. There are usually 100–110 days each year with snow cover, and 70–100 days with ice on the rivers, but snow cover and river ice temporarily disappear during winter. The summer half-year (May–October) sees more than half of the annual precipitation of 600–1200 mm, and it is then that the river floods. The largest flood on the Wielki Rogoźnik River during the study period was in May 2014, when the water level in the river was raised by 1.1–2.0 m (Figure 3), and the river markedly remodeled its banks [46]. Other rises in water level in July, September, and October 2014 were small (0.4–0.5 m) and did not cause erosion on the river banks.
3. Methods
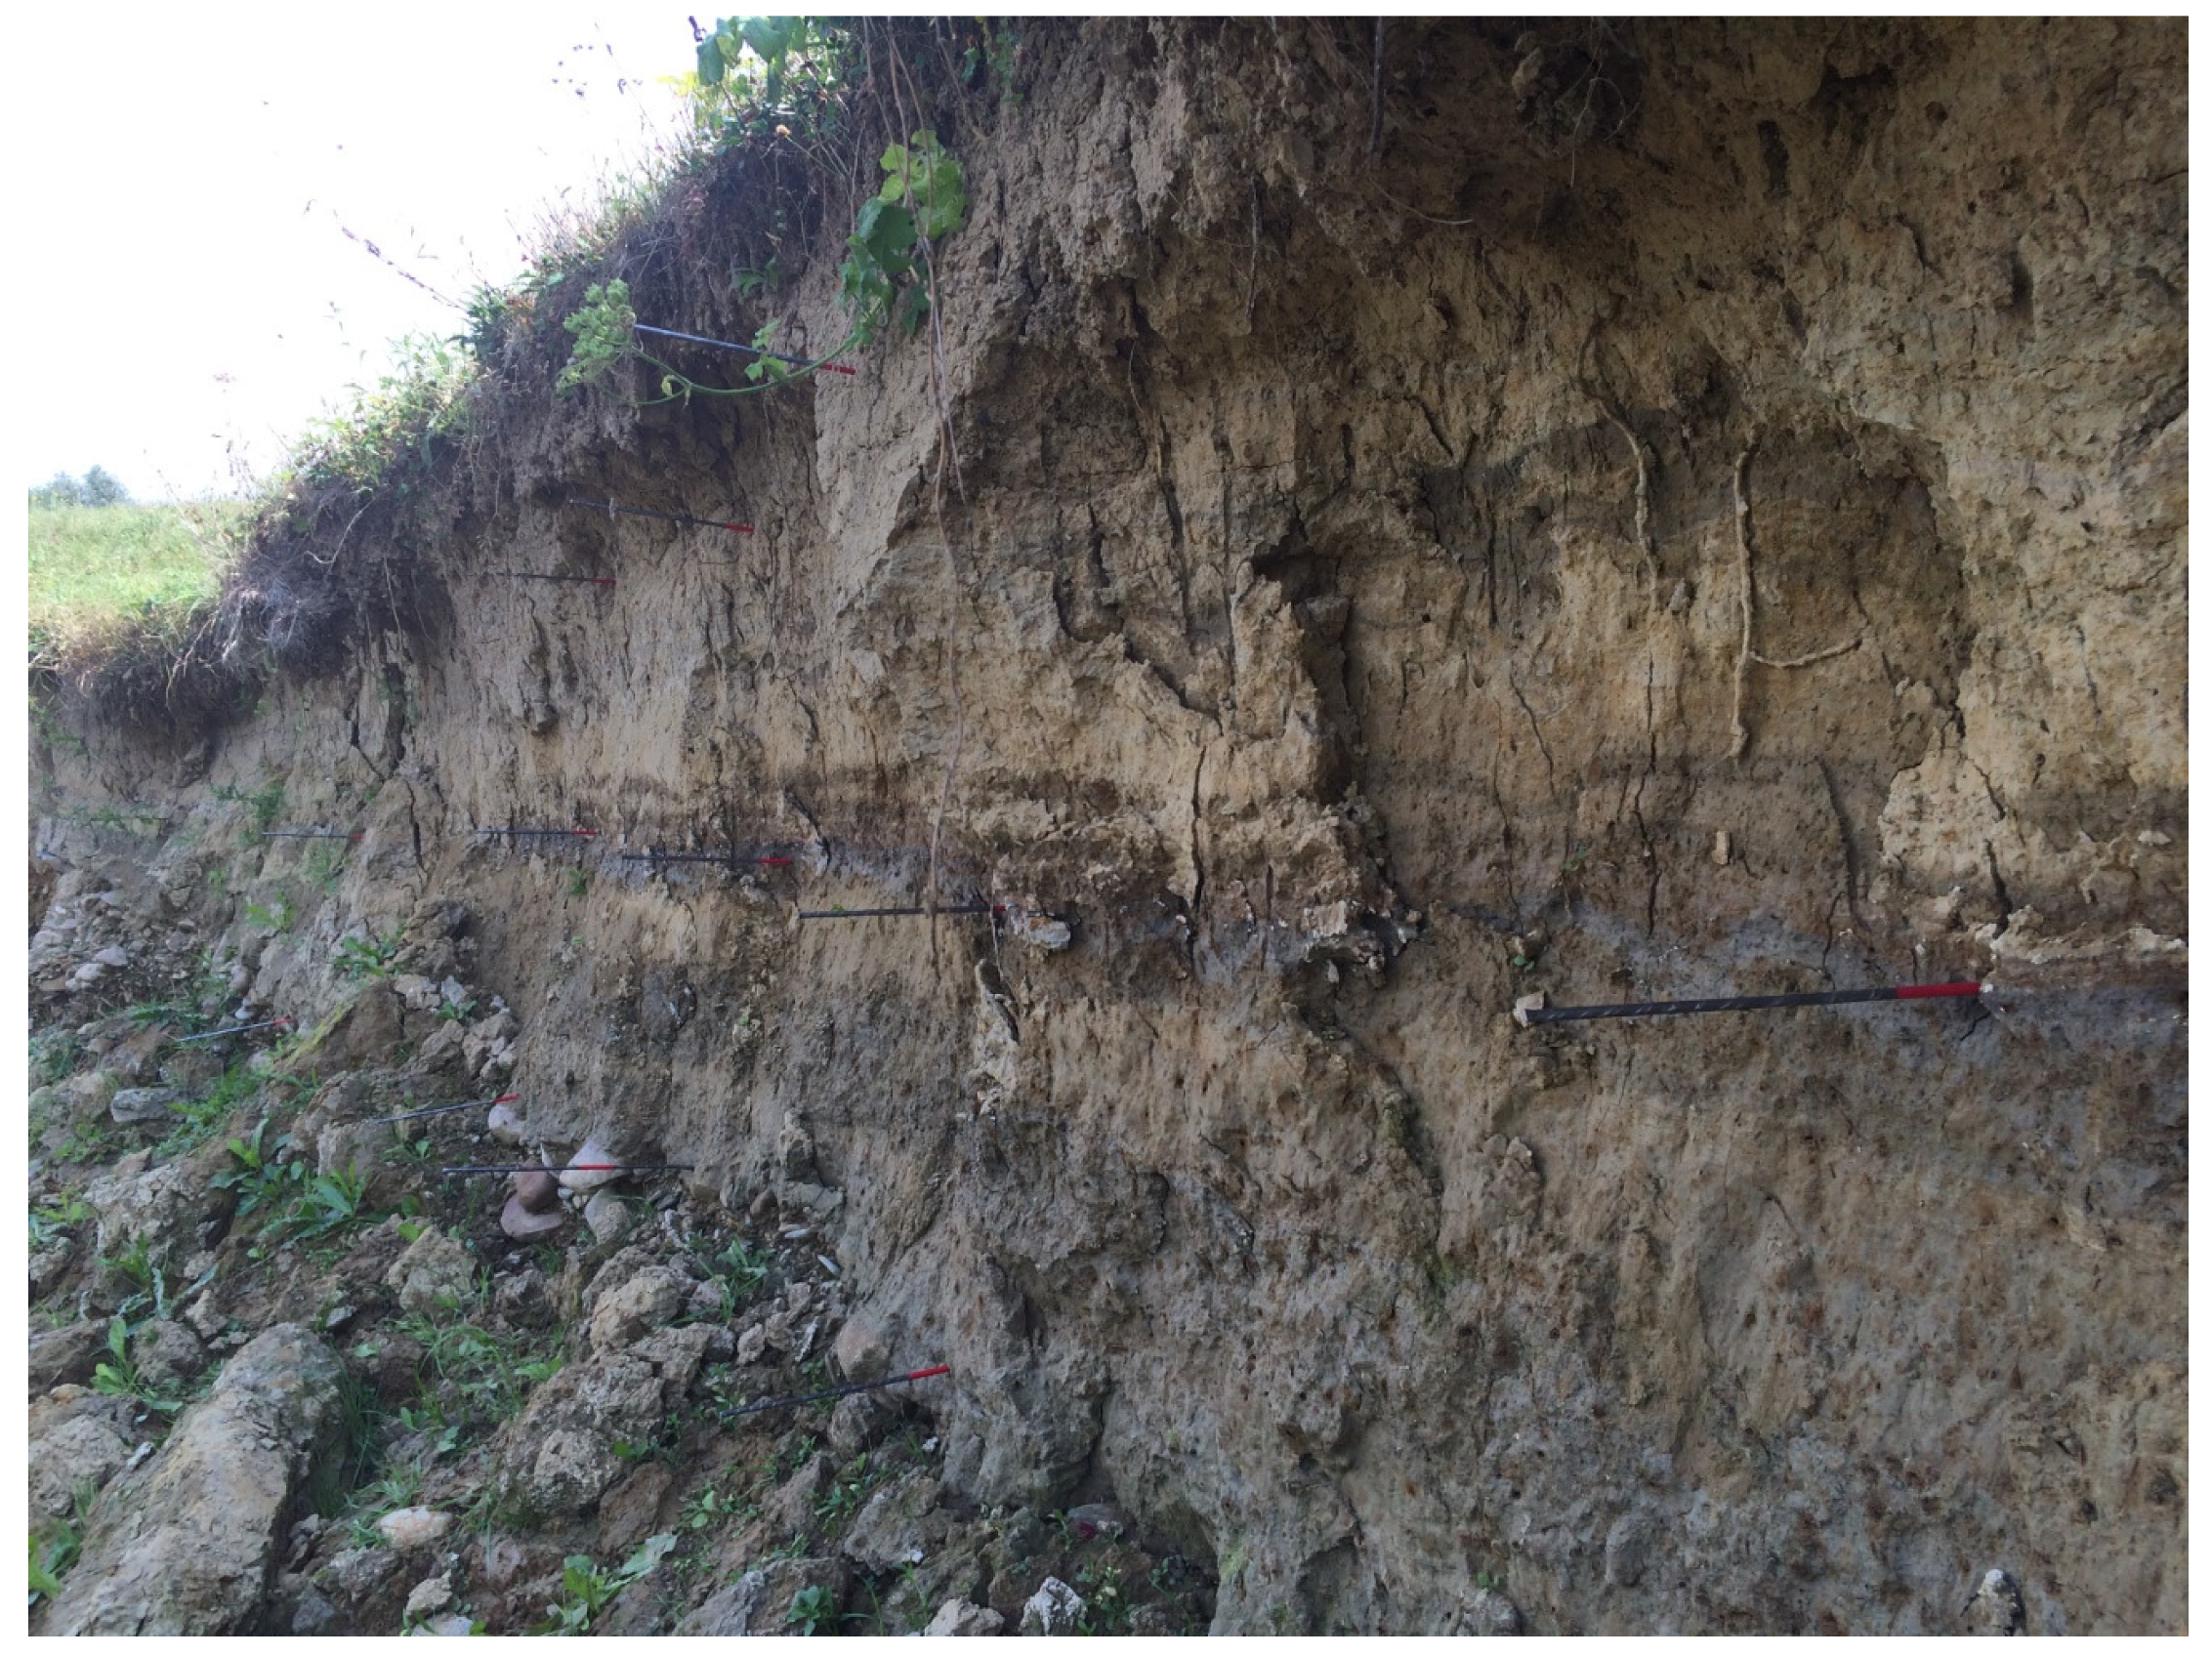
Bank erosion on the Wielki Rogoźnik River was studied using the simple version of erosion pins despite its known limitations. The obtained results using this method were integrated over the whole separate periods of multigelation. but do not provide information on the rate of processes within these periods. Occasionally, loss by erosion is compensated to some degree by the accumulation of scree in the measured section. This method lacks temporal resolution within the individual periods of multigelation, and thus gives integrated results over the whole period of observation from single events of erosion and accumulation. It also occasionally compensates real erosion by scree covers on the bank surfaces. In an attempt to obtain accurate data on erosion of the banks of the Wielki Rogoźnik River, we adapted this method to the local geological (type of sediments and the degree of their consolidation) and climatic (depth of ground freezing) conditions, and we followed the suggestions of authors who had used this method [1,3,36,47]. Erosion pins were inserted in several rows and in greater distances, so that longer sections of the banks were studied, up to 10–22 m. We avoided placing the erosion pins at the very bases of the banks, so that fluvial erosion did not affect the measurements of the effects of frost phenomena. The pins were inserted deeply enough to resist for a long time, and they were pushed deeper after the readings that were performed after every multigelation phase.
We used metal erosion pins that were ca. 1 m long and 6 mm in diameter. We hammered them to the depth of 80 cm, so that only their terminations, ca. 20 cm long, were left exposed (Figure 4). During prolonged episodes of strong frost at Podhale, the ground may freeze down to the depth of 0.8–1 m [46]. After each measurement, the pins were pushed into the ground to their initial position, so as not to lose their stability in the ground, and new measurements were taken from the fixed position marked on the pin. During the study period, we monitored water levels in the Wielki Rogoźnik and Czarny Dunajec Rivers at two gauge stations: Ludźmierz and Koniówka (Figure 1), and air temperatures at the nearby station at Ratułów (Figure 1). Measurements on the erosion pins were performed during the multigelation periods, 1–2 days after their termination, and after each rise in water level (Figure 2 and Table 1).
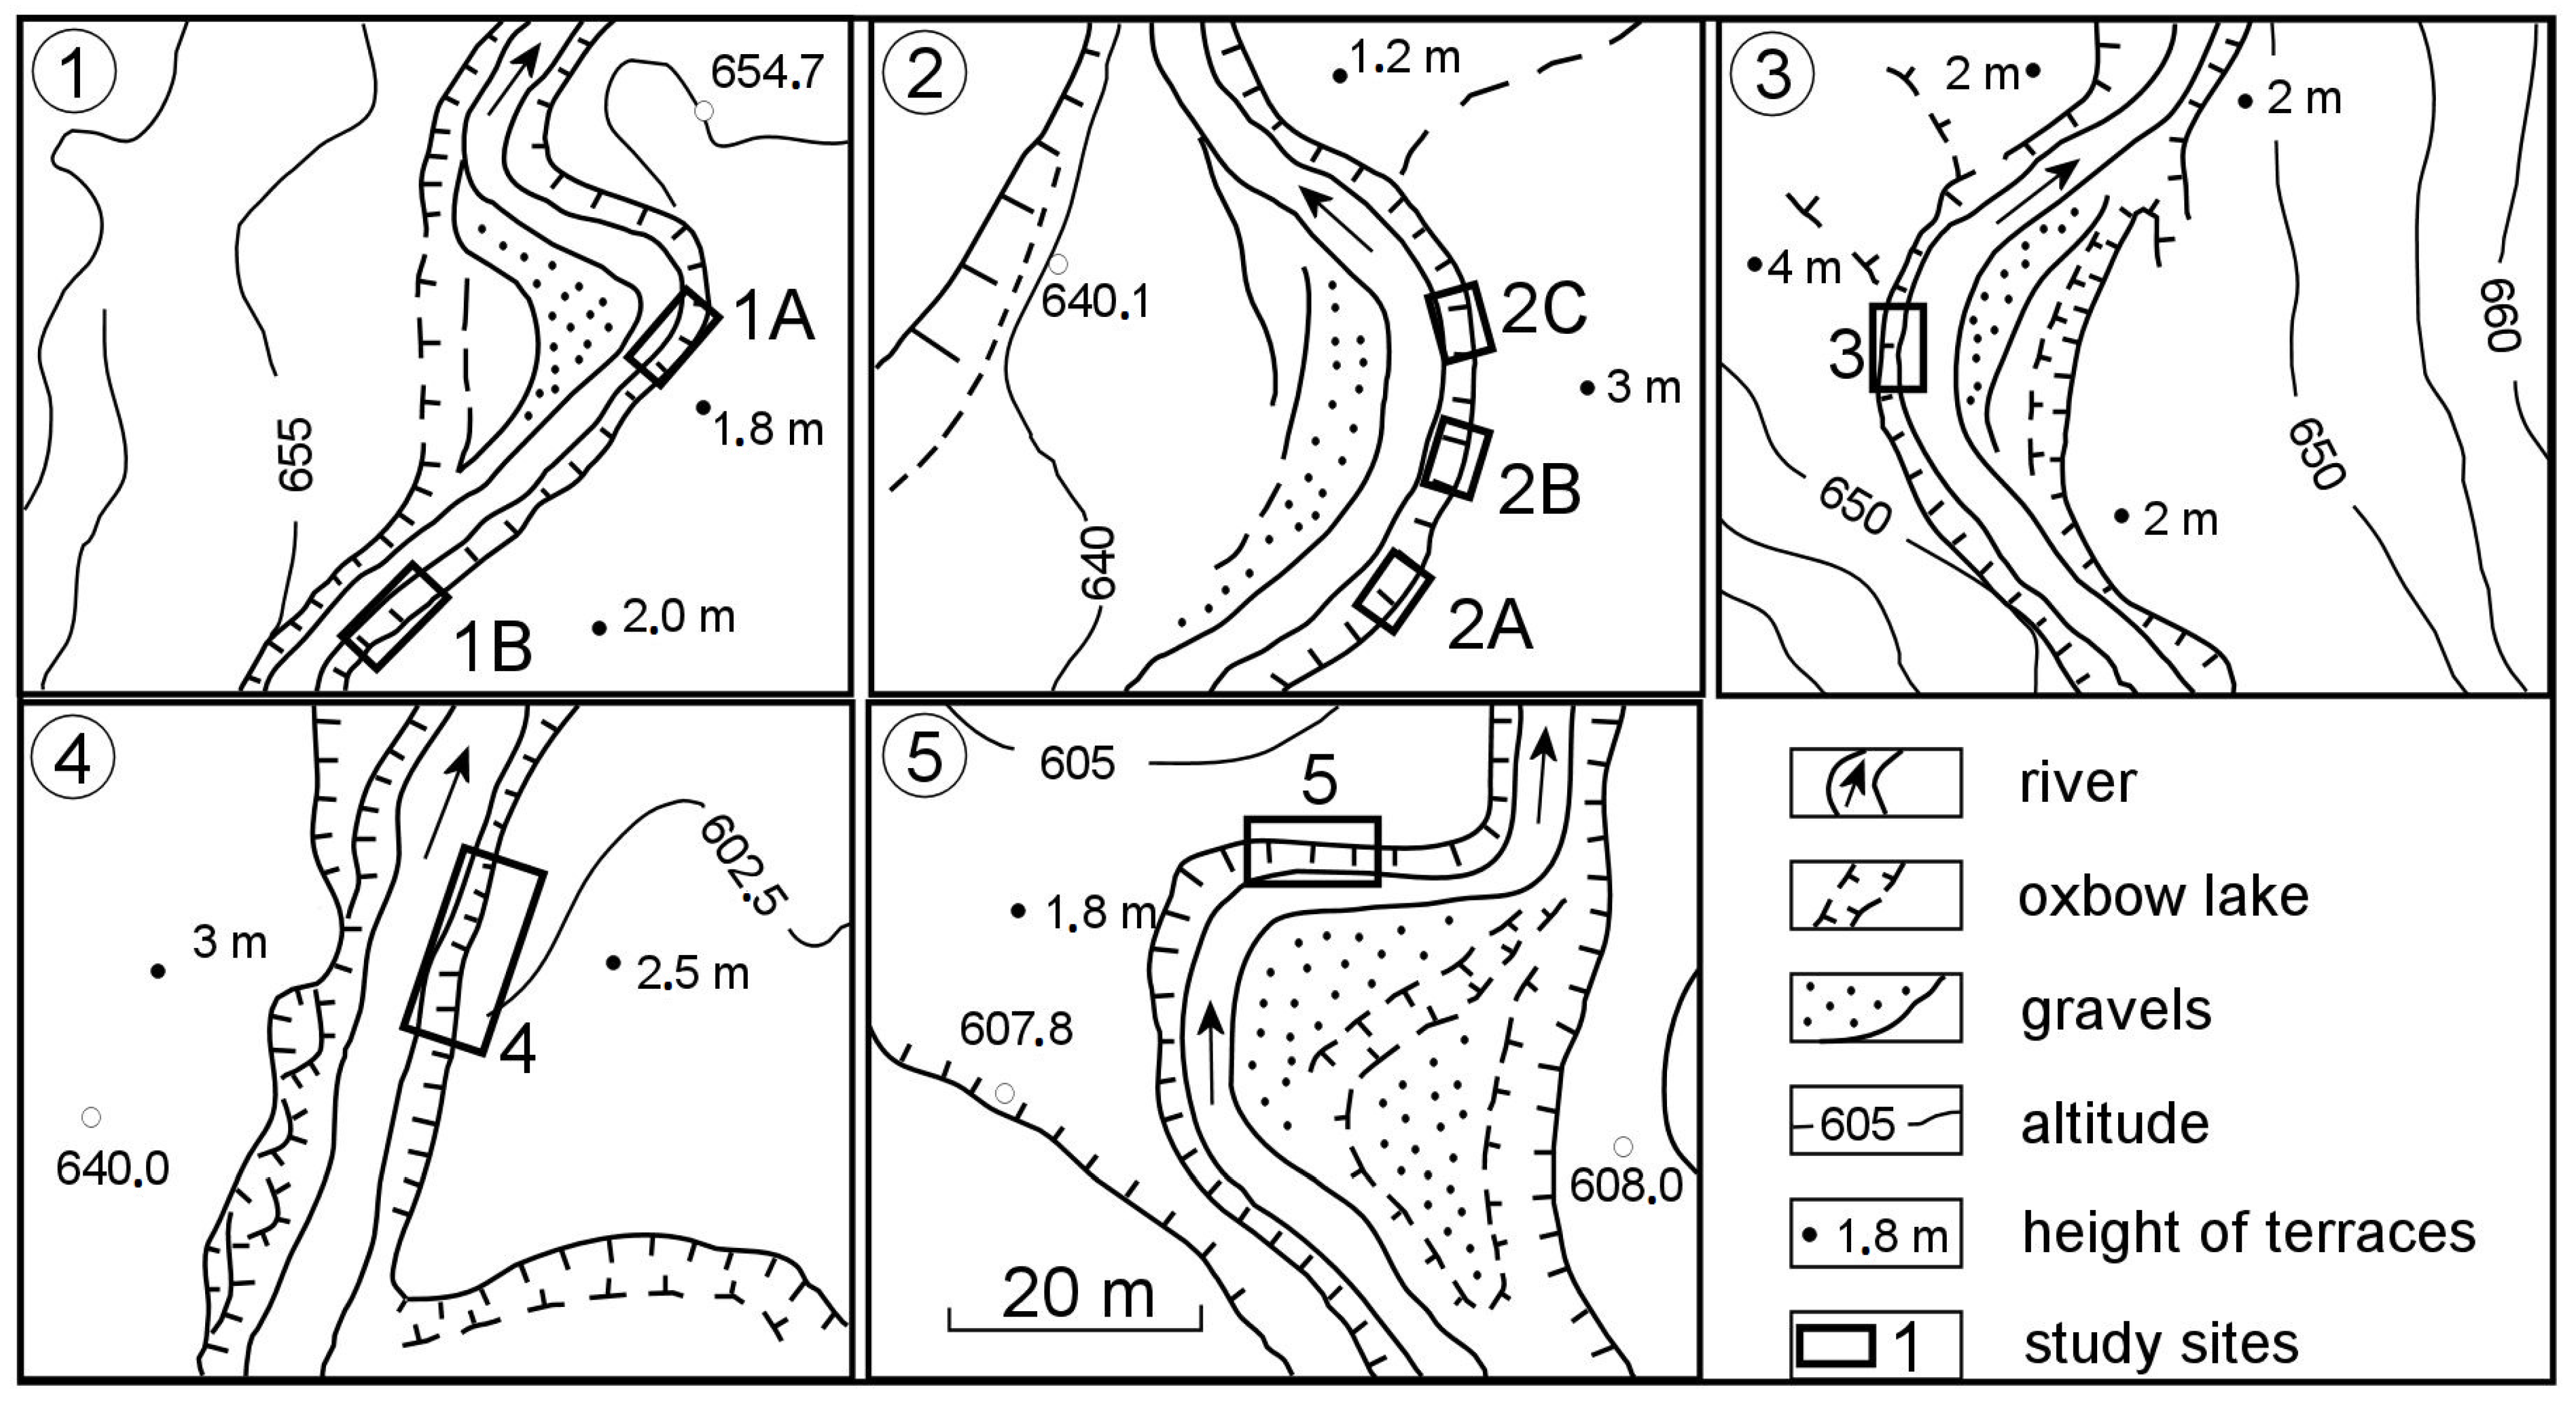
Five study sites (1–5) were set along the Wielki Rogoźnik River and its tributaries (Figure 1 and Figure 5). A total of 376 erosion pins in several horizontal rows were inserted (78, 113, 30, 87, 68 at study Sites 1–5, respectively). Four sites were situated on the banks being undercut by erosion and representing various structures with respect to grain size, and one site protected by a high bank against flowing river water. At each site, the granulometric characteristics of sediments were investigated at the level of the row of erosion pins. The study sites were chosen in places that were not protected by vegetation, where the channel bottom was composed of gravel and no artificial constructions such as dam or steps could modify the discharge. Grain size was measured by sieving.
Erosion pins are commonly used globally in studies on river-bank erosion. Wolman was the first to conduct such studies in Montgomery county in the eastern United States [20]. In Australia, they were used in measurements of the rates of bank retreat on rivers Ngaradj [48] and Daintree [26], and on Gowrie Creek [49]. In Italy, they were used in studies on bank erosion on the Cecina River [50]; in Denmark, on the Odense shores [51]; in England, on the banks of the Swale, Ouse, and Ure [2], rivers in Devon [9]; and in the United States, on the shores of Lake Michigan [33,34]. Erosion pins were also used in studies on the rates of erosion and denudation on slopes. Sirvent et al. [52] used them in NE Spain, Shi et al. [53] in the Hubei Province and near Chongqing in China, and Arens et al. [54] in Kennemerland in the Netherlands.
Bank erosion is now also studied using an improved version of erosion pins based on automatic photoelectronic monitoring (photoelectronic erosion pin, PEEP) [1,10,55,56,57] or even more advanced equipment such as terrestrial laser scanners [58].
3.1. Site 1
Two study plots were set at Site 1, A and B (Figure 5). Plot A was situated at a sharp bend of the Ciche stream on a bank 1.8 m high (Figure 5 1 (1A)). The undercut bank is built in its lower part of firmly cemented sandy gravel (gravel with sand matrix) layer, 60 cm thick, and overlain by unconsolidated clayey sediments (Figure 6 1A). We installed 42 erosion pins in three horizontal rows in the gravel and clay. The lowest row was set in the gravelly–sandy layer, 55 cm above low water level. The second row was placed in clay 50 cm above the lowest, and the third at 40 cm above the second. Each row consisted of 14 pins set over a section of the bank 11.5 m long (Table 2).
Plot B was set 40 m upstream from Plot A (Figure 5 1 (1B). The layer of firmly cemented gravel rises up to 1 m above water level there. Two rows of erosion pins were set in this layer. Another row of pins was inserted into a clay layer 1 m thick that overlay the gravel (Figure 6 1B). The bank there is less curved and higher, up to 2 m. A total of 36 erosion pins were placed in 3 rows and 12 columns over the 10 m length of the bank.
3.2. Site 2
This site lies on the right bank of the Wielki Rogoźnik River, on the face of a 3 m high fluvial terrace (Figure 7). The vertical section of the terrace consists of two layers of medium and coarse gravel separated by a thin (0.3 m) intercalation of gravelly sand with ferricrete and with cut-and-fill structures up to 1 m thick filled with laminated mud-containing wood debris. The matrix in the gravel consists of sand and clay. Both gravel layers are firmly cemented. The gravel is overlain by an up to 1 m thick layer of weakly cemented clayey–sandy sediment (Figure 6 2A). Three study plots were set on this site (Table 2), separated laterally by distances of 10 m. The first plot (A) was 5.2 m long. It comprised 36 erosion pins spread laterally at average distances of 65 cm in 4 rows and 9 columns (Figure 5 2 (2A). The plot was separated from the water flow by a low gravel bar 8 m wide.
Plot B was permanently washed by flowing water, regardless of water level. Any scree supplied from the scarp was removed immediately by flowing water (Figure 5 2 (2B) and Figure 6 2B). The 56 erosion pins at this plot were placed in 4 rows at distances of 65 cm, thus resulting in 14 columns, similarly to Plot A.
3.3. Site 3
Site 3 was placed on the left bank of the Raczy stream, a right-side tributary of the Wielki Rogoźnik River. The structure of the bank is the same over the whole length of the exposure. A 0.5 m high basement of Neogene clay is exposed at the base. It is overlain with a 1.5–2 m thick layer of firmly consolidated coarse and very coarse sandy gravels (Figure 6 3). A layer of sandy clay, 0.5 to 1 m thick, lies at the top. The profile of the bank is concave; its clayey base is less eroded and forms a distinct flat (Figure 5 3 (3)). Loose material fallen from the higher part of the bank face accumulates there in periods between successive rises in water level. It lies there until heavy rains wash it down to the river channel and the river takes it away. We placed 30 erosion pins in 3 rows (one in each layer) and 10 columns.
3.4. Site 4
Site 4 was set on the right bank of the Wielki Rogoźnik River. The bank is vertical, 2.5 m high, washed at its feet by the river. It is built of a layer of sandy–clayey alluvium 1.8 m thick at the base, overlain with alluvial muddy–sandy clay 0.7 m thick (Figure 6 4). The sediments in the lower part are weakly cemented. The consolidation of sediments in the upper part varies depending on temperature and humidity. It is higher when the sediment is frozen or dried in summer, and markedly lower after wetting by rain or thaw. We placed 87 erosion pins over a distance of 22 m at this plot in 4 rows and 22 columns, every 1 m horizontally and 0.5 m vertically (Figure 5 4 (4)). The lowest row lay 0.5 m above the river level at the average water stage.
3.5. Site 5
Site 5 was set on the left bank of the Mały Rogoźnik River. The bank there is 2.2 m high and it is undercut by the river. Three layers are present in its structure (Figure 5 5 (5)). The lower layer, 0.7 m thick, consists of weakly cemented medium gravel with a sand matrix. It is overlain with a 1.1 m thick layer of structureless, densely fractured sandy–clayey sediments (Figure 6 5). A layer of friable clay, 0.4 m thick, lies at the top. Over an 18.5 m long section of the vertical bank, 68 erosion pins were hammered in 3 rows, each in one layer of the alluvium. The lower row was placed ca. 0.5 m above the low water level. The pins in each row were set in distances of 0.75 m, thus forming 23 columns, except for column 14, which had only 2 pins.
4. Results
The grain size of bank sediments in four of the study sites (1, 2, 4, 5) varied from silty sand in the upper parts of the banks (upper rows of pins) to sandy gravels in the middle and lower parts (Figure 5). Changes in the grain size of sediments in vertical sections of the banks were not strictly correlated with the erosion rates at all sites. The bank section composed of fine-grained sediments below the turf (soil with grass-root systems) and hosting the upper rows of pins retreated at Sites 1 and 3 by more than 30 cm, but at Sites 3 and 5, by less than 10 cm. The value of the bank retreat was lower (3–30 cm) in the underlying sandy gravels, and it only reached maximal values above 60 cm at Site 2. This was different at Site 3, where the erosion rate of firmly consolidated clay at the bank base was lower than that of loose fine sediments at the top part of the bank (Figure 8 and Table 3).
The rate of exposure of the erosion pins by the bank retreat due to frost processes was consistent. At Plot A in Site 1 (Figure 1), the bank retreated by 34 cm during the periods of multigelation (a mean value for all erosion pins at the plot). The mean values in individual rows equaled 39, 38, and 26 cm in the highest, middle, and lowest row, respectively (Table 3). The values of the bank retreat were much higher during the spring flood, the highest recorded during the year (Figure 3). During the flood, in the middle of May 2014, the water level at Site 1 rose by 1.1 m; lateral erosion caused the retreat of the bank by at least 80 cm, so that Plot A was totally destroyed (Figure 8A). Bank retreat due to frost action at Plot B in Site 1 was 13.7 cm on average, and this was similar on all pins in all rows (Figure 8B). Bank retreat caused by stream erosion during the May 2014 flood was 45 cm on average (32 cm in highest row, 50 cm in the middle, and 53 cm in the lowest). A lower rise in water level in July and September 2014 resulted in only minor losses of the banks (0.7–3.1 cm; Table 3).
Two of the three study plots (A and B) at Site 2 were destroyed during the May 2014 flood, and the bank then retreated by at least 80 cm (Figure 8C,D). Only Plot C remained where the extent of erosion was somewhat smaller (55–70 cm), and the water-level rise in the summer and fall caused a retreat of another 2–3 cm (Figure 8E). The total fluvial erosion at this plot amounted to nearly 64 cm (mean for all rows). During this rise, the bank surface was more eroded at the level of the lower row of pins (up to 73 cm) by both flowing water and the gravity collapse of the gravel. The record of the results of frost phenomena is completely preserved at this site. While erosion during the multigelation phases at Plots A and C was minimal (10.5 and 9.5, respectively), at Plot B, the role of frost phenomena was important: the mean value of erosion recorded after the winter half-year and the corresponding of temperature oscillations around 0 °C was as much as 40.4 cm, and this differed between individual gravel layers. The greatest loss of bank margin was recorded in the lowest row of pins, 62 cm on average. At the next higher row, the bank retreated by 40.4 cm, and in the two highest rows, by ca. 29 cm (Table 3).
The erosion pins at Site 3 persisted spring and summer water-level rises of the Molczy stream. The water level there was not as high as that on the Wielki Rogoźnik River, and the complete record of bank retreat is preserved. The annual balance of the bank retreat shows that frost phenomena played a larger role there than at the other study sites because the mean value of the total erosion was only 8.2 cm (Figure 8F). This apparently low value is due to the uneven vertical profile of the bank. In winter, scree falling down from the strongly recessing upper part of the bank (31.3 cm in the upper row of erosion pins) was laid down on the gently sloping lower part of the bank built of clay. The erosion pins in the second row were partly buried with the scree (negative values of bank retreat in Table 2 and Table 3). The clayey part of the bank itself was reduced by frost phenomena during the winter half-year by 6.9 cm (mean for pins in the lowest row). The higher water stages during the summer half-year fostered the removal of the scree that had accumulated in winter, so that lateral erosion by flowing water also reached the second row of erosion pins. The effects of this type of erosion equaled bank loss by frost phenomena (8 cm each).
The bank at Site 4 was markedly altered during the May 2014 flood, and the plot with its erosion pins was completely destroyed, similar to Site 2. The erosion pins at this site recorded only the values of bank retreat caused by frost phenomena. The overall amount of erosion in the winter half-year appeared to be small when compared with that in the other sites. The bank retreated by 3.8 cm at the highest row of pins, and by 7.8 cm at the second highest row (Figure 8G). Swelling of the ground and scree deposition were mostly noted at the height of the two lowest rows, resulting in pins sinking or being partially buried (Table 3). The accumulated scree on river ice was moved by flowing water away from the bank during the periods that were free of ice.
The course of erosion during the full hydrological year was recorded at Site 5. The flood in May 2014 bypassed the studied section of the bank because the main stream incised a furrow in another part of the river channel, leaving the bank with the study site within a cut off loop of the channel. All rows of pins remained above the water level in the oxbow lake that was thus formed. The bank at this site retreated because of frost phenomena by 7.7 cm on average (Figure 8H). Greater losses occurred within the upper and middle rows of the erosion pins (8.6–11.9 cm), and the lowest in the lower row (2.9 cm). The bank surface retreated more, by ca. 16.5 cm on average, during the spring–fall period from thaw time until the May flood due to the action of flowing water and, later, gravity downfall. Large losses of sediments on the bank surface were registered in its highest part. Long overhanging turf slabs along the upper margin of the bank, created by erosion during the multigelation periods, fell or slid down after rains to the inactive channel of the Mały Rogoźnik River.
5. Discussion
All results of measurements taken together (Table 4) demonstrate how large and uneven the extent of destruction by frost phenomena is (including subaerial processes and mass movements initiated by frost) on the bank surfaces.
The share of frost phenomena in the annual balance of erosion at Sites 1–5 oscillated within a broad range from 6.8% to 71.0% (Table 4). At five plots, the maximal bank retreat was measured in the highest rows of erosion pins; at three plots, in the second highest rows. Bank retreat was smaller at the lower rows of erosion pins.
Summing up the mean shares of the frost and fluvial processes (including subaerial ones and mass movements) at individual sites shows that fluvial erosion had four times greater (79.7%) the share in bank erosion of the Wielki Rogoźnik River and its tributaries during hydrological year 2013/14. This was certainly related to the May flood, when the water level almost reached the upper edge of the banks. The intense erosion and mass movements exposed the erosion pins more than they did in winter; at three sites, erosion reached deeper than 80 cm and destroyed four study plots with all pins. It is possible that the share of fluvial processes at the destroyed plots could still be greater (thus reducing the share of the frost phenomena). At places that resisted erosion during that episode, the share of frost phenomena (including subaerial processes and mass movements) was the greatest: 50% at Site 3, with an argillaceous base resistant to erosion, and 31.8% at Site 5, with a lateral shift of the river’s main stream. The share of frost phenomena in the annual balance of bank erosion at the studied sites was probably similar for several preceding winter seasons. Water level higher than that in 2014 had not occurred in the Wielki Rogoźnik River since 2008. During the last 20 years, floods as large as that occurred rarely and irregularly (each 5–6 years on average, mainly in June and July).
Frost processes (including subaerial processes and mass movements) unevenly eroded the bank surfaces. The progress of erosion was greater in the upper rows of erosion pins, placed in less consolidated and finer-grained sediments than in the lower rows, where it was placed in coarser and more consolidated sediments (Figure 6). It may be inferred that finer and less consolidated sediments are more readily eroded during multigelation periods. This may be due to the higher content of mud and clay, and higher wetness levels. According to Teisseyre [35] and Cooper [16], such sediments become brittle and susceptible to frost exfoliation when frozen, and they are then easily broken away from the bank, even by wind and snow. Jahn [59] notes that frozen alluvial mud, clayey sand, and sand are mainly eroded by niveo-eolian processes.
It is also important that a layer of such sediments lies near the upper edges of the banks, where freezing is stronger and deeper (freezing front advances from two directions, downwards and sideways, and the snow cover is thinner on the steep slope) [60]. Clay and mud erosion is stronger when it takes place if they were wetted before freezing [61,62,63]. The destruction of the structure of wet clay during its freezing is especially affected by ground ice, which splits sediments with needles and lenses into polygonal clumps, and thus favors frost exfoliation at the bank face [35]. Sand is also susceptible to frost action. It contains more free water and freezes faster than clay does [64], while needle ice and lenticular ice destroy its primary weak cohesion. Less destructive was freezing in layers of sandy gravel. Single clasts pushed away appeared at the bank surface, and shallow and short fractures were visible within the gravel layers.
The most dynamic and effective phase of bank erosion took place during the thawing of their surfaces. Similar intensified subaerial erosion was observed on river banks in the Sudetes [35] and Lower Silesia [65]. During rapid thawing, the layer of alluvial clay along the frost fractures broke away into blocks which fell down by gravity. Sandy gravel crept down the bank slope over the deeper and still-frozen layer. Pebbles loosened upon wetting and individually rolled down the slope or crept down as a whole layer. Stripes or cones of scree accumulated at the bank feet. The banks retreated in that way by a few to more than 10 cm after each thawing episode.
The bank surface retreats slower in its lower parts, and erosion is periodically compensated there by the accumulation of scree falling from the upper parts of the banks. This is especially visible when the rivers are frozen (Site 3) or in places protected against the main stream by an alluvial bar (Site 4).
The effects of fluvial erosion are marked on the bank slopes in another way (Figure 8). The greatest loss of bank sediment occurred in the lower rows of erosion pins. Bank retreat in the summer half-year is faster at the bank bases. The undercutting of the banks by flowing water usually triggers mass movements on the banks, but fallen sediment is systematically removed downstream. This type of erosion is only active during elevated-water stages (up to several times during a summer half-year), though the effects may be several times greater than those of the frost phenomena [35]. During high-water stages, the river flow removes the bulk of scree accumulated during the winter, patches of turf detached from the edge of the bank in summer and fresh lumps of alluvium fallen from the whole bank surface as a result of undercutting. It was only at Site 3, where alluvial gravel and clay lie on a basement of firm clay, that alluvium falling down during high water stages slid over the firm clay directly into the stream flow. This clay base is more resistant to erosion than the alluvial cover is.
The share of frost phenomena in the erosion of the banks of the Wielki Rogoźnik River was much lower than that on the rivers mentioned in the introduction, even those with similar geological structure, gradient, and discharge. The role of the studied frost phenomena was closest to the values noted by Reid et al. [41] and Reid [40] for the shores of Sakakawea Lake. The 10–30% contribution of these processes to the annual progress of erosion on the banks of the Wielki Rogoźnik River proves their important role in the transformation of the studied sections of the river banks. If not for the significant bank retreat caused by the flood of May 2014, the share of the frost phenomena would be greater.
The erosion-pin method used to study bank retreat proved to be more useful in the study of frost phenomena than in the study of fluvial erosion. Frost phenomena affect the river banks in Podhale much less than fluvial erosion does. Moreover, during the winter months, gravity mass movements on the river banks are less violent and involve smaller volumes of sediments; hence, erosion pins were not completely removed.
6. Conclusions
The share of frost phenomena (including subaerial processes and mass movements) in the annual balance of erosion on the studied river banks was uneven both at individual sites and along the vertical sections of the banks. The intensity of the destructive action of frost largely depended on the grain size of the bank sediments. The summary effects of these processes were stronger in fine-grained sediments in the upper parts of the banks. The lower parts, built of gravel, were more intensely destroyed by fluvial processes in the summer half-year. Two phases of varying intensity were marked in the course of erosion caused by frost phenomena. The first involved the freezing of the banks, with the growth of ice in the ground, the destruction of the sediment structure, and the formation of freezing cracks. This phase may be considered to be preparatory for the dynamic erosion occurring during thawing in the second phase. Various types of mass movements simultaneously occurred during the second phase: the solifluction of sand and gravel, the downfall of clumps of fine-grained sediments, and the rolling down of separate rock clasts.
The determination of the effectiveness of frost phenomena in river-bank erosion requires further study, especially during years when no high water stages occur throughout the year. The deeper anchoring of erosion pins is also necessary to eliminate or reduce their loss during summer floods.
Author Contributions
Conceptualization, K.A. and J.K.; methodology, K.A. and J.K.; software, K.A. and J.K.; validation, K.A. and J.K.; formal analysis, K.A. and J.K.; investigation, K.A. and J.K.; resources, K.A. and J.K.; data curation, K.A. and J.K.; writing—original draft preparation, K.A. and J.K.; writing—review and editing, K.A. and J.K.; visualization, K.A. and J.K.; supervision, K.A. and J.K.; project administration, K.A. and J.K.; funding acquisition, K.A. and J.K. All authors have read and agreed to the published version of the manuscript.
Funding
The study was financed as a Statutory Study of Cracow Pedagogical University.
Institutional Review Board Statement
Not applicable.
Informed Consent Statement
Not applicable.
Data Availability Statement
The data presented in this study are available on request from the corresponding author.
Conflicts of Interest
The authors declare no conflict of interest.
References
- Lawler, D.M.; Thorne, C.R.; Hooke, J.M. Bank erosion and instability. In Applied Fluvial Geomorphology for River Engineering and Management; Thorne, C.R., Hey, R.D., Newson, M.D., Eds.; Wiley: Chichester, UK, 1997; pp. 137–172. [Google Scholar]
- Lawler, D.M.; Grove, J.R.; Couperthwaite, J.S.; Leeks, G.J.L. Downstream change in river bank erosion rates in the Swale-Ouse system, northern England. Hydrol. Process. 1999, 13, 977–992. [Google Scholar] [CrossRef]
- Watson, A.J.; Basher, L.R. Stream bank erosion: A review of processes of bank failure, measurement and assessment techniques, and modelling approaches. In Landcare ICM Report No. 2005-2006/01 Motueka Integrated Catchment Management Programme Report Series: Bank Erosion Review; Landcare Research: Nelson, New Zeland, 2006; pp. 1–32. [Google Scholar]
- Neill, C.R.; Yaremko, E.K. Identifying causes and predicting effects of bank erosion. In Proceedings of the National Conference on Hydraulic Engineering, American Society of Civil Engineers, New Orleans, LA, USA, 14–18 August 1989. [Google Scholar]
- Przedwojski, B. Morfologia rzek i prognozowanie procesów rzecznych. In Wyd. Akademii Rolniczej im; Augusta Cieszkowskiego w Poznaniu: Poznań, Poland, 1998; p. 293. [Google Scholar]
- Banach, M.; Grobelska, H. Stan dynamiki brzegów zbiornika Jeziorsko. Słupskie Pr. Geogr. 2003, 1, 91–106. [Google Scholar]
- Coffman, D. Streambank Erosion Assessment in Non-Cohesive Channels Using Erosion Pins and Submerged Jet Testing. Ph.D. Thesis, Baylor University, Dallas/Fort Worth, TX, USA, 2009. Available online: http://beardocs.baylor.edu/xmlui/bitstream/handle/2104/5318/David_Coffman_Masters.pdf?sequence=1 (accessed on 12 April 2012).
- Couper, P.R.; Maddock, I.P. Subaerial river bank erosion processes and their interaction with other bank erosion mechanisms on the River Arrow, Warwickshire, UK. Earth Surf. Process. Landf. 2001, 26, 631–646. [Google Scholar] [CrossRef]
- Hooke, J.M. An analysis of the processes of river bank erosion. J. Hydrol. 1979, 42, 39–62. [Google Scholar] [CrossRef]
- Lawler, D.M. Process dominance in bank erosion systems. In Lowland Floodplain Rivers; Carling, P., Petts, G.E., Eds.; John Wiley and Sons: New York, NY, USA, 1992; pp. 117–143. [Google Scholar]
- Lawler, D.M. The impact of scale on the processes of channelside sediment supply: A conceptual model. In Effects of Scale on Interpretation and Management of Sediment and Water Quality. IAHS Pub.; Osterkamp, W.T., Ed.; IAHS Press: Wallingford, UK, 1995; Volume 226, pp. 175–184. [Google Scholar]
- Mengoni, B.; Mosselman, E. Analysis of riverbank erosion processes: Cecina river, Italy. In River, Coastal and Estuarine Morphodynamics: RCEM; Parker, García, Eds.; Taylor and Francis Group: London, UK, 2006; pp. 943–951. [Google Scholar]
- Thorne, C.R. Processes and mechanisms of river bank erosion. In Gravel-Bed Rivers; Hey, R.D., Bathurst, J.C., Thorne, C.R., Eds.; Wiley: Chichester, UK, 1982; pp. 227–272. [Google Scholar]
- Wynn, T.M.; Mostaghimi, S. The effects of vegetation and soil type on streambank erosion, Southwestern Virginia, USA. J. Am. Water Resour. Assoc. 2006, 42, 69–82. [Google Scholar] [CrossRef]
- Bertrand, F. Fluvial Erosion Measurements of Streambank Using Photo-Electronic Erosion Pins (PEEP). Ph.D. Thesis, University of Iowa, 2010. Available online: http://ir.uiowa.edu/cgi/viewcontent.cgi?article=1827&context=etd (accessed on 10 February 2013).
- Couper, P. Effects of silt-clay content on the susceptibility of river banks to subaerial erosion. Geomorphology 2003, 56, 95–108. [Google Scholar] [CrossRef]
- Green, T.R.; Beavis, S.G.; Dietrich, C.R.; Jakeman, A.J. Relating stream-bank erosion to in-stream transport of suspended sediment. Hydrol. Process. 1999, 13, 777–787. [Google Scholar] [CrossRef]
- Thorne, C.R. Effects of vegetation on river bank erosion and stability. In Vegetation and Erosion; Thornes, J.B., Ed.; Wiley: Chichester, UK, 1990; pp. 125–144. [Google Scholar]
- Van Klaveren, R.W.; McCool, D.K. Erodibility and critical shear of a previously frozen soil. Trans. Asae 1998, 41, 1315–1321. [Google Scholar] [CrossRef]
- Wolman, M.G. Factors influencing erosion of a cohesive river bank. Am. J. Sci. 1959, 257, 204–216. [Google Scholar] [CrossRef]
- Wynn, T.M.; Henderson, M.B.; Vaughan, D.H. Changes in streambank erodibility and critical shear stress due to subaerial processes along a headwater stream, southwestern Virginia, USA. Geomorphology 2008, 97, 260–273. [Google Scholar] [CrossRef]
- Hupp, C.R.; Schenk, E.R.; Richter, J.M.; Peet, R.K.; Townsend, P.A. Bank erosion along the dam-regulated lower Roanoke River, North Carolina. Geol. Soc. Am. Spec. Pap. 2009, 451, 97–108. [Google Scholar]
- Merritt, D.M.; Cooper, D.J. Riparian vegetation and channel change in response to river regulation: A comparative study of regulated and unregulated streams in the Green River Basin, USA. Regul. Rivers Res. Manag. 2000, 16, 543–564. [Google Scholar] [CrossRef]
- Simon, A.; Hupp, C.R. Geomorphic and Vegetative Recovery Processes along Modified Stream Channels of West Tennessee. In U.S. Geological Survey Open-File Report 91-502; U.S. Geological Survey; Books and Open-File Reports Section: Reston, VA, USA, 1992; p. 142. [Google Scholar]
- Simon, A.; Rinaldi, M. Channel instability in the loess area of the Midwestern United States. J. Am. Water Resour. Assoc. 2000, 36, 133–150. [Google Scholar] [CrossRef]
- Bartley, R.; Keen, R.J.; Hawdon, A.A.; Disher, M.G.; Kinsey-Henderson, A.E.; Hairsine, P.B. Measuring Rates of Bank Erosion and Channel Change in Northern Australia: A Case Study from the Daintree River Catchment. Reef Rainfor. CRC Final. Rep. CSIRO Land Water Sci. Rep. 2006, 43, 6–51. Available online: http://www.clw.csiro.au/publications/science/2006/sr43-06.pdf (accessed on 10 February 2013).
- Bartley, R.; Henderson, A.; Wilkinson, S.; Whitten, S.; Rutherfurd, I. Stream Bank Management in the Great Barrier Reef Catchments: A Handbook. Report to the Department of Environment. CSIRO Land Water Aust. 2015, 80. Available online: https://publications.csiro.au/rpr/download?pid=csiro:EP15849&dsid=DS1 (accessed on 7 January 2013).
- Abernethy, B.; Rutherfurd, I.D. Where along a river’s length will vegetation most effectively stabilise stream banks? Geomorphology 1998, 23, 55–75. [Google Scholar] [CrossRef]
- Pilarczyk, K.W.; Havinga, H.; Klaasen, G.J.; Verhey, H.J.; Mosselman, E.; Leemans, J.A. Control of bank erosion in the Netherlands. State-of-the-art. Conf. Hydr. Eng. ASCE New Orleans 1989, 442, 1–32. [Google Scholar]
- Duong Thi, T.; Do Minh, D. Riverbank Stability Assessment under River Water Level Changes and Hydraulic Erosion. Water 2019, 11, 2598. [Google Scholar] [CrossRef] [Green Version]
- Yumoto, M.; Ogata, T.; Matsuoka, N.; Matsumoto, E. Riverbank freeze-thaw erosion along a small mountain stream, Nikko Volcanic Area, Central Japan. Permafr. Periglac. Process. 2006, 17, 325–339. [Google Scholar] [CrossRef]
- Augustowski, K. The role of multigelation in the development of river banks. Georeview 2013, 22, 56–66. [Google Scholar] [CrossRef] [Green Version]
- Vallejo, L.E. Mechanics of the Stability and Development of the Great Lakes Coastal Bluffs. Ph.D. Dissertation, University of Wisconsin-Madison, Madison, WI, USA, 1977. [Google Scholar]
- Vallejo, L.E. Bluff retreat by frost action in the Great Lakes. In Proceedings of the 33rd Annual Meeting Technical Program Abstracts, Association of Engineering Geologists, Pittsburgh, PA, USA, 1–5 October 1990; pp. 50–51. [Google Scholar]
- Teisseyre, A.K. Procesy fluwialne i rozwój koryta górnego Bobru na odcinku badawczym w Błażkowej (1967–1982). Geol. Sudetica 1984, 19, 7–71. [Google Scholar]
- Lawler, D.M. Needle ice processes and sediment mobilisation on river bends; the River Ilston, West Glamorgan, UK. J. Hydrol. 1993, 150, 81–114. [Google Scholar] [CrossRef]
- Jahn, A. Quantitative Analysis of some Periglacial Processess In Spitsbergen. Zesz. Nauk. Uniw. Wrocławskiego Ser. B 1961, 5, 3–34. [Google Scholar]
- Dutkiewicz, L. The distribution of periglacial phenomena In NW-Sörkapp, Spitsbergen. Biul. Peryglac. 1967, 16, 37–83. [Google Scholar]
- Reid, J.R. Bank-erosion processes in a cool-temperate environment, Orwell Lake, Minnesota. Geol. Soc. Am. Bull. 1985, 96, 781–792. [Google Scholar] [CrossRef]
- Reid, J.R. Bank recession causes, measurement techniques, rates and predictions, Lake Sakakawea, North Dakota. In Missouri River Division Sediment Series 38; University of North Dakota: Omaha, NE, USA, 1992. [Google Scholar]
- Reid, J.R.; Sandberg, B.S.; Millsop, M.D. Bank recession processes, rates and prediction, Lake Sakakawea, North Dakota, U.S.A. Geomorphology 1988, 1, 161–189. [Google Scholar] [CrossRef]
- Hill, A.R. Erosion of river banks composed of glacial till near Belfast, Northern Ireland. Z. Geomorphol. 1973, 17, 428–442. [Google Scholar]
- Thorne, C.R.; Lewin, J. Bank processes, bed material movement and planform development in a meandering river. In Adjustments of the Fluvial System; Rhodes, D.D., Williams, G.P., Eds.; Allen and Unwin: London, UK, 1979; pp. 117–137. [Google Scholar]
- Michalczewski, J. Długotrwale zastoiska mrozowe Kotliny Podhalańskiej. Acta Geogr. Lodziendzia 1962, 13, 27–70. (In Polish) [Google Scholar]
- Klimaszewski, M. Views on the geomorphological development of the Polish West Carpathians in tertiary times. Geomorphol. Probl. Carpathians Bratisl. 1965, 1, 91–126. [Google Scholar]
- Kozak, P. Rocznik hydrologiczny; Wyd. Komunikacji I Łączności: Warszawa, Poland, 2014. [Google Scholar]
- Prosser, I.P.; Hughes, A.O.; Rutherfurd, I.D. Bank erosion of an incised upland channel by subaerial processes: Tasmania, Australia. Earth Surf. Process. Landf. 2000, 25, 1085–1101. [Google Scholar] [CrossRef]
- Saynor, M.J.; Erskine, W.D.; Evans, K.G. Bank erosion in the Ngarradj catchment: Results of erosion pin measurements between 1998 and 2001. In Supervising Scientist Report 176; Supervising Scientist: Darwin, NT, Australia, 2003; p. 40. [Google Scholar]
- Howard, A.; Raine, S.R.; Titmarsh, G. The Contribution of Stream Bank Erosion to Sediment Loads in Gowrie Creek, Toowoomba; University of Southern Quennsland: Toowoombie, Australia, 1998; Available online: http://www.usq.edu.au/users/raine/index_files/ASSSI98_Howard_etal.pdf (accessed on 10 April 2012).
- Luppi, L.; Rinaldi, M.; Teruggi, L.B.; Darby, S.E.; Nardi, L. Monitoring and numerical modelling of riverbank erosion processes: A case study along the Cecina River (central Italy). Earth Surf. Process. Landf. 2008, 34, 530–546. [Google Scholar] [CrossRef]
- Kronvang, B.; Audet, J.; Baattrup-Pedersen, A.; Jensen, H.S.; Larsen, S.E. Phosphorus Load to Surface Water from Bank Erosion in a Danish Lowland River Basin. J. Environ. Qual. 2012, 41, 304–313. [Google Scholar] [CrossRef] [Green Version]
- Sirvent, J.; Desir, G.; Gutierrez, M.; Sancho, C.; Benito, G. Erosion rates in badland areas recorded by collectors, erosion pins and profilometer techniques (Ebro Basin, NE-Spain). Geomorphology 1997, 18, 61–75. [Google Scholar] [CrossRef]
- Shi, Z.; Wen, A.; Zhang, X.; Yan, D. Comparison of the soil losses from 7Be measurements and the monitoring data by erosion pins and runoff plots in the Three Gorges Reservoir region, China. Appl. Radiat. Isot. 2011, 69, 1343–1348. [Google Scholar] [CrossRef] [PubMed]
- Arens, S.M.; Slings, Q.; de Vries, C.N. Mobility of a remobilised parabolic dune in Kennemerland, The Netherlands. Geomorphology 2004, 59, 175–188. [Google Scholar] [CrossRef]
- Lawler, D.M.; West, J.R.; Couperthwaite, J.S.; Mitchell, S.B. Application of a novel automatic erosion and deposition monitoring system at a channel bank site on the tidal River Trent, UK, Estuarine, Coastal and Shelf. Science 2001, 53, 237–247. [Google Scholar]
- Stott, T. Stream bank and forest ditch erosion: Preliminary responses to timber harvesting in mid-Wales. In Fluvial Processes and Environmental Change; Brown, A.G., Quine, T.A., Eds.; Wiley: New York, NY, USA, 1999; pp. 47–70. [Google Scholar]
- Couper, P.; Scott, T.; Maddock, I. Insights into river bank erosion processes derived from anaylsis of negative erosion-pin recordings: Observations from three recent UK studies. Earth Surf. Process. Landf. 2002, 27, 59–79. [Google Scholar] [CrossRef]
- O’Neil, M.A.; Pizzuto, J.E. The rates and spatial patterns of annual riverbank erosion revealed through terrestrial laser-scanner surveys of the South River, Virginia. Earth Surf. Process. Landf. 2011, 36, 695–701. [Google Scholar]
- Jahn, A. Some problems concerning slope development in the Sudetes. Biul. Peryglac. 1969, 18, 331–348. [Google Scholar]
- Augustowski, K.; Kukulak, J. Przekształcenia powierzchni brzegów rzecznych przez procesy mrozowe (Transformations of the surface of riverbanks by frostprocesses). Landf. Anal. 2013, 24, 3–10. [Google Scholar] [CrossRef]
- Kaplar, C.W. A Laboratory Freezing Test to Determine the Relative Frost Susceptibility of Soils. CRREL Tech. Rept. TR-250 1965, 17, 40. [Google Scholar]
- Berg, R.L.; Johnson, T. Revised procedures for pavement design under seasonal frost conditions. In USA Cold Regions Research and Engineering Laboratory, Special Report 83–27; US Army Corps and Engineers: Hanover, NH, USA, 1983; p. 129. [Google Scholar]
- Piłat, J.; Radziszewski, P. Nawierzchnie Asfaltowe; Wyd. Komunikacji i Łączności: Warszawa, Poland, 2004; p. 517. (In Polish) [Google Scholar]
- Grabowska-Olszewska, B.; Siergiejew, J. (Eds.) Soil Science; Wyd. Geol.: Warszawa, Poland, 1977; pp. 81–85. (In Polish) [Google Scholar]
- Klementowski, J. Współczesne procesy mrozowe na Dolnym Śląsku. In Geograficzne Uwarunkowania Rozwoju Małopolski; Górka, Z., Jelonek, A., Eds.; IGiGP UJ: Kraków, Poland, 2002; pp. 191–198. (In Polish) [Google Scholar]
Figure 1.
Location of study sites, and hydrological and meteorological stations.

Figure 2.
Changes in temperature at ground level during hydrological year 2013–2014.

Figure 3.
Changes in water level at gauge station on Wielki Rogoźnik River during hydrological year 2013–2014.
Figure 3.
Changes in water level at gauge station on Wielki Rogoźnik River during hydrological year 2013–2014.

Figure 4.
Installed erosion pins.

Figure 5.
Study sites.

Figure 6.
River-bank profiles on studied sites.

Figure 7.
Right bank of Wielki Rogoźnik River (Site 2) with polygons A–C.

Figure 8.
Amounts of river-bank retreat and variability in erosion or accumulation of erosion pins in individual rows at study polygons on study Sites 1–5 as a result of frost and fluvial processes (A) Site 1 Plot A (B) Site 1 Plot 2 (C) Site 2 Plot A (D) Site 2 Plot B (E) Site 2 Plot C (F) Site 3 (G) Site 4 (H) Site 5.


Table 1.
Timing of measurements in hydrological year 2013–2014.
| Timing of Measurements During | |
|---|---|
| Fall–Winter | Spring–Fall |
| 15 December 2013 | 24 May 2014 (after the water-level rise on 14–21 May) |
| 10 January 2014 | 25 July 2014 (after water-level rise on 2–24 July) |
| 25 January 2014 | 3 September 2014 |
| 3 March 2014 | 29 October 2014 |
| 26 March 2014 | |
| 10 May 2014 | |
Table 2.
Characteristics of studied sites.
| Site | Plot | Number of Erosion Pins | Parameters of Studied Bank Sections | |||
|---|---|---|---|---|---|---|
| Length (m) | Elevation above Water Level (m) | Surface Area (m2) | Alluvium Type | |||
| 1 | A | 42 | 11.5 | 1.8 | 20.7 | Clayey gravel |
| B | 36 | 10 | 2 | 20 | Clayey gravel | |
| 2 | A | 36 | 5.2 | 3 | 15.6 | Gravel |
| B | 56 | 6.5 | 3 | 19.5 | Gravel | |
| C | 21 | 4 | 3 | 12 | Gravel | |
| 3 | A | 30 | 10 | 3 | 30 | Clayey gravel |
| 4 | A | 87 | 22 | 2.5 | 55 | Clayey |
| 5 | A | 68 | 18.5 | 2 | 37 | Clayey gravel |
Table 3.
Amounts of river-bank retreat and variability in erosion or accumulation of erosion pins in individual rows at study polygons on study Sites 1–5.
Table 3.
Amounts of river-bank retreat and variability in erosion or accumulation of erosion pins in individual rows at study polygons on study Sites 1–5.
| Site | Plot | Erosion due to (cm) | |||||||||
|---|---|---|---|---|---|---|---|---|---|---|---|
| Frost Phenomena | Fluvial Processes | ||||||||||
| Row 1 (Situated Closest to Terrace Surface) | Row 2 | Row 3 | Row 4 | Mean | Row 1 | Row 2 | Row 3 | Row 4 | Mean | ||
| 1 | A | 39.3 | 37.9 | 25.9 | 34.4 | 80 * | 80 * | 80 * | 80 * | ||
| B | 16.7 | 11.2 | 13.1 | 13.7 | 33.6 | 50.7 | 56.1 | 46.8 | |||
| 2 | A | 15.5 | 5 | 7.1 | 12.5 | 10.6 | 80 * | 80 * | 80 * | 80 * | 80 * |
| B | 28.3 | 29.9 | 40.4 | 62 | 40.4 | 80 * | 80 * | 80 * | 80 * | 80 * | |
| C | 9.9 | 10.7 | 8 | 9.5 | 56.7 | 62 | 72.7 | 63.8 | |||
| 3 | A | 31.3 | −13.7 | 6.9 | 8.2 | 9.6 | 8.4 | 6 | 8 | ||
| 4 | A | 3.8 | 7.8 | −5.3 | −13.9 | −2.2 | 80 * | 80 * | 80 * | 80 * | 80 * |
| 5 | A | 8.6 | 11.9 | 2.9 | 7.7 | 22 | 15 | 12.8 | 16.5 | ||
* Plot was destroyed during the flood in May 2014.
Table 4.
Share of frost phenomena in retreat of river banks.
| Site | Plot | Share of Frost Phenomena in Bank Erosion (%) | ||||
|---|---|---|---|---|---|---|
| Row 1 | Row 2 | Row 3 | Row 4 | Mean | ||
| 1 | A | 32.9 | 32.1 | 24.5 | 30.1 | |
| B | 33.2 | 18.1 | 18.9 | 22.6 | ||
| 2 | A | 16.2 | 5.9 | 8.2 | 13.5 | 11.7 |
| B | 26.1 | 27.2 | 25.4 | 14.5 | 23.6 | |
| C | 14.9 | 14.7 | 9.9 | 13.0 | ||
| 3 | A | 76.5 | ** | 53.5 | 50.6 | |
| 4 | A | 4.5 | 8.9 | −7.1 | −21.0 | −2.8 |
| 5 | A | 28.1 | 44.2 | 18.5 | 31.8 | |
** Deposition observed at the level of erosion pins during fall–winter season. Amount of bank retreat could not be determined because of the scree cover.
Publisher’s Note: MDPI stays neutral with regard to jurisdictional claims in published maps and institutional affiliations. |
© 2021 by the authors. Licensee MDPI, Basel, Switzerland. This article is an open access article distributed under the terms and conditions of the Creative Commons Attribution (CC BY) license (https://creativecommons.org/licenses/by/4.0/).
Share and Cite
MDPI and ACS Style
Augustowski, K.; Kukulak, J. The Role of Frost Processes in the Retreat of River Banks. Water 2021, 13, 1812. https://doi.org/10.3390/w13131812
AMA Style
Augustowski K, Kukulak J. The Role of Frost Processes in the Retreat of River Banks. Water. 2021; 13(13):1812. https://doi.org/10.3390/w13131812
Chicago/Turabian StyleAugustowski, Karol, and Józef Kukulak. 2021. "The Role of Frost Processes in the Retreat of River Banks" Water 13, no. 13: 1812. https://doi.org/10.3390/w13131812
Note that from the first issue of 2016, this journal uses article numbers instead of page numbers. See further details here.