
Determining Freshwater Lake Communities’ Vulnerability to Snowstorms in the Northwest Territories
by
 , ,
, ,
Janine A. Baijnath-Rodino
1,* ,
,
Amaia Albizua
2,
Laxmi Sushama
3,
Elena Bennett
4,5 and
Brian E. Robinson
6 1
Department of Civil and Environmental Engineering, University of California, Irvine, CA 92697, USA
2
Basque Centre for Climate Change, Parque Científico de UPV/EHU, 48940 Leioa, Spain
3
Department of Civil Engineering, McGill University, Montreal, QC H3A 0C3, Canada
4
Department of Natural Resource Sciences, Macdonald Campus, McGill University, Montreal, QC H9X 3V9, Canada
5
Bieler School of Environment, McGill University, Montreal, QC H3A 2A7, Canada
6
Department of Geography, McGill University, Montreal, QC H3A 0B9, Canada
*
Author to whom correspondence should be addressed.
Water 2021, 13(13), 1816; https://doi.org/10.3390/w13131816
Submission received: 28 April 2021
/
Revised: 18 June 2021
/
Accepted: 22 June 2021
/
Published: 30 June 2021
Abstract
:As the exposure to extreme snowstorms continues to change in response to a warming climate, this can lead to higher infrastructure damages, financial instability, accessibility restrictions, as well as safety and health effects. However, it is challenging to quantify the impacts associated with the combination of the many biophysical and socio-economic factors for resiliency and adaptation assessments across many disciplines on multiple spatial and temporal scales. This study applies a framework to quantitatively determine the multiple impacts of snowstorms by calculating the livelihood vulnerability index (LVI) for four exposed freshwater lake communities in Canada’s Northwest Territories using three contributing factors (exposure, sensitivity, and adaptive capacity). Results indicate that Déline is the most vulnerable community (0.67), because it has the highest exposure and one of the highest sensitivity ranks, while its ability to adapt to exposure stressors is the lowest among the communities. In contrast, Fort Resolution exhibits the lowest LVI (0.26) and has one of the highest adaptive capacities. This study emphasizes that while these freshwater communities may be exposed to snowstorms, they have different levels of sensitivity and adaptive capacities in place that influences their vulnerability to changes in hazardous snowfall conditions. The information gained from this study can help guide future adaptation, mitigation, and resiliency practices for Arctic sustainability efforts.
1. Introduction
The Mackenzie River basin (MRB), in the Northwest Territories (NWT), Canada, is considered a “global hotspot” because winter temperatures have increased as much as 4 °C in the past fifty years [1,2]. Warmer temperatures can lead to significant changes in the local environment and shifts in weather patterns [3]. One of these shifts includes changes in winter storms along the leeward shores of large lakes.
The increased exposure to snowstorm activity for communities along the shores of Great Bear Lake and Great Slave Lake in the MRB are of concern in a warming climate. Hydrometeorological linkages and feedback amongst these large lakes and the ambient environment result in a dynamic coupled system that is sensitive to climate change [4] One example is the later onset of lake-ice that allows for longer duration of open water that can facilitate the development of heavy lake effect snowfall, a meteorological phenomenon that occurs when a cold and dry Arctic air mass advects over open waters of relatively warm lake surfaces. A vertical temperature gradient develops between the lake surface and the atmosphere, initiating convection and the development of heavy snowfall that inundates communities along the leeward shores of the lake [5,6,7].
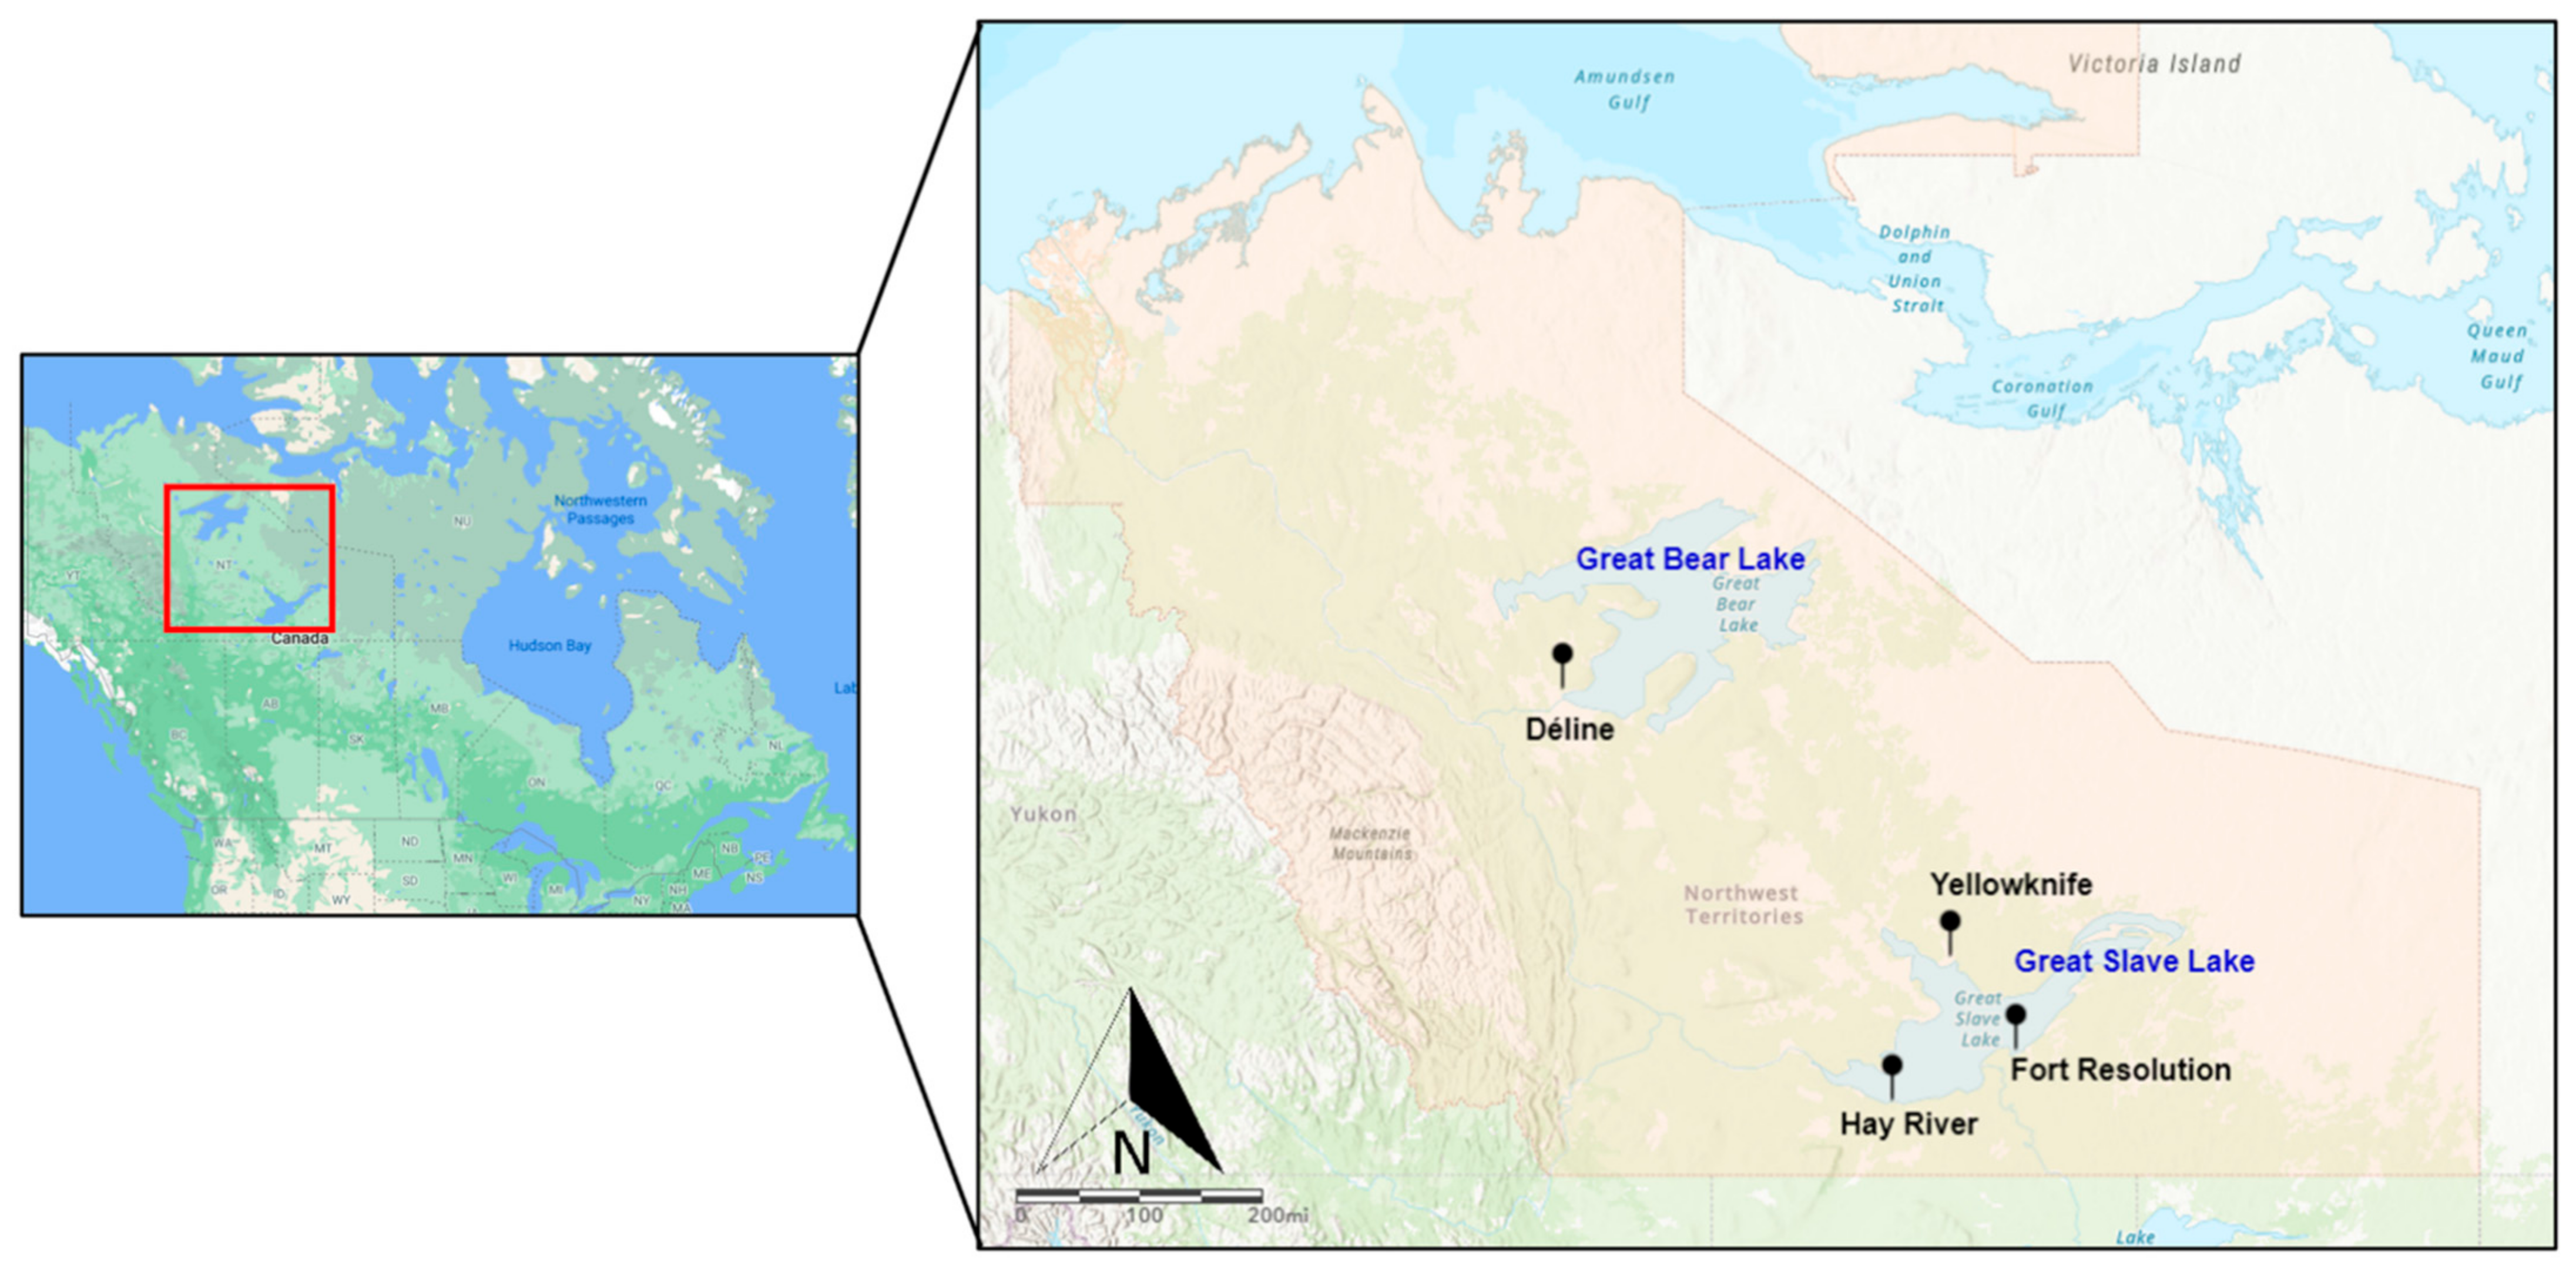
The Northwest Territories are covered by snow for a period of nine months of the year, and its temporal persistence plays a synergetic role in linking the ecological, climatological, hydrological, cultural, and socioeconomic systems [8]. However, despite these positive snowfall attributes, snowstorms can be a natural hazard for many NWT communities along the shores of the Mackenzie Great Lakes, such as Déline, which is along the western shores of Great Bear Lake, and Yellowknife, Hay River, and Fort Resolution, which are along the shores of Great Slave Lake (Figure 1).
These communities are potentially vulnerable to increased snowstorms because of their high exposure, which could pose socio-economic sensitivities including infrastructure damages, financial instabilities, accessibility restrictions, and impacts related to the communities’ safety and health. The National Round Table on the Environment and the Economy from 2009 found that infrastructure damage caused by a warmer climate is one of the most concerning effects for Northerners. The Climate Change Impact and Adaptation Report from 2008 also shows that extreme snow loads on buildings can cause roof structures to collapse. Approximately one fifth of buildings in the NWT are under watch or renovation for increased snow load failures [9]. Extreme snowstorms can also lead to millions of dollars of lost or delayed revenue due to operation shutdowns and slow transportation of goods and services every year [9,10]. Finally, research from [11] suggests that the quantity and duration of snowfall were associated with subsequent risk of hospital admissions or deaths. These reasons provide motivation for assessing the potential vulnerabilities that lakeshore communities have to snowstorm exposures. Moreover, understanding the extent to which these communities are vulnerable to snowstorms provides a useful assessment that regional authorities can consider when prioritizing resource allocations.
In order to inform and advise policymakers on improving adaptation and resiliency strategies in response to the negative impacts of climate change in these lake-rich communities, it is imperative to first characterize their social vulnerability [12]. In this context, we define social vulnerability as a person, household, community, or nation’s ability to deal with a range of stressors or shocks spawned from climate-related changes [13,14]. Therefore, vulnerability is evaluated based upon physical risks and the capacity of societies to respond to those risks [15]. The vulnerability of freshwater lake communities in the NWT is a function of current and future exposure-sensitivities, current adaptation strategies, and future adaptive capacities [16].
Extensive work has been done on the biophysical, and separately, the socio-economic risks in Arctic and subarctic regions. However, quantifying the combination of these risks for resiliency and adaptation assessments can be challenging because these impacts vary across many disciplines (social, economic, science, and engineering practices) on multiple spatial and temporal scales. For example, biophysical risk assessments include regional climate change projections that show an increase in rain-on-snow events during the winter period for Canadian regions [17]. There has also been substantial evidence that lake-ice phenology has been changing across northern communities with later freeze-up and earlier break-up dates being observed [18,19]. Ref. [19] suggest that there is a positive correlation between open water and cyclone intensity in the Arctic, which will likely produce larger and stronger storms. These changes in ice phenology have direct impacts on lake-atmospheric hydrology and energy balance that can promote the formation of extreme lake effect snowstorms.
Separately, examples of socio-economic risk assessments include interdisciplinary groups, such as the Community Adaptation and Vulnerability in Arctic Regions (CAVIAR) that comprised approximately two dozen teams that were partnered with communities across eight polar nations to advance community and vulnerability adaptation. They applied a common research framework and consistent methodologies to compare results and synthesize findings across the circumpolar north [20]. They found that water is the medium that connects residents to their environment and provides a vital role in the livelihood and community’s well-being. Likewise, [21] produced a framework for assessing the vulnerability of Canadian Arctic communities under climate change, for which they documented and characterized current and future communities’ exposures and adaptive capacities.
Besides separate endeavors, researchers are also attempting to bridge the gap on quantifiably determining climate vulnerability among social, natural, and physical sciences [22]. Several studies have integrated both a physical and social vulnerability perspective [16]. For example, [23] applied a geographic-information-system-based approach to assess the physical vulnerability of coastal regions to flood hazards from storms and sea-level rise. They also delineated regions of social vulnerability for some communities using indicator demographics, such as age, gender, and race [16]. However, there are concerns that many of these collaborative efforts are focused solely on physical exposure outcomes (e.g., coastal erosion and residual impacts). Additional quantitative analysis includes the integration of vulnerability by examining the social-ecological system’s sensitivity and adaptive capacity in such a way that comparisons among communities can be performed. Previous studies have also relied on climate projection scenarios from coarse general circulation models (GCMs) that suffer from uncertainties and can be impractical for assessing sociological problems at the community level [22,24,25]. Other researchers have used a vulnerability index, such as the livelihood vulnerability index (LVI), with the aim to: (1) operationalize vulnerability theories by taking into account the interdependencies between global stressors and local assets and mechanisms, and (2) understand the impacts and the social capabilities to reduce sensitivity and exposure to exogenous threats, in a quantitative and comparable manner [14,22].
It is evident that many studies have solely investigated biophysical or socio-economic risks in Arctic and sub-Arctic regions, and those that try to conduct risk assessment with respect to many variables still face many challenges. This study provides a novel approach by employing a livelihood vulnerability index (LVI) framework that combines biophysical and socio-economic risks to quantify the vulnerability of freshwater lake communities to heavy snowstorms. LVI is a quantitative measure that determines how a system’s (e.g., a community’s) basic necessities of living (such as shelter, work conditions, health, and environment) are affected by an exposure, such as treacherous snowstorms. This framework will be used to quantify the LVI for each freshwater lake community (Déline, Fort Resolution, Hay River, and Yellowknife) by analyzing a set of contributing factors (exposure, sensitivity, and adaptive capacity) and their respective indicator variables. This will be conducted by using both observation and simulation high-resolution exposure data, and the Canadian Census data for sensitivity and adaptive capacity indicators. The findings from this research will help to identify which communities are vulnerable to specific biophysical and socio-economic stressors and what capacities exist for adaptation within the MRB. The information gained from this study can help guide future adaptation, mitigation, and resiliency practices for Arctic sustainability efforts.
2. Data and Methodology
2.1. Selection of Communities and Their Livelihoods
This study assesses the vulnerability of four regions (the City of Yellowknife, the Town of Hay River, the Charter Community of Déline, and the Hamlet of Fort Resolution) to snowstorms. These regions are referred to as “communities” in this study. However, their title differs depending on settlement hierarchy, demographic, and land value. Table 1 describes their status, population, locations, geographic coordinates, and associated Great Lake. Yellowknife, Hay River, Déline, and Fort Resolution were selected for this study based on three criteria. First, these communities are in close proximity to the large freshwater bodies of either Great Bear or Great Slave Lake, making them dependent on these lakes for their livelihood. Secondly, these lakeshore communities are located in different snowbelt zones, providing a diverse regional exposure of heavy lake effect snowstorms. Thirdly, there is comprehensive secondary data available for these communities. A brief description of each community is presented in Appendix A.
These freshwater lake communities rely on the Mackenzie Great Lakes basin system for social and economic sustenance, including the provision of efficient transportation routes, the generation of electricity, and a source for food. In the winter months, ice roads that are formed over Great Slave Lake reduce long-duration transportation journeys that would otherwise be taken in the summer. For example, during the summer months, the distance from Yellowknife to Dettah (a small first Nations community) is a distance of 27 km. During the winter months, ice roads, provided by Great Slave Lake, reduce this distance to only 6.5 km, making ice roads an easily accessible passage of travel to remote communities [26]. Hydropower is also generated by utilizing the dynamic Mackenzie Great Lakes system. Fort Resolution receives power generated from Taltson Hydro system and Yellowknife from Snare and Bluefish Hydro. While some communities have back-up diesel generators, hydropower is used to generate electricity for many communities.
The lakes also provide settlements with the ability to carry out traditional water activities such as hunting, trapping, and fishing. These lake activities remain an important subsistence and supplementary source of income. Fishing is important to the local Great Slave communities with fish-processing plants. This industry, for example, generated millions of dollars in the early 1990s, which comprised about one-tenth of the total value of commercial fishing in Western Canada. In addition to still being an important source of the NWT’s food, fishing also facilitates sporting and commercial activities, generating additional income. Whitefish and Arctic Char from the Great Slave Lake accounts for approximately 75% and 25% of NWT’s commercial fishing revenue, respectively. Tourists across North America arrive during the summer and contribute to the local economy and growing tourist industry [27,28]. It is therefore evident that these lakes play an important role in the livelihood of these freshwater lake communities in the NWT.
2.2. Data Sources
The data for adaptive capacity and sensitivity are from the 2016 Statistics Canada, Census Profile, which the authors acquired in November 2020 (https://www12.statcan.gc.ca/census-recensement/2016/dp-pd/prof/index.cfm?Lang=E (accessed on 1 November 2020)). If available, more recent year census data were acquired from the NWT Bureau of Statistics (https://www.statsnwt.ca/community-data/index.html (accessed on 1 June 2020)). We ensured to use the most recent data available for all indicator variables. Table A2 shows the year and the source for which each indicator data was acquired. The secondary data presents information on population for various geographic locations and includes information on a number of major components, such as demographics, finances, and labor. Secondary data is a common approach for assessing LVI [22]. Furthermore, the comprehensive and reliable Government of Canada database gives confidence for pursuing this research in a cost-effective manner.
The LVI framework also obtains exposure indicators, representing meteorological data from both high-resolution interpolated weather observation stations from Daymet, as well as from model simulations. Exposure indicators under the major components of “average precipitation” and “average temperatures” were derived using point data from Daymet, a 1 km gridded estimate of daily weather observations from a series of ground-based weather stations. Daymet is a trustworthy and historic comprehensive data source that has been used in many research investigations, including those by [5,6]. For more information on this product, refer to [29,30].
For exposure indicators under the major component “extremes”, the state-of-the-art high-resolution Global Environmental Multiscale Model [31,32] in climate mode (GEM_CLIM) coupled to the one-dimensional Freshwater Lake model (FLake) [33] was employed. The GEM_CLIM simulation was driven by ERA_Interim and provides global atmospheric reanalysis of observational data through data assimilation techniques [31,32]. This model was used because it has a relatively high, 0.11° (12 km), spatial resolution that is capable of resolving narrower meso-beta snow squalls, found in lake effect snowstorms, which is not possible by coarser regional climate models (RCMs). In addition, FLake has been tested and coupled to different numerical weather prediction models and RCMS, such as studies conducted by [34,35,36,37]. Likewise, FLake has been evaluated against other lake models and observational data by [38,39,40], thereby justifying the use of the GEM_CLIM simulation in this study. Future simulation is also employed to assess projected exposures of precipitation. This is not included in the current LVI framework but provides information on the projected exposure of snowfall (see Appendix A).
2.3. Calculating the Contributing Factors
2.4. Exposure
Exposure is considered the magnitude and duration of a climate-related stressor, which in this case is snowstorms. In this framework, exposure comprises three major components that are assessed for November. The month of November is chosen because heavy snowstorms that develop as a result of the large open water extent over Great Bear and Great Slave Lakes are most prevalent at this time. This is because large lakes in the MRB are still mostly ice-free in November, with colder Arctic air masses advecting over the relatively warm open waters.
The three major components analyzed in exposure for the month of November are extremes, average precipitation variables, and average temperature variables. The average precipitation and average temperature major components were computed using Daymet daily gridded values and averaged over the daily five-year period of November from 2015 to 2019. The results were inputted into the framework to calculate exposure.
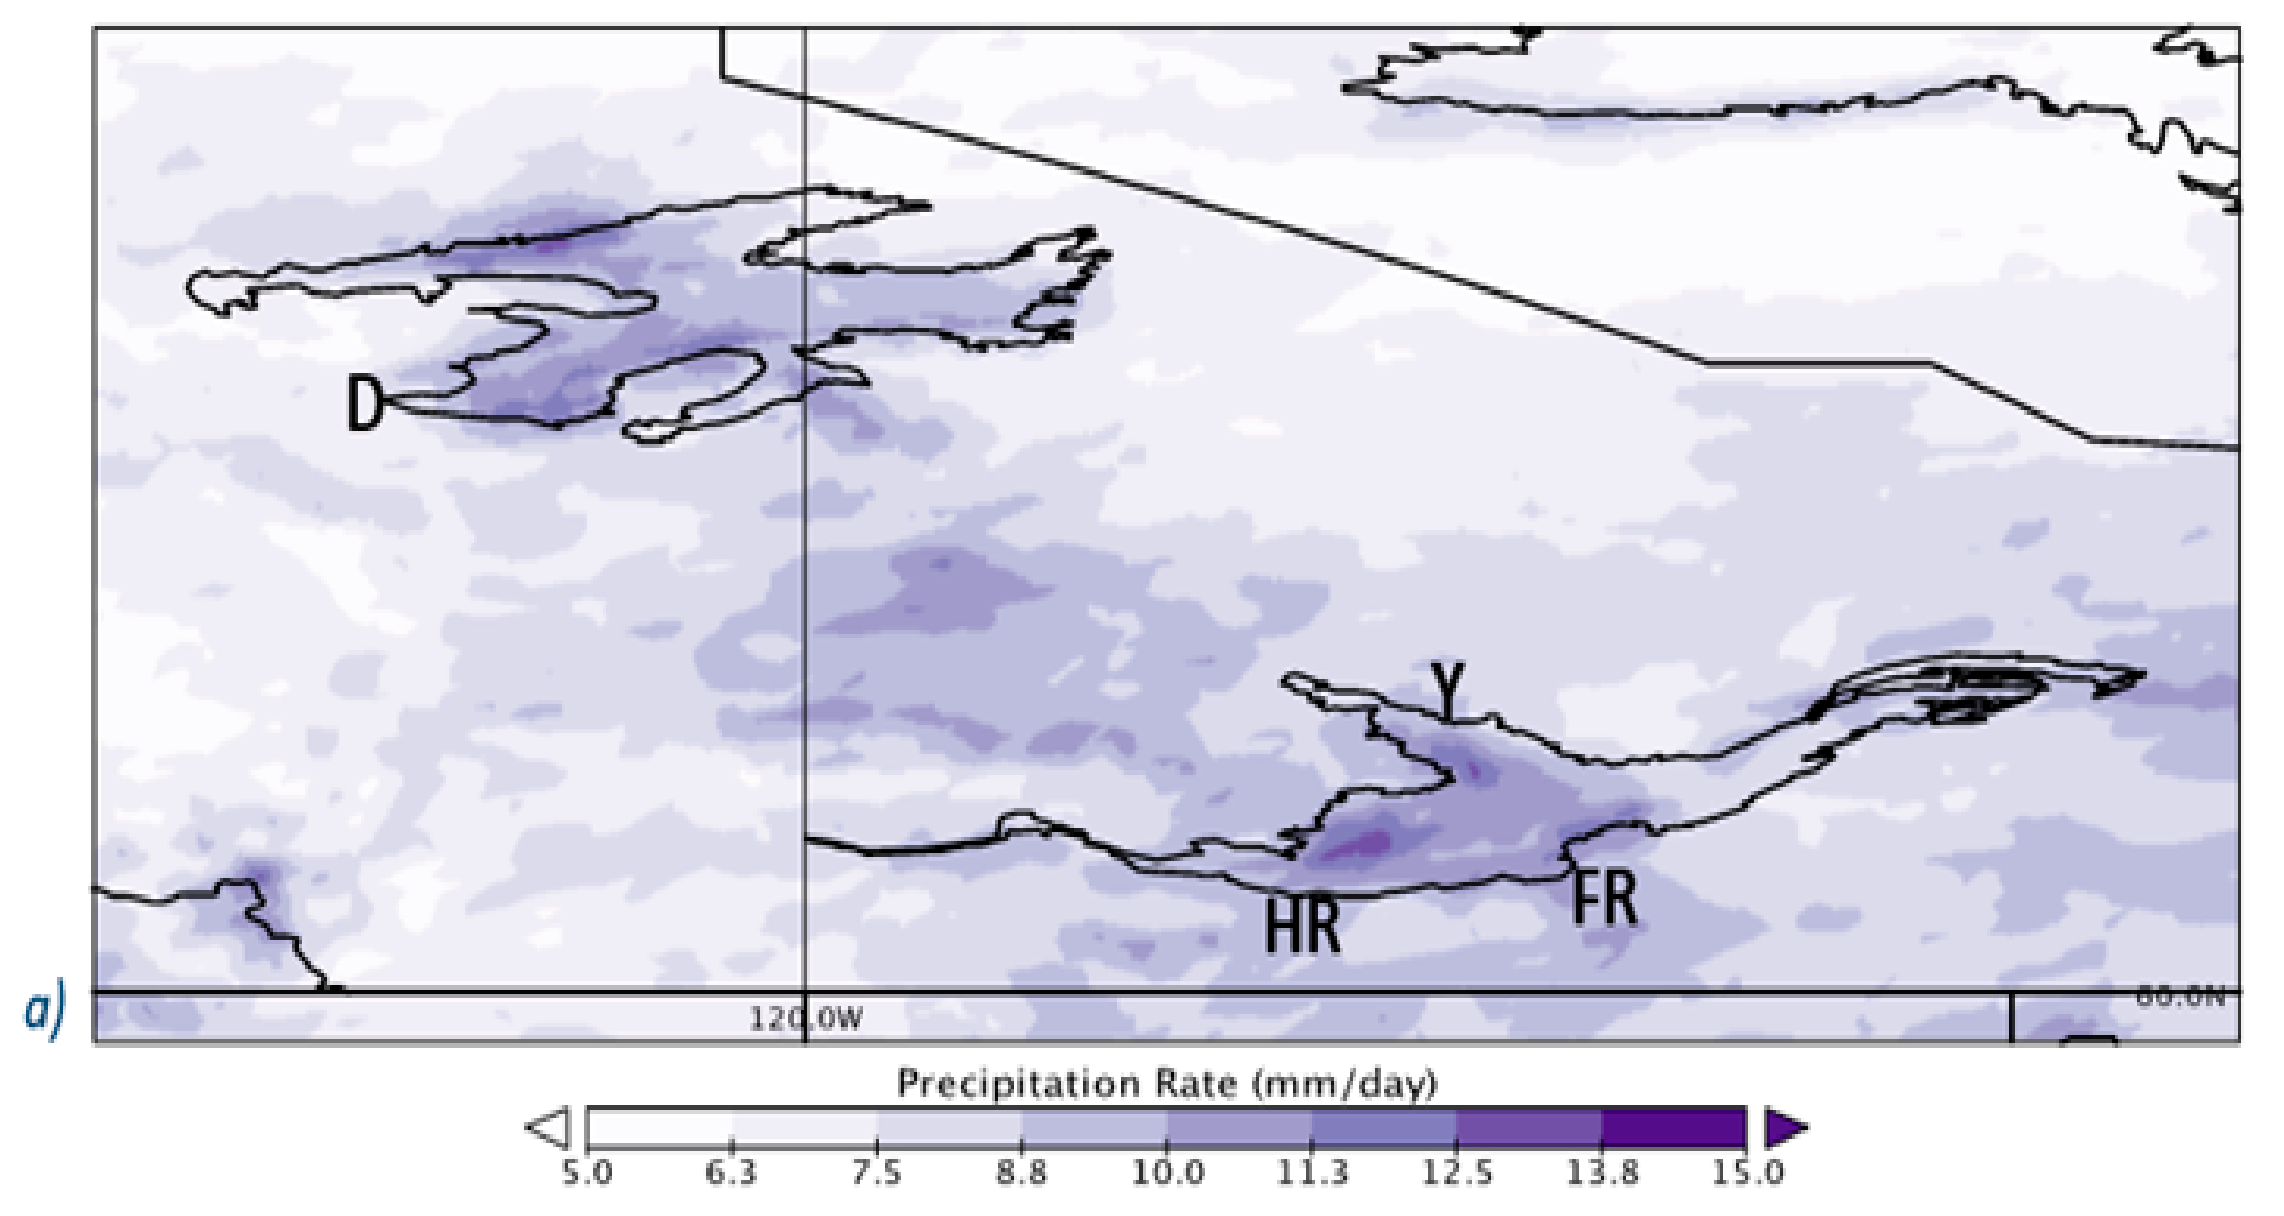
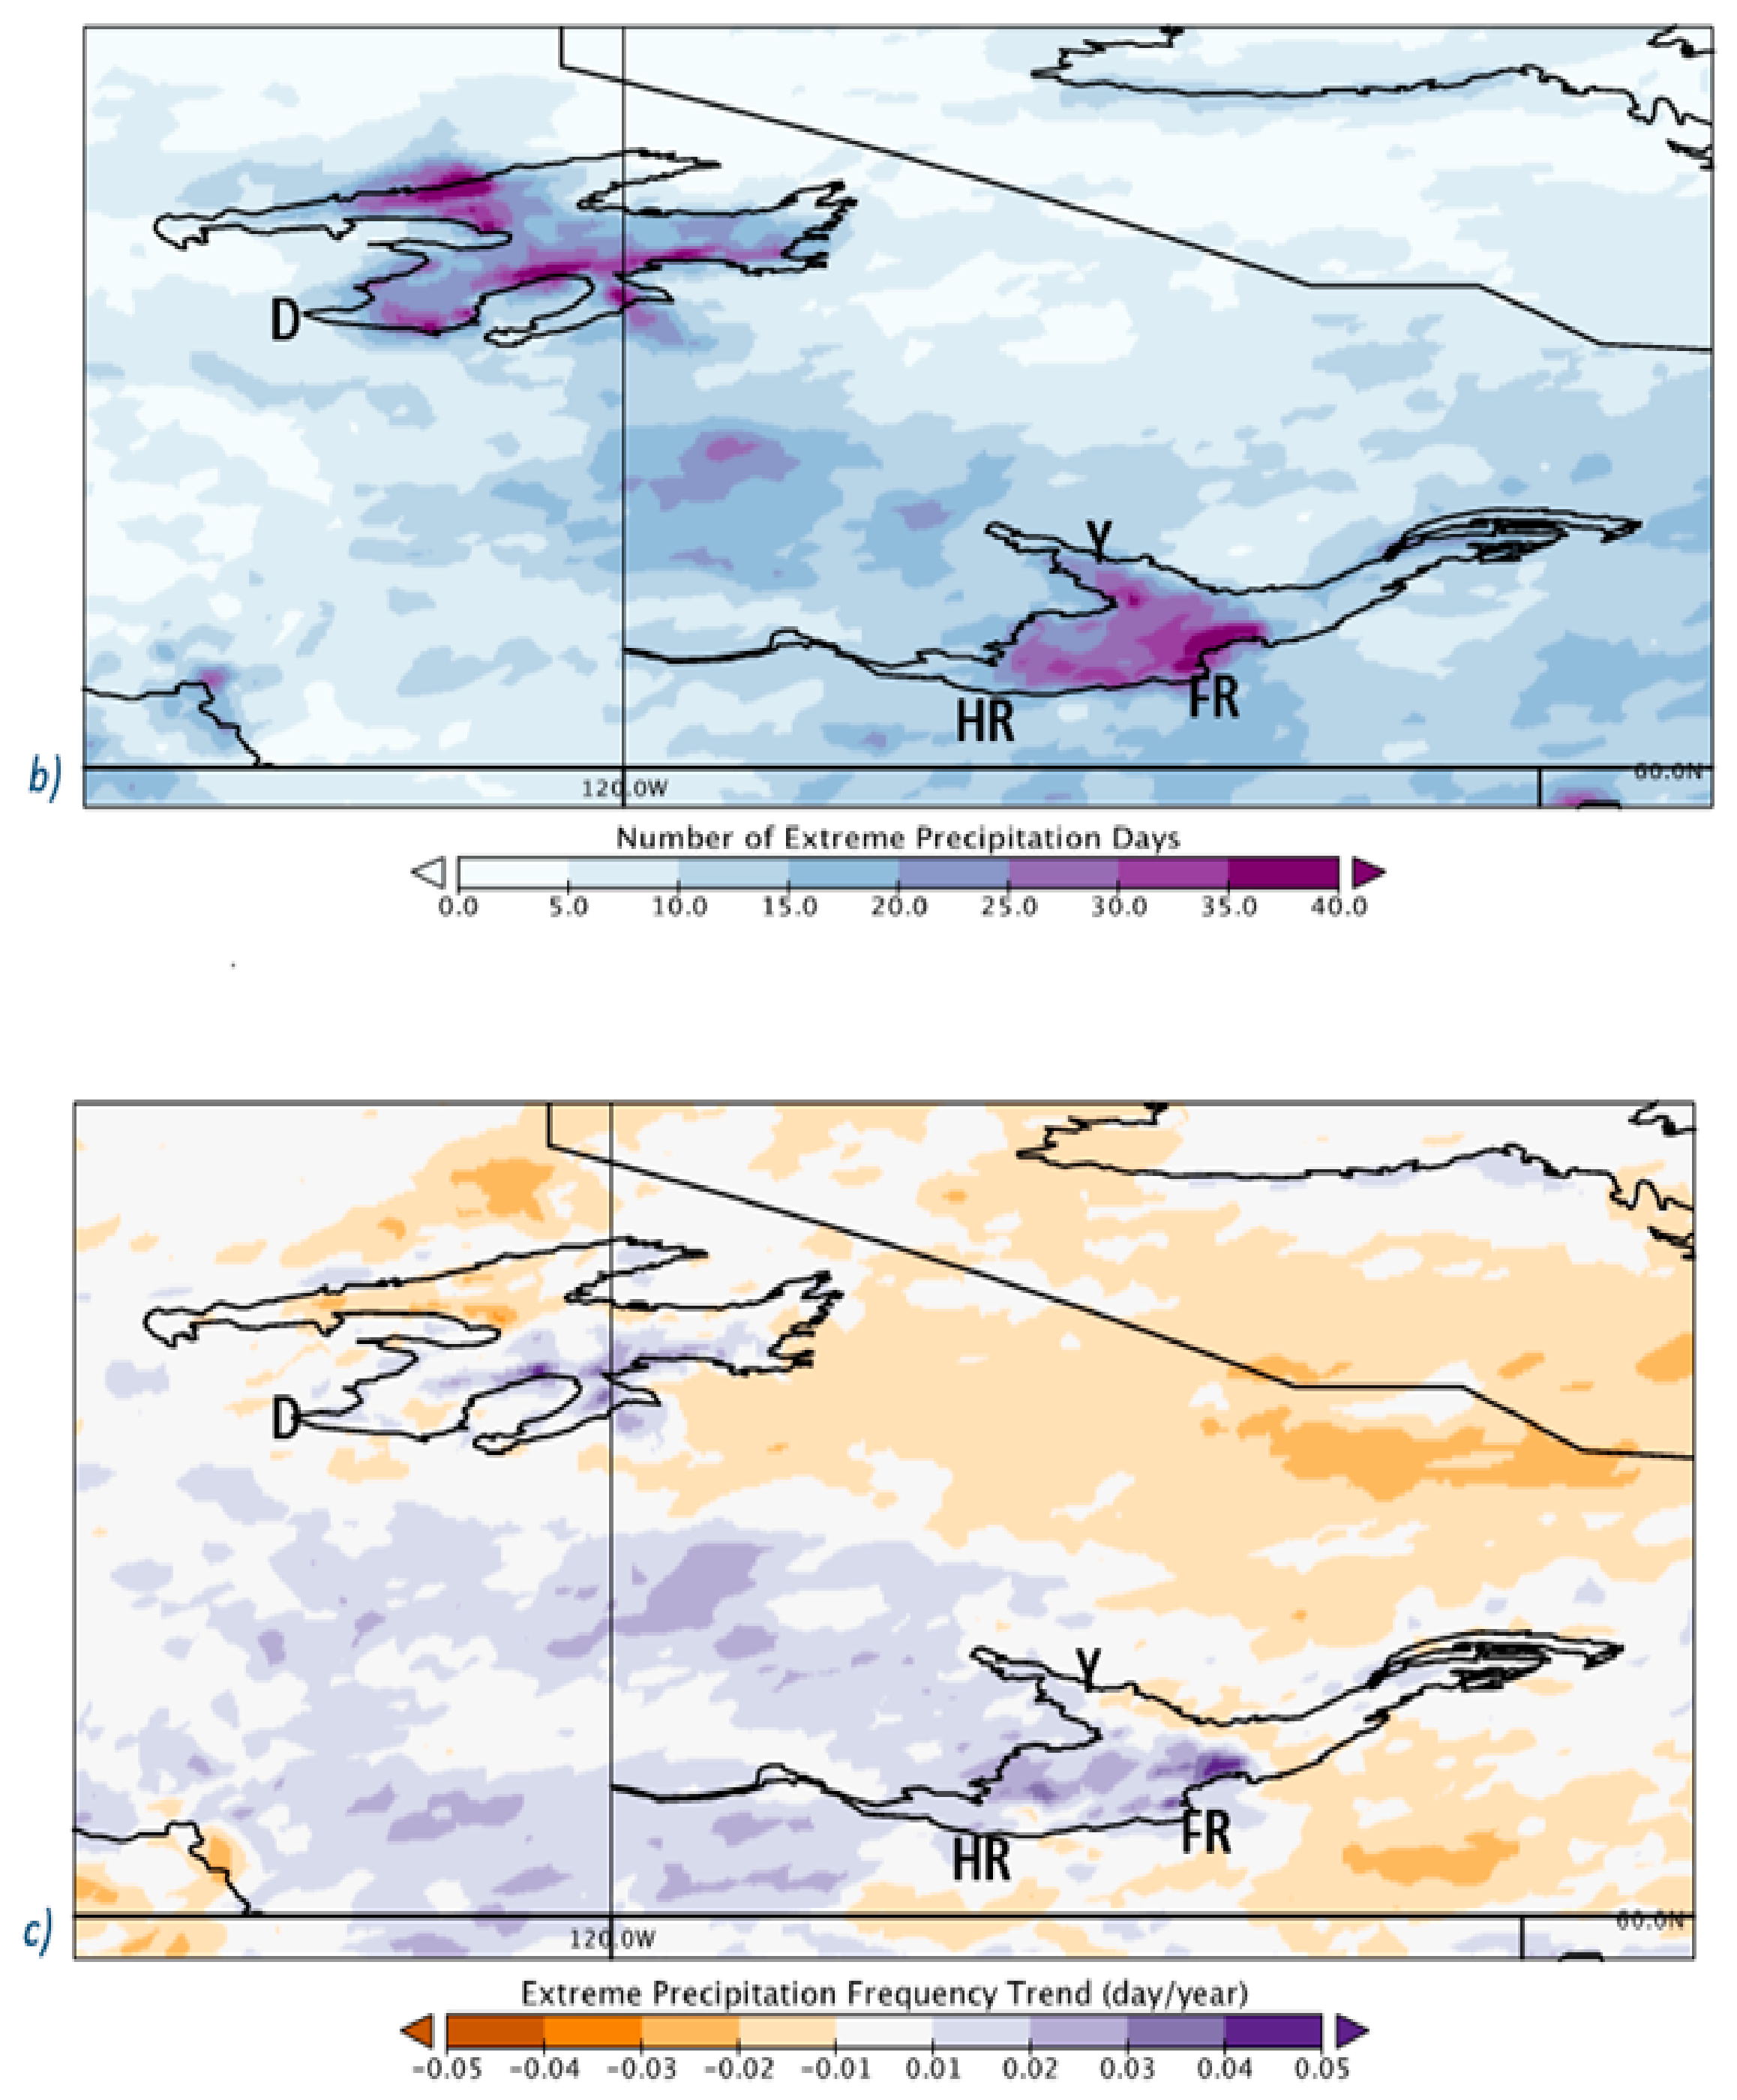
The major component, entitled extremes, represents three subcomponents (extreme precipitation intensity, frequency of extreme precipitation, and trend in extreme precipitation days). These subcomponents are computed by analyzing daily total precipitation (mm/day) for November over the 1980 to 2014 period, using outputs from the GEM_CLIM simulation driven by ERA Interim.
The extreme precipitation intensity (mm/day) represents how intense the extreme November precipitation has been over the past 35 years. It was calculated by computing the 99th percentile of daily November total precipitation for the 1980–2014 period. The frequency of extreme precipitation days represents how often daily precipitation events have been occurring for each community over the total 1980 to 2014 period. It was calculated by filtering all total precipitation days that equaled or exceeded a threshold value of 8 mm/day. (To understand how this threshold was determined, please refer to the derivation steps in the Appendix A.) The trend in extreme precipitation days (day/year) indicates the rate at which extreme precipitation days are changing over the 35-year period. It was determined by computing a linear regression over the number of extreme precipitation days over the 35-year period. Refer to Table A2 for all the major components, subcomponents, indicator variables, and their respective contributions used in calculating the exposure contributing factor.
2.5. Sensitivity
Sensitivity represents the degree to which a system (community) may be affected by the exposure [22,42]. In this study, sensitivity comprises three major components (demographic, labor, and health). These major components are further broken into subcomponents. For example, subcomponents that fall under demographic include family and households with the percentage of lone parents, population dependency ratio of people older than 60 years, and population density per square kilometer. The sensitivity contributing factor reflects that communities most dependent on natural resources, mainly those connected with the lakes such as fishing or trapping, will exhibit a higher sensitivity to snowstorms driven in part by large lakes. Refer to Table A2 of Appendix A for details on each subcomponent that falls under sensitivity.
2.6. Adaptive Capacity
Adaptive capacity is the ability of a community to withstand or recover from the exposure. Adaptive capacity is identified as a function of five types of capital: physical, natural, human, financial, and social capital [43,44]. Physical capital, or produced capital, refers to goods that provide benefits to their owners by helping to produce other goods and services; examples include equipment, buildings, machinery, and infrastructure. Natural capital refers to both cost and cost-free environmental stocks and systems that provide the people of that community with natural material and services for sustaining their economic activity; examples of natural capital include natural resources, land, and ecosystems. Human capital refers to the knowledge, skills, competencies, and other similar attributes that are embodied by individuals and result in the creation of personal, social, and economic well-being. Financial capital corresponds to funding, such as money and credit that build wealth. Finally, social capital refers to the relationship, networks, and norms that facilitate collective action; examples include both formal and informal institutional arrangements, as suggested by the National Round Table from 2003.
In this study, physical capital has three subcomponents, which are transportation, communication, and housing. Indicators under transportation include transportation to work by car or truck and transportation to work by public transit. Human capital has one subcomponent, education. Education has indicators including percentage of people who attained post-secondary degrees, apprentice or trade certificates, or natural resources and conservation degrees. For more details on each major component of human, physical, financial, social, and natural capital, along with their respective subcomponents, indicator variables, and relative contribution to the framework, please refer to Table A2 in Appendix A.
2.7. Index Calculation
To calculate the LVI, first, each subcomponent will contribute equally to determining the major components. The major components will then be used to calculate each of the contributing factors. The contributing factors will then be used to calculate the LVI for each community [14,22,45]. Each subcomponent may be measured on different scales or units. Therefore, the first step is to standardize each indicator corresponding to each subcomponent (Equation (2)).
Indexiv is the indicator of the vth community, and Smax and Smin are the maximum and minimum value of the indicator for all communities in this study. After the standardization is computed for each indicator at each community, the major components can be calculated, following Equation (3).
The average of all indicators within a major component are calculated. Mv is the major component average; Indexsvi is the indicator value pertaining to each subcomponent of the vth community; and n is the number of indicators that comprise the major component. Subsequently, each contributing factor (E, S, and AC), denoted as CFv, is calculated by using a balanced weighted average approach of each major component (Equation (4)).
Thus, E, S, and AC, for each community, are determined from Equation (4). These major contributing factors comprise major component, Mv, which are each multiplied by the weight of the corresponding major components (W). Note that W is the number of indicators in each major component and is equivalent to “n”. The contributing factors can now be implemented in Equation (1) to determine the LVI for each community. Following the work by [14,22,45], the balanced weight approach is applied, giving all indicators the same degree of influence when calculating the contributing factors, and ultimately, LVI. Finally, it is acknowledged that an arbitrary constant of 0.5 is added to each calculated LVI value in order to allow for positive values across all communities, making it easier for comparison. It does not interfere with the results since the same value is added to all the calculated LVI, and their relative comparison remains unchanged [14].
3. Results
3.1. Exposure
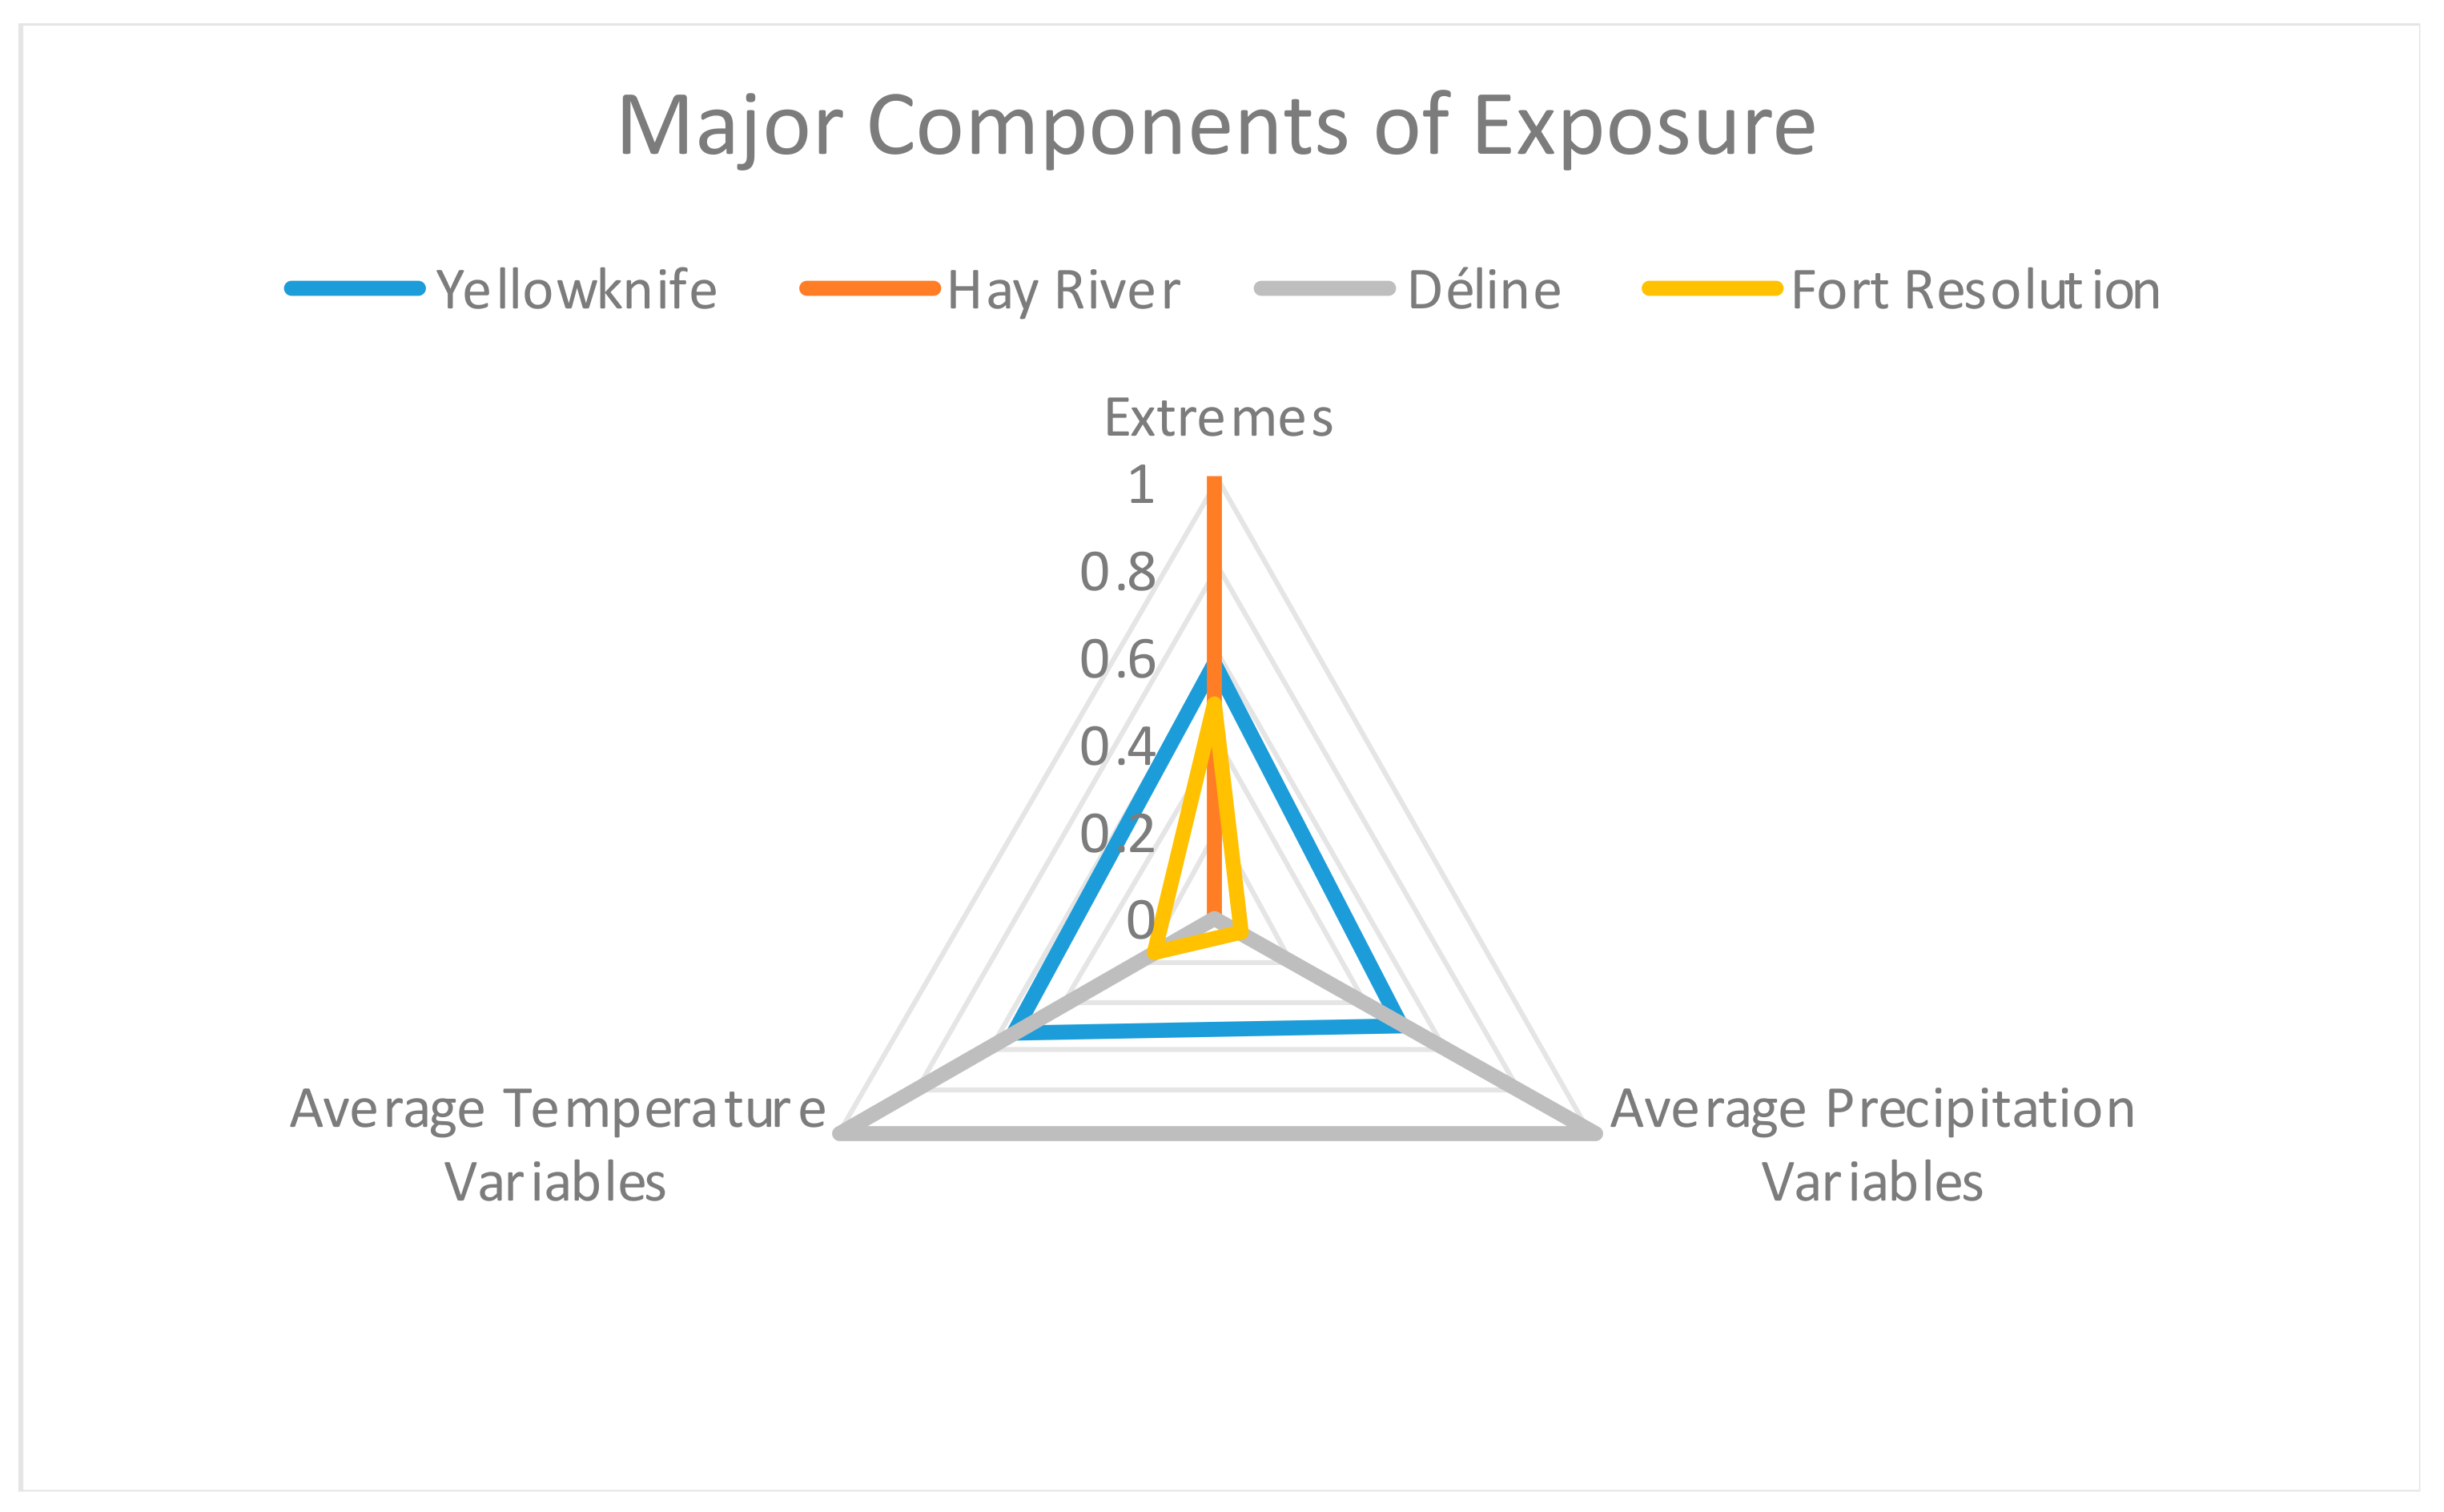
Exposure comprises three major components (extremes, average precipitation variables, and average temperature variables). To determine the exposures in extremes over the regions of interest, the three subcomponents of extremes (extreme precipitation intensity, frequency of extreme precipitation days, trend in extreme precipitation days) are plotted in Figure 2. The highest intensity, upwards of 10 mm/day, is especially noticeable over the two Great Lakes, as opposed to areas farther inland. Out of the four communities analyzed, Hay River experiences the highest intensity of extreme precipitation at 9.8 mm/day, while Déline experiences the least (7.3 mm/day) (Figure 2a). The frequency of extreme precipitation days is also predominant over the lakes, and Déline exhibits the least number of extreme days in comparison to the other communities (Figure 2b). Finally, the trends in extreme precipitation days have been increasing for three out of the four communities, with Hay River showing the greatest increase. In contrast, Déline indicates a decrease in extreme precipitation frequency (Figure 2c). The subcomponents of the extremes reiterate that communities along the shores of these massive freshwater lakes are more susceptible and exposed to more extreme cold season precipitation intensity than communities farther inland to the lakes. However, relative to the other communities, Déline exhibits the least exposure to extreme precipitation events, while Hay River experiences the greatest (Figure 3). This can be understood since Déline is located near Great Bear Lake, which is farther north and is covered by more ice in late November, thereby reducing the development of lake effect snowfall in comparison to that of Great Slave Lake.
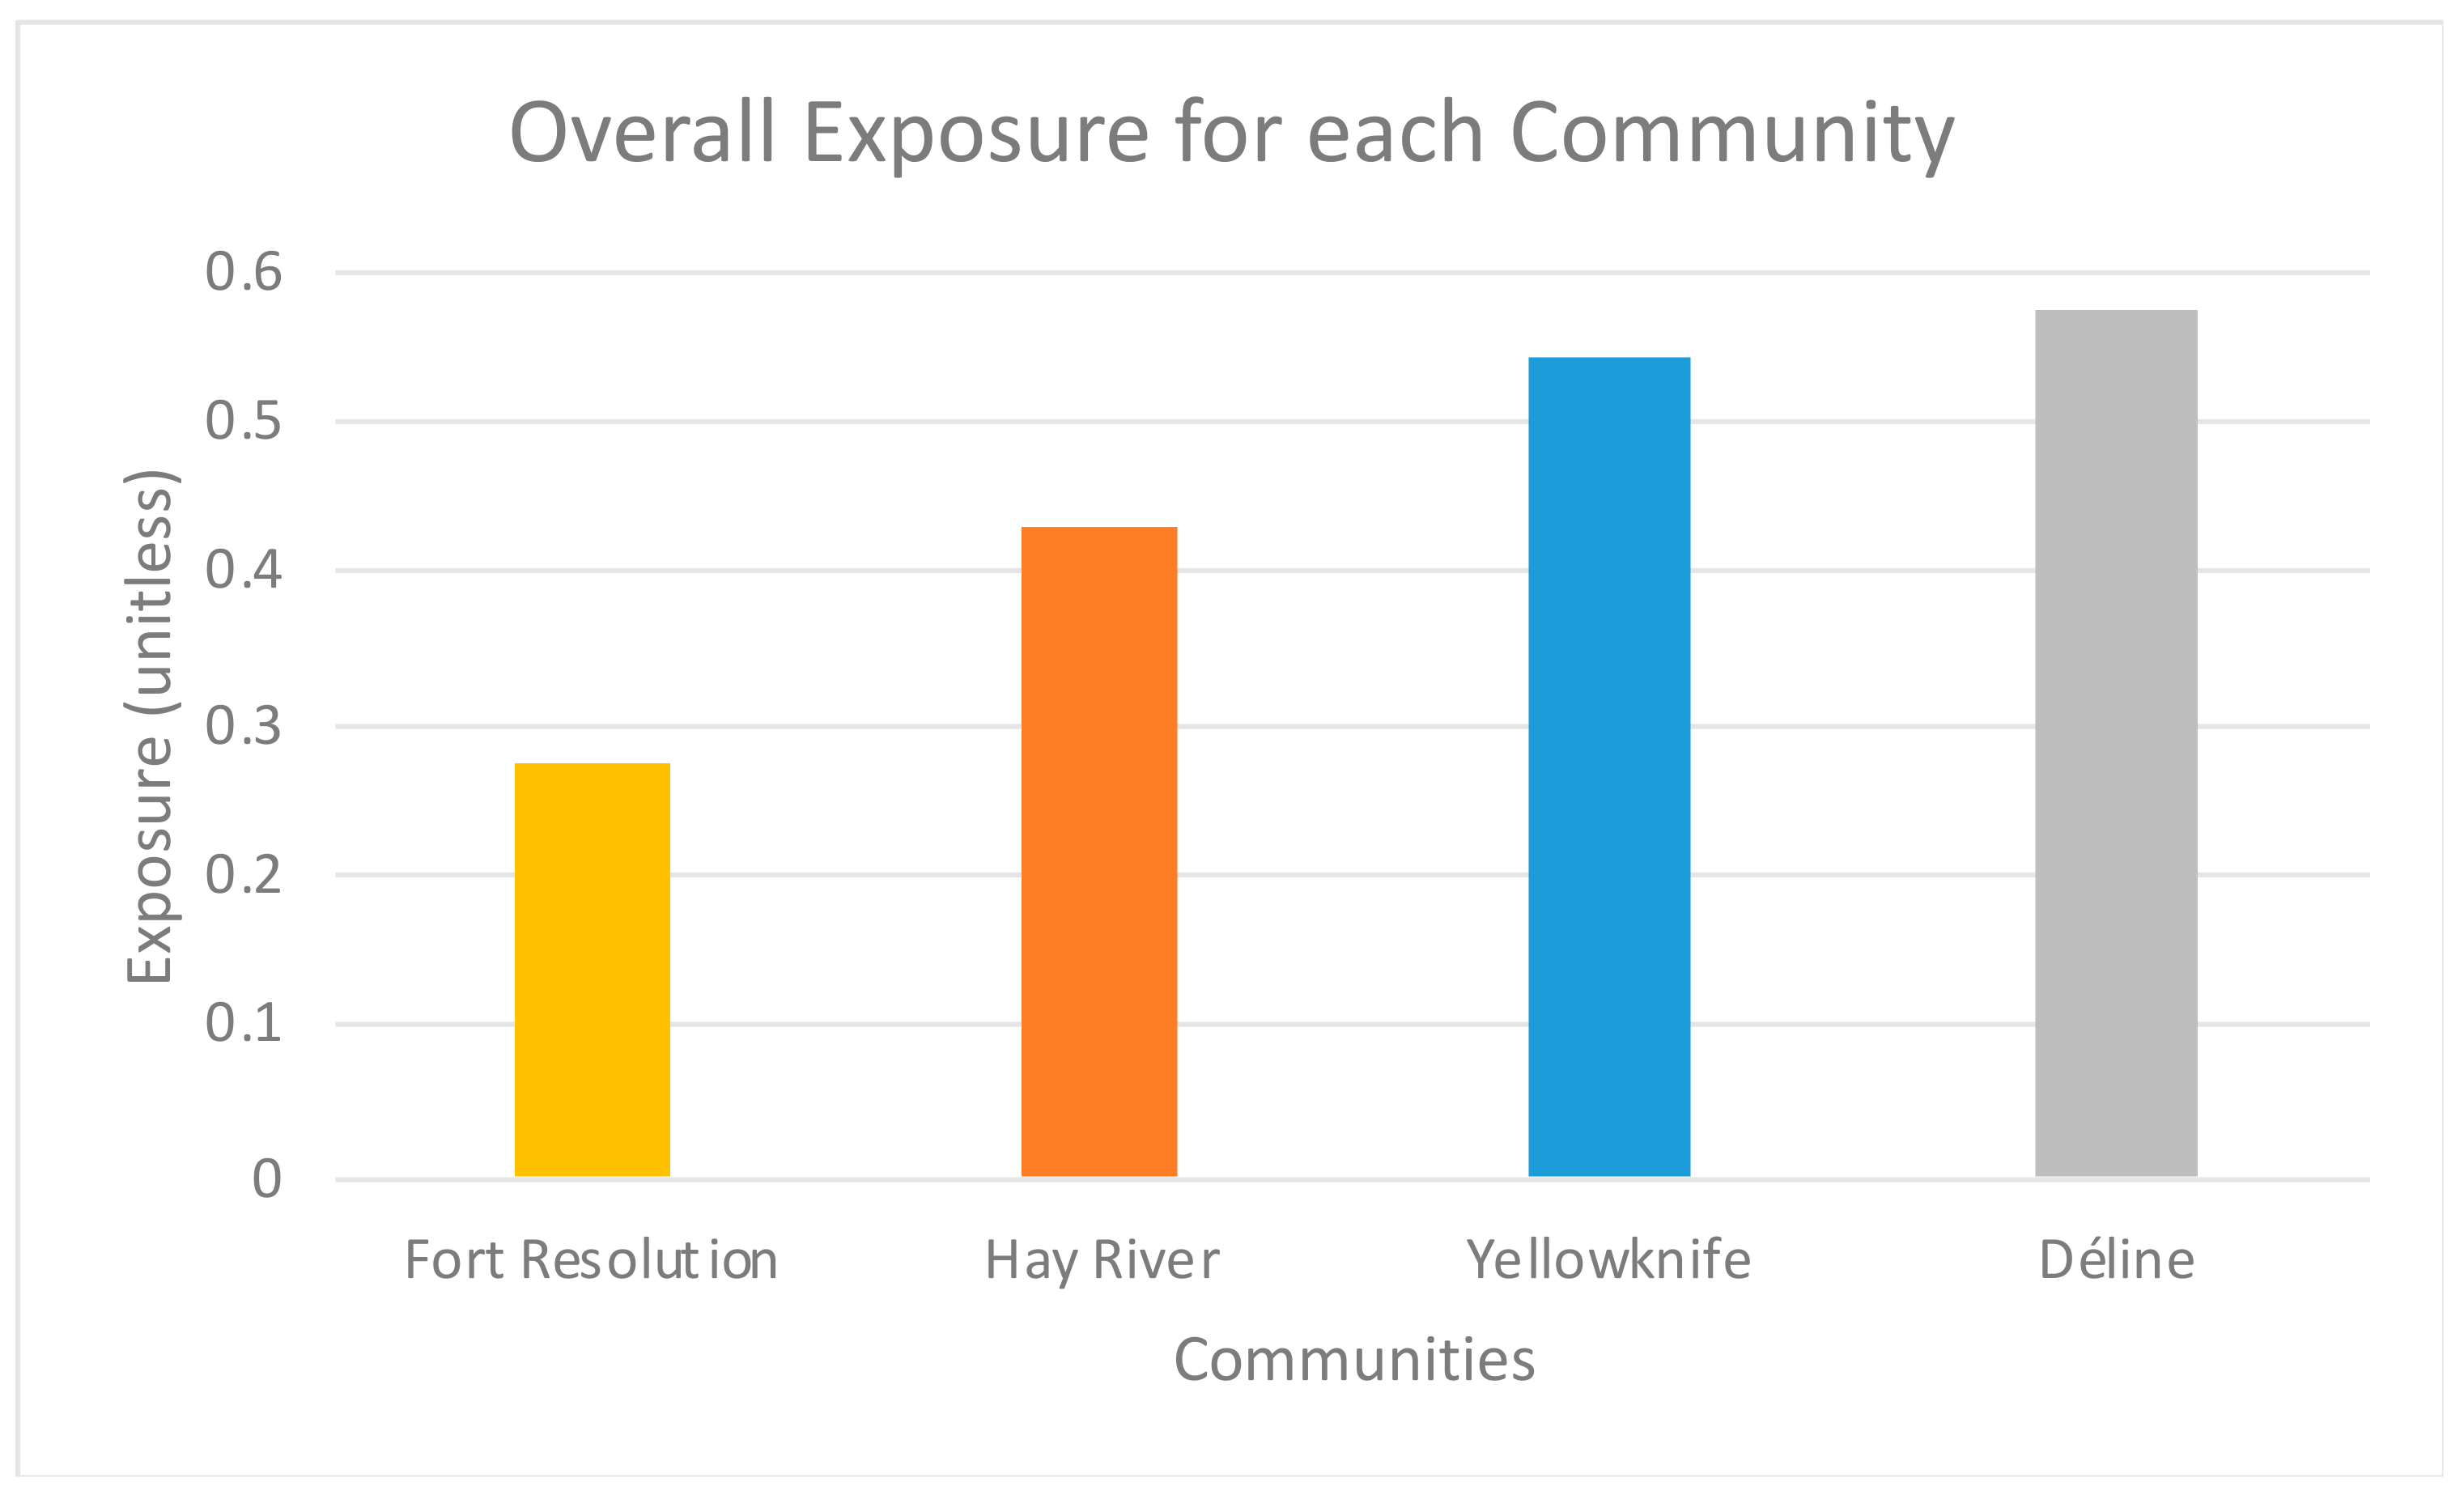
However, while Déline experiences the least exposure to extremes, it experiences colder temperatures and greater precipitation than the other communities. Fort Resolution seems to have the least exposure for all the major components, and Yellowknife experiences similar exposures for all three major components (Figure 4). When calculating the overall exposure, Déline, therefore, has the greatest exposure to snowstorms, followed by Yellowknife, Hay River, and then Fort Resolution, as expected from the breakdown of the major components seen in Figure 3.
3.2. Sensitivity
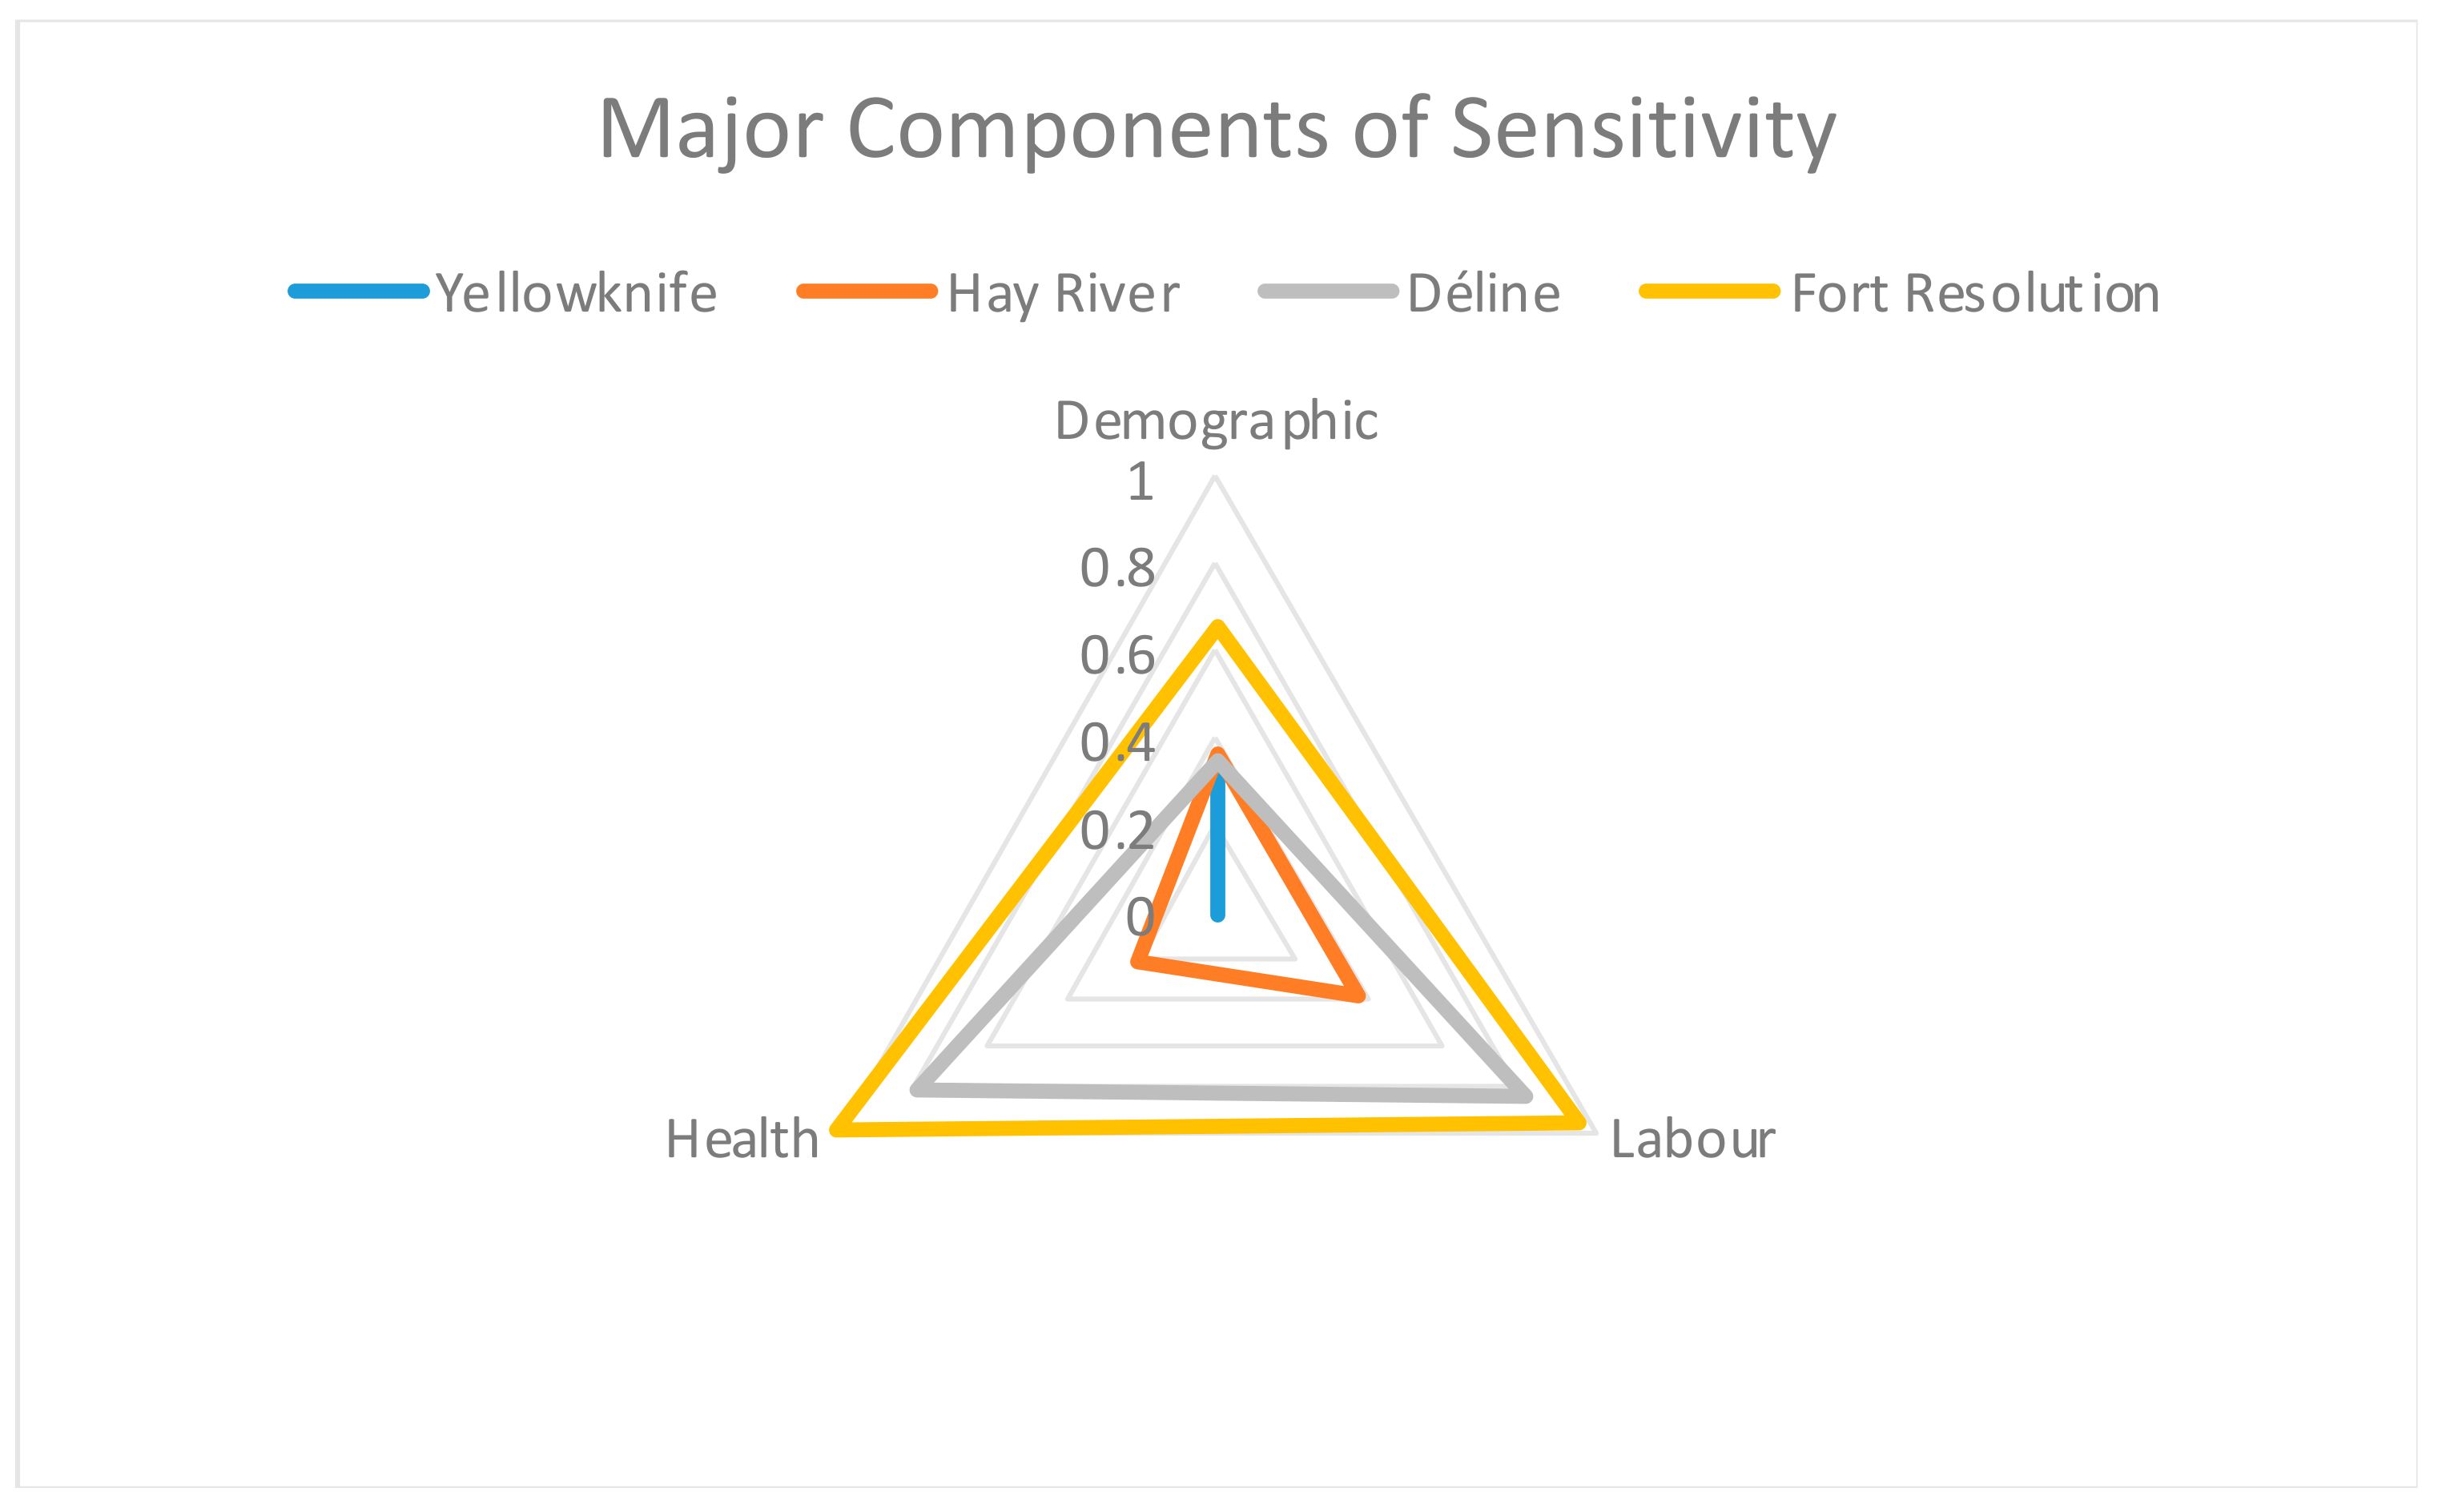
The three major components in sensitivity are demographic, labor, and health. Fort Resolution exhibits the greatest sensitivity for all three major components (Figure 5). This is because under demographic, its population comprises people with high dependencies, such as high teen birth rates and persons over the age of 60. Under labor, Fort Resolution has the greatest commuting duration to work. Commuting long distances to work can be a safety issue during heavy snowstorm events because lake effect snowfall, for example, can form highly localized snow squalls that produce poor visibility and near white-out conditions for motorists. In addition, traditional activities, such as hunting, fishing, and trapping are also more common in Fort Resolution, making them more dependent on the lakes for their livelihood activities.
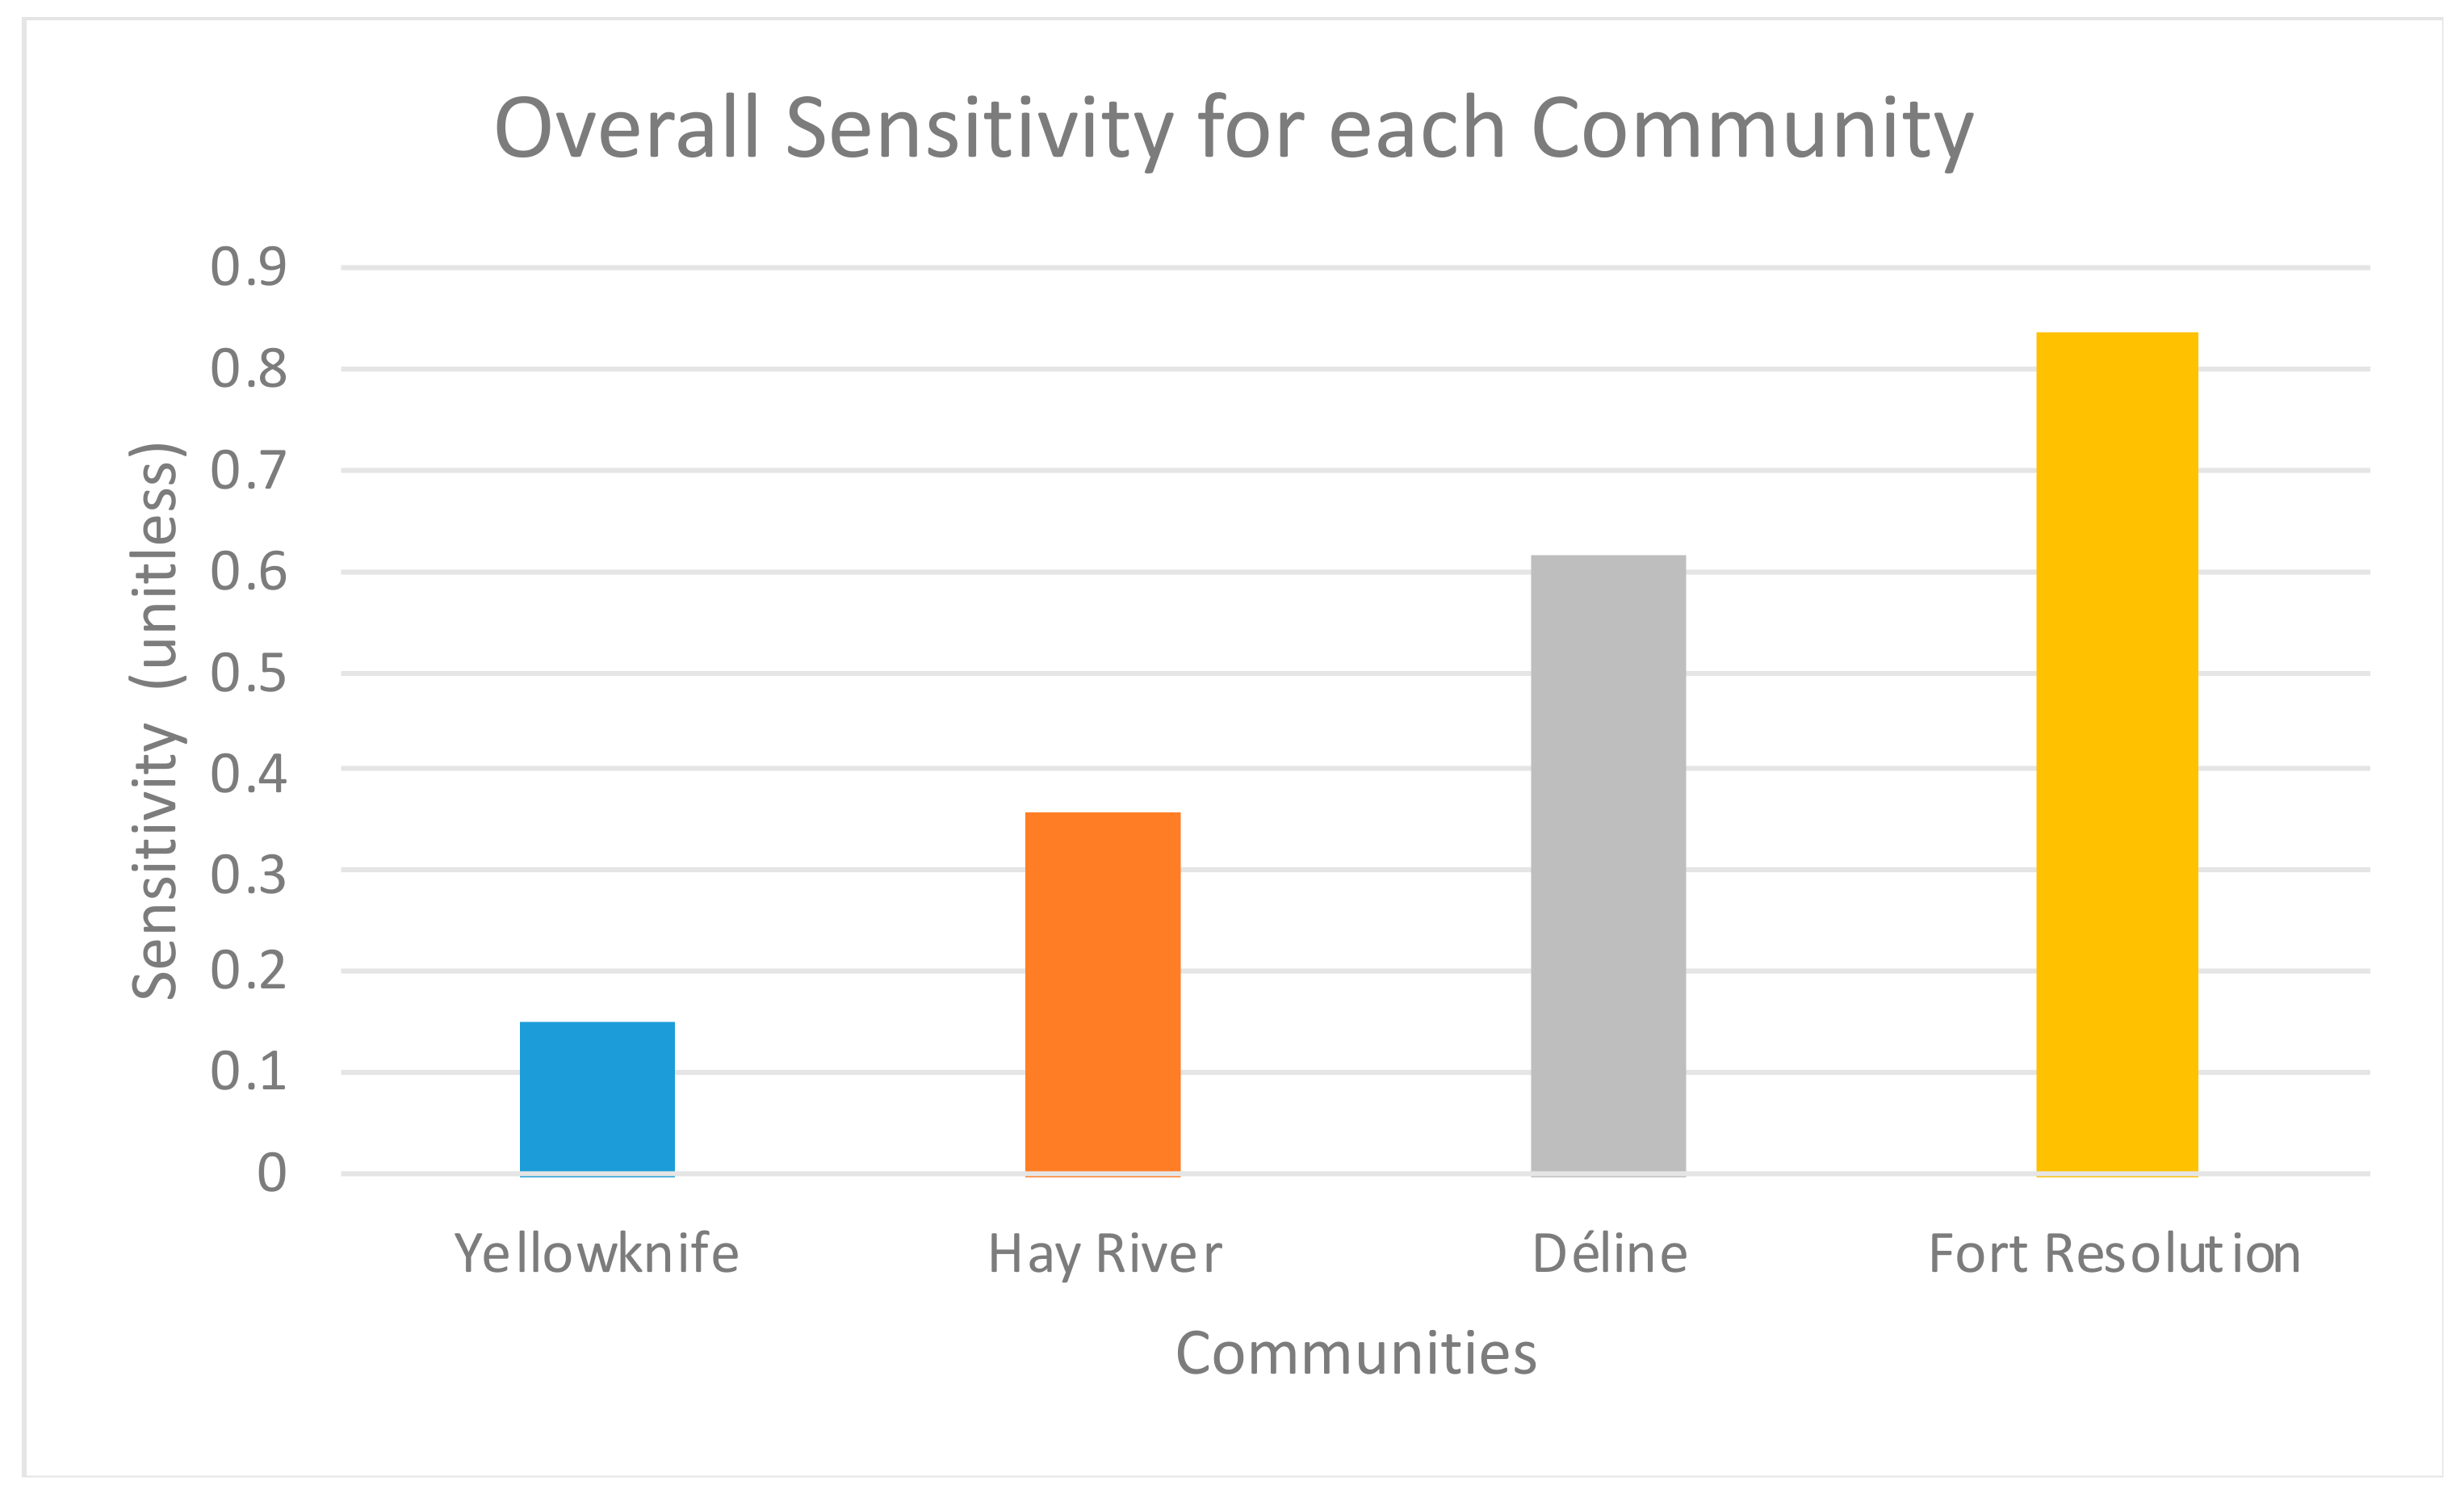
Calculating the overall sensitivity from its three contributing factors shows that Fort Resolution is the most sensitive, followed by Déline, Hay River, and Yellowknife (Figure 6). Yellowknife shows the least sensitivity and is primarily driven by the fact that its sensitivity to labor and health are negligible when compared to the other communities. However, communities such as Fort Resolution and Déline show a greater sensitivity to health factors. Health is taken into consideration because exposure to heavy snowfall may make communities more vulnerable to health complications, such as myocardial infarctions [11]. These risks can be caused by snow-related activities such as shoveling, resulting in severe exertion to the cardiovascular system. Therefore, heavy snowfall activity can exacerbate health risks, making unhealthy communities potentially more vulnerable to snowstorms.
Déline and Fort Resolution are also more sensitive to traditional lake-dependent activities in comparison to the other communities. These activities can be affected by heavy lake effect snowstorms that can present hazardous blizzard-like conditions, hampering and endangering those who are hunting. For example, the promotion of lake effect snowfall is a result of decreasing ice cover and ice thickness, which are connected to reduced travel safety for hunters and fishermen when out on the ice. Furthermore, increased snowfall leads to additional runoff and excess flooding, which can lead to the unnatural and unpredictable mortality of beavers, which are otherwise used for the fur trade. Winter water release by upstream dams for hydroelectric generation is in part responsible for drowning beavers in their lodges in regions such as Fort Resolution and Yellowknife. Thus, the reduction of hunting and trapping opportunities due to heavy snowstorms in these regions limits both the income and traditional quality of food harvesting and increases sensitivity for communities such as Fort Resolution [46].
3.3. Adaptive Capacity
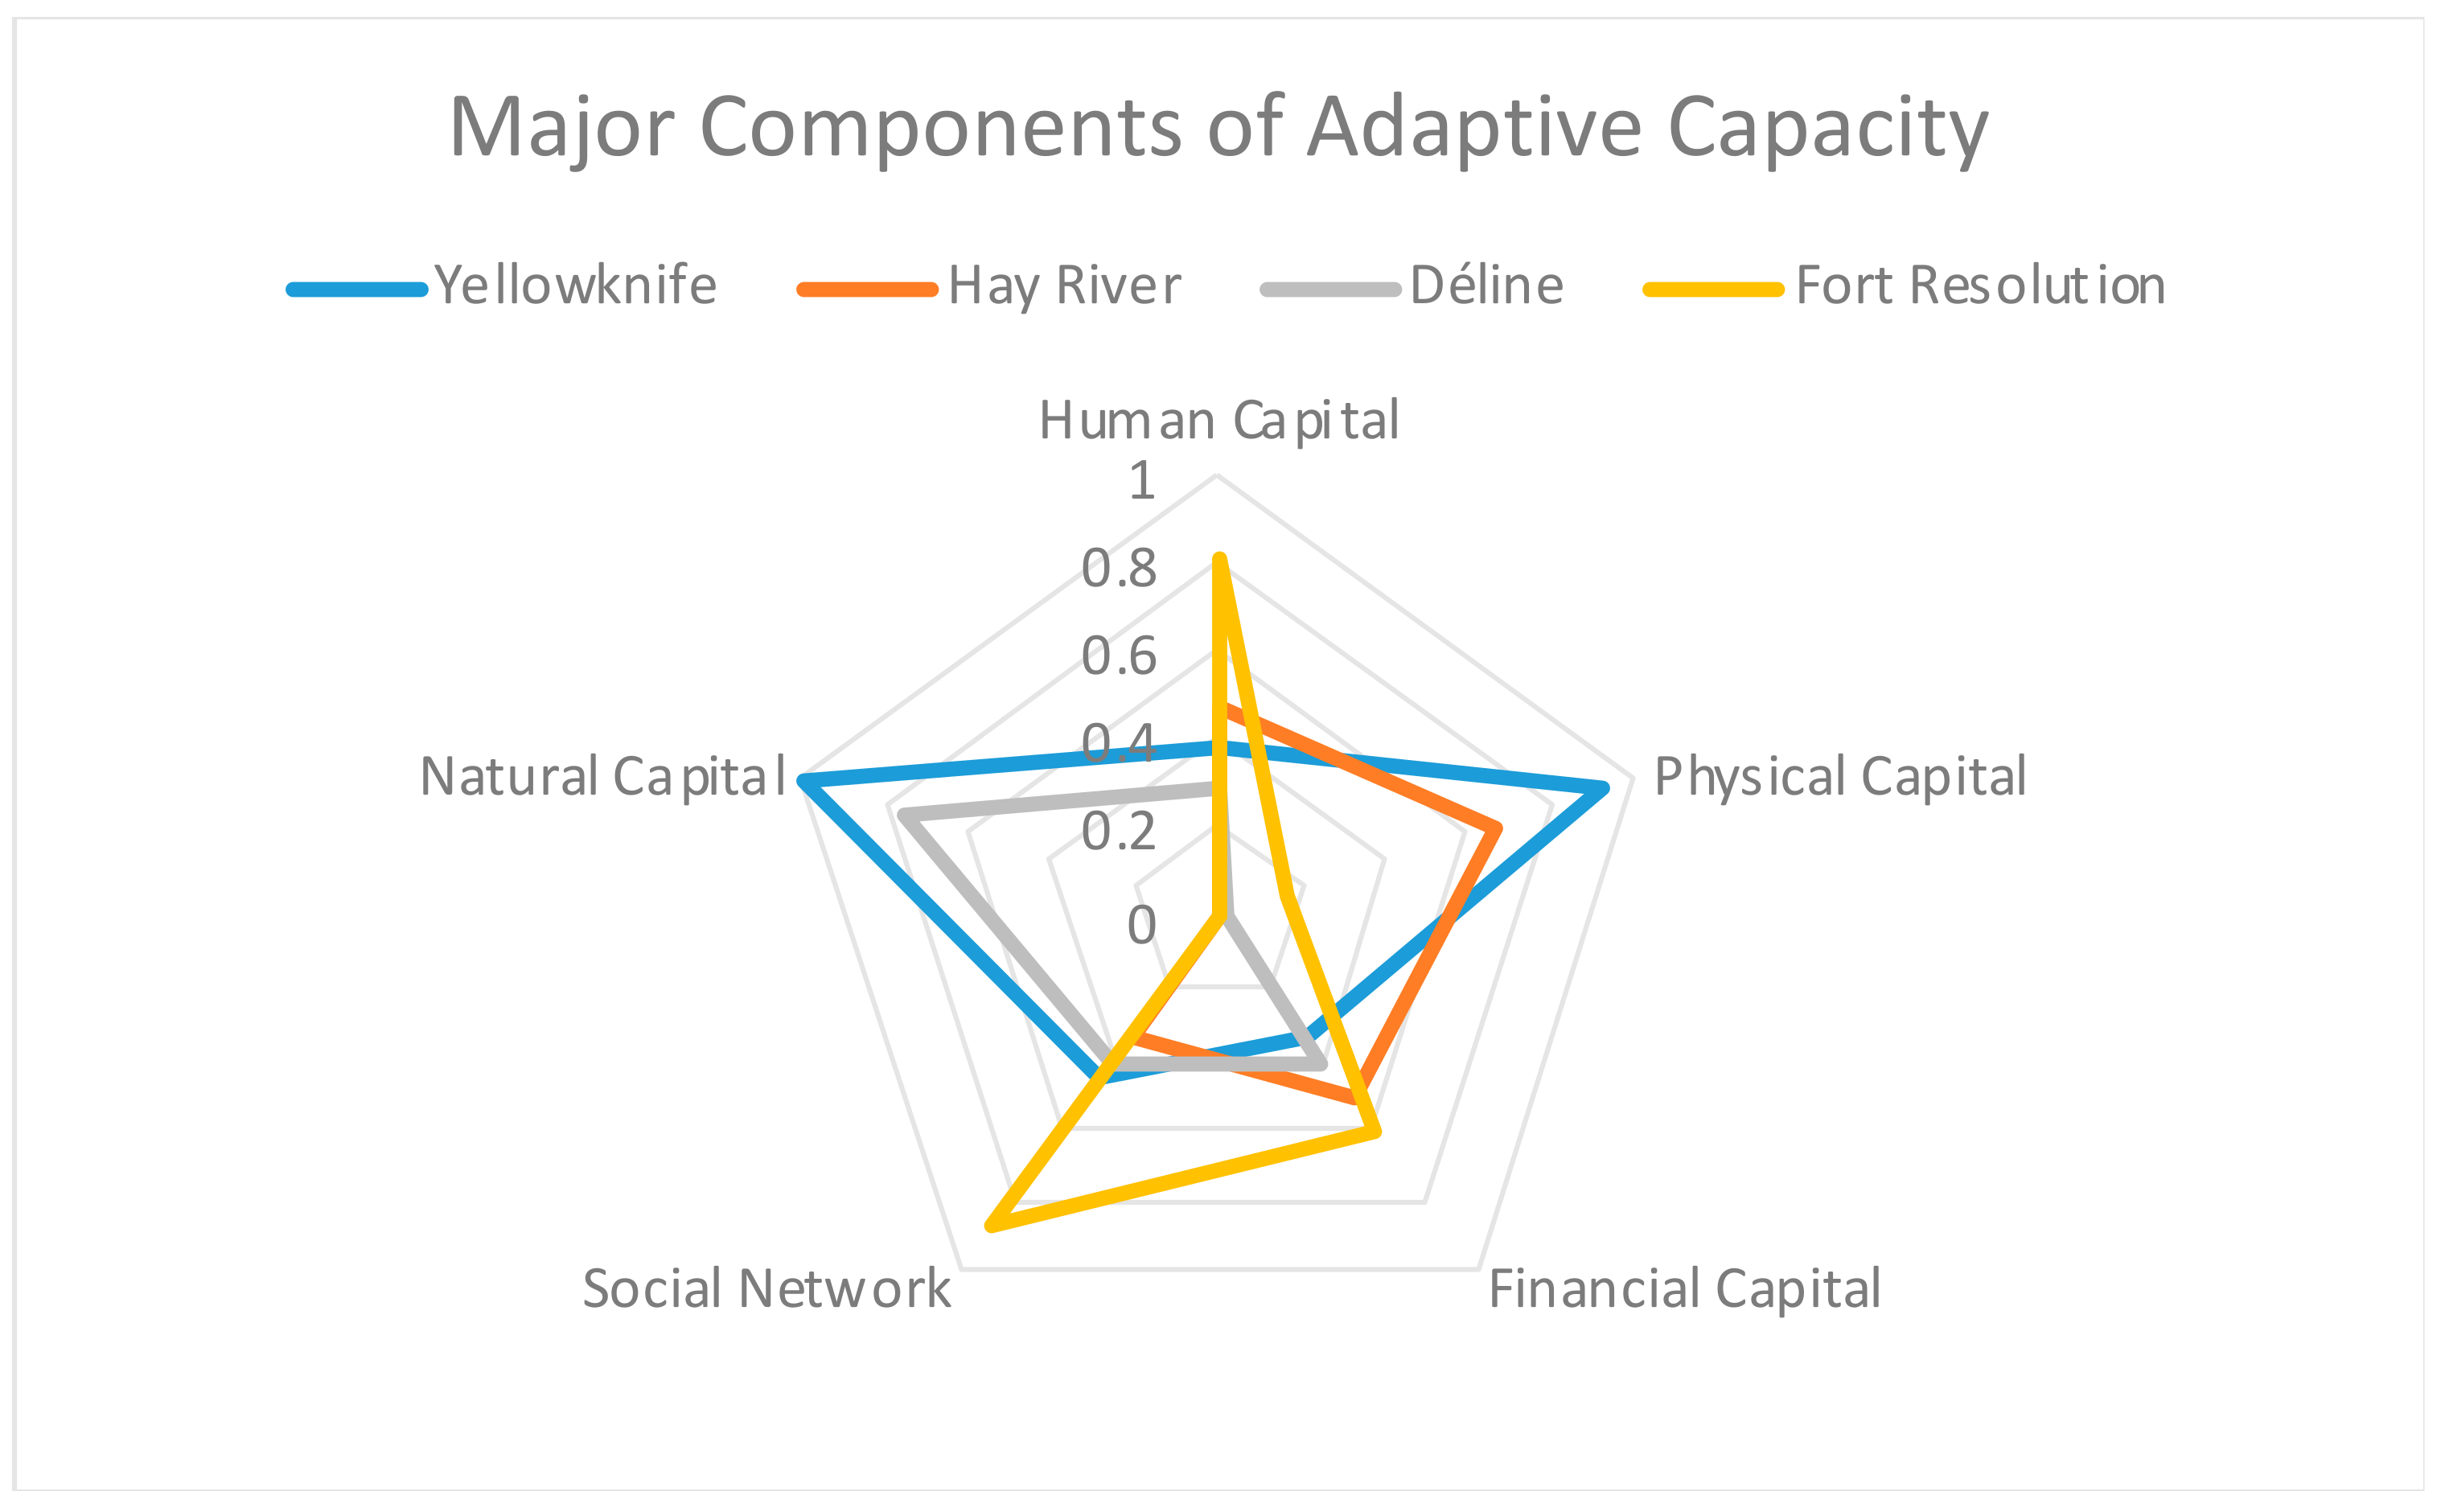
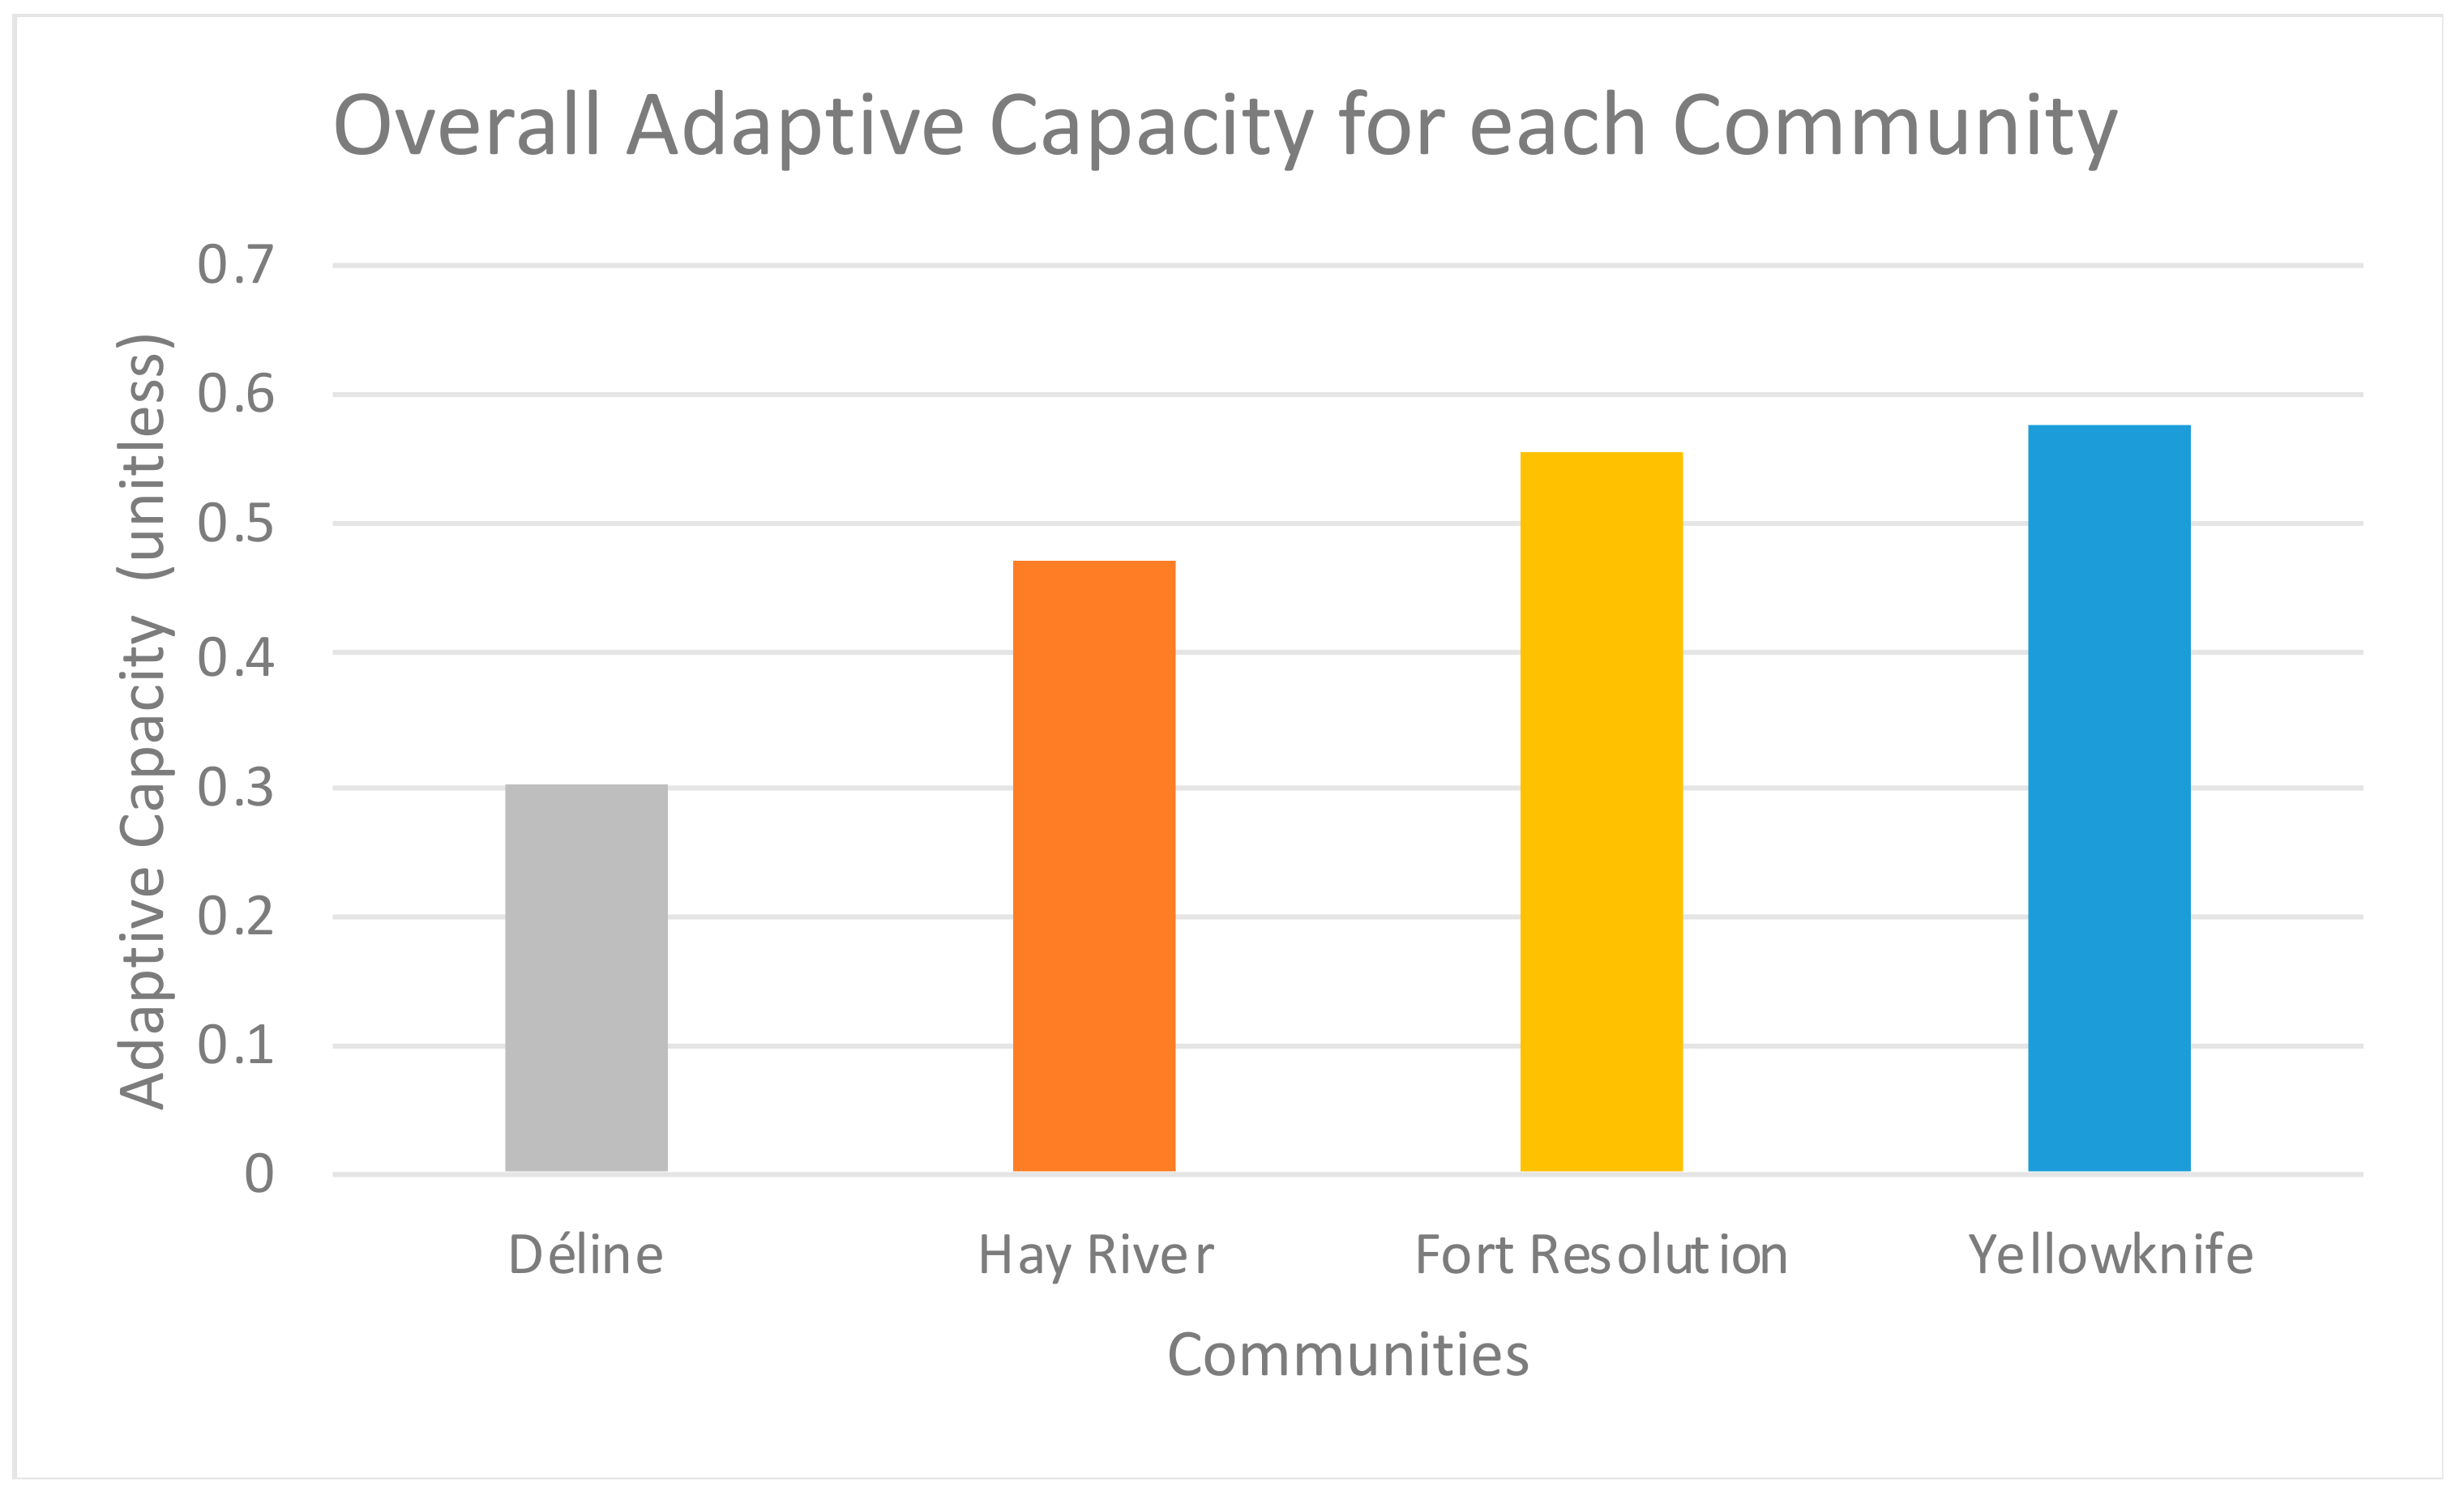
Adaptive capacity comprises five types of capital (human, physical, financial, social, and natural). Fort Resolution has the highest human capital, financial capital, and social network in comparison to the other communities. Yellowknife has the highest physical and natural capital. Déline has a relatively high natural capital but ranks lowest for human capital and physical capital (Figure 7). Déline has limited access to public transit, which can be helpful during heavy snowfall events. They also have relatively less access to communication via the internet, to keep them informed of any hazardous snowstorm conditions.
Physical capital, such as developed infrastructure or owning a home, can also be of concern during major snowstorms. Increased snowfall can affect infrastructure by destabilizing building foundations and by the addition of heavier snow loads. This is because increased snowfall accumulation can lead to additional spring run-off. The increase in groundwater carries heat content downwards, which enhances the degradation of permafrost, which is already melting from warmer air temperatures. As a result, permafrost degradation destabilizes building foundations. It is noted that many communities are already prone to flooding. A majority of the NWT population is located on a body of water in what are currently designated as flood risk areas. Hay River, for example, has been hit particularly hard with floods. [9] suggests the need for emergency planners across NWT to develop programs for watershed management, river/lake/ocean modelling/predictions, and monitoring and flood response. With rapid snowmelt and intense precipitation, the communities susceptible to flash floods need to improve their drainage infrastructure to protect vulnerable facilities.
Infrastructure damage, such as downed power lines from heavy snowstorms, can also severely impact communication. Many communication hubs are serviced by a single communication line in the southern NWT, and thus, failure to these lines due to destabilization of foundation or heavy snow load can be detrimental across many sectors. Critical infrastructure in the NWT can be impacted by extreme snowfall, leading to high construction and operating costs due to remoteness and extreme cold temperatures, rapid structural deterioration from extreme environments, high cost of reopening public services after short interruptions, lack of back-up services, and finances and human resource capacity limits [9].
Increased cold season precipitation can also produce financial burdens. Extreme snowstorms can lead to millions of dollars of lost or delayed revenue due to operation shutdowns and slow transportation of goods and services every year. The increase in snowstorm frequency has had an impact on roadway safety, with more snow removal required to accommodate safe travel and the transportations of goods [9,10]. Recent years have seen a rise in expenditure for snow removal, salt and sand usage on highways, and glycol for de-icing aircrafts. Increased snowfall has caused accessibility issues, such as hindering access to water and sewer service buildings. A rise in snowfall can lead to enhanced spring run-off, producing wash-out conditions and damaging supplies that have been delivered over the winter, thereby resulting in additional financial and environmental costs [20]. Uncertainties in the predictability of extreme snowfall also result in unexpected localized white-out snowfall conditions, which significantly reduce visibility and impact the safety of motorists and transportation workers. Thus, the ability for communities to withstand or cope with these critical issues during snowstorms indicates a high adaptive capacity to this exposure. When assessing the overall adaptive capacity from the five types of capital, Yellowknife ranks the highest, followed by Fort Resolution, Hay River, and Déline (Figure 8).
3.4. Livelihood Vulnerability Index
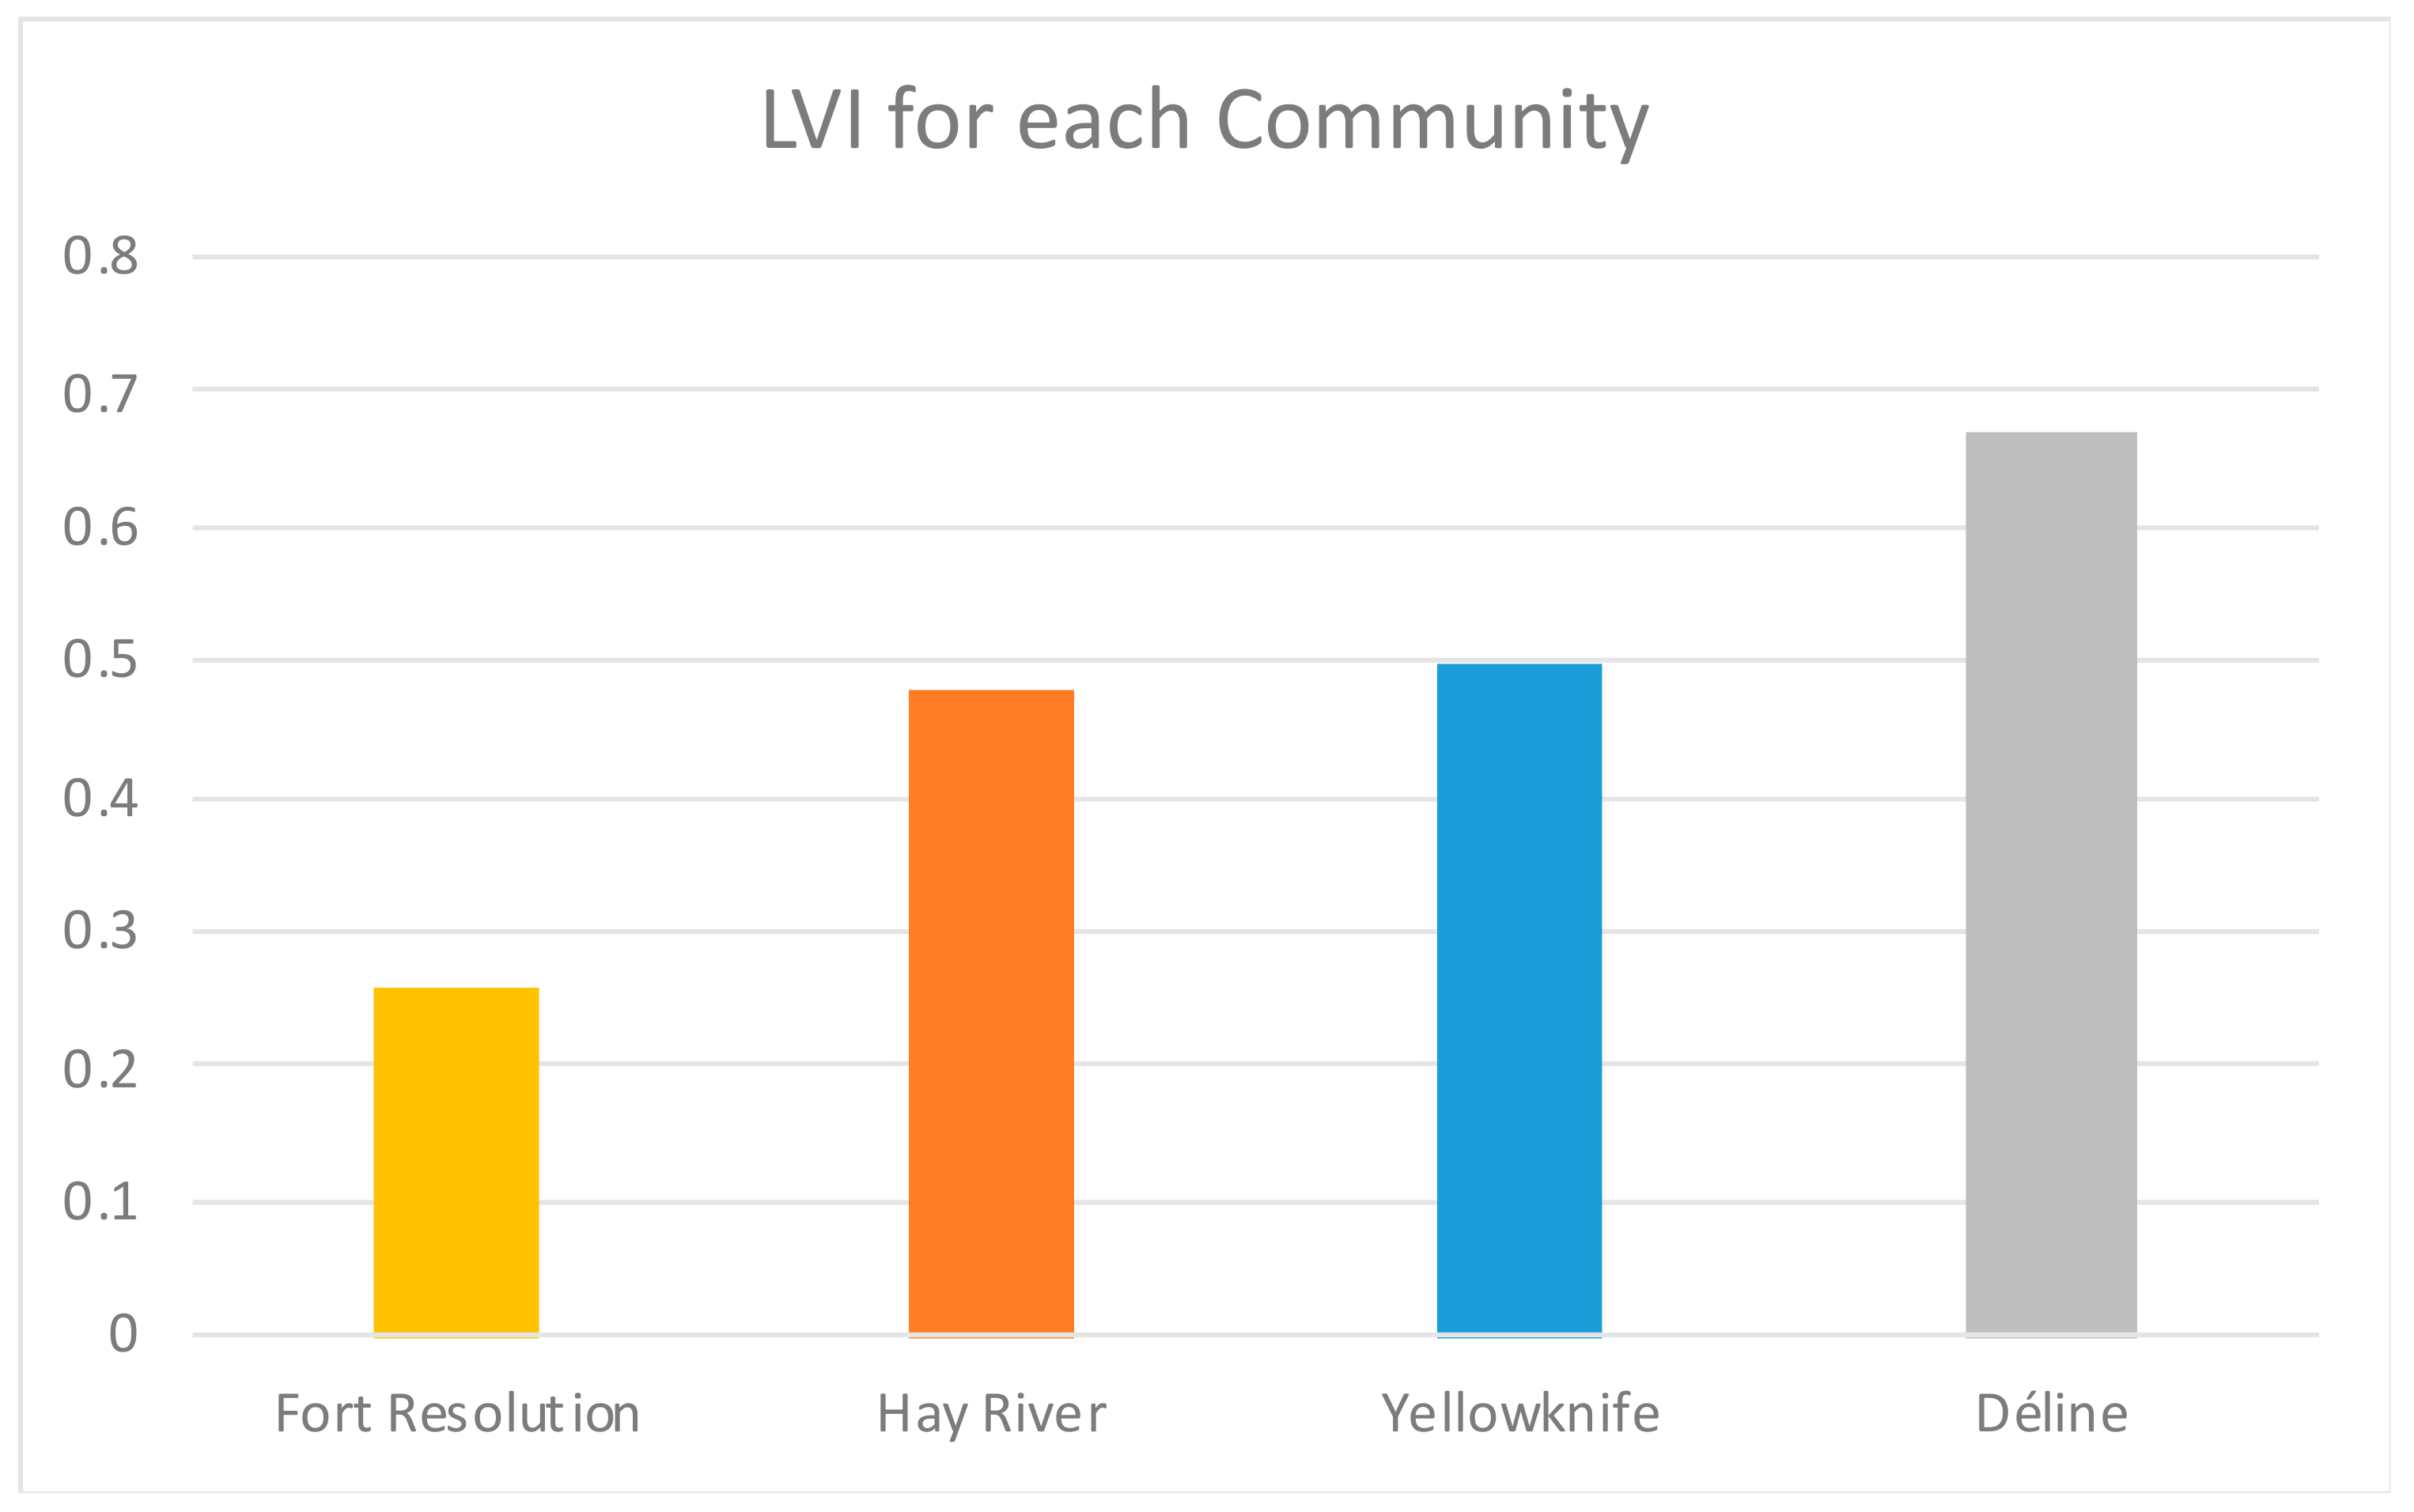
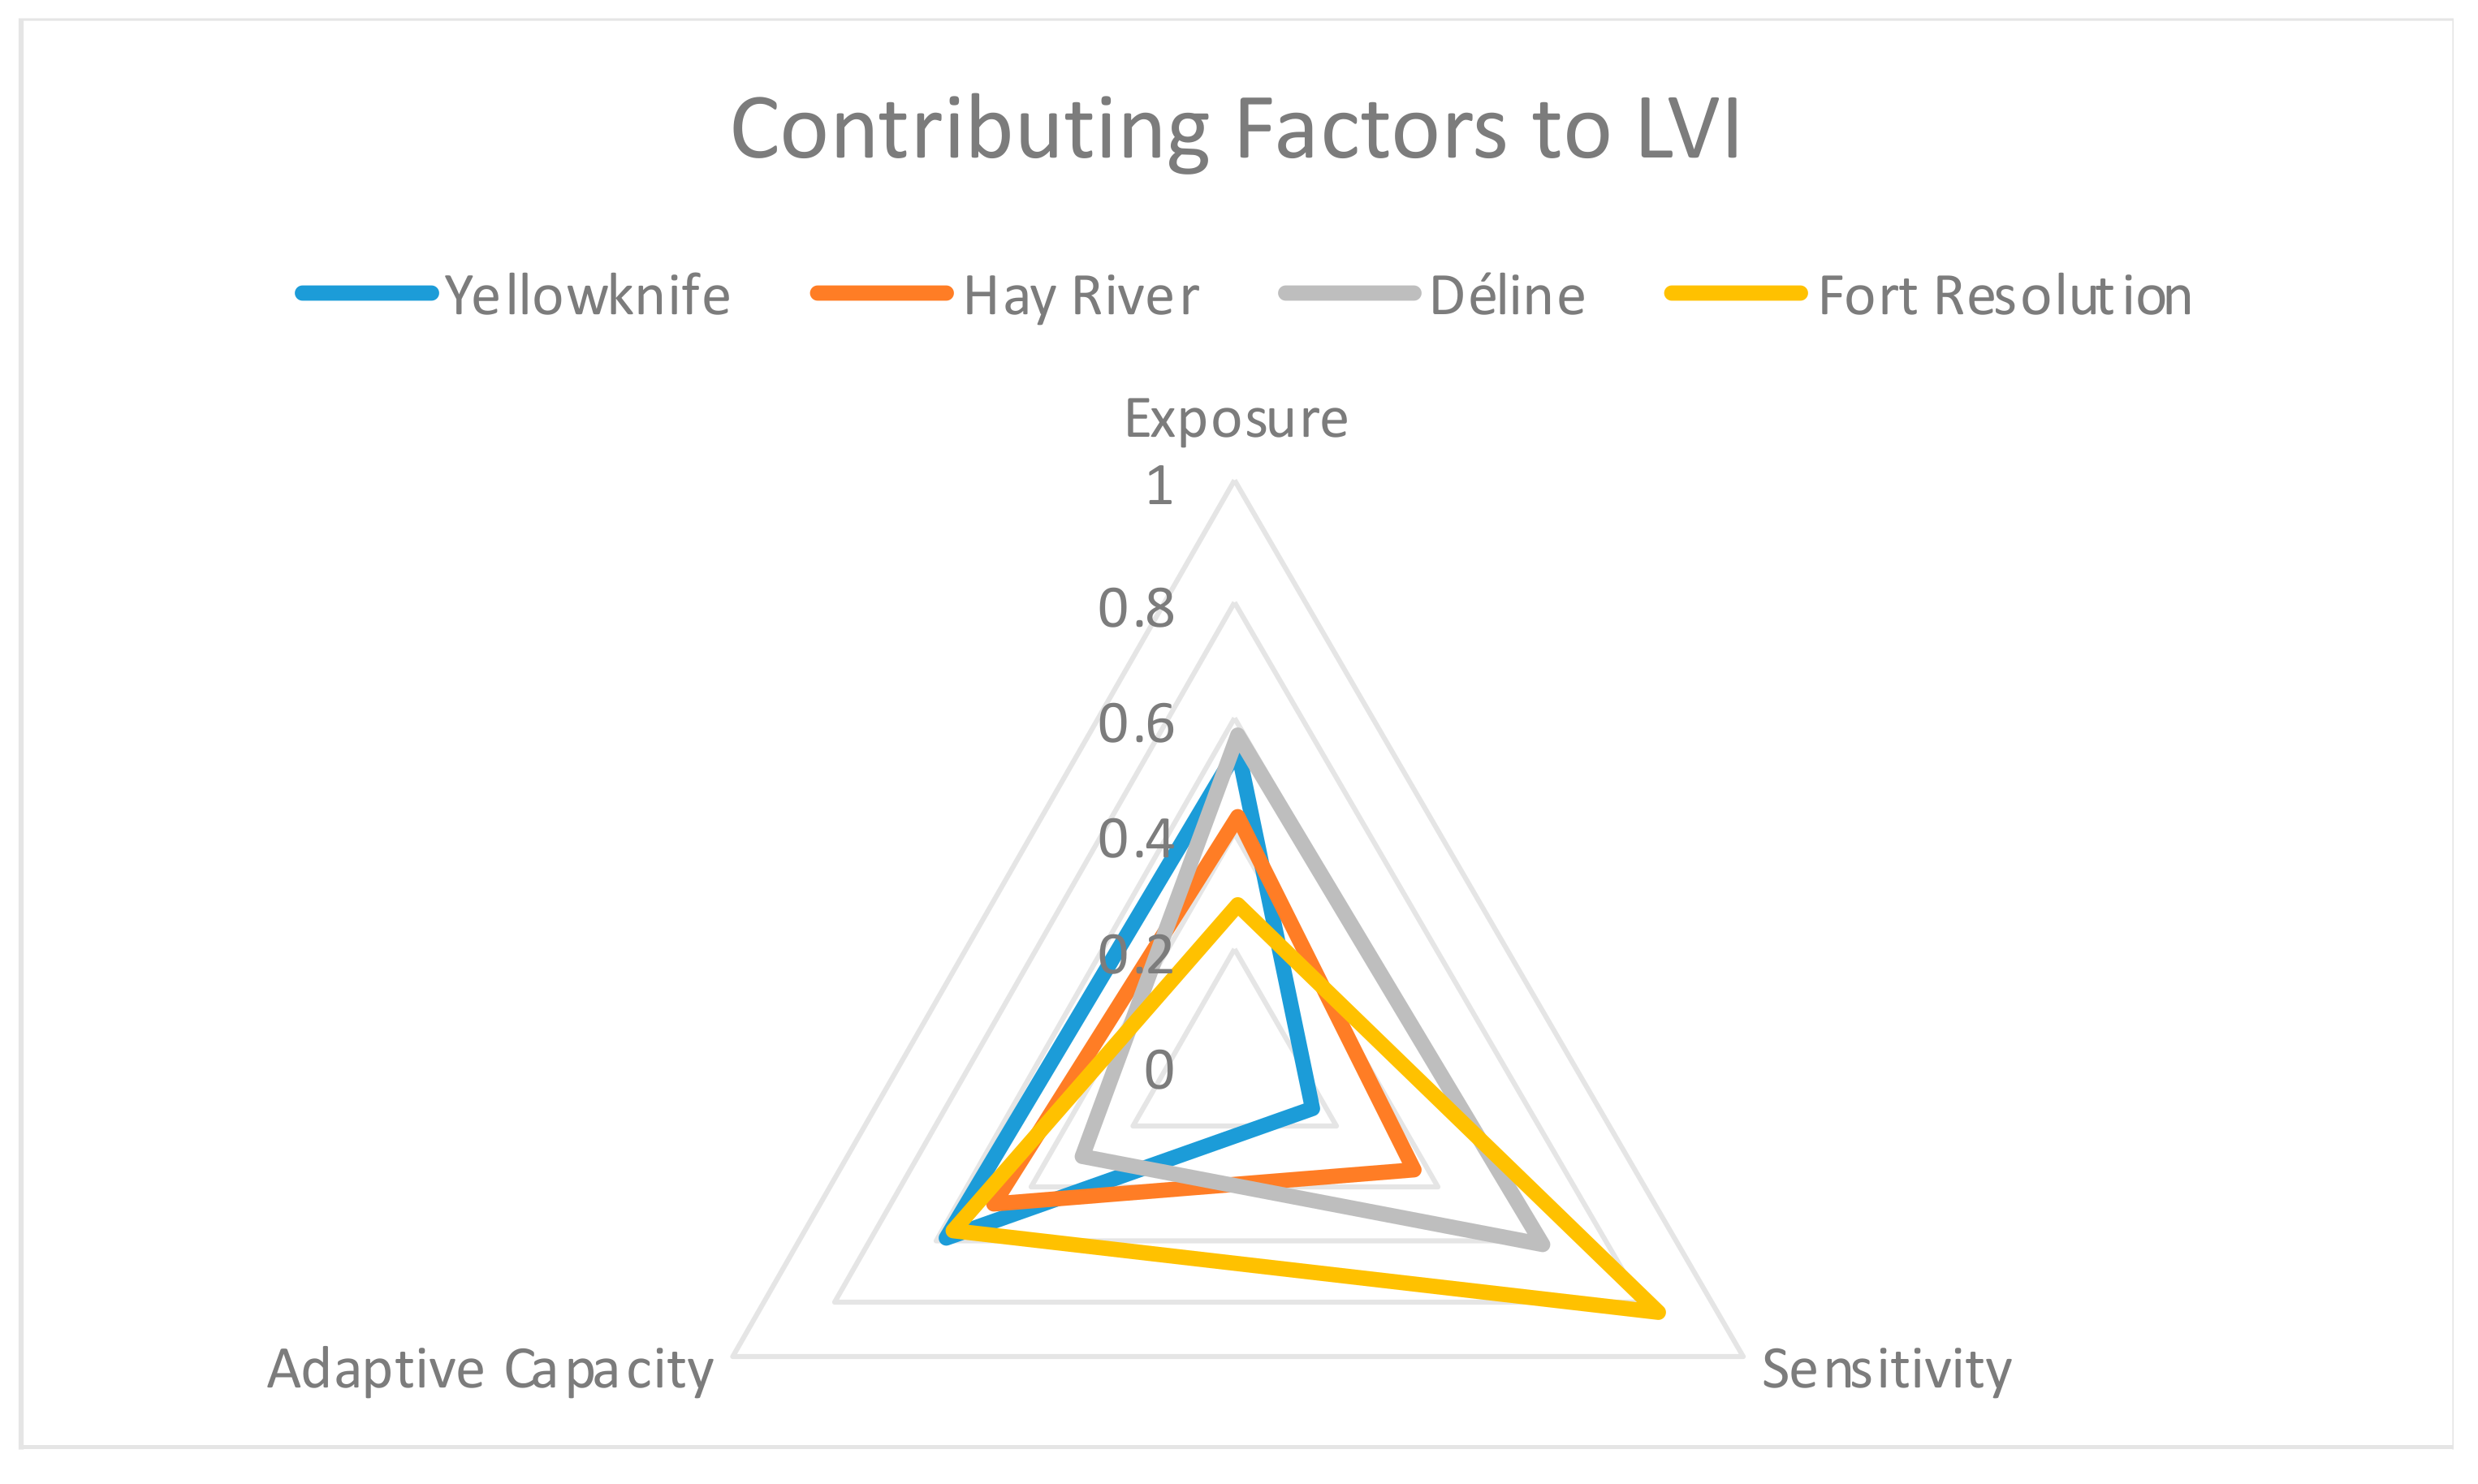
The overall LVI is determined by the three major contributing factors (exposure, sensitivity, and adaptive capacity). Results indicate that Déline has the highest LVI (0.67), followed by Yellowknife (0.50), Hay River (0.48), and Fort Resolution (0.26) (Figure 9). Déline is the most vulnerable because its exposure to heavy snowstorms is the greatest, its sensitivity to the exposure is relatively higher than three of the four communities, and its ability to adapt to these exposures is the lowest (Figure 10). In contrast, Fort Resolution has the lowest LVI, and this is primarily driven by the fact that its exposure to snowstorms is low. Despite having the highest sensitivity to snowstorms, its ability to adapt to these exposures are higher than most of the other communities. Yellowknife and Hay River are similar in their vulnerability. However, despite Yellowknife having a low sensitivity to snowstorms and the second highest adaptive capacity, its exposure to snowstorms is very high, making it more vulnerable than three of the four communities.
3.5. Future Simulation
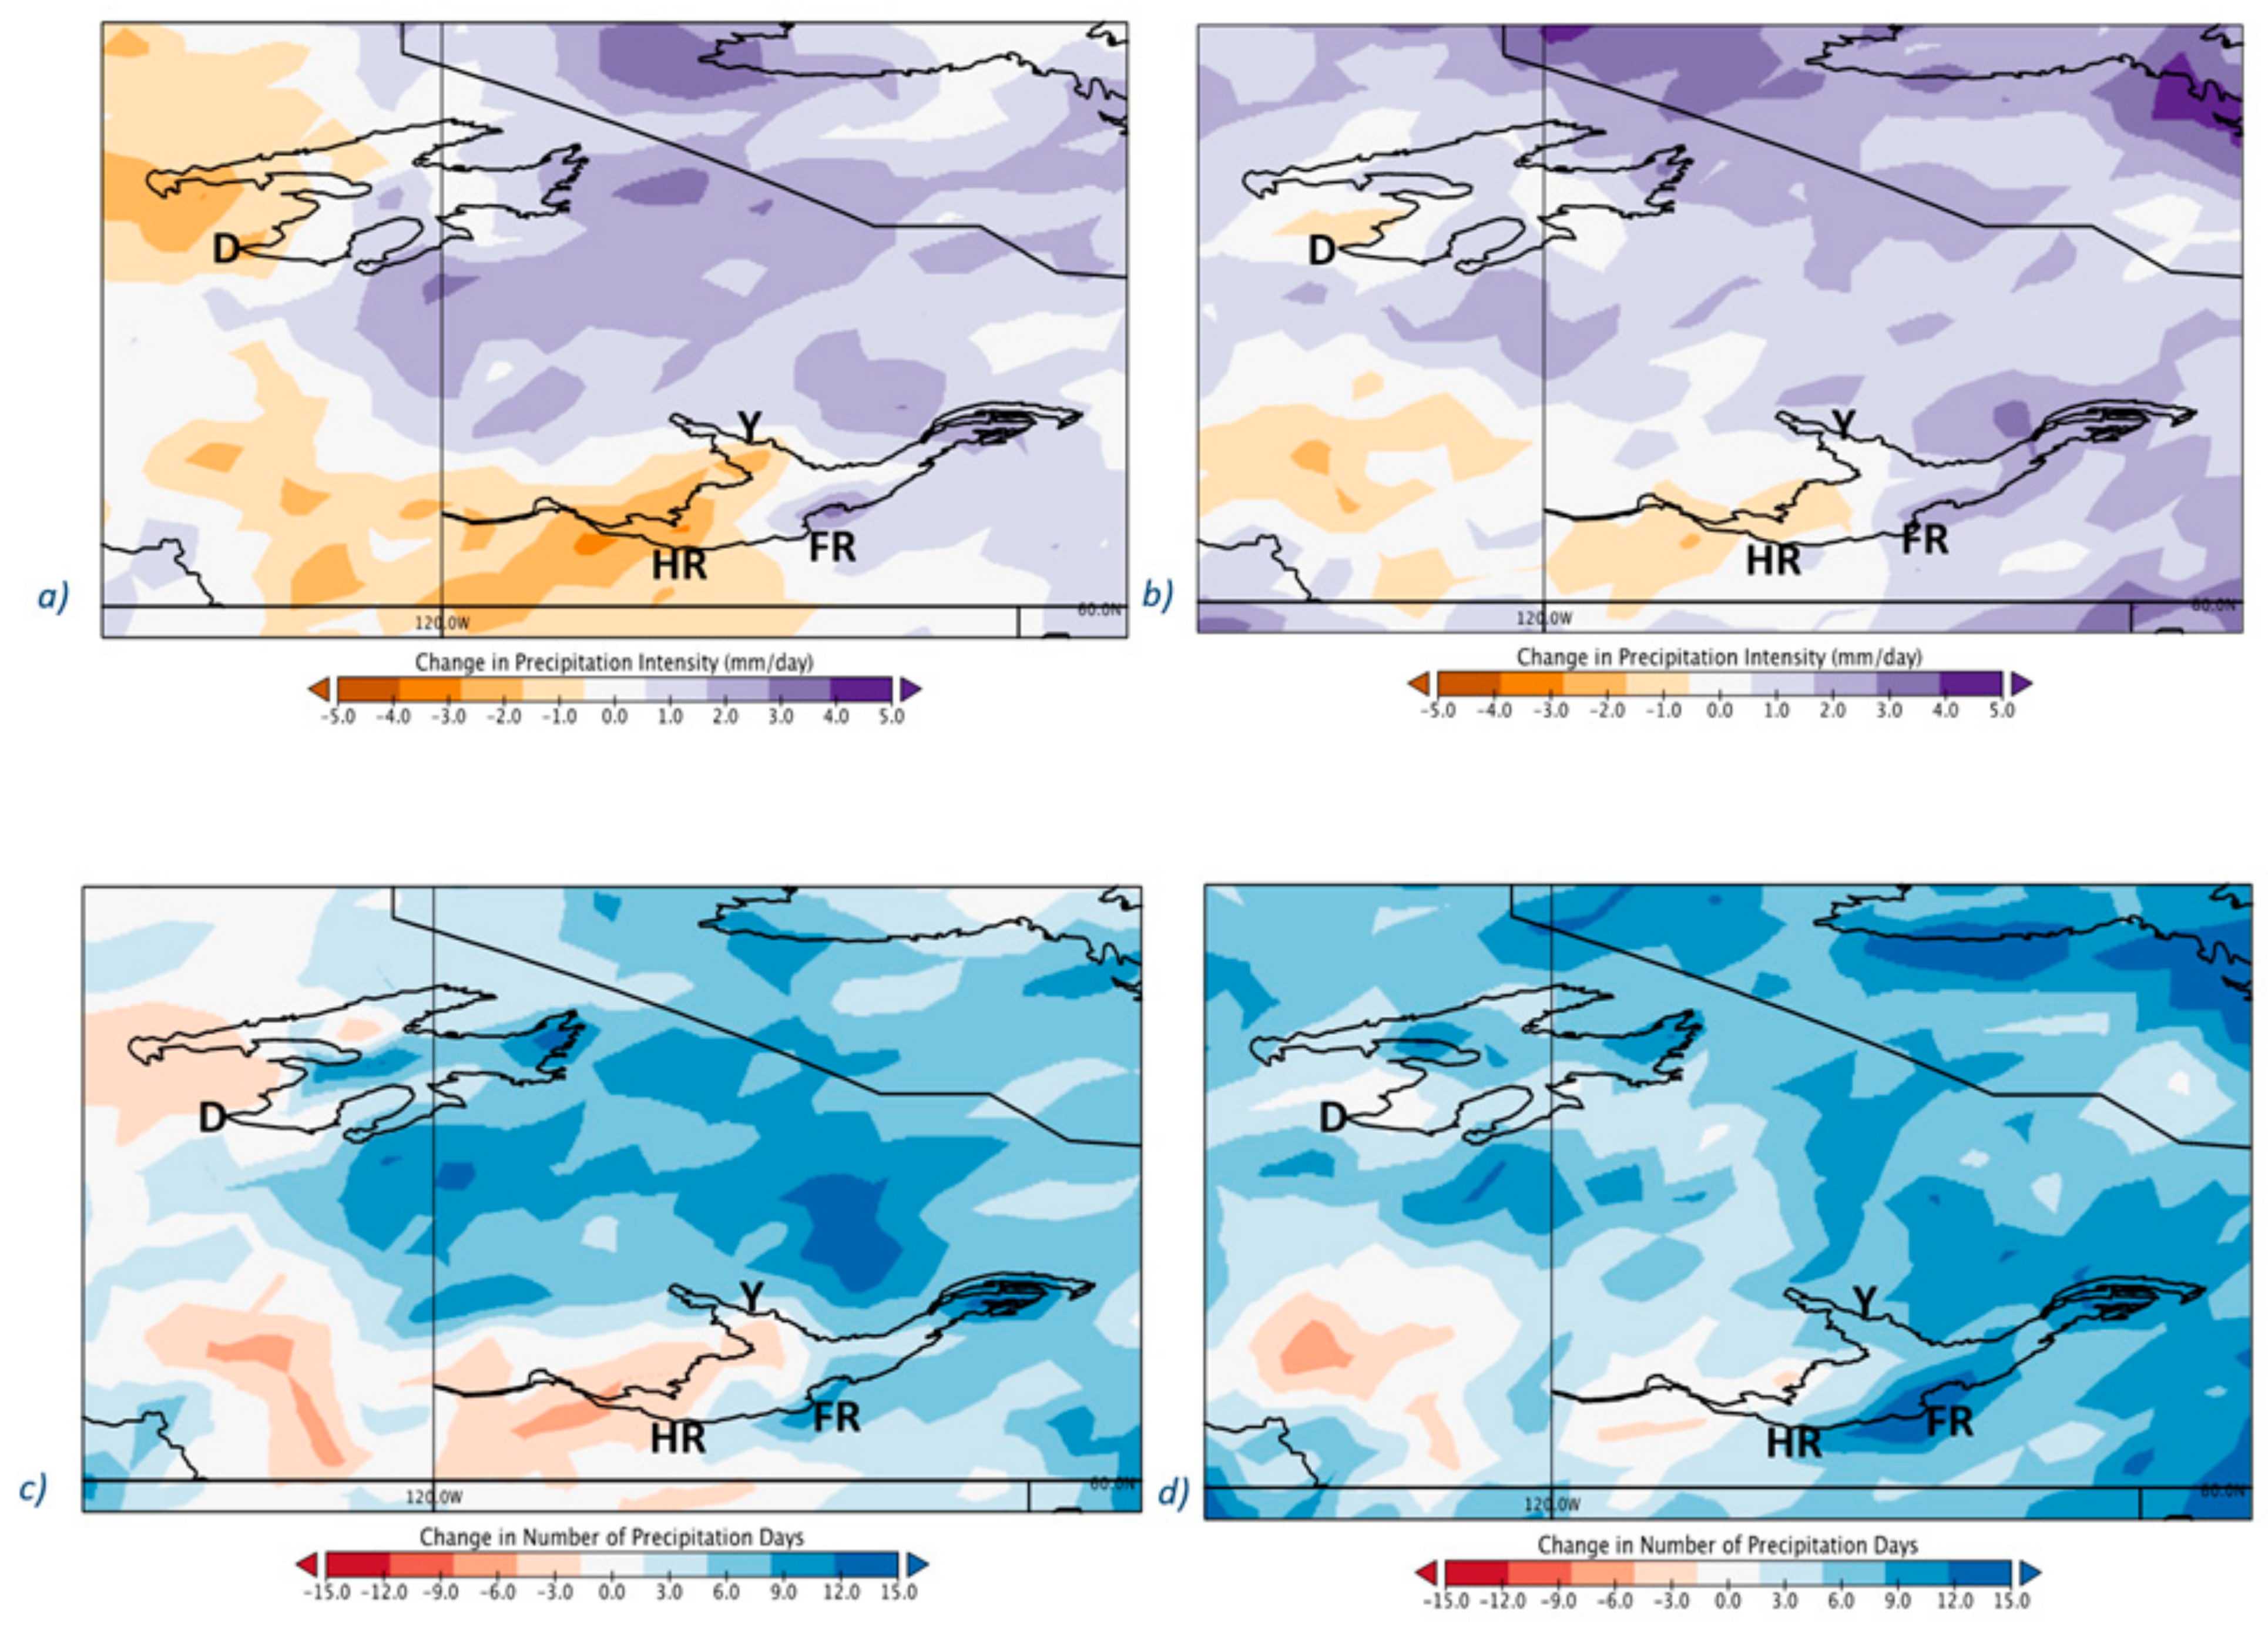
Based on the current LVI for each community, the question arises as to whether these communities will become more vulnerable to snowstorms in the future. While this assessment is beyond the scope of this study, we examine whether the exposure to November precipitation will become more prevalent in the future, giving a first-order approximation of potential snowfall risk. Figure 11a shows changes in extreme precipitation projection for the next 35 years, while Figure 11b shows the projection from 2050–2084. It is evident that extreme precipitation intensity will increase for most of the Great Slave and Great Bear regions. While the first half of the 21st century shows a decrease in precipitation for the western shores of Great Slave and Great Bear Lakes, that change is smaller for the 2050 to 2084 period. It is also evident that Fort Resolution and surrounding areas experience a large increase in extreme precipitation intensity during the first half of the century. Similarly, the change in the frequency of extreme precipitation days also increases for both periods for regions of Fort Resolution and Yellowknife (Figure 11c,d).
Future projections suggest that Fort Resolution may be the most exposed to an increase in frequency and intensity of extreme precipitation in comparison to the other three communities. Thus, while Fort Resolution is currently the least vulnerable to snowstorms, an increase in future extreme precipitation may create the need for Fort Resolution to further reduce its sensitivity and improve its adaptive capacity measures. Fort Resolution’s current sensitivities and adaptive capacities, as also identified by [46] include reduced hunting and trapping opportunities, travel safety concerns, loss of cultural identity, reduced transfer of traditional knowledge, disrupted social and family networks, and reliance on mixed economy. Separately, Déline continues to indicate a lower exposure to extremes, with decrease in precipitation intensity and frequency in the first half of the 21st century. This community may have a lower exposure in the upcoming decades. Furthermore, Hay River may also begin to experience a decrease in its extreme exposures. If it maintains a relatively high adaptive capacity and low sensitivity, then it may begin to become more resilient and prove to be more sustainable to climate change exposures, specifically snowstorms, in the future. To gain additional confidence in the indicator variables utilized in this framework, a validation analysis was conducted. Please refer to Appendix A for a detailed description of the approach.
4. Discussion
Based on the LVI results from this study, Déline is the most vulnerable community because its exposure and sensitivity are the highest, and its ability to adapt to exposure stressors is the lowest, in comparison to the other communities. Yellowknife, the most developed community, it has the second-highest vulnerability index, and it is the second most exposed community. In contrast, Fort Resolution exhibits the lowest LVI; despite having the highest sensitivity, its adaptive capacity is one of the highest and its exposure is the lowest.
If focused on the two most vulnerable communities, it is acknowledged that there is a trade-off in the adaptive capacity components between Yellowknife and Déline. Yellowknife has higher levels of physical assets, such as access to transportation, internet, or housing. In contrast, Déline has a high Indigenous population and a subsistence-based economy, that is, one based on land activities and hunting. It also has the lowest levels of most of the capital assets contributing to adaptive capacity. As [47] proposed, snowstorm conditions can affect the health and availability of wildlife species that are important for food subsistence, as well as exacerbate risks associated with hunting and travel in contexts similar to that of Déline’s. Furthermore, population type and demographic in Yellowknife, along with its administrative regime, also play a crucial role in the current findings. It is suggested that while Déline’s Indigenous self-perception can make social capital stronger in terms of reciprocity dynamics (e.g., to share food at restricting times), Yellowknife’s larger and more diverse community has a greater percentage of people working in education, law, community, and social government services, giving residents the information and resources to form other kinds of strong social networks that can help withstand negative exposure effects. These suggestions and ideas can be further explored in future studies.
An increase in financial and physical aid in Déline should be considered in order to subsidize vital needs, such as the costs of living, food, healthcare, education, and supporting public transport. In the meanwhile, precautionary measures, such as changing modes of transportation and travel routes, should continue to be taken when travelling and hunting. As [16] highlighted, Indigenous groups have also encountered considerable social, cultural, political, economic, and demographic changes in recent decades, which makes these groups doubly exposed to globalization and global environmental change. The findings highlight that the identified trade-off could be an unintended effect of the development agenda driving the economy in these sub-Arctic communities.
Despite increased environmental changes, Indigenous people of Canada can offer lessons about how to adapt to climate change impacts [16,47]. The coping strategies of Indigenous people, such as their early awareness and ability for making short-term adjustments in combination with longer-term strategies, provide an advantage to cope with snowfall hazards. Based on the current results, policymakers are encouraged to consider how to prioritize and manage their resources. In general, some of the current adaptive strategies may be altering land use patterns, drawing on traditional knowledge, adapting to new technologies, diversifying economic activities, drawing on social relationships, and accessing institutional resources [46]. Likewise, there are other long-term adaptation strategies, such as cultural adaptation and new adaptive responses, which may become available through new institutional processes, including co-management.
Future vulnerability will include the exacerbation of current trends related to climate change, with additional challenges related to resource development, such as employment opportunities, increased access to resources and services, and strained social networks [46]. While Déline currently shows the highest vulnerability to snowfall, future projections indicate that this community will become less exposed to extreme precipitation intensity and frequency, while Fort Resolution and Yellowknife will continue to see an increase. Consequently, future adaptive capacity can include increased environmental monitoring, investing in community developments, emergency planning, youth and club services, and cultural education in these communities, as outlined by [46]. In addition, resiliency strategies could include improving engineering practices so that they can withstand and accommodate heavier snowfall loads on infrastructure or increasing the snow-removal capacities in heavy-snow-prone areas.
It is acknowledged that there are some limitations within this study, including spatial resolution, weighted indicators, and the use of secondary data. In the future simulation of the exposure variable, the GEM_CLIM has a spatial resolution of 0.44 degrees. This coarse resolution may not be ideal for assessing higher-scale community-level social-ecological problems. However, the future projections were used only as an indicator to view potential changes in the current exposure variable and were not used in the framework to assess the current LVI. Determining the current LVI in this study was based on historical data that utilized the high-resolution RCM, which offered a higher degree of sophistication for assessing regional-scale physical processes. This study also used the high-resolution interpolated weather observation gridded data from Daymet.
Furthermore, the current method utilizes the weighted balance function that gives equal weighting to each indicator. It is acknowledged that the balanced weight approach has been criticized by [48], who recommend a more objective approach rather than using implicit judgment [45]. The weight of certain indicators could be adjusted by urban planners and managers to better address local needs and demands, as suggested by multi-criteria decision analysis studies [49], but there are time and economic restrictions in this method. The current method is a pragmatic approach and is often used to monitor vulnerability and to evaluate potential program and policy effectiveness in data-scarce regions. This technique is also beneficial when there are hidden or ambiguous relationships in the different components analyzed [22,45]. By applying the LVI approach, one can quantitatively compare the LVI of one community to another based on the assessments of the major components. While similar studies could have been made through interviews and focus groups, we suggest a further triangulation of quantitative and qualitative LVI data, which joins the index results with interview or focus group findings. This would be a suitable and desirable approach, not only for aggregating and quantifying the results, but for providing additional insight to the results.
Finally, this study structured its analytical framework around the data available, contending with spatial and temporal differences in the data [50,51]. Future steps, if feasible, would be to conduct fieldwork in each of these communities by carrying out surveys, interviews, and/or focus groups, in order to engage community representatives and decision-makers in the research process to ensure that the factors analyzed are pertinent to community members and relevant to community decisions, as suggested [21]. Newly acquired data can be used to modify and augment the initial framework produced in this study. Nevertheless, the current approach can be used as inputs for additional in-depth studies, preferably by adopting a multi-temporal approach. Despite the aforementioned limitations, this study can be used as an initial assessment with first-order approximations for evaluating LVI in these relatively remote communities to regional climate change exposures.
5. Conclusions
Communities along the shores of Great Bear and Great Slave Lakes in the MRB are potentially exposed to increasing November snowstorms in response to a warming climate, potentially making communities in the NWT more vulnerable. The purpose of this study was to quantify the livelihood vulnerability of four freshwater lake communities to November snowstorms from a combination of biophysical and socio-economic factors, by developing a livelihood vulnerability index framework. The four communities assessed were Déline, Fort Resolution, Hay River, and Yellowknife. The contributing factors of the LVI included sensitivity, adaptive capacity, and exposure. Each contributing factor was further divided into major components and subsequent subcomponents with associated indicator variables. A balanced weighted approach was applied to each indicator variable to calculate LVI for each community.
Exposure comprises three major components (extremes, average precipitation variables, and average temperature variables). Exposure results indicated higher intensity precipitation (upwards of 10 mm/day) noticeable over the two Great Lakes as opposed to areas farther inland, suggesting that communities along the lakeshores are more susceptible and exposed to extreme cold season precipitation than communities farther inland. Relative to the other communities, Déline exhibits the smallest exposure to extreme precipitation events, while Hay River experiences the greatest. This could be attributed to the fact that Déline is located farther north near Great Bear Lake, which is covered by more ice in late November, reducing the development of lake effect snowfall in comparison to Great Slave Lake.
Sensitivity comprises the three major components of demographic, labor, and health. Sensitivity results indicate that Fort Resolution exhibits the greatest sensitivity in all three major components. Reasons for this includes that Fort Resolution has the greatest commuting duration to work, which can pose risks to commuters during heavy snowfall events. In contrast, Yellowknife exhibits the least sensitivity, which is primarily driven by the fact that its sensitivity to labor and health are negligible when compared to the other communities.
Adaptive capacity comprises five types of capital (human, physical, financial, social, and natural). When assessing each capital, results indicate that Fort Resolution has the highest human capital, financial capital, and social network in comparison to the other communities. Yellowknife has the highest physical and natural capital, and Déline ranks lowest for human capital and physical capital. Déline has limited access to public transit, which can pose inconveniences during heavy snowfall events. Furthermore, Déline has less access to communication via the internet to keep residents informed of impending hazardous snowstorms.
When quantifying the livelihood vulnerability based on exposure, sensitivity, and adaptive capacity, current results demonstrate livelihood vulnerability differences among sub-Arctic communities. Déline is the most vulnerable of the four communities (0.67), which is primarily driven by its overall high exposure, high sensitivity, and low adaptive capacity. In contrast, Fort Resolution is the least vulnerable community (0.26). Despite having a high sensitivity to snowstorms, its exposure is relatively low in comparison to the other communities. In addition, it has the second-highest adaptive capacity in place to be able to withstand heavy precipitation events. Yellowknife follows Déline with the second highest LVI (0.5) and second-most-exposed community. Although extreme precipitation intensity will continue to increase for most regions, results suggest that Fort Resolution may be the most exposed to increased frequency and intensity of extreme cold season precipitation in the future.
The framework produced from this study can be used to assess regional changes in cold season precipitation for lake-rich communities in response to climate change, as this exposure variable will continue to affect certain lake communities in the near future. These findings can help provide innovative solutions to the current socio-economic structures in place to reduce the vulnerability faced by these communities and to further increase their adaptive capacity and resiliency to regional heavy snowstorms for a more sustainable future.
Author Contributions
Conceptualization, J.A.B.-R. and A.A.; methodology, J.A.B.-R., A.A.; software, J.A.B.-R. and L.S.; validation, A.A., L.S., E.B. and B.E.R.; formal analysis, J.A.B.-R. and A.A.; investigation, J.A.B.-R. and A.A.; resources, J.A.B.-R., A.A. and, L.S.; data curation, J.A.B.-R. and A.A.; writing—original draft preparation, J.A.B.-R., A.A.; writing—review and editing, A.A., L.S., E.B. and B.E.R.; visualization, J.A.B.-R., A.A. and L.S.; supervision, L.S.; project administration, J.A.B.-R., L.S.; funding acquisition, L.S., E.B. and B.E.R. All authors have read and agreed to the published version of the manuscript.
Funding
This research was funded by the McGill Sustainability Systems Initiative (MSSI), grant number 246889 from Montreal, Canada.
Institutional Review Board Statement
Not applicable.
Informed Consent Statement
Not applicable.
Data Availability Statement
Data available in a publicly accessible repository that does not issue DOIs Publicly available datasets were analyzed in this study. This data can be found here: [https://www12.statcan.gc.ca/census-recensement/2016/dp-pd/prof/index.cfm?Lang=E; https://www.statsnwt.ca/community-data/index.html].
Conflicts of Interest
The authors declare no conflict of interest.
Appendix A
Appendix A.1. A Brief Description of Each Community
The name of the Charter Community, Délįne, means “where the waters flow”, a reference to the headwaters of the Great Bear River, Sahtúdé. In 2017, the population was 510, with an average yearly growth rate of −0.4% from 2006 [52]. Yellowknife is the capital and only city, as well as the largest community, in the Northwest Territories, Canada. Yellowknife is an ethnically diverse city with a population of 19,569 in 2016 [53]. As the largest city in the Northwest Territories, Yellowknife is the hub for mining, industry, transportation, communications, education, health, tourism, commerce, and government activity in the territory [54]. Yellowknife’s population has increased from 28.6% of the territorial population in 1976 to 45.2% in 2005, while smaller communities tend to decrease over time [54]. For Hay River, the Government of the Northwest Territories reported that the population was 3734 in 2017, with an average yearly growth rate of −0.2% from 2006.The settlement’s all-season trucking, and the establishment of a commercial fishing industry, started an economic boom. The community has a full hospital, a woman’s shelter/transition house, a dental clinic, and an ambulance service. The town hosts four schools, and a correctional center. Media sources include its own community-owned newspaper, television broadcasting, four radio channels, and internet services provided by SSI Micro and Bell Internet, land-based telephone by Northwestel, and cell phones by NMI Mobility. Fort Resolution is situated at the mouth of the Slave River, on the shores of Great Slave Lake. The beach along Great Slave Lake is a prime spot for summer swimming, bird watching, fishing, or relaxing. Local residents engage in fishing, hunting, and trapping year-round. The population is 470 according to the 2016 Census, a decrease of −0.8% from 2011. The town also has a hockey arena, community hall, two nursing stations, and a youth center. Fort Resolution airport services provide charter and medevac flights. These communities have livelihood dependencies on the large freshwater lakes, which merits this study.
Appendix A.2. Description of Future Exposure Projection
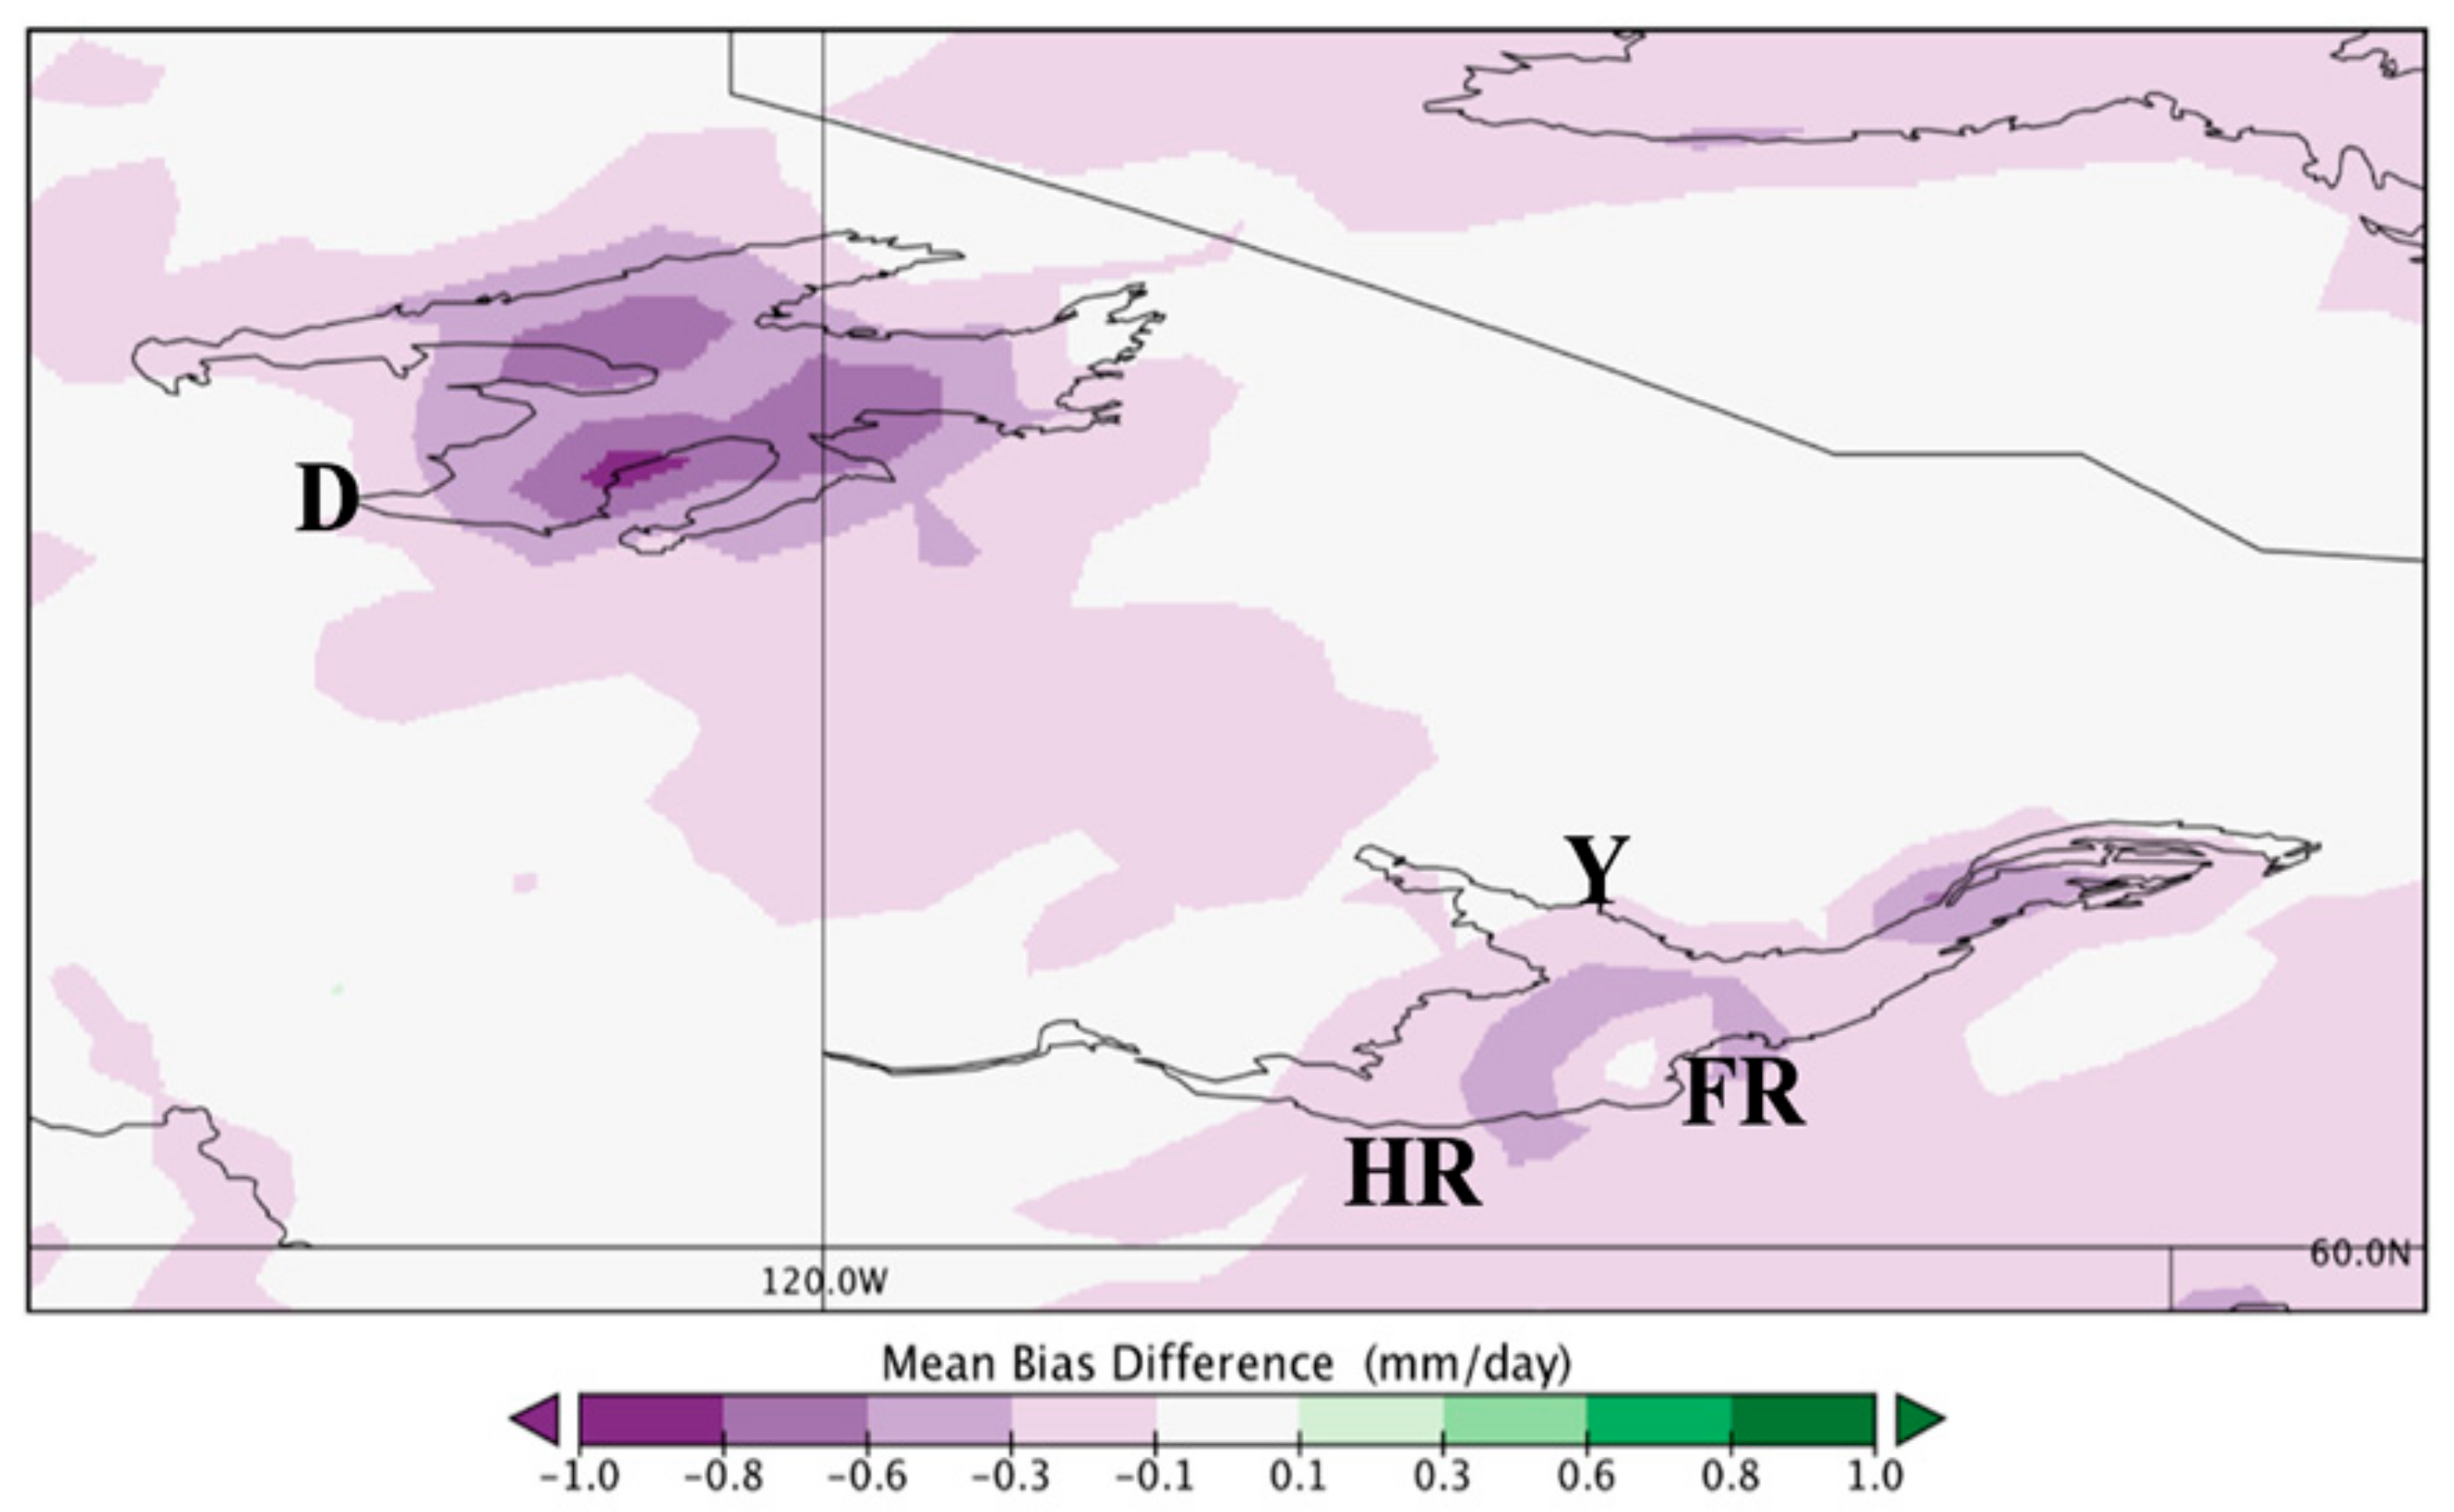
A future simulation is also employed using the 0.44 resolution GEM_CLIM, driven by the second-generation Canadian Earth System Model (CanESM2). This simulation was used to determine projected changes in extreme precipitation for two thirty-five-year periods (2015 to 2049 and 2050 to 2084) with respect to the 1980 to 2005 period. To justify the use of this simulation, comparisons between the model driven by reanalysis data from ERA_Interim and, separately, by CanESM2 are shown in Figure A1 and Table A1 of Appendix A and show the mean bias difference (MBD) between the model runs for daily precipitation intensity. The MBD is not very large, suggesting that the lateral boundary forcings between the GEM_CLIM driven by CanESM2 and, separately, by ERA_Interim may not be very different. The results provide confidence that the GEM_CLIM-driven CanESM2 was an appropriate and trustworthy simulation for determining projected extreme precipitation.
The 2015–2049 and 2050–2084 periods were selected because the trend in lake effect snowfall may increase for many of these communities in the earlier period before it starts to decrease in the later half of the 21st century. This is because warmer climates will reduce ice cover over lakes and allow for more open water, which can facilitate the exchange of heat and energy fluxes into the lower atmosphere, thus commencing and increasing the amount of precipitation over these communities. However, as the climate continues to warm even further (in the later period), the air temperature at the 850 millibar level may become too warm to induce a strong temperature gradient between the lake and the atmosphere, thereby inhibiting the incidence of heavy snowfall [6,55]. The additional analysis using GEM_CLIM-driven by CanESM2 is to provide supplementary contextual information on long-term projected exposures of extreme precipitation and is not included as data for assessing the current LVI framework, which focuses on LVI within the past 2010–2020 decade.
Appendix A.3. Validation Analysis
To gain additional confidence in the indicator variables utilized in this framework, a validation analysis is conducted. The results of the validation analysis will help establish whether the LVI rank for the four communities would vary or remain the same if any indicators were omitted. An unchanged LVI rank amongst the communities would suggest that the framework developed is unwavering, providing confidence in the LVI results for each community. The approach is as follows. One randomly selected indicator from each major component is removed at a time from the framework, and the LVI is re-calculated. In total, there are eleven validation scenarios computed. For example, in scenario one, the indicator under the major component of human capital entitled “major field of study in personal, protective, and transportation services” is removed from the framework. In scenario two, an indicator under the major component of physical capital entitled “major repairs needed” is removed from the framework. For more details on the indicators that were removed, refer to “Validation Analysis” in Appendix A, Table A3.
In eight out of the eleven scenarios, the LVI rank remains the same as our current results. In scenario 3, Yellowknife and Hay River are the same. This does not change the overall rank of the LVI, but simply reiterates that these two communities exhibit very similar LVI, as shown in the original results. However, in scenarios 10 and 11, the LVI for Hay River is slightly larger than that of Yellowknife. Removing “average snow water equivalent over 5 years for November” (scenario 10) and removing “average minimum temperature” over 5 years for November” (Scenario 11) results in these ranks. However, there is no surprise in these changes. If these indicators are removed, then there can be no robust assessment of this major biophysical exposure affecting these communities. Yellowknife and Hay River already exhibit a very similar LVI and removing the indicators which features very highly exposed conditions for Yellowknife will, thereby, reduce Yellowknife’s LVI and act to increase Hay River’s vulnerability. In conclusion, the validation analysis provides confidence that our framework is robust, giving credence to the initial results and the framework developed.
Figure A1.
Comparing the 1980-2005 daily November precipitation by computing the mean bias difference between model simulations driven by CANESM2 and ERA_Interim.
Figure A1.
Comparing the 1980-2005 daily November precipitation by computing the mean bias difference between model simulations driven by CANESM2 and ERA_Interim.


Table A1.
Values of mean bias difference for each community’s daily November precipitation during the 1980 to 2005 period.
Table A1.
Values of mean bias difference for each community’s daily November precipitation during the 1980 to 2005 period.
| (mm/day) | Yellowknife | Hay River | Déline | Fort Resolution |
|---|---|---|---|---|
| MBD | −0.2 | −0.2 | −0.1 | −0.4 |
Appendix A.4. Steps for Deriving 8 mm/Day Snowfall in the Liquid State
To determine the threshold value of 8 mm/day, the 99th percentile of daily precipitation over the domain of interest suggested an extreme value that was equal to or greater than 9 mm/day. In the NWT, 8 mm out of the total 9 mm of total daily precipitation fallen would be considered solid-state (snowfall). Understanding this ratio conversion follows the snowfall derivation algorithm by [5,56,57]. The threshold of 8 mm/day corresponds to a solid-state accumulation rate of 10 cm/day. This is in good approximation with Environment and Climate Change Canada, which issues a snowfall warning in the NWT when snowfall equals or exceeds 10 cm in 12 h or less.
Following the work by [5]:
Step (1): The 99th percentile of daily precipitation is considered the extreme intensity for the overall region. This value is estimated to be 9 mm/day. This value is taken as the initial precipitation (.
Step (2): To determine how much of this extreme precipitation (9 mm/day) is actually falling as snow (), a ratio has to be computed, which determines the ratio of precipitation falling as snow to overall initial precipitation. The ratio is calculated by knowing the average air temperature for November over the region. The average temperature was calculated to be −8.5 °C (source: provided by the National Oceanic and Atmospheric Administration–National Centers for Environmental Information (NOAA-NCEP)).
Step (3): is then calculated:
Step (4): To convert from mm to cm, the average snow density () (grams/cm3) has to be determined, which is also a function of air temperature. This value is approximately 0.078 g/cm3.
Step (5): Now the snowfall accumulation height in cm can be calculated:
Table A2.
Framework outlining the subcomponents and indicators under each major component, along with a description of each indicator, the year and data source provided, and units of each indicator.
Table A2.
Framework outlining the subcomponents and indicators under each major component, along with a description of each indicator, the year and data source provided, and units of each indicator.
| Adaptive Capacity | |||||
|---|---|---|---|---|---|
| Major Sub Components | Subcomponents | Indicator | Contribution | Year & Source of Data | Unit |
| 1. Human Capital | Education | Attained post-secondary diploma or degree | The level of education represents a population who are informed and can respond accordingly to climate hazards | 2016: Statistics Canada Census Profile [54,58,59,60] | % of population |
| Apprentice or trade certificate or diploma | The level of education in the trades provides personnel with the right tools and know-how to respond to climate hazards, for example, electricians and construction workers that can fix potential damages from snowstorms, such as power outages or structural damages | 2016: Statistics Canada Census Profile [54,58,59,60] | % of population | ||
| Major field of study in natural resources and conservation | The level of education in the natural resources provides personnel with the right tools and know-how to respond to climate hazards, such as staying informed and being able to monitor natural environmental concerns, such as climate change hazards | 2016: Statistics Canada Census Profile [54,58,59,60] | % of population | ||
| Major field of study in personal, protective, and transportation services | The level of education in the protective services, such as police officers and other first responders, provides personnel with the right tools and know-how to respond in emergency situations during climate hazards | 2016: Statistics Canada Census Profile [54,58,59,60] | % of population | ||
| 2. Physical Capital | Transportation | Transportatio-n by main driver using car, truck, or van as a main mode of commuting for work | Having access to cars and trucks during hazardous weather makes residents able to reach their work destination and sustain their means of livelihood | 2016: Statistics Canada Census Profile [54,58,59,60] | % of population |
| Transportatio-n to work by public transit | Commuters having access to public transportation allows for safer driving (less traffic on roads) during major snowstorms | 2016: Statistics Canada Census Profile [54,58,59,60] | % of population | ||
| Communication | Number of households with home internet | Important accessibility to emergency access and information during hazardous conditions | 2013: NWT Bureau of Statistics [53] | % of population | |
| Housing | Major repairs required for home | Potential infrastructure issues that can be exacerbated due to heavy snowfall if infrastructure is not stable and secure | 2016: Statistics Canada Census Profile [54,58,59,60] | % of population | |
| 3. Financial Capital | Income | Average total income of households in 2015 | Higher income can provide financial aid in order to respond to climate hazards, such as the ability to incur damages to homes and for potential evacuations | 2015: Statistics Canada Census Profile [54,58,59,60] | Canadian Dollar value averaged by household-s |
| Cost of living | Households spending less than 30% of income on shelter costs (for owner and tenant households with total income greater than zero in non-farm, non-reserve private dwellings) | For residents spending less money on basic costs of living, more financial aid is available for emergency disasters | 2016: Statistics Canada Census Profile [54,58,59,60] | % of population | |
| Subsidies | % of tenants per household in subsidized housing (tenant in non farm, non reserve private dwellings) | Subsidies and financial aid in place to help residents so that they have more financial support for emergency situations Subsidized housing also reduces financial commitments of residents if snowstorms produce structural damages (leaks, insulation, collapsed roof) | 2016: Statistics Canada Census Profile [54,58,59,60] | % of population | |
| 4. Social Network | Social Support | Occupations in education, law and social, community and government services | Strong social network can aid in enacting positive changes. The presence of these occupations provide a social structure within the community to enable others to access resources, information, and social support that can increase the community’s adaptive capacity | 2016: Statistics Canada Census Profile [54,58,59,60] | % of population |
| Major field in public administratio-n and social service professions | The presence of these occupations provide a social structure within the community to enable others to access resources, information, and social support that can increase the community’s adaptive capacity | 2016: Statistics Canada Census Profile [54,58,59,60] | % of population | ||
| Population who volunteered in 2013 | Strong social network can aid in enacting positive changes. The higher the number of volunteers within a community, the greater the opportunity for such a community to get support from one another | % of population | |||
| 5. Natural Capital | Proximity to lakes | Approximate distance to closest lake center (INVERSE) | Shorter distance to the nearest lake suggests a community is closer and has more accessibility to the nearest lake and freshwater resources | 2020: Google Map Data | km |
| Sensitivity | |||||
| 1. Demographic | Family and households | Total lone-parent families | Greater numbers of lone-parent families indicate more people who are dependent in a household during hazardous events | 2016: Statistics Canada Census Profile [54,58,59,60] | % households |
| Dependency ratio | Population 60 years and older | Number of people who are dependent on the household during hazardous events due to old age | 2018: NWT Bureau of Statistics [53] | % of population dependen-y ratio | |
| Population density | Population and dwellings per km2 | Denser areas will have more people who are affected by highly localized winter storms | 2016: Statistics Canada Census Profile [54,58,59,60] | people/km2 | |
| Births | Teen births (number of teen births for 2017 divided by population of 2017) | These households are more dependent because resources may be limited for those who are not prepared for family planning | 2017: NWT Bureau of Statistics [53] | % of population | |
| 2. Labour | Journey to work | Commuting duration for employed labour force with a usual place of work or no fixed workplace address | Higher percentage of people commuting a long duration to work during a snowstorm makes them more exposed and at risk of accidents | 2016: Statistics Canada Census Profile [54,58,59,60] | % of population |
| Traditional Activities | Takes part in hunting and fishing | People who rely on fishing and hunting are more prone to be affected by changes in adverse snowstorms over lakes | 2013: NWT Bureau of Statistics [53] | % of population | |
| Takes part in trapping | People who rely on trapping are more prone to be affected by changes in adverse snowstorms over lakes | 2013: NWT Bureau of Statistics [53] | % of population | ||
| Employment rate | % of population employed (INVERSE) | Greater value indicates that people are most likely leaving their homes to go to work in adverse winter storm conditions | 2016: Statistics Canada Census Profile [54,58,59,60] | % of population | |
| 3. Health | Unhealthy | Population currently smoking | Increased health risk occurs due to adverse weather events for people already prone to health conditions | 2009: NWT Bureau of Statistics [53] | % of population |
| Exposure | |||||
| 1. Extremes | Extreme precipitation Intensity | 99th percentile of daily November precipitation rate for November (1980–2014) | The larger the intensity, the greater the exposure of winter storms, compromising communities’ infrastructure, finances, accessibility, safety, and health | (1980–2014) ERA Interim: McGill University Climate Change and Sustainable Engineering and Design (CCaSED) lab | mm/day |
| Frequency of extreme precipitation days | Number of days daily precipitation exceeds 8 mm/day for November over the period of 1980 to 2014 | The greater the frequency of extreme precipitation days, the greater the winter storm exposure, compromising communities’ infrastructure, finances, accessibility, safety, and health | (1980–2014) ERA Interim: McGill University Climate Change and Sustainable Engineering and Design (CCaSED) lab | number of days | |
| Trend in extreme precipitation days | Trend in number of days daily precipitation exceeds 8 mm/day for November (1980–2014) | The greater the increase in frequency of extreme days, the greater the winter storm exposure, compromising communities’ infrastructure, finances, accessibility, safety, and health | (1980–2014) ERA Interim: McGill University Climate Change and Sustainable Engineering and Design (CCaSED) lab | days/year | |
| 2. Average Precipitation Variables | Average precipitation | Average precipitation over 5 years for November (2015–2019) | Greater November precipitation indicates greater potential that winter storms are prevalent | (2015–2019) Daymet [30] | mm/day |
| Average SWE | Average SWE over 5 years for November (2015–2019) | Greater November snow water equivalent indicates greater potential that winter storms are prevalent | (2015–2019) Daymet [30] | kg/m2 | |
| 3. Average Temperature Variables | Average max temperature | Average temp. max over 5 years (deg C) for November (2015–2019) (INVERSE) | Colder daily maximum temperatures indicate greater potential that winter storms are prevalent | (2015–2019) Daymet [30] | (deg C) |
| Average min temperature | Average temp. min over 5 years (deg C) for November (2015–2019) (INVERSE) | Colder daily minimum temperatures indicate greater potential that winter storms are prevalent | (2015–2019) Daymet [30] | (deg C) | |
Table A3.
This table shows the original LVI values for each community, compared to the LVI scenarios calculated when one indicator variable is omitted from the calculation under a specific major component. The symbols beside each LVI represent whether that community exhibits the highest, second highest, third highest, or fourth highest LVI in comparison to the other communities.
| Scenario of Indicator Removed under Its Major Component | LVI for Yellowknife | LVI for Hay River | LVI for Déline | LVI for Fort Resolution |
|---|---|---|---|---|
| Original | 0.50 ** | 0.48 *** | 0.67 * | 0.26 **** |
| 1. Major field of study in personal, protective and transportation services: Human Capital | 0.49 ** | 0.48 *** | 0.65 * | 0.29 **** |
| 2.Major repairs needed: Physical Capital | 0.50 ** | 0.48 *** | 0.65 * | 0.24 **** |
| 3. % of tenants per household in subsidized housing (tenant in non farm, non reserve private dwellings): Financial Capital | 0.48 ** | 0.46 *** | 0.69 * | 0.25 **** |
| 4. Population who volunteered in 2013: Social Network | 0.50 **,**** | 0.50 **,*** | 0.65 * | 0.27 **** |
| 5. Approximate distant to closest lake center: Natural Capital | 0.50 ** | 0.47 *,** | 0.69 * | 0.23 **** |
| 6. Teen births (number of teen births for 2017 divided by population of 2017): Demographic | 0.50 ** | 0.49 *** | 0.69 * | 0.27 **** |
| 7. % of population employed: Labour | 0.49 ** | 0.48 *** | 0.65 * | 0.27 **** |
| 8. Population currently smoking: Health | 0.50 ** | 0.49 *** | 0.64 * | 0.30 **** |
| 9. Trend in extreme precipitation days: Extremes | 0.49 ** | 0.45 *** | 0.73 * | 0.20 **** |
| 10. Average SWE: Average Precipitation Variables | 0.50 *** | 0.51 ** | 0.62 * | 0.23 **** |
| 11. Average min temperature: Average Temperature Variables | 0.49 *** | 0.51 ** | 0.62 * | 0.27 **** |
* = highest LVI; ** = second highest LVI; *** = third highest LVI; **** = fourth highest LVI.
References
- Arctic Climate Impact Assessment (ACIA). 2005. Available online: https://www.amap.no/documents/doc/arctic-arctic-climate-impact-assessment/796 (accessed on 5 January 2019).
- GNWT. Climate observations in the Northwest Territories (1957–2012) Inuvik Norman Wells Yellowknife Fort Resolution. 2015. Available online: https://www.enr.gov.nt.ca/sites/enr/files/page_3_nwt-climate-observations_06-13-2015_vf_1_0.pdf (accessed on 5 January 2019).
- Woo, M. Cold Region Atmospheric and Hydrologic Studies. The Mackenzie GEWEX Experience Volume 1: Atmospheric Dynamics; Springer: Berlin/Heidelberg, Germany, 2008. [Google Scholar]
- Blanken, P.; Rouse, W.; Schertzer, W.M. Time scales of evaporation from Great Slave Lake. In Cold Region Atmospheric and Hydrologic Studies: The Mackenzie GEWEX Experience Volume 2: Hydrologic Processes, 1st ed.; Wo, M.-K., Ed.; Springer: Berlin/Heidelberg, Germany, 2007; pp. 181–196. [Google Scholar]
- Baijnath-Rodino, J.A.; Duguay, C.R. Historical spatiotemporal trends in snowfall extremes over the Canadian domain of the Great Lakes Basin. Adv. Meteorol. 2018, 2018, 1–20. [Google Scholar] [CrossRef]
- Baijnath-Rodino, J.A.; Duguay, C.R.; LeDrew, E. Climatological trends of snowfall over the Laurentian Great Lakes Basin. Int. J. Clim. 2018, 38, 3942–3962. [Google Scholar] [CrossRef]
- Baijnath-Rodino, J.A.; Duguay, C.R. Assessment of coupled CRCM5–FLake on the reproduction of wintertime lake-induced precipitation in the Great Lakes Basin. Theor. Appl. Clim. 2019, 138, 77–96. [Google Scholar] [CrossRef]
- Derksen, C.; Sturm, M.; Liston, G.E.; Holmgren, J.; Huntington, H.; Silis, A.; Solie, D. Northwest Territories and Nunavut snow characteristics from a subarctic traverse: Implications for passive microwave remote sensing. J. Hydrometeorol. 2009, 10, 448–463. [Google Scholar] [CrossRef]
- NWT, 2014: Northwest Territories Hazard Identification Risk Assessment, Vanguard EMC Inc. 1/1/2014). Available online: https://www.maca.gov.nt.ca/sites/maca/files/resources/nwt-hira-final.pdf (accessed on 5 January 2019).
- Pryor, J.; Cobb, P. Creating a More Resilient Yellowknife, Climate Change Impacts and Municipal Decision Making; The Pembina Institute: Calgary, AB, Canada, 2007. [Google Scholar]
- Auger, N.; Potter, B.; Smargiassi, A.; Bilodeau-Bertrand, M.; Paris, C.; Kosatsky, T. Association between quantity and duration of snowfall and risk of myocardial infarction. Can. Med. Assoc. J. 2017, 189, E235–E242. [Google Scholar] [CrossRef] [Green Version]
- Ford, J.D.; Furgal, C. Foreword to the special issue: Climate change impacts, adaptation and vulnerability in the Arctic. Polar Res. 2009, 28, 1–9. [Google Scholar] [CrossRef]
- Adger, W.N. Vulnerability. Glob. Environ. Chang. 2006, 16, 268–281. [Google Scholar] [CrossRef]
- Albizua, A.; Corbera, E.; Pascual, U. Farmers’ vulnerability to global change in Navarre, Spain: Large-scale irrigation as maladaptation. Reg. Environ. Chang. 2019, 19, 1147–1158. [Google Scholar] [CrossRef]
- Dolan, A.H.; Walker, I. Understanding vulnerability of coastal communities to climate change related risk. J. Coast. Res. 2006, 39, 1316–1323. [Google Scholar]
- Berkes, F.; Armitage, D. Co-management institutions, knowledge, and learning: Adapting to change in the Arctic. Études/Inuit/Stud. 2010, 34, 109–131. [Google Scholar] [CrossRef] [Green Version]
- Jeong, D.I.; Sushama, L. Rain-on-snow events over North America based on two Canadian regional climate models. Clim. Dyn. 2017, 50, 303–316. [Google Scholar] [CrossRef] [Green Version]
- Duguay, C.R.; Prowse, T.D.; Bonsal, B.R.; Brown, R.D.; Lacroix, M.P.; Ménard, P. Recent trends in Canadian lake ice cover. Hydrol. Process. 2006, 20, 781–801. [Google Scholar] [CrossRef]
- Ford, J.; Falk, K.; Tesar, C.; Jacobsen, R.B. Adaptation and Resilience. In Adaptation Actions for a Changing Arctic: Perspectives from the Baffin Bay/Davis Strait Region; Arctic Monitoring and Assessment Programme: Oslo, Norway, 2018; pp. 307–328. [Google Scholar]
- Smit, B.; Hovelsrud, G.; Wandel, J. Community Adaptation and Vulnerability in Arctic Regions; Springer: Dordrecht, The Netherlands, 2008. [Google Scholar] [CrossRef]
- Ford, J.D.; Smit, B. A framework for assessing the vulnerability of communities in the Canadian Arctic to risks associated with climate change. Arctic 2004, 57, 389–400. [Google Scholar] [CrossRef]
- Hahn, M.B.; Riederer, A.M.; Foster, S.O. The Livelihood Vulnerability Index: A pragmatic approach to assessing risks from climate variability and change—A case study in Mozambique. Glob. Environ. Chang. 2009, 19, 74–88. [Google Scholar] [CrossRef]
- Wu, S.-Y.; Yarnal, B.; Fisher, A. Vulnerability of coastal communities to sea-level rise: A case study of Cape May County, New Jersey, USA. Clim. Res. 2002, 22, 255–270. [Google Scholar] [CrossRef] [Green Version]
- O’Brien, K.; Quinlan, T.; Ziervogel, G. Vulnerability interventions in the context of multiple stressors: Lessons from the Southern Africa Vulnerability Initiative (SAVI). Environ. Sci. Policy 2009, 12, 23–32. [Google Scholar] [CrossRef]
- Thornton, P.K.; Jones, P.G.; Owiyo, T.M.; Kruska, R.L.; Herrero, M.; Kristjanson, P.; Notenbaert, A.; Bekele, N.; Orindi, V.; Otiende, B.; et al. Mapping Climate Vulnerability and Poverty in Africa; ILRI: Nairobi, Kenya, 2006; 200p. [Google Scholar]
- Sinchi, U.K. Available online: https://sinchi-foundation.com/news/hunting-season-great-slave-lake/ (accessed on 5 January 2019).
- Hamley, W. The Geographical Review; Tourism in the Northwest Territories; Taylor & Francis: Abingdon, UK, 1991; Volume 81, No. 4; pp. 389–399. [Google Scholar]
- Hamley, W. Geography; Problems and Challenges in Canada’s Northwest Territories; Geographical Association: Sheffield, UK, 1993; Volume 78, No. 3; pp. 267–280. [Google Scholar]
- Thornton, P.; Running, S.W.; White, M.A. Generating surfaces of daily meteorological variables over large regions of complex terrain. J. Hydrol. 1997, 190, 214–251. [Google Scholar] [CrossRef] [Green Version]
- Thornton, P.E.; Thornton, M.M.; Mayer, B.W.; Wei, Y.; Devarakonda, R.; Vose, R.S.; Cook, R.B. Daymet: Daily Surface Weather Data on a 1-km Grid for North. America, Version 3; ORNL DAAC: Oak Ridge, TN, USA, 2017. [Google Scholar]
- Cote, J.; Gravel, S.; Methot, A.; Patoine, A.; Roch, M.; Staniforth, A. The operational CMC-MRB global environmental multiscale (GEM) model. Part I: Design considerations and formulations. Mon. Weather. Rev. 1998, 126, 1373–1395. [Google Scholar] [CrossRef]
- Yeh, K.S.; Cote, J.; Gravel, S.; Methot, A.; Patoine, A.; Roch, M.; Staniforth, A. The CMC-MRB global environmental multiscale (GEM) model. Part III: Nonhydrostatic formulation. Mon. Weather. Rev. 2002, 130, 339–356. [Google Scholar] [CrossRef]
- Huziy, O.; Sushama, L. Impact of lake–river connectivity and interflow on the Canadian RCM simulated regional climate and hydrology for Northeast Canada. Clim. Dyn. 2017, 48, 709–725. [Google Scholar] [CrossRef] [Green Version]
- Kourzeneva, E.P.; Samuelsson, P.; Ganbat, G.; Mironov, D. Implementation of lake model Flake into HIRLAM. HIRLAM Newsl. 2008, 54, 54–64. [Google Scholar]
- Martynov, A.; Laprise, R.; Sushama, L. Off-Line Lake Water and Ice Simulations: A Step Towards the Interactive Lake Coupling with the Canadian Regional Climate Model Geophysical Research Abstract, 10, EGU2008-A-02898; EGU General Assembly: Vienna, Austria, 2008. [Google Scholar]
- Mironov, D.; Heise, E.; Kourzeneva, E.; Ritter, B.; Schneider, N.; Terzhevik, A. Implementation of the lake parameterisation scheme Flake into the numerical weather prediction model COSMO. Boreal Environ. Res. 2010, 15, 218–230. [Google Scholar]
- Samuelsson, P.; Kourzeneva, E.; Mironov, D. The impact of lakes on the European climate as simulated by a regional climate model. Boreal Environ. Res. 2010, 15, 113–129. [Google Scholar]
- Kheyrollah Pour, H.; Duguay, C.R.; Martynov, A.; Brown, L.C. Simulation of surface temperature and ice cover of large northern lakes with 1-D models: A comparison with MODIS satellitedata and in situ measurements. Tellus A Dyn. Meteorol. Oceanogr. 2012, 64, 17614. [Google Scholar] [CrossRef] [Green Version]
- Semmler, T.; Cheng, B.; Yang, Y.; Rontu, L. Snow and ice on Bear Lake (Alaska)—Sensitivity experiments with two lake ice models. Tellus A Dyn. Meteorol. Oceanogr. 2012, 64, 17339. [Google Scholar] [CrossRef] [Green Version]
- Mallard, M.S.; Nolte, C.G.; Bullock, O.R.; Spero, T.; Gula, J. Using a coupled lake model with WRF for dynamical downscaling. J. Geophys. Res. Atmos. 2014, 119, 7193–7208. [Google Scholar] [CrossRef]
- IPCC. Climate Change 2001. Impacts, Adaptation and Vulnerability: Summary for Policymakers; Cambridge University Press: Cambridge, UK, 2001. [Google Scholar]
- Ebi, K.L.; Kovats, R.S.; Menne, B. An Approach for Assessing Human Health Vulnerability and Public Health Interventions to Adapt to Climate Change. Environ. Health Perspect. 2006, 114, 1930–1934. [Google Scholar] [CrossRef] [PubMed] [Green Version]
- Notenbaert, A.; Karanja, S.N.; Herrero, M.; Felisberto, M.; Moyo, S. Derivation of a household-level vulnerability index for empirically testing measures of adaptive capacity and vulnerability. Reg. Environ. Chang. 2013, 13, 459–470. [Google Scholar] [CrossRef]
- Speranza, C.I.; Wiesmann, U.; Rist, S. An indicator framework for assessing livelihood resilience in the context of social–ecological dynamics. Glob. Environ. Chang. 2014, 28, 109–119. [Google Scholar] [CrossRef]
- Pandey, R.; Jha, S. Climate vulnerability index—measure of climate change vulnerability to communities: A case of rural Lower Himalaya, India. Mitig. Adapt. Strat. Glob. Chang. 2012, 17, 487–506. [Google Scholar] [CrossRef]
- Wesche, S.; Armitage, D.R. As long as the sun shines, the rivers flow and grass grows’: Vulnerability, adaptation and environmental change in Deninu Kue Traditional Territory, Northwest Territories. In Community Adaptation and Vulnerability in Arctic Regions; Springer: Dordrecht, The Netherlands, 2008; pp. 163–189. [Google Scholar]
- Pearce, T.; Smit, B.; Duerden, F.; Ford, J.; Goose, A.; Kataoyak, F. Inuit vulnerability and adaptive capacity to climate change in Ulukhaktok, Northwest Territories, Canada. Polar. Record. 2010, 46, 157–177. [Google Scholar] [CrossRef] [Green Version]
- Eakin, H.; Bojórquez-Tapia, L.A. Insights into the composition of household vulnerability from multicriteria decision analysis. Glob. Environ. Chang. 2008, 18, 112–127. [Google Scholar] [CrossRef]
- Langemeyer, J.; Gómez-Baggethun, E.; Haase, D.; Scheuer, S.; Elmqvist, T. Bridging the gap between ecosystem service assessments and land-use planning through Multi-Criteria Decision Analysis (MCDA). Environ. Sci. Policy 2016, 62, 45–56. [Google Scholar]
- Sullivan, C.; Meigh, J.R.; Fediw, T.S. Derivation and Testing of the Water Poverty Index Phase1: Final Report; Department for International Development: Wallingford, UK, 2002. [Google Scholar]
- Sullivan, C.; Meigh, J. Targeting attention on local vulnerability using an integrated index approach: The example of the climate vulnerability index. Water Sci. Technol. 2005, 51, 69–78. [Google Scholar] [CrossRef] [PubMed]
- Canadian Encyclopedia, Published by: Historical Canada, Toronto, 2014. Available online: https://www.thecanadianencyclopedia.ca/en/article/nunavut (accessed on 1 November 2020).
- Northwest Bureau of Statistics. Available online: https://www.statsnwt.ca/community-data/index.html (accessed on 1 June 2020).
- Statistics Canada. Yellowknife [Census Agglomeration], Northwest Territories and Northwest Territories [Territory] (Table). Census Profile. 2016 Census. Statistics Canada Catalogue no. 98-316-X2016001. Ottawa. Released November 29, 2017. 2017. Available online: https://www12.statcan.gc.ca/census-recensement/2016/dp-pd/prof/index.cfm?Lang=E (accessed on 3 December 2020).
- Notaro, M.; Zarrin, A.; Vavrus, S.; Bennington, V. Simulation of Heavy Lake-Effect Snowstorms across the Great Lakes Basin by RegCM4: Synoptic Climatology and Variability. Mon. Weather. Rev. 2013, 141, 1990–2014. [Google Scholar] [CrossRef]
- Legates, D.R.; Willmott, C.J. Mean seasonal and spatial variability in global surface air temperature. Theor Appl Climatol. 1990, 41, 11–21. [Google Scholar] [CrossRef]
- Rawlins, M.; Willmott, C.; Shiklomanov, A.; Linder, E.; Frolking, S.; Lammers, R.; Vörösmarty, C. Evaluation of trends in derived snowfall and rainfall across Eurasia and linkages with discharge to the Arctic Ocean. Geophys. Res. Lett. 2006, 33. [Google Scholar] [CrossRef] [Green Version]
- Statistics Canada. Déline, CC [Census Subdivision], Northwest Territories and Region 2, REG [Census Division], Northwest Territories (Table). Census Profile. 2016 Census. Statistics Canada Catalogue no. 98-316-X2016001. Ottawa. Released 29 November 2017. 2017. Available online: https://www12.statcan.gc.ca/census-recensement/2016/dp-pd/prof/index.cfm?Lang=E (accessed on 3 December 2020).
- Statistics Canada. Fort Resolution, HAM [Census subdivision], Northwest Territories and Region 5, REG [Census division], Northwest Territories (table). Census Profile. 2016 Census. Statistics Canada Catalogue No. 98-316-X2016001. Ottawa. Released 29 November 2017. 2017. Available online: https://www12.statcan.gc.ca/census-recensement/2016/dp-pd/prof/index.cfm?Lang=E (accessed on 3 December 2020).
- Statistics Canada. Hay River, T [Census subdivision], Northwest Territories and Region 5, REG [Census division], Northwest Territories (table). Census Profile. 2016 Census. Statistics Canada Catalogue No. 98-316-X2016001. Ottawa. Released 29 November 2017. 2017. Available online: https://www12.statcan.gc.ca/census-recensement/2016/dp-pd/prof/index.cfm?Lang=E (accessed on 3 December 2020).
Figure 1.
Location of each study region (Déline, Fort Resolution, Hay River, and Yellowknife) in relation to Great Bear and Great Slave Lake in the Northwest Territories.
Figure 1.
Location of each study region (Déline, Fort Resolution, Hay River, and Yellowknife) in relation to Great Bear and Great Slave Lake in the Northwest Territories.

Figure 2.
Precipitation exposure variable for the past (1980-2014) simulation driven by ERA_Interim: (a) 99th percentile of daily November precipitation intensity, (b) number of days exceeding 8 mm/day of precipitation for November over the 35-year period, (c) trend in frequency of extreme precipitation days.


Figure 3.
Each community’s exposure to the individual major components of exposure (extremes, average precipitation variables, and average temperature variables).
Figure 3.
Each community’s exposure to the individual major components of exposure (extremes, average precipitation variables, and average temperature variables).

Figure 4.
The overall rank of each community’s exposure to snowstorms by taking into account the three major components of exposure (average temperature variables, average temperature, average precipitation variables, and extremes).
Figure 4.
The overall rank of each community’s exposure to snowstorms by taking into account the three major components of exposure (average temperature variables, average temperature, average precipitation variables, and extremes).

Figure 5.
Each community’s sensitivity to the individual major components of sensitivity (demographic, labor, and health).
Figure 5.
Each community’s sensitivity to the individual major components of sensitivity (demographic, labor, and health).

Figure 6.
The overall rank of each community’s sensitivity to snowstorms by taking into account the three major components of exposure (demographic, labor, and health).
Figure 6.
The overall rank of each community’s sensitivity to snowstorms by taking into account the three major components of exposure (demographic, labor, and health).

Figure 7.
Each community’s ability to adapt to each of the individual capitals under adaptive capacity (human capital, physical capital, financial capital, social network, natural capital).
Figure 7.
Each community’s ability to adapt to each of the individual capitals under adaptive capacity (human capital, physical capital, financial capital, social network, natural capital).

Figure 8.
The overall rank of each community’s adaptive capacity as determined by the five types of capital (human capital, physical capital, financial capital, social network, natural capital).
Figure 8.
The overall rank of each community’s adaptive capacity as determined by the five types of capital (human capital, physical capital, financial capital, social network, natural capital).

Figure 9.
The overall livelihood vulnerability of each community as determined by its three contributing factors (exposure, sensitivity, and adaptive capacity).
Figure 9.
The overall livelihood vulnerability of each community as determined by its three contributing factors (exposure, sensitivity, and adaptive capacity).

Figure 10.
The overall rank of each community’s livelihood vulnerability index, indicating each community’s vulnerability to November snowstorms by taking into account the three major contributing factors (adaptive capacity, sensitivity, and exposure).
Figure 10.
The overall rank of each community’s livelihood vulnerability index, indicating each community’s vulnerability to November snowstorms by taking into account the three major contributing factors (adaptive capacity, sensitivity, and exposure).

Figure 11.
Projected changes in extreme daily precipitation intensity for November (a) 2015–2049 and (b) 2050–2084; projected changes in extreme daily precipitation frequency for November, (c) 2015–2049 and (d) 2050–2084.
Figure 11.
Projected changes in extreme daily precipitation intensity for November (a) 2015–2049 and (b) 2050–2084; projected changes in extreme daily precipitation frequency for November, (c) 2015–2049 and (d) 2050–2084.

Table 1.
Description of each study regions’ title, population, geographic coordinates, and associated Great Lake.
Table 1.
Description of each study regions’ title, population, geographic coordinates, and associated Great Lake.
| Name | Title | Population (2016) | Coordinate Location | Closest Lake |
|---|---|---|---|---|
| Yellowknife | City | 19,234 | 62.46 N 114.44 W | Great Slave |
| Hay River | Town | 3606 | 60.84 N 115.78 W | Great Slave |
| Déline | Charter Community | 533 | 65.21 N 123.43 W | Great Bear |
| Fort Resolution | Hamlet | 474 | 61.18 N 113.69 W | Great Slave |
Publisher’s Note: MDPI stays neutral with regard to jurisdictional claims in published maps and institutional affiliations. |
© 2021 by the authors. Licensee MDPI, Basel, Switzerland. This article is an open access article distributed under the terms and conditions of the Creative Commons Attribution (CC BY) license (https://creativecommons.org/licenses/by/4.0/).
Share and Cite
MDPI and ACS Style
Baijnath-Rodino, J.A.; Albizua, A.; Sushama, L.; Bennett, E.; Robinson, B.E. Determining Freshwater Lake Communities’ Vulnerability to Snowstorms in the Northwest Territories. Water 2021, 13, 1816. https://doi.org/10.3390/w13131816
AMA Style
Baijnath-Rodino JA, Albizua A, Sushama L, Bennett E, Robinson BE. Determining Freshwater Lake Communities’ Vulnerability to Snowstorms in the Northwest Territories. Water. 2021; 13(13):1816. https://doi.org/10.3390/w13131816
Chicago/Turabian StyleBaijnath-Rodino, Janine A., Amaia Albizua, Laxmi Sushama, Elena Bennett, and Brian E. Robinson. 2021. "Determining Freshwater Lake Communities’ Vulnerability to Snowstorms in the Northwest Territories" Water 13, no. 13: 1816. https://doi.org/10.3390/w13131816
Note that from the first issue of 2016, this journal uses article numbers instead of page numbers. See further details here.