1. Introduction
Currently, under the rising pressures of increasing water demand along with climate change effects, i.e., changes in water distribution and reduced water availability and quality extremes, a key challenge in water resources management is the adaptation of the water storage capacity to strengthen water security [
1,
2]. Water storage provides a mechanism for dealing with variability, which, if planned and managed correctly, increases water security, agricultural productivity and adaptive capacity [
3]. Reservoirs are one of the most important infrastructures for integrated water resources management [
4] and play an important role in mitigating the negative impacts of climate change [
5]. From this point of view, a water reservoir can play a fundamental role in safeguarding potable water demand, irrigation, hydropower production and/or livestock during water-scarce periods. Thus, as also described by Mulligan et al. [
6], they support agricultural and economic activity and enhance people’s well-being.
The World Commission on Dams [
7], by the end of the twentieth century, lists 45,000 dams throughout the world, acknowledging their contribution to human development, but also noting the severe and often unnecessary impacts in numerous cases. Dams have a profound impact on ecosystem structures, functions and services in basins via regulation of basin water resources, which in turn affects basin water resources, soil, climate and biodiversity [
8]. More precisely, dams can have negative upstream and downstream impacts including: dispossession of lands; downstream geological alterations due to sediment trapping; natural fish migration; isolation and/or extinction; flood hazard in the case of dam failure; disruption of the riverine ecosystem, such as fragmentation, reduction of biodiversity and water quality due to nutrients sequestration; greenhouse gases generation (methane), as a result of anaerobic degradation of biomass [
9,
10,
11]. Studying the trade-offs and synergies between ecosystem services upstream and downstream of dams is of great importance because such studies can help reach win–win goals for regional development and ecological protection [
12].
Furthermore, as the inventory of new potential dam sites is shrinking, construction of additional reservoirs is less likely to be compared to simultaneous flow and sediment management in existing reservoirs [
13]. Existing reservoirs with given storage capacity and management plans are vulnerable to hydrologic and socioeconomic alterations. Vulnerability of water resources systems to floods and droughts is expected to increase, and the trade-offs between reservoir releases to maintain flood control storage, drought resilience, ecological flow, human water demand and energy production should be reconsidered [
14].
Assessment of climate change effects on water resources management and allocation for an existing reservoir is achieved via hydrological models, which require reliable historic climatic (e.g., temperature, precipitation or evapotranspiration) and hydrologic (e.g., runoff) time series and future projections in the near future (taking 2050 as the reference average year for the period 2041–2060) and/or the far future (taking 2070 as the reference average year for the period 2061–2080), as defined in the fifth report of the Intergovernmental Panel on Climate Change [
15]. Future projections can be derived either by the use of plausible climate scenarios and global climate models (GCMs), or by extrapolation of historic data. For future climate change uncertainties, a range of climate scenarios should be considered in impact assessments. A climate scenario is a plausible representation of the future climate that has been constructed for explicit use by investigating the potential impacts of anthropogenic climate change [
16]. Climate scenarios often make use of climate projections (descriptions of the modeled response of the climate system to scenarios of greenhouse gas and aerosol concentrations), by manipulating model outputs and combining them with observed climate data. Scenario construction techniques can be contrasted according to the sources of uncertainty that they address. Such sources are unknown future emissions of greenhouse gases and aerosols, conversion of emissions to atmospheric concentrations and the climate change imposed by radiative effects, modeling the response of the climate system to forcing and methods for regionalizing GCM results and those that they ignore [
16].
These techniques do not always provide consistent results. There is a number of studies questioning whether climate models provide plausible prediction of the future hydroclimate, when comparing model outputs with real data of the recent or earlier past [
17,
18,
19,
20,
21]. Accurately predicting the future is difficult if not impossible, and hydrologic planning will always consider probabilistic or multiple plausible realizations and adopt adaptive risk management with systems planned for particular levels of security or reliability [
22]. Considering their strengths and weaknesses, we consider both possibilities (i.e., by using plausible climate scenarios and global climate models (GCMs) or by extrapolation of historic data) in order to incorporate the uncertainty of runoff change. For downscaled climate change data, including maximum, mean and minimum temperature and precipitation, there are three climate databases most widely used in ecology to date [
23]: (i) the WorldClim [
24], (ii) CRU TS datasets [
25], and (iii) the EuMedClim [
26], which differ in data quality over time and space. A detailed comparison is provided in [
26], enabling the selection based on the specific characteristics of each case study.
Apart from hydrologic alterations, the reservoir operation depends on the increase of the dead storage due to sediment deposition. The sediment volume retained into a reservoir can decrease its potential storage capacity and subsequently its performance in terms of the water and energy services it provides. Dam sedimentation presents geographic and seasonal differences because of strong dependence on the globally and seasonally differing climate conditions regarding mainly rainfall and temperature, which also affect dam inflows [
27,
28]. For watershed management agencies, the estimation of annual sediment yield and the sediment delivery has been a top priority due to the influence that sedimentation has on the holding capacity of reservoirs and the annual economic cost of sediment-related disasters [
29]. Morris [
30] gave a classification of the available strategies that combat reservoir sedimentation in order to be used by practitioners as a checklist in evaluating sediment management alternatives of new designs and remedial work at existing sediment-challenged reservoirs. Kondolf et al. [
31] summarizes the collective experience from five continents in managing reservoir sediments and mitigating downstream sediment starvation.
According to the World Commission on Dams [
7], the annual rate of loss in the storage capacity of the world’s reservoirs was approximately 0.5–1.0% (in terms of water volume), driving to a 50% reduction of storage capacity for most dams by 2050. Morris and Fan [
32], note the need to replace the concept of a limited design life with dual management of flow and sediment to preserve and ensure sustainability of existing reservoir sites instead of constructing new dams, as the number of potential new sites is shrinking. The importance of considering this need is also claimed by Oehy and Schleiss [
33], who noted that today’s loss in storage capacity due to reservoir sedimentation is higher than the increase of capacity due to construction of new reservoirs [
13]. Numerous studies have reported sedimentation rates for small and large reservoirs across the globe; others have attempted to derive correlations between sedimentation rates and variability in these rates over time relative to catchment area, land use/cover, precipitation and sediment sources; in all cases the complexity in correlating sedimentation rates to one or a few variables is shown [
13,
34,
35,
36,
37].
Τhe research on reservoir operation affected by future climate change is thoroughly analyzed by Feng et al. [
37]; two main concepts are identified: (1) reservoir reoperation, incorporating ecological flow into the operation model to obtain trade-offs between environmental requirements and human needs [
38,
39,
40], and (2) adaptive operation, i.e., adapting the reservoir operation to climate change and focusing on impacts of the changing environment on the water resources system [
41]. The proposed framework of adaptive reservoir operation includes incorporating the future weather generator model, the hydrological model and the reservoir operation model [
42,
43]. Therefore, the main impetus for this paper is the need to reassess supply capacity and management resilience for an existing reservoir under climate change, considering also the trade-off between the active storage reduction over time and the benefit by the probable use of excess water.
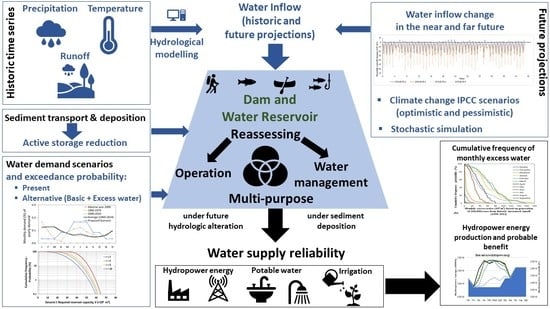
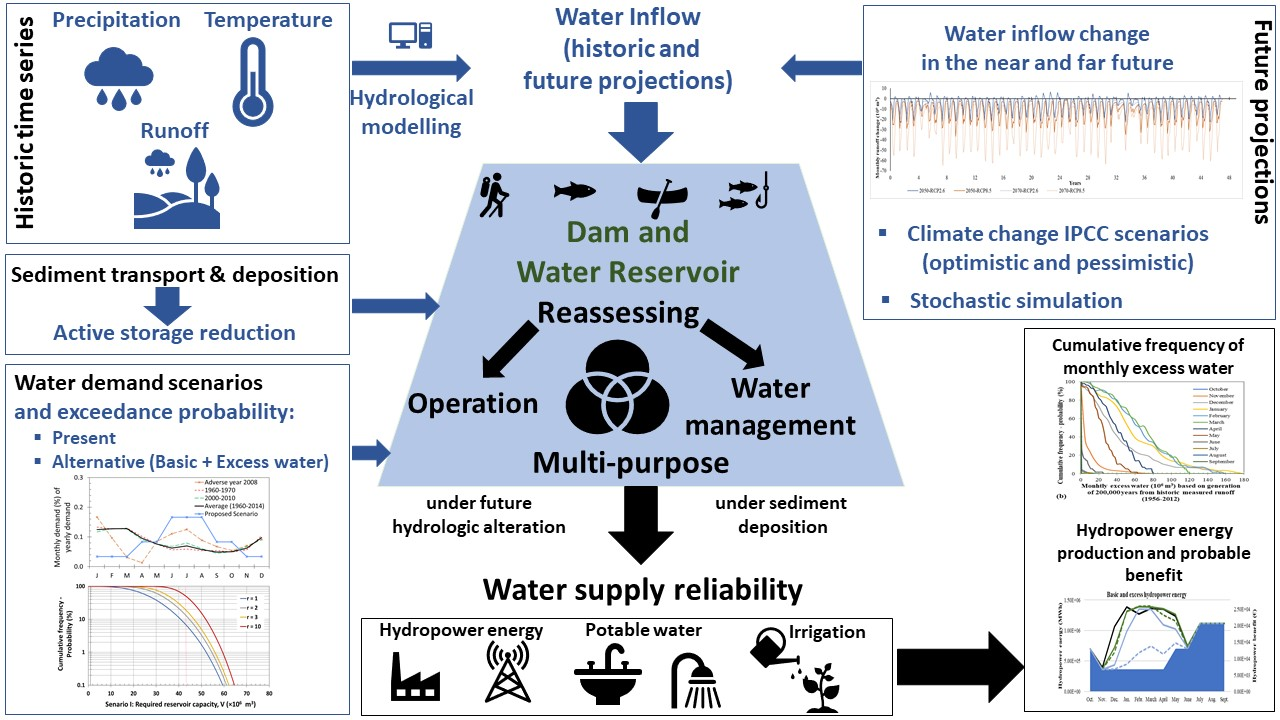
The present paper aims: (i) to propose a methodological framework for the reassessment of the present reservoir management strategy under future hydrologic conditions and the reduction of active storage due to sediment deposition and (ii) to examine, under a probabilistic prism, possible alterations of the reservoir management by proposing the use of additional excess water volumes enabling multiple-purpose water demands. More precisely, the novel methodology for multiple-year regulation of reservoir active storage capacity as proposed by Yannopoulos and Demetracopoulos [
44] is used and properly adjusted to determine a basic monthly reservoir operating scheme for which there is a low probability of exceedance (<5%) for the present and future active storage capacity of the reservoir. Then, the additional excess water releases are stochastically simulated based on the near and far future hydrologic uncertainty. For future climatic projections, both concepts (climatic scenarios and stochastic simulation) are considered, as analyzed above, in order to incorporate the uncertainty of the runoff change. The methodology is applied to the Ladhon (Ladon or Ladonas) Reservoir, in Northwestern Peloponnisos (Greece). The paper is structured as follows: In
Section 2, the steps of the proposed methodology are provided in a synoptic and general way; in
Section 3, the case study is shortly described, and each step of the methodology is thoroughly analyzed in order to demonstrate its application; in
Section 4, the results and discussion are presented; in
Section 5, conclusions are drawn.
3. Ladhon Dam
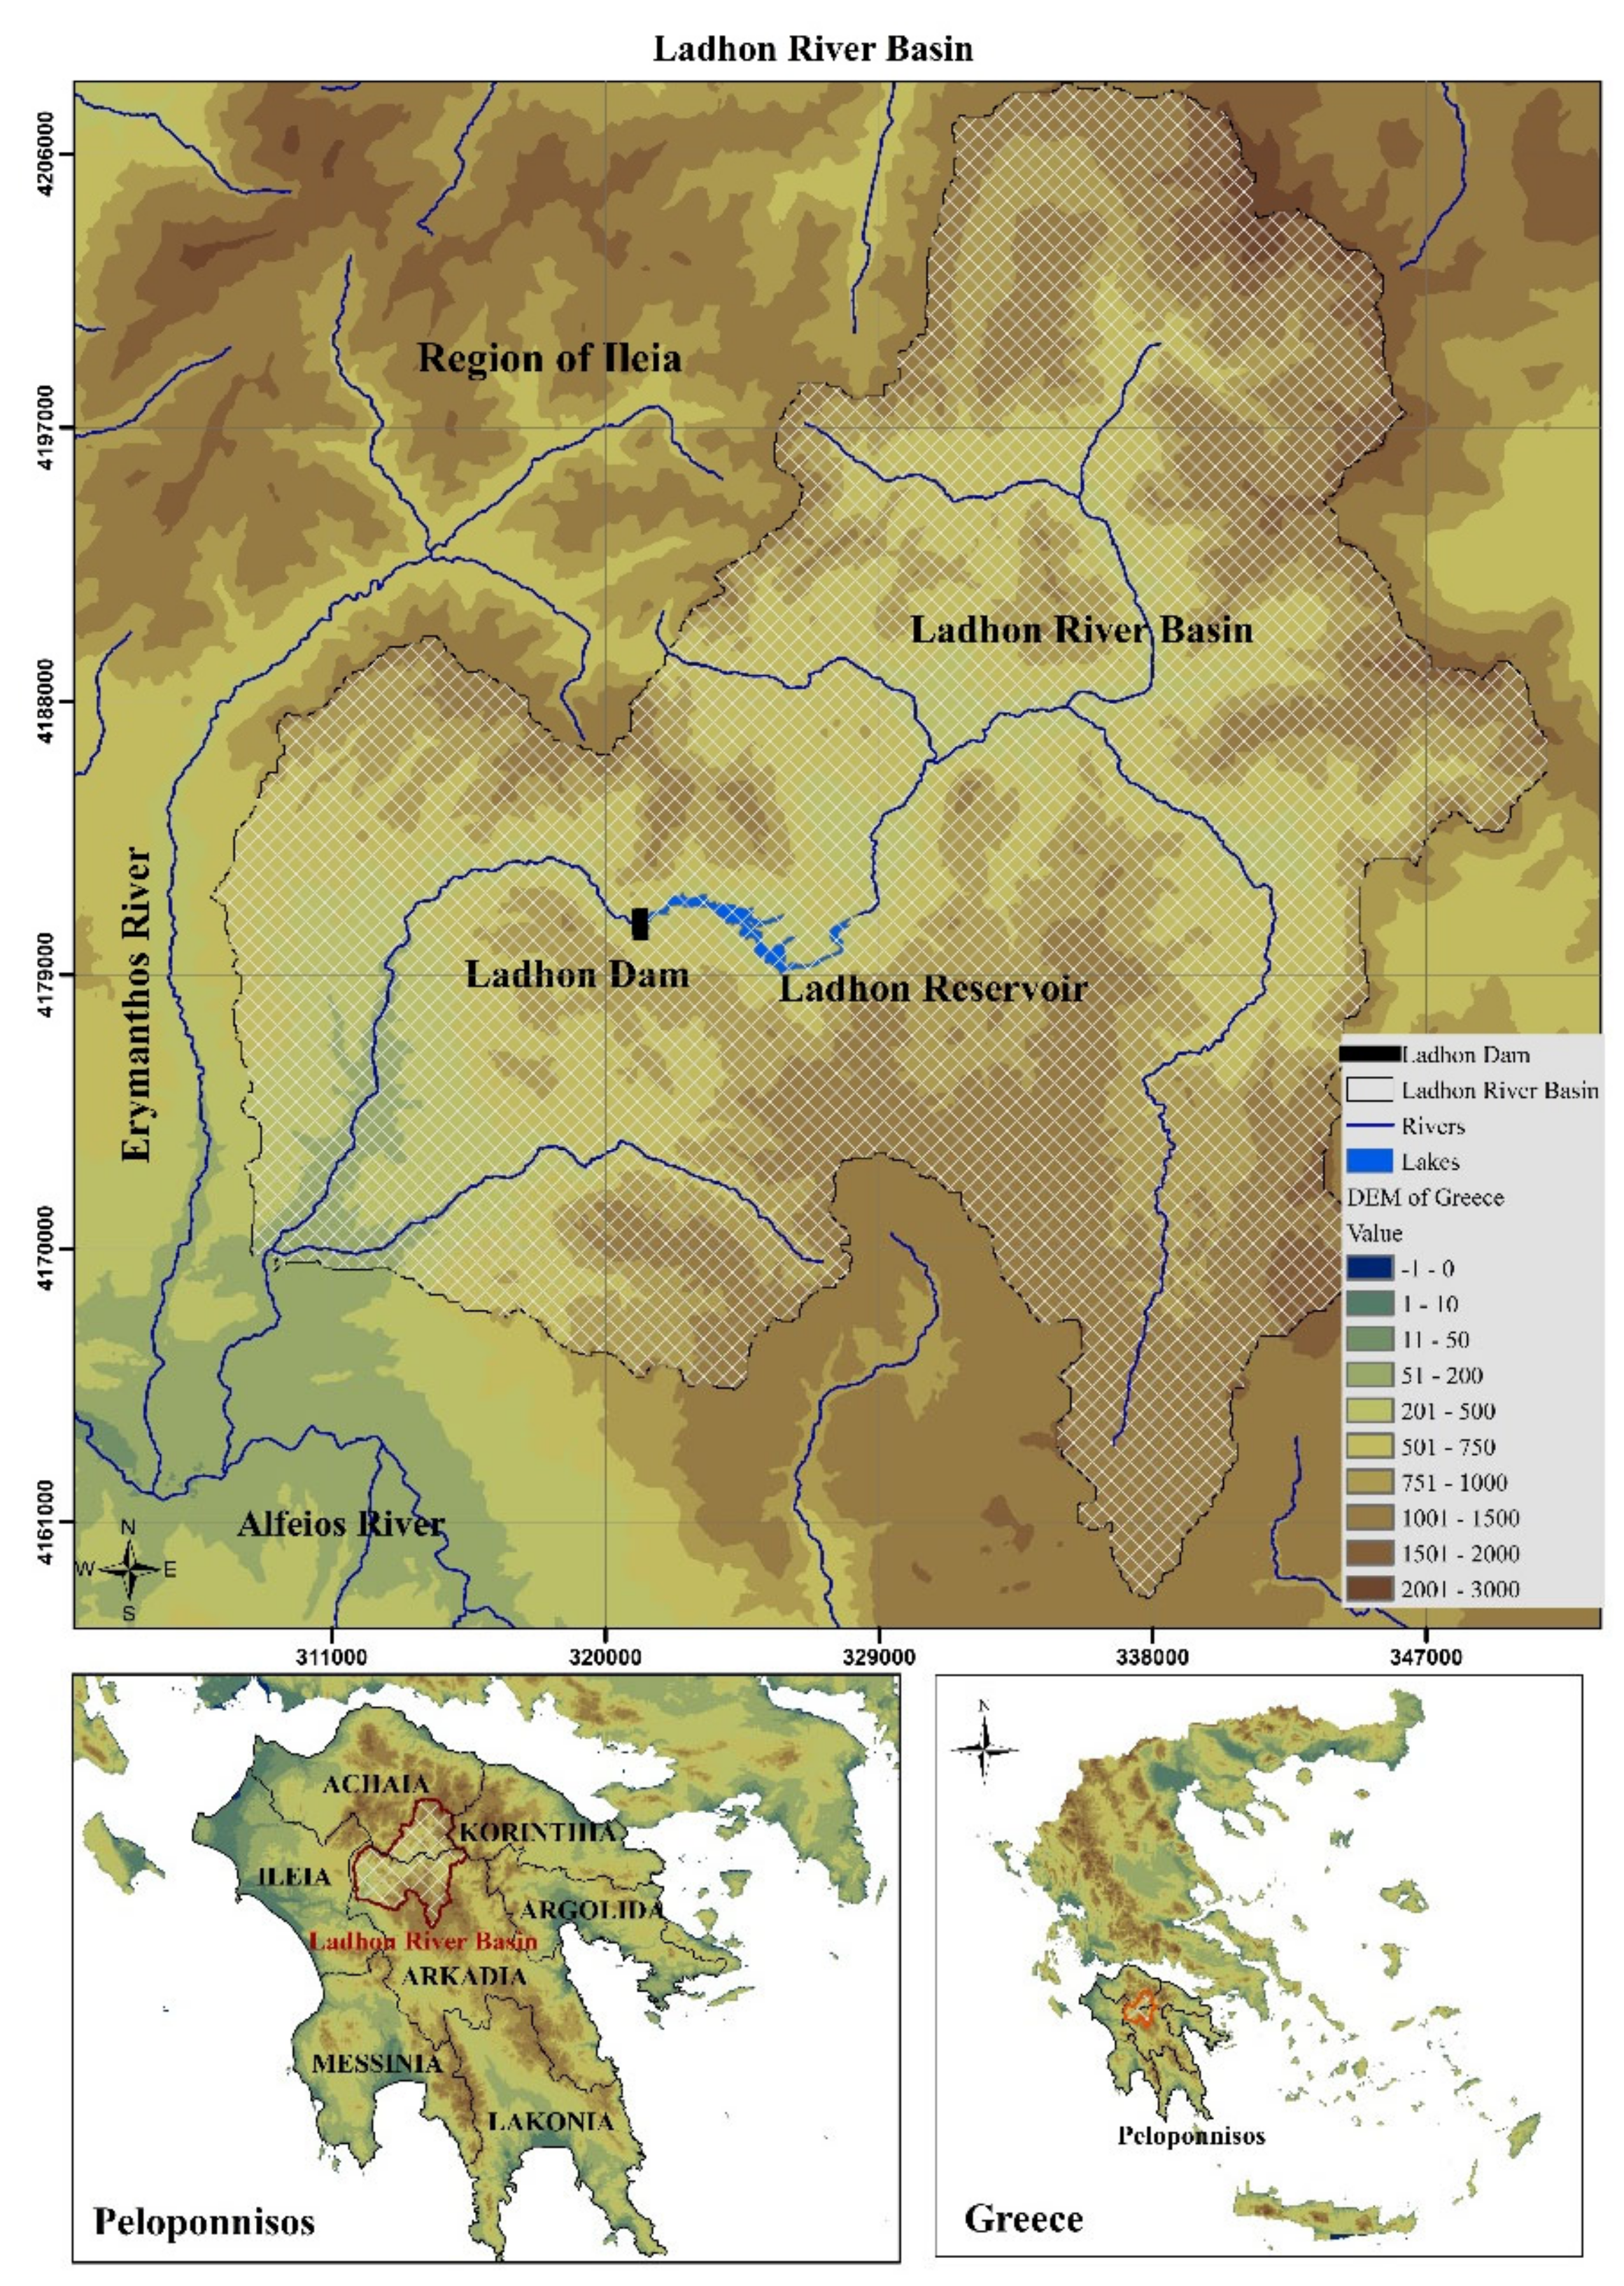
In order to implement the management procedure described in the previous section, the Ladhon Dam and Reservoir was selected. As shown in
Figure 1, Ladhon River is situated in Central-Western Peloponnisos, demarcating the boundaries between the regions of Achaia and Arcadia. It is the most important tributary of the Alfeios River, draining almost one third of the Alfeios basin total area, and is mainly supplied by karstic sources [
9]. The prevailing climate in the Ladhon River Basin ranges from temperate to the continental type based on Köppen climate classification. Precipitation averages 1123 mm annually, ranging from 529 to 1714 mm. The annual basin mean air temperature is 13.98 °C with a range of variation less than 8.5 °C.
At 420 m above sea level, a gravity concrete dam of medium size (101.5 m crest length and 56 m height) was built at Tropaia between 1950 and 1955. Ladhon Dam corresponds to a river basin area of 749 km
2, forming a reservoir in a meander-type valley, mainly composed of limestone and shale with a 4 km
2 lake area and 46.2 × 10
6 m
3 storage volume [
46]. Approximately 8 km downstream, one of the first major hydroelectric power stations (HPS) in Greece was built in 1955 and set in operation in 1956 by the Hellenic Public Power Corporation (HPPC). Ladhon HPS, due to its hydropower variability, has been used mainly as a peak load power plant. Under the need to increase the renewable energy share into the Greek Energy sector, in line with the EU Directive on Renewable Energy, it is worth investigating, for current and future hydrologic conditions, the possibility to reassess the role of such an HPS and propose an alternative operating scheme. Based on the exceedance probabilities, the proposed scheme involves the stable monthly excess releases of water in the usage for extra demand. This concept is closer to the philosophy of the base load power plants, which supply a dependable and consistent amount of electricity, to meet the minimum demand.
The highest water inflows into Ladhon Dam are mainly during winter and spring with the highest value observed in February 2003 (60.61 m
3/s), when serious flooding events were reported. The hydrologic year 2007–2008 was the worst in terms of water inflows and in the summer of 2007 extremely hot and dry weather conditions in Greece, combined with strong winds, led to a disastrous upsurge of forest fires and wildfires, burning large forested areas (Aleppo pine forests, low vegetation and meadows) of Western and Northern Peloponnisos [
9]. In Diakakis et al. [
47], an increase in reported flood events in Peloponnisos since 1960 and especially in the last 25 years is observed with the highest concentration of events in the lower Alfeios basin (Region of Ileia) and Laconia, mainly in November and January. Heavy rainfall events (e.g., in winter 2003 and 2019) generate spill events at Ladhon Dam, with reported damages to downstream agricultural areas in the lower part of Ladhon River Basin and the wider Alfeios lower area.
3.1. Water Demand and Supply Pattern from Ladhon Reservoir
The main water uses of Ladhon Reservoir are primarily hydropower production at the Ladhon hydropower station (HPS) and secondarily water supply to Alfeios River in order to cover the irrigation demand of the Flokas works, linked with the diversion Flokas Dam situated almost 20 km upstream of the Alfeios River outflow into the Kyparissiakos Gulf. The irrigation water demand extends officially from May to September, whereas in most years could be further extended from April up to October due to dry climatic conditions. Based on these water use priorities, a monthly minimum reservoir level serves as guidance for the operation of the Ladhon HPS. The general rule of thumb is to start on January 1st with a minimum water level at 402 ± 1 m and increase it until May at the target level of 419 ± 1 m, in order to satisfy mainly irrigation demands.
A critical point of the present research is the determination of an alternative water demand scenario for managing the future reservoir operation, which can be satisfied with a high probability based on the historical reservoir water inflows. Firstly, the reservoir water inflows and outflows during the available historic period (1956–2014) are analyzed. The water releases are analogous to the water inflow rates, aiming solely at hydroelectric energy production (single reservoir purpose). The partial satisfaction of irrigation demands during the dry period of each year becomes a matter of conflict as an extra decision between HPPC and local irrigation authorities is necessary every year [
48,
49]. The previously mentioned reservoir operation is shown in
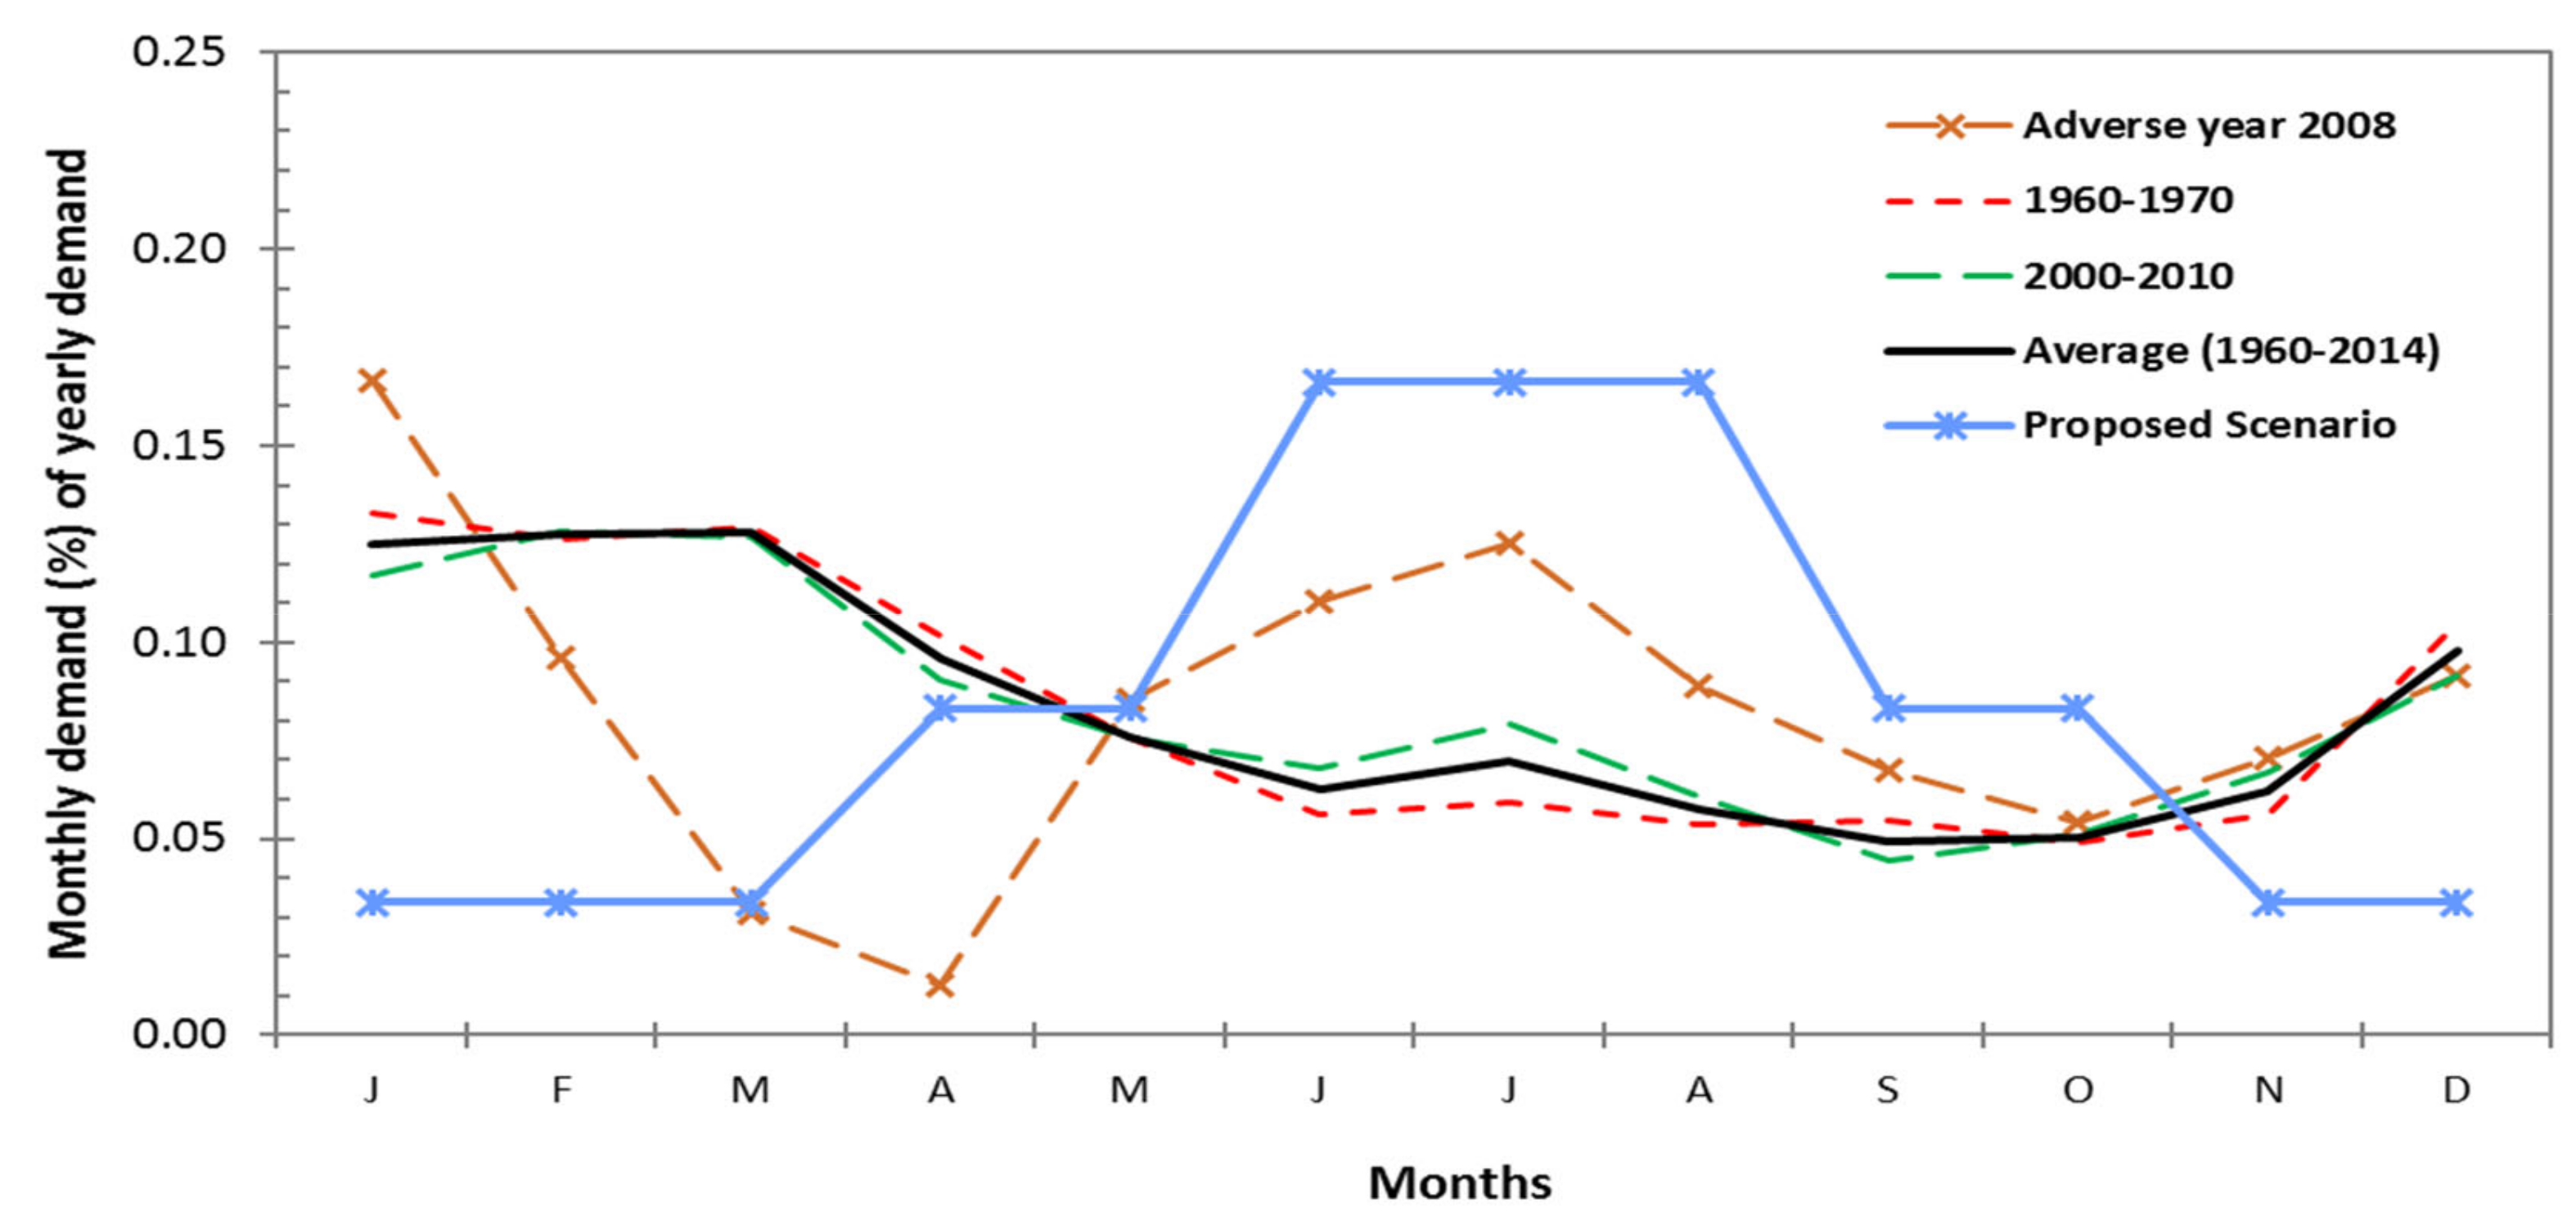
Figure 2 (i.e., the average of the historic timeseries (1956–2014) with the black solid line, the average of the decade 1960–1970 with the red dotted line, the average of the decade 2000–2010 with the green dotted lines, the most adverse hydrologic year 2008 with the orange line and the alternative proposed scenario with the blue line), where the monthly water use is given in the vertical axis as a percentage of the yearly water quantity, which is usually about equal to the yearly runoff.
The alternative demand scenario proposed is based on the analysis of water inflows and the corresponding energy production. It is assumed that the future annual demand should be satisfied in the case of the most adverse water inflows as in 2008. Since Alfeios River provides water to the fertile land of the Ileia Region situated at the lower Alfeios basin close to its estuary, its main tributary Ladhon should serve, besides hydropower production, also the irrigation needs of the agricultural areas of this land. Therefore, the aim of the selected scenario for the operation of Ladhon Reservoir is to satisfy both the irrigation demand target and a predetermined monthly hydropower production threshold. The proposed scenario is shown in
Figure 2. The yearly total demand is determined to be 192.58 × 10
6 m
3, which is equal to the lowest yearly runoff observed in the period (1956–2012) and occurred in the most adverse year 2008. As this year was the driest of the whole period, PPC forced by the local authorities, charged for safeguarding water irrigation, to drastically change the program of Ladhon Reservoir operation, according to which hydropower constitutes the single purpose, Thus, PPC reserved water during the winter period and provided it during the irrigation period. The proposed reservoir operation scenario is quite different from the average operation of the reservoir (black solid line), since it emphasizes the multiple-purpose water management of the reservoir. It satisfies irrigation needs even in unfavorable (dry) years (see the most adverse yearly demands in 2008), while ensuring a minimum prescribed hydroelectric energy production, as the future trend is to combine the usage of the green energy alternatives, i.e., solar, water, wind and other kinds of renewable energy sources. Since higher reservoir water inflows are expected during winter, compared to the hydrologic regime of the adverse year 2008, additional hydropower energy can be produced than the least scheduled ones, as proposed by the alternative management scenario. In this sense, the past and present role of Ladhon Reservoir in the Greek energy power map is expected to change from serving only as the peaking power plant to a more reliable and stable base-load power plant.
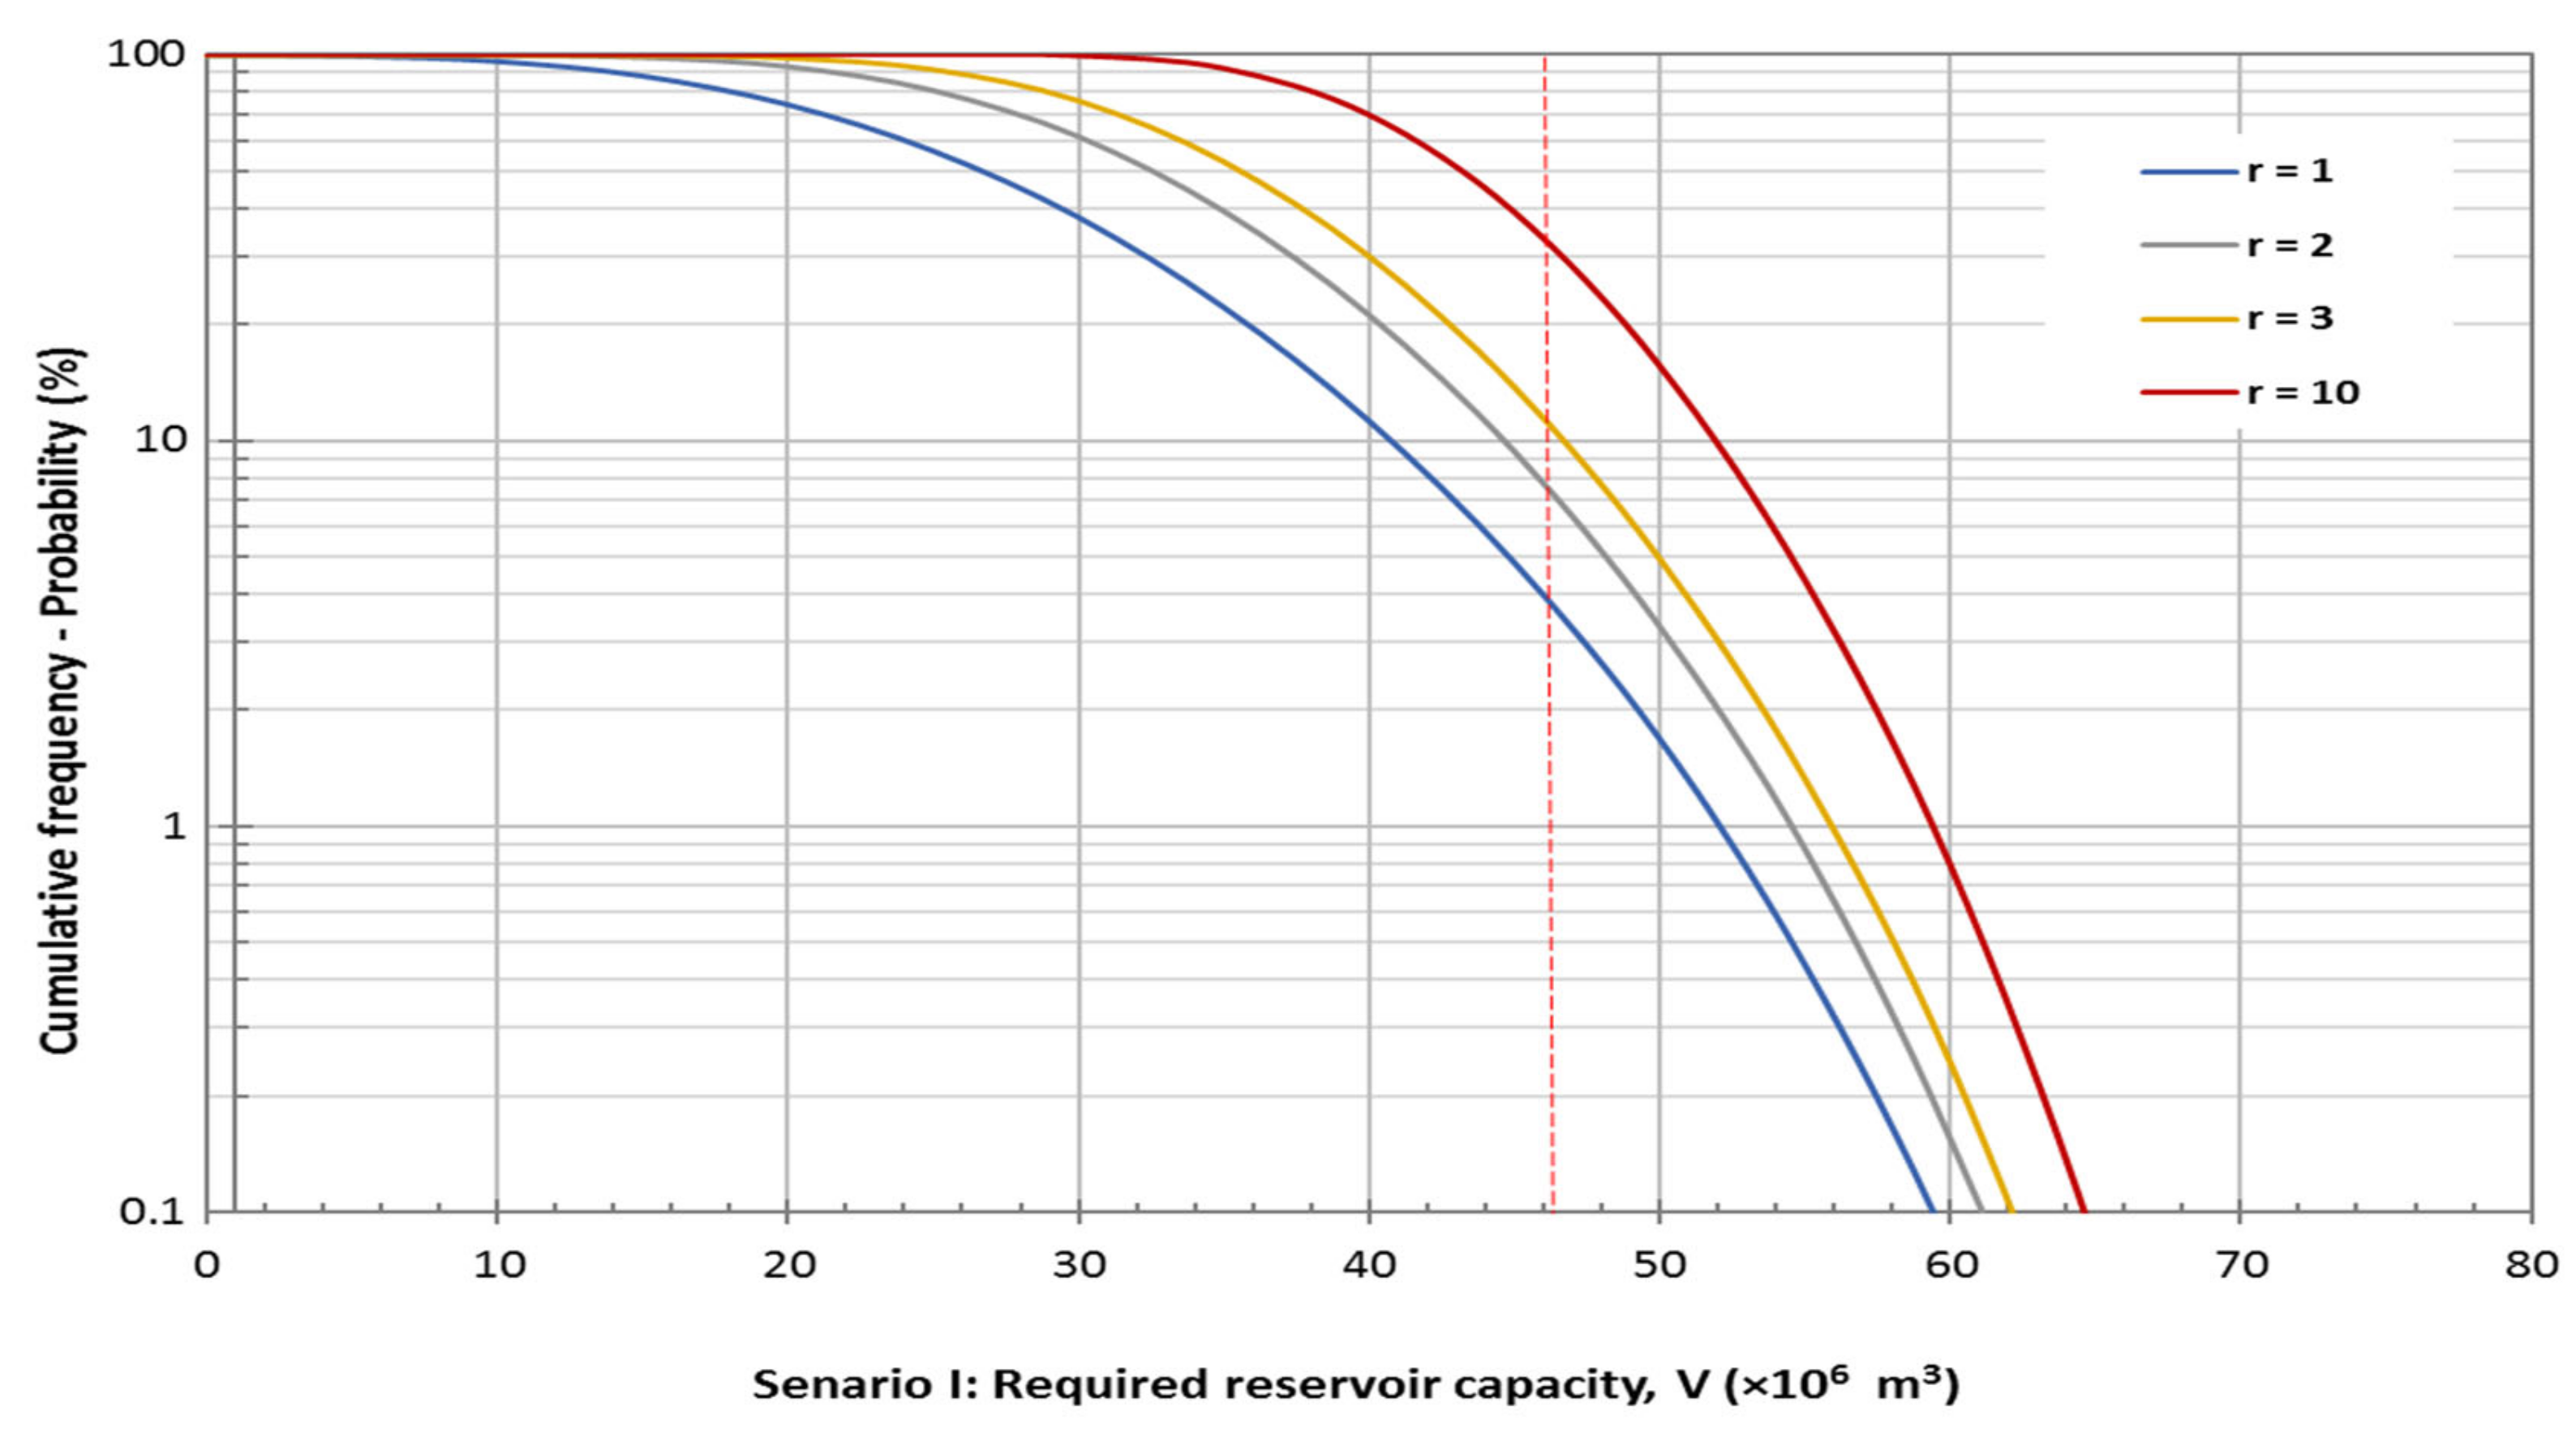
Assuming a zero height dam and following the novel methodology of Yannopoulos and Demetracopoulos [
44], the exceedance probability with respect to any given reservoir volume is computed and shown in
Figure 3 for the regulation periods r = 1, 2, 3 and 10 years derived for the actual runoff data (1956–2012) using the above scenario. For the proposed water management scenario and the actual dam capacity due to sediment deposition into Ladhon Reservoir (see
Section 3.4), if similar hydrologic conditions with the historic time series (1956–2012) were assumed, the reservoir should satisfy the demand shown in
Table 1 with a 90% probability (10% exceedance probability) for a one (1) year regulation period. Therefore, the proposed scenario suggests a significant change of future reservoir water management, which could be more flexible and beneficial (i.e., resilient) for the local communities and the state.
3.2. Past and Future Meteorological and Hydrologic Data
The available historical record of the meteorological stations of the Hellenic National Meteorological Service (HNMS) close to the Ladhon Dam includes measured time series of mean monthly rainfall and temperature for a 47-year time period (1957–2004) for the Ladhon Basin (
Appendix A,
Table A1). The time series of measured mean monthly inflows into the Ladhon Reservoir and water releases, as provided by the Hellenic Public Power Corporation from the operation of Ladhon Dam and its adjacent hydropower station, are available from October 1956 to September 2012. The meteorological data from 2005 to 2012, which is the additional time period with available hydrological and operational data from Ladhon Dam, but not from the meteorological stations, were not available from the HNMS.
The future climatic and hydrologic projections are approximated by both approaches analyzed in the Introduction, i.e., (a) using plausible climate scenarios and global climate models and (b) by properly extrapolating historic data. To apply the future climate scenario approach, we selected one of the most widely used climate database, the WorldClim version 1.4 [
24]. This database includes: (i) the 1960–1990 average climate for monthly precipitation, mean, minimum and maximum daily temperatures and 19 derived bioclimatic variables, at high geospatial resolution (GeoTIFF of 1 km × 1 km), referred as the baseline ‘current’ climate. The data layers were generated through spline surface fitting spatial interpolation of average monthly climate data from weather stations around the world. (ii) Future climate data (monthly average of total precipitation and monthly minimum and maximum temperature over the reference future period) for two future time periods: (a) 2050 (average for 2041–2060), referred to as the near future, and (b) 2070 (average for 2061–2080), referred to as the far future. The provided climatic data are downscaled and calibrated (bias corrected) outputs from global climate models (GCMs) using the WorldClim 1.4 baseline ‘current’ climate for four representative concentration pathways (RCPs) based on the Fifth Assessment of the Intergovernmental Panel on Climate Change (IPCC) report [
15]. In order to approximate the minimum and maximum runoff change, we considered the two extreme climate-change IPCC scenarios, being (a) the “optimistic”, RCP 2.6, representing an environmental-friendly future with a draconian climate policy and (b) the “pessimistic”, RCP 8.5, representing an unsustainable future without any policy restrictions for mitigating climate change. More precisely, the RCP 2.6 limits the increase of the global mean temperature to 2 °C and represents the lowest emissions as a result of the most stringent climate policy [
50]. The RCP 8.5 is characterized by increasing greenhouse gas emissions over time, representative of scenarios in the literature that lead to high greenhouse gas concentration levels without a climate policy [
51].
In order to estimate the water inflows into the Ladhon Reservoir, for each climatic scenario (current and the two extreme future scenarios projected to the near and far future), the 1 km × 1 km grid data of the GFDL Climate Model version 3 (CM3) of the NOAA Geophysical Fluid Dynamics Laboratory (GFDL) [
52] was chosen. This model has been suggested by McSweeney et al. [
53] as one of the most appropriate climate models for the Mediterranean region. This database provides the mean monthly average temperature and precipitation for the time projections to 2050 (average for 2041–2060) and 2070 (average for 2061–2080) of the two-extreme climate-change scenarios. Thus, we applied the following process to produce a time series of equal time length as the historic record (1957–2004). Based exclusively on the mean monthly averages of the WorldClim database, the monthly average change between the present (monthly average of the historic period 1960–1990 provided by WorldClim v.1.4) and the corresponding values of the two extreme climate change scenarios for the near and the far future were computed. These monthly average differences have been applied to the available 47-years historic record of monthly precipitation and temperature, resulting in a new time series of the same time length, but having as mean monthly values the ones of the future projections. From this process, five in the total time series of 47 years (one current and four future for the two future scenarios and the near and the far future) for the mean monthly precipitation are available and, accordingly, five for the mean monthly temperature.
Based on the historic meteorological and hydrologic monthly time series (with a common period of 1957–2004), the simple lumped conceptual river basin ZYGOS model [
54,
55], having a similar logic as the HBV model [
56], but requiring less hydrologic data input, has been selected and used for the hydrologic simulation of the Ladhon River Basin [
48,
49]. The aforementioned software models the main hydrological processes of a watershed, using a lumped approach. It implements a conceptual soil moisture accounting scheme, based on a generalization of the standard Thornthwaite model, extended with a groundwater tank. A global optimization procedure, implementing the evolutionary annealing simplex algorithm, is included for the automatic estimation of model parameters, using as evaluation criterion the coefficient of determination [
57]. Input data are the monthly precipitation and the potential monthly evapotranspiration time series (estimated from the mean monthly temperature based on the Thornthwaite method) as inputs. The objective function value of the calibration process for the Ladhon Basin is 0.8 [
48,
49]. Based on the calibrated ZYGOS model, the monthly inflow water volumes for the near and the far future for the two extreme climate-change scenarios are estimated using as inputs the derived 47 years of mean monthly precipitation and evapotranspiration (using the mean monthly temperature from the Thornthwaite method) as described above.
The future climatic and hydrologic projections are approximated additionally by the second methodological approach, using the statistical characteristics of the real recorded time series and a proper extrapolation to the future. For this purpose, the stochastic software of CASTALIA [
45,
58,
59] for the stochastic simulation and forecasting of hydrologic variables has been selected. This model includes: (1) multivariate analysis (for many hydrologic processes, including rain, temperature and discharge and geographical correlated locations) and (2) multiple time scales (monthly and yearly) in a disaggregation framework. It enables the preservation of essential marginal statistics up to third order (skewness) and joint second order statistics (auto- and cross-correlations) and the reproduction of long-term persistence (Hurst phenomenon) and periodicity. The measured monthly water inflows into the Ladhon Reservoir (1956–2012) serve as inputs into CASTALIA. The forecasting procedure can be conducted in two alternative modes: (i) in steady-state simulations, by generating a long time series, which represent statistically rare events, and evaluating extreme probabilities, and (ii) in terminating simulations, in which the present and past states of the system under study must be considered, thus the observed values of the present and past must condition the hydrological time series of the future [
45], by generating numerous time series of a time horizon (referred to as multiple hydrological scenarios) of, typically, a few years, where the observed past records of the hydrological variables are introduced to the generation scheme, in order to obtain statistical predictions of their future values. For the Ladhon Basin, the latter mode is used generating 15,500 short-time hydrologic scenarios for a time length of ten years of a monthly time step, using the recorded monthly runoff at Ladhon Dam (1956–2012).
3.3. Generation of a Long Synthetic Record and Computation of Water Releases
Based on the historic and future time series of monthly runoff derived from the two approaches, we generated a very long synthetic record of random hydrologic years, as proposed in the novel methodology for multiple-year regulation of reservoir active storage capacity by Yannopoulos and Demetracopoulos [
44]. More precisely, for each monthly water inflow time series, a random year consisting of random water inflow values for each month, corresponding to the available monthly values for the 47 hydrologic years, was generated. This algorithmic procedure was repeated 200,000 times to produce 200,000 (bootstrap) hydrologic years. For the generated year and the water demand: (i) the required reservoir capacity was computed for a zero-height dam [
44] and (ii) the water releases from the reservoir and the excess water volumes were computed from the monthly water balance of the Ladhon Reservoir based on the current and future reservoir storage capacity (as computed in step (5) of
Section 2). If the reservoir capacity is greater than the minimum required capacity for satisfaction of the demand, the excess water partly remains as a residue in the reservoir and partly overflows from the spillway of the dam. If the reservoir capacity is less than the minimum required capacity for the satisfaction of the demand, then the excess water totally overflows from the spillway of the dam. In the latter case, the demand is only partially satisfied. Nevertheless, if an amount of water during or before the high runoff period could be used for an extra water purpose (hydroelectric energy production, drinking water and other market purposes), it would allow the reservoir to store and use greater amounts of water on a yearly basis, without affecting the percentage of demand satisfaction.
3.4. Sediment Retention in the Ladhon Reservoir
For an accurate estimation of basin soil loss and sediment transport, a systematic hydromorphologic monitoring of a dam reservoir along with sediment discharge measurements, would have been required. However, such information is not available for Ladhon Reservoir. Therefore, a fairly reliable estimation of sediment yield and dead storage for a reservoir with no such measurements, such as Ladhon Reservoir, was undertaken by making use of the RUSLE2015 database [
60] of soil loss by water at high resolution, combined with a process of low requirements for additional input data as described below. The estimation of the soil erosion by water at the Ladhon Dam was based on the dataset of soil loss by water erosion in Europe available by the Joint Research Centre (JRC) of the European Commission. The Global Soil Erosion Modelling platform (GloSEM available at
https://esdac.jrc.ec.europa.eu/content/global-soil-erosion accessed on 10 January 2021) provides an assessment of global soil erosion (in t ha
−1 yr
−1) for 2001 and 2012, which is estimated by application of a modified version of the revised universal soil loss equation (RUSLE) model, at a spatial resolution of 25 km (pixel size) [
60]. Based on the total Ladhon drainage basin, a GIS map of the total soil erosion (in t ha
−1 yr
−1) was produced, resulting in a total soil loss for the entire basin equal to 951.392 t/yr, which is comparable with some relevant estimates of other Greek rivers by [
61]. Now, for the drainage area cut off corresponding to the Ladhon Dam, the soil loss was equal to 834.155 t/yr. On the basis of monthly suspended sediment flux data available for other Greek rivers discharging into the Ionian Sea, i.e., Acheloos River (2.5 × 10
6 t), Arachthos River (7.3 × 10
6 t), Kalamas River (1.9 × 10
6 t) and on the basis of published information on sediment fluxes in the NE Mediterranean Sea (e.g., [
62]), an amount of some 2.5 × 10
6 tons per year of suspended sediment and an amount of more than 3 × 10
6 tons of total sediment load are expected to be transported annually by the Alfeios River towards its deltaic coast [
63]. Approximately 25% of the sediment load corresponded to the drainage area cut off from the Ladhon Dam, resulting in 750,000 t/yr of total sediment load. This was in good agreement with the 834,155 t/yr estimated earlier.
The sediment yield was approximated as a fraction of the soil erosion through a sediment yield factor (SDR). The SDR connects the eroded sediment volume and transports it from the drainage area to the sediment volumes entering streams and rivers. It is estimated empirically either by correlation exclusively with the basin area or with the hydro-morphologic basin characteristics. The first method, i.e., using only the basin area, is widely used for providing direct, quick and reliable results even though it represents a simplification of the sediment transport process [
64,
65]. Moreover, the area is strongly correlated to the sediment yield, compared to the hydromorphologic data, whose correlation shows greater variation. The three relations more widely used are the empirical relationships of Renfro [
66], of USDA-SCS [
67] and of Vanoni [
68]. The Vanoni relationship [
68], 𝑆𝐷𝑅 = 0.42 × 𝐴
−0.125, (with A the area in mi
2), was selected for this study since it is the most general as a result of a dataset from 300 basins worldwide. The corresponding sediment yield of the entire basin was 178.105 t/yr (for SDR 0.187) and for the basin area cut off by Ladhon Dam, 161.524 t/yr (for SDR 0.194). Moreover, in the environmental impact report of Flokas Dam, a value of 210.07 t/km
2 was computed for the Alfeios basin, based on the simple empirical relationship of Koutsoyiannis and Tarla [
69] where the mean annual sediment transport is linked to the mean annual precipitation and a geological factor expressing the erosion. For the Ladhon Dam’s draining area, the mean annual sediment yield can then be approximated as 159,863 t/yr, which is similar to our previous estimate.
Finally, for the total volume of sediment depositions in the Ladhon reservoir, assuming a bulk density of the retained sediments of the order of 2 t/m3, an annual sediment volume retained in the reservoir of 80,762 m3/yr was estimated. Then, for a steady annual sediment volume, the increase of the dead volume due to sediment retention results in: (i) 5,249,518 m3 after 65 years (1955–2020), reducing its active storage by 5%, (ii) 8,479,990 m3 after 105 years (1955–2060), reducing its active storage by 12%, and (iii) 10,095,226 m3 after 125 years (1955–2080), reducing its active storage by 16%. The sediment volume in the reservoir after 40 years was estimated to be equal to 3,230,472 m3, which is comparable to the theoretical dead volume of the reservoir (given in the Ladhon Dam study as 2,890,000 m3).
For assessing the effect of active storage decrease due to sediment deposition to the target reliability supply, the novel methodology for multiple-year regulation of reservoir active storage capacity proposed by [
44] Yannopoulos and Demetracopoulos (2018) is alternatively used. More precisely, this method, based on a very long record of monthly inflows and predetermined monthly water demands, provides a robust way to select reservoir capacity as a function of the reservoir regulation period and the exceedance probability. The computation of reservoir active storage capacity was performed with the aid of the concept of a zero-height dam proposed by the authors for the first time. The method is in the spirit of the methods initiated by [
70] Rippl (1883); it is, however, easier to interpret physically and implement computationally. The analysis is depicted graphically, demonstrating the cumulative frequency of exceedance, interpreted as the probability of exceedance, for any reservoir volume capacity for the considered regulation periods (commonly up to three years).
Figure 3 shows the exceedance probability for any reservoir volume capacity for the regulation periods of 1, 2, 3 and 10 years and the demand scenario given in
Table 1. The meaning of a x% probability of exceedance for a given reservoir storage volume is that, in x% of the time period, the given reservoir storage will fail to fully satisfy the given demand, since a higher reservoir volume is required. By assuming a “zero-height dam” at the existing Ladhon Dam, we built these exceedance probability diagrams for the predetermined monthly water demand from Ladhon Reservoir (as estimated in step (1) of
Section 2) and for the water inflow time series of current and future climate scenarios (as estimated in step (4) of
Section 2). For the present and future active storage of Ladhon Reservoir (as computed in step (5) of
Section 2), the corresponding exceedance probabilities are considered as a measure of the reliability of this storage volume to satisfy the predetermined monthly water demand.
4. Results and Discussion
4.1. Current and Future Water Inflow in Ladhon Reservoir
Starting with the statistical characteristics of the monthly water inflows into Ladhon Reservoir, the results for the historic and future time series are provided in
Table A1 and
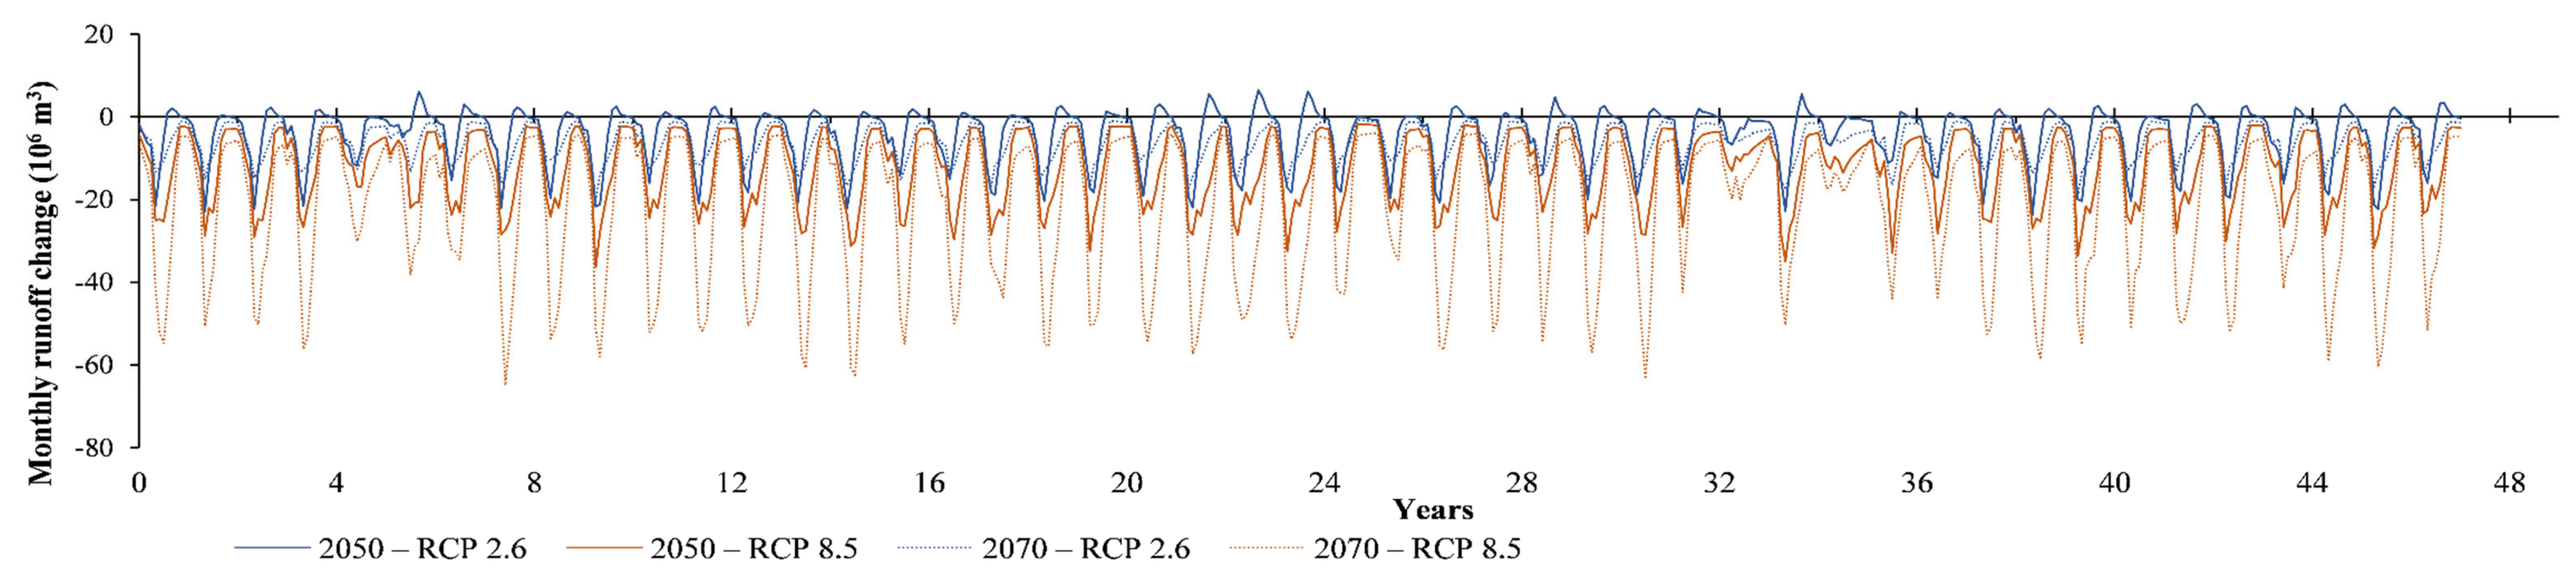
Table A2. The effect of two extreme climate change IPCC scenarios (optimistic and pessimistic scenario) for the near (solid line) and for the far (dotted line) future on the water inflows into Ladhon Reservoir is shown graphically in
Figure 4. Through the comparison of the simulated historic and future monthly runoff into the Ladhon Reservoir, it is worth noticing that: (i) For the optimistic IPCC climatic scenario, RCP 2.6, in the near future (2050) the runoff was mainly reduced from October until March up to 25%, and then a small increase up to 5% is noticed for the spring and summer period, which is in accordance with the scenario assumptions. In the far future (2070), the runoff decreased throughout the year with the highest reduction reported from September until January (15%) (with the highest reduction value in October (26%)), and for the rest of the months the runoff was reduced from 9% to 14% during the spring and summer period. (ii) For the pessimistic IPCC climatic scenario, RCP 8.5, in the near future (2050) the runoff was reduced from approximately 30 up to 40% for the winter and autumn period and from 20% up to 30% for spring and summer. In the far future (2070), the runoff decreased more than 40% throughout the year with the highest reduction reported in October (61%) and the lowest in June and July (42%). As it can be seen from this table, the simulated monthly runoff values with the ZYGOS hydrologic model were good approximations of the recorded (real) values for most months except for the low flow conditions during the dry period. More precisely the runoff for October was underestimated by 30% and for the summer period from 23% (June) up to 40% (September). This can be attributed to the fact that the Ladhon Basin is interconnected with its neighboring basins with water inflow contributions through karstic sources that cannot be easily incorporated into the hydrologic simulation. This deviation between measured and simulated runoff was taken into consideration by taking the relative runoff change instead of its absolute value between the simulated historic and future runoff values (being all simulated with ZYGOS and therefore comparable).
Let us consider the stochastic simulation by using the Castalia software. We produced 15,500 stochastic scenarios with each scenario having 10 years duration (starting from the next year of the historic measured period (1956–2012), that being the hydrologic year 2012–2013 up to 2012–2022). The mean monthly values of these stochastic scenarios are given in
Table A3 (and the column 15,500 stochastic scenarios—10 years (2012–2021)) and compared to the mean values of the historic (measured) runoff record, the following conclusions can be drawn. From December to March the stochastic mean monthly runoff was reduced from 40% up to 60% (December: −47%, January: −58%, February: −43% and March: −42%); from August to October a smaller reduction is noticed ranging from 15 to 18% (August: −18%, September: −15% and October: −16%). Therefore, the most significant reduction was estimated from December to April, resulting in mean runoff values lying between the corresponding runoff values derived from the optimistic and pessimistic IPCC climatic scenarios in the far future. For the other months the reduction of the mean monthly runoff was comparable to the corresponding values derived from the optimistic IPCC climatic scenario in the near future.
4.2. Excess Water Volume
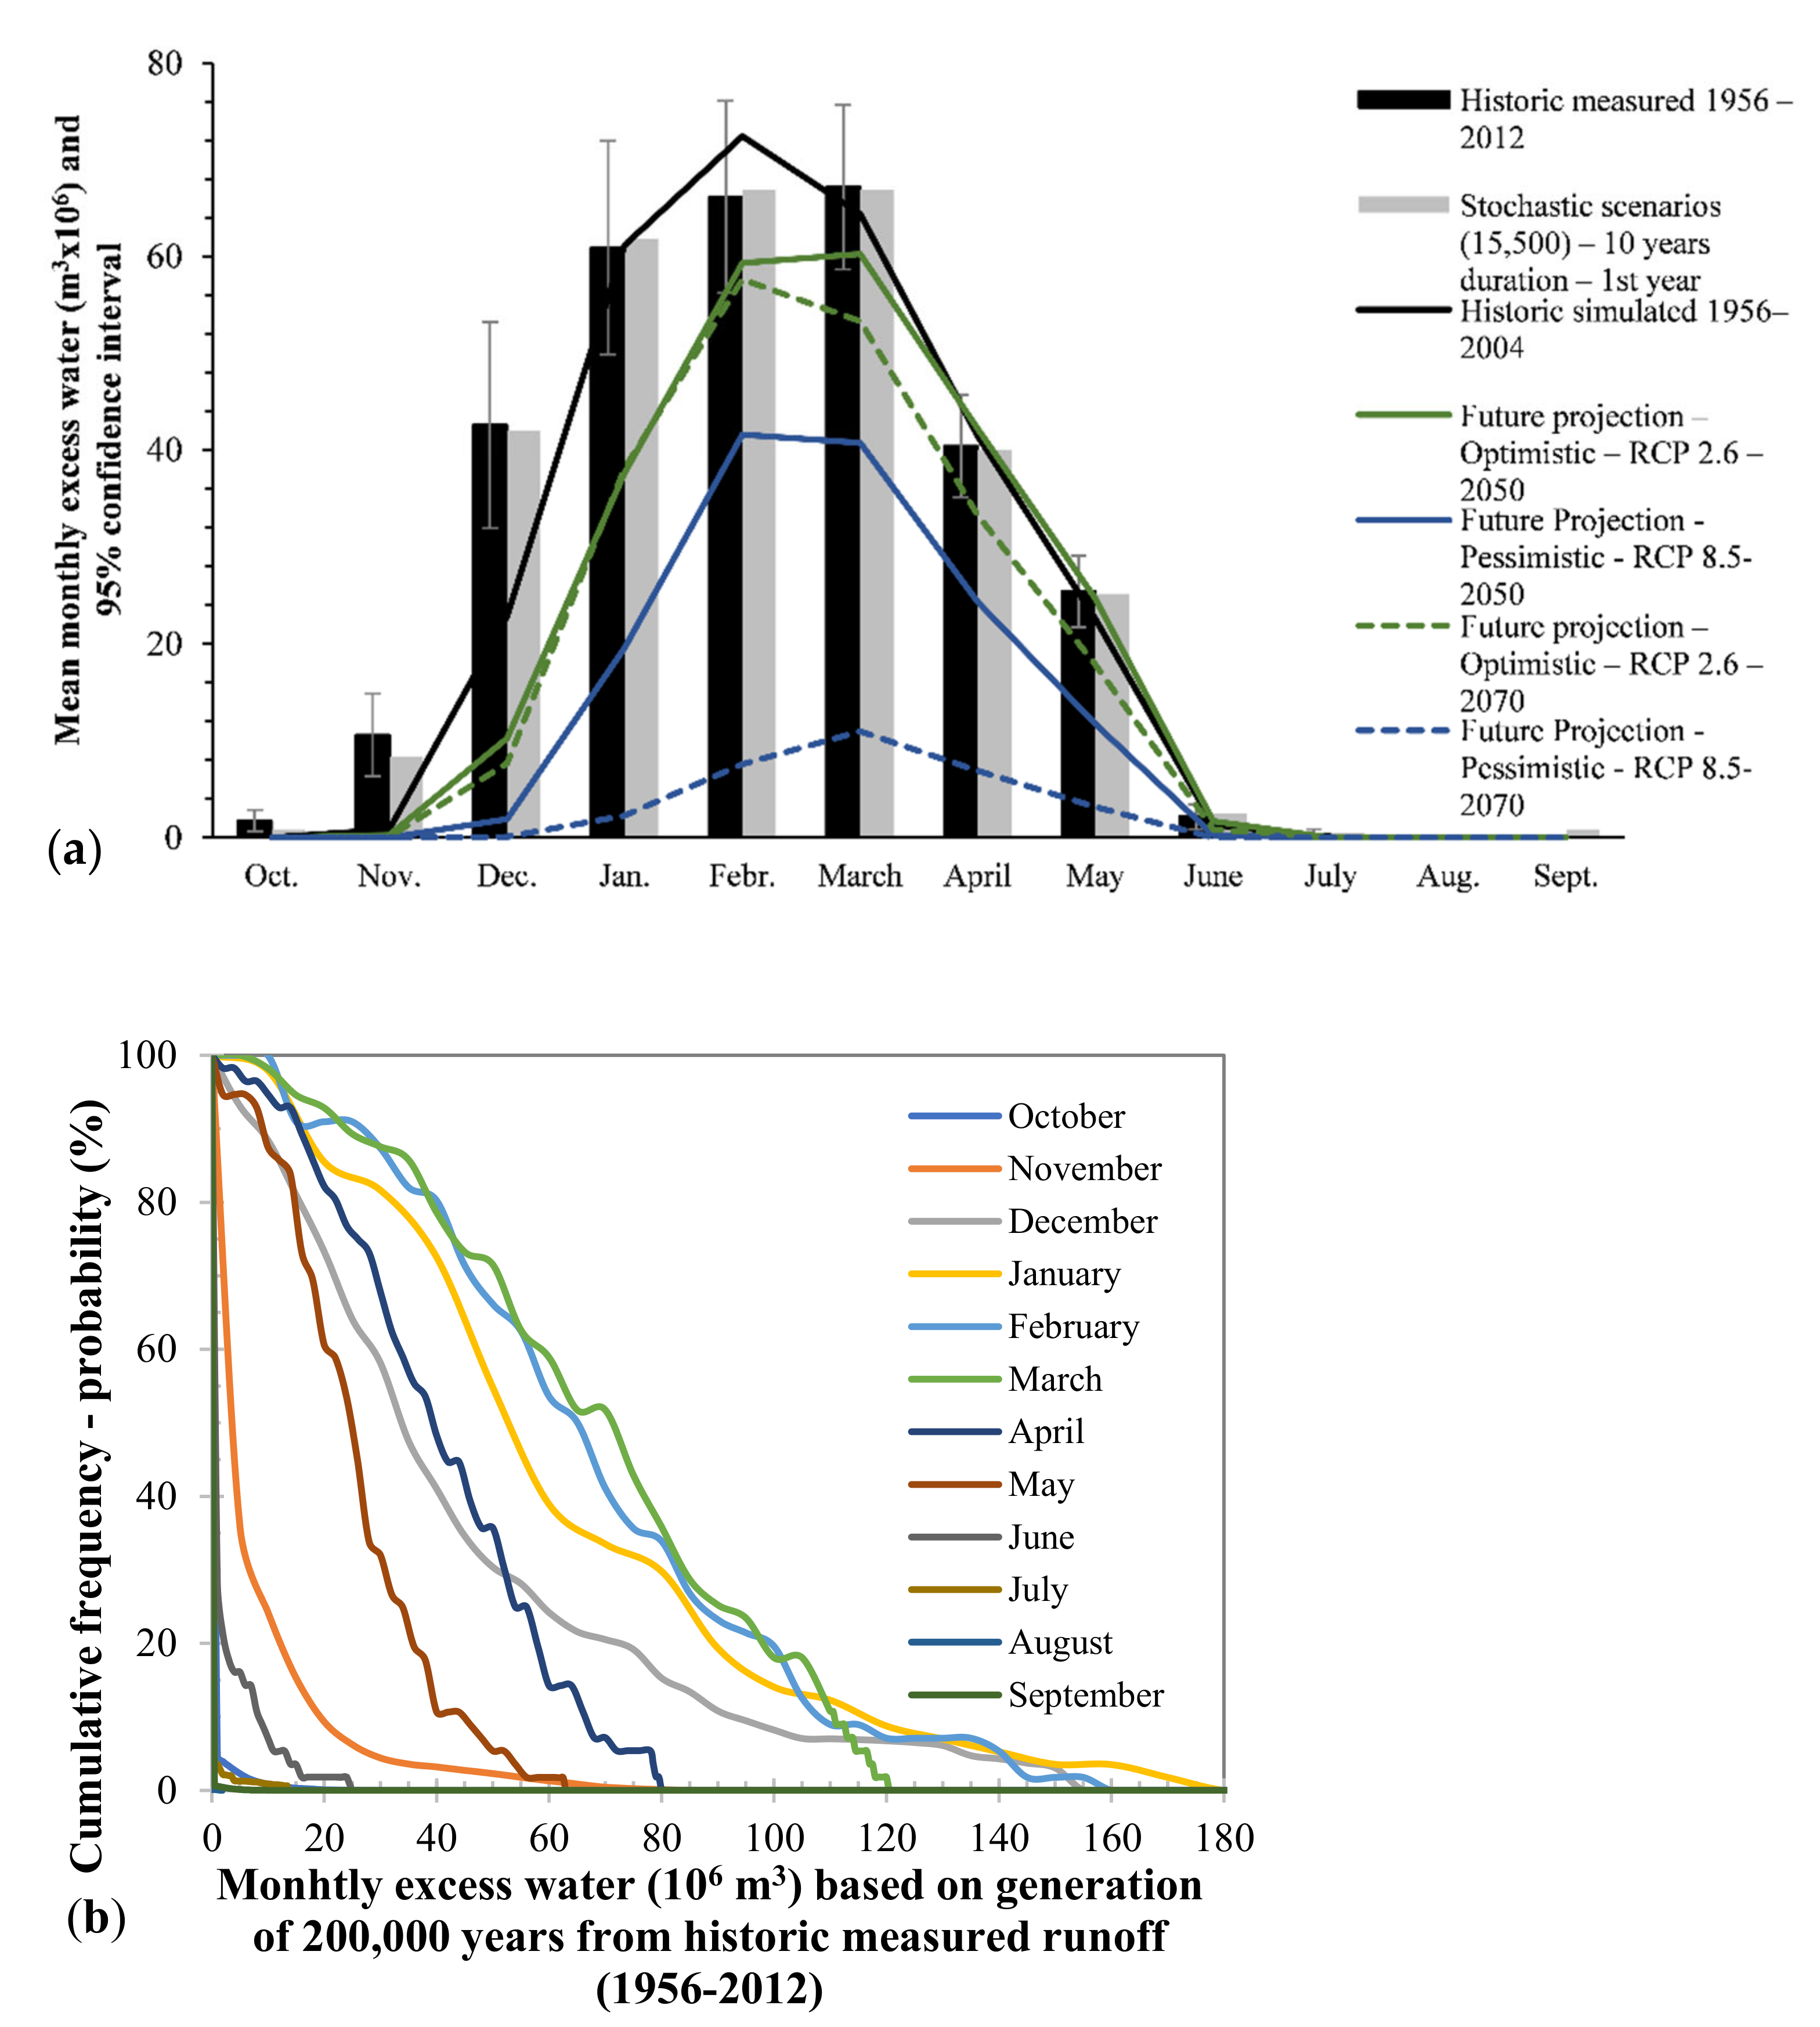
The monthly excess water volume represents the additional water volume with high variability and higher exceedance probability in comparison to the basic monthly water volume, which corresponds to the proposed water management scenario selected to fully satisfy the water demand for current and future hydrologic conditions with a very low exceedance probability. Firstly, the mean monthly excess water volume and its 95% confidence interval were computed for the historic (measured and simulated) and future (stochastic simulation and IPCC climate change scenarios) hydrologic conditions (
Figure 5a and
Table A4). The results show that from December until April at least 40 × 10
6 m
3 of the excess water volume (where the mean excess water volume, multiplied by 10
6 m
3, was 40 in December, 60 in January, 65 in February, 65 in March and 40 in April) could be used for additional hydropower production from the Ladhon Reservoir without restricting the need for irrigation water demand during the dry period. During that period, a lower monthly mean excess water was available for additional irrigation purposes (with a mean excess water volume in May of 25 × 10
6 m
3, June of 2.5 × 10
6 m
3, July of 0.5 × 10
6 m
3, August of 0, September of 0.6 × 10
6 m
3 and October of 1.5 × 10
6 m
3).
The mean monthly excess water derived from the future stochastic runoff simulations using the CASTALIA software did not deviate significantly from the historic measured runoff time series (1956–2012), which are depicted as bars in
Figure 5a. For most of the months the excess water volume change of future stochastic scenarios compared to historic records was less than ±15%, except for October with a reduction to about half (−51%) and November with −21%.
Comparing the mean monthly excess water derived from the historic measured and simulated runoff time series, a similar deviation of the simulated from the measured values reported for the monthly water inflows into Ladhon Reservoir is also noticed for the monthly excess water volumes. This deviation is a matter of estimation based on the reservoir water balance (estimated water inflow and precise outflow for a given reservoir volume). More precisely, from January to May the mean excess water volumes resulting from the historic simulated hydrologic data does not deviate significantly from the measured ones, whereas for the dry period the mean excess water volumes from the simulated data are close to zero and significantly below from the corresponding values of the historic measured data. For this reason, the results derived from the historic simulated data were compared only with the ones from the future climate change IPCC scenarios (which were also simulated using the hydrologic model, as analyzed above) and their relative change (instead of the absolute values) was analyzed. These excess water volumes are depicted as lines in
Figure 5a.
Generally, for the summer period (including June, July and August) and for September and October, and therefore for the months covering the main irrigation period, the mean excess water volume for the current and future climate scenarios was zero and the change could not be analyzed. By comparing the future mean excess water volumes to the ones derived from the historic simulated runoff, for the optimistic IPCC climate change scenarios, RCP 2.6, we found: (i) In the near future there was a small increase of the mean excess water volume for the beginning of the dry period when water is required for irrigation purposes, i.e., for April (2%), for May (9%) and for June (29%), which is in accordance to the storytelling of the climatic scenario. For the other months, a variable decrease of mean excess water is observed with the smallest in March (with −6%) and the highest in November (with −67%). (ii) In the far future, the mean excess water volume reduced for all months. From February to May a small decrease (about 20%) is shown, in January and June a medium decrease (about 40%) and a drastic decrease in December (−66%) and in November (−90%). Therefore, for the optimistic IPCC climate change scenarios, the mean excess water from February to May, mainly used for hydropower energy production, did not change significantly by considering the hydrologic uncertainty of the near and the far future. For the other months, i.e., the remaining wet period (November, December and January) targeting hydropower production and for the remaining dry period (June, July, August, September and October) targeting irrigation, the mean excess water for hydropower and irrigation was subject to a medium to significant decrease in the near and the far future.
For the pessimistic IPCC climate change scenarios, RCP 8.5: (i) in the near future, there was at least a 35% decrease of the mean excess water volume for all months. From February to May, when water was only used for hydropower production, the reduction of the mean excess water ranged from 35 to 50%. For the remaining wet period (November, December and January) a higher decrease was computed, ranging from 66% to 99%. (ii) In the far future, the mean excess water volume was reduced for all months more than 80%, and, therefore, the additional hydropower production and irrigation could not be guaranteed.
A critical point for the mean monthly excess water volumes is to identify how probable is their occurrence within the time period. Within the proposed methodological framework, the cumulative frequency of exceedance for the monthly excess water (10
6 m
3) from historic measured runoff (1956–2012) was built and is shown in
Figure 5b. This was based on the generation of 200,000 years by employing the procedure of [
44]. From this figure, the probability of the excess water volume to have values at least equal to a given value is provided as the cumulative frequency or vice versa the 100% minus the cumulative frequency provides the probability of the excess water to have values below the given value. Therefore, the probability of the excess water to have values of at least the mean monthly excess water values given previously is as follows: (a) for February until May, approximately 55%, (b) for December and January, 40%, (c) for November and June approximately 30% and (d) for the other months it was very low, below 5%.
The choice of the level of exceedance probability may be a matter of economic, social and environmental factors; the lower the probability level the higher the excess water volume, which could be used additionally, hence the higher the risk of non-satisfying the excess water demand above the basic water demand. Accepting a monthly operation scheme with a “low risk” of not-satisfying the selected monthly excess water volumes, i.e., expressed as 10% exceedance probability (corresponding to 90% cumulative frequency), the lowest monthly excess water volumes are observed with descending magnitude order in February and March (approximately 25 × 106 m3), in January and April (approximately 20 × 106 m3), in December and May (approximately 10 × 106 m3) and in the other months it was practically zero. Accepting a “higher risk” operation policy, i.e., expressed as 40% exceedance probability (corresponding to 60% cumulative frequency) almost doubled the mean monthly excess water volumes, the descending order being in February and March (approximately 55 × 106 m3), in January and April (approximately 45 × 106 m3), in December and May (approximately 30 × 106 m3) and in the other months it was below 0.5 × 10⁶ m3.
4.3. Active Storage Reduction Due to Sediment Deposition and Reservoir Supply Reliability
As described in
Section 3.4, for the present and future active storage of Ladhon Reservoir, the corresponding exceedance probabilities based on the “zero-height dam” concept [
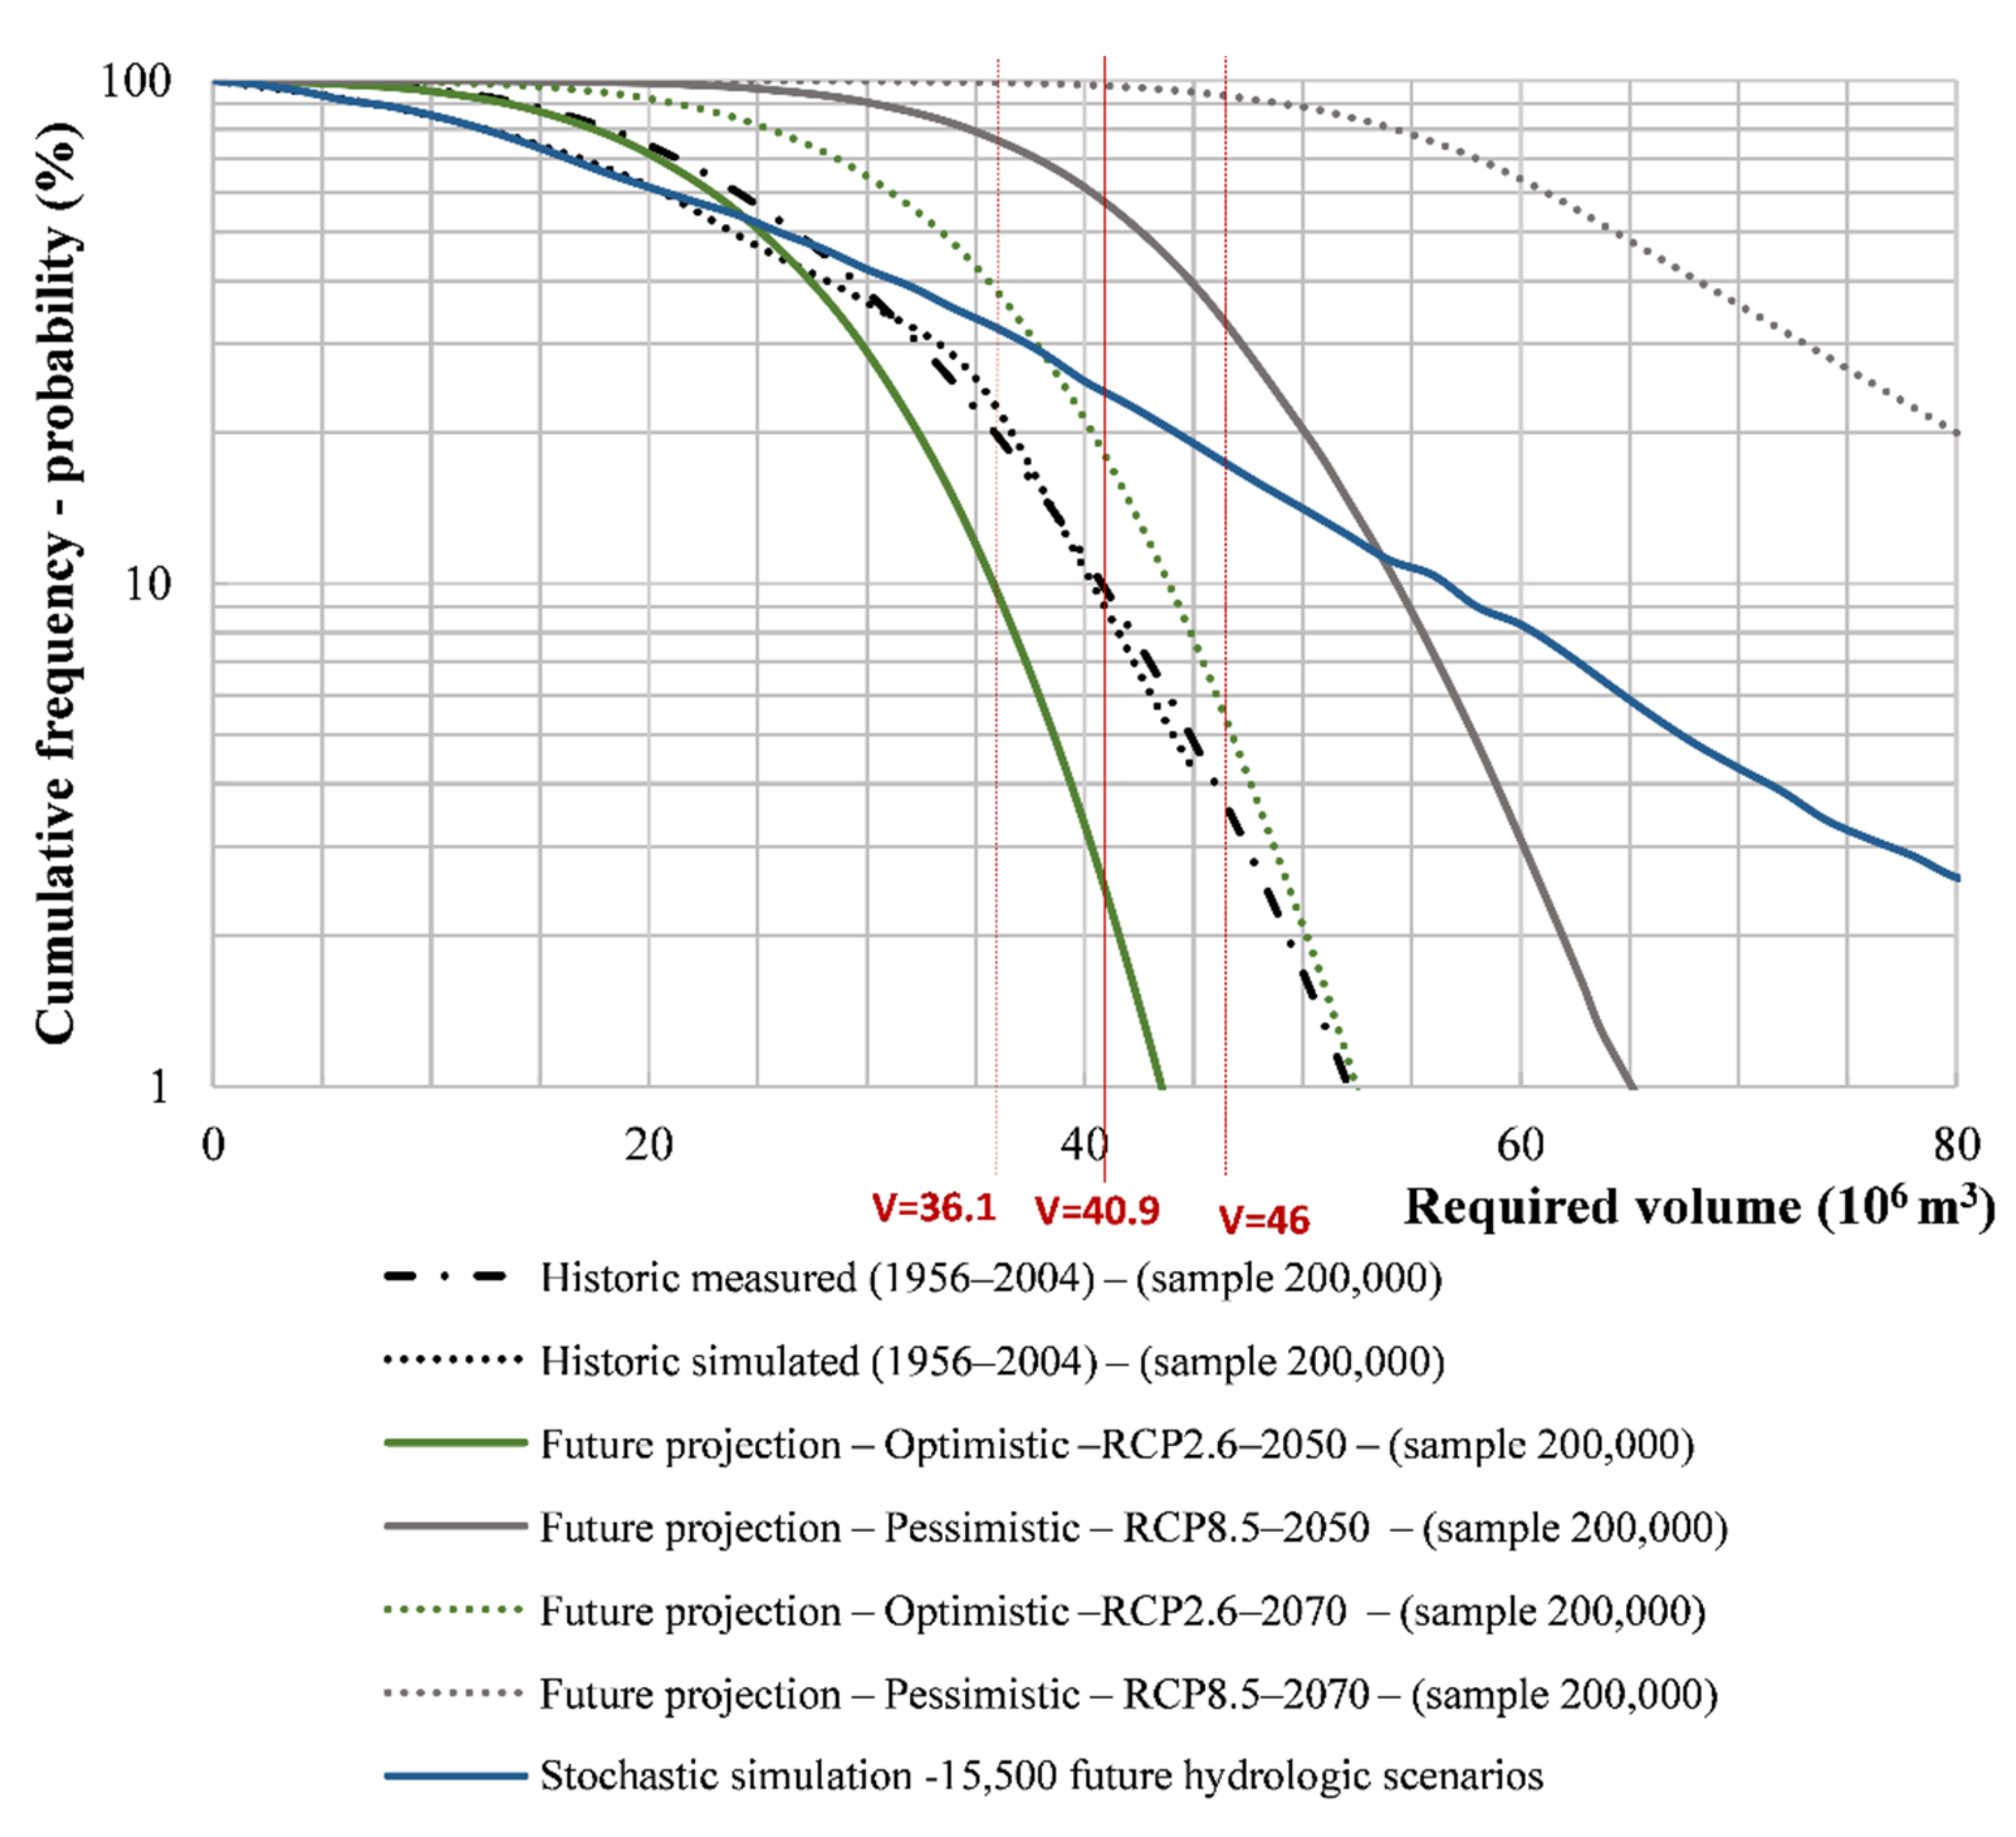
44] is taken as a reliability measure of any reservoir storage to satisfy the predetermined monthly water demand. The exceedance probability with respect to reservoir volumes is shown in
Figure 6, including: (a) the current state based on the historic measured (1956–2012) and simulated (1956–2004) runoff and (b) the future projections derived from the simulated runoff of the future IPCC climatic scenarios and from the stochastically simulated runoff data. As mentioned previously, the simulated runoff data (current and future) (due to the peculiarities of the Ladhon River Basin as described previously) underestimated systematically the monthly low flow runoff for the dry period compared to the measured runoff, and therefore, overestimated the required reservoir volumes. To overcome this deviation in
Figure 6, the curve derived from the simulated runoff time series was shifted horizontally to the left by trial and error (the best fit corresponds to a reduction of reservoir volume by 30 × 10
6 m
3) in order to coincide with the curve derived from the measured runoff. The corresponding curves of future projections derived from the simulated runoff of the future IPCC climatic scenarios were also similarly shifted, assuming that the systematic runoff underestimation of the hydrologic model was the same also in the near and the far future.
In order to assess the effect of the active storage decrease, due to sediment deposition, to the water supply target reliability from this figure, the exceedance probability is given for the current period (historic simulated and measured runoff data): (i) 4% for the design active storage of 46.2 × 10⁶ m3, (ii) 9% for the current active storage of 40.95 × 10⁶ m3 and (iii) 25% for the far future active storage volume of 36.105 × 10⁶ m3. The exceedance probability in the near and far future under the optimistic IPCC climate scenarios equaled to: (i) 0–9% for the design active storage of 46.2 × 10⁶ m3, (ii) 3–25% for the current active storage of 40.95 × 10⁶ m3 and (ii) 10–48% for the far future active storage volume of 36.105 × 10⁶ m3. The exceedance probability in the near and far future under the pessimistic IPCC climate scenarios equaled to: (i) 35–95% for the design active storage of 46.2 × 10⁶ m3, (ii) 60–98% for the current active storage of 40.95 × 10⁶ m3 and (ii) 80–99% for the far future active storage volume of 36.105 × 10⁶ m3.
Based on these results, it can be concluded that the active storage reduction from the beginning of the operation of Ladhon Dam until now has reduced its reliability in terms of satisfying the proposed water demand by 5% (=9–4). The reliability of the current active storage will be reduced in the future up to 16% (=25–9) under an optimistic climate change scenario and 89% (=98–9) under a pessimistic climate change scenario. Finally, the reliability of the future active storage will be reduced by 27% (=48–25) under an optimistic climate change scenario and up to 74% (=99–25) under a pessimistic climate change scenario.
For the stochastically simulated runoff using CASTALIA, the reservoir exceedance probability derived from the 15,500 probabilistic runoff scenarios was: (i) 17% for the design active storage of 46.2 × 10⁶ m3, lying between the corresponding probabilities of the optimistic (RCP2.6-2070) and the pessimistic (RCP8.5-2050) future climate change scenarios, (ii) 25% for the current active storage of 40.95 × 10⁶ m3, being almost equal to the corresponding probability of the optimistic (RCP2.6-2070) future climate change scenario, and (iii) 32% for the far future active storage volume of 36.105 × 10⁶ m3, lying between the corresponding probabilities of the historic measured data and the optimistic (RCP2.6-2070) future climate change scenarios. It is of note that for active storage volume below 25 × 106 m3, corresponding to the half of the design storage, the cumulative frequency curve from the stochastic simulation practically coincided with the corresponding curve from the historic data.
4.4. Total Benefit for Water Allocated to Hydropower Production and Irrigation
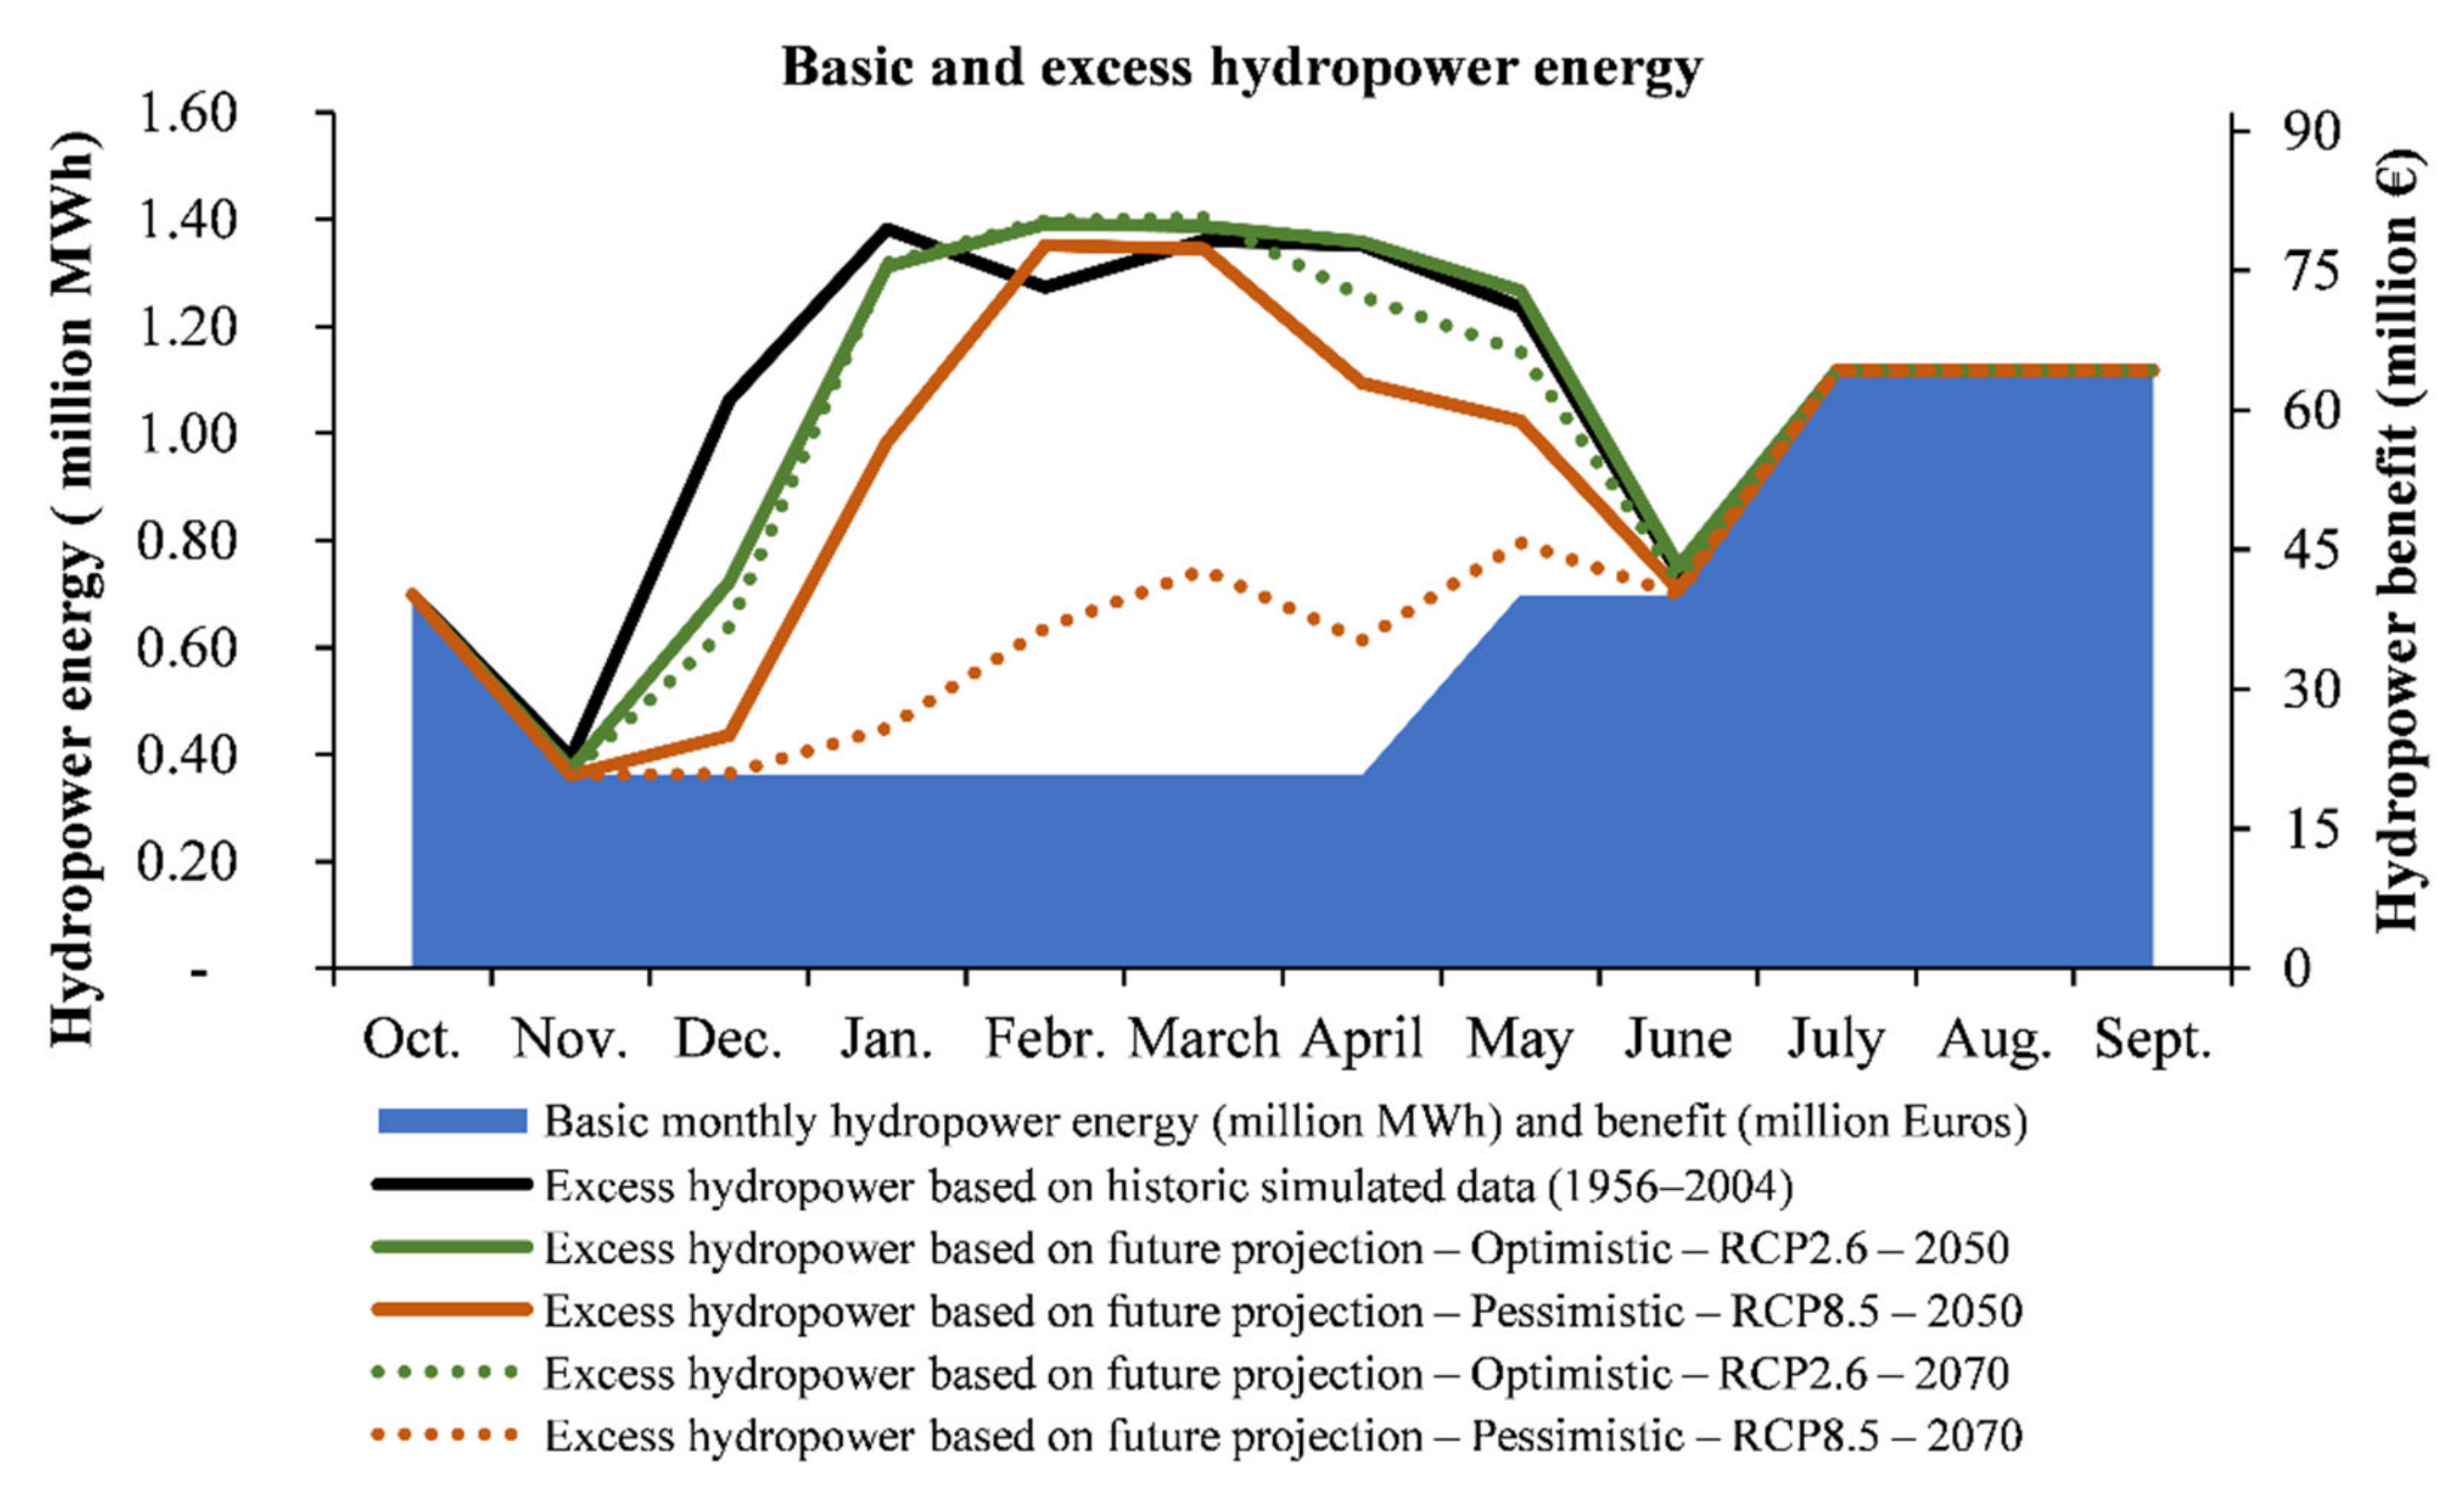
In order to estimate the total benefit from water allocated to hydropower energy, the unit benefit proposed by Bekri et al. [
49] was used. This research took into account, firstly, the changes that resulted from the liberalization of the energy market in Greece, and, secondly, the effect of the hourly marginal energy price of the energy system and the real benefits of Ladhon HPS for the period 2000–2008 based on the estimations of the chief engineer responsible for the operation of Ladhon HPS. The mean value of the extreme unit benefit values (corresponding to the lower (40 €/MWh) and upper (75 €/MWh) fuzzy boundaries) was considered, resulting in an interval midpoint benefit of 57.5 €/MWh. The basic (corresponding to full satisfaction of the proposed water demand scenario under present and future hydrologic conditions with a very low exceedance probability) and the mean excess monthly water volume (m
3) and the corresponding probable benefit (in million €) from allocating these water volumes to hydropower production for the simulated historic and future IPCC climatic scenarios are given in
Figure 7.
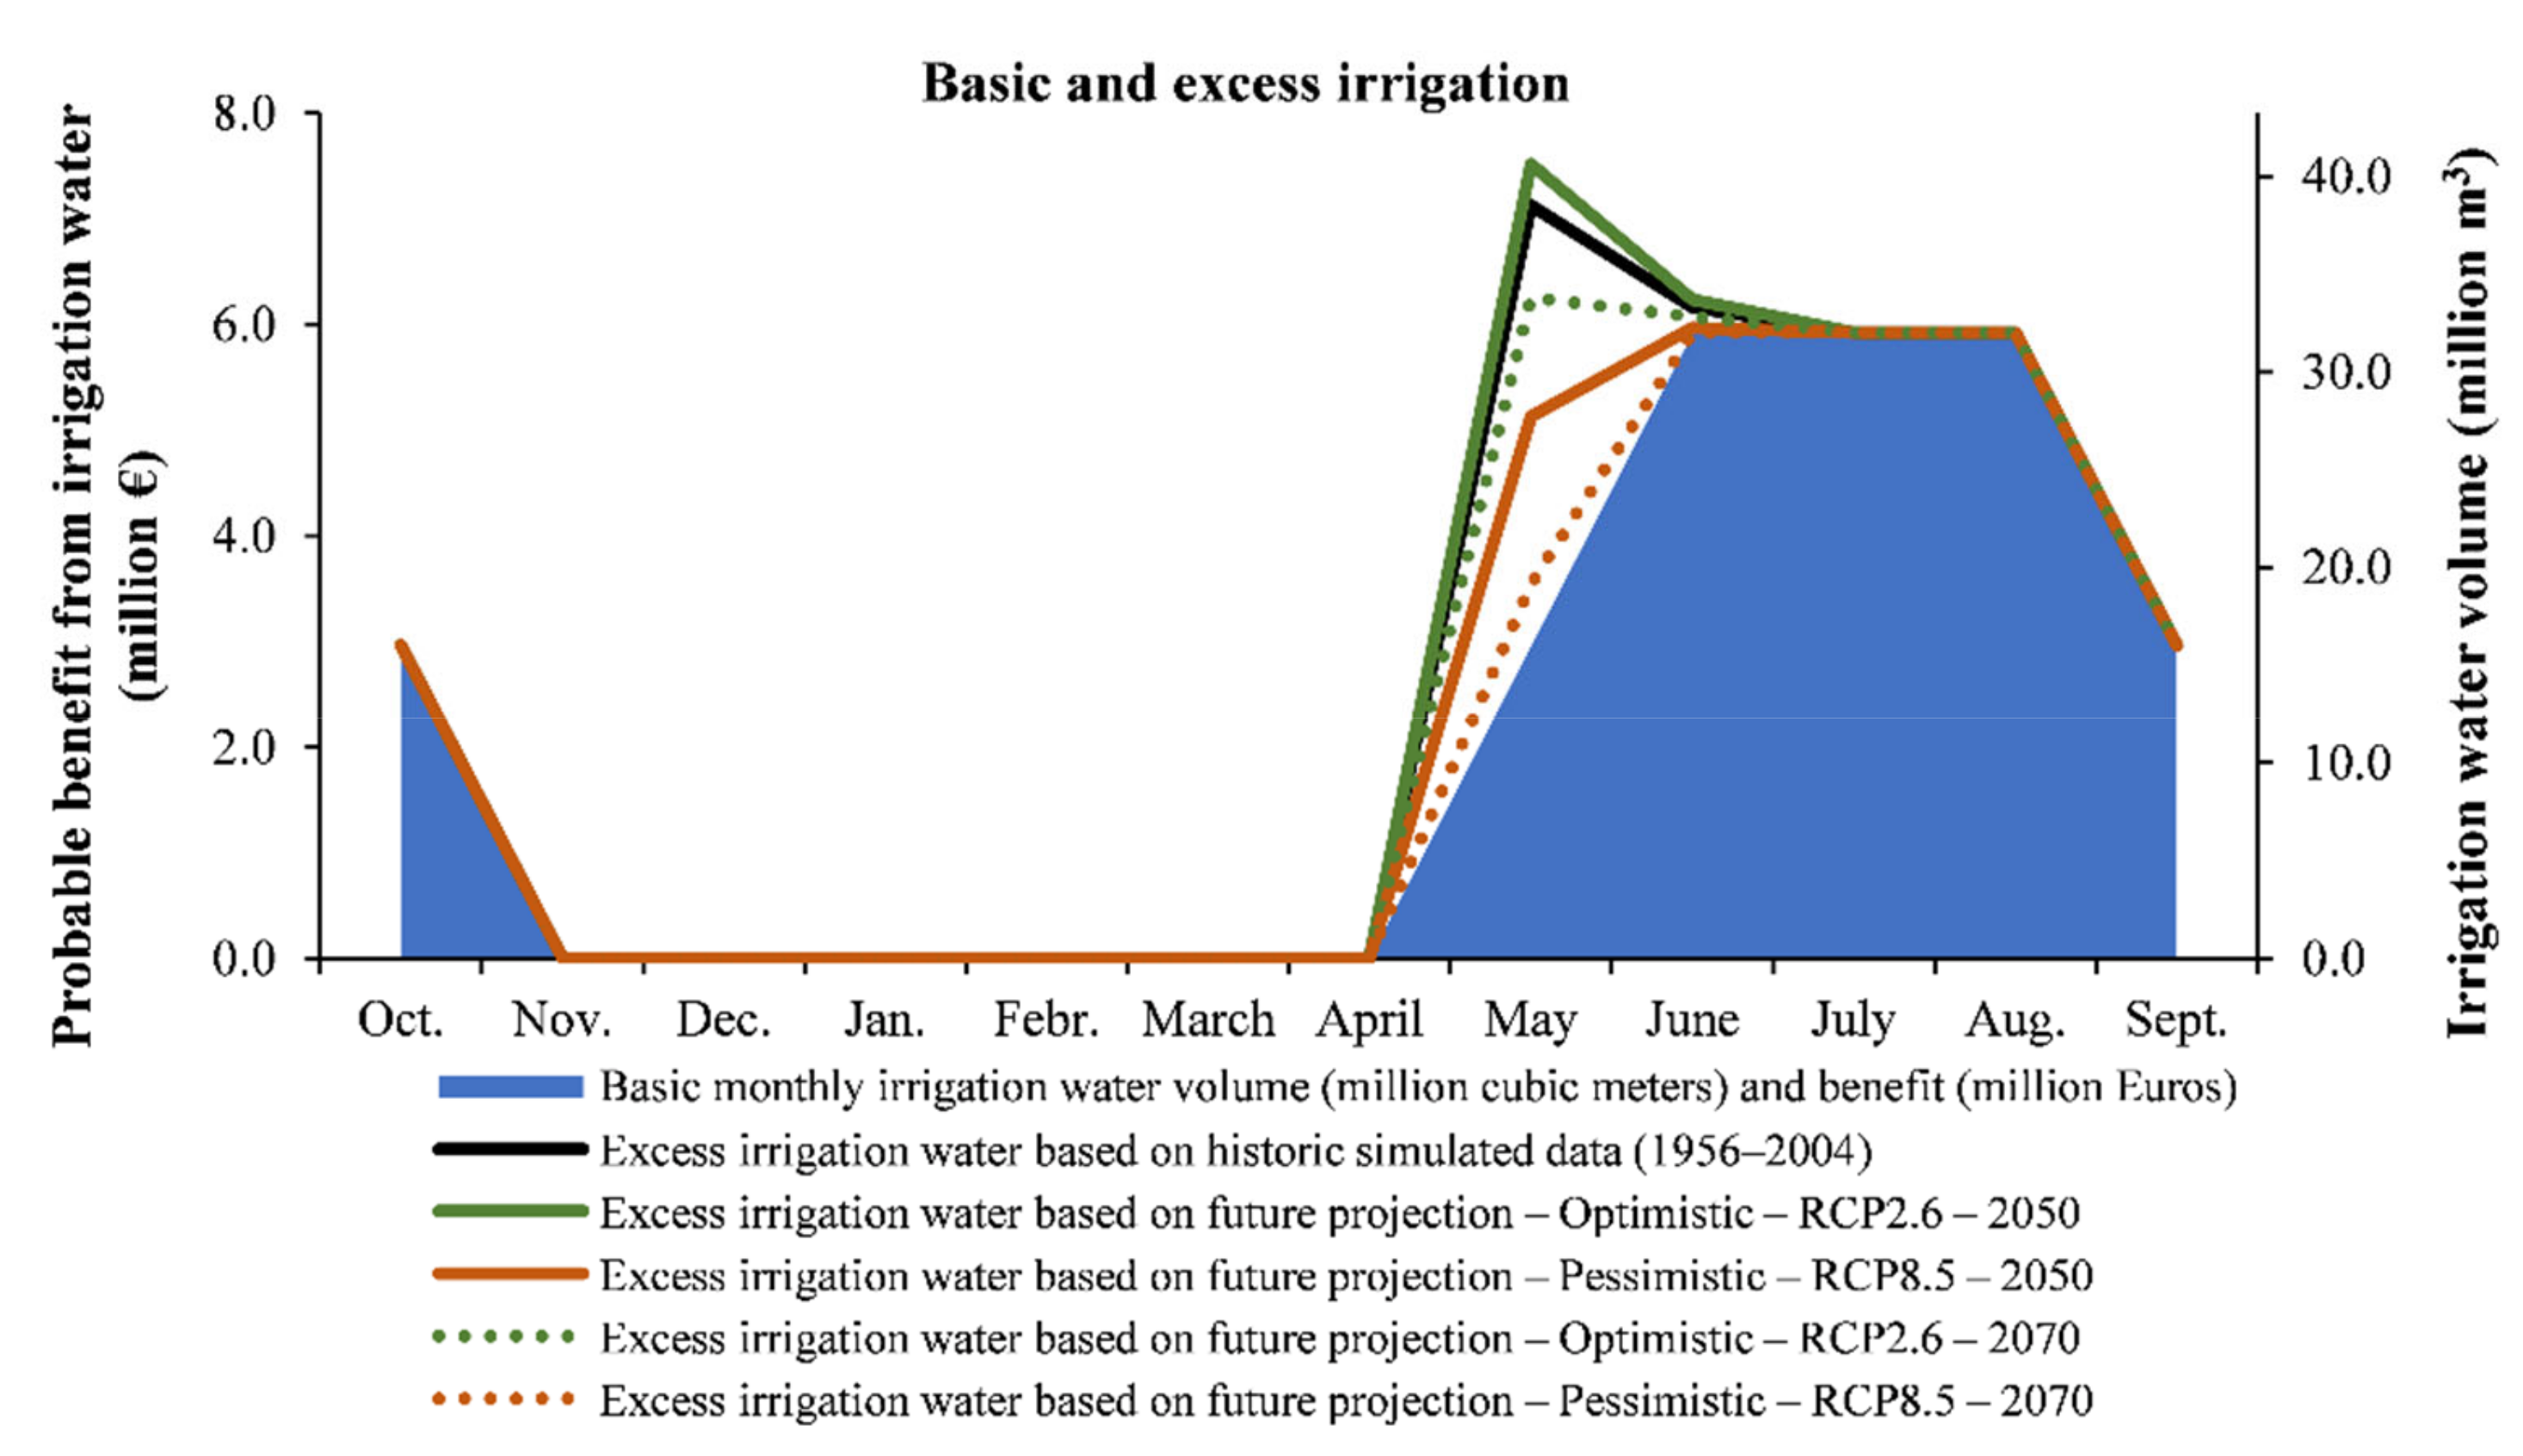
Additionally, the unit benefit for water allocated to irrigation was also based on the results of Bekri et al. [
49] for the Alfeios basin (i.e., from the Flokas irrigation scheme). The irrigation water demand (dry period) in the Alfeios basin extends officially from May to September, whereas in most years, it could be further extended from April up to October, due to the dry climatic conditions. An official agreement for stable water released from the Ladhon HPS in order to satisfy irrigation demand for the months of June, July and August has been arranged. In most cases, additional water releases are required. By estimating the probable net income from the agricultural production of the lower Alfeios irrigated crop pattern, taking into account the farmer, the cost of production, the cost of the irrigation canal (associated with the water charge to the farmers from the general irrigation organization) and the organizational structure of local irrigation organizations (the charges of the local irrigation organizations), a lower (0.166 €/m
3) and an upper (0.205 €/m
3) value of the unit irrigation benefit is estimated [
49]. We used the interval midpoint (0.185 €/m
3) in the computational process of the total benefit from the irrigation water volume. The basic (corresponding to full satisfaction of the proposed water demand scenario with a very low exceedance probability) and mean excess monthly water volume (m
3) and the corresponding probable benefit (in million €) from allocating these basic and excess water volumes for irrigation for the simulated historic and future IPCC climatic scenarios is given in
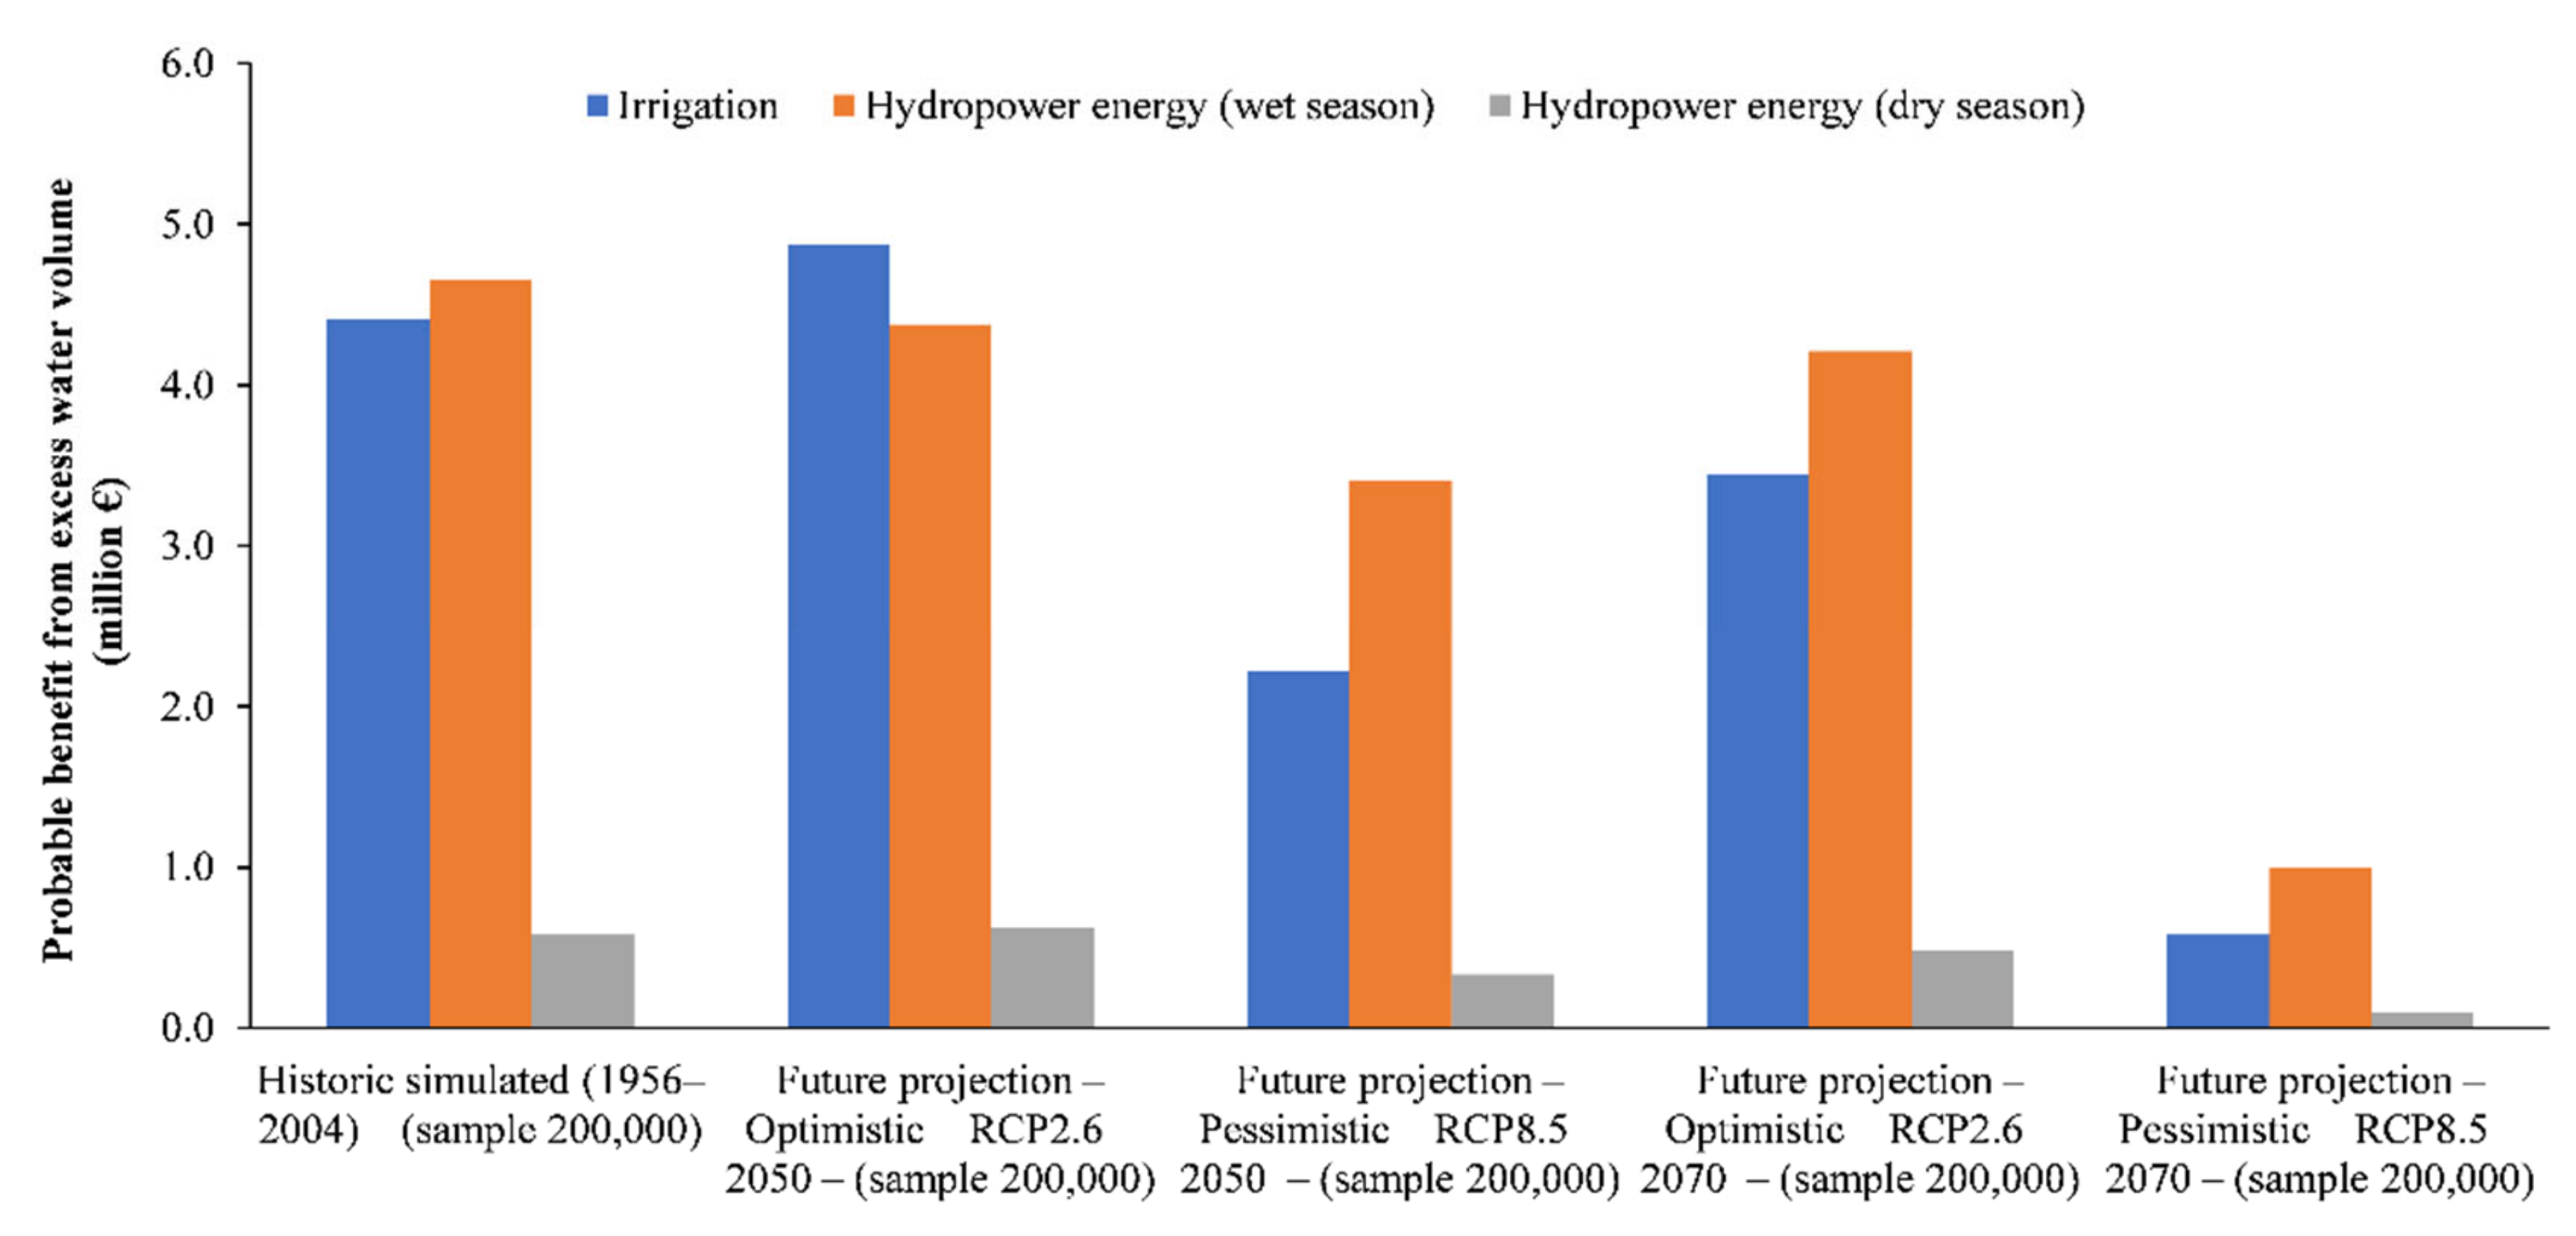
Figure 8. The irrigation benefit together with the hydropower benefit for the wet (November to April) and dry (May to October) months for the current period and for the near and far future was estimated and given in
Figure 9.
Since, as mentioned above, the simulated runoff data for present and past conditions (simulated runoff of 1956–2004) and for the future runoff projections based on the IPCC climatic scenarios deviated in some cases from the measured data, the conclusions were based on the relative change of hydropower and irrigation benefit for the near and far future compared to the historic period. More precisely, in
Figure 10, the hydropower and irrigation benefit from the mean excess water as a percentage of the total hydropower and irrigation benefit (including benefit from basic and excess water) is provided. The hydropower benefit was divided into two periods: (a) wet (November to April) and (b) dry (May to October) period. The hydropower energy benefit from the excess water in the wet period corresponded to the two thirds of the total benefit, i.e., 68% of the total benefit derived from the historic simulated runoff (1956–2004). In the near future under the climate change effect, this percentage was only slightly reduced to 67% for the optimistic climatic scenario and to 61% for the pessimistic scenario. In the far future, this percentage was slightly reduced to 66% for the optimistic climatic scenario and drastically reduced to 34% for the pessimistic scenario. Finally, comparing the hydropower benefit derived from the historic measured runoff data and the stochastic simulation, a small reduction, ranging from 5 to 10%, mainly in October, November and in April is noticed.
5. Conclusions
Adapting the operation and management of existing reservoirs, with given storage capacity and management strategy, to future hydrologic alterations due to climate change effects and changing water demands, is a key challenge for the water security related to human needs. The active storage reduction of existing reservoirs over time, due to sediment transport and deposition, intensifies the need for reassessment of their supply capacity and management resilience. To overcome this challenge, a general methodological framework was proposed in this paper and was applied to a case study, i.e., Ladhon Reservoir (Greece). Based on the historic meteorological and hydrologic timeseries, the reservoir water availability in the near and far future was estimated: (i) by using the two extreme (best—RCP 2.6 and worst—RCP 8.5) climate change IPCC scenarios [
15], and (ii) by stochastic simulation and projection. The climate change effect on the monthly water inflows into Ladhon Reservoir was estimated, with a small reduction in the near and far future under the optimistic climatic scenario (with the highest reduction of 26% in October), and under the pessimistic scenario with a medium reduction (up to 40%) in the near future and a high reduction of more than 50% throughout the year in the far future.
The novel methodology for multiple-year regulation of reservoir active storage capacity [
44] was properly modified and used to determine a basic monthly operating scheme with low probability of exceedance (<5%) for the present and future active reservoir storage capacity (affected by the active storage reduction due to sediment deposition). Considering the reservoir storage reduction over time due to sedimentation, reservoir active storage capacities of 46.2, 40.95 and 36.105 × 10
6 m
3 were estimated corresponding to the present year, the near future (2050) and the far future (2070). For these cases, the exceedance probabilities and the mean monthly excess water volumes, and their 95% confidence intervals, for the historic and future hydrologic conditions were computed. The corresponding exceedance probabilities with respect to the reservoir volumes for 1 year of the regulation period were 4%, 9% and 25% for the current period. The corresponding exceedance probabilities in the near and far future, under the optimistic IPCC climate scenarios, were 0–9%, 3–25% and 10–48% and under the pessimistic IPCC climate scenarios, 35–95%, 60–98% and 80–99%. The effect of the active storage reduction over time due to sedimentation on the water supply reliability of the reservoir for the proposed water demand gave a reduction of 5% for the current period, up to 16% under an optimistic future climate change scenario and 89% under a pessimistic future climate change scenario. The corresponding effect on water supply reliability, for the stochastically simulated runoff using CASTALIA, was expressed by a reduction of 17% for the design active storage, 25% for the current active storage and 32% for the far future active storage volume, which all lay between the corresponding pessimistic and optimistic values given previously. Then, excess water releases, additional to the basic operation scheme, were stochastically simulated for the future projections, which enabled the adaptation to a multiple-purpose water supply management strategy.
The probable total benefit from water allocated to the various water uses was determined for all future projections together with their corresponding level of reliability (exceedance probability). Selecting a reservoir operation scheme with higher risk (i.e., non-satisfying the excess water demand above the basic water demand) involved higher excess water volume and higher benefits, and vice versa. In this way, the reservoir operators and the involved decision makers can investigate the tradeoffs between the probabilistic plausible hydrologic realizations of the alternative reservoir operation schemes and the corresponding levels of security or reliability along with the corresponding probable benefit.


 ,
, 


