
Risk Assessment of Water Resources and Energy Security Based on the Cloud Model: A Case Study of China in 2020


1
Beijing Key Laboratory of Urban Hydrological Cycle and Sponge City Technology, College of Water Sciences, Beijing Normal University, Beijing 100875, China
2
College of Sciences, North China University of Science and Technology, Tangshan 063210, China
3
Argonne National Laboratory, Environment Science Division, Lemont, IL 60439, USA
4
Consortium for Advanced Science and Engineering, University of Chicago, Chicago, IL 60637, USA
*
Author to whom correspondence should be addressed.
Water 2021, 13(13), 1823; https://doi.org/10.3390/w13131823
Submission received: 4 June 2021
/
Revised: 26 June 2021
/
Accepted: 28 June 2021
/
Published: 30 June 2021
(This article belongs to the Special Issue Water Environmental System Analysis)
Abstract
:With the rapid development of economy and society, China’s demand for water resources and energy is increasing, and the supply situation is becoming increasingly severe. The correlation and binding characteristics between the two have become increasingly prominent, which will become bottlenecks in sustainable economic and social development in the future. In this paper, the Liang–Kleeman method was used to screen the risk factors of water resources and energy security, and then four major risk factors were selected. Based on the cloud model, the water resource and energy security risk assessment models were constructed combined with the predicted values using GM (1,1) and Pearson III curve methods, and the water resource and energy security risks of 30 provinces (cities) in 2020 were quantitatively assessed. The risk assessment results showed that the risk level zoning of water resource shortage with different guarantee rates in most regions has undergone little change, but the spatial distribution was quite different, showing the characteristics of “low in the South and high in the North”. When the guarantee rate changed from P = 25% to P = 95%, the risk level of water shortage in Sichuan, Jiangxi, Hunan, Hainan, Jilin, Ningxia and Nei Monggol significantly increased, and the spatial distribution of energy security risk and water resource shortage risk was obviously inconsistent.
1. Introduction
The resources available to human beings on the earth are limited. With the development of economy and society, human demand for resources has also further increased. When the demand cannot be met, human beings may have to face the challenge brought by “risk”. Therefore, many scholars are paying more and more attention to the research on risk assessment [1]. Under this background, the relationship between water, energy and food has become one of the research hotspots [2,3]. Among them, the security risk of water resources and energy plays an important role. Water and energy are two kinds of indispensable resources in the process of human survival and development [4]. The theme of 2014 World Water Day was determined as “water and energy”, reflecting that water and energy issues have attracted global attention, and people have fully recognized the threats and challenges that water and energy shortage may bring [5,6,7].
China’s total freshwater resources are 2800 billion m3, but the population is huge, equivalent to feeding 21% of the world’s population with 6% of the world’s water resources. In 2016, China’s energy consumption accounted for 23%, ranking first in the world. At present, China’s consumption demand for water resources and energy is on the rise, and water resources and energy will be in short supply in the future. Therefore, it is of great theoretical significance and practical value, for the coordinated security of water resources and energy in China and even in the world, to carry out an integrated assessment of water resource shortage and energy security risks in China.
As for risk, many scholars have provided different definitions and interpretations according to the characteristics of different disciplines [8,9,10]. A widely accepted view is that the risk is usually understood as a combination of the probability level of a threat activation and the level of its effects [11,12]. The main phase of risk response consists of dealing with risk and risk monitoring. In addition, risk communication is required from beginning to end. In this study, risk identification and risk evaluation are considered the premise of a scientific response to risk. In the aspect of risk assessment of water shortage, many scholars have provided relevant definitions of the water shortage risk, among which the widely accepted definition is the loss caused by the impact of human life and industrial and agricultural development due to the failure of the water supply system to meet the water demand [13]. Due to the characteristics of openness, randomness and chaos, the water resources system is a complex giant system. To make the assessment results more integrative and accurate, it should include the identification and screening of risk factors, risk analysis, risk assessment, risk control and risk decision-making.
In most areas of China, the development and utilization of water resources has reached or exceeded the international early-warning level, especially in the arid and semi-arid areas in the north of China. The serious water resources pressure has aroused widespread concern of all countries in the world. The water resources system is affected by many factors, especially human activities. Therefore, in recent years, research on the risk assessment of water shortage has become increasingly extensive and in-depth. For instance, Liu et al. assessed the actual water use of human beings from the perspective of consumption based on water footprint and other indicators [14]. Dong and Liu defined the drought risk index (DRI) by a linear combination of reliability, recoverability and vulnerability indices and introduced the Dempster–Shafer (D-S) evidence theory and reasoning algorithm considering the uncertainty of drought events [15]. Gain and Giupponi selected the water shortage index (WSI), population density and rice planting area as assessment indexes to assess the risk of water shortage in the Yarlung Zangbo River Basin [16]. The results show that the risk of water shortage has been increasing since 2000, and put forward some risk management and control measures in view of the grim situation that water shortage would still be on the rise for a period of time in the future.
Energy is a strategic resource to support the development of a country and a region. It is an important basis for resource and economic management to make a scientific assessment of the energy security situation in time. Energy security is the assessment, planning and development of the energy system from the perspective of technology, economy, society, environment and politics. In recent years, many scholars have tried to analyze the energy security risk from different angles and obtained some research results, such as energy production and consumption, energy supply and demand forecast, energy security strategy and other related explorations. At present, most of the research studies are based on the Shannon–Wiener index (SWI) and the Hirschman–Herfindahl indicator (HHI) to establish energy security models [17] and to identify the state of energy security of countries or regions. For example, Chalvatzis and Ioannidis used SWI, HHI and the net import dependence index to assess the energy supply security of all EU countries [18]. The results show that the diversity of energy security in EU countries has increased significantly since 1990. The SWI index has increased by 14.2%, and the HHI index has increased by 22.6%. Meanwhile, the relationship between net import dependence and energy diversity has been demonstrated. The development and utilization of renewable energy can not only reduce energy import dependence but also reduce energy security risk.
At present, there is no authoritative organization or institution to track or warn China’s energy security on a regular basis. However, as great importance has been attached to the issue of energy security by the relevant government departments and society, many scholars have carried out relevant research from the perspective of energy production, supply, transportation, consumption and policies to explore the factors affecting energy security [19]. For example, Zhang et al. constructed an indicator system from the five aspects of energy availability and diversity, affordability and substitutability, technology and efficiency, and policy, and divided the 30 provinces in China into 8 regions to conduct energy security risk assessment [20]. The results show that the middle reaches of the Yellow River and Northwest China have the lowest energy security risk; Zhou et al. quantitatively assessed the medium- and short-term supply risks of 12 mineral elements used in clean energy technology through their own reserves, import dependence and substitutability and concluded that tin, cobalt, chromium and nickel are at high risk [21]. The above research results have played a certain reference and support role in the formulation and implementation of energy security strategies, but throughout the results of energy security assessment research, the time and space scales are generally large and most of them focus on long-term and country-based unit analysis, while there are few studies on short-term energy risk identification and national internal regional energy security assessment.
In addition, in the general assessment, the classification criteria of indicators are mostly determined by experience, which has certain subjective arbitrariness. Li et al. put forward the cloud model, which has the advantage of weakening the influence of the interval threshold [22]. The membership function of the cloud model is assumed to be a normal distribution, which is closer to the actual situation. The cloud model has been successfully applied to the calculation of water resource carrying capacity [23] and to water environment quality assessment [24]. Water and energy, as natural resources with strategic significance, play a very important role in ties [25]. Therefore, in the risk assessment of water and energy, it is necessary to fully consider the degree of interaction between the two.
In this paper, the Liang–Kleeman information flow method is used to screen the risk factors of water resource shortage and energy security, and the cloud model method is introduced to quantitatively express and objectively assess the qualitative risk factors. A risk assessment model is constructed to quantitatively assess the risk of water resources and energy security in China in 2020.
2. Methods
2.1. Overview of the Study Area and Data Preparation
In recent years, China’s economy has grown steadily and rapidly, and its contribution to the world economy is also rising step by step. However, this rapid development is often accompanied by excessive consumption of natural resources and energy. Water resources and energy have become the main obstacles to regional economic development.
Overview of water resources: China’s annual renewable freshwater resources are about 2.81 trillion m3, ranking the fifth in the world, second only to Brazil, Russia, Canada and Indonesia. However, the per capita freshwater share is very low, only about 34% of the world average [26]. There is a mismatch between the existing water resources and water resource demand in many areas of northern and eastern China, which leads to excessive extraction of surface water and groundwater. The excessive development of water resources has seriously damaged the development of the ecological environment, such as land subsidence and saltwater intrusion [27]. With the rapid growth of population and urbanization, the situation is still deteriorating. Especially in the northern arid areas, it is equivalent to using 19.1% of the national water resources to meet the water demand of nearly half of China’s population [28], so the water shortage is more serious. To alleviate this situation, the Chinese government has established more than 20 water diversion projects, such as the South to North Water Diversion Project. In a normal year, nearly 400 of China’s more than 660 cities face water shortage, 110 cities are seriously short of water, and 30 of the 32 large cities with a population of more than 1 million cannot meet their water demand. In terms of the current water supply gap of 30~40 billion m3 per year, the water supply gap is larger in China. In terms of water quality, due to the extensive development model adopted by China in the early and middle stages of industrialization, water resources have been seriously polluted. By 2016, the total amount of waste water discharged in China was 76.5 billion tons, accounting for more than 70% of the total amount of wastewater discharged in 1990. However, the proportion of wastewater treatment in China has only increased by 20–66%. Water environmental pollution makes the already tense water use situation more serious.
Overview of energy consumption: According to the statistical results of the China Energy Statistical Yearbook 2016 [29], China’s total energy consumption in 2016 was 436 million tons of standard coal, an increase of 665% compared with 1978, accounting for 23% of the world’s total energy consumption. In 2009, China’s total energy consumption surpassed that of the United States, and it became the largest energy consumption country in the world. According to the current situation of China’s economic development entering a new era and the development momentum of a new round of industrial reform, China’s energy consumption demand will increase further in the future, and the world’s share may reach 60% by 2050 [30]. For a long time, China’s energy development has been facing the situation of an unreasonable structure. With coal, oil, natural gas and other primary energy sources as the leading energy sources, the total consumption of these three kinds of energy accounted for 87.2% in 2016, far higher than the world average level. At present, China is facing not only the severe situation of insufficient energy supply but also the pressure of energy conservation and emission reduction. Improving energy efficiency can effectively alleviate this situation. However, China’s energy efficiency is not high at present. The energy consumption per unit GDP is about 1.75 times the world average level, which is 2.25, 3.63 and 4.18 times that of the United States, Germany and Japan, respectively [31], and there is a big gap compared with the developed countries. To alleviate the energy crisis, China has been emphasizing the development of renewable energy in recent years, but the consumption pattern relying on fossil energy will not change significantly in a short time. It is still an important part of China’s energy structure adjustment to develop renewable energy, promote renewable energy utilization technology and increase the proportion of renewable energy utilization and consumption.
2.2. The Liang–Kleeman Information Flow Method
Information flow is a basic concept in physics. Liang and Richard Kleeman established a strict system based on the concept of information, which can be accurately calculated by using simple formulas [32,33].
For time series and , the maximum likelihood estimation of the causal quantity from to is
where refers to the sample covariance between and , refers to the covariance of and is the covariance of the sequence obtained by the difference separation of with Euler’s front difference.
If , then in the causal relationship, is the cause and is the effect.
The above equation can be expressed by correlation coefficient as follows:
where is the correlation coefficient, and , .
When . However, when , is not necessarily equal to 0. This also shows that causality and correlation are not completely equivalent. If there is a causal relationship between two sequences, they must be related, but the correlation between them does not mean that they are causal.
Here, the Liang–Kleeman information flow method is used to analyze the causality degree between the risk factors and risk, so as to realize the preliminary screening of risk factors, which not only ensures the reliability of the assessment results but also reduces the computational complexity.
2.3. Assessment Method Based on the Normal Cloud Model
The cloud model is based on probability theory and fuzzy mathematics theory. It can be used to process qualitative concepts expressed in language description, convert them into corresponding quantitative language values, or convert quantitative values into qualitative expressions [22].
The three numerical characteristics of clouds are expected , entropy and hyper entropy . Among them, is the central value of the domain, represents the measurable range of a qualitative concept and is the entropy’s entropy, which is used to represent the uncertainty of entropy. The horizontal axis represents the range of uncertainty measurements of a concept, and the vertical axis represents the membership degree.
On the basis of the level standard, the calculation formula is as follows [34,35]:
where represent the minimum and maximum critical values of the indicator. is generally taken as 0.01. If the level standard of the indicator’s membership degree is an infinite interval, such as or , the expected value or default boundary parameters can be determined according to the upper and lower limits of the indicator value, and then the three parameters can be calculated.
Suppose is the assessment object. refers to the qualitative description concept (i.e., level set) on . Then there is , where . The distribution on is called a normal cloud if the membership function μ of c is
Here, the normal cloud model is used to measure the randomness and fuzziness in the risk assessment of water resource shortage and energy security, and the membership degree of each assessment indicator is calculated using a normal generator to assess the risk of water resources and energy security.
3. Results
This section applies the methods of the previous section to the assessment of water resources and energy security risks in China. Water resource shortage and energy security risks are sensitive to temporal aggregation, so, if computed on different period bases, different pictures will be provided. Due to the limitation of research period selection and data sources, this study carried out related research on a yearly basis and assessed the risk of water resource shortage and energy security in 30 provinces (cities) of China.
3.1. Data Sources and Analysis
Considering that Beijing is representative in terms of water shortage, the relevant data are relatively complete. Therefore, taking Beijing as the sample, the main risk factors of water resource shortage are screened. Because of the large regional differences in energy production and consumption in China, energy production space and consumption space are highly separate, so we use national scale data to screen the main risk factors of energy security. The total amount of water resources, water consumption, precipitation and GDP from 1980 to 2016 were calculated by consulting the statistical yearbook, water resources bulletin, water conservancy statistical yearbook, and national economic and social development statistical bulletin of Beijing. Due to the incompleteness of data statistics, the four indicators of surface water resources, groundwater resources, inflow water, and 10,000-yuan GDP water consumption are the data from 2000 to 2016.
Similarly, by referring to China’s statistical yearbook, energy statistical yearbook, environmental yearbook, environmental statistical annual report and the statistical annual report of national economic and social development, the data of energy production, energy consumption, energy reserve rate and SO2 emission reduction rate from 1980 to 2016 are calculated. The energy import, export, external dependence, vehicle ownership, smoke (dust) emission and total investment in environmental pollution control are all data from 1991 to 2016. The data of CO2 emission per capita is from the carbon dioxide information analysis center of the Environmental Science Department of Oak Ridge National Laboratory (ORNL) in Tennessee. Among them, the degree of external dependence is equal to regional energy input divided by energy consumption; the elasticity coefficient of energy consumption (production) is equal to the annual average growth rate of total energy consumption (production) divided by the annual average growth rate of the national economy [36]; the energy processing conversion efficiency is equal to (processing conversion output divided by processing conversion input) × 100%; the energy reserve rate is equal to (basic reserves of coal, oil and natural gas divided by total national reserves) × 100%.
3.2. Identification and Weight Determination of Risk Factors
Taking Beijing as the sample, 24 main risk factors of water shortage are selected from four aspects: water resource endowment, social economy, water resources utilization and water environment. In addition, 28 major risk factors of energy security are screened out by using national scale data in view of energy endowment, social economy, energy utilization and atmospheric environment. See Tables S1 and S2 for details.
Water shortage rate [37] is usually used to describe the water shortage degree, so this indicator is used as the characterization value of water resources shortage risk.
The information flow values between each indicator and water risk are shown in Table S1. Generally speaking, if the information flow is greater than 0.1, there is a strong causal relationship between risk factors and risks.
According to the calculation results, precipitation (d1), surface water resources (d2), groundwater resources (d3), per capita water resources (d4), water consumption per 10,000-yuan GDP (d5) and water supply per capita (d6), the causal relationship between the six indicators and the water resources shortage rate is relatively strong, and the order of relative importance is as follows:
Therefore, these six indicators are the main risk factors of water resource shortage risk.
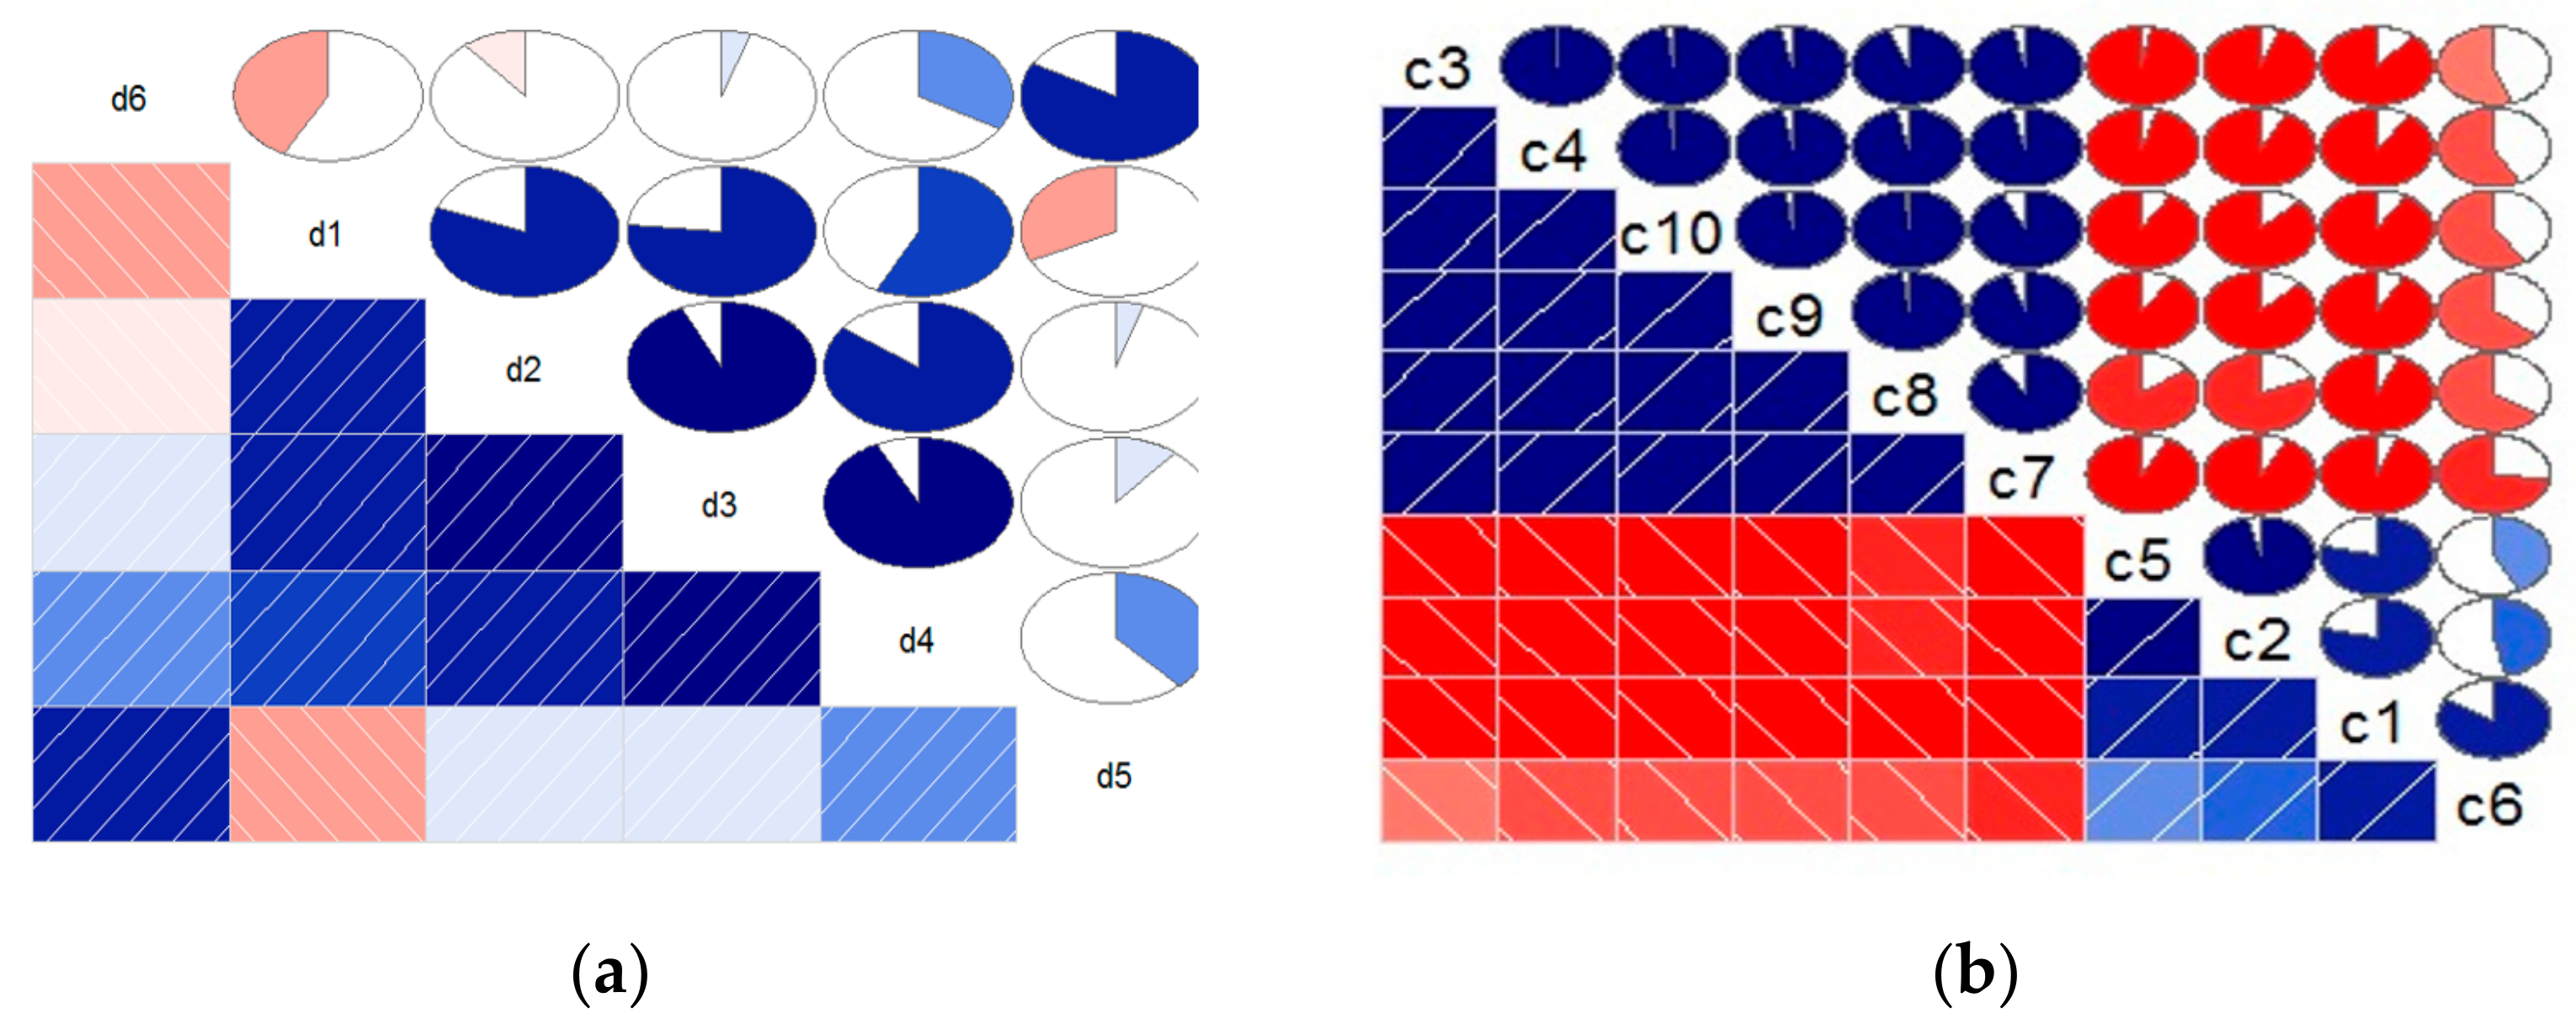
In addition, there may be a certain correlation between the indicators, so it is necessary to further analyze the correlation between factors. If two or more indicators are highly correlated, the indicator with higher relative importance should be selected and other indicators should be eliminated. The data from 2000 to 2016 are used for correlation analysis based on the Spearman method, which requires a smaller sample size and overall distribution of variables. Figure 1a shows the correlation coefficient of the six risk factors. Blue indicates a positive correlation between the two variables, pink indicates a negative correlation, and the darker the color implies that the larger the filling area, the stronger the correlation between the two variables. To gather variables with similar correlation patterns together, the row and column of the matrix are reordered by the principal component method.
As can be seen from Figure 1a, the correlation between d3, d4 and d2 is very strong. According to the relative importance of factors, d2 is selected. Finally, d1, d2, d5 and d6 are selected as risk factors of water shortage risk assessment.
According to the formula for water shortage rate, energy shortage rate is defined as
Energy shortage rate is used to describe the degree of regional energy shortage, and the indicator is used as the characterization value of energy shortage risk. The value of information flow between each indicator and energy security risk is shown in Table S2. According to the calculation, there are 10 indicators that have a strong causal relationship with energy shortage risk: energy reserve rate (c1), energy consumption per 10,000-yuan GDP (c2), population number (c3), urbanization rate (c4), proportion of primary industry (c5), proportion of secondary industry (c6), proportion of tertiary industry (c7), energy import (c8), degree of external dependence (c9) and vehicle ownership (c10). The order of relative importance is
According to the strong causal relationship between energy shortage rate and 10 indicators (Figure 1b), we can see that c3, c4, c5, c7, c8, c9 and c10 have a strong correlation, and the meanings of different colors are the same as above. According to the relative importance of factors, c3 and c2 are selected.
Finally, c6, c3, c1 and c2 are selected as the main factors of energy security risk.
For comparison, surface water resources and population number are transformed into runoff coefficient and population density. Taking water resource shortage assessment factors as an example, the structure entropy weight method is used to calculate the weight [38]. Different expert opinions may have an impact on the acquisition of weight. Therefore, to make the decision-making results reflect the real situation as much as possible, we comprehensively considered factors such as research field relevance, academic influence and geographical distribution, and five experts were selected to rank the importance of the four indicators. The results are shown in Table S3.
The ranking result aij formed according to the experts’ opinions is applied to obtain the membership matrix bij:
The average cognition degree is
The cognitive blind degree was calculated as
The five experts’ overall cognition degree of each indicator is:
Finally, the weight vector of the indicators was obtained by normalization for :
In the same way, we can get the weight of energy security assessment indicators. See Table S4.
3.3. Prediction of Risk Factor Value
Due to the periodicity of precipitation, surface water and incoming water volume data, the gray model simulation error of GM (1,1) is large. Therefore, the Pearson III (P-III) curve commonly used in hydrology is selected to fit the frequency curve of rainfall, and the precipitation and surface water with P = 25% (wet year), P = 50% (normal year), P = 75% (dry year) and P = 95% (extraordinarily dry year) are calculated [39]. The gray GM (1,1) model is used to simulate the water consumption per 10,000-yuan GDP and water supply per capita of all provinces and cities in 2020 [40]. The simulation value is compared with the actual value to verify the simulation accuracy, and the prediction accuracy level is judged according to the posterior difference rate C.
Taking Beijing as an example, the Pearson III (P-III) curve is used to fit the frequency curve of precipitation and surface water resources, as shown in Figure S1. The results are shown in Table 1.
The GM (1,1) model was used to predict d5 and d6. The data of Beijing from 2004 to 2016 were imported and the predicted values were obtained, as shown in Figure S2.
The accuracy of the simulation results was tested and the accuracy test results are shown in Table 2. The relative residual error, average relative error, relative precision and C value of the original value and the fitting value from 2004 to 2016 are small, and the fitting effect is good. The posterior difference rate C of d5 and d6 is 0.061 and 0.257, respectively, and the prediction level is I (good).
The main risk factors of energy security, such as the proportion of secondary industry, population density, energy reserve rate and energy consumption per 10,000-yuan GDP, are also predicted by the gray GM (1,1) model, and the data from 2004 to 2016 are used for fitting. However, when the GM (1,1) model is used to establish the population and the proportion of the secondary industry, it is found that the changes of the population and the proportion of the secondary industry tend to be stable in recent years. Taking the population of Tianjin as an example (as shown in Figure S3), the fitting curve is established on the basis of ensuring the minimum relative error of the overall original data, so the residual in recent years are relatively large. To ensure the relative stability and similarity of the original data, the data from 2004 to 2016 were selected for fitting. According to the fitting results, adjust the sample size, shorten the sample range and make the fitting effect better.
Similarly, the prediction results of all major risk factors can be obtained by repeating the above steps. Among them, for provinces (cities) with missing precipitation data, the annual average precipitation of major cities is used instead. Based on all the calculation results, the water resource and energy status of provinces (cities) in 2020 are predicted.
3.4. Risk Assessment Results Based on the Cloud Model and Discussion
In this section, the assessment indicators of water resource and energy security can be divided into positive and negative indicators. The positive indicators include water consumption per 10,000-yuan GDP, water supply per capita, proportion of secondary industry, population and energy consumption per 10,000-yuan GDP. The greater the value of positive indicators, the greater the pressure on water resources or energy utilization in the region, indicating that the risk of water resource shortage or energy security is greater. The negative indicators include precipitation, surface water resources and energy reserve rate. The greater the value of negative indicators, the less the risk of water resource shortage or energy security in the region.
On the basis of the existing literature and the actual situation, each indicator is divided into five levels: low risk (Level I), relatively low risk (Level II), medium risk (Level III), relatively high risk (Level IV) and high risk (Level V). The results are shown in Table 3.
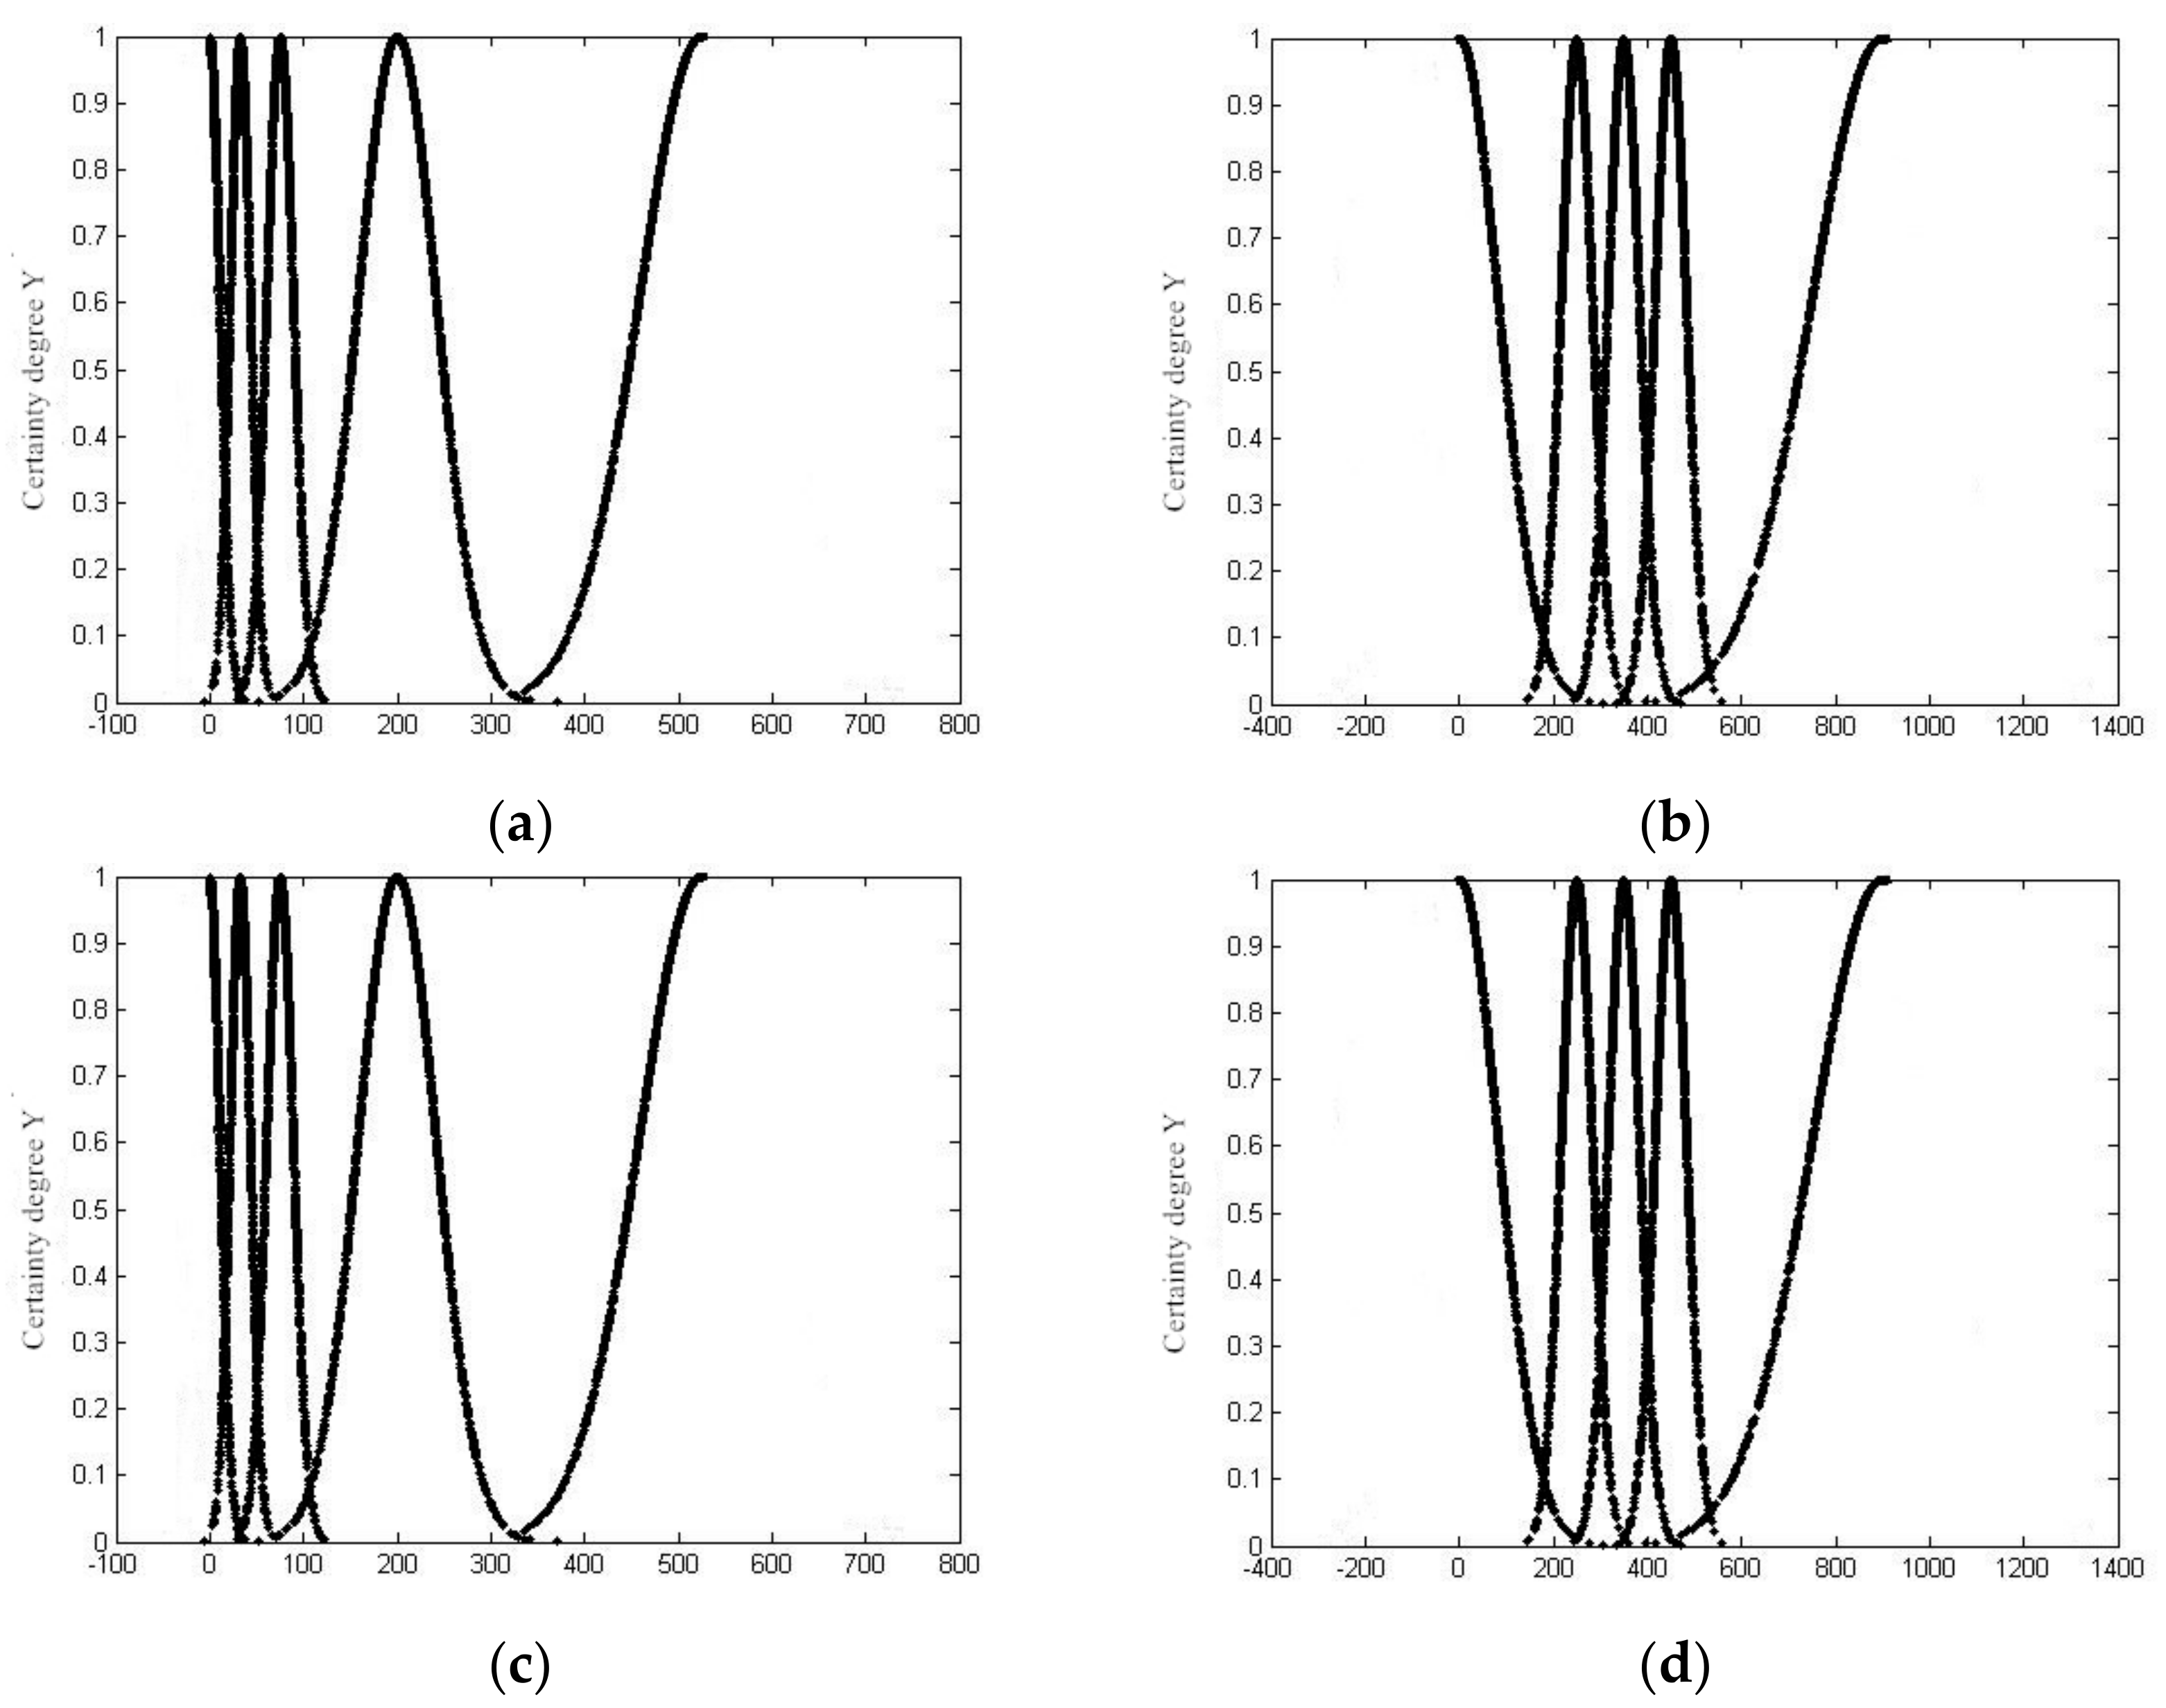
The risk assessment results of water and energy security based on the cloud model are shown in Figure 2.
In Figure 2a,b, the abscissa represents the water consumption per 10,000-yuan GDP and water consumption per capita, and the ordinate is its corresponding degree of certainty. From left to right, they represent cloud clusters corresponding to low risk (U(1)), relatively low risk (U(2)), medium risk (U(3)), relatively high risk (U(4)) and high risk (U (5)). Figure 2c,d is the opposite. When the specific value is given, the degree of risk value belonging to a certain risk value can be judged intuitively from the cloud image. For example, in 2020, the predicted water consumption per 10,000-yuan GDP in Beijing is 10.74 m3. According to the positive cloud generator, the degree of certainty of each risk level was obtained: U(1) = 0.61, U(2) = 0.13, U(3) = U(4) = U(5) = 0. In the practical sense, X (water consumption of 10,000 yuan GDP) = 10.74 should belong to low risk, while the calculation result was U(1) > U(2) > U(3) = U(4) = U(5) = U(6), which shows that X (water consumption of 10,000 yuan GDP) = 10.74 belongs to level I, and it is possible to be subordinate to level II, but it is small, and it is not subordinate to other higher-risk levels, which is consistent with the practical significance. By repeating the above operations, the degree of certainty of other assessment indicators at a certain point can be obtained, and the certainty matrix can be obtained. In the same way, we can get the cloud model that each energy security risk factor belongs to in terms of risk level, as shown in Figure S4.
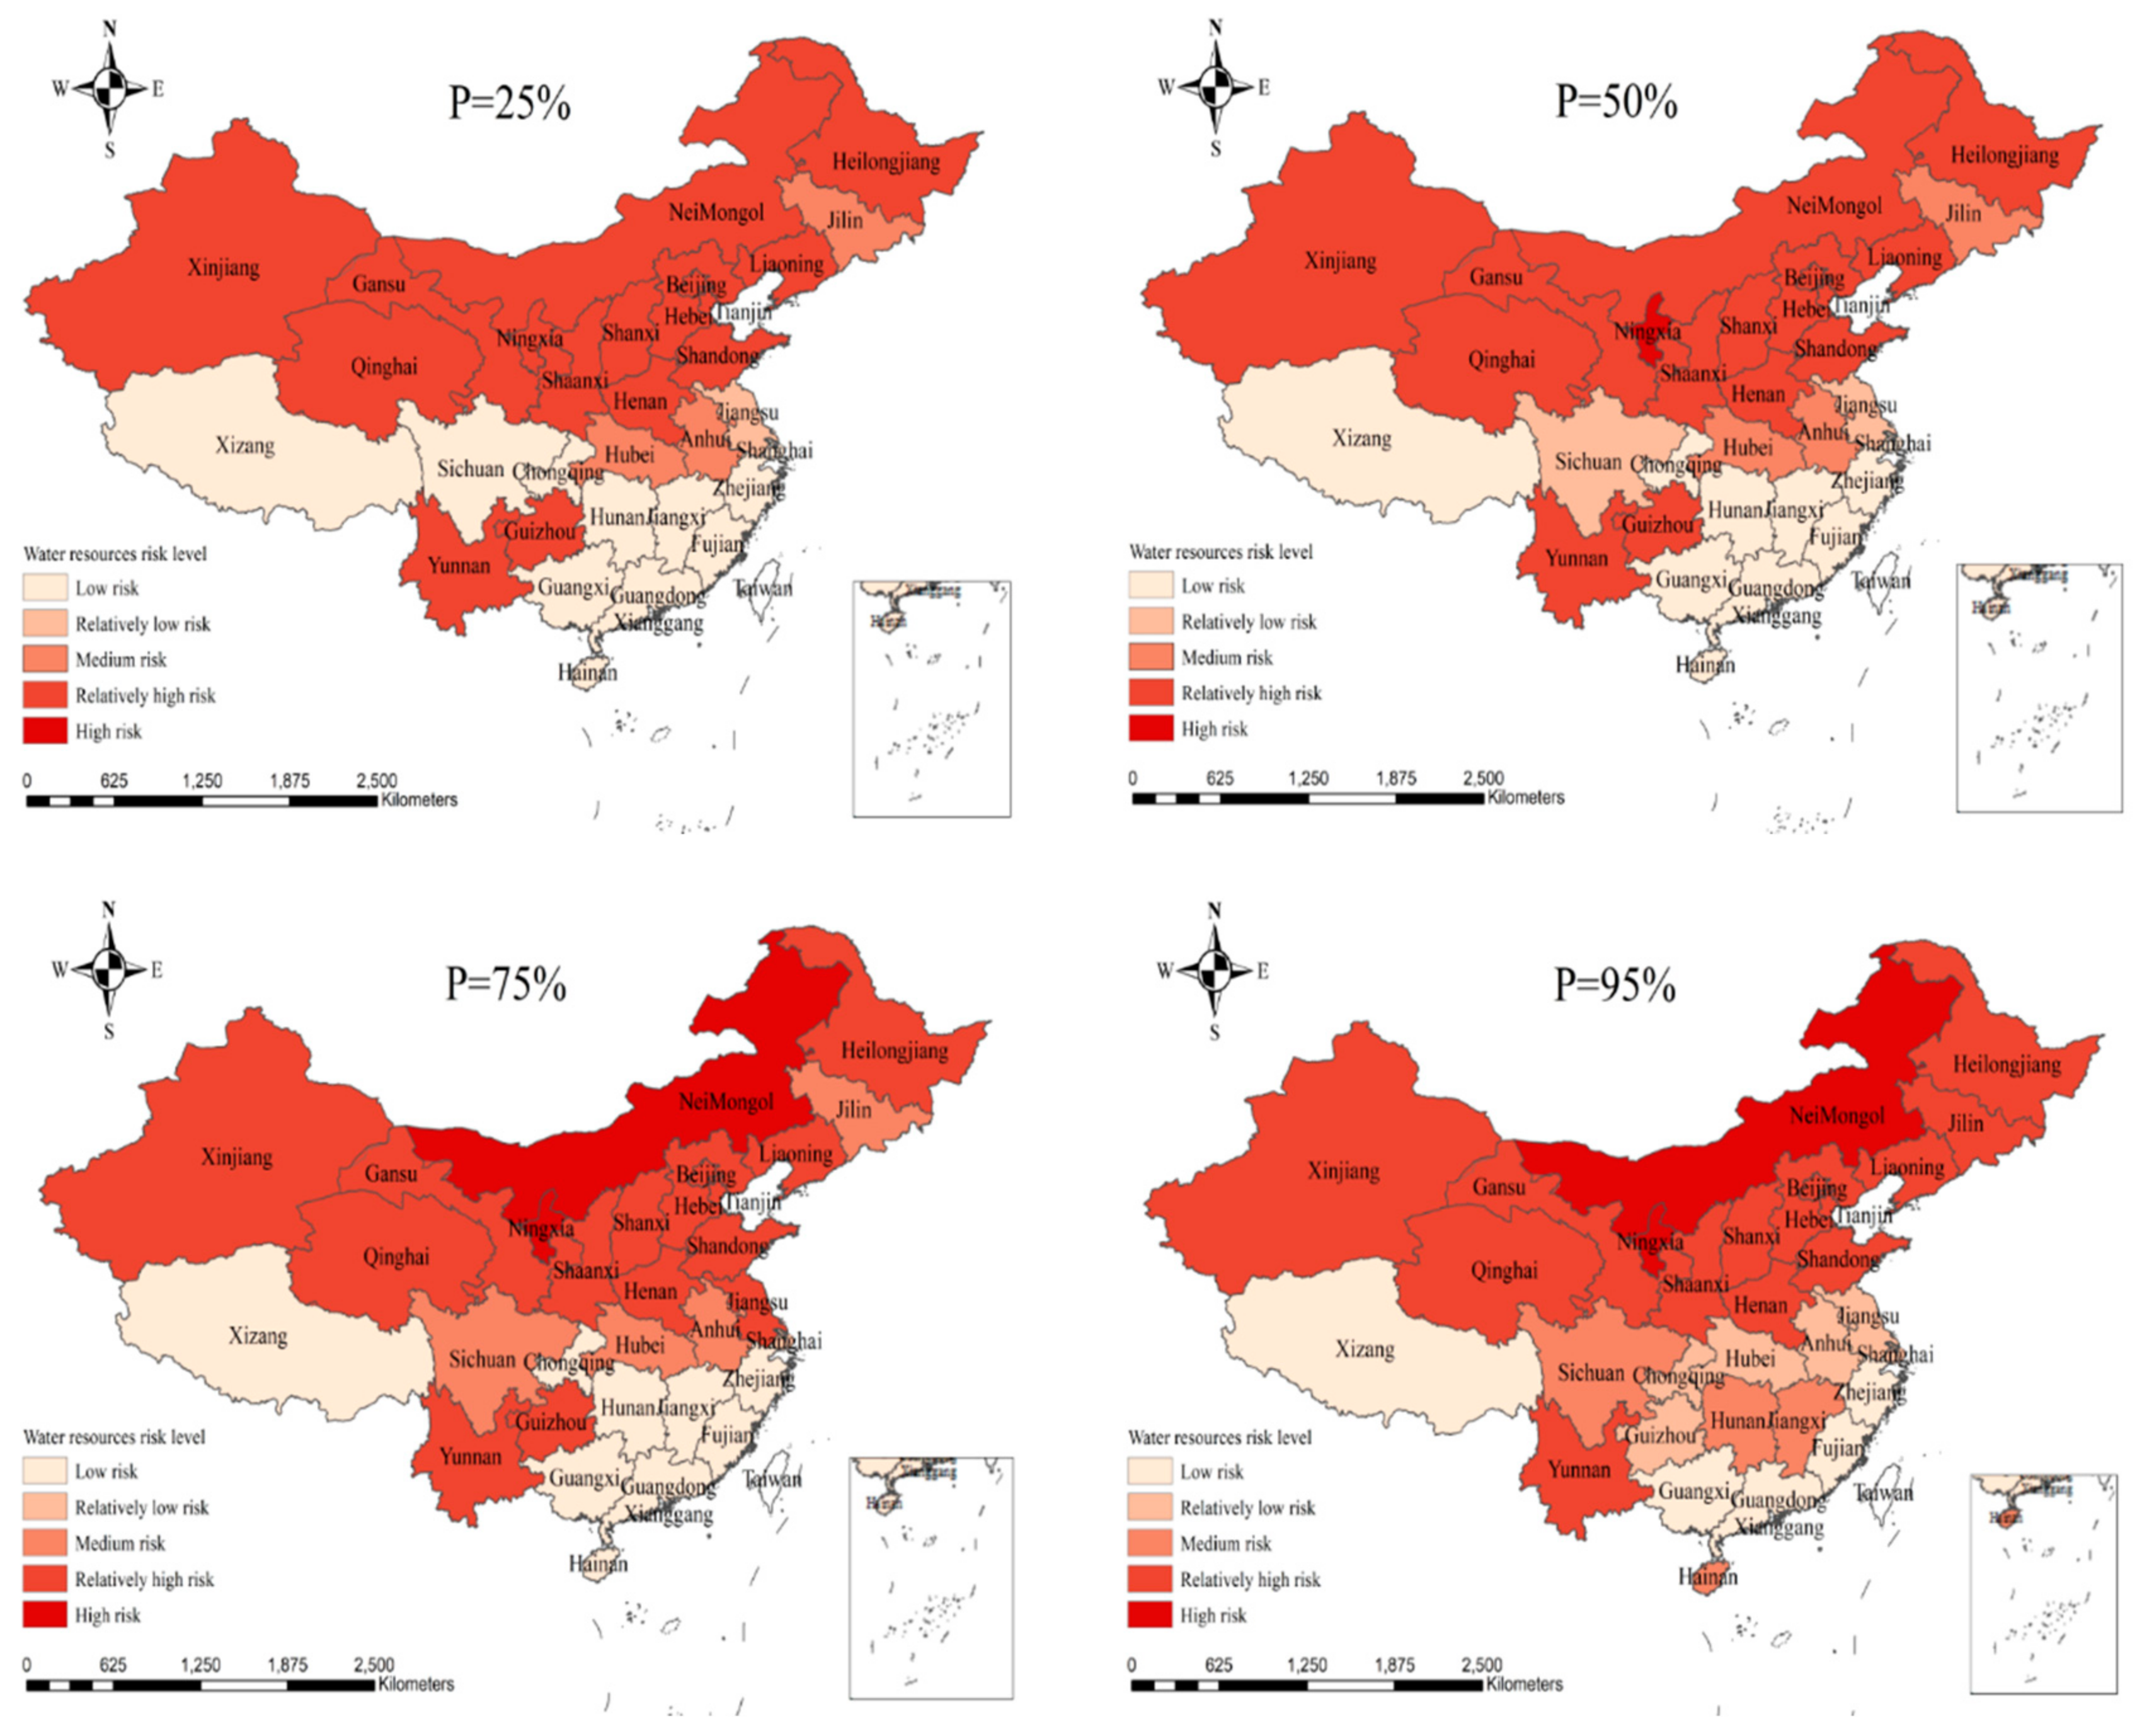
The four water resources shortage risk indicators were determined according to the cloud chart, which belong to different risk levels. Then, according to the different weights of the four water resource shortage risk assessment indicators, the certainty values of each risk level are weighted average. The value of certainty of different risk levels was compared. The level with the highest degree of certainty is the level corresponding to the risk of water shortage in the province. Then, the risk assessment results of water resource shortage for each province under the conditions of P = 25% (wet year), P = 50% (normal year), P = 75% (dry year) and P = 95% (extraordinarily dry year) are calculated and shown in Table S5 and Figure 3.
It can be seen from Table S5 and Figure 3 that the risk level zoning of water resource shortage does not change much with different assurance rates, but the spatial distribution difference is large under the same guarantee rate, which is mainly manifested as “low in the South and high in the North”, which is consistent with the distribution characteristics of water resources in China.
In the case of P = 25% (wet year), P = 50% (normal year), P = 75% (dry year) and P = 95% (extraordinarily dry year), there are 0, 1, 2 and 2 provinces (cities) with high risk; 14, 15, 14 and 14 with higher risk; and 4, 3, 4 and 4 with medium risk. Among them, Gansu, Qinghai, Xinjiang, Nei Monggol, Heilongjiang, Jilin, Liaoning, Beijing, Tianjin, Hebei, Shandong, Henan, Shanxi, Shaanxi, Yunnan and Ningxia have maintained relatively high-risk levels, which are areas with serious water shortage. In addition, Sichuan, Jiangxi, Hunan and Hainan belong to the areas with good water resource endowment, but when the guarantee rate changes from P = 25% (wet year) to P = 95% (extraordinarily dry year), the risk level is significantly improved to medium risk, while the guarantee rate in Jilin, Ningxia and Nei Monggol is changed from P = 25% (wet year) to P = 95% (extraordinarily dry year), the risk level is significantly increased to high risk or higher risk, which indicates that if drought occurs, the security risk will increase significantly.
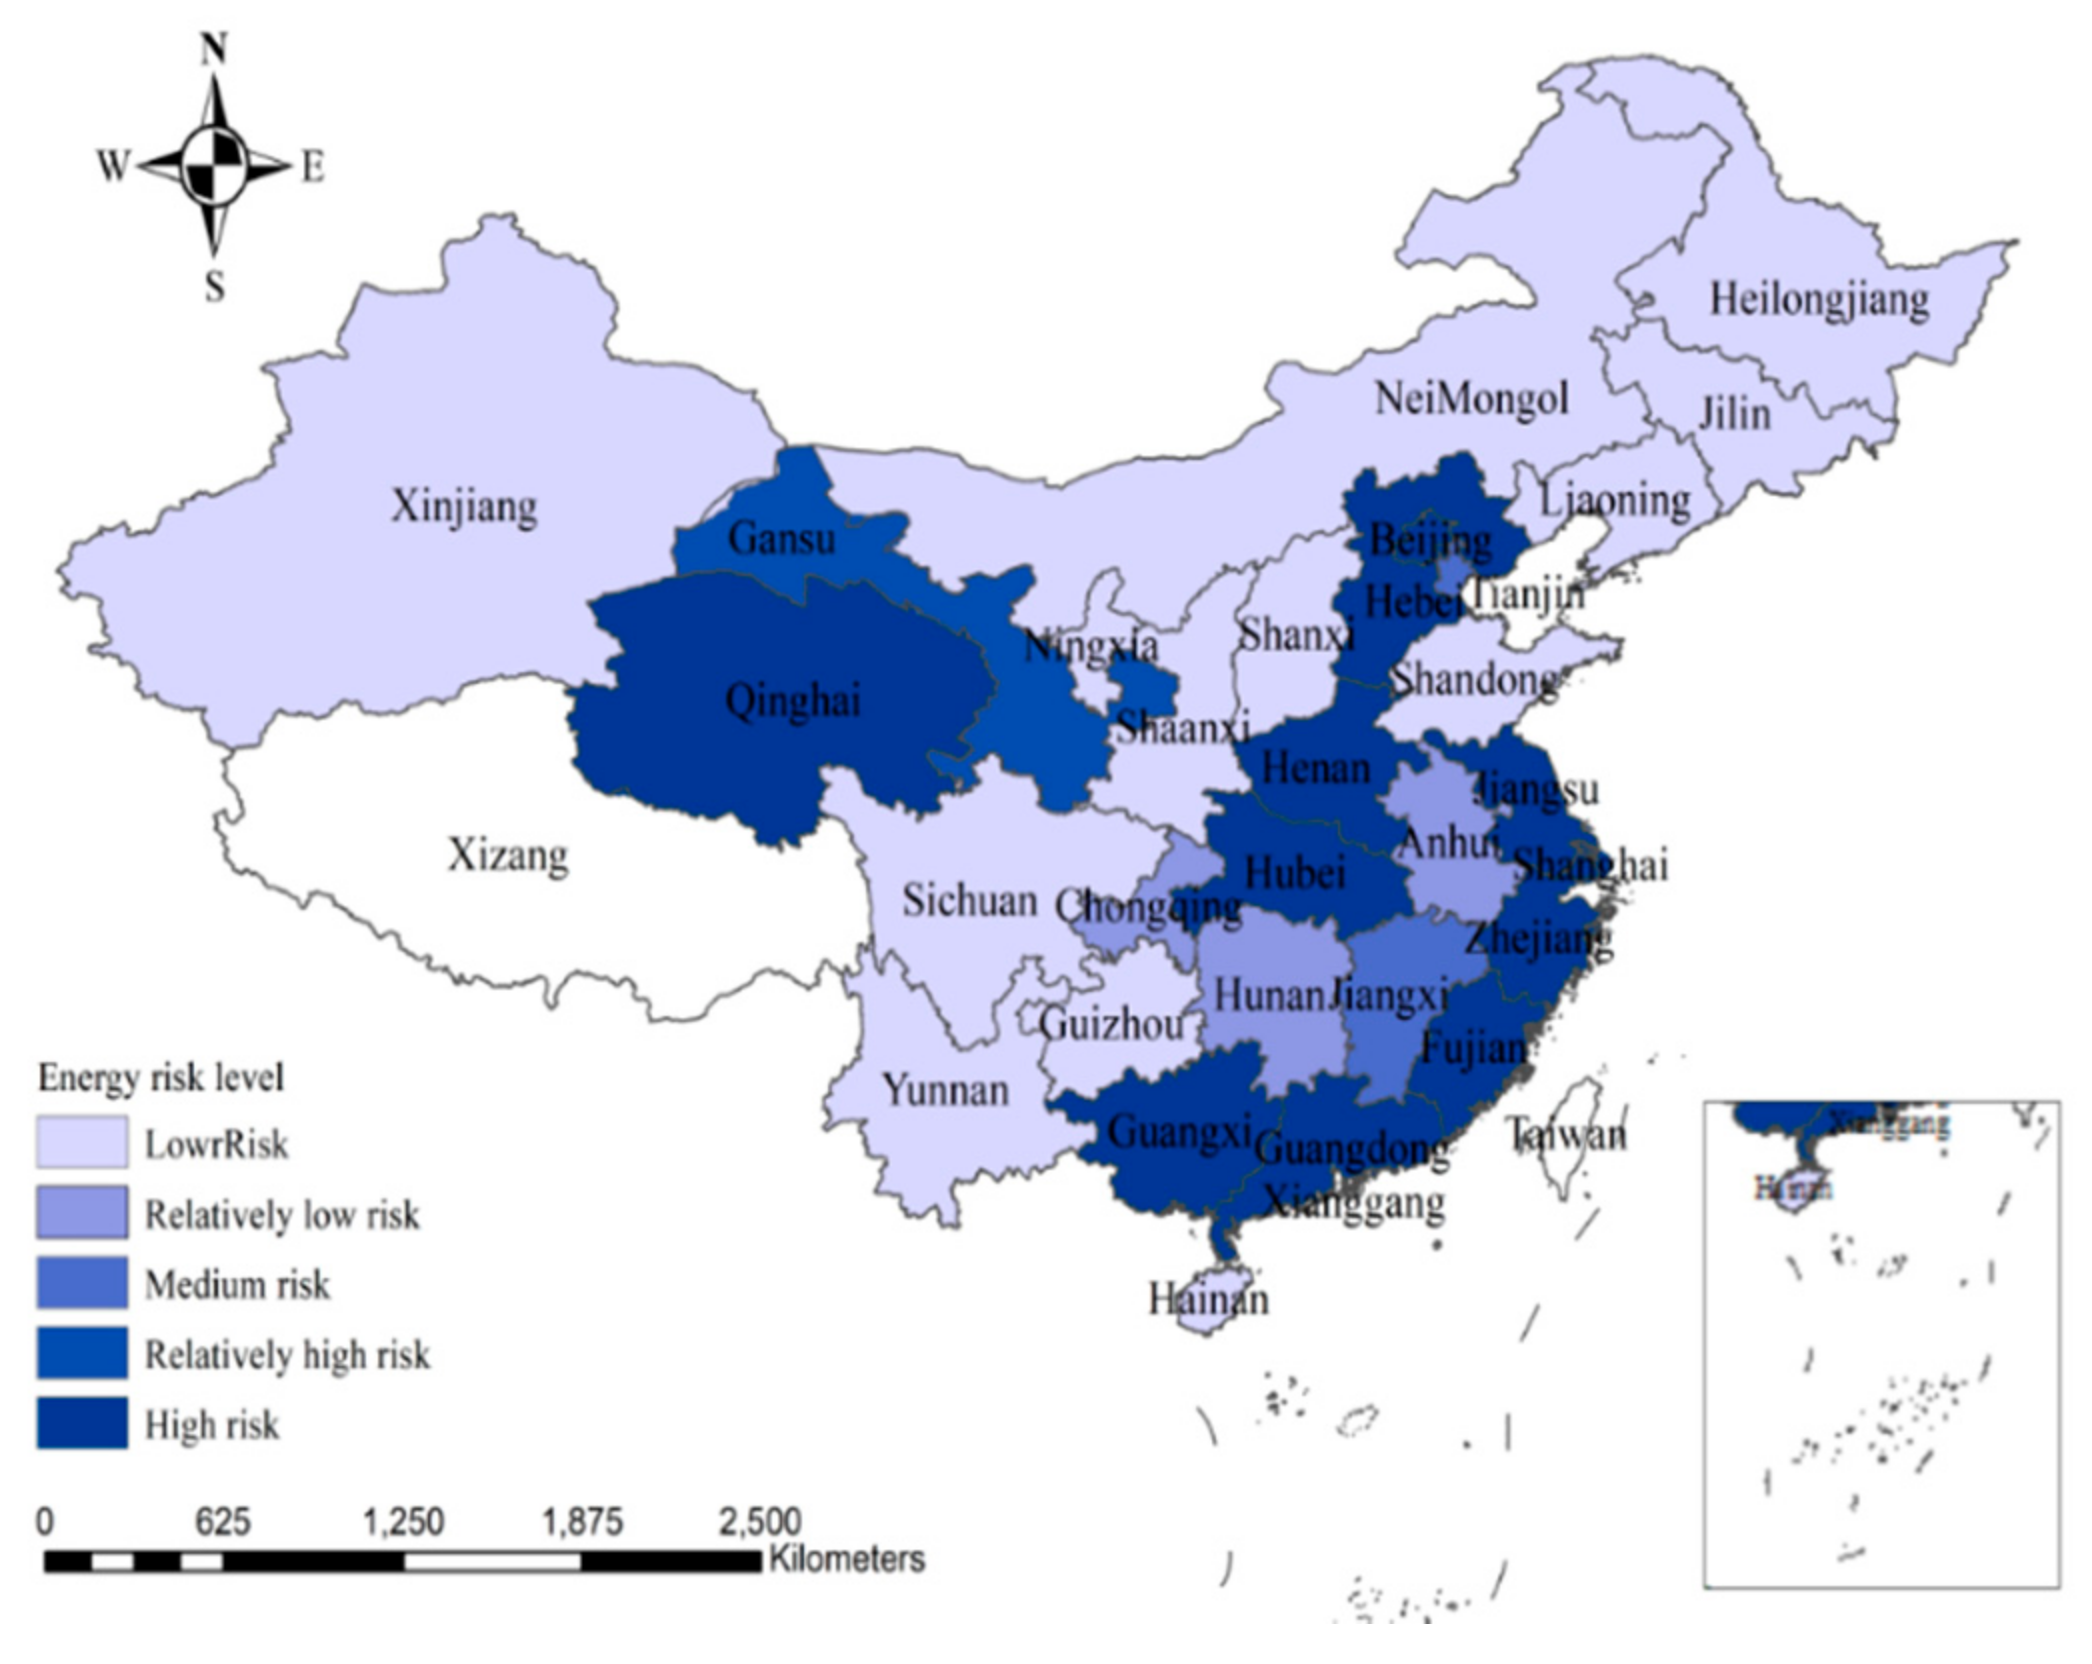
The assessment results of energy security risk degree in each province are shown in Table S6 and Figure 4. It can be seen that, in terms of spatial distribution, the risk level distribution of energy security is basically inconsistent with that of water resource security. For example, Xinjiang, Gansu, Ningxia, Shanxi, Shaanxi, Nei Monggol, Heilongjiang, Jilin and Liaoning are seriously short of water resources, but the energy is relatively rich, belonging to low-risk areas.
There are 12 high-risk energy security areas, including Beijing, Hebei, Qinghai, Henan, Jiangsu, Hubei, Shanghai, Fujian, Zhejiang, Guangdong, Guangxi and Anhui. For example, although the energy production is small in Hainan, Yunnan, Hunan, Sichuan and other provinces, these areas have mainly tourism, planting and other low-energy consumption industries, and the per capita energy consumption is small, so the demand is small and the energy security is relatively adequate.
4. Conclusions
In this paper, the Liang–Kleeman method is used to screen the risk factors of water resource shortage and energy security, respectively. Four indicators are selected as the main risk factors, and the risk assessment model of water resource shortage and energy security is constructed to quantitatively assess the risk of water resources and energy security in various regions in 2020.
The results of the risk assessment of water resources and energy security for different regions in 2020 based on the cloud model show that, under different guarantee rates (P = 25%, P = 50%, P = 75% and P = 95%), the risk level zoning of water resources shortage in the same region does not change much, but the spatial distribution of different regions is quite different, showing the characteristics of “low in the South and high in the North.” When the guarantee rate is changed from P = 25% (wet year) to P = 95% (extremely dry year), the risk level of Sichuan, Jiangxi, Hunan, Hainan, Jilin, Ningxia and Nei Monggol is significantly improved, and the drought early-warning work in these areas should be strengthened. The spatial distribution of energy security risk and water shortage risk is inconsistent, which will bring difficulties to regional water resources and energy development.
Supplementary Materials
The following are available online at https://www.mdpi.com/article/10.3390/w13131823/s1: Table S1: Information flow value of risk factors and water shortage risk; Table S2: Information flow value of risk factors and energy security risks; Table S3: Ranking results based on expert opinions; Table S4: Calculation table of structure entropy weight of the energy security risk assessment indicator; Table S5: Assessment results of risk degree of water resources shortage with different guarantee rates; Table S6: Assessment results of energy security risk degree; Figure S1: Frequency curve for (a) annual precipitation in Beijing; (b) surface water resources in Beijing; Figure S2: Comparison between the original value and the fitted value for (a) Water consumption per 10,000-yuan GDP; (b) Water consumption per capita, values of d5 and d6; Figure S3: Comparison of the original and fitted values for population in Tianjin; Figure S4: Cloud model of energy security belonging to risk level for (a) Proportion of secondary industry (on X-axis); (b) Energy reserve rate (on X-axis); (c) Energy consumption per 10,000-yuan GDP (on X-axis); (d) Population density (on X-axis).
Author Contributions
Data curation, formal analysis, and writing—review and editing, Y.Y. and H.W.; conceptualization and methodology, Y.Z. and C.W.; supervision, resources, and funding acquisition, H.W.; formal analysis, Y.Y. and C.W. All authors have read and agreed to the published version of the manuscript.
Funding
This research was funded by the National Natural Science Foundation of China (No. 51879010), the National Key Research and Development Program of China (2018YFC0407900 and 2019YFC0408902), the Graduate Innovation Fund in Beijing Key Laboratory of Urban Hydrological Cycle and Sponge City Technology (HYD2020IFDC03) and the 111 Project (No. B18006).
Institutional Review Board Statement
Not applicable.
Informed Consent Statement
Not applicable.
Data Availability Statement
The data presented in this study are available in Supplementary Materials.
Conflicts of Interest
The authors declare no conflict of interests.
References
- Kasperson, R. The Risk Society Revisited: Social Theory and Governance Edited by EugeneRosa, OrtwinRenn, and AaronMcCright. Risk Anal. 2014, 34, 2188. [Google Scholar] [CrossRef]
- D’Odorico, P.; Davis, K.F.; Rosa, L.; Carr, J.A.; Chiarelli, D.; Dell’Angelo, J.; Gephart, J.; MacDonald, G.K.; Seekell, D.A.; Suweis, S.; et al. The Global Food-Energy-Water Nexus. Rev. Geophys. 2018, 56, 456–531. [Google Scholar] [CrossRef]
- Uen, T.; Chang, F.; Zhou, Y.; Tsai, W. Exploring synergistic benefits of Water-Food-Energy Nexus through multi-objective reservoir optimization schemes. Sci. Total Environ. 2018, 633, 341–351. [Google Scholar] [CrossRef]
- Hong, S.; Yang, H.; Wang, H.; Cheng, T. Water and energy circulation characteristics and their impacts on water stress at the provincial level in China. Stoch. Environ. Res. Risk Assess. 2021, 35, 147–164. [Google Scholar] [CrossRef]
- Zheng, J.; He, F.; Wu, W. Several Problems in the Study on Integrated Evaluation of Security Risks of China’s Energy and Water Resources. Prog. Geogr. 2010, 29, 1027–1031. [Google Scholar]
- Srinivasan, R. International World Water Day 2014, Focus: Water–Energy Nexus. Curr. Sci. 2014, 106, 911–912. [Google Scholar]
- Cosgrove, W.J.; Rijsberman, F.R. World Water Vision: Making Water Everybody’s Business; World Water Council: Marseille, France; Earthscan Publications Ltd.: London, UK, 2000. [Google Scholar]
- Haimes, Y.Y. On the defifinition of vulnerability in measuring risks to infrastructures. Risk Anal. 2006, 26, 293–296. [Google Scholar] [CrossRef] [PubMed]
- Aubrecht, C.; Fuchs, S.; Neuhold, C. Spatiotemporal aspects and dimensions in integrated disaster risk management. Nat. Hazards. 2013, 68, 1205–1216. [Google Scholar] [CrossRef]
- Tsakiris, G. Flood risk assessment: Concepts, modeling, applications. Nat. Hazards. Earth Syst. Sci. Discuss. 2014, 2, 261–286. [Google Scholar]
- Haimes, Y.Y. On the complex definition of risk: A systems-based approach. Risk Anal. 2009, 29, 1647–1654. [Google Scholar] [CrossRef]
- Qian, L.; Zhang, R.; Hong, M.; Wang, H.; Yang, L. A new multiple integral model for water shortage risk assessment and its application in Beijing, China. Nat. Hazards. 2016, 80, 43–67. [Google Scholar] [CrossRef]
- Grey, D.; Garrick, D.; Blackmore, D.; Kelman, J.; Muller, M.; Sadoff, C. Water security in one blue planet: Twenty-first century policy challenges for science, Philosophical Transactions of the Royal Society A: Mathematical. Phys. Eng. Sci. 2013, 371, 20120406. [Google Scholar]
- Liu, M.; Wei, J.; Wang, G.; Wang, F. Water resources stress assessment and risk early warning—A case of Hebei Province China. Ecol. Indic. 2017, 73, 358–368. [Google Scholar] [CrossRef]
- Dong, Q.; Liu, X. Risk assessment of water security in Haihe River Basin during drought periods based on D-S evidence theory. Water Sci. Eng. 2014, 7, 119–132. [Google Scholar]
- Gain, A.K.; Giupponi, C. A dynamic assessment of water scarcity risk in the Lower Brahmaputra River Basin: An integrated approach. Ecol. Indic. 2015, 48, 120–131. [Google Scholar] [CrossRef]
- Chuang, M.C.; Ma, H.W. Energy security and improvements in the function of diversity indices—Taiwan energy supply structure case study. Renew. Sustain. Energy Rev. 2013, 24, 9–20. [Google Scholar] [CrossRef]
- Chalvatzis, K.J.; Ioannidis, A. Energy supply security in the EU: Benchmarking diversity and dependence of primary energy. Appl. Energy 2017, 207, 465–476. [Google Scholar] [CrossRef]
- Liu, L.; Chen, L.; Liu, X. Theories, Methods and Progress of Energy Security Research. Prog. Geogr. 2012, 31, 403–411. [Google Scholar]
- Zhang, L.; Yu, J.; Sovacool, B.K.; Ren, J. Measuring energy security performance within China: Toward an inter-provincial prospective. Energy 2017, 125, 825–836. [Google Scholar] [CrossRef]
- Zhou, Y.; Li, J.; Wang, G.; Chen, S.; Xing, W.; Li, T. Assessing the short-to medium-term supply risks of clean energy minerals for China. J. Clean. Prod. 2019, 215, 217–225. [Google Scholar] [CrossRef]
- Li, D.; Meng, H.; Shi, X. Membership clouds and membership cloud generators. Comput. Res. Dev. 1995, 32, 15–20. [Google Scholar]
- Wei, G.; Dong, X. Evaluation of development and utilization of regional water resources based on cloud model. J. Water Resour. Water Eng. 2014, 25, 71–74. [Google Scholar]
- Liu, D.; Wang, D.; Ding, H.; Wang, L. Eutrophication assessment by Entropy-Cloud Model. J. Hydraul. Eng. 2014, 45, 1214–1222. [Google Scholar]
- Siddiqi, A.; Anadon, L.D. The water-energy nexus in Middle East and North Africa. Energy Policy 2011, 39, 4529–4540. [Google Scholar] [CrossRef]
- Jiang, Y. China’s water scarcity. J. Environ. Manag. 2009, 90, 3185–3196. [Google Scholar] [CrossRef]
- Liu, J.; Yang, W. Water Sustainability for China and Beyond. Science 2012, 337, 649–650. [Google Scholar] [CrossRef] [PubMed]
- Cai, J.; Varis, O.; Yin, H. China’s water resources vulnerability: A spatio-temporal analysis during 2003–2013. J. Clean. Prod. 2017, 142, 2901–2910. [Google Scholar] [CrossRef]
- Energy Department of National Statistics. China Energy Statistical Yearbook 2016; Energy Department of National Statistics: South Wales, UK, 2017. [Google Scholar]
- Han, Y. Relationship among Energy Consumption, Economic Growth and Carbon Emissions Based on Discussion on the Research of Energy Policies; China University of Geosciences: Beijing, China, 2012; p. 126. [Google Scholar]
- Liu, J.; Cheng, Z.; Zhang, H. Does industrial agglomeration promote the increase of energy efficiency in China? J. Clean. Prod. 2017, 164, 30–37. [Google Scholar] [CrossRef]
- Liang, X. The Liang-Kleeman Information Flow: Theory and Applications. Entropy 2013, 15, 327–360. [Google Scholar] [CrossRef] [Green Version]
- Liang, X. Unraveling the cause-effect relation between time series. Phys. Rev. E 2014, 90, 52150. [Google Scholar] [CrossRef] [PubMed] [Green Version]
- Zhou, Q.; Zhang, X.; Wang, Z. Land use ecological risk evaluation in Three Gorges Reservoir Area based on normal cloud model. Trans. Chin. Soc. Agric. Eng. 2014, 30, 289–297. [Google Scholar]
- Wang, M.; Zhu, M. Evaluating intensive land use situation of development zone based on cloud models. Trans. Chin. Soc. Agric. Eng. 2012, 28, 247–252. [Google Scholar]
- Zha, D.; Zhou, D. The Inequality about Provincial Energy Efficiency and Its Related CO2 Emission: Decomposition Based on Kaya. Syst. Eng. 2007, 11, 65–71. [Google Scholar]
- Liao, Q.; Zhang, S.; Chen, J. Risk Assessment and Prediction of Water Shortages in Beijing. Resour. Sci. 2013, 35, 140–147. [Google Scholar]
- Cheng, Q. Structure entropy weight method to confirm the weight of evaluating index. Syst. Eng. Theory Pract. 2010, 30, 1225–1228. [Google Scholar]
- Lei, G.; Yin, J.; Wang, W.; Wang, H. The Analysis and Improvement of the Fuzzy Weighted Optimum Curve-Fitting Method of Pearson-Type III Distribution. Water Resour. Manag. 2018, 32, 4511–4526. [Google Scholar] [CrossRef]
- Wang, Z.; Li, Q.; Pei, L. A seasonal GM (1,1) model for forecasting the electricity consumption of the primary economic sectors. Energy 2018, 154, 522–534. [Google Scholar] [CrossRef]
Figure 1.
The diagram of causality between risk factors and risks. (a) The correlation between risk factors and water resource security; (b) the correlation between risk factors of energy security.
Figure 1.
The diagram of causality between risk factors and risks. (a) The correlation between risk factors and water resource security; (b) the correlation between risk factors of energy security.

Figure 2.
The risk assessment results of water resources and energy security based on the cloud model for (a) water consumption per 10,000-yuan GDP (on X-axis); (b) water consumption per capita (on X-axis); (c) Precipitation (on X-axis);precipitation; (d) precipitation coefficient (on X-axis).
Figure 2.
The risk assessment results of water resources and energy security based on the cloud model for (a) water consumption per 10,000-yuan GDP (on X-axis); (b) water consumption per capita (on X-axis); (c) Precipitation (on X-axis);precipitation; (d) precipitation coefficient (on X-axis).

Figure 3.
The risk level distribution of water resource shortage with different guarantee rates P in China 2020 (predicted).
Figure 3.
The risk level distribution of water resource shortage with different guarantee rates P in China 2020 (predicted).

Figure 4.
The risk level distribution of energy security in China 2020 (predicted).


Table 1.
Predicted results of precipitation in Beijing in 2020.
| Period Types | Precipitation (mm) | Surface Water Resources (108 m3) |
|---|---|---|
| P = 25% (wet year) | 647.08 | 14.91 |
| P = 50% (normal year) | 547.39 | 9.95 |
| P = 75% (dry year) | 447.70 | 6.96 |
| P = 95% (extraordinarily dry year) | 304.29 | 5.11 |
Table 2.
Predicted results of precipitation in Beijing in 2020.
| Indicator | Average Relative Error | Relative Precision | C | Level |
|---|---|---|---|---|
| Water consumption per 10,000-yuan GDP/d5 | 647.08 | 14.91 | 0.061 | Good |
| Water supply per capita/d6 | 547.39 | 9.95 | 0.257 | Good |
Table 3.
Classification criteria for risk assessment indicators of water resources and energy security.
Table 3.
Classification criteria for risk assessment indicators of water resources and energy security.
| Indicators | Level Ⅰ | Level Ⅱ | Level Ⅲ | Level Ⅳ | Level Ⅴ |
|---|---|---|---|---|---|
| Water consumption per 10,000-yuan GDP | 0~15 | 15~50 | 50~100 | 100~300 | 300~750 |
| Water consumption per capita | ≥500 | 400~500 | 300~400 | 200~300 | 0~200 |
| precipitation | ≥1000 | 750~1000 | 500~750 | 250~500 | 0~250 |
| Runoff coefficient | ≥0.32 | 0.29~0.32 | 0.27~0.29 | 0.24~0.27 | 0~0.24 |
| Proportion of secondary industry | 0~35 | 35~40 | 40~46 | 48~46 | ≥48 |
| Population density | 0~250 | 250~300 | 300~350 | 350~400 | ≥400 |
| Energy reserve rate | ≥2.0 | 1.0~2.0 | 0.6~1.0 | 0.2~0.6 | 0~0.2 |
| Energy consumption per 10,000-yuan GDP | 0~250 | 250~500 | 500~750 | 750~1000 | ≥1000 |
Publisher’s Note: MDPI stays neutral with regard to jurisdictional claims in published maps and institutional affiliations. |
© 2021 by the authors. Licensee MDPI, Basel, Switzerland. This article is an open access article distributed under the terms and conditions of the Creative Commons Attribution (CC BY) license (https://creativecommons.org/licenses/by/4.0/).
Share and Cite
MDPI and ACS Style
Yang, Y.; Wang, H.; Zhang, Y.; Wang, C. Risk Assessment of Water Resources and Energy Security Based on the Cloud Model: A Case Study of China in 2020. Water 2021, 13, 1823. https://doi.org/10.3390/w13131823
AMA Style
Yang Y, Wang H, Zhang Y, Wang C. Risk Assessment of Water Resources and Energy Security Based on the Cloud Model: A Case Study of China in 2020. Water. 2021; 13(13):1823. https://doi.org/10.3390/w13131823
Chicago/Turabian StyleYang, Yafeng, Hongrui Wang, Yuanyuan Zhang, and Cheng Wang. 2021. "Risk Assessment of Water Resources and Energy Security Based on the Cloud Model: A Case Study of China in 2020" Water 13, no. 13: 1823. https://doi.org/10.3390/w13131823
Note that from the first issue of 2016, this journal uses article numbers instead of page numbers. See further details here.