
Global Research on Riparian Zones in the XXI Century: A Bibliometric Analysis


1
Department of Biology, Faculty of Natural Sciences, Universidad del Rosario, Kr 26 No 63B-48, Bogotá D.C. 111221, Colombia
2
Centro de Recursos para el Aprendizaje y la Investigación, Calle 12C Nº 6-25, Bogotá D.C. 111711, Colombia
*
Author to whom correspondence should be addressed.
Water 2021, 13(13), 1836; https://doi.org/10.3390/w13131836
Submission received: 13 May 2021
/
Revised: 23 June 2021
/
Accepted: 24 June 2021
/
Published: 30 June 2021
Abstract
:Riparian zones (RZs) are transitional environments at the interface between land and freshwater ecosystems, which are important in terms of socioecological services. In this work, we report a bibliometric-based analysis to unveil the knowledge structure and actors of scientific production on riparian zones for the first 20 years of the 21st century. We performed a literature search, querying for riparian zones publications for the period 2001–2020. The selected 1171 bibliographic records were analyzed by extracting several bibliometric indices of reporting tendencies, location, collaboration dynamics, and top topics. Results show that RZs publications increased considerably from 2001 to 2020, and top journals publishing on the subject are from the water, environmental management, and ecology areas. The US, China, Brazil, and Canada were the most productive countries, while the institutions with higher productivity were the Chinese Academy of Sciences and Oregon University. In terms of impact, the US, Canada, and Australia led in citation number, while the country collaboration network showed that the strongest links occur between China and the US. Our results also show that few studies were produced in low-middle income countries, which suggests a need to funnel international funding to study riparian environments in these geographical contexts. According to analysis of frequency, top topics are related to water quality and focused on lotic environments. We here present the main knowledge structure of RZs studies globally for the first 20 years of the XXI century.
1. Introduction
Riparian zones (RZs) are transitional environments occurring at the interface between land and freshwater ecosystems, with distinctive biotic and abiotic characteristics strongly regulated by water presence [1,2,3]. Such environments include floodplains and near-slope zones ecologically connected to the waterbody by surface and subsurface hydrology [4]. Riparian areas can develop adjacent to perennial, intermittent, and ephemeral streams, lentic ecosystems, and estuarine-marine shorelines, and their physical and ecological structure is largely regulated by seasonal waterflow dynamics and transport of sediments [5]. Vegetation along lotic ecosystems affects and responds to river processes by modifying water flow, retaining sediments, and modifying erosion susceptibility and morphology of stream banks through flow-vegetation-sediments feedback mechanisms [6]. Riparian trees’ growth rate influences river corridors dynamics and morphology [7,8], and the diversity and productivity of riparian vegetation can also have large effects on riverine biogeochemical processes [9]. At the same time, riparian vegetation displays a range of life history, morphological, and phenological adaptations as a result of different flow regimes, which derive into distinct traits and strategies for survival, dispersal, and reproduction [10,11]. Anthropic drivers of change, e.g., land use activities, strongly influence their abiotic and biotic structure [12].
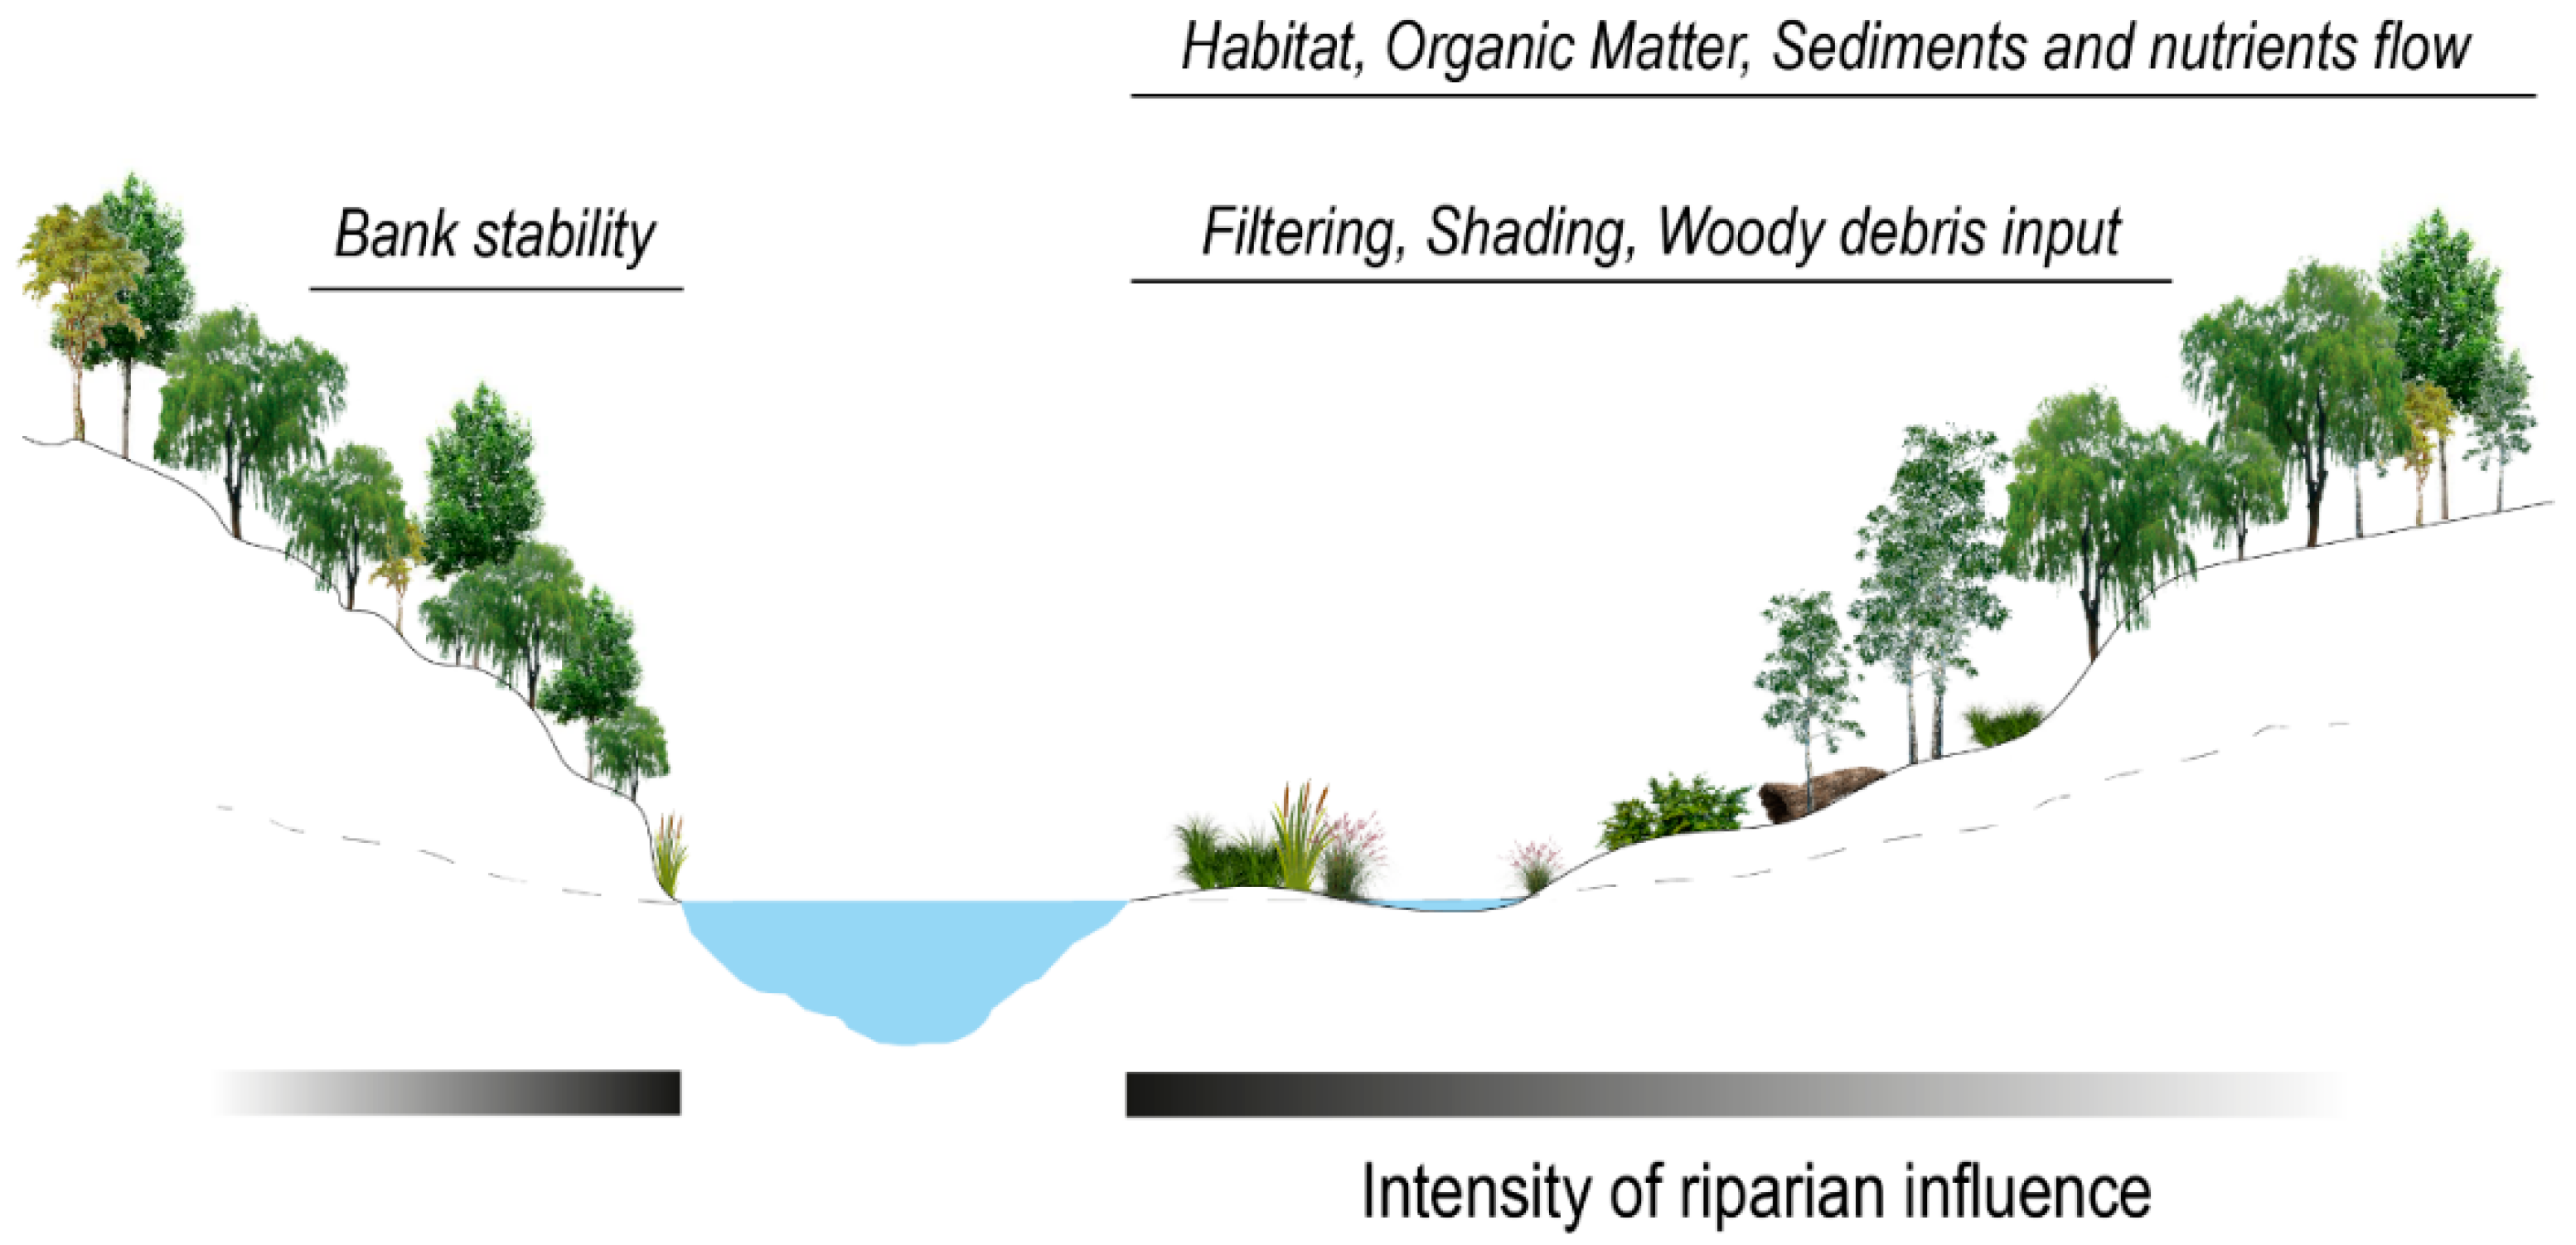
Comprehensive discussions of the heterogeneous definitions of ‘riparian zones’ are provided by Dufour et al. (2019) [13] and Fischer et al. (2011) [14]. The diversity and confusion of terms present in the literature is also reflected into the different attempts to spatially delineate and map RZs. Simple approaches rely on the delineation of a fixed or variable width buffer from the water stream bank (e.g., 1 km [15]). More complex modelling considers a variety of information from Earth Observation-based geomorphological, hydrological, land cover-land use, and vegetation indices [16,17,18], including functional considerations [19,20]. A schematic representation of riparian zones is shown in Figure 1.
Despite the heterogeneity in concepts and spatial delineation approaches, a large agreement is found with respect to the high significance of riparian systems in terms of the multiple socioecological services they deliver to society, i.e., RZs, and especially riparian vegetation, are sources of a large array of different ecosystem services (ESS [21]). In terms of provisioning services, fuel and energy can be obtained from riparian forests and grass vegetation [22,23], and they can also be providers of important genetic resources [24]. Several regulation services are modulated by riparian zones, such as water quality regulation by filtration of pollutants and sediments [25,26], carbon sequestration and regulation of micro-climate [27,28], pollination [29], habitat maintenance [30], and flow regulation and erosion control [31,32]. Riparian areas also provide cultural services, such as environmental education, aesthetic, and recreational opportunities [33,34]. The provision of riparian ESS is under threat due to severe anthropogenic impacts, especially those related to land conversion to agriculture, the alteration of stream flows, water nutrient enrichment, and climate change [35,36].
Riparian zones are a growing field of research due to their ecological and societal importance. Several reviews have recently summarized and discussed the scientific literature on riparian vegetation [6,10,13] and their services [30], riparian biogeochemistry and contaminants abatement [37], functional riparian buffers delineation [38], riparian structure’s influence on invertebrate ecology [39], and the evolution of research themes linked to riparian zones [40].
Nevertheless, there is still a lack of comprehensive analyses focusing on the main knowledge structure of RZs studies globally considering trends in topics, leading institutions, authors, and collaboration networks. Therefore, we present a bibliometric-based analysis to unveil the major spatiotemporal patterns of riparian zones scientific production for the first 20 years of the 21st century. Bibliometric analyses are largely based on mathematical and statistical methods to derive the structure and development of a research topic or field based on publications and other media of communication [41,42]. Results from systematic literature reviews based on bibliometric analyses provide insights into the lead researchers, institutions and journals, collaboration structures of scholarly networks, and existence of literature gaps while helping to identify forward-momentum topics, among others [43,44].
The main aim of this work is to characterize the development of RZs research, describing the knowledge structure and actors involving riparian research globally for the period between 2001–2020. The analysis was performed based on publication outputs, authors’ keywords and KeyWords Plus® (Clarivate Analytics, Philadelphia, PA, USA), journals, institutions, authors, and countries. Our results can help identify knowledge and geographical gaps that need future support to aid decisional and planning processes involving riparian zones.
2. Materials and Methods
2.1. Bibliographic Search Strategy
A literature search of RZs was initially carried out by querying the subscription-based services Scopus® [45] and Web of Science™ (WoS [46]). Both services provide access to several databases for gathering bibliometric data of published material in multiple areas of knowledge. Numerous bibliometric reviews have based their data search on Scopus® or Web of Science™ (e.g., [47,48,49,50].
The following search criteria were applied in the query of both Scopus® and WoS principal collections. First, we defined a temporal interval from 2001 to 2020 (search date: 27-11-2020), covering about 20 years of scientific literature. The types of documents searched were articles, books, book chapters, and reviews, representing, from our perspective, the most important categories of peer-reviewed published research material. The following string was then searched: “riparian area*” OR “riparian zone*”. Since the terms ‘area’ and ‘zone’ are both commonly used in riparian studies, the asterisk was used to ensure the inclusion of plural words. The search string was applied to all words present in the publication title or in the authors’ keywords. This choice aimed to consider publications that include a primary focus on RZs instead of merely naming the term. The documents were searched in English language. The exact formal query is reported in Supporting Information (Table S1). Given that Scopus® provided ~11% more results than WoS (1171 versus 1054), all bibliographic analyses were carried out based on Scopus® [51] (Dataset S1 in Supplementary Materials). The resulting records were exported in BibTeX format, carrying crucial bibliometric information, such as authors name and affiliations, publication title and year, journal name, etc.
The Preferred Reporting Items for Systematic Reviews and Meta-Analyses (PRISMA; [52]) was adopted. The retrieved records from Scopus® (n = 1171) were automatically screened for duplicates (0 replicates were found). Due to the high number of documents, 100 records were randomly selected and screened to ensure that the content dealt with RZs and that they were written in English language. After the eligibility check, the 1171 records were included in the quantitative analyses.
2.2. Bibliometric Analyses
All bibliographic analyses were performed based on the Bibliometrix package [53] in RStudio [54]. Graphic layouts were plotted using the Bibliometrix user-friendly interface Biblioshiny, and collaboration networks were mapped using VOSviewer 1.6.16 [55]. For networks construction, we used fractional counting, which assigns co-authored publications fractionally to each author. This method has been reported as a better option than full counting [47]. In the network analysis, we focused on “link strength,” i.e., a positive value that indicates the strength of a connection or a relation between 2 items, considering countries, institutions, and authors. For each item in the network, total link strength refers to the total strength of all links of that item with other items. Additionally, the link strength of co-authorship indicates the number of publications that 2 researchers have co-authored [56].
Using the biblioAnalysis tool in Bibliometrix, we extracted several quantitative indices from the selected 1171 records, which, in this study, were grouped in 3 sections:
(i) Reporting tendencies: This section evaluates the distribution of RZs publications, including biblioanalytic information such as document type, most cited papers, number of citations per journal, and principal journals or sources where the documents were published.
(ii) Location tendencies and collaboration dynamics: This section evaluated countries and institutions that were more prolific on RZs publications over time (publication number per country and publications per leading institution) and networks of interactions. The country collaboration network and institution collaboration network were constructed in VOSviewer, which provided better graphical layouts. An author collaboration network was also derived to analyze cooperative efforts among researchers.
(iii) Top topics: Lastly, we focused on the top topics associated to RZs publications. For that, we constructed word clouds in Biblioshiny based on both keywords reported by the authors and KeyWords Plus® (i.e., terms created by Thomson Reuters from significant and frequently occurring words in the titles of an article’s cited references) and plotted in WordArt.com. To analyze topic changes through time, we evaluated the yearly occurrence of top keywords between 2001 and 2020 employing the KeywordGrowth function in Bibliometrix.
The complete set of bibliometric indicators used in this study is summarized in Table S2.
3. Results and Discussion
3.1. Reporting Tendencies
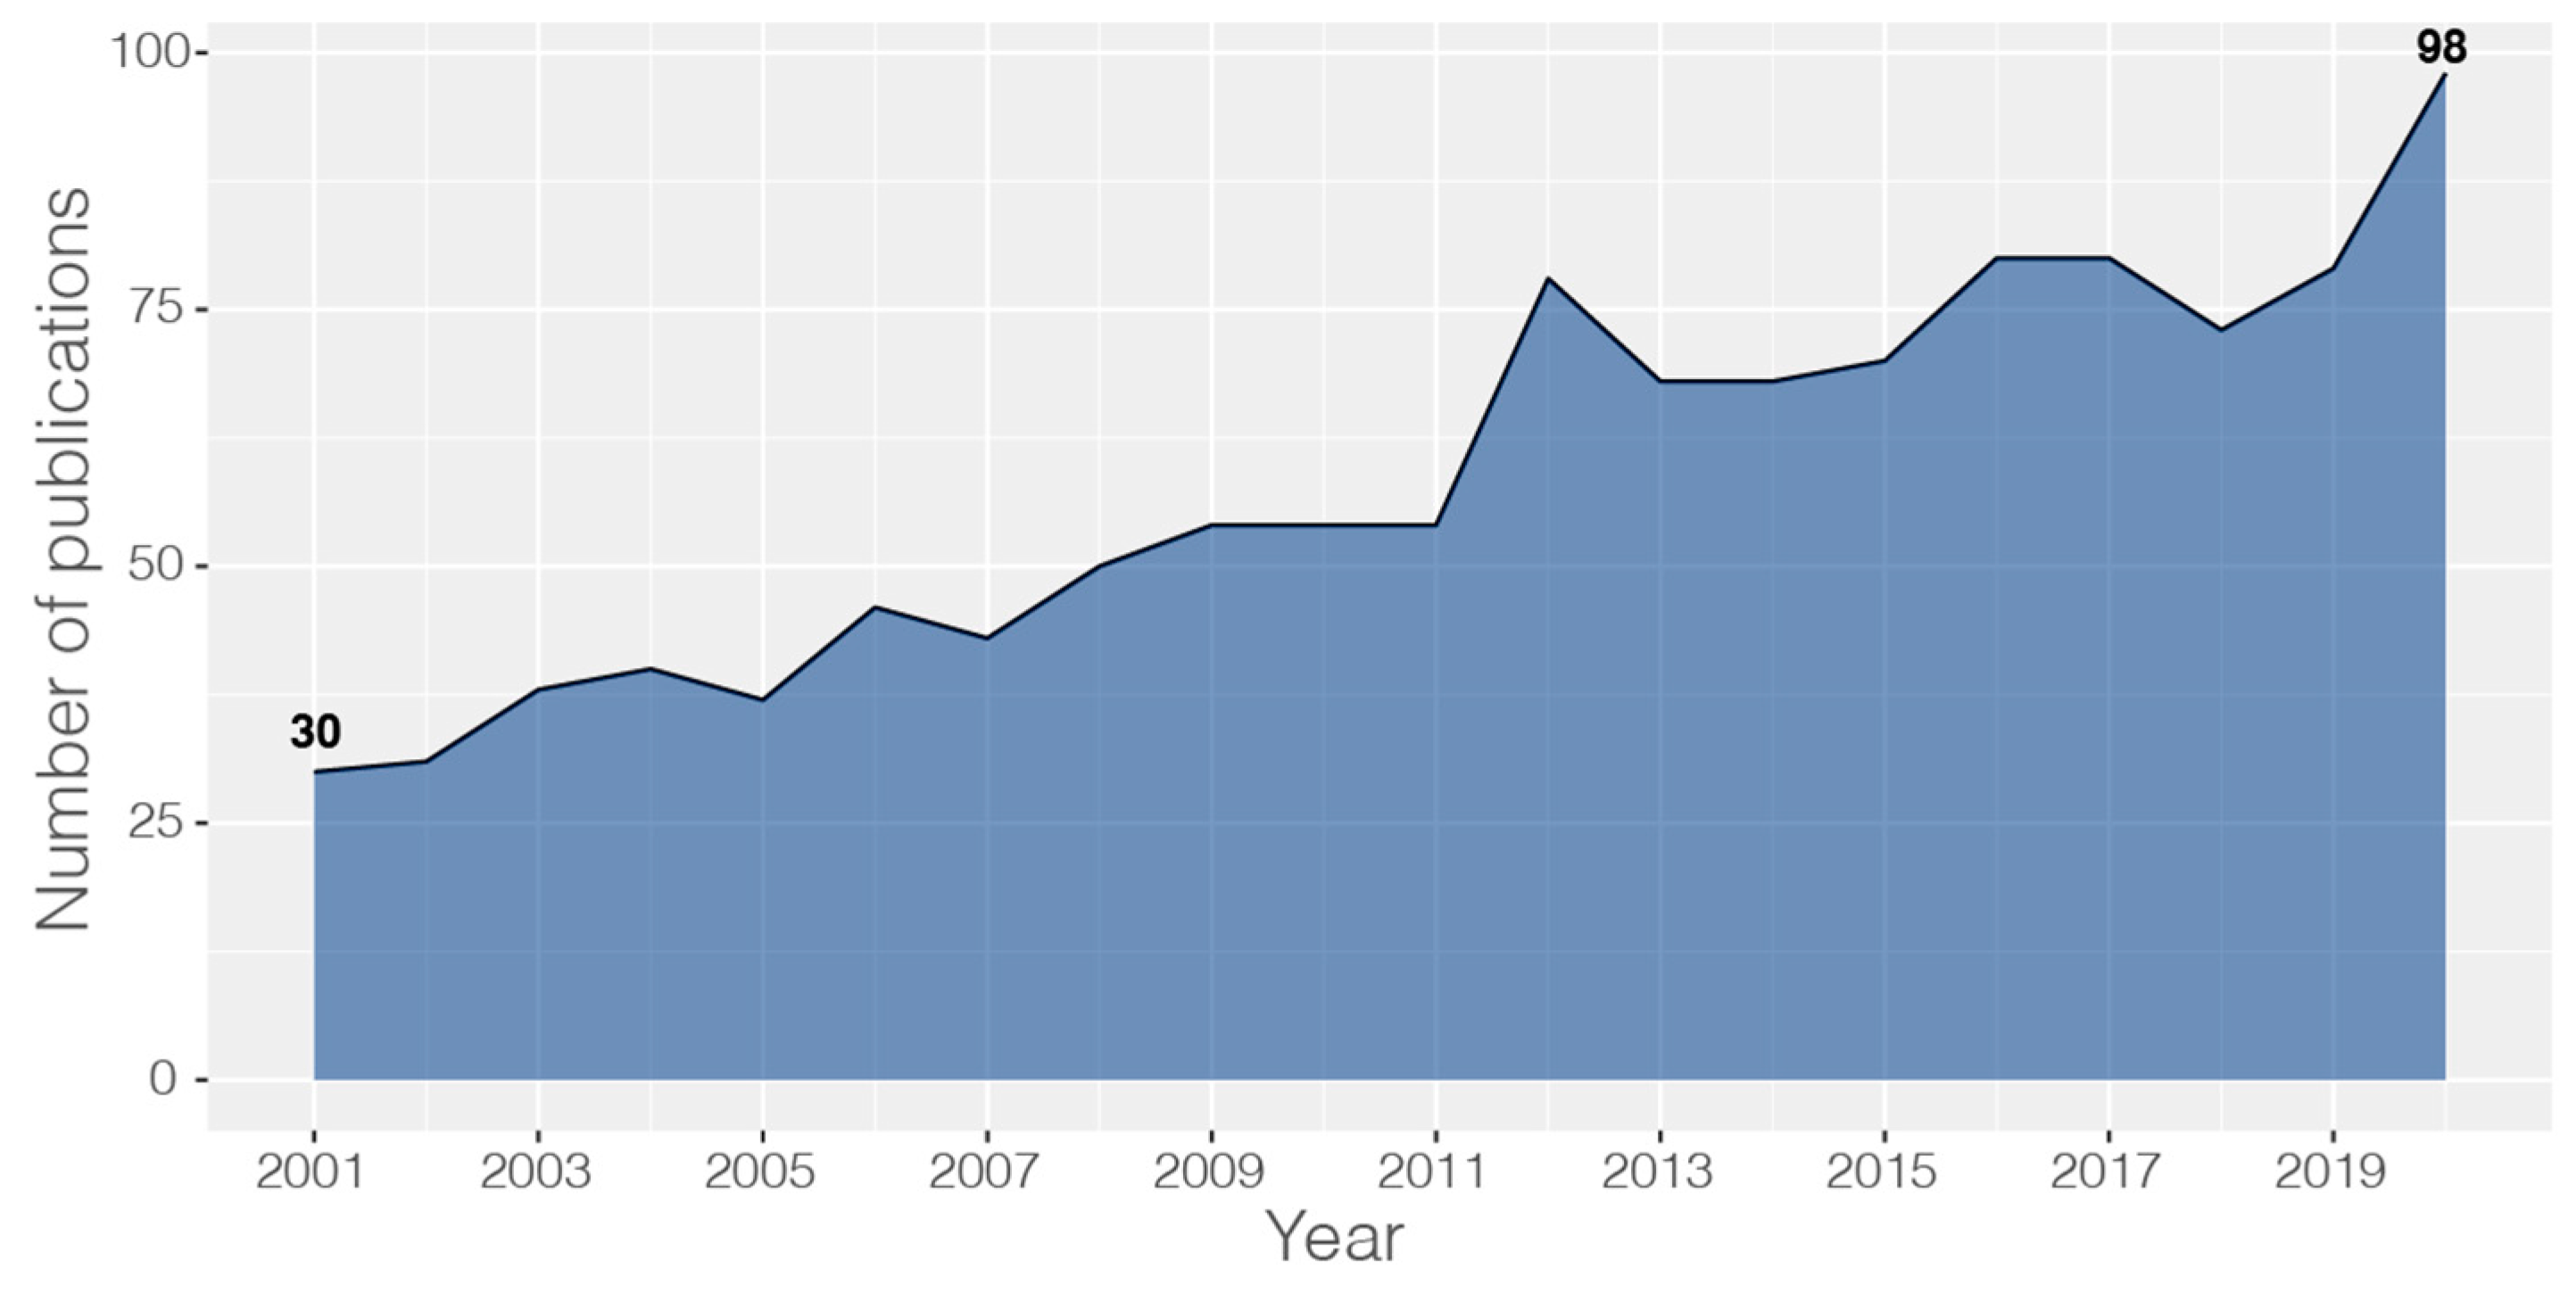
The 1171 publications retrieved from Scopus® show an average annual percent growth rate of 6.43%, from 30 publications in 2001 to 98 in 2020 (Figure 2). A total of 433 different sources published documents about RZs. Most of these correspond to articles in journals (1098), with a considerable number of reviews (42), and some books and book chapters (31). Based on our bibliometric analyses, the top 10 journals publishing RZs research accounted for about 23% of the articles, i.e., Journal of Hydrology: 40; Forest Ecology and Management: 30; Hydrological Processes: 28; Journal of the American Water Resources Association: 28; Science of the Total Environment: 26; Water Resources Research: 20; Wetlands: 20; Biogeochemistry: 19; Ecological Indicators: 16; Freshwater Ecology: 15; River Research and Applications: 15; Journal of Environmental Quality: 15.
Yet, these journals did not always correspond to the top 10 most highly cited documents (Table 1). For example, the document with the highest number of citations (676) was published in Freshwater Biology (Baxter et al., 2005 [57]), which is not listed above. Additionally, the five most cited sources were the journals Ecology (1247 citations), Journal of Environmental Quality (772), Journal of Hydrology (722), Water Resources Research (716), and Biogeochemistry (704).
3.2. Location Tendencies and Collaboration Dynamics
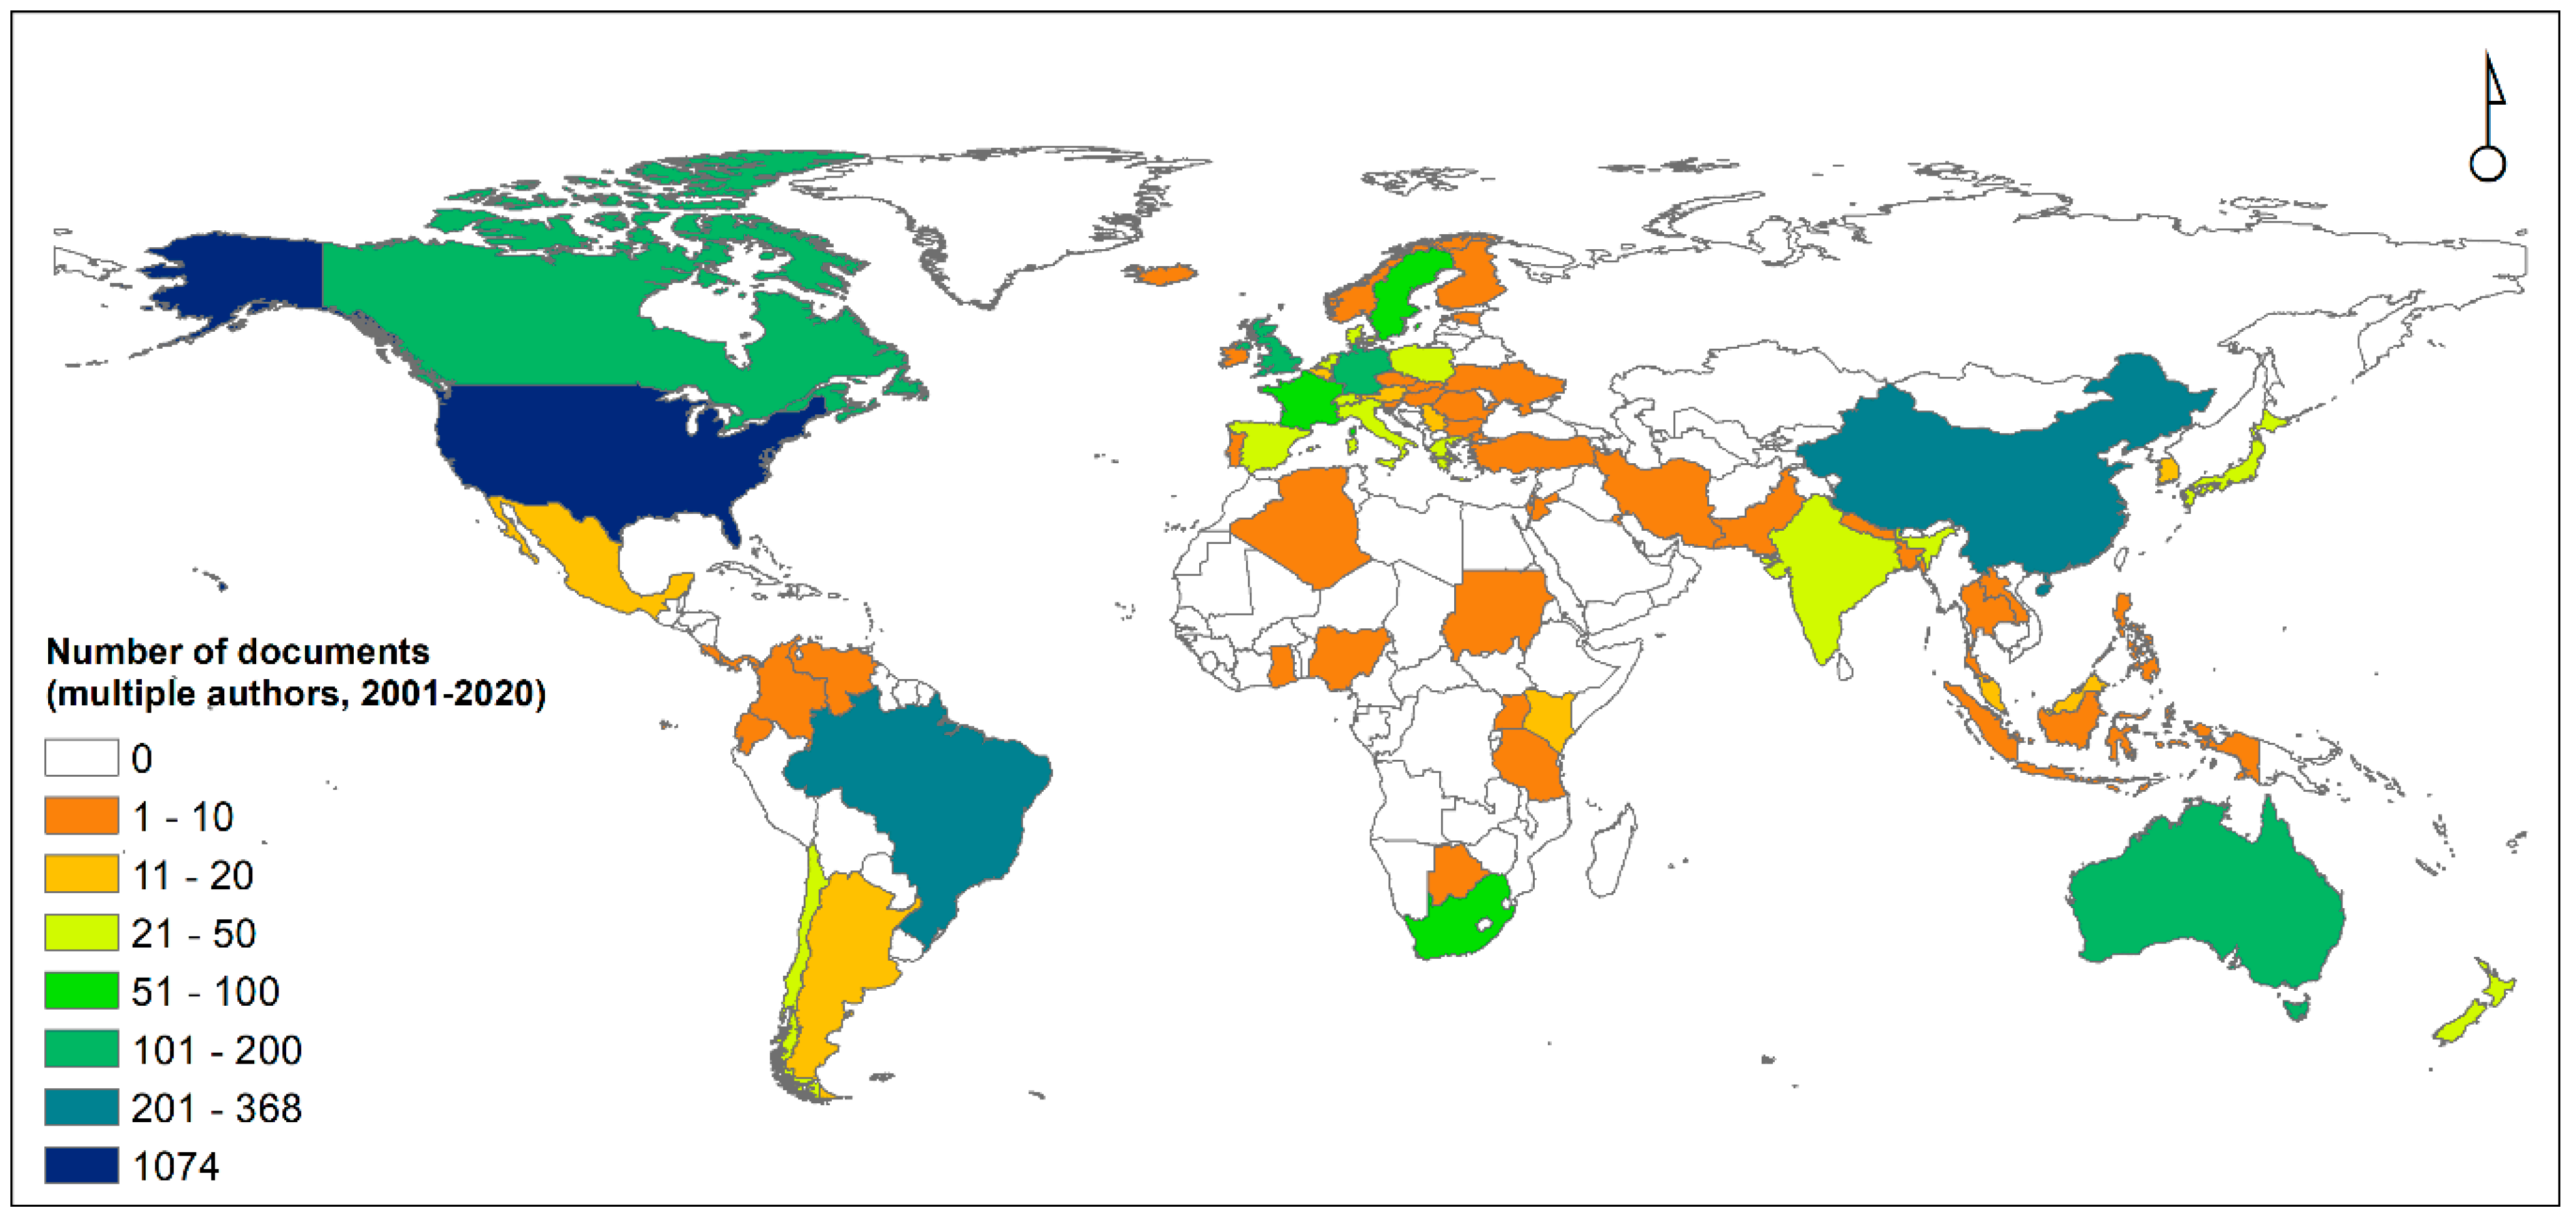
In terms of scientific production, we found 68 countries involved in RZs publications using co-authored counting. The US produced the highest number of documents (1074), followed by China (368), Brazil (209), Canada (176), Australia (173), Germany (123), the UK (101), and France (90). Several countries from Africa, South America, and Asia had no publications (Figure 3).
We also found that, based on leading authors affiliation, 51 countries published in the topic during the period analyzed. The majority (30) published between 1 and 5 documents. Of these countries, only 15 had more than 10 publications, of which North America (US and Canada) accounted for 357 publications, Asia (China and Japan) for 100, Europe (Germany, UK, France, Sweden, Greece, Italy, The Netherlands, and Spain) for 150. We found only 1 Latin American (Brazil, 50) and 1 African country (i.e., South Africa, 23) with more than 10 publications.
The US had the highest number of citations, with 9919 total citations and an average of 32.95 citations per article. This country outnumbered any other country in terms of citation number, since the second and third countries had less than 2000 (Canada: 1936; Australia: 1914). However, Canada, Australia, and the UK held more average citations per document (34.57, 34.18, and 37.36, respectively) than the US (Table S3). The leading country in terms of average citations per document was Hungary (67).
Overall, 929 institutions published on the subject. The corresponding author’s affiliation was more commonly associated with the Chinese Academy of Sciences (including University of Chinese Academy of Sciences, 51), Oregon State University (32 articles), Hohai University (28), Colorado State University (23), and the Swedish University of Agricultural Sciences (23) (Table 2).
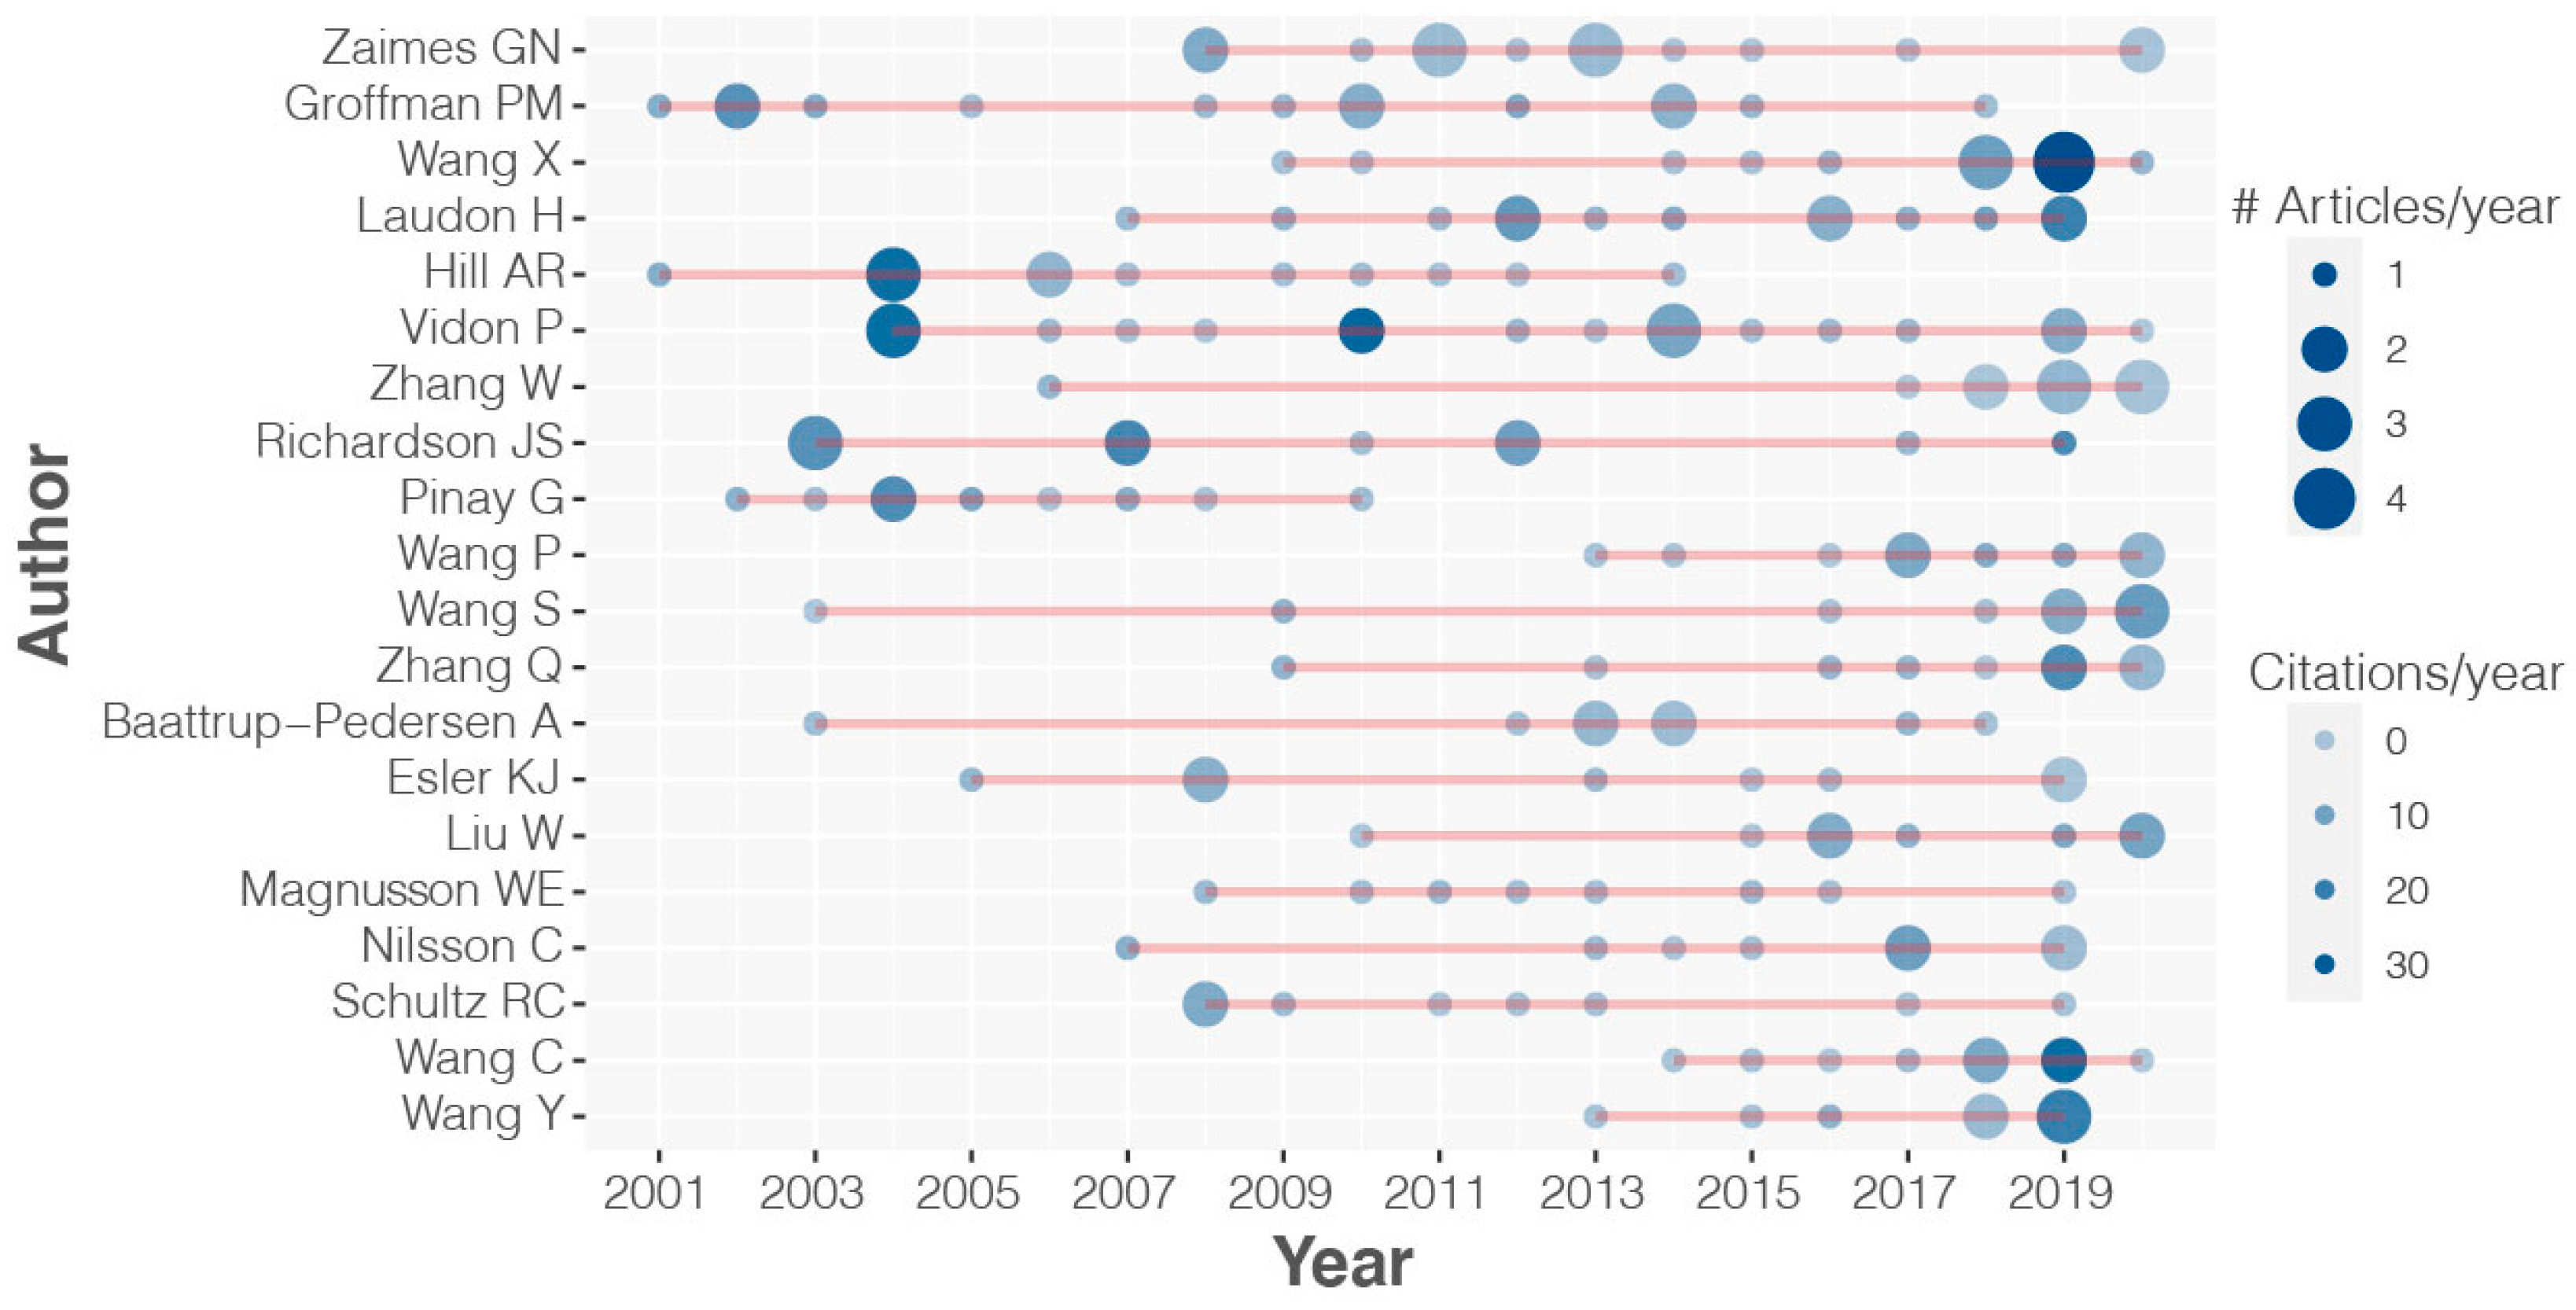
A total of 2968 authors participated in research related to RZs. Most corresponding authors were affiliated with US institutions (301), with China (87), Australia (56), Canada (56) and Brazil (50) among the top 5 countries. These countries accounted for a total of 50% of the affiliations, and the US alone accounted for 27.4%. The top 3 most productive authors were G. Zaimes (University of Arizona, 15 documents), P. Groffman (City University of New York, 14), and X. Wang (Hohai University, 14) (Figure 4). Interestingly, these authors do not correspond to the authors in the top 10 most cited documents (Table 1).
When exploring the collaborative networks, it is evident that most countries published with other institutions of their same country. For instance, of the 301 documents published by leading authors in the US, 272 were collaborations within the country and 29 with others (9.6%). A different number applies for China, which had 65 documents with collaboration inside the country and 22 (30%) in collaboration with other nations.
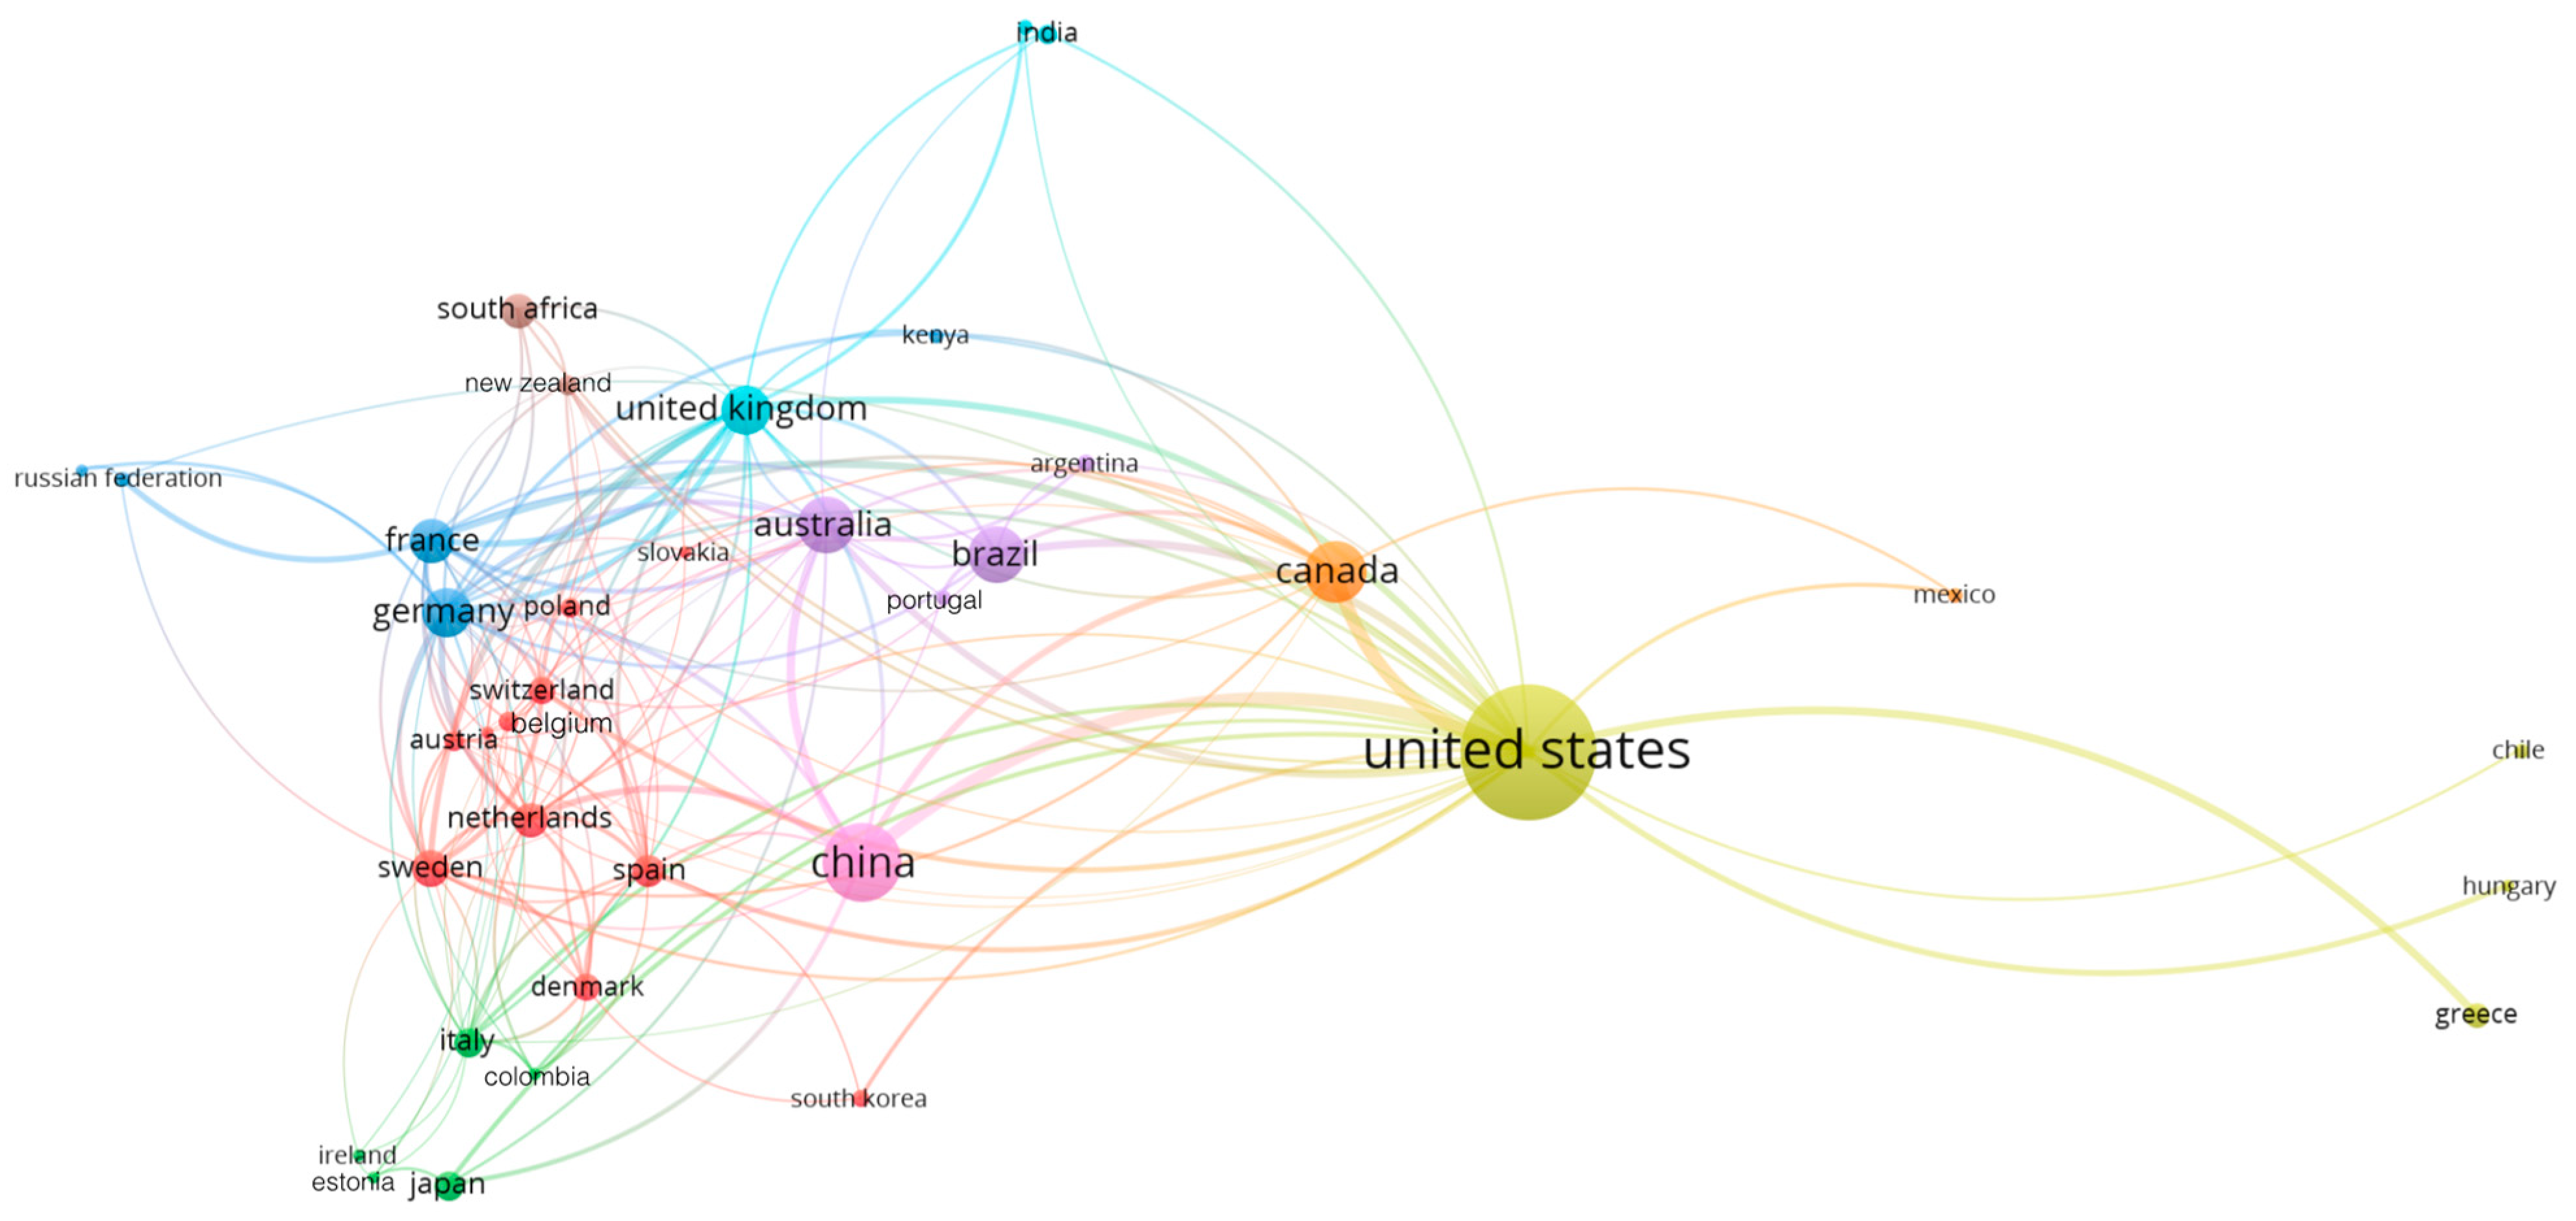
The US appears highly connected to Canada and China, with weaker connections to the rest of the network (Figure 5). The total link strength between the US and Canada was 21.1%, while the total link strength between the US and China was 19.1%. China’s network was mostly linked to the US (accounting for 40.2% of the total link strength) and Australia’s was strongly connected to China, the US, and Germany (55% of the total link strength). Our network analysis identified eight different nation clusters highlighting stronger international collaborations: Countries surrounding the US (the yellow cluster), China (pink), Canada (orange), Australia/Brazil (purple), Germany (blue), the UK (turquoise), Italy (green), Sweden, and several Western European countries (red).
We found seven clusters of collaborative institutions (a threshold of five for “minimum total link strength of an item” was applied), with the highest link strength corresponding to the University of Chinese Academy of Sciences, the Swedish University of Agriculture, and Oregon State University (Figure S1). The total link strength of The University of Chinese Academy of Sciences was 126 (3 links), where the Chinese Academy accounted for 64.3%, and the Institute of Mountain Hazards (China) accounted for 28.6%. The Swedish University of Agriculture had a 49 total link strength (7 links), of which the Umea and Uppsala universities accounted for 51% and 32.7%, respectively. Total link strength of Oregon State University was 26 (9 links), of which Montana State University accounted for most of it (34.62%).
Based on our analyses (Figure 5 and Figure S1), most of the knowledge is produced in few, principally first-world countries and institutions. As other authors have reported, there is an urgent need to understand riparian ecosystem functioning in an integrative way [13,40,67]. We therefore believe that, to fulfill this understanding, stronger collaborative networks need to be developed, including countries and institutions from different regions covering a wider geographical range, given that most collaborations occurred within a single country, such as in the US, where 90.4% of the collaborations occurred within the country (see above).
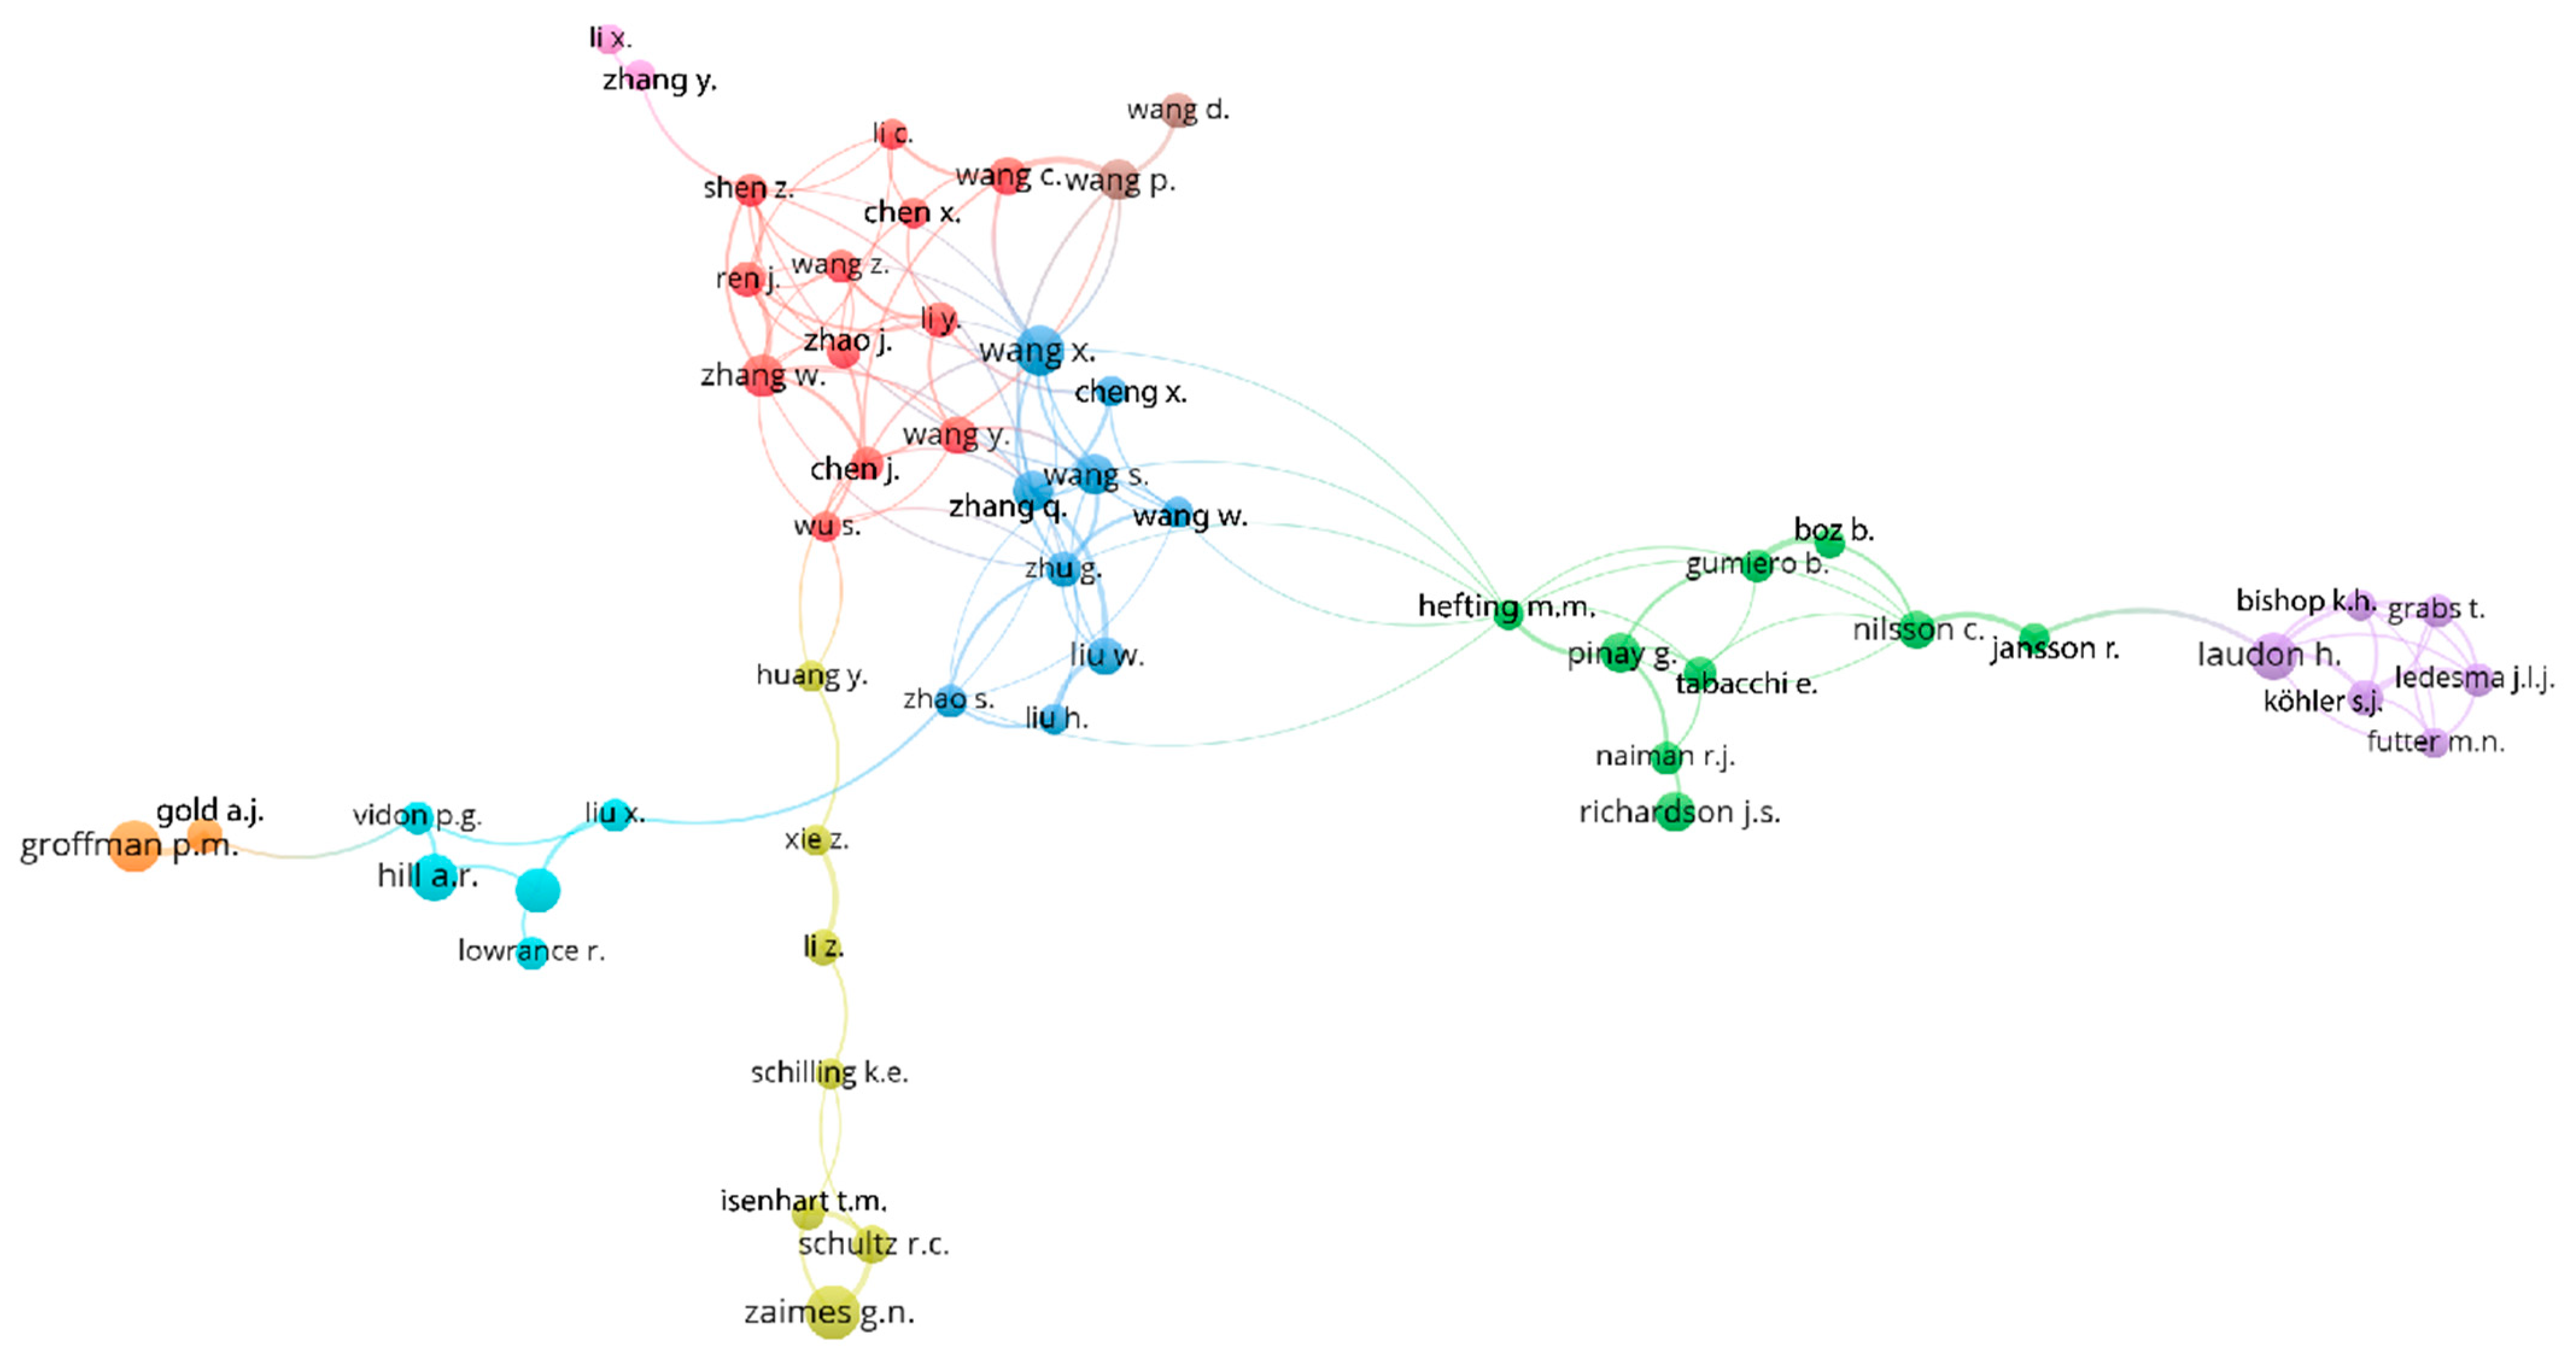
Similarly, by applying a threshold of five documents, nine different clusters of co-authors were identified in Scopus®. Six of these clusters are composed by more than five co-authors, and only three clusters were composed of two to three authors (Figure 6). The denser collaboration networks correspond to Chinese authors.
3.3. Top Topics
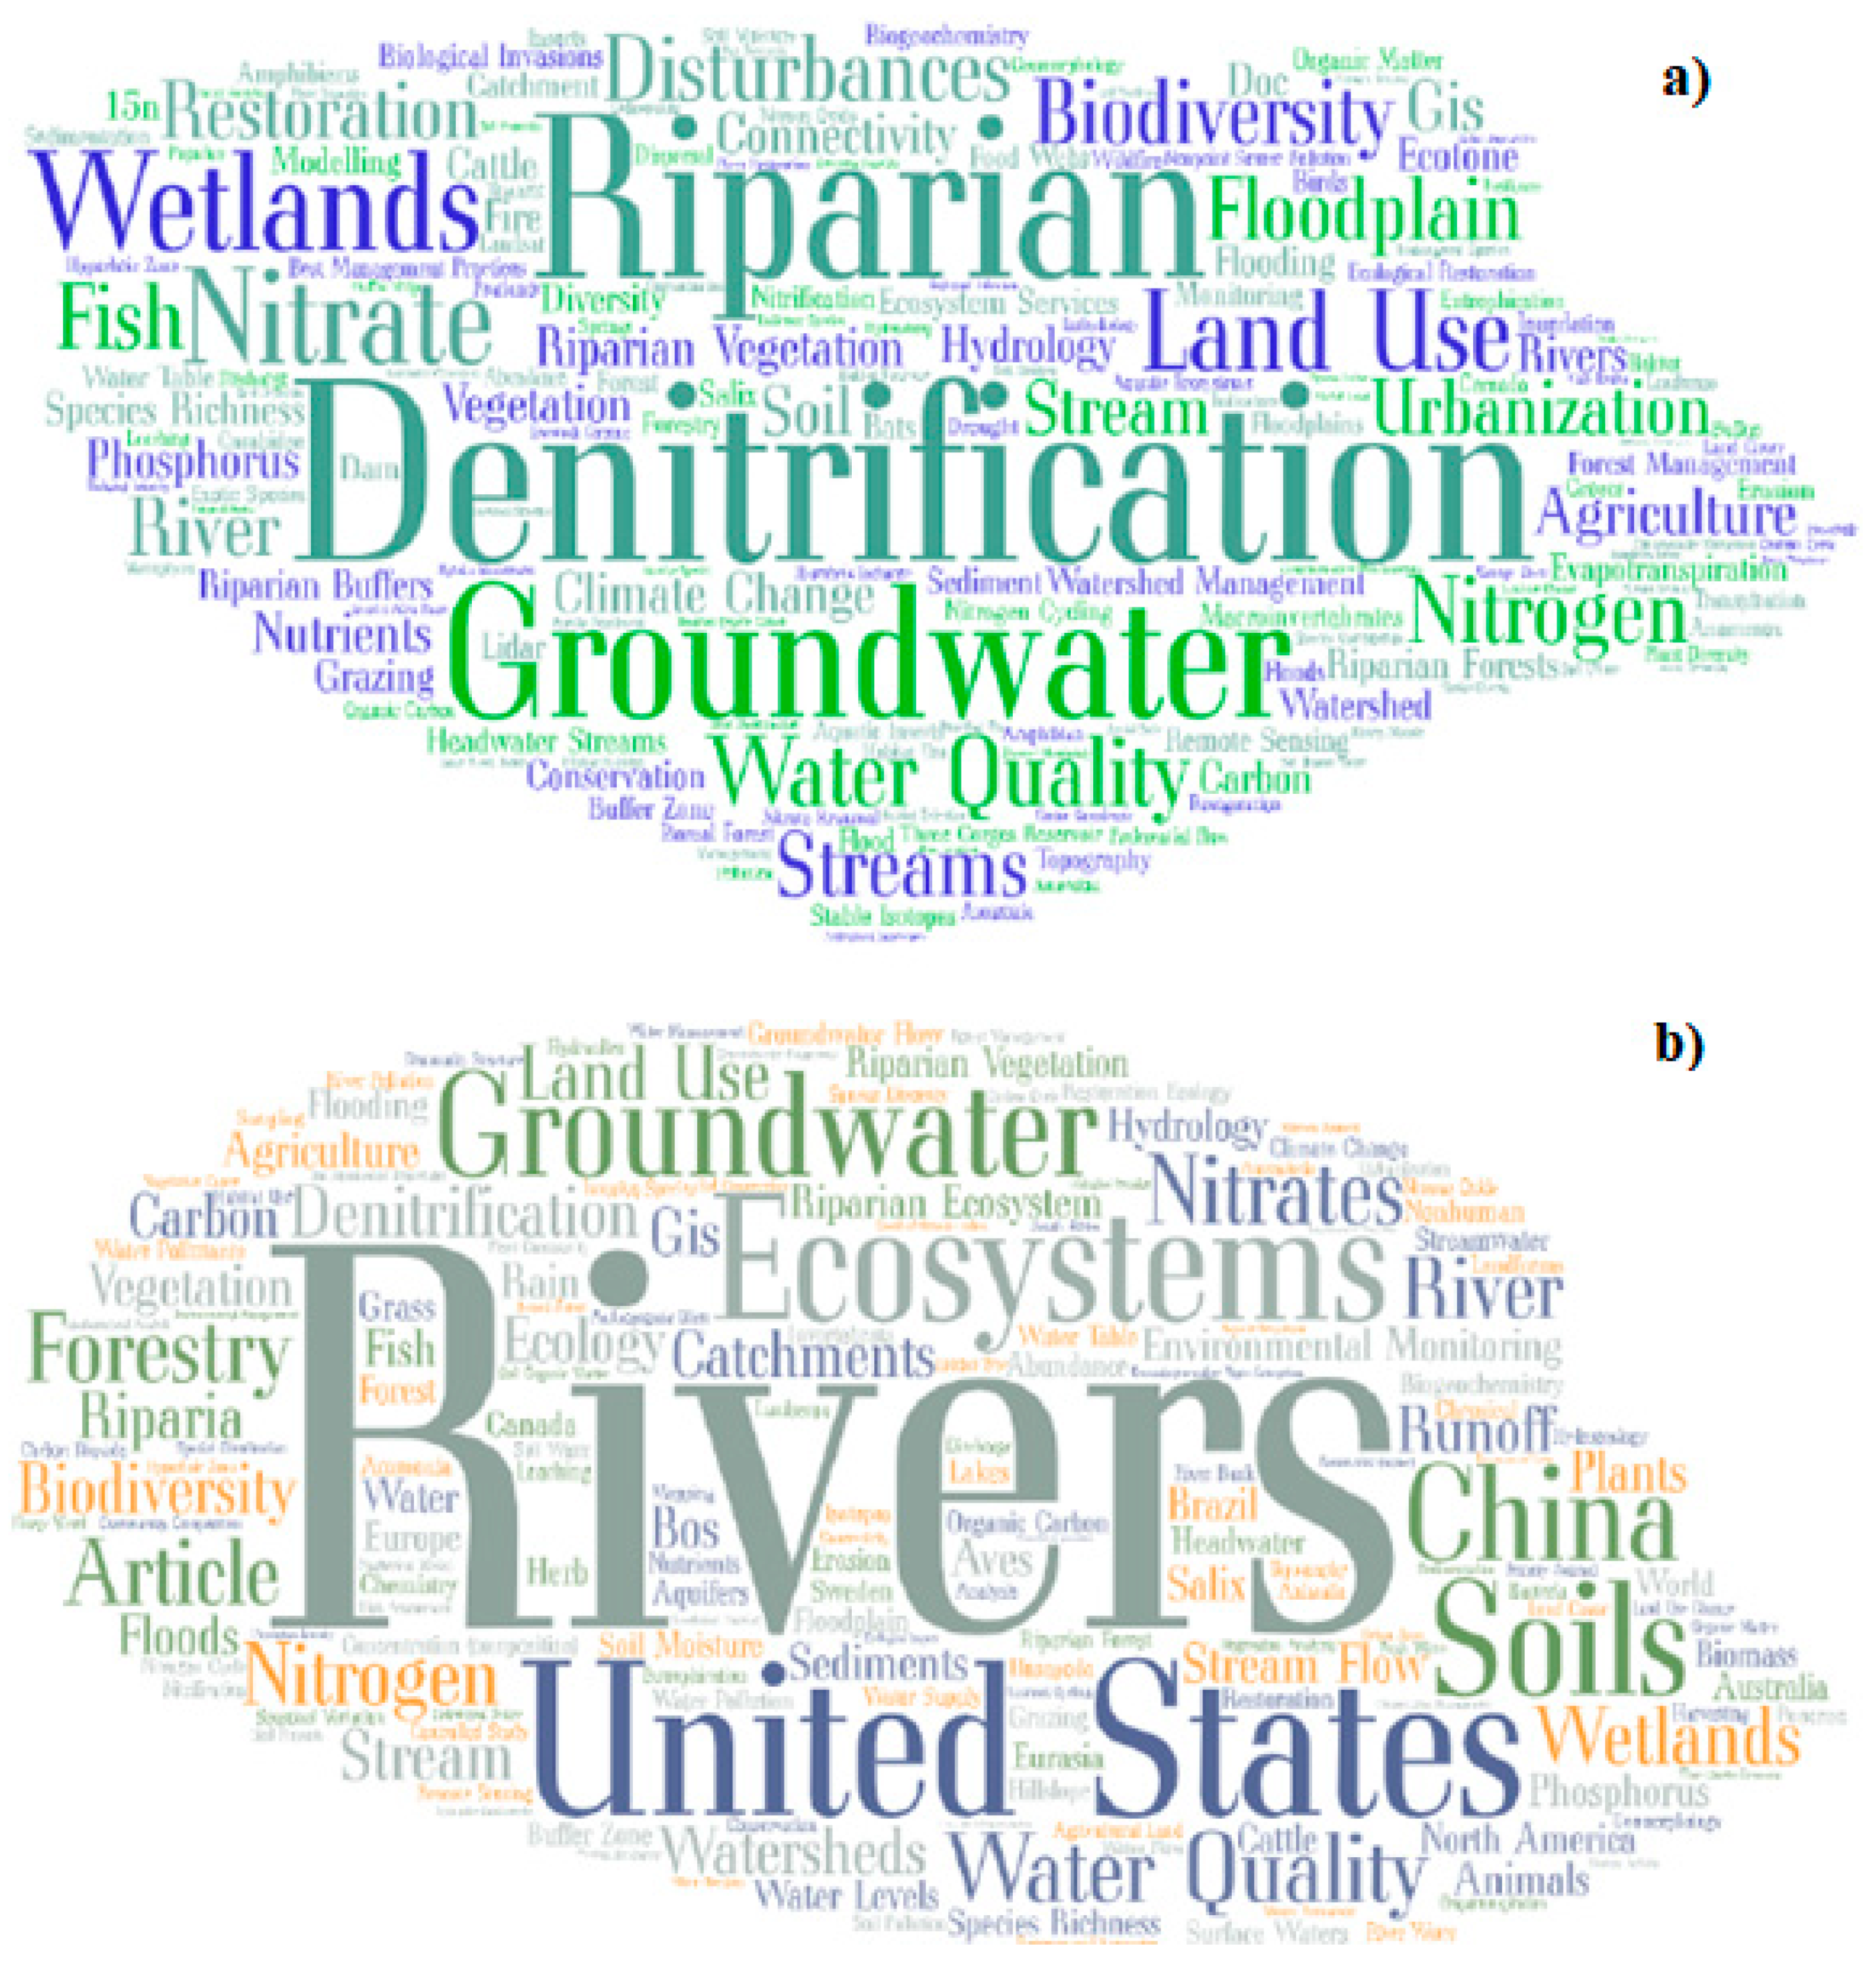
Publication keywords can provide useful indications of author research subjects and interests in the wide field of RZs, thus providing indication of the most studied topics. According to the authors’ keywords, the top 5 topics, in terms of total occurrences (in parenthesis) and excluding riparian zone(s) (528) and riparian area(s) (118), were denitrification (59), groundwater (41), water quality (40), nitrate (35), and nitrogen (30), highlighting as upmost general topics the study of riparian zones’ water quality and composition (Figure 7a). With the same criteria, the top KeyWords Plus® terms were rivers (236), United States (234), ecosystem(s) (225), groundwater (217), and water quality (210) (Figure 7b). The latter correspond to the most frequently occurring words in the titles of an article’s cited references.
“Groundwater” and “water quality” were top keywords in both authors’ keywords and KeyWords Plus®, showing the significant relationship of riparian zones with water provision and quality. Also, other top topics reflected in the results (i.e., denitrification, nitrate, and nitrogen) are related with water quality, highlighting the significance of riparian systems for the fundamental service of water provision. Water quality regulation by filtration of pollutants and sediments [25,26] and flow regulation and erosion control [31,32] have been reported as important processes modulated by riparian zones. Additionally, according to the scientific literature on riparian biogeochemistry and contaminants abatement, riparian zones are efficient at reducing emerging contaminants in subsurface flow [37]. These services have been related especially to riparian vegetation [13,30]. According to Vidon et al. (2019) [37], most of riparian research in the period 1997–2007 has focused on the benefits of RZs in terms of water quality, NO3− contaminants, and sediments, among others. With respect to our authors’ keywords analysis, we found an agreement in topics such as water quality and denitrification (as well as nitrogen and nitrate) (Figure 7a). However, other topics such as groundwater, wetlands, streams, and biodiversity were not reflected in the study by Vidon et al. (2019) [37], a result likely dependent on differences in the specific query structure and on topics’ evolution.
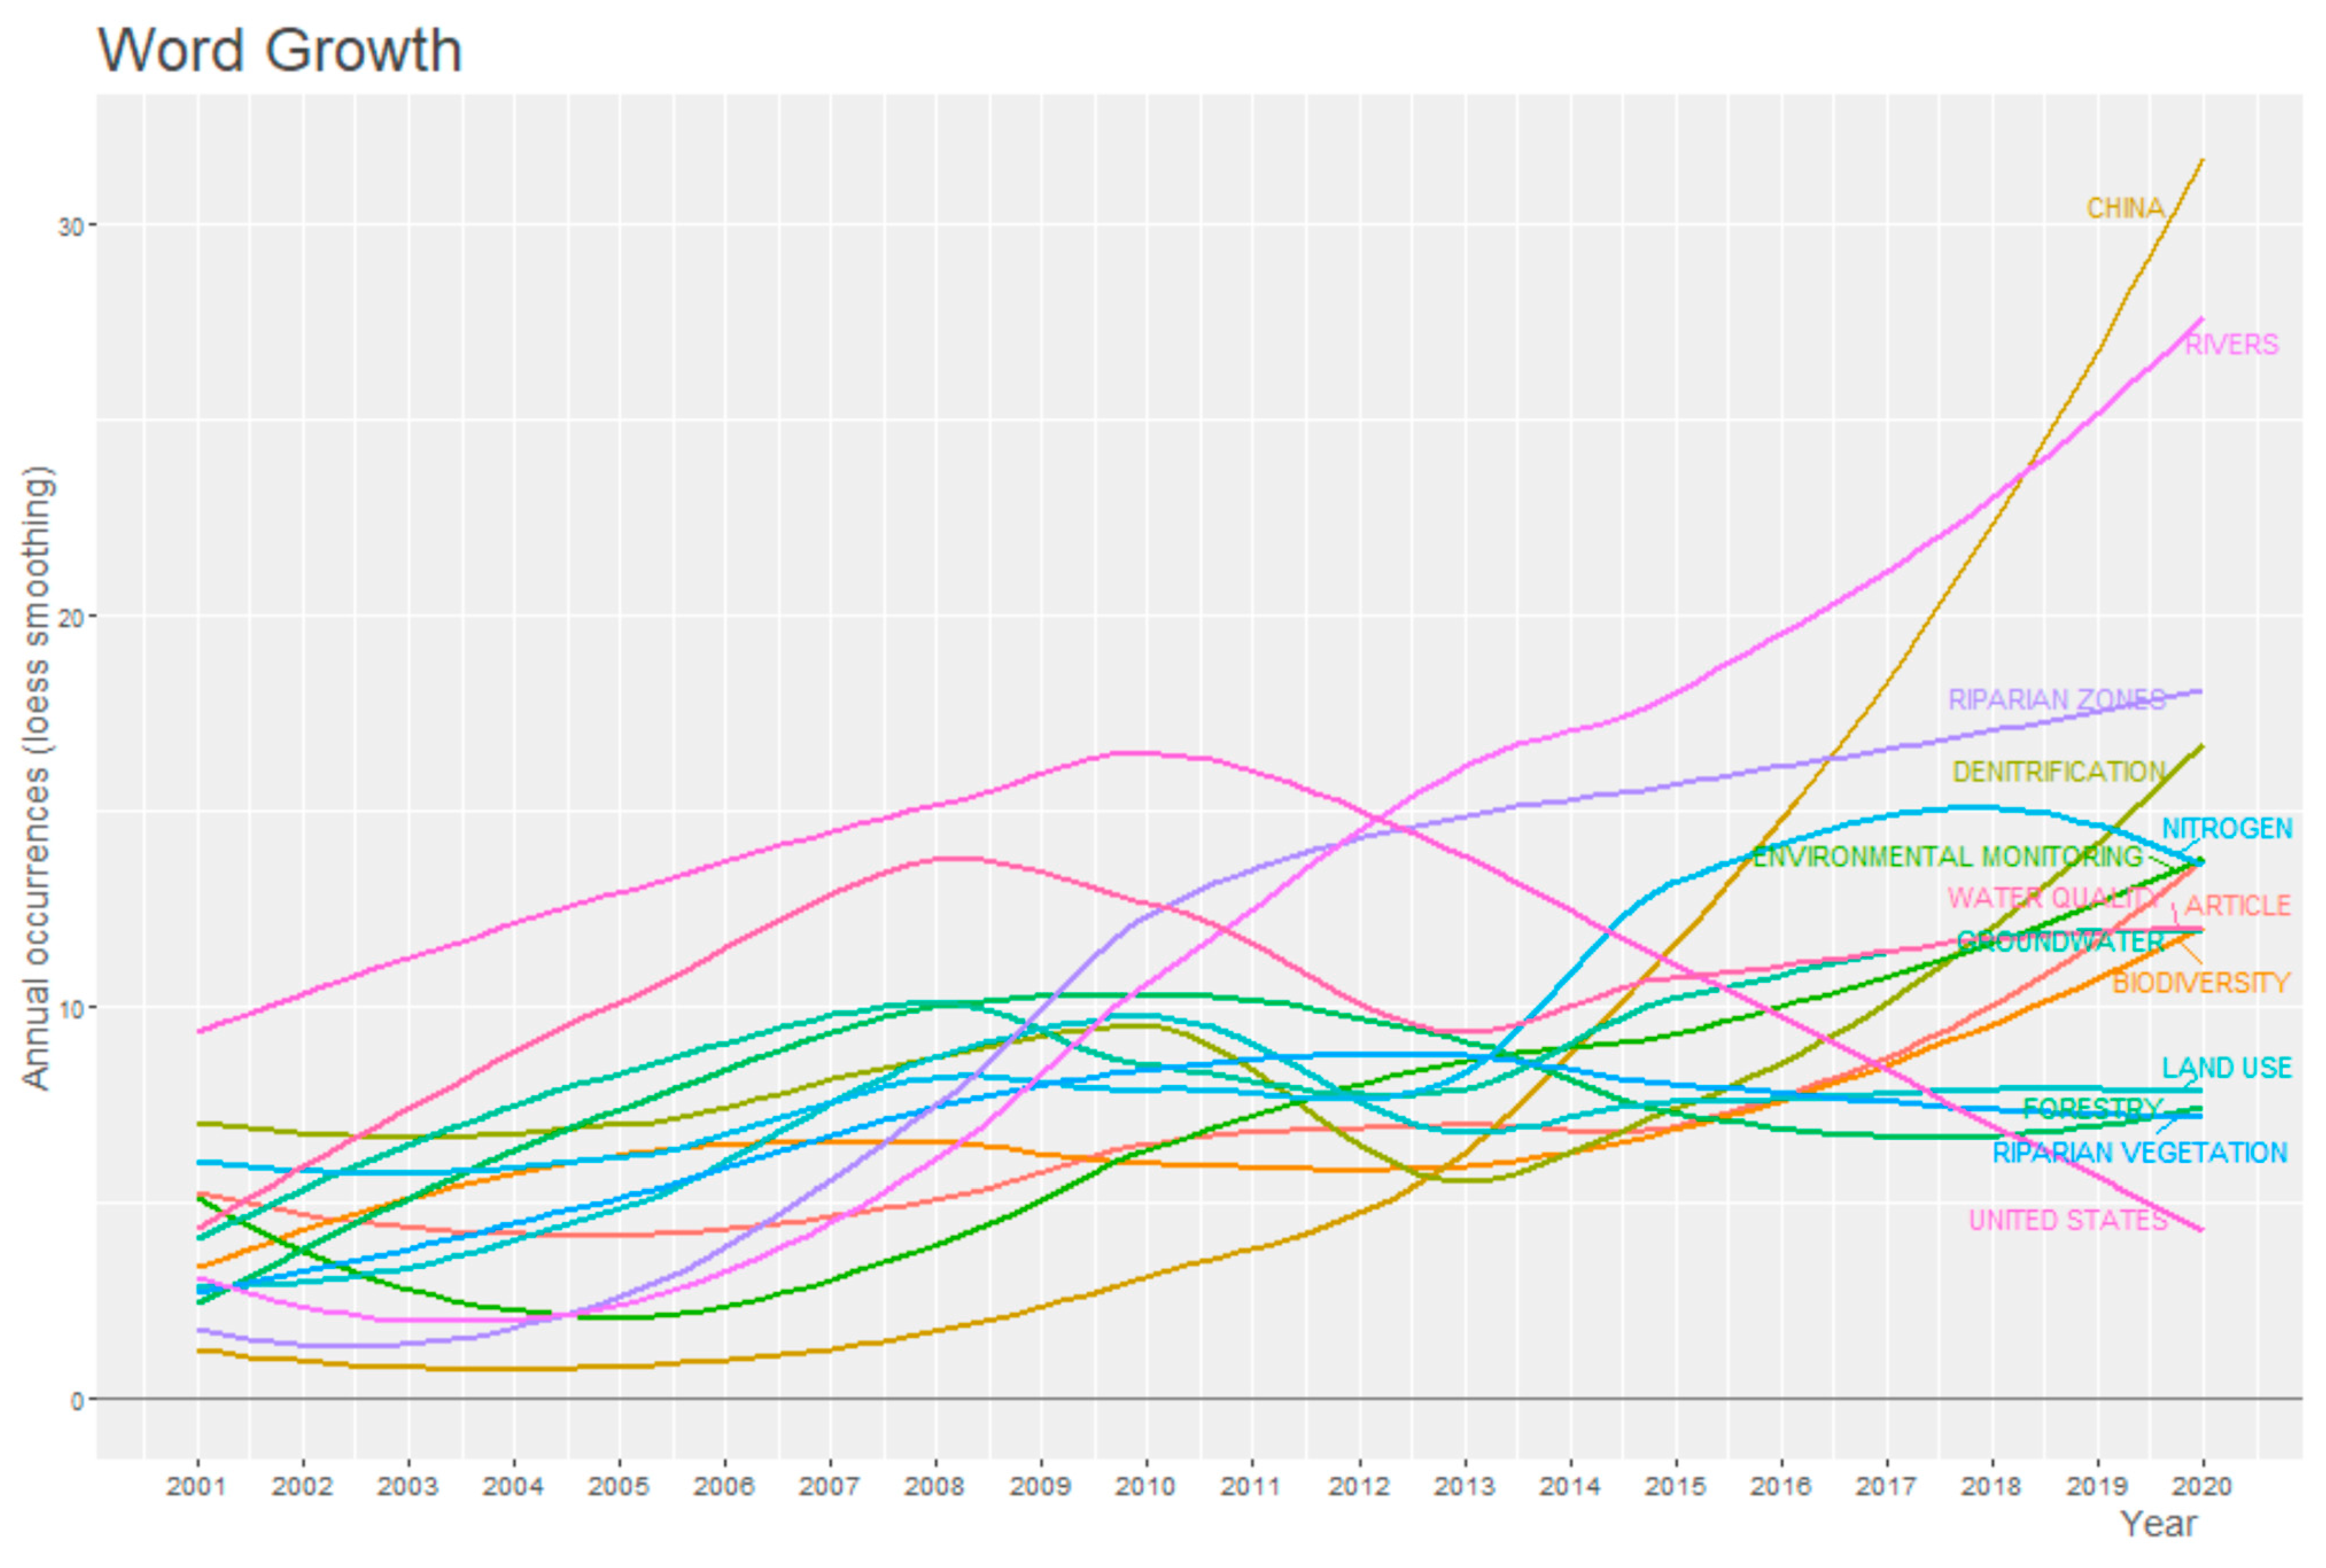
When analyzing temporal trends in author keywords, common words such as nitrate, nitrogen, denitrification, water quality, and groundwater remained approximately stable through the study period (Table S4). On the contrary, in KeyWords Plus®, the usage of the word “China” increased from 0 instances in 2001 to 35 in 2020, reflecting a clear expansion of RZs research effort in the country (Figure 8; Table S4). “United States” has been mentioned 12 times on average, although, in 2020, it reached its minimum (3 mentions) in an evident descending trend. Other words, such as “rivers”, also increased in the same period from 4 to 29. The presence of “river” in the top keywords likely indicates a strong and growing focus on lotic ecosystems, showing, in relative terms, a minor research effort in riparian zones associated to lentic systems. Increasing trends are also shown for “denitrification” and “biodiversity” (Figure 8).
3.4. Study Limitations
The bibliographic search strategy adopted in this study is not fully comprehensive with respect to the entire scientific production on RZs for 2001–2020. Several factors should be considered:
(i) Limitations derived from the choice of the English language. Although English is the major language used in science, a considerable amount of scientific works are produced in emerging languages such as Chinese and Spanish.
(ii) We focused on the terms riparian zones/areas to broaden our research to their general meaning. However, other queries using semantic variants or synonymic expressions, e.g., ‘riparian ecotones’ or ‘stream water-land interfaces’, or even related to specific ecosystems (e.g., riparian forests), would provide additional documents to the analysis.
(iii) Finally, our query was based on the principal collections of possibly the most comprehensive service for gathering bibliometric data of published material (Scopus®). Nevertheless, the use of other data sources, such as Google Scholar, can provide further valuable information, especially on relevant grey literature.
4. Conclusions
In this study, we presented a bibliometric-based analysis to unveil the knowledge structure and development of research on riparian zones for the period 2001–2020. Report tendencies indicate that RZs are a global growing subject of research interest, especially in the freshwater ecology and water quality areas. The rise of the ecosystem services concept could have contributed to increase the research in RZs due to the high number and importance of benefits provided by these environments to society. Although riparian research has been historically dominated by the US, a growing body of research is increasingly coming from China, showing a dense cluster of collaborative institutions.
Notably, our results show that few studies are produced in low-middle income countries, which suggests a need to funnel international funding to research riparian environments in these geographical contexts. This appears especially evident for RZs in the tropics, a region with rapid land transformation where urgent decision-making processes can particularly benefit from such scientific knowledge. Also, we observed a strong focus on lotic riparian zones studies, which could indicate a need for further research of lentic riparian systems.
Finally, despite the described limitations of the study, our results present valuable information about most productive authors, institutions, countries, publications, and topics associated to RZs studies globally for the first 20 years of the XXI century, showing strengths and knowledge gaps of this growing research topic.
Supplementary Materials
The following are available online at https://www.mdpi.com/article/10.3390/w13131836/s1, Figure S1: Co-authorship network between top institutions, Table S1: Detailed query performed in Scopus® and WoS, Table S2: Set of bibliometric indicators used in the analyses, Table S3: Citations per country (top 20), Table S4: Yearly occurrence of top keywords, Dataset S1: Bibliographic records as queried from Scopus® (primary data).
Author Contributions
Conceptualization, S.P., N.C. and A.S.; methodology, N.C., S.P. and J.D.Z.G.; software, S.P. and J.D.Z.G.; formal analysis, S.P. and J.D.Z.G.; investigation, S.P., N.C. and A.S.; data curation, S.P., N.C. and A.S.; writing—original draft preparation, N.C., S.P. and A.S.; writing—review and editing, N.C., S.P., J.D.Z.G. and A.S. All authors have read and agreed to the published version of the manuscript.
Funding
This research was funded by Dirección de Investigación y Innovación of Universidad del Rosario.
Institutional Review Board Statement
Not applicable.
Informed Consent Statement
Not applicable.
Data Availability Statement
Primary data in BibTeX format were derived from the bibliographic service Scopus®, and provided in Dataset S1 in Supplementary Materials.
Acknowledgments
We acknowledge the Centro de Recursos para el Aprendizaje y la Investigación (CRAI) of Universidad del Rosario for providing access to the bibliometric databases.
Conflicts of Interest
The authors declare no conflict of interest. The funders had no role in the design of the study; in the collection, analyses, or interpretation of data; in the writing of the manuscript, or in the decision to publish the results.
References
- Camporeale, C.; Perucca, E.; Ridolfi, L.; Gurnell, A.M. Modeling the interactions between river morphodynamics and riparian vegetation. Rev. Geophys. 2013, 51, 379–414. [Google Scholar] [CrossRef] [Green Version]
- Naiman, R.; Decamps, H.; McClain, M. Riparia. Riparia—Ecology, Conservation and Management of Streamside Communities; Elsevier Academic Press: London, UK, 2005; p. 448. [Google Scholar]
- Naiman, R.; Decamps, H. The ecology of interfaces: Riparian Zones. Annu. Rev. Ecol. Syst. 1997, 28, 621–658. [Google Scholar] [CrossRef] [Green Version]
- Gregory, S.V.; Swanson, F.J.; McKee, W.A.; Cummins, K.W. An ecosystem perspective on riparian zones focus on links between land and water. Bioscience 1991, 41, 540–551. [Google Scholar] [CrossRef]
- National Research Council—NRC. Riparian Areas. Functions and Strategies for Management; The National Academies Press: Washington, DC, USA, 2002. [Google Scholar]
- Gurnell, A. Plants as river system engineers. Earth Surf. Process. Landforms 2014, 39, 4–25. [Google Scholar] [CrossRef]
- Bertoldi, W.; Drake, N.A.; Gurnell, A.M. Interactions between river flows and colonizing vegetation on a braided river: Exploring spatial and temporal dynamics in riparian vegetation cover using satellite data. Earth Surf. Process. Landforms 2011, 36, 1474–1486. [Google Scholar] [CrossRef]
- Bertoldi, W.; Gurnell, A.M.; Drake, N.A. The topographic signature of vegetation development along a braided river: Results of a combined analysis of airborne lidar, color air photographs, and ground measurements. Water Resour. Res. 2011, 47, 06525. [Google Scholar] [CrossRef]
- Tabacchi, E.T.; Correll, D.L.C.; Hauer, R.H.; Pinay, G.P.; Planty-Tabacchi, A.-M.P.; Wissmar, R.C.W. Development, maintenance and role of riparian vegetation in the river landscape. Freshw. Biol. 1998, 40, 497–516. [Google Scholar] [CrossRef]
- Merritt, D.M.; Scott, M.L.; Poff, N.L.; Auble, G.T.; Lytle, D.A. Theory, methods and tools for determining environmental flows for riparian vegetation: Riparian vegetation-flow response guilds. Freshw. Biol. 2010, 55, 206–225. [Google Scholar] [CrossRef]
- Lytle, D.A.; Poff, N. Adaptation to natural flow regimes. Trends Ecol. Evol. 2004, 19, 94–100. [Google Scholar] [CrossRef]
- Dufour, S.; Rinaldi, M.; Piégay, H.; Michalon, A. How do river dynamics and human influences affect the landscape pattern of fluvial corridors? Lessons from the Magra River, Central–Northern Italy. Landsc. Urban Plan. 2015, 134, 107–118. [Google Scholar] [CrossRef]
- Dufour, S.; Rodríguez-González, P.M.; Laslier, M. Tracing the scientific trajectory of riparian vegetation studies: Main topics, approaches and needs in a globally changing world. Sci. Total. Environ. 2019, 653, 1168–1185. [Google Scholar] [CrossRef]
- Fischer, R.A.; Martin, C.O.; Ratti, J.T.; Guidice, J. Riparian Terminology: Confusion and Clarification. Available online: https://www.spa.usace.army.mil/Portals/16/docs/civilworks/regulatory/Stream%20Information%20and%20Management/ERDC%20Riparian%20Terminology.pdf (accessed on 10 September 2020).
- Ivits, E.; Cherlet, M.; Mehl, W.; Sommer, S. Estimating the ecological status and change of riparian zones in Andalusia assessed by multi-temporal AVHHR datasets. Ecol. Indic. 2009, 9, 422–431. [Google Scholar] [CrossRef]
- Weissteiner, C.J.; Ickerott, M.; Ott, H.; Probeck, M.; Ramminger, G.; Clerici, N.; Dufourmont, H.; De Sousa, A.M.R. Europe’s green arteries—a continental dataset of riparian zones. Remote. Sens. 2016, 8, 925. [Google Scholar] [CrossRef] [Green Version]
- Akasheh, O.; Neale, C.; Jayanthi, H. Detailed mapping of riparian vegetation in the middle Rio Grande River using high resolution multi-spectral airborne remote sensing. J. Arid. Environ. 2008, 72, 1734–1744. [Google Scholar] [CrossRef]
- Collins, J.N.; Sutula, M.; Stein, E.; Odaya, M.; Zhang, E.; Larned, K. Comparison of Methods to Map California Riparian Areas. Available online: https://www.sfei.org/sites/default/files/biblio_files/No522_WL_RHJVReportFINAL.pdf (accessed on 10 September 2020).
- Clerici, N.; Weissteiner, C.J.; Paracchini, M.L.; Boschetti, L.; Baraldi, A.; Strobl, P. Pan-European distribution modelling of stream riparian zones based on multi-source Earth Observation data. Ecol. Indic. 2013, 24, 211–223. [Google Scholar] [CrossRef]
- Clerici, N.; Weisstener, C.; Paracchini, M.-L.; Strobl, P. Riparian Zones: Where Green and Blue Networks Meet. Pan-European Zonation Modelling Based on Remote Sensing and GIS; EU Science Hub–European Commission: Brussels, Belgium, 2011. [Google Scholar]
- Haines-Young, R.; Potschin, M.B. Common International Classification of Ecosystem Services (CICES) V5 1 and Guidance on the Application of the Revised Structure. Available online: https://cices.eu/content/uploads/sites/8/2018/01/Guidance-V51-01012018.pdf (accessed on 15 June 2020).
- Richardson, J.S.; Béraud, S. Effects of riparian forest harvest on streams: A meta-analysis. J. Appl. Ecol. 2014, 51, 1712–1721. [Google Scholar] [CrossRef]
- Brix, H.; Ye, S.; Laws, E.A.; Sun, D.; Li, G.; Ding, X.; Yuan, H.; Zhao, G.; Wang, J.; Pei, S. Large-scale management of common reed, Phragmites australis, for paper production: A case study from the Liaohe Delta, China. Ecol. Eng. 2014, 73, 760–769. [Google Scholar] [CrossRef]
- Patzak, J.; Nesvadba, V.; Krofta, K.; Henychova, A.; Marzoev, A.I.; Richards, K. Evaluation of genetic variability of wild hops (Humulus lupulus L.) in Canada and the Caucasus region by chemical and molecular methods. Genome 2010, 53, 545–557. [Google Scholar] [CrossRef]
- Aguiar, T.R.; Bortolozo, F.R.; Hansel, F.A.; Rasera, K.; Ferreira, M.T.; Junior, T.A. Riparian buffer zones as pesticide filters of no-till crops. Environ. Sci. Pollut. Res. 2015, 22, 10618–10626. [Google Scholar] [CrossRef] [PubMed]
- Dosskey, M.G.; Vidon, P.; Gurwick, N.P.; Allan, C.J.; Duval, T.P.; Lowrance, R. The role of riparian vegetation in protecting and improving chemical water quality in Streams1. JAWRA J. Am. Water Resour. Assoc. 2010, 46, 261–277. [Google Scholar] [CrossRef]
- Dybala, K.E.; Matzek, V.; Gardali, T.; Seavy, N.E. Carbon sequestration in riparian forests: A global synthesis and meta-analysis. Glob. Chang. Biol. 2019, 25, 57–67. [Google Scholar] [CrossRef] [PubMed] [Green Version]
- Moore, R.D.; Spittlehouse, D.L.; Story, A. Riparian microclimate and stream temperature response to forest harvesting: A review. JAWRA J. Am. Water Resour. Assoc. 2005, 41, 813–834. [Google Scholar] [CrossRef]
- Williams, N.M. Restoration of nontarget species: Bee communities and pollination function in riparian forests. Restor. Ecol. 2010, 19, 450–459. [Google Scholar] [CrossRef]
- Riis, T.; Kelly-Quinn, M.; Aguiar, F.C.; Manolaki, P.; Bruno, D.; Bejarano, M.D.; Clerici, N.; Fernandes, M.R.; Franco, J.C.; Pettit, N.; et al. Global overview of ecosystem services provided by riparian vegetation. BioScience 2020, 70, 501–514. [Google Scholar] [CrossRef]
- Feld, C.K.; Fernandes, M.R.; Ferreira, M.T.; Hering, D.; Ormerod, S.J.; Venohr, M.; Canovas, C.G. Evaluating riparian solutions to multiple stressor problems in river ecosystems—A conceptual study. Water Res. 2018, 139, 381–394. [Google Scholar] [CrossRef] [PubMed]
- Merritt, D.M.; Cooper, D.J. Riparian vegetation and channel change in response to river regulation: A comparative study of regulated and unregulated streams in the Green River Basin, USA. Regul. Rivers Res. Manag. 2000, 16, 543–564. [Google Scholar] [CrossRef]
- Vollmer, D.; Prescott, M.F.; Padawangi, R.; Girot, C.; Grêt-Regamey, A. Understanding the value of urban riparian corridors: Considerations in planning for cultural services along an Indonesian river. Landsc. Urban Plan. 2015, 138, 144–154. [Google Scholar] [CrossRef]
- Brown, T.C.; Daniel, T.C. Landscape aesthetics of riparian environments: Relationship of flow quantity to scenic quality along a wild and scenic river. Water Resour. Res. 1991, 27, 1787–1795. [Google Scholar] [CrossRef]
- Stella, J.C.; Rodríguez-González, P.M.; Dufour, S.; Bendix, J. Riparian vegetation research in Mediterranean-climate regions: Common patterns, ecological processes, and considerations for management. Hydrobiologia 2013, 719, 291–315. [Google Scholar] [CrossRef]
- Capon, S.; Chambers, L.E.; Mac Nally, R.; Naiman, R.J.; Davies, P.; Marshall, N.; Pittock, J.; Reid, M.; Capon, T.; Douglas, M.; et al. Riparian ecosystems in the 21st Century: Hotspots for climate change adaptation? Ecosystem 2013, 16, 359–381. [Google Scholar] [CrossRef]
- Vidon, P.G.; Welsh, M.K.; Hassanzadeh, Y.T. Twenty years of riparian zone research (1997–2017): Where to next? J. Environ. Qual. 2019, 48, 248–260. [Google Scholar] [CrossRef] [PubMed]
- Lind, L.; Hasselquist, E.M.; Laudon, H. Towards ecologically functional riparian zones: A meta-analysis to develop guidelines for protecting ecosystem functions and biodiversity in agricultural landscapes. J. Environ. Manag. 2019, 249, 109391. [Google Scholar] [CrossRef]
- Ramey, T.L.; Richardson, J.S. Terrestrial Invertebrates in the Riparian Zone: Mechanisms Underlying Their Unique Diversity. BioScience 2017, 67, 808–819. [Google Scholar] [CrossRef] [Green Version]
- Rood, S.B.; Scott, M.L.; Dixon, M.; González, E.; Marks, C.O.; Shafroth, P.B.; Volke, M.A. Ecological interfaces between land and flowing water: Themes and trends in riparian research and management. Wetlands 2020, 40, 1801–1811. [Google Scholar] [CrossRef]
- Pritchard, A. Statistical Bibliography or Bibliometrics? J. Doc. 1969, 25, 348–349. [Google Scholar]
- Rousseau, R. Forgotten founder of bibliometrics. Nat. Cell Biol. 2014, 510, 218. [Google Scholar] [CrossRef] [PubMed]
- Wang, M.-H.; Li, J.; Ho, Y.-S. Research articles published in water resources journals: A bibliometric analysis. Desalination Water Treat. 2011, 28, 353–365. [Google Scholar] [CrossRef]
- King, D.A. The scientific impact of nations. Nat. Cell Biol. 2004, 430, 311–316. [Google Scholar] [CrossRef]
- Scopus. 2020. Available online: https://www.scopus.com/home.uri (accessed on 5 March 2020).
- Clarivariate Analytics. 2020. Available online: www.webofknowledge.com (accessed on 8 June 2020).
- Zhang, X.; Estoque, R.C.; Xie, H.; Murayama, Y.; Ranagalage, M. Bibliometric analysis of highly cited articles on ecosystem services. PLoS ONE 2019, 14, e0210707. [Google Scholar] [CrossRef] [PubMed]
- Sweileh, W.M.; Al-Jabi, S.W.; Zyoud, S.H.; Sawalha, A.F.; Abu-Taha, A.S. Global research output in antimicrobial resistance among uropathogens: A bibliometric analysis (2002–2016). J. Glob. Antimicrob. Resist. 2018, 13, 104–114. [Google Scholar] [CrossRef] [PubMed]
- Sun, S.; Jiang, Y.; Zheng, S. Research on ecological infrastructure from 1990 to 2018: A bibliometric analysis. Sustainability 2020, 12, 2304. [Google Scholar] [CrossRef] [Green Version]
- Castellanos-Galindo, G.A.; Kluger, L.C.; Camargo, M.A.; Cantera, J.; Pineda, J.E.M.; Blanco-Libreros, J.F.; Wolff, M. Mangrove research in Colombia: Temporal trends, geographical coverage and research gaps. Estuarine Coast. Shelf Sci. 2021, 248, 106799. [Google Scholar] [CrossRef]
- Clerici, N.; Pedraza, S.; Zuluaga Gaviria, J.D.; Sanchez, A. Bibliometrics records of global research on riparian zones in the XXI century. Mendeley Data, 2021. [Google Scholar] [CrossRef]
- Liberati, A.; Altman, D.G.; Tetzlaff, J.; Mulrow, C.; Gøtzsche, P.C.; Ioannidis, J.P.A.; Clarke, M.; Devereaux, P.J.; Kleijnen, J.; Moher, D. The PRISMA statement for reporting systematic reviews and meta-analyses of studies that evaluate health care interventions: Explanation and elaboration. PLoS Med. 2009, 6, e1000100. [Google Scholar] [CrossRef]
- Aria, M.; Cuccurullo, C. bibliometrix: An R-tool for comprehensive science mapping analysis. J. Inf. 2017, 11, 959–975. [Google Scholar] [CrossRef]
- RStudio Team. RStudio: Integrated Development for R; RStudio, Inc.: Boston, MA, USA, 2019. [Google Scholar]
- VOSviewer VOSviewer—Visualizing Scientific Landscapes. Available online: https://www.vosviewer.com// (accessed on 21 October 2020).
- VOSviewer VOSviewer—Visualizing Scientific Landscapes. Manual for VOSviewer version 1.6.16. Available online: https://www.vosviewer.com/documentation/Manual_VOSviewer_1.6.16.pdf (accessed on 21 October 2020).
- Baxter, C.V.; Fausch, K.D.; Saunders, W.C. Tangled webs: Reciprocal flows of invertebrate prey link streams and riparian zones. Freshw. Biol. 2005, 50, 201–220. [Google Scholar] [CrossRef]
- Pusey, B.J.; Arthington, A.H. Importance of the riparian zone to the conservation and management of freshwater fish: A review. Mar. Freshw. Res. 2003, 54, 1–16. [Google Scholar] [CrossRef] [Green Version]
- Vidon, P.; Allan, C.; Burns, D.; Duval, T.P.; Gurwick, N.; Inamdar, S.; Lowrance, R.; Okay, J.; Scott, D.; Sebestyen, S. Hot spots and hot moments in riparian zones: Potential for improved water quality Management1. JAWRA J. Am. Water Resour. Assoc. 2010, 46, 278–298. [Google Scholar] [CrossRef]
- Sabo, J.L.; Sponseller, R.; Dixon, M.; Gade, K.; Harms, T.; Heffernan, J.; Jani, A.; Katz, G.; Soykan, C.; Watts, J.; et al. Riparian zones increase regional species richness by harboring different, not more, species. Ecology 2005, 86, 56–62. [Google Scholar] [CrossRef]
- McGlynn, B.L.; Mcdonnell, J. Quantifying the relative contributions of riparian and hillslope zones to catchment runoff. Water Resour. Res. 2003, 39, 1310. [Google Scholar] [CrossRef] [Green Version]
- Malmqvist, B. Aquatic invertebrates in riverine landscapes. Freshw. Biol. 2002, 47, 679–694. [Google Scholar] [CrossRef]
- Groffman, P.M.; Boulware, N.J.; Zipperer, W.C.; Pouyat, R.V.; Band, L.E.; Colosimo, M.F. Soil nitrogen cycle processes in urban riparian zones. Environ. Sci. Technol. 2002, 36, 4547–4552. [Google Scholar] [CrossRef] [PubMed]
- Hefting, M.; Clement, J.-C.; Dowrick, D.; Cosandey, A.; Bernal, S.; Cimpian, C.; Tatur, A.; Burt, T.; Pinay, G. Water table elevation controls on soil nitrogen cycling in riparian wetlands along a European climatic gradient. Biogeochemistry 2004, 67, 113–134. [Google Scholar] [CrossRef]
- Kiffney, P.M.; Richardson, J.; Bull, J.P. Responses of periphyton and insects to experimental manipulation of riparian buffer width along forest streams. J. Appl. Ecol. 2003, 40, 1060–1076. [Google Scholar] [CrossRef]
- Glenn, E.P.; Nagler, P.L. Comparative ecophysiology of Tamarix ramosissima and native trees in western U.S. riparian zones. J. Arid. Environ. 2005, 61, 419–446. [Google Scholar] [CrossRef]
- Van Looy, K.; Tormos, T.; Souchon, Y.; Gilvear, D. Analyzing riparian zone ecosystem services bundles to instruct river management. Int. J. Biodivers. Sci. Ecosyst. Serv. Manag. 2017, 13, 330–341. [Google Scholar] [CrossRef]
Figure 1.
Schematic representation of riparian zones and major ecological functions.

Figure 2.
Number of scientific documents published annually on riparian zones (2001–2020).

Figure 3.
Country co-authored counting of English published documents on riparian zones (2001–2020).
Figure 3.
Country co-authored counting of English published documents on riparian zones (2001–2020).

Figure 4.
Most productive authors working on riparian zones (2001–2020).

Figure 5.
Co-authorship network of the countries publishing on riparian zones. A threshold of 5 published documents was applied, resulting in a total of 32 countries. The bubble size refers to the total number of publications. Line thickness and color refer to link strength and clustering, respectively.

Figure 6.
Co-authorship network. A threshold of 5 documents was applied, resulting in a total of 54 authors. The bubble size refers to the total number of publications. Line thickness and color refer to link strength and clustering, respectively.
Figure 6.
Co-authorship network. A threshold of 5 documents was applied, resulting in a total of 54 authors. The bubble size refers to the total number of publications. Line thickness and color refer to link strength and clustering, respectively.

Figure 7.
Word cloud of (a) authors’ keywords and (b) KeyWords Plus®, excluding the terms “riparian zone(s)” and “riparian area(s)”.
Figure 7.
Word cloud of (a) authors’ keywords and (b) KeyWords Plus®, excluding the terms “riparian zone(s)” and “riparian area(s)”.

Figure 8.
Temporal trend in KeyWords Plus® associated to riparian zones research (2001–2020).


Table 1.
Top 10 most cited publications under the query performed (search date: 27-11-2020). Topics were gathered from the SciVal Topic Prominence in Science service (Elsevier). TC = Total citations.
Table 1.
Top 10 most cited publications under the query performed (search date: 27-11-2020). Topics were gathered from the SciVal Topic Prominence in Science service (Elsevier). TC = Total citations.
| Publication | TC | TC/Year | SciVal Topic Prominence | Document Type |
|---|---|---|---|---|
| Baxter, C. et al. (2005) [57] Freshwater Biology | 676 | 42.25 | Ecosystem Boundary, Aquatic Insects, Subsidies | Review |
| Pusey B.J. & Arthington A.H. (2003) [58] Marine and Freshwater Research | 290 | 16.11 | Macquaria ambigua, Maccullochella macquariensis | Review |
| Vidon P. et al. (2010) [59] Journal of the American Water Resources Association | 278 | 25.27 | Filter Strips, Riparian Buffers, Runoff | Article |
| Sabo J.L. et al. (2005) [60] Ecology | 277 | 17.31 | Tamarix, Riparian Vegetation, Diorhabda carinulata | Article |
| Mcglynn B.L. & McDonnell J.J. (2003) [61] Water Resources Research | 210 | 11.67 | Hillslope, Transit Time, Headwater | Article |
| Malmqvist B. (2002) [62] Freshwater Biology | 210 | 11.05 | Macroinvertebrates, Trichoptera, Baetis | Article |
| Groffman P.M. et al. (2002) [63] Environmental Science & Technology | 207 | 10.89 | Bioretention Areas, Stormwater Management, Urban Runoff | Article |
| Hefting M. et al. (2004) [64] Biogeochemistry | 206 | 12.12 | Filter Strips, Riparian Buffers, Runoff | Article |
| Kiffney P.M. et al. (2003) [65] Journal of Applied Ecology | 199 | 11.06 | Forest Roads, Best Management Practices, Man-made Trails | Article |
| Glenn E.P. & Nagler P.L. (2005) [66] Journal of Arid Environments | 187 | 11.69 | Tamarix, Riparian Vegetation, Diorhabda carinulata | Article |
Table 2.
Top institutions per number of published documents (2001–2020) based on the corresponding author’s affiliation.
Table 2.
Top institutions per number of published documents (2001–2020) based on the corresponding author’s affiliation.
| Affiliation | Publications (Number) |
|---|---|
| Oregon State University | 32 |
| Hohai University | 28 |
| Chinese Academy of Sciences | 27 |
| University of Chinese Academy of Sciences | 24 |
| Colorado State University | 23 |
| Swedish University of Agricultural Sciences | 23 |
| University of British Columbia | 22 |
| University of California | 21 |
| Aarhus University | 19 |
| University of Idaho | 19 |
| University of Washington | 19 |
| Usda Forest Service | 18 |
| Monash University | 17 |
| Ume University | 17 |
| Stellenbosch University | 16 |
| Utrecht University | 16 |
| Arizona State University | 15 |
| Montana State University | 14 |
| York University | 14 |
| Beijing Forestry University | 13 |
Publisher’s Note: MDPI stays neutral with regard to jurisdictional claims in published maps and institutional affiliations. |
© 2021 by the authors. Licensee MDPI, Basel, Switzerland. This article is an open access article distributed under the terms and conditions of the Creative Commons Attribution (CC BY) license (https://creativecommons.org/licenses/by/4.0/).
Share and Cite
MDPI and ACS Style
Pedraza, S.; Clerici, N.; Zuluaga Gaviria, J.D.; Sanchez, A. Global Research on Riparian Zones in the XXI Century: A Bibliometric Analysis. Water 2021, 13, 1836. https://doi.org/10.3390/w13131836
AMA Style
Pedraza S, Clerici N, Zuluaga Gaviria JD, Sanchez A. Global Research on Riparian Zones in the XXI Century: A Bibliometric Analysis. Water. 2021; 13(13):1836. https://doi.org/10.3390/w13131836
Chicago/Turabian StylePedraza, Sara, Nicola Clerici, Jennifer D. Zuluaga Gaviria, and Adriana Sanchez. 2021. "Global Research on Riparian Zones in the XXI Century: A Bibliometric Analysis" Water 13, no. 13: 1836. https://doi.org/10.3390/w13131836
Note that from the first issue of 2016, this journal uses article numbers instead of page numbers. See further details here.