
Analysis of Characteristics of Hydrological and Meteorological Drought Evolution in Southwest China


1
College of Hydrology and Water Resources, Hohai University, Nanjing 210098, China
2
Development of China Drainage Irrigation Center, Beijing 100054, China
3
Hydrology Bureau of Ministry of Water Resources, Beijing 100053, China
*
Author to whom correspondence should be addressed.
Water 2021, 13(13), 1846; https://doi.org/10.3390/w13131846
Submission received: 20 May 2021
/
Revised: 28 June 2021
/
Accepted: 29 June 2021
/
Published: 1 July 2021
(This article belongs to the Special Issue Human and Climate Impacts on Drought Dynamics and Vulnerability)
Abstract
:Based on the data of 82 meteorological stations and six representative hydrological stations in four provinces in Southwest China (Guizhou, Sichuan, Yunnan, Chongqing), this paper uses standardized precipitation evapotranspiration index (SPEI) and standardized runoff index (SRI) to analyze the spatial and temporal evolution characteristics of drought in the study area from 1968 to 2018. Combined with the Southwest monsoon index and historical drought data, the correlation of drought and the applicability of different drought indices were verified. The results show that: (1) SPEI-12 in Southwest China shows a downward trend from 1968 to 2018, with a linear trend rate of −0.074/10a, and SPEI-3 has a downward trend in four seasons, the maximum linear trend rate being −0.106/10a in autumn;(2) The change in SRI-12 and SRI-24 value directly reflected the decrease in SRI value, indicating that drought events are increasing in recent times, especially in the 21st century (3). Severe drought occurred in the south of Southwest China, as indicated by the increase of drought frequency in this area. The main reason for the variations in the frequency distribution of drought in Southwest China is the combined effect of the change of precipitation and evapotranspiration. (4) The correlation between hydrological drought index and disaster areas is stronger than the correlation between meteorological drought and disaster areas.
1. Introduction
Drought is the kind of natural disaster with the widest influence range, the highest frequency, the longest duration and the highest disaster rate in the world, a meteorological disaster that causes the largest economic loss among many other natural disasters [1,2,3]. According to statistics, the losses caused by meteorological disasters account for about 85% and by drought for about 50% of meteorological disasters among total losses caused by various natural disasters [4]. The direct economic loss is approximately 2.5–3.5% of the total GDP in a drought year in China [5]. Drought has become an important factor restricting the development of China’s national economy.
The spatial and temporal distribution of drought in China has also changed under global climate change. Drought is no more the exclusive natural disaster of traditional arid and semi-arid areas such as northeast, northwest and north China. In China’s humid and semi humid areas, the frequency of drought is also increasing, and the drought is becoming more and more serious. It is instructive to have a clear understanding of this development trend via the analysis of drought change characteristics in Southwest China. A clear understanding of drought characteristics is necessary to improve the level of disaster prevention.
Previous studies have mainly focused on meteorological drought in Southwest China, and less on hydrological drought [6,7]. Yu et al. [8] use SPEI to analyze the characteristics of drought change in Southwest China, whereas Wang et al. [9] use PDSI. The analysis of hydrological drought is only for a single basin (Nanpanjiang River and Wujiang River) [10,11], not for the whole of Southwest China. Prasenjit et al. [12] used the meteorological index SPI to analyze drought patterns in three relatively drought-prone places in India and pointed out that other types of drought, such as hydrological drought, should be considered if more detailed analysis is needed. However, there are no reports of Southwest drought combining meteorological and hydrological drought.
Based on the meteorological and hydrological drought index, combined with the Southwest monsoon index and historical drought data, this paper analyzes the spatial and temporal evolution characteristics of drought in Southwest China from 1968 to 2018.
2. Study Area and Data
2.1. Study Area
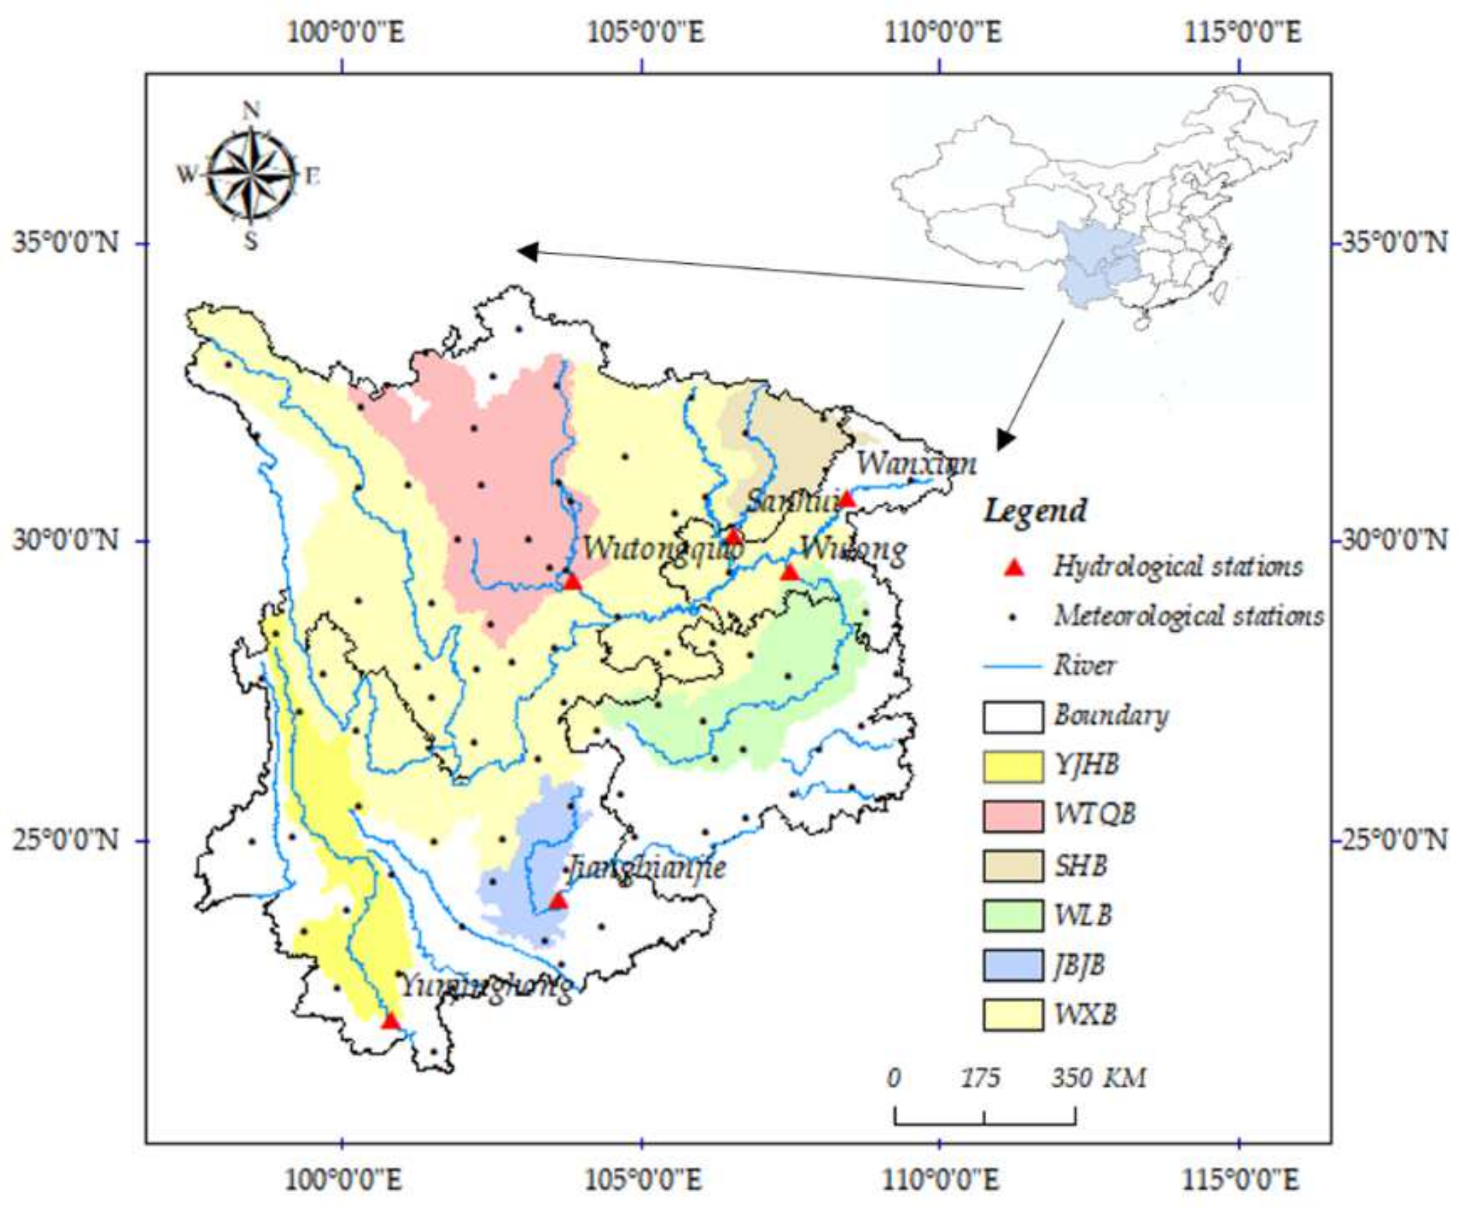
An important geographical area of China is selected to analyze the evolution of meteorological and hydrological drought. Geographically, it is located in Southwest China, including Chongqing, Sichuan, Guizhou and Yunnan provinces. It includes Sichuan Basin and Yunnan-Kweichow Plateau, and is adjacent to the middle and lower reaches of the Yangtze River Plain in the East. The study area has a surface area of 113.87 × 10⁴ km2, and the mean annual precipitation for 1968–2017 was 1058 mm, with a standard deviation of 58 mm. It belongs to the humid and semi humid subtropical monsoon climate with a mean annual daily temperature of around 16.25 °C, affected by the Southwest monsoon. The study area is shown in Figure 1. There are six hydrological stations in the study area, and the basins controlled by the six hydrological stations are Yunjinghong Basin (YJHB), Wutongqiao Basin (WTQB), Sanhui Basin (SHB), Wulong Basin (WLB), Jiangbianjie Basin (JBJB) and Wanxian Basin (WXB).
2.2. Dataset
Daily precipitation data of 82 meteorological stations from 1968 to 2017 are provided by the China Meteorological Data Service Centre (data.cma.cn, accessed on 30 June 2021). Two climate variables (sunshine and mean air temperature) are used to calculate the potential evapotranspiration. They are then aggregated to monthly values in order to estimate meteorological drought indices. Monthly natural runoff data of six hydrological stations from 1968 to 2017 is provided by the Hydrology Bureau of the Ministry of Water Resources of the People’s Republic of China to calculate hydrological drought indices. Information on the selected hydrological stations is provided in Table 1 as well as Figure 1. South Asian summer monsoon index (SASMI) data (http://ljp.gcess.cn/dct/page/1, accessed on 30 June 2021) is also used to compare the trends in meteorological drought. The statistical data on agricultural drought includes that from the China Statistical Yearbooks compiled by the National Bureau of Statistics (http://www.stats.gov.cn/tjsj/ndsj/, accessed on 30 June 2021) provided by the Ministry of Agriculture and Rural Affairs of the People’s Republic of China. It consists of data on the drought affected areas of four provinces in Southwest China from 1972 to 2017. The data on Chongqing after 1997 were incorporated into that for Sichuan Province because of the change of administrative division.
2.3. Methodology
SPEI: standardized precipitation evapotranspiration index [13] considers the impact of water budget changes, between precipitation(P) and potential evapotranspiration (PET), on drought.
The calculation of SPEI is based on the differences between P and PET. The three-parameter log-logistic probability distribution is usually employed to fit these differences:
where F(x) is the cumulative distribution function of the log-logistic distribution, and α, β and λ represent the three parameters of the distribution, which can be estimated by the maximum likelihood estimation (MLE) method [14]. Mavromatis [15] showed that the use of simple or complex methods to calculate the PET provides similar results when a drought index, such as the PDSI, is calculated. Therefore, we followed the simplest approach to calculate PET [16], which has the advantage of only requiring data on monthly-mean temperature. The monthly PET is obtained by:
where T is the monthly-mean temperature (°C); I is a heat index, which is calculated as the sum of 12 monthly index values of i, the latter being derived from mean-monthly temperature using the formula:
where m is a coefficient depending on I:m = 6.75 × 10⁻⁷I3 − 7.71 × 10⁻⁵I2 + 1.79 × 10²I + 0.492; and K is a correction coefficient computed as a function of the latitude and month:
Here NDM is the number of days in the month and N is the monthly average sunshine.
With F(x) the SPEI can easily be obtained as the standardized values of F(x). For example, following the classical approximation [17] of
When p ≤ 0.5,
p is the probability of exceeding a determined x value, p = 1 − F(x). If p > 0.5, then p is replaced by 1 − p and the sign of the resultant SPEI is reversed. The constants are C0 = 2.515517, C1 = 0.802853, C2 = 0.010328, d1 = 1.432788, d2 = 0.189269, and d3 = 0.001308.
SRI: Standardized runoff index is developed on the basis of standardized rainfall index (SPI). The mechanism of SPI is to make the precipitation series on a certain time scale obey Γ distribution, then calculate the cumulative probability for the probability density function of Γ distribution and finally normalize the cumulative probability, and then SPI value is obtained [18]. SRI is calculated with a similar method to that for SPEI. In this paper, it is considered that runoff also obeys the three-parameter log-logistic probability distribution, and x in SPEI is replaced by runoff to calculate SRI.
SPEI has the characteristics of multiple time scales. This paper calculates the SPEI values of four-time scales of 1, 3, 12 and 24 months, which are expressed by SPEI-1, SPEI-3, SPEI-12 and SPEI-24, respectively. Among them, SPEI-3 represents seasonal drought (spring, summer, autumn and winter), SPEI-12 represents annual drought, and SPEI-24 represents long-term drought. The SRI also has different time scales, and the SRI values of 1, 3, 12 and 24 months are calculated and expressed as SRI-1, SRI-3, SRI-12, and SRI-24, respectively.
According to the SPEI drought classification standard formulated by the China Meteorological Administration, the SPEI is divided into five grades. The SRI drought grade is also divided, with reference to the SPEI drought classification standard (Table 2).
SASMI: The South Asian summer monsoon index is calculated according to the definition of Li Jianping [19]. It is defined as an area-averaged seasonally (JJAS) dynamic normalized seasonality (DNS) at 850 hPa within the South Asian domain (5°–22.5° N, 35°–97.5° E) [20]. The South Asian monsoon is called the Southwest monsoon because the southwest wind in summer is stronger than the northeast wind in winter.
Pearson correlation coefficient: Pearson correlation coefficient (PCCs), which can be calculated using the expression given in equation (8), are used to measure the linear correlation between variables X and Y, ranging from +1 to −1 [21].
The function Cov (X, Y) is the covariance of X and Y, which can be calculated by
and are the deviations of X and Y, which can be calculated by
While and are the respective means of X and Y, n is sample size.
Generally, the correlation strength of variables is judged by the value range in Table 3.
Statistical significance test [22,23] is to make a hypothesis about the parameters or the distribution of the population (random variables) in advance, and then use the sample information to judge whether the hypothesis is reasonable, that is, to judge whether there is a significant difference between the real situation of the population and the original hypothesis. Take the correlation coefficient of the sample (r) and the correlation coefficient of the population () as an example. If the probability of obtaining the r value in the population is p ≤ 0.05 or p ≤ 0.01, we refuse to test the hypothesis at the level α = 0.05 or α = 0.01 and assume that the r value comes not from the population for but from another population for . Therefore, it is judged that there is a significant relationship between the two variables.
In this study, the significance of r was tested by t-test [24,25,26]; the steps of t-test are as follows:
1. Establish test hypothesis, H0: , H1: , α = 0.01.
2. t of sample correlation coefficient r was calculated by:
v is the degree of freedom, which is obtained from the difference between the sample size (n) and 2. If H0 is true, then t obeys the t-distribution, whose degree of freedom is n−2.
3. Look up t-distribution table to get by a given α. Get r according to the sample, and then bring it into the Equation (11), and to calculate t*. If |t*| > , H0 is denied, otherwise H0 is accepted.
3. Results
3.1. The Characteristics of Meteorological Drought
In order to study the temporal variation trend of drought, the SPEI-12 values from January to December were used for the annual SPEI, and the SPEI-3 from March to May, June to August, September to November, and December to February were used, respectively, for spring, summer, autumn and winter. The SRI values are same.
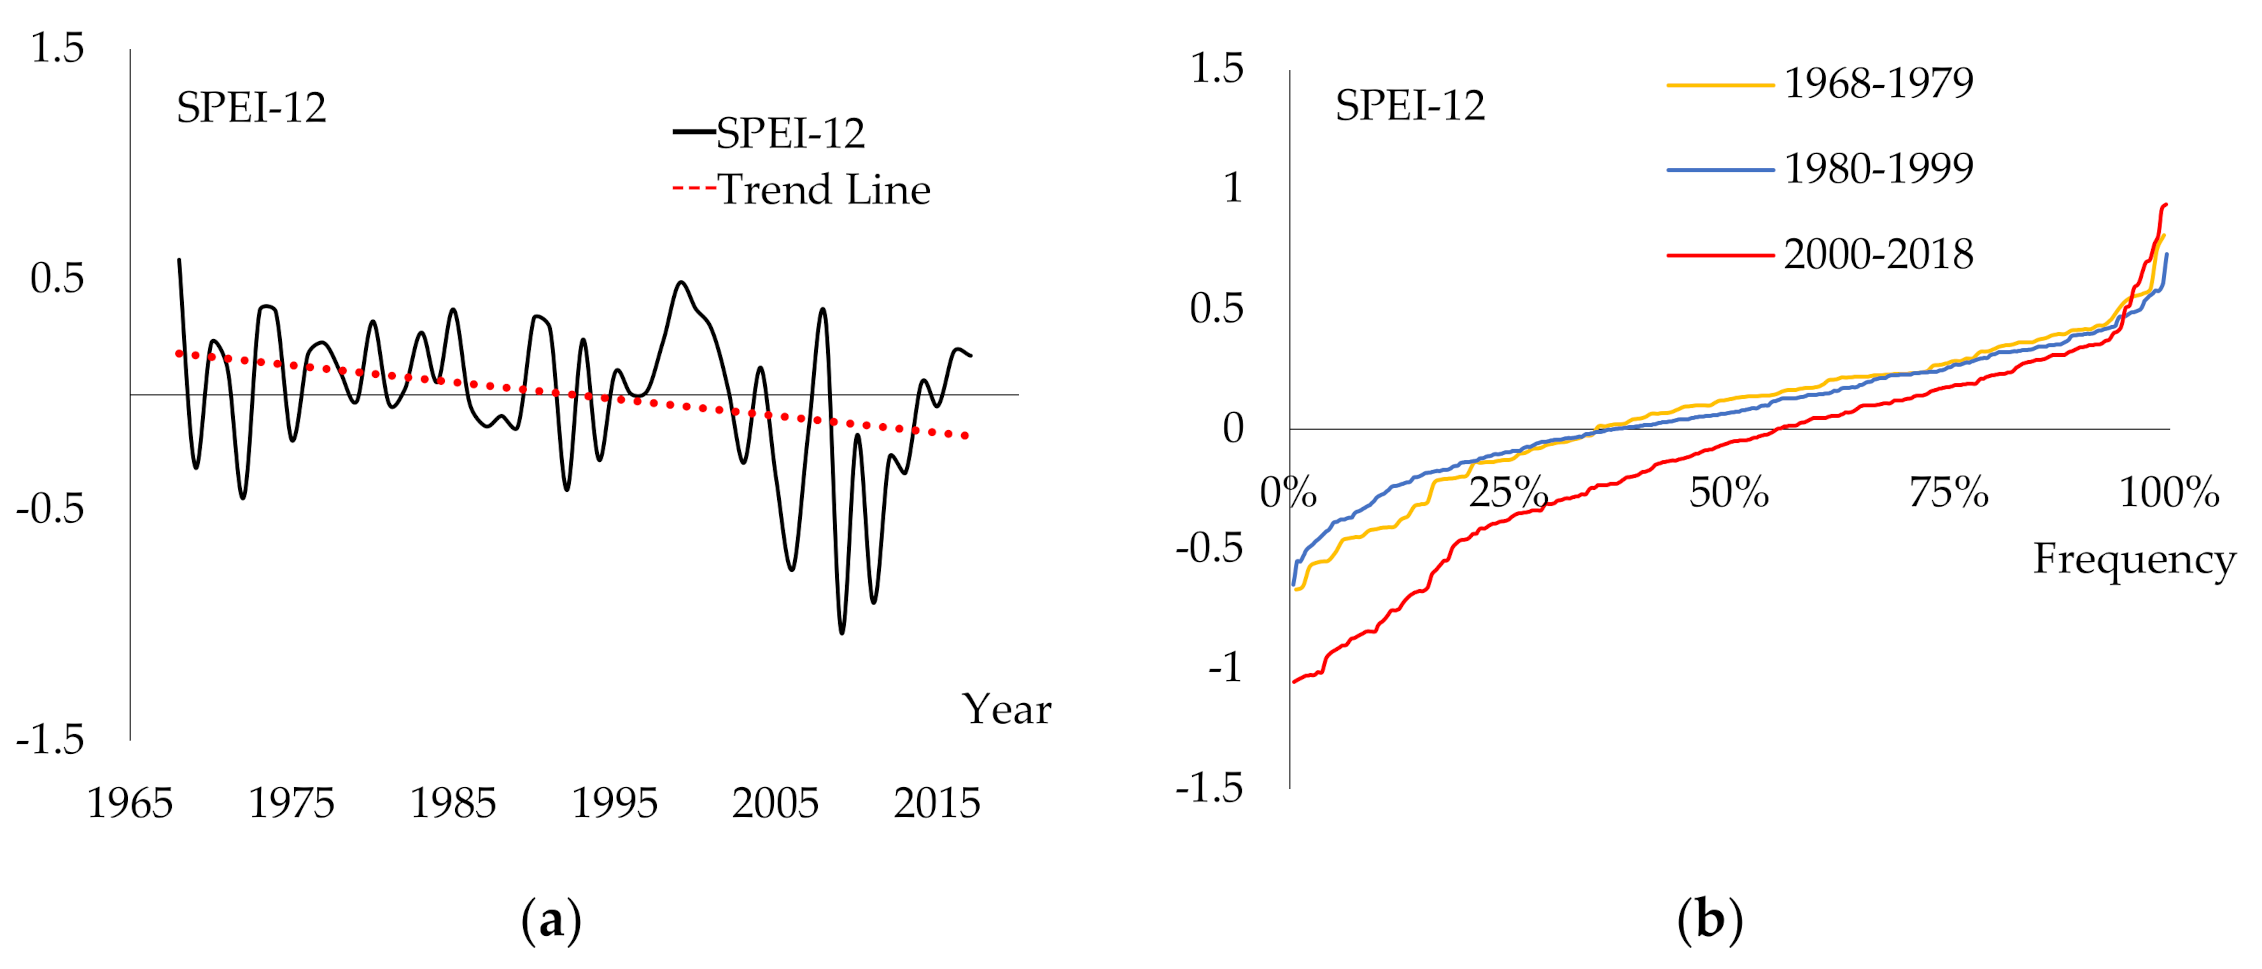
Figure 2a helps in understanding that the SPEI value in Southwest China showed a downward trend from 1968 to 2018, with a linear trend rate of −0.074/10a. As Figure 2b indicates, the frequency of annual scale drought in the study area has increased significantly. According to historical drought data, the drought records in Southwest China have been refreshed many times since the 21st century, which is consistent with the conclusion of SPEI analysis.
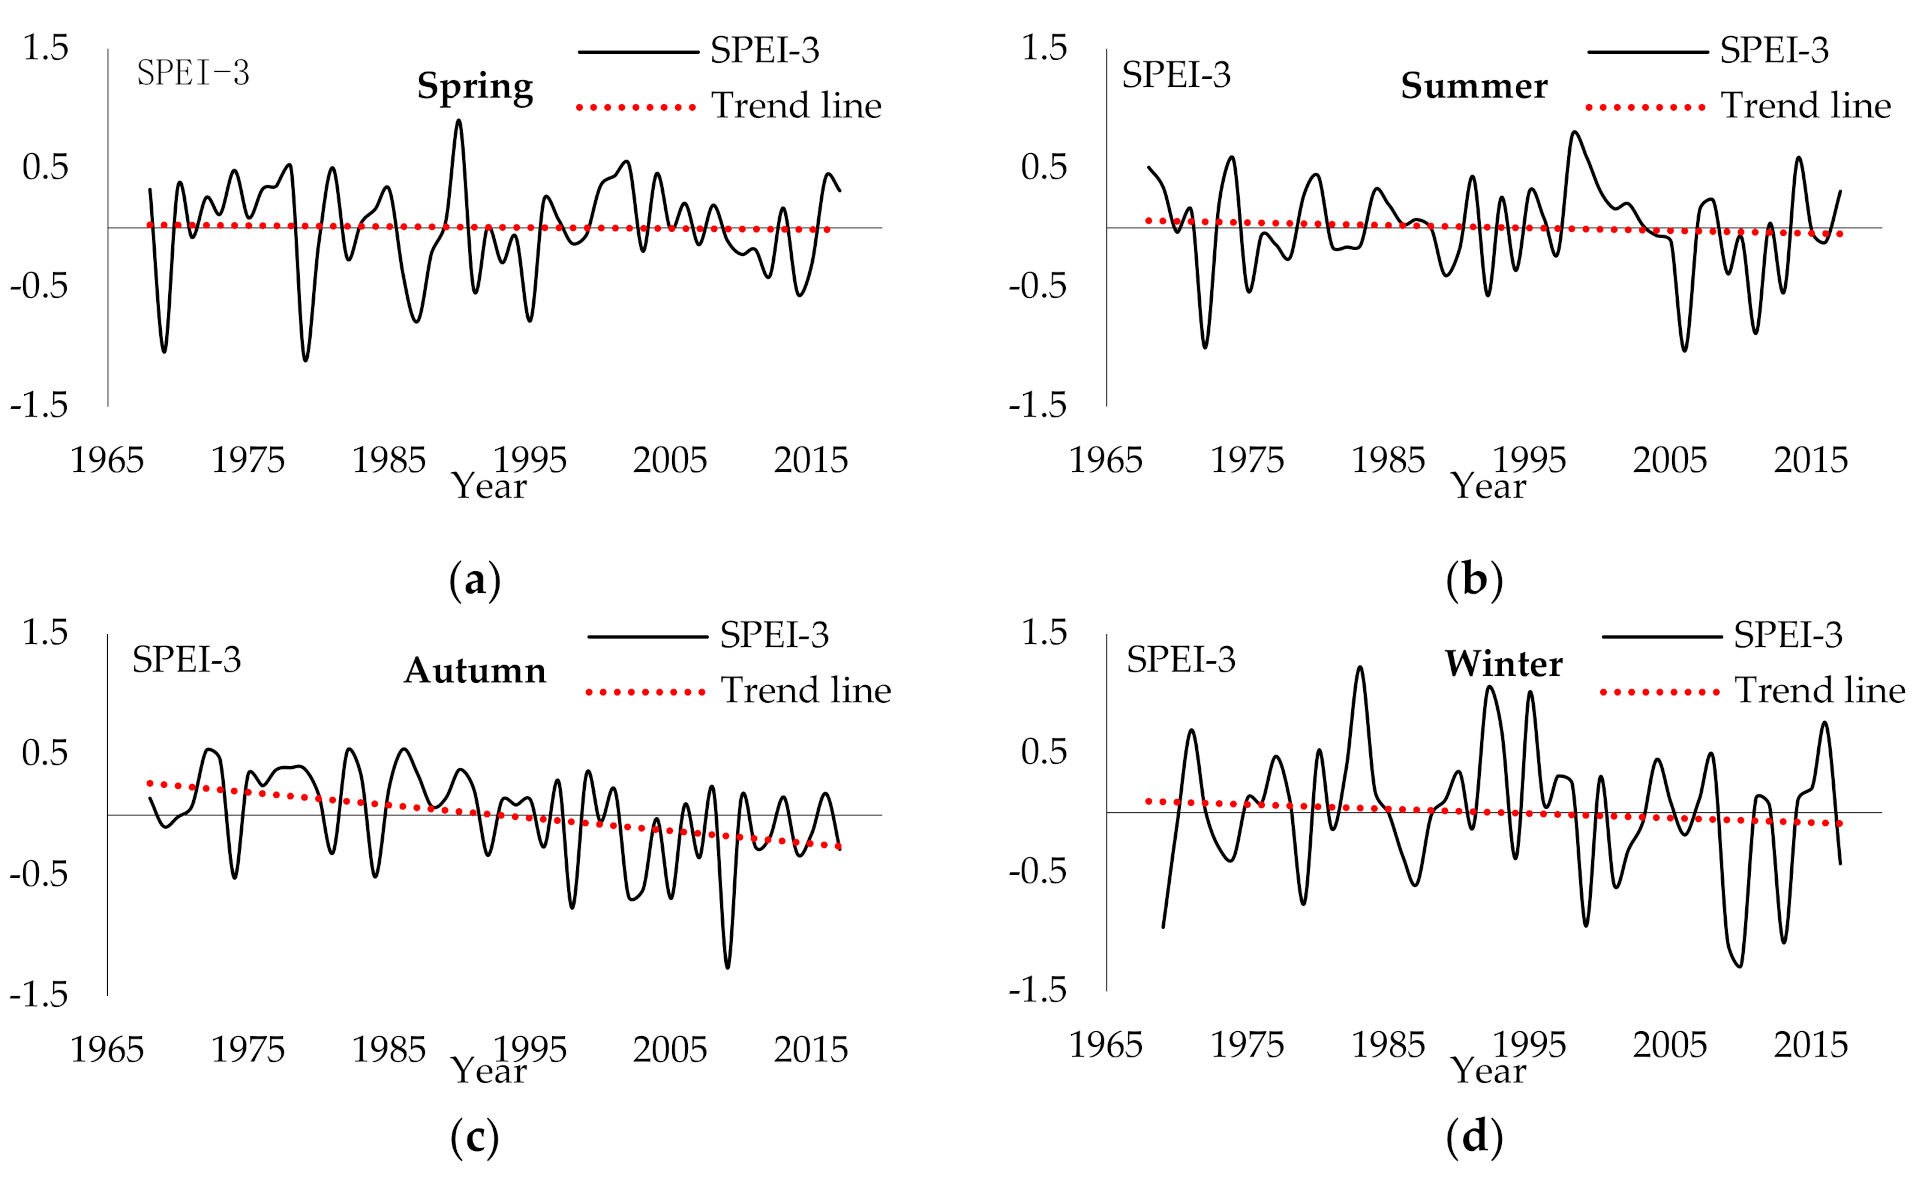
The inter-annual variation of SPEI in different seasons in Southwest China was calculated (Figure 3) to better reveal the seasonal variation trend in drought. This tells us that SPEI in Southwest China has a downward trend (towards drought) in four seasons, with an average decrease of 0.009 in spring, 0.023 in summer, 0.106 in autumn and 0.038 per 10 years in winter. It can be seen that the drought in autumn has an obvious aggravating trend.
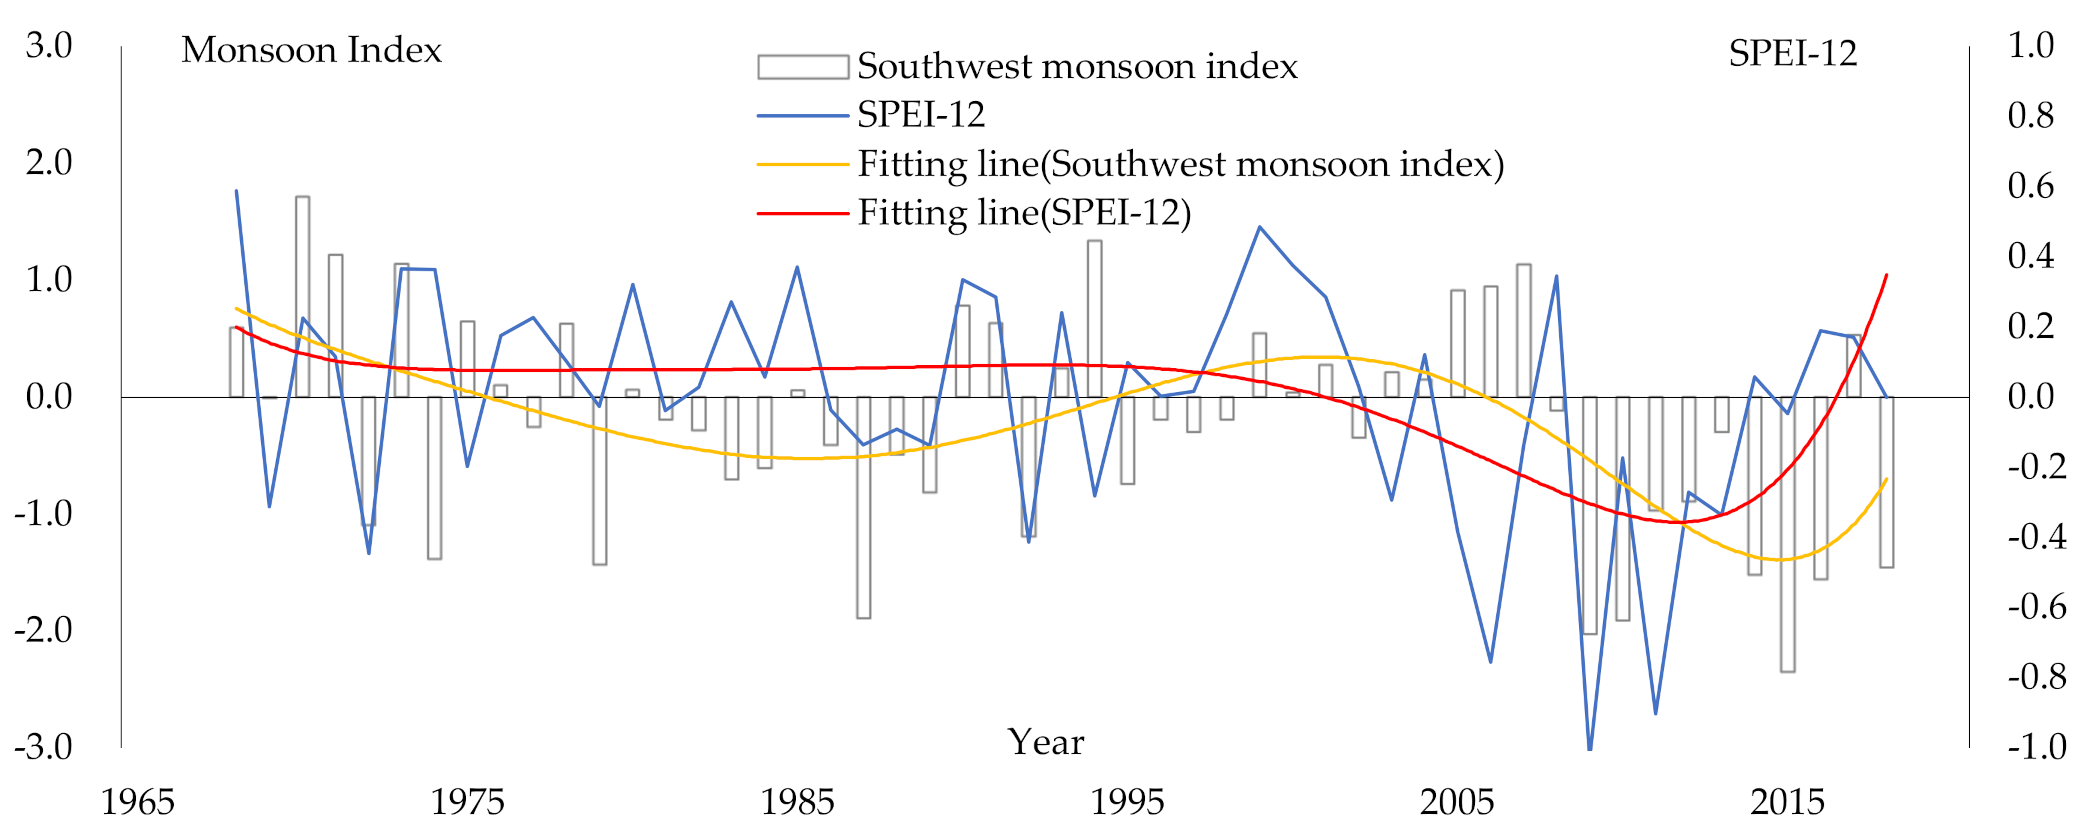
Based on the polynomial fitting of SPEI and SASMI at the inter-annual scale from 1968 to 2018 in Southwest China, the time variation trend between them is drawn (Figure 4). SASMI has weakened in the past ten years, and has been lower than the historical average level for a long time. SASMI has an opposite trend to SPEI in the 1970s and 1980s, but in the 2000s, when SASMI shows a downward trend, SPEI shows the same trend. By comparing the time series of SASMI and SPEI, it is found that the year with smaller SPEI in Southwest China corresponds to the year with weaker Southwest monsoon. Therefore, it can be inferred that there is a weak correlation between the aggravation of drought and the weakening of the Southwest monsoon from Table 4. There is no significant difference between the sample and the population at 95% confidence.
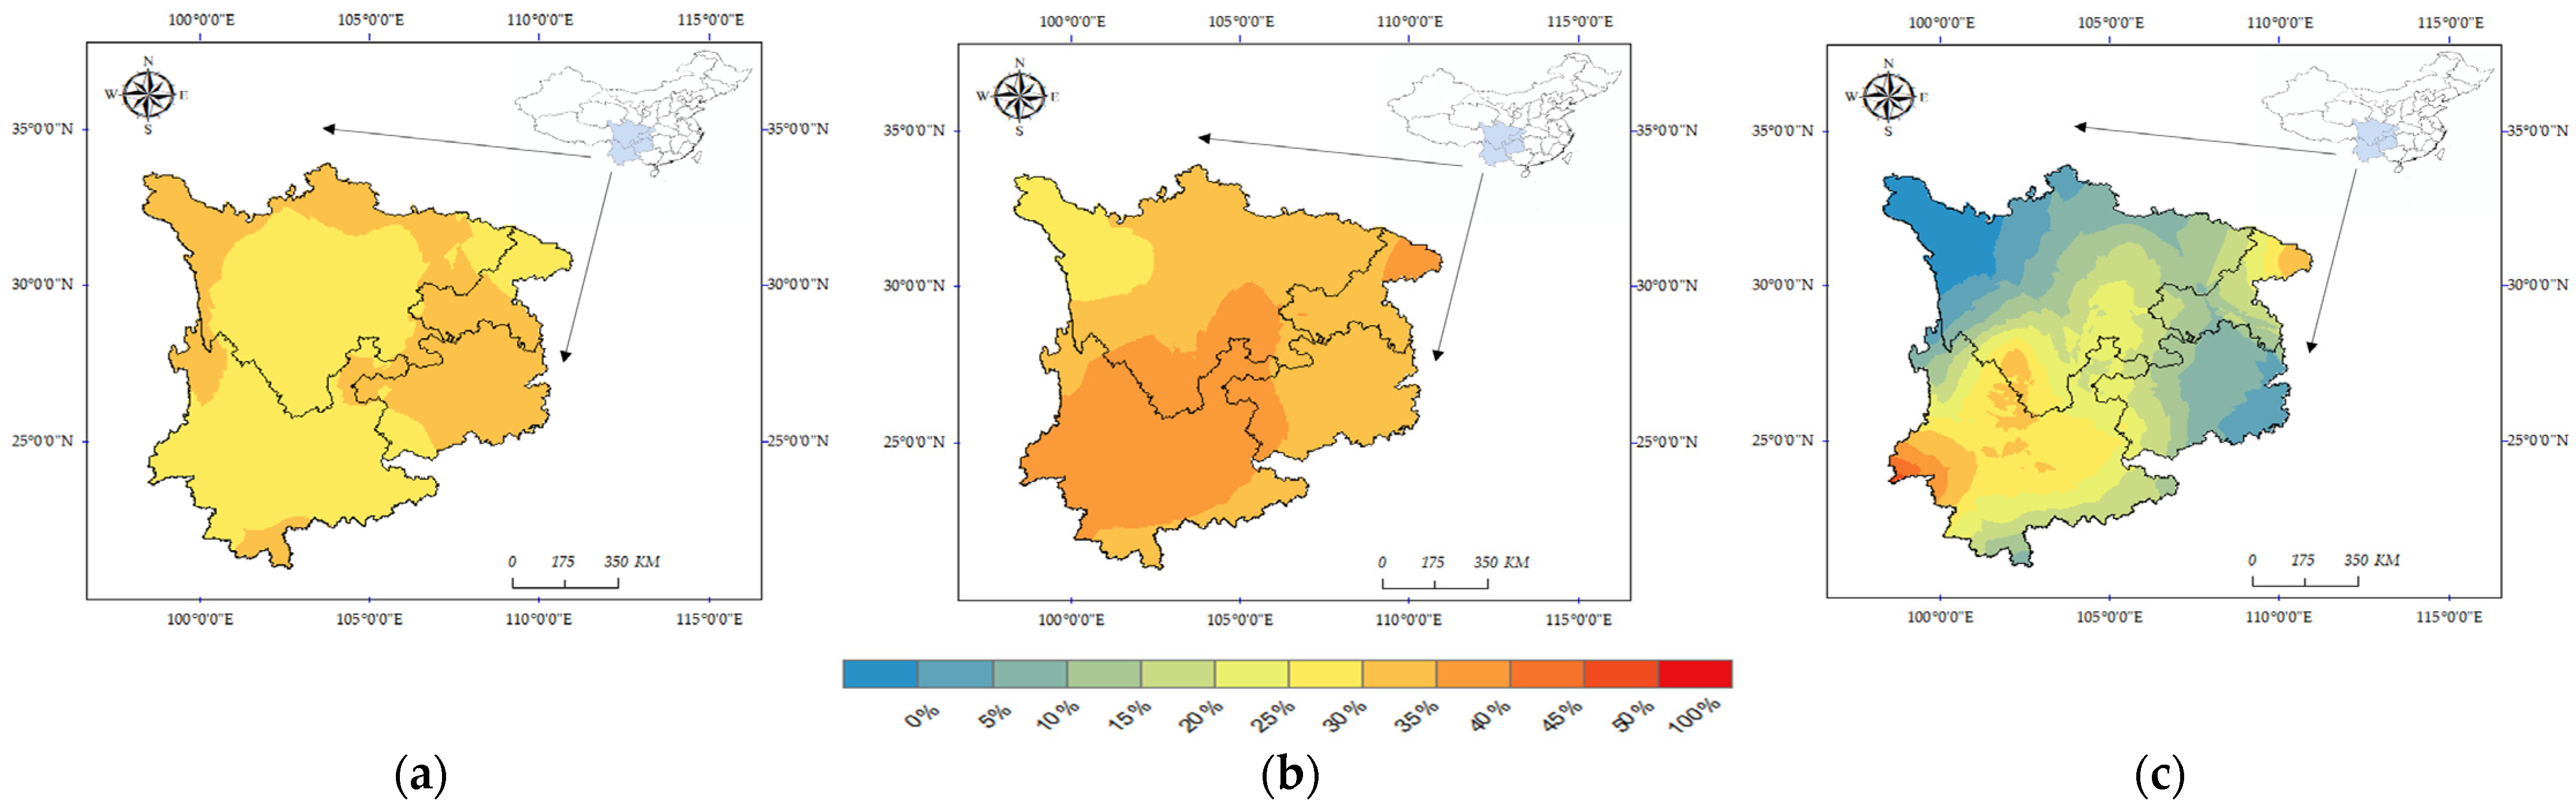
It can be seen from Figure 5a that the drought frequency in Southwest China was generally high in the east before the 21st century, most of Guizhou and Southwest Chongqing were drought prone areas, and the monthly drought frequency was more than 30%. Figure 5b summarizes that the drought frequency in Southwest China has increased, and the drought frequency in most of Yunnan and Southern Sichuan has risen by more than 35% since the 21st century. As Figure 5c indicates, this increase in drought frequency in Southwest China is mainly concentrated in most parts of Yunnan, Southern Sichuan and Eastern Chongqing.
3.2. The Characteristics of Hydrological Drought
Wanxian hydrological station is a kind of precision hydrological station which controls the water regime of the upper reaches of the Yangtze River. Its multi-year runoff process can reflect the overall hydrological drought situation in Southwest China.
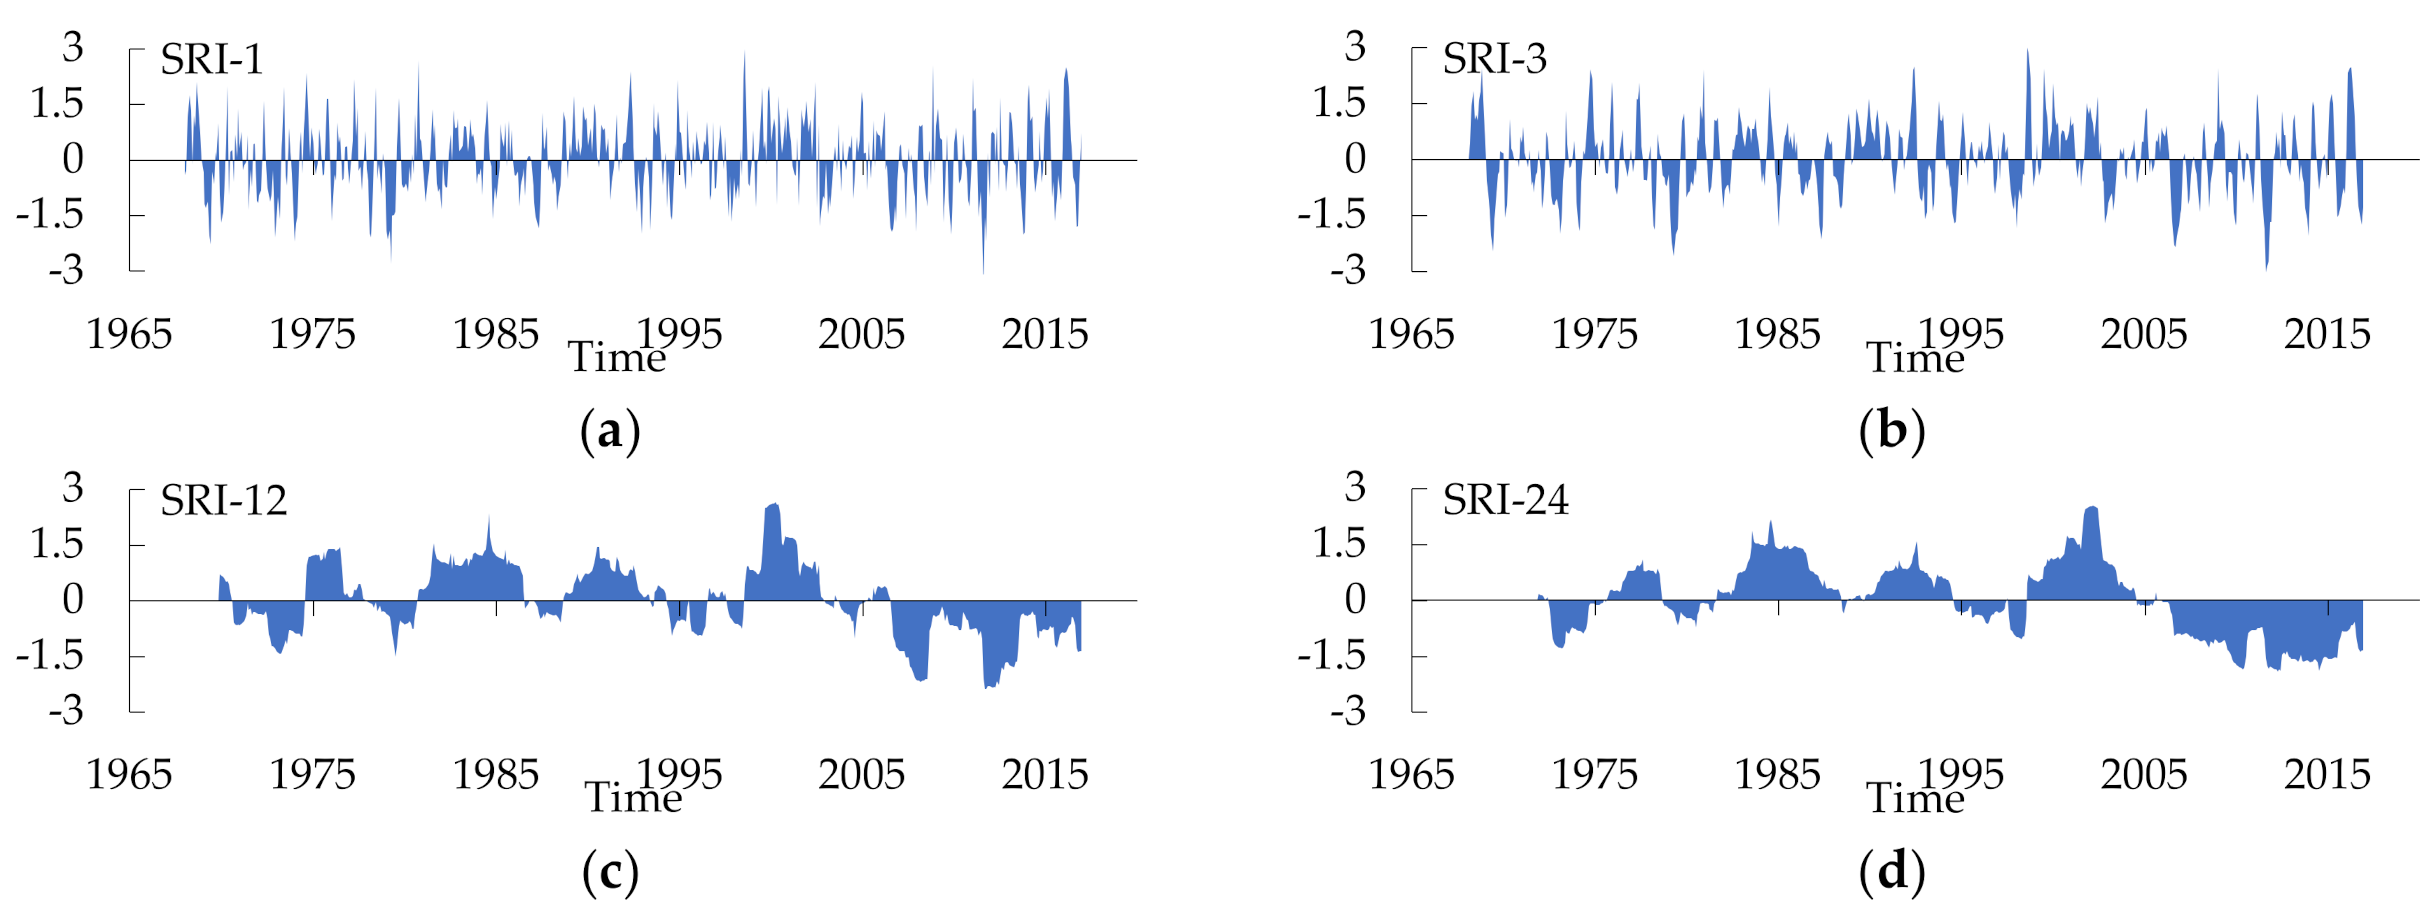
According to the inter-annual variation of SRI at Wanxian hydrological station (Figure 6), the fluctuation of SRI index with time also slows down with the difference of scale. In the last 50 years, the runoff in Southwest China has been decreasing as a whole. In the 1980s, the SRI value was greater than 0 as a whole, but since the 21st century, especially after 2005, the SRI value has been less than the previous minimum value at many times and less than 0 for a long time, which indicates that the situation of hydrological drought in Southwest China has become severe in the 21st century.
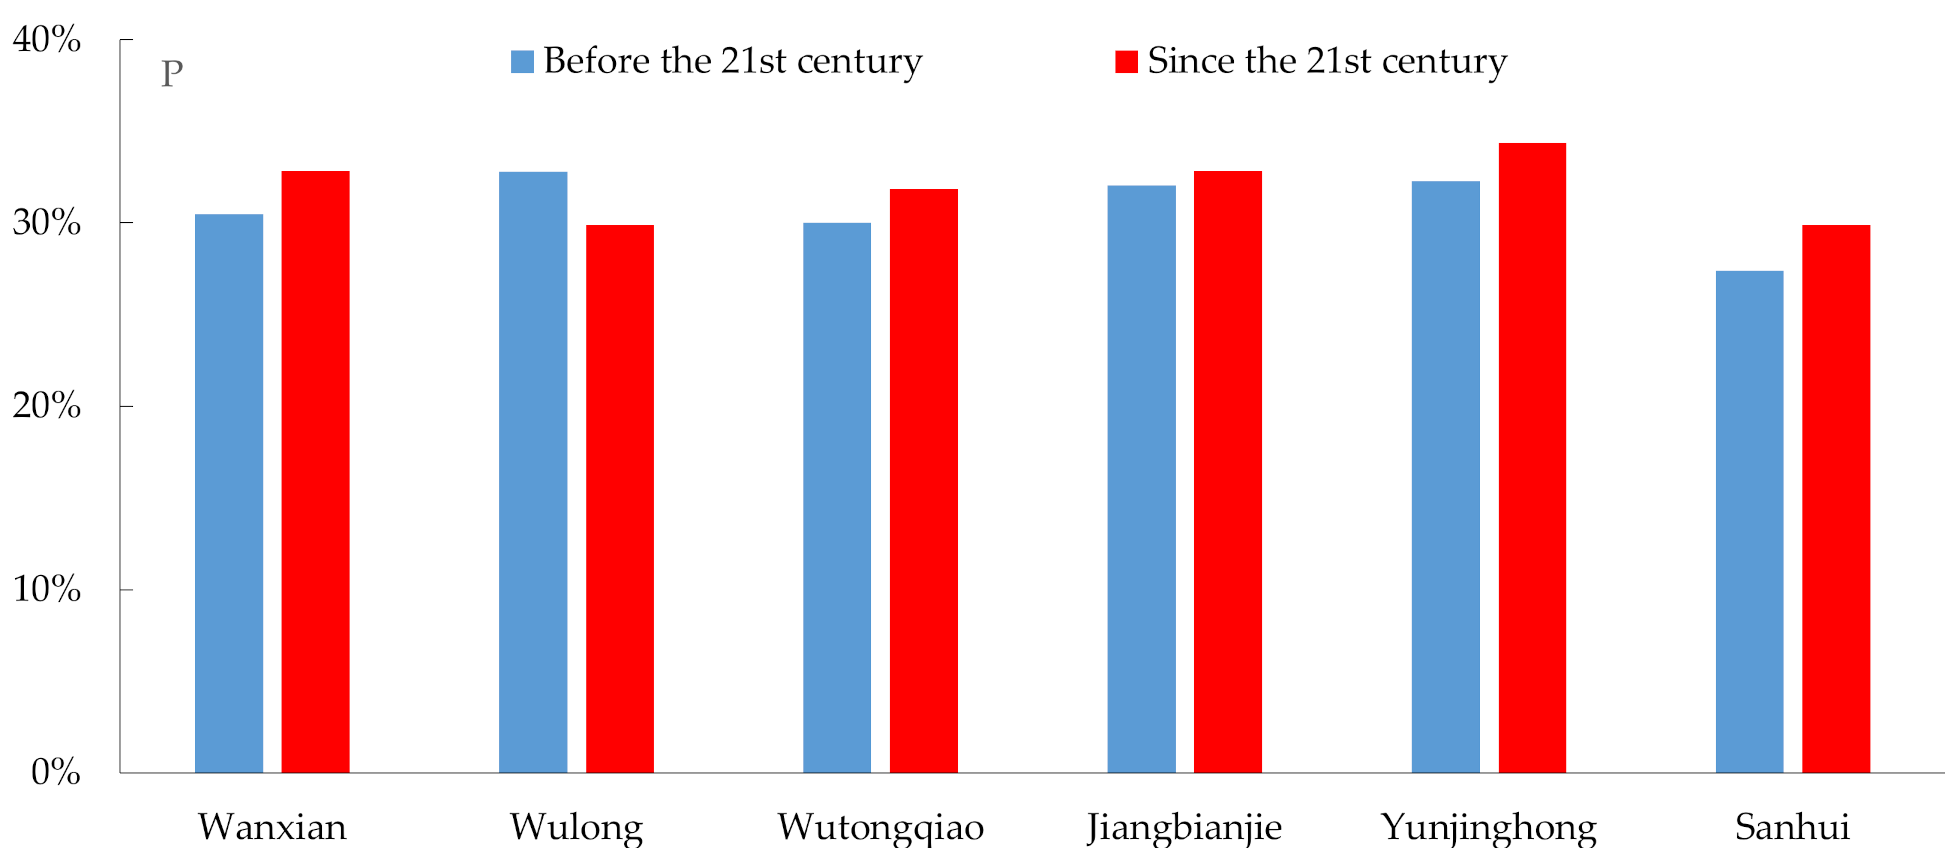
In Figure 7, the frequency of hydrologic drought in Wanxian station since the 21st century is obviously higher than the frequency before the 21st century, which indicates that the overall drought in Southwest China has been aggravated. There are four hydrological stations where drought is intensifying, and the spatial distribution of these is also consistent with the drought aggravating areas obtained from SPEI analysis. Before the 21st century, Wulong station had the highest frequency of hydrological drought, which is consistent with the results in Figure 5a. Yunjinghong station has the highest frequency of hydrological drought in the 21st century, which is consistent with the results in Figure 5b. Most of the watershed controlled by Wulong station is located in the northeast of Guizhou, and the decrease of drought frequency helps to show that the increase in hydrological drought in this area has slowed down. Considering Figure 1 and Figure 5c, we can find that four basins (WTQB, and JBJB, and YJHB and SHB) are located in the areas where the frequency of meteorological drought increases greatly, while WLB is located in the areas where the frequency increases less. Therefore, the increase and decrease of drought frequency obtained by SRI and SPEI are similar, but there are still differences in quantitative analysis.
3.3. Historical Droughts
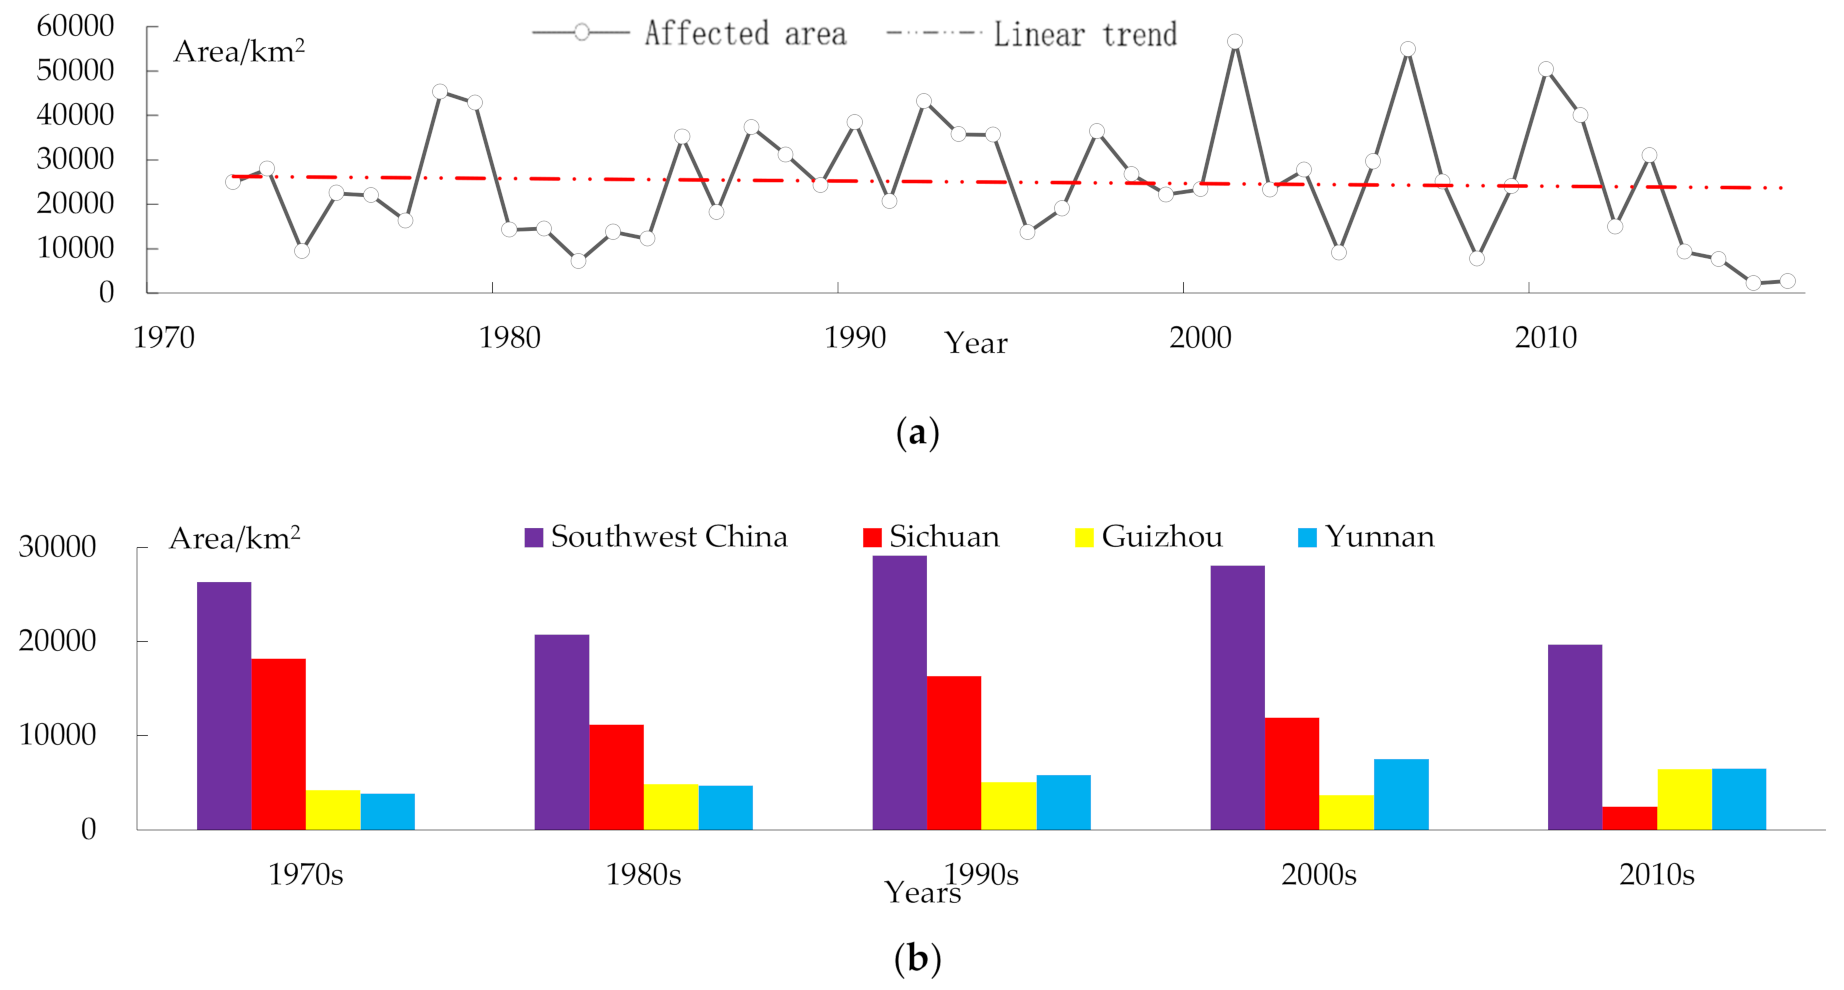
It can be seen from Figure 8a that the development of drought disasters in Southwest China has generally slowed down in area coverage in recent 40 years, with the drought disaster areas in Yunnan and Guizhou showing an increasing trend revealed in Figure 8b. However, the disaster area in Sichuan Province has decreased further in the 21st century, which has made the disaster area in Southwest China decrease as a whole.
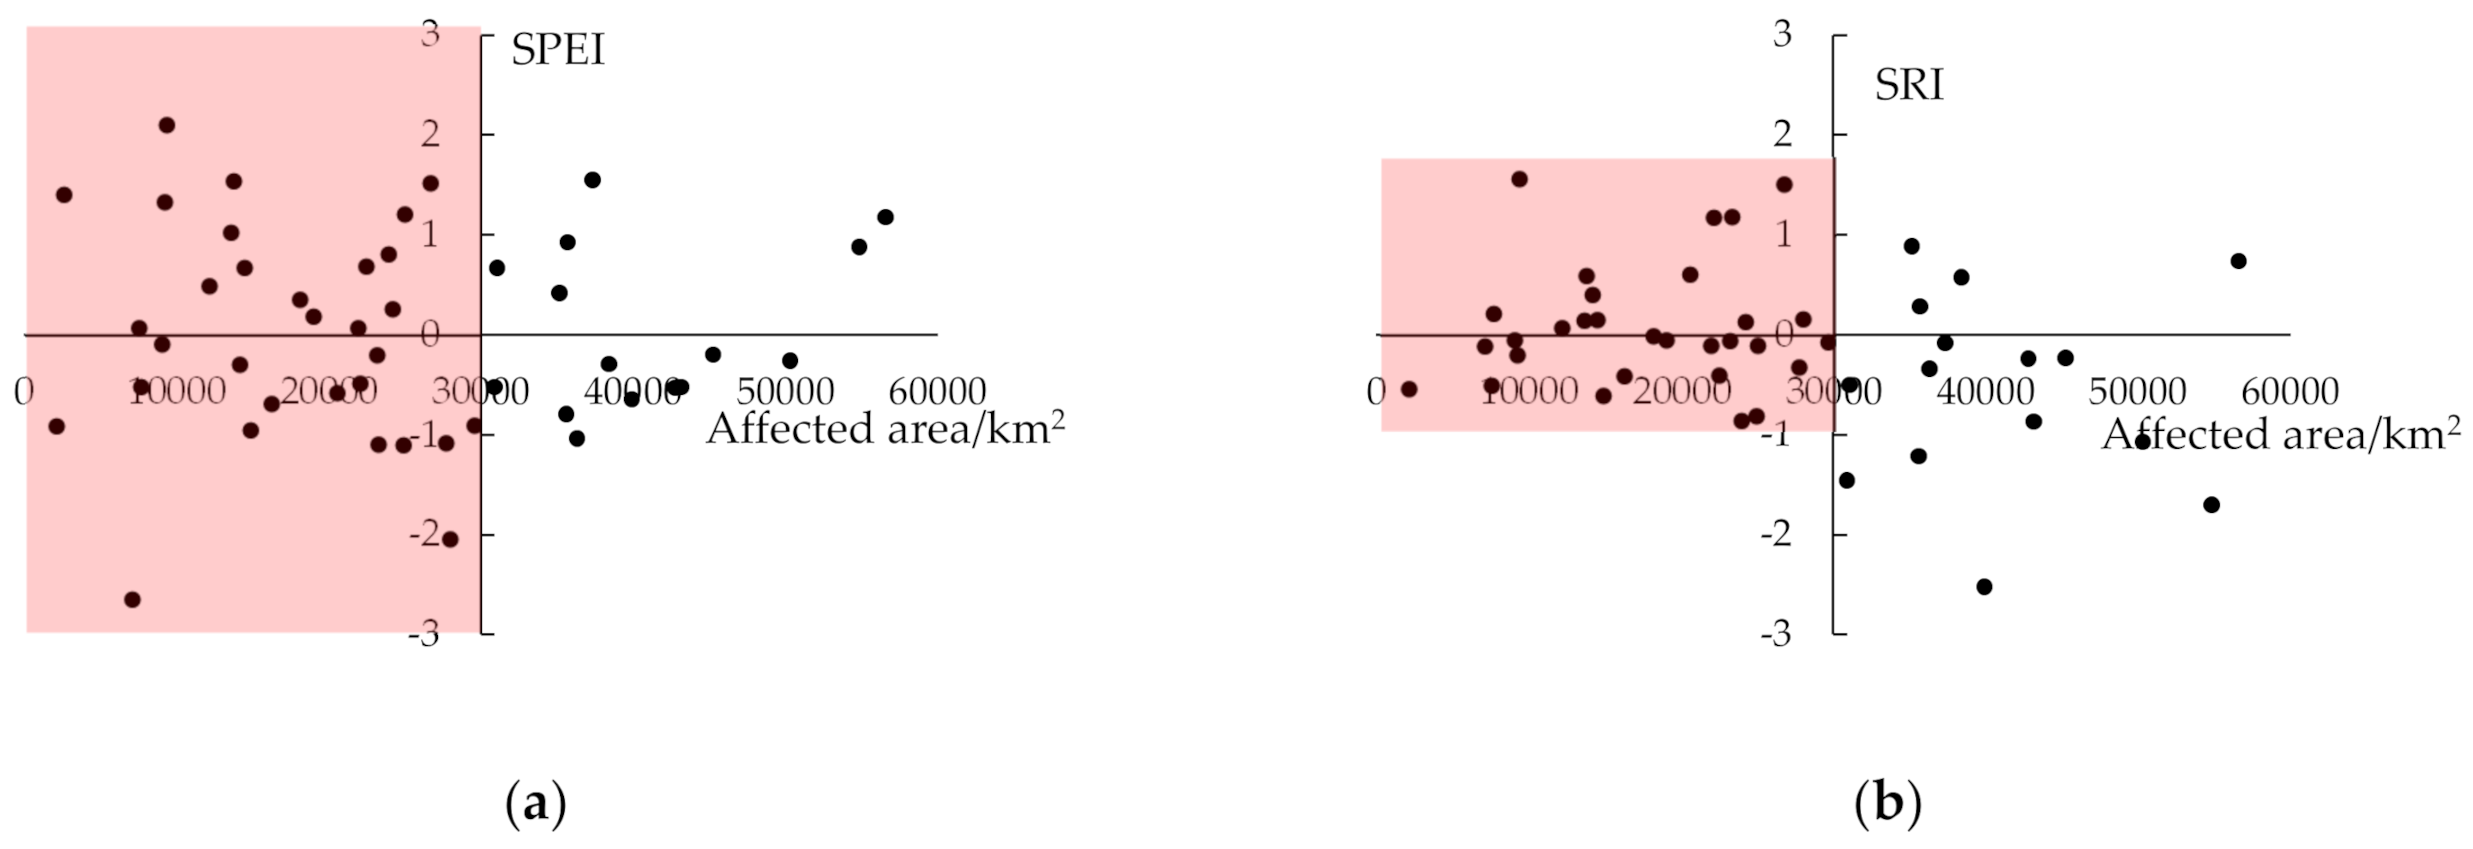
It can be seen from Table 5 that the PCC between affected area and SPEI is −0.01, and the PCC between affected area and SRI is −0.29. The PCCs between the two drought indices and affected area are negative, which indicates that the values of two drought indices decrease with an increase in the affected area. The absolute value of PCCs can reflect the strength of the linear correlation, that is, the linear correlation between affected area and SRI is stronger than the linear correlation between affected area and SPEI. In conclusion, the values of the two drought indices decreased with the increase of affected area, and the changes of SRI and affected area could be better by linear equations. There is no significant difference between the sample and the population at 95% confidence for the correlation between affected area and SRI. Figure 9 also shows that the correlation between the two indices and the affected area is weak, but the trend shows that when the SRI value is greater than 0, most of the affected areas are smaller, while when the SPEI value is greater than 0, the phenomenon is not obvious.
The amount of rainfall can qualitatively describe whether a disaster has occurred or not, but this cannot be quantified. There are also other natural factors such as topography, soil moisture in the early stage, and the influence of human activities which will have an impact on drought. For example, in the dry season with less rainfall, the regulation of water conservancy projects can prevent the occurrence of crop drought, so as to reduce the area of drought.
4. Discussion
The analysis of meteorological drought and hydrological drought indicates that Southwest China is experiencing a drought trend, and the drought trend in autumn is most obvious for all seasonal periods, which is in accordance with Wang et al. [27]. Previous studies have made detailed summaries of drought trends in Guizhou, Sichuan and Yunnan with different drought indices [27,28,29,30,31,32,33]. In the 21st century, on the one hand, severe drought events in 2006 and 2009/2010 in Southwest China have also been extensively reported [34,35,36]. On the other hand, Yunnan Province has become a hot spot of drought in Southwest China [37]. More articles focus on the analysis of drought changes and causes in Yunnan Province [27,28,29,30,38,39]. The severity and frequency of drought in Southwest China have increased in recent years, and drought events have become more frequent in the 21st century as can be seen by analyzing the spatiotemporal variation of SPEI and SRI, which is consistent with conclusions obtained by previous studies [40,41,42]. The drought frequency in most areas showed an increasing trend, in addition to the northwestern part of Sichuan Province. Before 2000, the drought hot spots in southwest China usually appeared in Guizhou Province, but in the 21st century, the drought hot spots moved to Yunnan Province, which is in accordance with Jia et al. [37].
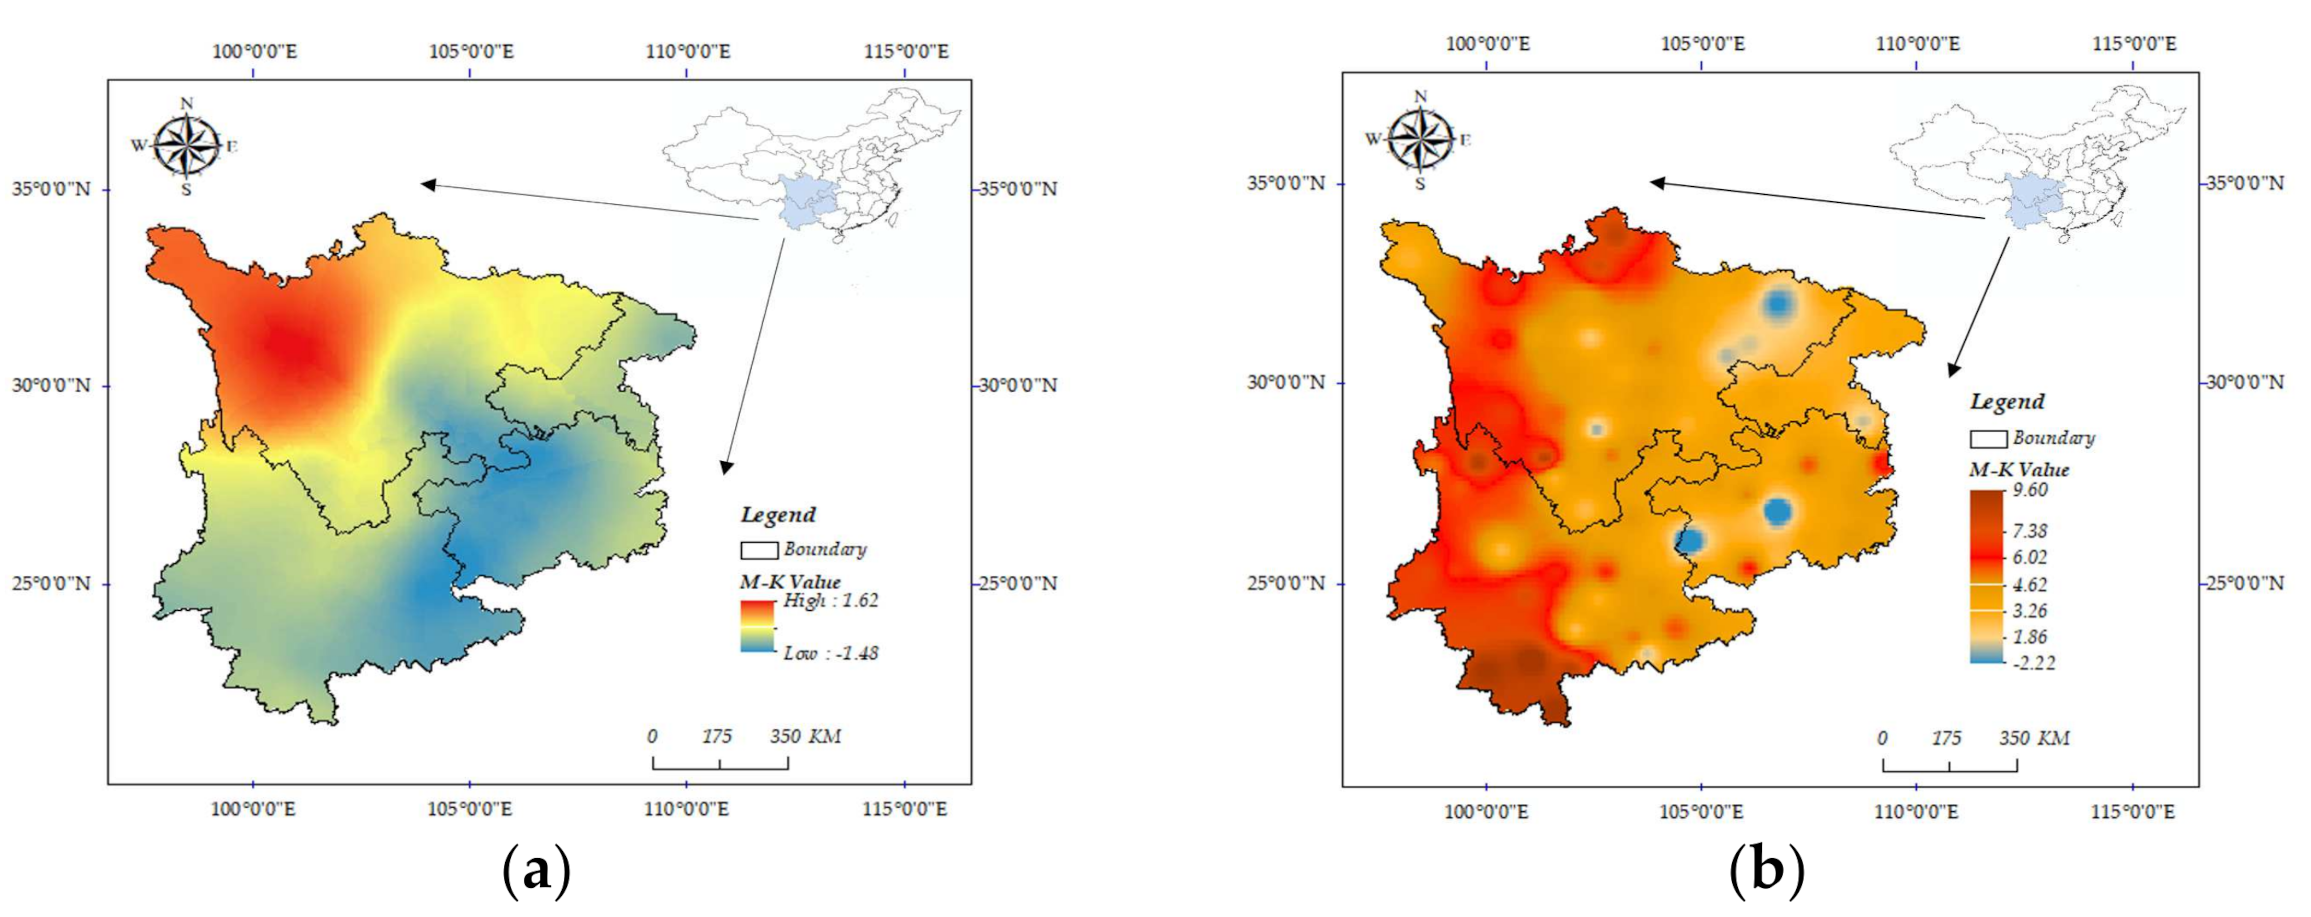
The different drought categories [43,44,45] and impacted sectors [45] make it difficult to define drought quantitatively [46], resulting in a variety of indices [47,48,49,50,51]. The choice of index and its factors is important when conducting drought analysis because they may lead to different conclusions [52,53]. Valipour et al. [54] pointed out that climate change can be analyzed more comprehensively by considering the trend of multiple climate factors. It is generally agreed that the most important factors associated with drought are temperature and precipitation [13]. Therefore, the M-K value [55] of precipitation and temperature is calculated. As shown in Figure 10a, the annual precipitation in Southwest China exhibits significant spatial variation. The precipitation in Guizhou, Yunnan and Chongqing shows an overall decreasing trend, while it increased significantly in the northwest of Sichuan. A general warming trend in temperature has been observed in almost the whole Southwest China since the 1950s, seen in Figure 10b. The most significant warming occurred in Southwestern Yunnan, where the increase in drought frequency has been most pronounced since the 21st century. Yu et al. [8] point out that significant drying trends occur in most parts of Southwest China mainly due to a decrease in precipitation and an increase in temperature. Sun et al. [36] reported that the drought occurrence and persistence during 2009–2011 can generally be attributed to precipitation reduction and evapotranspiration increment over Southwest China. In general, the main reason for the variations in frequency distribution of drought in different periods in Southwest China is the combined effect of the change of precipitation and evapotranspiration.
5. Conclusions
The overall trend of drought in Southwest China is as follows: the SPEI value from 1968 to 2018 shows a downward trend, with a linear trend rate of × 0. 074/10a, indicating that Southwest China has shown a trend towards drought. In terms of seasonal SPEI, the drought in autumn tends to be serious in Southwest China. In the 21st century, drought has become more and more serious. From spatial change, it can be seen that the increase of drought frequency in Southwest China is mainly concentrated in Yunnan Province. The annual variation of SRI shows that the runoff in Southwest China shows a decreasing trend. In the 1880s, the SRI value was greater than 0 as a whole, but in the 21st century, especially after 2005, the SRI value has been less than the previous minimum value at many times and less than 0 for a long time, which indicates that the situation of hydrological drought in Southwest China has become severe in the 21st century. The spatial distribution of hydrological stations where drought is intensifying is consistent with the drought aggravating areas obtained from SPEI analysis. Therefore, the increase and decrease of drought frequency obtained by SRI and SPEI are similar, but there are still differences in quantitative analysis.
The disaster areas of Yunnan and Guizhou show an increasing trend, while the disaster areas of Sichuan are greatly reduced, which makes the disaster areas of Southwest China also show a decreasing trend, especially in recent years. The values of the two drought indices decreased with the increase in the affected area, and the changes of SRI and affected area could be better fitted by linear equations.
This verifies the correlation between drought index and monsoon index based on the SPEI and SRI and combined with the Southwest monsoon index. Combined with the historical drought data, the characteristics of meteorological drought and hydrological drought in Southwest China in recent years were analyzed. The trend towards climate aridity is mainly caused by global warming, and hydrological drought is the result of climate change and human activities. In this paper, the relationship between the two indices is less commonly analyzed, and the transmission mechanism of meteorological drought to hydrological drought is not considered. Secondly, this paper only judges whether drought exists or not via the size of the index; it does not analyze drought characteristics such as intensity and duration. In addition, Southwest China has a large area and complex terrain, and the natural environment of the basin is also different in different administrative divisions. How to quantitatively analyze the impact of natural environment and human activities on drought needs further study.
Author Contributions
The research presented here was carried out in collaboration between all authors. H.T. processed the data and carried out the statistical analysis of results; T.W., P.S., S.Q., L.Z. and Q.L. provided sufficient data and many significant suggestions on the methodology and structure of the manuscript. All authors have read and agreed to the published version of the manuscript.
Funding
This research was funded by the National Natural Science Foundation of China (41730750).
Institutional Review Board Statement
Not applicable.
Informed Consent Statement
Not applicable.
Data Availability Statement
The study did not report any data.
Conflicts of Interest
The authors declare no conflict of interest.
References
- Zhou, L.; Yang, G. Ecological economic problems and development patterns of the arid inland river basin in Northwest China. Ambio 2006, 35, 316–318. [Google Scholar] [CrossRef] [PubMed]
- Sivakumar, M.V.K.; Das, H.P.; Brunini, O. Impacts of Present and Future Climate Variability and Change on Agriculture and Forestry in the Arid and Semi-Arid Tropics. Clim. Chang. 2005, 70, 31–72. [Google Scholar] [CrossRef]
- Su, B.; Huang, J.; Fischer, T.; Wang, Y.; Kundzewicz, Z.W.; Zhai, J.; Sun, H.; Wang, A.; Zeng, X.; Wang, G.; et al. Drought losses in China might double between the 1.5 °C and 2.0 °C warming. Proc. Natl. Acad. Sci. USA 2018, 115, 10600–10605. [Google Scholar] [CrossRef] [Green Version]
- Obasi, G.O.P. WMO‘s Role in the International Decade for Natural Disaster Reduction. Bull. Am. Meteorol. Soc. 1994, 75, 1655–1661. [Google Scholar] [CrossRef] [Green Version]
- Chen, Y.; Li, L.; Cui, M. Analysis of Meteorological Disasters and Its Impact based on Production Function. Int. J. Hybrid Inf. Technol. 2012, 5, 2. [Google Scholar]
- Li, X.; Li, Y.; Chen, A.; Gao, M.; Slette, I.; Piao, S. The impact of the 2009/2010 drought on vegetation growth and terrestrial carbon balance in Southwest China. Agric. For. Meteorol. 2019, 269–270, 239–248. [Google Scholar] [CrossRef]
- Yang, J.; Gong, D.; Wang, W.; Hu, M.; Mao, R. Extreme drought event of 2009/2010 over southwestern China. Theor. Appl. Clim. 2011, 115, 173–184. [Google Scholar] [CrossRef]
- Yu, M.; Li, Q.; Hayes, M.J.; Svoboda, M.D.; Heim, R.R. Are droughts becoming more frequent or severe in China based on the Standardized Precipitation Evapotranspiration Index: 1951–2010? Int. J. Clim. 2014, 34, 545–558. [Google Scholar] [CrossRef]
- Liu, M.; Xu, X.; Sun, A.Y.; Wang, K. Decreasing spatial variability of drought in southwest China during 1959–2013. Int. J. Clim. 2017, 37, 4610–4619. [Google Scholar] [CrossRef]
- Liu, X.; Xu, X.; Yu, M.; Lu, J. Hydrological Drought Forecasting and Assessment Based on the Standardized Stream Index in the Southwest China. Procedia Eng. 2016, 154, 733–737. [Google Scholar] [CrossRef] [Green Version]
- Qin, N.; Wang, J.; Chen, X.; Yang, G.; Liang, H. Impacts of climate change on regional hydrological regimes of the Wujiang River watershed in the Karst area, Southwest China. Geoenviron. Disasters 2015, 2, 10. [Google Scholar] [CrossRef] [Green Version]
- Bhunia, P.; Das, P.; Maiti, R. Meteorological Drought Study Through SPI in Three Drought Prone Districts of West Bengal, India. Earth Syst. Environ. 2019, 4, 43–55. [Google Scholar] [CrossRef]
- Vicente-Serrano, S.M.; Beguería, S.; Lopez-Moreno, I. A Multiscalar Drought Index Sensitive to Global Warming: The Standardized Precipitation Evapotranspiration Index. J. Clim. 2010, 23, 1696–1718. [Google Scholar] [CrossRef] [Green Version]
- Ahmad, M.; Sinclair, C.; Werritty, A. Log-logistic flood frequency analysis. J. Hydrol. 1988, 98, 205–224. [Google Scholar] [CrossRef]
- Mavromatis, T. Drought index evaluation for assessing future wheat production in Greece. Int. J. Clim. 2007, 27, 911–924. [Google Scholar] [CrossRef]
- Thornthwaite, C.W. An Approach toward a Rational Classification of Climate. Geogr. Rev. 1948, 38, 55. [Google Scholar] [CrossRef]
- Abramowitz, M.; Stegun, I.A.; Romer, R.H. Handbook of mathematical functions: With formulas, graphs and mathematical tables. Am. J. Phys. 1988, 56, 958. [Google Scholar] [CrossRef] [Green Version]
- McKee, T.B.; Doesken, N.J.; Kleist, J. The relationship of drought frequency and duration to time scales. In Proceedings of the 8th Conference on Applied Climatology, Anaheim, CA, USA, 17–22 January 1993; pp. 179–184. [Google Scholar]
- Li, J.; Zeng, Q. A unified monsoon index. Geophys. Res. Lett. 2002, 29, 115-1–115-4. [Google Scholar] [CrossRef]
- Li, J.; Feng, J.; Li, Y. A possible cause of decreasing summer rainfall in northeast Australia. Int. J. Climatol. 2012, 32, 995–1005. [Google Scholar] [CrossRef]
- Liu, Y.; Mu, Y.; Chen, K.; Li, Y.; Guo, J. Daily Activity Feature Selection in Smart Homes Based on Pearson Correlation Coefficient. Neural Process. Lett. 2020, 51, 1771–1787. [Google Scholar] [CrossRef]
- Wang, H.; Shi, W.; Chen, X. The Statistical Significance Test of Regional Climate Change Caused by Land Use and Land Cover Variation in West China. Adv. Atmos. Sci. 2006, 23, 355–364. [Google Scholar] [CrossRef]
- Cox, D. Statistical significance tests. Diagn. Histopathol. 2016, 22, 243–245. [Google Scholar] [CrossRef]
- Hansen, J.P. Quality Research Toolbox: CANT MISS: Conquer Any Number Task by Making Important Statistics Simple. Part 6. Tests of Statistical Significance (z Test Statistic, Rejecting the Null Hypothesis, p value), t Test, z Test for Proportions, Statistical Significance Versus Meaningful Difference. J. Healthc. Qual. 2004, 26, 43–53. [Google Scholar] [CrossRef]
- Johnson, L.A. Analysis of variance of parameter estimates: F tests and t tests. Anal. Biochem. 1992, 206, 195–201. [Google Scholar] [CrossRef]
- Zenhausern, R. The A test: A simplification of the t test for correlated samples. Psychon. Sci. 2013, 7, 288. [Google Scholar] [CrossRef] [Green Version]
- Wang, L.; Huang, G.; Chen, W.; Zhou, W.; Wang, W. Wet-to-dry shift over Southwest China in 1994 tied to the warming of tropical warm pool. Clim. Dyn. 2018, 51, 3111–3123. [Google Scholar] [CrossRef]
- Jiaonan, L.; Yungang, L. Temporal and Spatial Characteristics of Droughts over Yunnan Province During 1961–2012. Mt. Res. 2016, 1, 19–27. [Google Scholar] [CrossRef]
- Qing, P.; Ping, W. Drought and Flood Change Characteristics Based on RDI Index from 1960 to 2013 in Yunnan Province. Resour. Environ. Yangtza Basin 2018, 27, 185–196. [Google Scholar] [CrossRef]
- Li, Y.; Wang, Z.; Zhang, Y.; Li, X.; Huang, W. Drought variability at various timescales over Yunnan Province, China: 1961–2015. Theor. Appl. Clim. 2019, 138, 743–757. [Google Scholar] [CrossRef]
- Liu, C.; Yang, C.; Yang, Q.; Wang, J. Spatiotemporal drought analysis by the standardized precipitation index (SPI) and standardized precipitation evapotranspiration index (SPEI) in Sichuan Province, China. Sci. Rep. 2021, 11, 1280. [Google Scholar] [CrossRef]
- Cheng, Q.; Gao, L.; Chen, Y.; Liu, M.; Deng, H.; Chen, X. Temporal-Spatial Characteristics of Drought in Guizhou Province, China, Based on Multiple Drought Indices and Historical Disaster Records. Adv. Meteorol. 2018, 2018, 1–22. [Google Scholar] [CrossRef]
- Xiao, L.; Chen, X.; Zhang, R.; Zhang, Z. Spatiotemporal Evolution of Droughts and Their Teleconnections with Large-Scale Climate Indices over Guizhou Province in Southwest China. Water 2019, 11, 2104. [Google Scholar] [CrossRef] [Green Version]
- Zhang, C. Moisture sources for precipitation in Southwest China in summer and the changes during the extreme droughts of 2006 and 2011. J. Hydrol. 2020, 591, 125333. [Google Scholar] [CrossRef]
- Lü, J.; Ju, J.; Ren, J.; Gan, W. The influence of the Madden-Julian Oscillation activity anomalies on Yunnan’s extreme drought of 2009–2010. Sci. China Earth Sci. 2012, 55, 98–112. [Google Scholar] [CrossRef]
- Sun, S.; Li, Q.; Li, J.; Wang, G.; Zhou, S.; Chai, R.; Hua, W.; Deng, P.; Wang, J.; Lou, W. Revisiting the evolution of the 2009–2011 meteorological drought over Southwest China. J. Hydrol. 2019, 568, 385–402. [Google Scholar] [CrossRef]
- Jia, Y.; Zhang, B.; Ma, B. Daily SPEI Reveals Long-term Change in Drought Characteristics in Southwest China. Chin. Geogr. Sci. 2018, 28, 680–693. [Google Scholar] [CrossRef] [Green Version]
- Pradhan, N.S.; Su, Y.; Fu, Y.; Zhang, L.; Yang, Y. Analyzing the Effectiveness of Policy Implementation at the Local Level: A Case Study of Management of the 2009–2010 Drought in Yunnan Province, China. Int. J. Disaster Risk Sci. 2017, 8, 64–77. [Google Scholar] [CrossRef] [Green Version]
- Wang, L.; Zhang, X.; Wang, S.; Salahou, M.K.; Fang, Y. Analysis and Application of Drought Characteristics Based on Theory of Runs and Copulas in Yunnan, Southwest China. Int. J. Environ. Res. Public Health 2020, 17, 4654. [Google Scholar] [CrossRef]
- Cheng, Q.; Gao, L.; Zhong, F.; Zuo, X.; Ma, M. Spatiotemporal variations of drought in the Yunnan-Guizhou Plateau, southwest China, during 1960–2013 and their association with large-scale circulations and historical records. Ecol. Indic. 2020, 112, 106041. [Google Scholar] [CrossRef]
- Prudhomme, C.; Giuntoli, I.; Robinson, E.; Clark, D.B.; Arnell, N.W.; Dankers, R.; Fekete, B.M.; Franssen, W.; Gerten, D.; Gosling, S.N.; et al. Hydrological droughts in the 21st century, hotspots and uncertainties from a global multimodel ensemble experiment. Proc. Natl. Acad. Sci. USA 2014, 111, 3262–3267. [Google Scholar] [CrossRef] [Green Version]
- Wanders, N.; Wada, Y.; Van Lanen, H.A.J. Global hydrological droughts in the 21st century under a changing hydrological regime. Earth Syst. Dyn. 2015, 6, 1–15. [Google Scholar] [CrossRef] [Green Version]
- Wilhite, D.A.; Glantz, M.H. Understanding: The Drought Phenomenon: The Role of Definitions. Water Int. 1985, 10, 111–120. [Google Scholar] [CrossRef] [Green Version]
- Mishra, A.K.; Singh, V.P. A review of drought concepts. J. Hydrol. 2010, 391, 202–216. [Google Scholar] [CrossRef]
- van Genderen, J. Drought: Past problems and future scenarios. Int. J. Digit. Earth 2012, 5, 456–457. [Google Scholar] [CrossRef]
- Lloyd-Hughes, B. The impracticality of a universal drought definition. Theor. Appl. Clim. 2014, 117, 607–611. [Google Scholar] [CrossRef] [Green Version]
- Heim, R.R. A Review of Twentieth-Century Drought Indices Used in the United States. Bull. Am. Meteorol. Soc. 2002, 83, 1149–1166. [Google Scholar] [CrossRef] [Green Version]
- Keyantash, J.; Dracup, J.A. The Quantification of Drought: An Evaluation of Drought Indices. Bull. Am. Meteorol. Soc. 2002, 83, 1167–1180. [Google Scholar] [CrossRef]
- Tsakiris, G.; Nalbantis, I.; Vangelis, H.; Verbeiren, B.; Huysmans, M.; Tychon, B.; Jacquemin, I.; Canters, F.; Vanderhaegen, S.; Engelen, G.; et al. A System-based Paradigm of Drought Analysis for Operational Management. Water Resour. Manag. 2013, 27, 5281–5297. [Google Scholar] [CrossRef]
- Dai, A. Drought under global warming: A review. WIREs Clim. Chang. 2010, 2, 45–65. [Google Scholar] [CrossRef] [Green Version]
- Van Loon, A.F. Hydrological drought explained. WIREs Water 2015, 2, 359–392. [Google Scholar] [CrossRef]
- Burke, E.J.; Brown, S.J. Evaluating Uncertainties in the Projection of Future Drought. J. Hydrometeorol. 2008, 9, 292–299. [Google Scholar] [CrossRef]
- Sheffield, J.; Wood, E.F.; Roderick, M.L. Little change in global drought over the past 60 years. Nature 2012, 491, 435–438. [Google Scholar] [CrossRef] [PubMed]
- Valipour, M.; Bateni, S.; Sefidkouhi, M.G.; Raeini-Sarjaz, M.; Singh, V. Complexity of Forces Driving Trend of Reference Evapotranspiration and Signals of Climate Change. Atmosphere 2020, 11, 1081. [Google Scholar] [CrossRef]
- Hamed, K.; Rao, A.R. A modified Mann-Kendall trend test for autocorrelated data. J. Hydrol. 1998, 204, 182–196. [Google Scholar] [CrossRef]
Figure 1.
Geographical location and distribution of meteorological and hydrological stations in the study area.
Figure 1.
Geographical location and distribution of meteorological and hydrological stations in the study area.

Figure 2.
The annual variation of SPEI (a) and frequency curve of SPEI-12 in different periods (b). The solid line in (a) shows the change of SPEI in given years, and the dotted line shows the downward trend of SPEI. The three lines in (b), respectively, show the frequency curves of SPEI in three time periods, indicating the probability that SPEI is lower than a certain value in the time period.

Figure 3.
The annual variation of SPEI in spring (a), summer (b), autumn (c) and winter (d) in Southwest China.
Figure 3.
The annual variation of SPEI in spring (a), summer (b), autumn (c) and winter (d) in Southwest China.

Figure 4.
The relationship between SPEI and SASMI in Southwest China.

Figure 5.
Frequency distribution of meteorological drought in different periods. This shows the distribution of drought frequency before the 21st century (a) and since the 21st century (b), as well as the change of drought frequency between the two periods (c).
Figure 5.
Frequency distribution of meteorological drought in different periods. This shows the distribution of drought frequency before the 21st century (a) and since the 21st century (b), as well as the change of drought frequency between the two periods (c).

Figure 6.
The variation of SRI in Wanxian hydrological station: The change of SRI-1 (a), SRI-3 (b), SRI-12 (c), SRI-24 (d).
Figure 6.
The variation of SRI in Wanxian hydrological station: The change of SRI-1 (a), SRI-3 (b), SRI-12 (c), SRI-24 (d).

Figure 7.
The frequency of drought at hydrological stations. The blue and red bar charts respectively show the frequency before the 21st century and during the 21st century.
Figure 7.
The frequency of drought at hydrological stations. The blue and red bar charts respectively show the frequency before the 21st century and during the 21st century.

Figure 8.
The annual variation trend of drought affected area (a) and the decadal variation of drought affected area in different regions (b), i.e., Southwest China, Sichuan, Guizhou and Yunnan.
Figure 8.
The annual variation trend of drought affected area (a) and the decadal variation of drought affected area in different regions (b), i.e., Southwest China, Sichuan, Guizhou and Yunnan.

Figure 9.
Relationship between drought affected area and the two indices: (a) is the meteorological drought index and (b) is the hydrological drought index.
Figure 9.
Relationship between drought affected area and the two indices: (a) is the meteorological drought index and (b) is the hydrological drought index.

Figure 10.
The M-K value of precipitation and temperature: (a) is the M-K value of annual precipitation from 1968 to 2017 and (b) is the M-K value of annual average temperature from 1951 to 2018.
Figure 10.
The M-K value of precipitation and temperature: (a) is the M-K value of annual precipitation from 1968 to 2017 and (b) is the M-K value of annual average temperature from 1951 to 2018.


Table 1.
Information on six hydrological stations and basins.
| Basins | Hydrological Stations | Longitude | Latitude | Area (km2) | Average Annual Runoff (108 m3) |
|---|---|---|---|---|---|
| YJHB | Yunjinghong | 100°47′ E | 22°1′ N | 72,625 | 564 |
| WTQB | Wutongqiao | 103°49′ E | 29°20′ N | 120,905 | 766 |
| SHB | Sanhui | 106°29′ E | 30°1′ N | 33,155 | 111 |
| WLB | Wulong | 107°43′ E | 29°19′ N | 76,101 | 487 |
| JBJB | Jiangbianjie | 103°36′ E | 24°3′ N | 31,608 | 60 |
| WXB | Wanxian | 108°25′ E | 30°45′ N | 630,822 | 4066 |
Table 2.
Drought index ranks of SPEI and SRI.
| Grade | Degree | SPEI/SRI |
|---|---|---|
| 1 | No drought | −0.5< |
| 2 | Light drought | −1.0–−0.5 |
| 3 | Moderate drought | −1.5–−1.0 |
| 4 | Severe drought | −2.0–−1.5 |
| 5 | Extreme drought | ≤−2.0 |
Table 3.
Description of correlation and its range of value.
| Value Range | Correlation Description |
|---|---|
| 0.8–1.0 | Very strong correlation |
| 0.6–0.8 | Strong correlation |
| 0.4–0.6 | Moderate correlation |
| 0.2–0.4 | Weak correlation |
| 0.0–0.2 | Very weak correlation or no correlation |
Table 4.
Statistical significance test of correlation between SPEI and SASMI.
| Statistics | r | n | α | t | |
|---|---|---|---|---|---|
| 0.28 | 51 | 0.05 | 2.023 | 1.676 |
Table 5.
Statistical significance test of correlation between affected area and drought indices.
| Statistics | r | n | α | t | |
|---|---|---|---|---|---|
| Between affected area and SPEI | −0.01 | 45 | 0.05 | −0.085 | 1.679 |
| Between affected area and SRI | −0.29 | 45 | 0.05 | −1.973 | 1.679 |
Publisher’s Note: MDPI stays neutral with regard to jurisdictional claims in published maps and institutional affiliations. |
© 2021 by the authors. Licensee MDPI, Basel, Switzerland. This article is an open access article distributed under the terms and conditions of the Creative Commons Attribution (CC BY) license (https://creativecommons.org/licenses/by/4.0/).
Share and Cite
MDPI and ACS Style
Tang, H.; Wen, T.; Shi, P.; Qu, S.; Zhao, L.; Li, Q. Analysis of Characteristics of Hydrological and Meteorological Drought Evolution in Southwest China. Water 2021, 13, 1846. https://doi.org/10.3390/w13131846
AMA Style
Tang H, Wen T, Shi P, Qu S, Zhao L, Li Q. Analysis of Characteristics of Hydrological and Meteorological Drought Evolution in Southwest China. Water. 2021; 13(13):1846. https://doi.org/10.3390/w13131846
Chicago/Turabian StyleTang, Han, Tong Wen, Peng Shi, Simin Qu, Lanlan Zhao, and Qiongfang Li. 2021. "Analysis of Characteristics of Hydrological and Meteorological Drought Evolution in Southwest China" Water 13, no. 13: 1846. https://doi.org/10.3390/w13131846
Note that from the first issue of 2016, this journal uses article numbers instead of page numbers. See further details here.