
Burrow Densities of Primary Burrowing Crayfishes in Relation to Prescribed Fire and Mechanical Vegetation Treatments


1
USDA Forest Service, Southern Research Station, Center for Bottomland Hardwoods Research, 1000 Front St., Oxford, MS 38655, USA
2
US Fish and Wildlife Service, Mississippi Sandhill Crane National Wildlife Refuge, 7200 Crane Lane, Gautier, MS 39553, USA
3
Department of Ecology and Genetics, Animal Ecology, Uppsala University, Norbyvägen 18D, SE-75236 Uppsala, Sweden
*
Author to whom correspondence should be addressed.
Water 2021, 13(13), 1854; https://doi.org/10.3390/w13131854
Submission received: 27 May 2021
/
Revised: 28 June 2021
/
Accepted: 30 June 2021
/
Published: 2 July 2021
(This article belongs to the Special Issue Aquatic Biodiversity and Forests)
Abstract
:Fire suppression and other factors have drastically reduced wet prairie and pine savanna ecosystems on the Coastal Plain of the southeastern United States. Restoration of these open-canopy environments often targets one or several charismatic species, and semi-aquatic species such as burrowing crayfishes are often overlooked in these essentially terrestrial environments. We examined the relationship between primary burrowing crayfishes and three vegetation treatments implemented over at least the past two decades in the Mississippi Sandhill Crane National Wildlife Refuge. Vegetation in the 12 study sites had been frequently burned, frequently mechanically treated, or infrequently managed. Creaserinus spp., primarily C. oryktes, dominated the crayfish assemblage in every site. We counted crayfish burrow openings and coarsely categorized vegetation characteristics in 90, 0.56-m2 quadrats evenly distributed among six transects per site. The number of active burrow openings was negatively, exponentially related to both the percent cover of woody vegetation and the maximum height of woody vegetation in quadrats, and to the number of trees taller than 1.2 m per transect, indicating that woody plant encroachment was detrimental to the crayfishes. Results were consistent with several other studies from the eastern US, indicating that some primary burrowing crayfishes are habitat specialists adapted to open-canopy ecosystems.
1. Introduction
In the southeastern US, frequent fire—with return intervals of 1–3 years—maintained millions of acres of open longleaf pine (Pinus palustris Mill.) stands [1], characterized by species-rich bunchgrass-dominated understories free of hardwoods and shrubs [2]. These pine savannas and their associated embedded ecosystems, such as pitcher plant (Sarracenia spp.) bogs, wetlands, and prairies, were historically one of North America’s most species-rich ecosystems and remain global biodiversity hotspots [3,4,5]. Longleaf pine stands host diverse faunal communities that evolved in, and often depend upon, habitats with relatively open canopies and low tree basal areas [6]. The fauna include charismatic endangered species such as the red-cockaded woodpecker (Dryobates borealis) and gopher tortoise (Gopherus polyphemus), as well as many less-familiar species, including burrowing crayfishes (Cambaridae) [5]. Longleaf pine ecosystems are critically endangered [7], with less than 4% of their pre-historic distribution remaining [1,4]; however, remnants of these ecosystems, and other open pine savannas and prairies in the southeastern US, still harbor diverse communities [3,7,8].
The fire frequencies necessary to shape and maintain southeastern pine savannas pre-dated fires set by humans over the past 15,000 years, occurring instead over evolutionary time scales, and so allowing distinct biotas to develop in these ecosystems [1,3,9,10]. However, within a few years of fire exclusion, mesophytic pines, hardwoods, and shrubs usually encroach [1]. Logging and then fire suppression were major contributors to the loss of longleaf ecosystems, and fire is central to their restoration [4,8]. The reintroduction of frequent fire is expected to benefit entire fire-adapted ecological communities [6]. However, to ensure successful restoration of faunal communities, scientists need to assess how different species respond to burning and other management activities [4].
The Mississippi Sandhill Crane National Wildlife Refuge (hereafter, Refuge), located in Mississippi’s Gulf Coastal Plain, was established in 1975 to conserve the last remaining population of Mississippi Sandhill Crane (Grus canadensis pulla), a non-migratory endangered subspecies [11,12]. Mississippi sandhill cranes require open habitat—prairie or savanna—and managers have used prescribed burning to restore such ecosystems after decades of fire suppression. Where unable to burn frequently enough or to produce adequately hot fires, mechanical methods—such as mulching and mowing—are sometimes employed on a smaller scale to reduce woody vegetation. As Refuge management goals broadened to include more species that depend upon the Refuge’s open-canopy habitats, managers sought to understand how their vegetation management practices affected several at-risk burrowing crayfishes thought to occur on the Refuge.
Although studies of more and more taxa support the concept that fire benefits the endemic fauna in pine savannas, few have focused on relationships between burrowing crayfishes and fire-maintained landscapes, e.g., [10]. Primary burrowing crayfishes dig complex burrows that they occupy for the majority of their lives [13]. Most primary burrowing species excavate down to the water table, at least during the wet season, but are rarely associated with open water; therefore, they are semi-aquatic species that often inhabit terrestrial ecosystems. In contrast to primary burrowers, secondary burrowers construct simpler burrows and more evenly divide their time between burrows and open water. Some primary burrowers are associated with open-canopy habitats [14], and Creaserinus gordoni, a primary burrower endemic to Mississippi, is one of many sensitive species associated with longleaf pine ecosystems [8].
Our goal in this study was to assess whether crayfish burrow densities differed among sites with differing vegetation treatments: frequent prescribed fire, frequent mowing or mulching, or infrequent fire. We assumed that the water table was relatively high throughout much of the Refuge and so was not a major factor driving differences in crayfish densities among sites; therefore, canopy cover was a logical candidate as a driver of crayfish densities. Our objectives were to determine: (1) whether, and how, vegetation characteristics and burrow densities differed among units with three vegetation management histories, and (2) which, if any, vegetation characteristics correlated with burrow densities.
2. Materials and Methods
2.1. Study Area and Vegetation Treatments
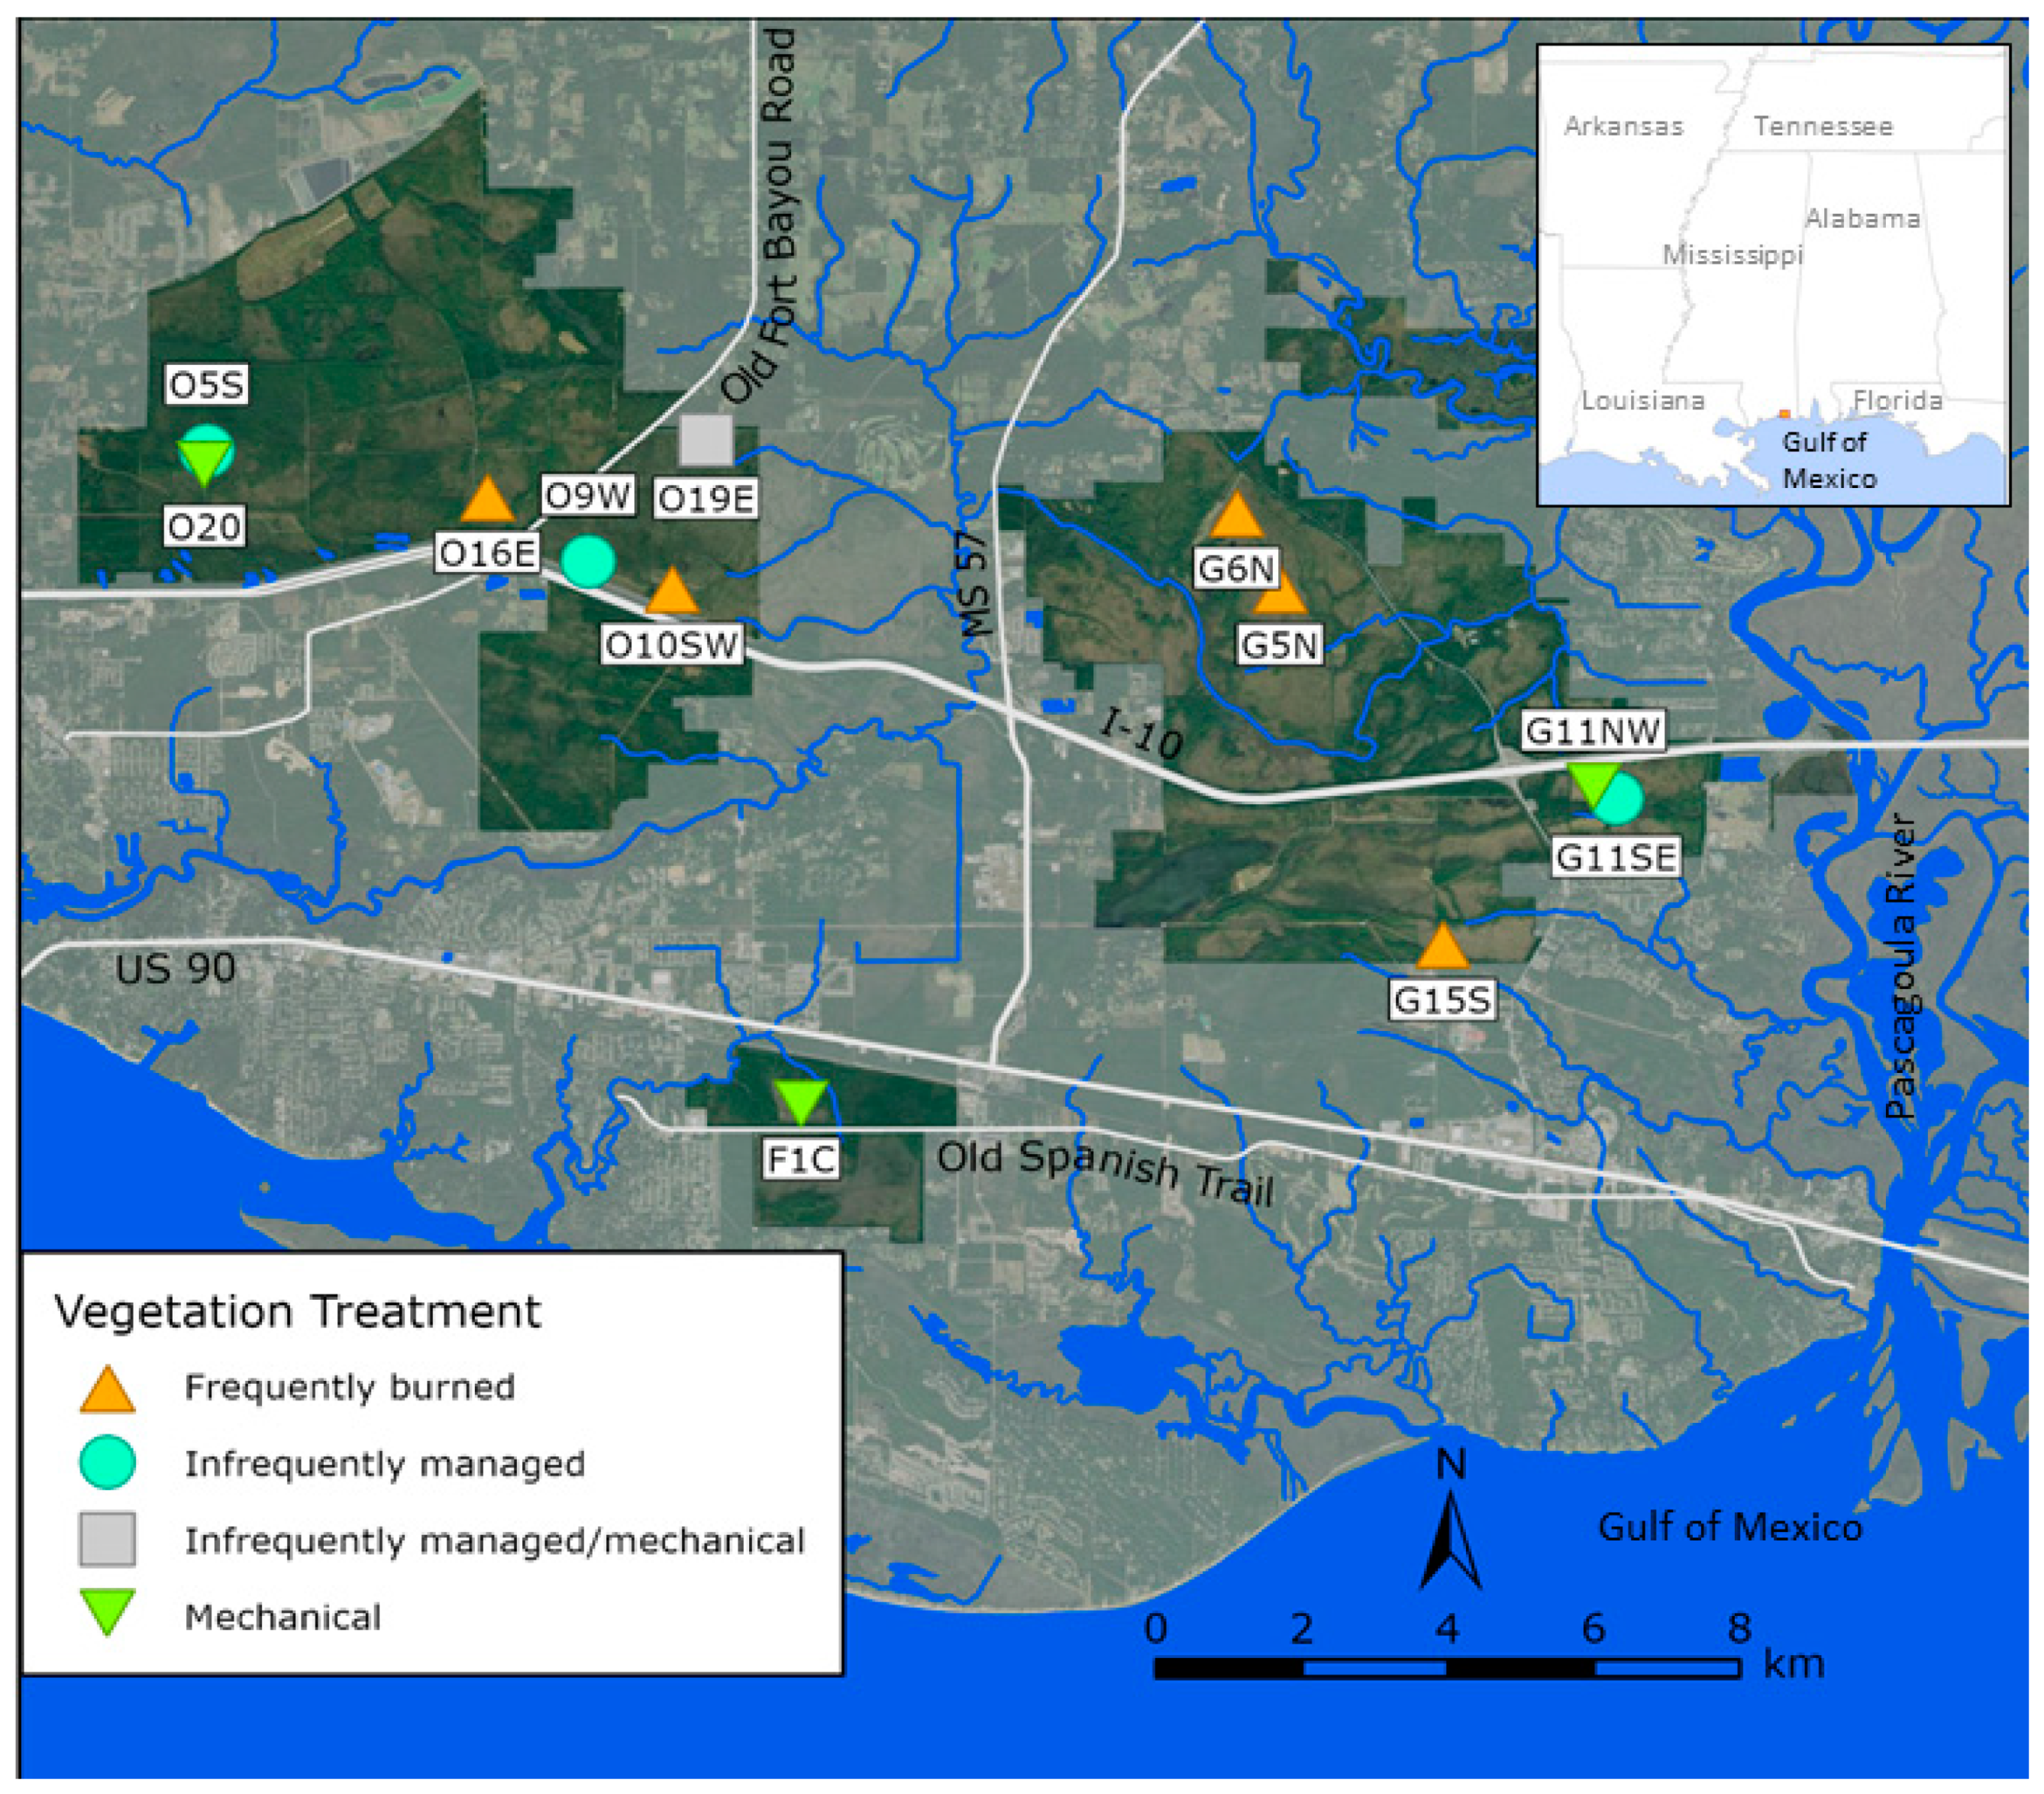
The Refuge is located less than 15 km from the Gulf of Mexico, in Jackson County, Mississippi (Figure 1). The 8000-ha Refuge is characterized by a temperate climate, flat and low (mostly <10 m above sea level) topography, and poorly drained soils [15]. Primary habitat types include coastal pine savannas, pine flatwoods/scrub, wooded swamps, and tidal marsh. Wet pine savannas comprise approximately half of the Refuge and are characterized by a species-rich groundcover, low-growing shrubs, and scattered trees [15,16,17]. These ecosystems are also known as pine flatwoods, pitcher plant bogs, pitcher plant prairies, grass-sedge bogs, and crawfish flats [18].
Wet pine savannas tend to be underlain by relatively shallow (<50 cm deep) clay soils that create perched water tables [18,19]. However, Refuge sites with some wetland characteristics, such as obligate wetland plant species, do not necessarily have hydric soil morphologies (i.e., they are neither anaerobic nor saturated for >14 consecutive days during the growing season).
The three vegetation treatment categories were based on the documented histories of management compartments in the Refuge. “Frequently burned” compartments had been burned every two to three years, on average, since at least the early 1990s, recreating the pre-industrial burn interval [1]. Some frequently burned compartments also had some or all trees removed mechanically at some time since Refuge establishment. “Mechanically treated” compartments included one of three activities: cutting and mulching most woody vegetation with a Gyro Trac machine and leaving the mulch on the ground (site F1C); annual or semi-annual mowing (site G11NW); or mowing (two to three times per year) some years and tilling and planting as a food plot for cranes other years (site O20). At the time of the study, site O20 had not been managed as a food plot for several years, but it had been sprayed with glyphosate and imazapyr to control invasive cogongrass (Imperata cylindrica). Mechanically treated sites were also burned, but neither frequently nor recently (Table 1). “Infrequently managed” compartments were typically burned less than every three years over the past two decades, with an average burn interval across the three sites of 5.7 years. Since the early 1990′s, two infrequently managed sites (G11SE and O5S) had only been burned, whereas the third site (O9W) had also had trees felled by chainsaw in 2005.
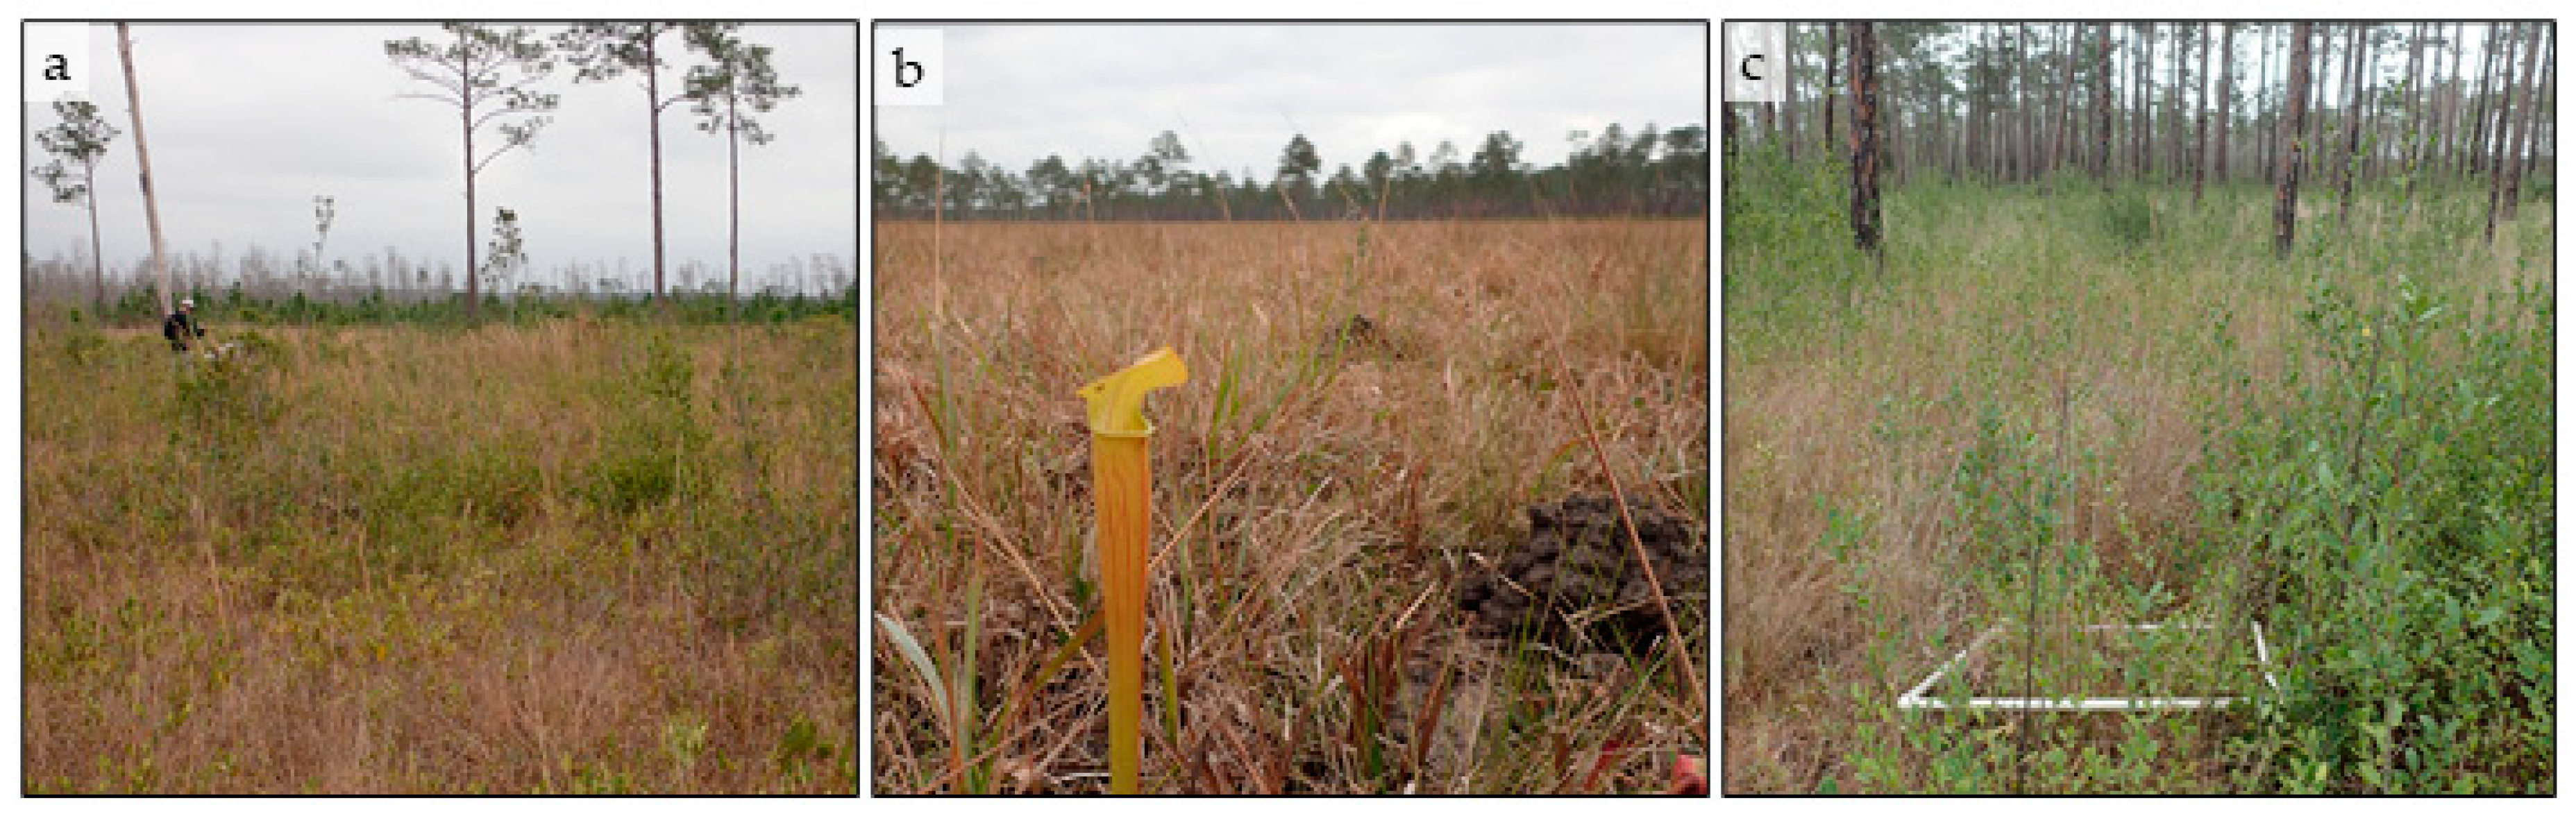
Frequently burned compartments were typically open savannas dominated by a highly diverse herbaceous ground layer and had <10% tree cover (Figure 2a). Shrub cover in those compartments was typically low but higher in wet areas where surface fires did not burn evenly. Mechanically treated compartments tended to be smaller than frequently burned compartments but mimicked the open canopies of the latter (Figure 2b). Regularly mowed compartments had greatly reduced woody plant cover but also may have had reduced herbaceous diversity. Infrequently managed compartments were pineland scrub in which Pinus elliotti comprised an overstory more than 20%, sometimes exceeding 50% (Figure 2c). Shrub species were 1–3 m tall and became the dominant vegetative component [17].
2.2. Site Selection
Study site selection criteria included compartment management history (e.g., frequency of prescribed burning), distribution across the Refuge, and access. We avoided areas where our activity was likely to disturb cranes. Treatments were distributed across study sites as follows: frequently burned (N = 5), mechanically treated (N = 3), or infrequently managed (N = 3). One additional site, O19E, was excluded from comparisons among treatment categories because in addition to infrequent burning, vegetation had been removed by a skid steer lopper in 2011, making it not comparable to the three other infrequently managed sites. Unmanaged and infrequently managed compartments with dense mid- and understory vegetation occurred on the Refuge but were not included in the study because tall and dense woody vegetation prevented placement of the quadrats. Compartments containing study sites ranged from 47 to 170 ha (mean = 95 ha), but the two pasture sites each occupied only a small portion of their management compartment (Table 1).
2.3. Vegetation, Burrow and Crayfish Sampling
We sampled during three weeks in late winter/early spring 2017: 23–27 January, 6–10 February, and 27 February–3 March (Table 1). Using transects and quadrats, we systematically sampled vegetation and crayfish burrow densities in four sites per week. In each systematically sampled site, we established six transects (A–F) approximately 100–150 m long and roughly perpendicular to the access road. Transects were spaced out across each compartment. In larger sites, transects were staggered, with starting points at varying distances from the road, in order to capture as much intra-compartment variation as possible. We assessed 15 quadrats per transect (90 per site), for a total sampling effort of 1080 quadrats along 72 transects. Quadrats were delineated by 0.75 × 0.75 m squares of polyvinyl chloride (PVC) piping (Figure 2c), so we sampled 8.44 m2 per transect. We haphazardly tossed quadrats along alternating sides of a transect, with a minimum distance along the transect of 6.6 m between quadrats. Quadrats landing near fire ant (Solenopsis spp.) mounds were re-thrown.
Within each quadrat, we visually estimated the percentage (to the nearest 10%) of the quadrat covered by: grasses/forbs; woody plants; leaves or small woody debris (SWD, <10 cm diameter); large woody debris (LWD, >10 cm diameter); and bare soil. Those percentages added to 100. We then measured the tallest herbaceous and woody vegetation in each quadrat to the nearest centimeter. After completing quadrats along a transect, we counted the number of trees shorter than 1.2 m and the number taller than 1.2 m within 2 m to either side of each transect. Using handheld GPS receivers, we obtained coordinates (as either decimal degrees [WGS 84 datum] or UTM coordinates [NAD 83 datum]) at the beginning and end of each transect and later obtained transect lengths using GIS software (ArcGIS Pro Version 2.4.19948).
We then counted the number of burrow entrances in each quadrat. If a burrow intersected the edge of the quadrat, it was included. Burrow entrances were classified as “active” or “inactive,” with three categories of each. Active burrow entrances were classified as having either chimneys, fresh mud around the opening, or “open-clear” entrances. Open-clear entrances had no signs of recent soil movement, but the burrow openings were clear of detritus and spider webs. Inactive burrows had old mounds, sealed entrances, or “open-obscured” entrances. Unlike chimneys, old mounds were often shaped like eroded volcanoes without individual mud balls. A sealed entrance was indicated by a flat area of bare soil. Open-obscured entrances were at least partially obstructed by leaves, debris, or spider webs. The designation of active or inactive entrances was not foolproof, and crayfish may have occupied burrows with entrances that appeared to be inactive. Additionally, distinguishing between a sealed burrow and other small soil disturbances was sometimes difficult. We flagged up to two burrow openings per quadrat for later crayfish sampling.
We sampled crayfishes using active and passive methods that were standardized across sites, so the resulting crayfish numbers provided relative abundances within and across sites. Active sampling included burrow excavation and suctioning, and passive sampling included trapping with mist net traps [20] and modified Norrocky traps [21] of three diameters: small (3.2 cm), medium (3.8 cm), and large (5.1 cm). However, because of biases that we found associated with crayfish sampling, we defaulted to burrow entrance data for assessing relationships between vegetation and crayfish densities, using numbers of active burrow entrances as indices of crayfish densities [22]. Here, we report only relative abundances of crayfish species captured by site.
2.4. Analyses
Numbers of trees per transect were calculated per meter of transect length. Numbers of burrow openings were summed over each transect and also calculated per m2. We only present analyses based on numbers of active burrow openings because: (1) our designation of active burrows seemed more reliable than of inactive burrows, and (2) the number of active and inactive burrow openings, summed over transects, were correlated (Pearson’s r = 0.36, N = 72, p-value = 0.002) and provided the same qualitative results in comparisons to vegetation characteristics.
Our first research question was whether vegetation, as we measured it, differed among the three treatments. We used principal coordinates analysis (PCA) and an ordination plot to qualitatively answer this question (PC-Ord for Windows v.7.08) [23]. Input data included quadrat vegetation data (excluding percent bare soil and percent large wood, due to the large numbers of zeroes), averaged by transect, and the number of short (<1.2 m) and tall (>1.2 m) trees per m of transect length. We used a randomization approach, Rnd-Lambda, with 999 randomizations to determine the number of PCA axes to interpret [24,25].
Our second question was whether the number of active burrow openings differed among treatments. We addressed this using a mixed-effects model (below), where the response variable was the number of active burrow openings per transect (8.44 m2). The response variable was square-root transformed in order to satisfy the homoscedasticity (equal variance of residuals) assumption of linear regression. The predictors included “vegetation treatment” as a fixed effect, and “site” as a random effect. The random effect accounted for the fact that transect sampling at each site did not represent independent replicates. To perform mixed-effects modeling, we used the “lme4” package in the R programming environment [26,27].
Sqrt (active burrows)~1 + veg. treatment + (1|Site)
For the mixed-effects model, we obtained least-squares means (“emmeans” package in R [28]), and in lieu of R2, we calculated pseudo-R2 (r.squaredGLMM function of the “MuMIn” package [29]). The means of the three treatment categories were back-transformed from the square-root transformation and then compared using Tukey’s test. To adjust for multiple comparisons, we applied the Sidak p-value correction (1 − (1 − p)^3, where 3 was the number of pairwise comparisons). We excluded transects in the site (O19E) that could not be placed in a single treatment category.
Finally, we asked whether the numbers of active burrow openings per transect were associated with measured vegetation characteristics, and if so, which vegetation variables were most strongly related to the burrow numbers. We used curve fitting (SPSS Statistics 25), with both linear and exponential equations, to evaluate the relationships. Data were summarized by site because when assessing the data by transects, zero values prevented the use of exponential equations. We summed burrow openings within transects and then averaged them within sites.
3. Results
We captured 152 crayfishes from the 12 sites. Creaserinus spp. constituted 91.4% of the crayfishes captured, and the remaining 8.6% were Procambarus fitzpatricki (Table 1). Most or all of the Creaserinus spp. were C. oryktes; however, due to uncertainties in taxonomy and identification, we cannot rule out the possibility that some were C. danielae. Work is ongoing to clarify the taxonomy and characteristics of the two species.
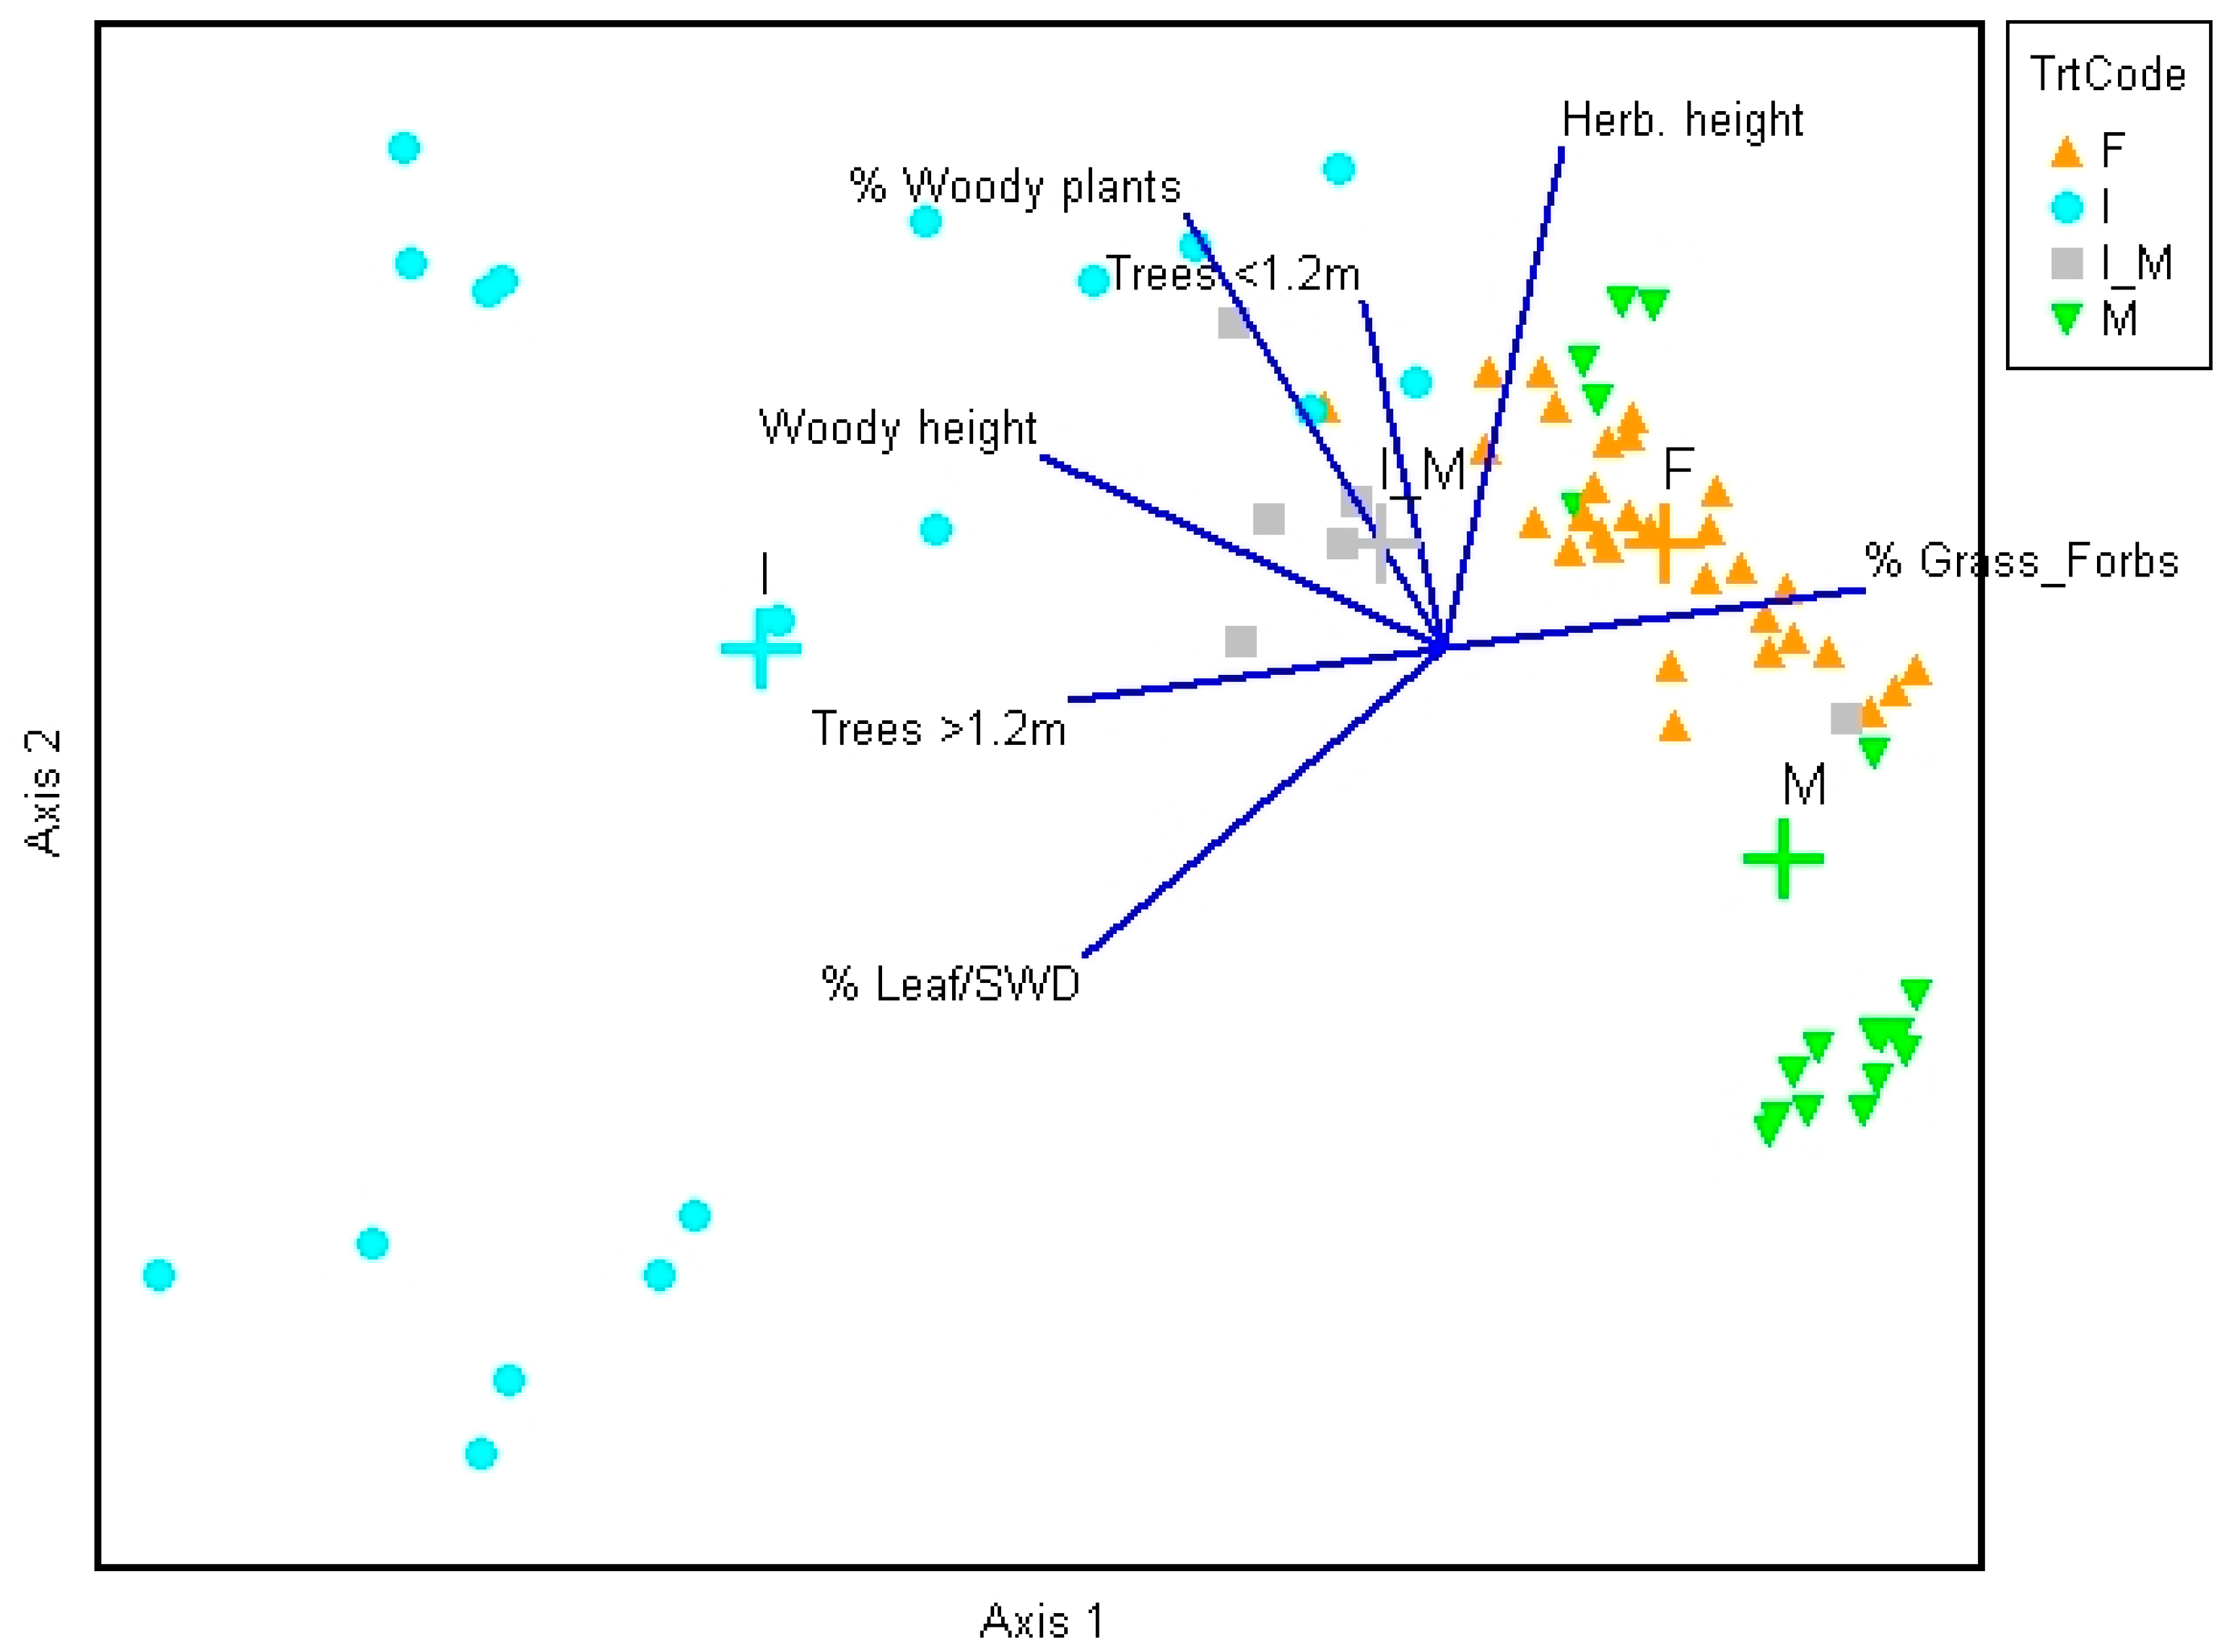
Vegetation characteristics differed between frequently and infrequently managed sites (Figure 3; Supplementary Table S1). The PCA resulted in two interpretable axes (Rnd-lambda p-values = 0.001; Supplementary Table S2). The first axis explained 52% of the variation in the data, almost completely separating the infrequently managed sites from the two categories of frequently managed sites (Figure 3). Transects in frequently burned and mechanically treated sites had a higher percentage of grasses and forbs, whereas those in infrequently managed sites had taller woody vegetation, more trees taller than 1.2 m, and a higher percentage of leaves/small wood and woody plants (Table 2; Figure 3). Site O19E that was infrequently burned but had trees removed in 2011 was intermediate in position along axis 1, falling between the frequently burned or mechanically treated sites and the infrequently managed sites. The second axis explained 25% of the variance; however, a relatively high number of zeroes in the data may have somewhat distorted the second axis into a horseshoe shape [25], so it must be interpreted with caution. Within mechanically treated sites, the second axis separated transects in the regularly mowed or planted sites from those in the mulched site, with the latter having taller herbaceous plants, a higher percentage of woody plants, and more small trees (Table 2; Supplementary Table S1). Infrequently managed sites were also widely distributed along the second axis.
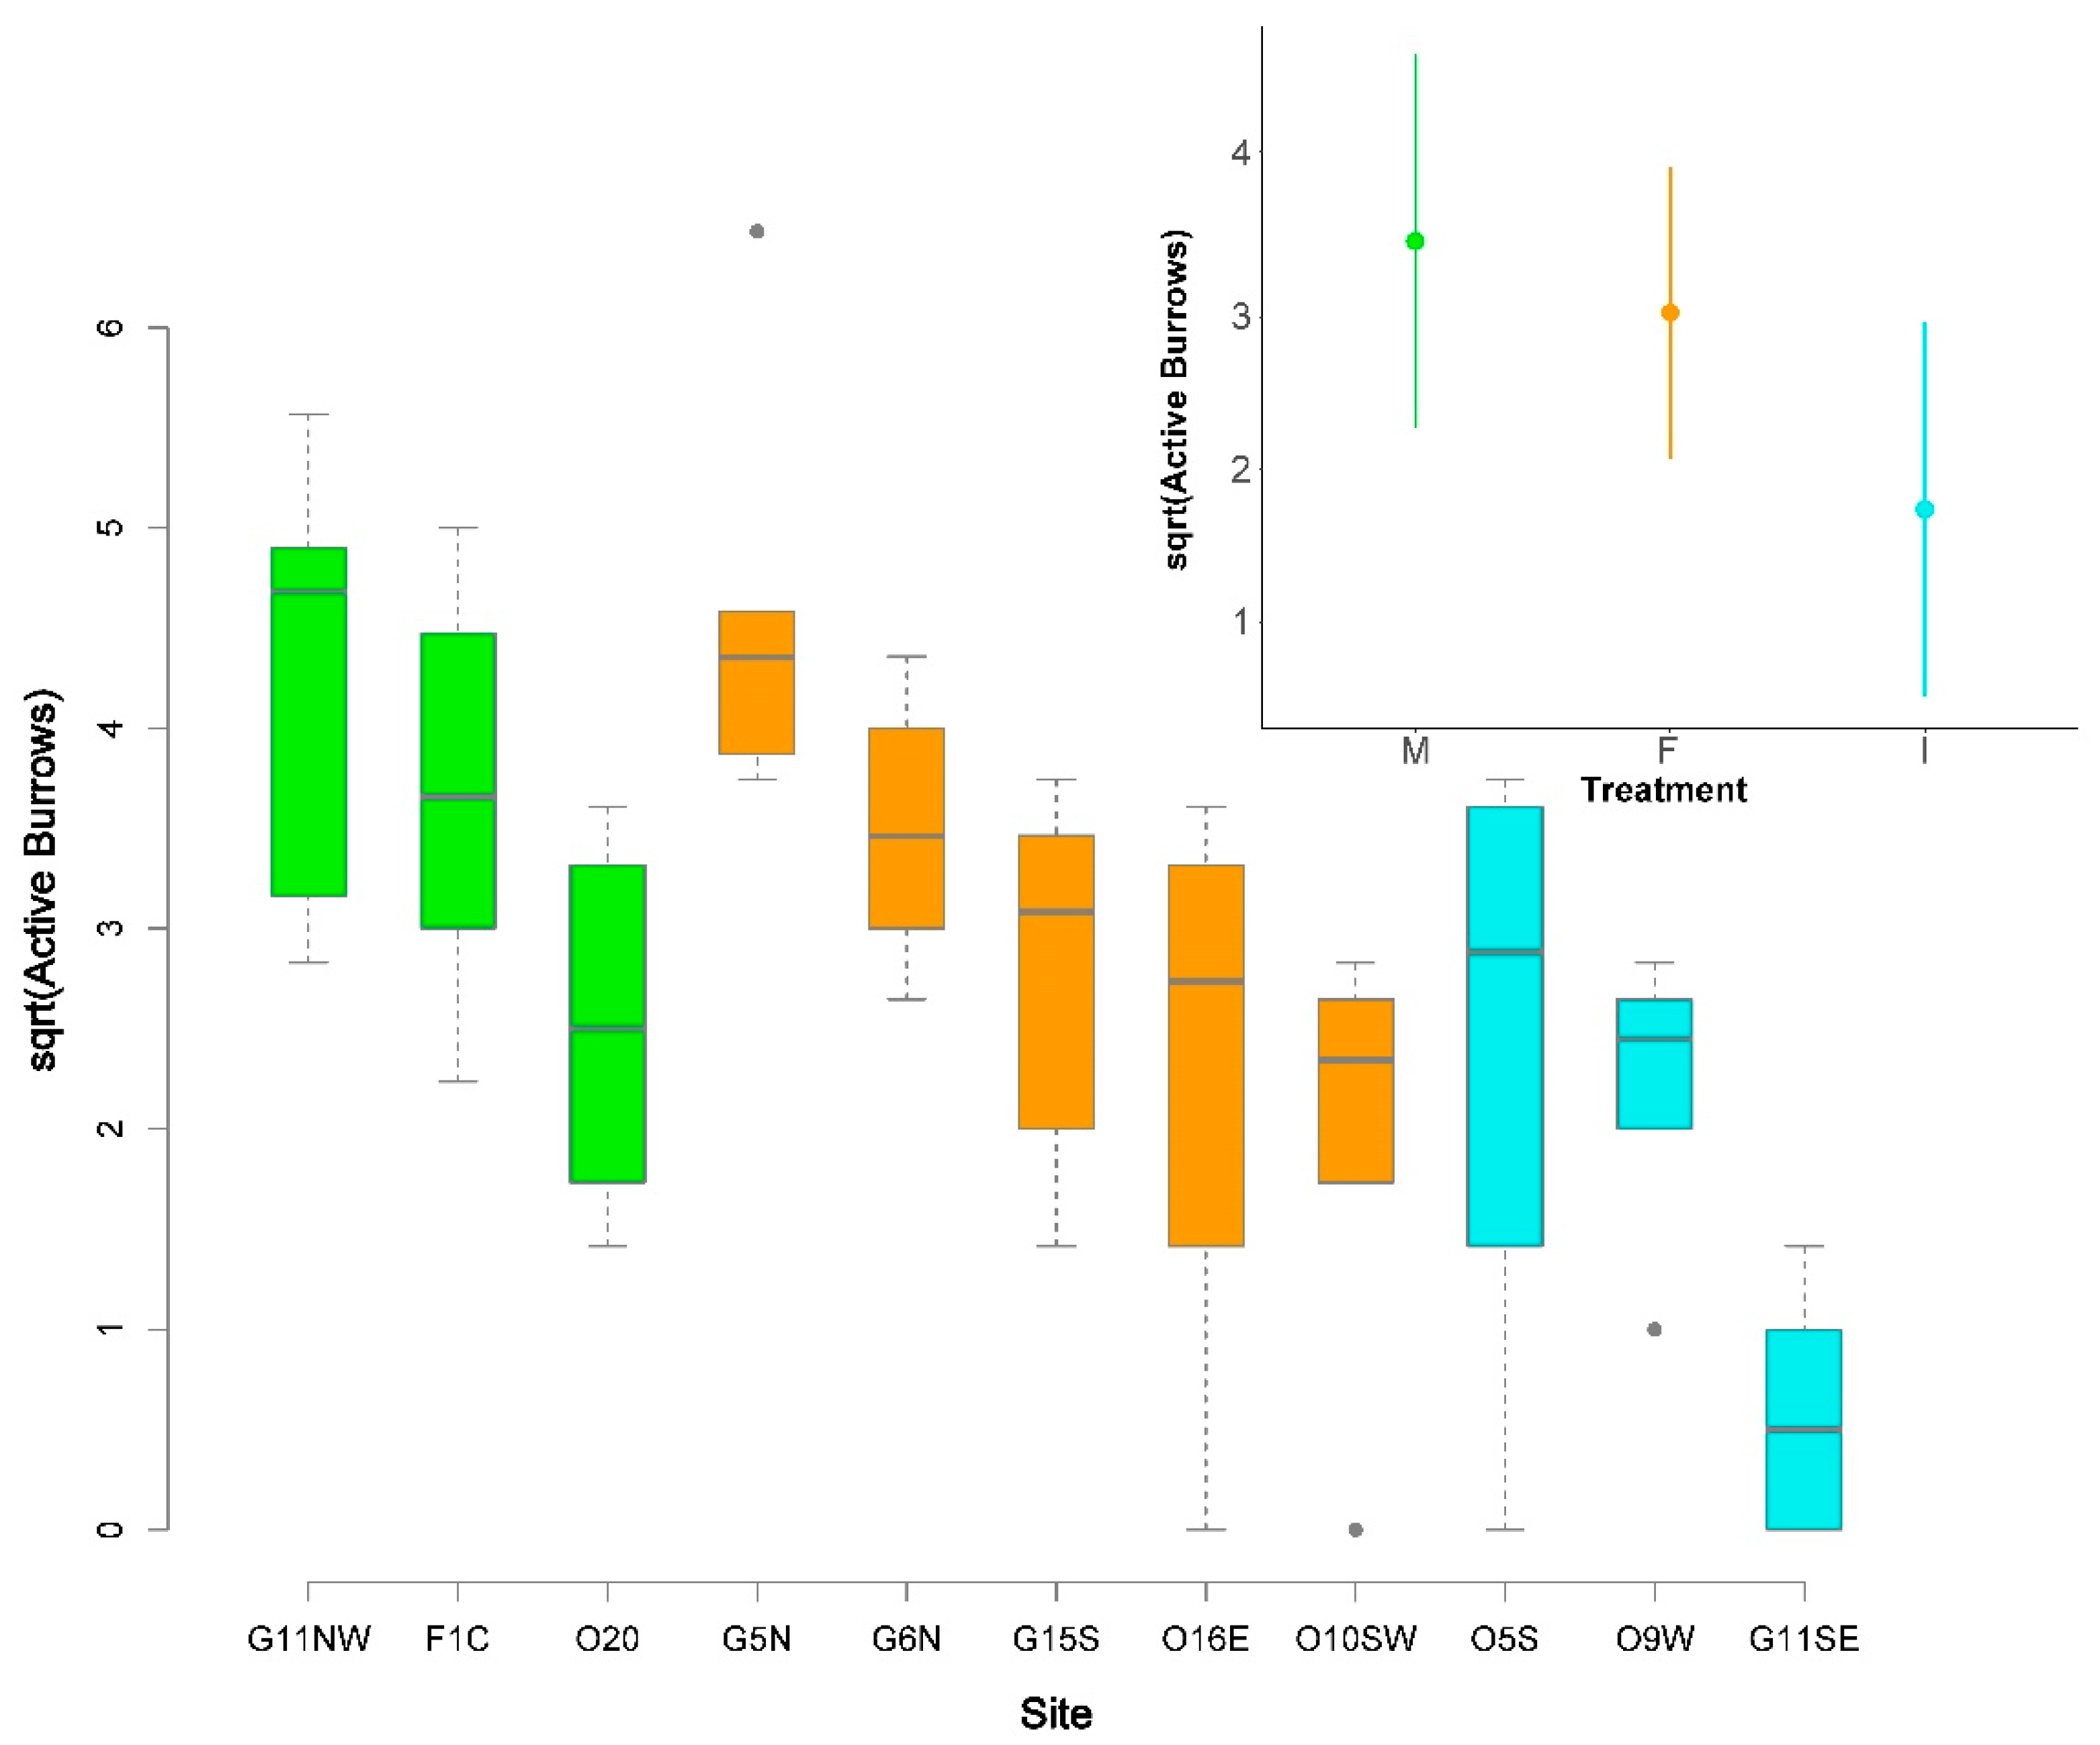
The number of active burrow openings was weakly related to vegetation treatment (Figure 4; Supplementary Table S1). In the mixed-effects model, “treatment” (fixed effect) explained 23% of the variance in the number of active burrow openings, while “site” (random effect) explained another 27%, as indicated by the pseudo-R2 values. Estimated least-squares means indicated that the frequently burned and mechanical treatments had more burrow openings than the infrequently managed treatments (Table 3; Figure 4 inset); unadjusted p-values from Tukey’s test were <0.10 for comparisons of the infrequently burned treatment to both frequently burned and mechanical treatments. However, the Sidak adjustment increased the p-values to >0.15 (Table 3).
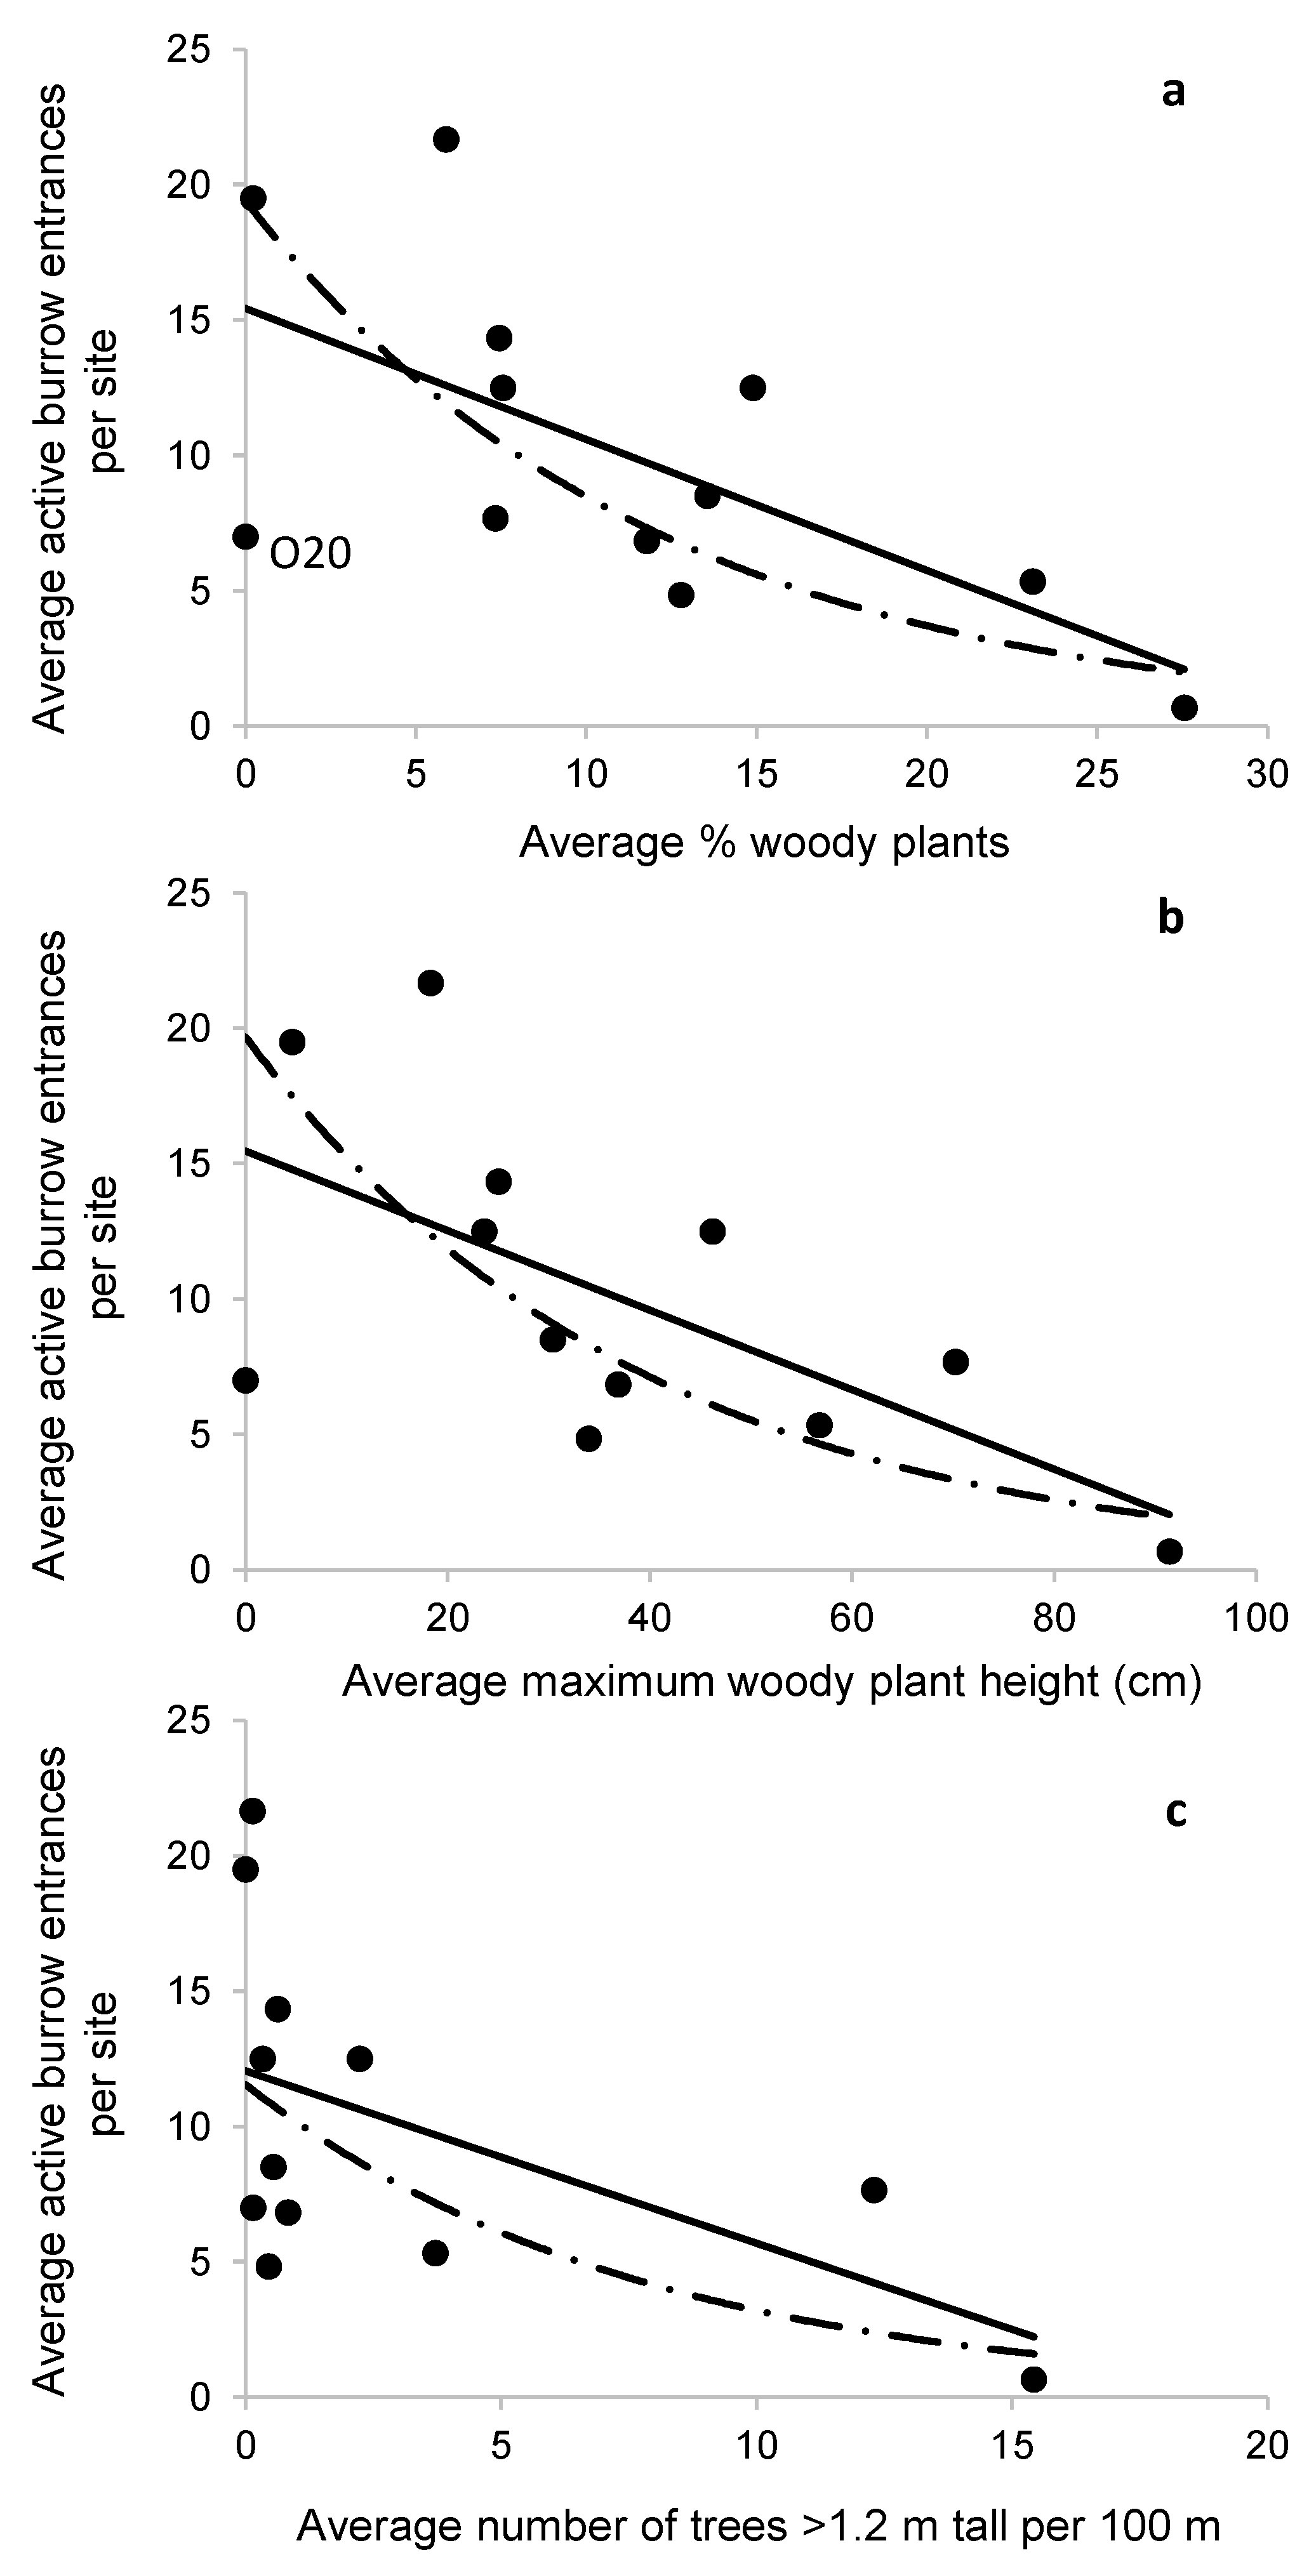
The number of active burrow openings was negatively related to woody vegetation metrics. The number of active burrows per transect, averaged over a site, was significantly negatively related to percent woody plant cover, woody plant height, and the number of trees per m along transects (Table 4, Figure 5) but not to other variables. For each of the significant variables, the exponential equation provided the best fit (Table 4). The exponential equation for percent woody plant cover was the best model, explaining 52% (adjusted R-square) of the variation in active burrow openings (Table 4). The food plot site, O20, appeared to be an outlier in that relationship (Figure 5a). When we repeated the analysis without the site, the exponential equation explained 68% of the variation in burrow openings (p-value = 0.001, constant and b1 = 27.03 and −0.10, respectively; see Discussion).
4. Discussion
Forest management influenced crayfish burrow densities. Though many prairies and savannas are considered terrestrial habitats, they can be critical to burrowing semi-aquatic species that access the water table during at least some seasons [30]. The number of active crayfish burrow openings on the Refuge was inversely related to woody plant cover and maximum woody plant height. Sites on the Refuge that were frequently managed, whether by fire or mechanical means, tended to have fewer and smaller woody plants compared to infrequently managed sites. The number of trees shorter than 1.2 m was not associated with burrow numbers, presumably because tree seedlings began growing soon after burning or mowing.
The mechanisms leading to the negative association between woody plants and some burrowing crayfishes are not known but may relate to impacts of encroaching woody plants on: crayfish foraging success or predation risk, water table levels [31,32], biophysical characteristics of soils, or other factors. One interesting outlier was the food plot site (O20), which almost entirely lacked woody vegetation, yet had relatively few burrow openings (Figure 5a). Although we cannot draw conclusions about this because it was our only site that had been managed as a food plot and that had been sprayed with herbicides, the result raised concerns because some primary burrowing crayfishes appear to be largely restricted to highly managed roadsides, lawns, or agricultural areas [14] that evidently function as prairie remnants for crayfishes. If soil compaction, a hardpan layer, limited plant diversity, effects of chemical spraying, or other factors make more intensively managed areas less-than-ideal habitat for the crayfishes, that may have important implications for burrowing crayfish conservation.
Frequently burned and mechanically treated sites tended to have more burrow openings compared to those in infrequently managed areas, although results were not significant after p-values were adjusted for multiple comparisons. Our small number of sites resulted in low statistical power to detect differences among treatments. Furthermore, our results were conservative because our sampling methods precluded sampling in areas with the longest burn intervals and, thus, the densest and tallest woody plant growth on the Refuge. Based on casual observations, burrow numbers in such areas were even lower than those in the infrequently managed sites that we sampled. Perhaps the best example of different management strategies affecting woody vegetation and burrow densities was in comparison of the frequently mowed site G11NW and the adjacent, infrequently managed site G11SE. The former was an open pasture environment and the latter a mature pine forest. The former had the second-highest burrow density in the study, and the latter had the lowest, even though the sites were within 50 m of each other and were sampled in the same week.
Our finding that burrow densities decreased exponentially as woody plants encroached supports the growing evidence that numerous primary burrowing crayfishes are adapted to and require open-canopy environments. However, our results are not applicable to all primary burrowing crayfishes. Within their basic requirements for certain soil types and adequately shallow water tables, primary burrowing crayfishes may be habitat generalists (e.g., Creaserinus fodiens [33]) or specialists. Whereas some habitat specialists require or prefer mature forests (e.g., Cambarus dubius [34]), many require open habitats such as prairies or savannas, including pitcher plant bogs (e.g., Creaserinus gordoni [35], Distocambarus crockeri [10]) or even mowed road rights-of-way (e.g., Fallicambarus harpi and Procambarus reimeri [14]) or lawns—all habitats maintained in an early successional stage by fire or other means. In the Ouachita Mountains, Arkansas, and Camp Shelby, Mississippi, burrow densities for several crayfishes were positively related to open canopy and availability of water relatively near the soil surface [14,36]. Procambarus gracilis occurred in both prairies and forested ecotones in southeastern Wisconsin, but Hobbs and Rewolinski [37] implied that forested sites where the species occurred were formerly prairies. The authors noted that fire prevention and other human activities had greatly reduced mesic and wet prairie environments, thereby contributing to reductions in P. gracilis, a concept echoed by Welch and Eversole [30] for Distocambarus crockeri. The same is likely true for many primary burrowers in areas formerly dominated by wet pine savannas on the Gulf Coastal Plain.
Our results were most applicable to C. oryktes, the numerically dominant species we captured. The research was initiated, in part, out of concern for Creaserinus danielae, a primary burrowing species petitioned for listing under the US Endangered Species Act (ESA) [38]; however, nearly all Creaserinus captured appeared to be C. oryktes. Some questions exist about the taxonomy and identification of the two species [39,40]. During limited subsequent sampling on and near the Refuge, we captured several C. danielae in three forested areas, but in Alabama, where C. oryktes is absent, we captured C. danielae in some open areas (SBA unpublished data). It is possible that where the species are sympatric, C. oryktes may benefit the most from open habitat. This pattern warrants further research after the taxonomy is clarified.
We also captured Procambarus fitzpatricki, a narrow endemic [39,41] that was also petitioned for listing under the ESA [38]. Five of the 13 P. fitzpatricki we captured from burrows were from the wettest site sampled (F1C). In addition, dipnetting in small (typically <16 m2), shallow pools in the site yielded another 25 juvenile and 4 adult P. fitzpatricki. Juvenile P. fitzpatricki were also dipnetted from pools in several other Refuge sites (SBA unpublished data). Hobbs [42] listed P. fitzpatricki as a primary or secondary burrower, and during our study, it appeared that it tended to use open water more often than did the primary burrowing C. oryktes; this was further supported by our collection of P. fitzpatricki from small, temporary waters in this study and in our sampling of roadside ditches in the region.
One assumption underlying our analyses was that the number of active burrow openings correlated positively to the number of crayfishes. This assumption may be invalid for several reasons. First, we may not have accurately distinguished between active and inactive openings. Second the number of active burrow openings per burrow can vary by crayfish species [43]. Third, soil compaction, woody vegetation, or other factors that influence the ease of burrowing, as well as water table depth [43], may affect the burrow complexity and thus the number of openings created per burrow. That said, we found that both active (e.g., excavation) and passive (e.g., trapping) sampling methods for the crayfishes themselves had substantial biases [44]. Furthermore, for C. gordoni, another primary burrower in the Coastal Plain of Mississippi that is closely related to C. oryktes and C. danielae, burrow numbers were highly correlated with, and so could be used to estimate, crayfish abundances [22]. Finally, over 90% of the crayfish we collected from burrows belonged to a single species. Therefore, we concluded that burrow entrance counts represented the least-biased approach to answering the questions posed here, but further research on this topic would be useful.
We encourage further work to understand how vegetation management affects populations of C. danielae that are sympatric with C. oryktes. We also suggest research to understand: (1) how relationships between numbers of burrow openings and crayfishes vary across habitats and seasons for various species [44]; (2) how various agricultural practices influence burrower densities, and (3) the mechanisms by which woody plant encroachment reduces burrowing crayfish densities.
Future work on burrowing crayfish densities in relation to vegetation could benefit from several improvements in study design. To better address the question of how vegetation management influences burrow densities, we recommend sampling fewer quadrats on more sites (analysis ongoing) to increase statistical power. An ideal study design would compare adjacent compartments having different management histories. Vegetation aspects of future studies could focus solely on quantifying woody vegetation. Conversely, although measuring maximum plant heights in each quadrat was fast, other approaches, such as use of a Robel pole [45] or density board [46] that better represent the distribution of plant heights or correlate with plant volume, may refine our understanding of the relationship between vegetation characteristics and crayfish densities. Additionally, recording the presence or absence of pitcher plants (Sarracenia spp.) or other easily identifiable plant indicators of site wetness may provide an additional correlate of burrow densities.
Supplementary Materials
The following are available online at https://www.mdpi.com/article/10.3390/w13131854/s1, Table S1: Vegetation characteristics and crayfish burrow densities by site. Averages (SD) of vegetation and cover data from quadrats (or from transects, for trees) at each site and the average number of active and inactive burrow openings per m2. Standard deviations calculated from transect means. SWD = small woody debris; LWD = large woody debris; stand. water = standing water; herb_ht = height of tallest herbaceous plant in quadrat; woody_ht = height of tallest woody shrub in quadrat; trees <1.2 m = number of trees shorter than 1.2 m per m of transect length; trees >1.2 m = number of trees taller than 1.2 m per m of transect length, Table S2: Interpretable axes from principal components analysis of vegetation characteristics and percentage of overall variance (% of variance) and cumulative percentage of variance (Cum. % of variance) explained by the axes. Minimum (Min.), average (Avg.), and maximum (Max.) eigenvalues from 999 randomizations are shown, along with the resulting p-values, Table S3: Sampling, treatment, vegetation, and burrow data by quadrat, Table S4: Vegetation and burrow data by transect.
Author Contributions
S.B.A. and S.G.H. contributed substantially to the study, with S.B.A. providing crayfish expertise, and S.G.H. providing Refuge expertise. Conceptualization, S.B.A. and S.G.H.; methodology, S.B.A.; validation, S.B.A.; formal analysis, S.B.A. and C.H.; investigation, S.B.A. and S.G.H.; resources, S.B.A. and S.G.H.; data curation, S.B.A.; writing—original draft preparation, S.B.A. and S.G.H.; writing—review and editing, S.B.A., S.G.H., and C.H.; visualization, S.B.A. and C.H.; project administration, S.B.A. and S.G.H.; funding acquisition, S.G.H. All authors have read and agreed to the published version of the manuscript.
Funding
This research was funded by US Fish and Wildlife Service Interagency Agreement Number F16PG00142 to the US Department of Agriculture, Forest Service, Southern Research Station. Both agencies provided additional salary and in-kind support.
Institutional Review Board Statement
The study was conducted according to the guidelines of the Declaration of Helsinki, and approved by the Institutional Animal Care and Use Committee of the USDA Forest Service (permit number 2016-016 approved 23 December 2016).
Informed Consent Statement
Not applicable.
Data Availability Statement
The data presented in this study are available in Supplementary Tables S1–S4.
Acknowledgments
We thank the employees, interns, and volunteers who assisted with sampling: Z. Barnett, M. Bland, G. McWhirter, C. Smith (FS); A. Dedrickson, S. Ray, V. Schneider, J. Stockdale, V. Thorpe, V. van Vienen (FWS). We are particularly grateful to those who moved beyond their areas of interest and expertise and willingly embraced the challenges of burrowing crayfish sampling! Z. Barnett led sampling for several days. A. Dedrickson assisted with sampling and logistics. We thank S. Gray and S.K. Saucier with the Refuge Fire Management Program. C. Smith created Figure 1. C. Sabatia provided statistical advice. Finally, thanks to the numerous FS and FWS administrative staff who facilitated the funding agreement. The findings and conclusions in this article are those of the authors and do not necessarily represent the views of the U.S. Forest Service or the U.S. Fish and Wildlife Service.
Conflicts of Interest
The authors declare no conflict of interest. The funders had no role in the design of the study; in the collection, analyses, or interpretation of data; in the writing of the manuscript; or in the decision to publish the results.
References
- Frost, C.C. Four centuries of changing landscape patterns in the longleaf pine ecosystem. In Proceedings of the Tall Timbers Fire Ecology Conference, Tallahassee, FL, USA, 3–6 November 1993; pp. 17–43. Available online: https://talltimbers.org/wp-content/uploads/2018/09/17-Frost1993_op.pdf (accessed on 22 May 2021).
- Landers, J.L.; Van Lear, D.H.; Boyer, W.D. The longleaf pine forests of the southeast: Requiem or renaissance? J. For. 1995, 93, 39–44. [Google Scholar]
- Noss, R.F.; Platt, W.J.; Sorrie, B.A.; Weakley, A.S.; Means, D.B.; Costanza, J.; Peet, R.K. How global biodiversity hotspots may go unrecognized: Lessons from the North American Coastal Plain. Divers. Distrib. 2014, 2014, 1–9. [Google Scholar] [CrossRef]
- Van Lear, D.H.; Carroll, W.D.; Kapeluck, P.R.; Johnson, R. History and restoration of the longleaf pine-grassland ecosystem: Implications for species at risk. For. Ecol. Manag. 2005, 211, 150–165. [Google Scholar] [CrossRef]
- Clay, M.; Brannock, P.M.; Barbour, M.; Feminella, J.W.; Santos, S.R.; Helms, B.S. Strong population structure and differentiation within and among burrowing bog crayfish species of southern Alabama wetlands. Wetlands 2020, 1–12. [Google Scholar] [CrossRef]
- Baxley, D.; Qualls, C. Habitat associations of reptile and amphibian communities in longleaf pine habitats of south Mississippi. Herpetol. Conserv. Biol. 2009, 4, 295–305. [Google Scholar]
- Noss, R.F.; La Roe, E.T., III; Scott, J.M. Endangered Ecosystems of the United States: A Preliminary Assessment of Loss and Degradation; National Biological Service, US Department. of Interior: Washington, DC, USA, 1995; p. 58.
- Clark, N.A.; Saunders, B.P. The role of longleaf pine in the conservation framework of the southeast United States. In A Multidisciplinary Approach to Conservation, Proceedings of the 31st Southern Conservation Agricultural Systems Conference, Painter, VA, USA, 20–23 July 2009; Reiter, M.S., Ed.; Virginia Cooperative Extension Publication: Painter, VA, USA, 2009; pp. 49–57. [Google Scholar]
- Bond, W.J.; Woodward, F.I.; Midgley, G.F. The global distribution of ecosystems in a world without fire. New Phytol. 2005, 165, 525–538. [Google Scholar] [CrossRef] [PubMed]
- Welch, S.M.; Eversole, A.G.; Riley, J. Using the spatial information implicit in the habitat specificity of the burrowing crayfish Distocambarus crockeri to identify a lost landscape component. Ecography 2007, 30, 349–358. [Google Scholar] [CrossRef]
- Gee, G.F.; Hereford, S.G. Mississippi sandhill cranes. In Our Living Resources: A Report to the Nation on the Distribution, Abundance, and Health of U.S. Plants, Animals, and Ecosystems; Larue, E.T., Farris, G.S., Puckett, C.E., Doran, P.D., Mac, M.J., Eds.; U.S. Department of the Interior, National Biological Service: Washington, DC, USA, 1995; pp. 75–77. [Google Scholar]
- Hereford, S.G.; Dedrickson, A.J. Mississippi Sandhill Crane Conservation Update 2014–2016. In Proceedings of the North American Crane Workshop, Johannesburg, South Africa, 5 January 2018; pp. 132–136. Available online: https://digitalcommons.unl.edu/cgi/viewcontent.cgi?article=1358&context=nacwgproc (accessed on 22 May 2021).
- Hobbs, H.H., Jr. The Crayfishes of Florida; Biological Science Series; University of Florida Publications: Gainesville, FL, USA, 1942; Volume 3, pp. 1–79. [Google Scholar]
- Rhoden, C.M.; Taylor, C.A.; Peterman, W.E. Highway to heaven? Roadsides as preferred habitat for two narrowly endemic crayfish. Freshw. Sci. 2016, 35, 974–983. [Google Scholar] [CrossRef] [Green Version]
- Norquist, C. A Comparative Study of the Soils and Vegetation of Savannas in Mississippi. Master’s Thesis, Mississippi State University, Starkville, MS, USA, 1984. [Google Scholar]
- Frost, C.C.; Walker, J.; Peet, R.K. Fire-dependent savannas and prairies of the Southeast: Original extent, preservation status and management problems. In Wilderness and Natural Areas in the Eastern United States: A Management Challenge; Kulhavy, D.L., Connor, R.N., Eds.; Center for Allied Studies, School of Forestry, Stephen F. Austin University: Nacogdoches, TX, USA, 1986; pp. 348–357. [Google Scholar]
- Clewell, A.F.; Raymond, C.A. Preliminary Characterization of Vegetation at Mississippi Sandhill Crane National Wildlife Refuge; Mississippi Sandhill Crane: Jackson, MS, USA, 1995; p. 62.
- Berkowitz, J.F.; Page, S.; Noble, C.V. Potential disconnect between observations of hydrophytic vegetation, wetland hydrology indicators, and hydric soils in unique pitcher plant bog habitats of the southern Gulf Coast. Southeast Nat. 2014, 13, 721–734. [Google Scholar] [CrossRef] [Green Version]
- Teaford, J.W.; Lewis, P.L.; Johnson, D.B. Mississippi Pine Savannahs, Pine Flatwoods, and Forested Bayheads: Wetland Delineation, Evaluation, and Mitigation Considerations; J.W. Teaford and Company: Vicksburg, MS, USA, 1995. [Google Scholar]
- Welch, S.M.; Eversole, A.G. Comparison of two burrowing crayfish trapping methods. Southeast Nat. 2006, 5, 27–30. [Google Scholar] [CrossRef]
- Norrocky, M.J. Burrowing crayfish trap. Ohio J. Sci. 1984, 84, 65–66. [Google Scholar]
- Welch, S.M.; Waldron, J.L.; Eversole, A.G.; Simoes, J.C. Seasonal variation and ecological effects of Camp Shelby burrowing crayfish (Fallicambarus gordoni) burrows. Am. Midl. Nat. 2008, 159, 378–384. [Google Scholar] [CrossRef]
- McCune, B.; Mefford, M.J. PC-ORD: Multivariate Analysis of Ecological Data; Version 7.08; Wild Blueberry Media: Corvallis, OR, USA, 2018. [Google Scholar]
- Peres-Neto, P.R.; Jackson, D.A.; Somers, K.M. How many principal components? Stopping rules for determining the number of non-trivial axes revisited. Comput. Stat. Data Anal. 2005, 49, 974–997. [Google Scholar] [CrossRef]
- Peck, J.E. Multivariate Analysis for Ecologists: Step-by-Step, 2nd ed.; MjM Software Design: Gleneden Beach, OR, USA, 2016; p. 192. [Google Scholar]
- R Core Team. R: A Language and Environment for Statistical Computing. 2021. Available online: https://www.r-project.org/ (accessed on 22 May 2021).
- Bates, D.; Machler, M.; Bolker, B.; Walker, S. Fitting linear mixed-effects models using lme4. J. Stat. Softw. 2015, 67, 1–48. [Google Scholar] [CrossRef]
- Lenth, R.V. Emmeans: Estimated Marginal Means, Aka Least-Squares Means. 2021. Available online: https://CRAN.R-project.org/package=emmeans (accessed on 22 May 2021).
- Barton, K. MuMIn: Multi-Model. Inference. 2020. Available online: https://CRAN.R-project.org/package=MuMIn (accessed on 22 May 2021).
- Welch, S.M.; Eversole, A.G. The occurrence of primary burrowing crayfish in terrestrial habitat. Biol. Conserv. 2006, 130, 458–464. [Google Scholar] [CrossRef]
- Budny, M.L.; Benscoter, B.W. Shrub encroachment increases transpiration water loss from a subtropical wetland. Wetlands 2016, 36, 631–638. [Google Scholar] [CrossRef]
- Acharya, B.S.; Kharel, G.; Zou, C.B.; Wilcox, B.P.; Halihan, T. Woody plant encroachment impacts on groundwater recharge: A review. Water 2018, 10, 1466. [Google Scholar] [CrossRef] [Green Version]
- Norrocky, M.J. Observations on the ecology, reproduction and growth of the burrowing crayfish Fallicambarus (Creaserinus) fodiens (Decapoda: Cambaridae) in north-central Ohio. Am. Midl. Nat. 1991, 125, 75–86. [Google Scholar] [CrossRef]
- Loughman, Z.J. Ecology of Cambarus dubius (upland burrowing crayfish) in north-central West Virginia. Southeast Nat. 2010, 9, 217–230. [Google Scholar] [CrossRef]
- Welch, S.M. Multiscale Habitat Associations of Three Primary Burrowing Crayfish. Ph.D. Thesis, Clemson University, Clemson, SC, USA, 2006. [Google Scholar]
- Welch, S.M. Relationships between Burrow Densities of the Camp Shelby Burrowing Crayfish (Fallicambarus Gordoni) and Vegetation Structures in the Cypress Creek Watershed of the Camp Shelby Training Site, MS; Technical report of The Nature Conservancy; Camp Shelby Field Office: Camp Shelby, MS, USA, 2004.
- Hobbs, H.H.I.; Rewolinski, S.A. Notes on the burrowing crayfish Procambarus (Girardiella) gracilis (Bundy)(Decapoda, Cambaridae) from southeastern Wisconsin, USA. Crustaceana 1985, 48, 26–33. [Google Scholar] [CrossRef] [Green Version]
- CBD, Center for Biological Diversity. Petition to List 404 Aquatic, Riparian, and Wetland Species from the Southeastern United States as Threatened or Endangered under the Endangered Species Act. 2010. p. 1122. Available online: https://www.fws.gov/southeast/pdf/petition/404-aquatic.pdf. (accessed on 22 May 2021).
- Adams, S.B.; Jones, R.L. Crayfishes of Mississippi: A provisional checklist with distributions and discussion of unresolved taxonomic issues. Southeast Nat. 2021, 20, 51–76. [Google Scholar] [CrossRef]
- Ainscough, B.J.; Breinholt, J.W.; Robison, H.W.; Crandall, K.A. Molecular phylogenetics of the burrowing crayfish genus Fallicambarus (Decapoda: Cambaridae). Zool. Scr. 2013, 42, 306–316. [Google Scholar] [CrossRef]
- Hobbs, H.H., Jr. A new crayfish of the genus Procambarus from Mississippi (Decapoda: Astacidae). Proc. Biol. Soc. Wash. 1971, 83, 459–468. [Google Scholar]
- Hobbs, H.H., Jr. An illustrated checklist of the American crayfishes (Decapoda: Astacidae, Cambaridae, and Parastacidae). Smithson. Contrib. Zool. 1989, 480, 1–236. [Google Scholar] [CrossRef]
- Hobbs, H.H., Jr. The crayfishes of Georgia. Smithson. Contrib. Zool. 1981, 318, 1–549. [Google Scholar] [CrossRef]
- Adams, S.B.; Hereford, S.G. Digging deep for crayfish clues. Wildl. Prof. 2019, 13.5, 41–45. [Google Scholar]
- Robel, R.J.; Briggs, J.N.; Dayton, A.D.; Hulbert, L.C. Relationships between visual obstruction measurements and weight of grassland vegetation. Rangel. Ecol. Manag. J. Range Manag. Arch. 1970, 23, 295–297. [Google Scholar] [CrossRef] [Green Version]
- Haskell, D.E.; Webster, C.R.; Bales, A.L.; Meyer, M.W.; Flaspholer, D.J. Assessment of wildlife habitat attributes at restoration projects on northern Wisconsin lakeshores. Northeast Nat. 2017, 24, 391–412. [Google Scholar] [CrossRef]
Figure 1.
Map of sites sampled on the Mississippi Sandhill Crane National Wildlife Refuge, Jackson County, MS. Labels coincide with site codes in Table 1.
Figure 1.
Map of sites sampled on the Mississippi Sandhill Crane National Wildlife Refuge, Jackson County, MS. Labels coincide with site codes in Table 1.

Figure 2.
Examples of vegetation treatments: frequently burned site O10SW (a), mechanically treated (mowed) site G11NW (b), and infrequently managed site G11SE (c).
Figure 2.
Examples of vegetation treatments: frequently burned site O10SW (a), mechanically treated (mowed) site G11NW (b), and infrequently managed site G11SE (c).

Figure 3.
Principal components analysis (PCA) ordination of vegetation characteristics averaged within transects, or in the case of trees, counted along transects. Small symbols represent transects, crosses indicate group centroids, and lines indicate PCA loadings of each variable. Blue circles in lower left were from site O5S, and green triangles in lower right from sites O20 and G11NW. Treatment abbreviations as in Table 1. Variable abbreviations as in Supplementary Table S1.

Figure 4.
Boxplot of the number of active burrow openings per transect (square-root transformed) by site and treatment. Center lines indicate medians, boxes show the interquartile range (25th to 75th percentiles), whiskers cover 1.5 times the interquartile range, and grey dots represent outliers. The inset shows the least-squares means (circles) of the square root of number of active burrow openings with 95% confidence intervals obtained from the mixed-effects model for each of the three vegetation treatments. Site codes as in Table 1. Colors indicate treatments (green = mechanical, orange = frequently burned, and blue = infrequently managed).

Figure 5.
The average number of active burrow openings per site versus the three most informative habitat variables: average percentage of each quadrat covered by woody vegetation (a), average maximum woody plant height (b), and average number of trees taller than 1.2 m per 100 m of transect length (c). Linear and exponential curves shown.


Table 1.
Vegetation treatments, habitat types, management compartment sizes, sampling dates in 2017 (day month), locations, and the number of crayfishes captured at each site. Years since burn indicates years as of the sampling date in 2017. Latitude and longitude (decimal degrees, WGS 84) are reported from the end of transect C farthest from the road. Vegetation treatment codes are: F = frequently burned; I = infrequently managed; I_M = infrequently managed/recent mechanical, and M = mechanically treated. The first letter of site codes indicates the Refuge unit in which the site was located: F = Fontainebleau, G = Gautier, and O = Ocean Springs.
| Site Code | Vegetation Treatment | Site Name | Habitat Type | Compart-ment Size (ha) | Sample Date(s) | Years Since Burn | Latitude | Longitude | Procambarus fitzpatricki | Creaserinus sp. |
|---|---|---|---|---|---|---|---|---|---|---|
| F1C | M (mulched) | NW Fontainebleau | savanna | 73 | 26–27 January | 18 | 30.3979 | −88.7436 | 5 | 8 |
| G11NW | M (mowed) | Martin Pasture | pasture | 16 1 | 28 February | 10 | 30.4333 | −88.6450 | 0 | 6 |
| O20 | M (mowed) | Utah Crop Unit W | pasture/food plot | 2 1 | 9–10 February | 5 | 30.4682 | −88.8176 | 0 | 16 |
| G15S | F | Church | savanna | 61 | 25–26 January | 1 | 30.4164 | −88.6635 | 0 | 15 |
| G5N | F | West Valentine | savanna | 155 | 24–25 January | 2 | 30.4548 | −88.6849 | 3 | 16 |
| G6N | F | North Valentine | savanna | 65 | 24–25 January | 1 | 30.4635 | −88.6893 | 1 | 13 |
| O10SW | F | S Duck Pond | savanna | 60 | 7–8 February | 1 | 30.4540 | −88.7589 | 0 | 9 |
| O16E | F | SW Greenpond | savanna | 170 | 8–9 February | 1 | 30.4642 | −88.7816 | 0 | 11 |
| G11SE | I | NW Martin | forest | 69 | 1 March | 2 | 30.4314 | −88.6431 | 1 | 5 |
| O5S | I | Utah North | savanna | 126 | 2 March | 3 | 30.4699 | −88.8161 | 1 | 14 |
| O9W | I | scrub | 47 | 8 February | 7 | 30.4577 | −88.7693 | 1 | 10 | |
| O19E | I_M | Semmes 9 | savanna | 90 | 1 March | 3 | 30.4711 | −88.7550 | 1 | 16 |
1 size of pasture, not entire management compartment.
Table 2.
Standardized relative importance of each variable to the first two principal component axes. Eigenvectors were scaled to standard deviations (also called “weights”). Variables ordered by descending absolute weights along first axis.
Table 2.
Standardized relative importance of each variable to the first two principal component axes. Eigenvectors were scaled to standard deviations (also called “weights”). Variables ordered by descending absolute weights along first axis.
| Eigenvector | ||
|---|---|---|
| Vegetation variable | 1 | 2 |
| % Grass/forbs | 0.958 | 0.094 |
| Woody height | −0.920 | 0.304 |
| Trees > 1.2 m | −0.856 | −0.084 |
| % Leaf/SWD | −0.819 | −0.491 |
| % Woody plants | −0.587 | 0.687 |
| Herbaceous height | 0.275 | 0.797 |
| Trees < 1.2 m | −0.181 | 0.548 |
Table 3.
Mixed-effects model pairwise comparisons among vegetation treatments of number of active burrow openings per transect (back-transformed) nested within sites. Treatment codes as in Table 1. Site O19E was excluded from the analysis.
Table 3.
Mixed-effects model pairwise comparisons among vegetation treatments of number of active burrow openings per transect (back-transformed) nested within sites. Treatment codes as in Table 1. Site O19E was excluded from the analysis.
| Contrast | Estimate | SE | df | Statistic | p-Value | Adj. p-Value |
|---|---|---|---|---|---|---|
| Treatment M-F | 3.06 | 4.85 | 15.1 | 0.63 | 0.530 | 0.901 |
| Treatment M-I | 9.19 | 4.50 | 15.1 | 2.04 | 0.059 | 0.167 |
| Treatment F-I | 6.13 | 3.37 | 15.1 | 1.82 | 0.088 | 0.242 |
Table 4.
Curve-fitting results for univariate models of habitat characteristics versus number of burrows. Independent variables were habitat characteristics from quadrats averaged over each site. The dependent variable was the number of active burrows in quadrats totaled by transect then averaged over each site. Degrees of freedom 1 and 2 were 1 and 10, respectively, for all tests; N = 12. Models with p < 0.05 are in bold.
| Equation | Model Summary | Parameter Estimates | ||||
|---|---|---|---|---|---|---|
| Adjusted R-Square | F | p-Value | Constant | b1 | ||
| PERCENT COVER | ||||||
| % woody plants | Linear | 0.36 | 7.12 | 0.024 | 15.43 | −0.48 |
| Exponential | 0.52 | 12.67 | 0.005 | 19.40 | −0.08 | |
| % grass/forbs | Linear | 0.20 | 3.72 | 0.083 | −0.32 | 0.14 |
| Exponential | 0.21 | 3.99 | 0.074 | 1.61 | 0.02 | |
| % bare | Linear | −0.01 | 0.92 | 0.359 | 14.05 | −0.53 |
| Exponential | −0.09 | 0.11 | 0.752 | 9.57 | −0.03 | |
| % leaf or small wood | Linear | −0.01 | 0.91 | 0.364 | 10.91 | −0.10 |
| Exponential | −0.01 | 0.94 | 0.356 | 8.80 | −0.01 | |
| % large wood | Linear | 0.11 | 2.40 | 0.153 | 12.25 | −11.00 |
| Exponential | −0.02 | 0.84 | 0.380 | 9.53 | −1.03 | |
| PLANT HEIGHTS | ||||||
| Woody plant height | Linear | 0.33 | 6.52 | 0.029 | 15.46 | −0.15 |
| Exponential | 0.50 | 11.78 | 0.006 | 19.68 | −0.02 | |
| Herbaceous plant height | Linear | −0.10 | 0.01 | 0.927 | 10.59 | −0.01 |
| Exponential | −0.10 | 0.05 | 0.831 | 9.18 | 0.00 | |
| TREES | ||||||
| Trees > 1.2 m tall/m | Linear | 0.22 | 4.05 | 0.072 | 12.06 | −63.77 |
| Exponential | 0.49 | 11.46 | 0.007 | 11.55 | −12.82 | |
| Trees < 1.2 m tall/m | Linear | −0.04 | 0.56 | 0.472 | 11.27 | −53.12 |
| Exponential | −0.03 | 0.67 | 0.432 | 9.39 | −8.54 | |
Publisher’s Note: MDPI stays neutral with regard to jurisdictional claims in published maps and institutional affiliations. |
© 2021 by the authors. Licensee MDPI, Basel, Switzerland. This article is an open access article distributed under the terms and conditions of the Creative Commons Attribution (CC BY) license (https://creativecommons.org/licenses/by/4.0/).
Share and Cite
MDPI and ACS Style
Adams, S.B.; Hereford, S.G.; Hyseni, C. Burrow Densities of Primary Burrowing Crayfishes in Relation to Prescribed Fire and Mechanical Vegetation Treatments. Water 2021, 13, 1854. https://doi.org/10.3390/w13131854
AMA Style
Adams SB, Hereford SG, Hyseni C. Burrow Densities of Primary Burrowing Crayfishes in Relation to Prescribed Fire and Mechanical Vegetation Treatments. Water. 2021; 13(13):1854. https://doi.org/10.3390/w13131854
Chicago/Turabian StyleAdams, Susan B., Scott G. Hereford, and Chaz Hyseni. 2021. "Burrow Densities of Primary Burrowing Crayfishes in Relation to Prescribed Fire and Mechanical Vegetation Treatments" Water 13, no. 13: 1854. https://doi.org/10.3390/w13131854
Note that from the first issue of 2016, this journal uses article numbers instead of page numbers. See further details here.