
Spatiotemporal Variations of Water Vapor Content and Its Relationship with Meteorological Elements in the Third Pole


1
Department of Geography and Environment Sciences, Northwest Normal University, Lanzhou 730070, China
2
Northwest Institute of Eco-Environment and Resources, Chinese Academy of Sciences, Lanzhou 730000, China
*
Author to whom correspondence should be addressed.
Water 2021, 13(13), 1856; https://doi.org/10.3390/w13131856
Submission received: 8 June 2021
/
Accepted: 30 June 2021
/
Published: 3 July 2021
Abstract
:Water vapor content plays an important role in climate change and the ecosystem in the Tibetan Plateau (TP) through its complicated interaction with the meteorological elements. However, due to the complex topography of the Tibetan Plateau, it is unreliable to attempt to understand the variation pattern of water vapor content using only observational data. Satellite and reanalysis data can be a good substitute for observational data, but their accuracy still needs to be evaluated. Therefore, based on radiosonde stations data, comprehensive assessment of water vapor content on the TP and surrounding areas derived from ERA-5, Second Modern-Era Retrospective analysis for Research and Applications (MERRA2), Atmospheric Infrared Sounder (AIRS)-only, and weighted ensemble data was performed in the context of spatial and temporal distribution at the annual and seasonal scale. Based on precipitation from Gauge V3.0 and Tropical Rainfall Measuring Mission satellite (TRMM) and temperature from ERA-5, the relationship between water vapor content and temperature and precipitation was analyzed. The results show that water vapor content decreases from southeast to northwest, and ERA-5, MERRA2, and AIRS-only can reasonably reproduce the spatial distribution of annual and seasonal water vapor content, with ERA-5 being more reliable in reproducing the spatial distribution. Over the past 50 years, the water vapor content has shown a gradual increasing trend. The variation trends of AIRS-only, MERRA2, ERA-5, and weighted ensemble data are almost consistent with the radiosonde stations data, with MERRA2 being more reliable in capturing water vapor content over time. Weighted ensemble data is more capable of capturing water vapor content characteristics than simple unweighted products. The empirical orthogonal function (EOF) analysis shows that the first spatial mode values of water vapor content and temperature are positive over the TP, while the values of precipitation present a “negative-positive-negative” distribution from south to north over the TP. In the second spatial mode of EOF analysis, the values of water vapor content, air temperature, and precipitation are all negative. The first temporal modes of EOF analysis, water vapor content, air temperature, and precipitation all show an increasing trend. In conclusion, there is a clear relationship of water vapor content with temperature and precipitation.
1. Introduction
Atmospheric water vapor is one of the important parameters of the hydrological cycle, surface atmospheric energy exchange, and climate change [1]. Although the proportion of water vapor content in the atmosphere is small (0.1–3%), it is the most active element in the atmospheric circulation and Earth climate system [2,3]. The most direct impact of global warming is the change of water vapor content, with warmer temperature increasing water vapor in the atmosphere [4].
The Tibetan Plateau (TP) and surrounding areas, where observational stations are scarce and unevenly distributed due to its complex topography, current understanding of water vapor content depends on a rigorous assessment of the regions’ datasets. Many scholars have calculated and analyzed the water vapor content distribution using different datasets and methods [5,6,7,8]. Chen et al. [9] combined three datasets of ERA-5, MERRA, and NCEP/NCAR reanalysis to research the summer variability of water vapor content over the TP and found the trends in summer water vapor content for the ERA-Interim and MERRA were more similar than the NCEP/NCAR. Zhao et al. [10] used two satellite datasets and seven reanalysis datasets to compare water vapor content reproduction capability, indicating that ERA-I was more reliable in reproducing the spatial pattern of the annual cycle, however, JRA55 performed best in capturing the interannual variability. Wang et al. [11] evaluated water vapor content from four satellite products and four reanalysis datasets against ground-based Global Positioning System (GPS) stations data on the Southern TP, indicating that MODIS infrared product underestimated the water vapor content, while the MODIS near-infrared product overestimated it. AIRS products were suitable for constructing high-resolution and high-quality water vapor content. Zhang et al. [12] showed that there was a clear seasonal variation in water vapor on the TP, with more water vapor in the warm season than in the cold season. Zhuo et al. [13] concluded that water vapor on the TP decreases from southeast to northwest. Zhan et al. [14] researched the spatial distribution of water vapor content by using the Empirical orthogonal function (EOF), showing that there were two distribution types on the TP, which were: consistently changing across the region and of inverse north–south (east–west) type.
Changes in water vapor content as the main greenhouse gas in the atmosphere, have a significant impact on temperature and precipitation. As reported by Skliris et al. [15] for the Clausius–Clapeyron equation, when temperature increases, the saturated water vapor pressure increases, causing more water to be held in the air. Wu and Fu [16] found that changes in water vapor had a significant impact on local precipitation intensity and frequency. Zhang et al. [17] analyzed the relationship between water vapor content and meteorological elements in the Qaidam Basin and surrounding areas from 1971 to 2010, and pointed out that temperature was the most important climatic factor affecting the variation in water vapor content. Yao et al. [18] studied the association of water vapor content and climate factors based on the measured data, and showed that the connection of water vapor and precipitation was complex, while water vapor was one of the factors affecting precipitation in the Tianshan Mountains. Zhou et al. [19] explored the link between water vapor content and precipitation in the TP, and discovered that the summer water vapor content was more in the south and less in the north, and the distribution trend of precipitation was consistent with water vapor content. Cess. [5] and Xie et al. [20] concluded that there was a positive feedback effect on temperature and water vapor content on the TP. Yao et al. [21] reported that the changes of water vapor content and temperature in the TP were consistent. Li et al. [22] analyzed the relationship between water vapor content and temperature and precipitation in Changchun, China, and revealed that water vapor content had a significant correlation with temperature, while the trend and magnitude of changes in water vapor content and precipitation were not consistent.
Most of the earlier studies analyzed the characteristics of water vapor content based on single datasets, and there are few studies on the relationship between water vapor content and meteorological elements on the TP. However, to reveal the hydrological cycle of the TP, the relationship between water vapor content and meteorological elements must be analyzed [23,24]. In this paper, first, comparing with the radiosonde stations data, the ability of ERA-5, MERRA2, AIRS-only and weighted ensemble data to reproduce the annual and seasonal water vapor content features over the TP was evaluated. Second, based on precipitation data and temperature data, the relationship between water vapor content and temperature and precipitation was analyzed by using EOF. Finally, analysis of the correlation between water vapor content and temperature and precipitation in the 15 mountain ranges over the TP was conducted. The seasons were divided according to spring (March–May), summer (June–August), autumn (September–November), and winter (December–February).
2. Data and Methods
2.1. Study Area
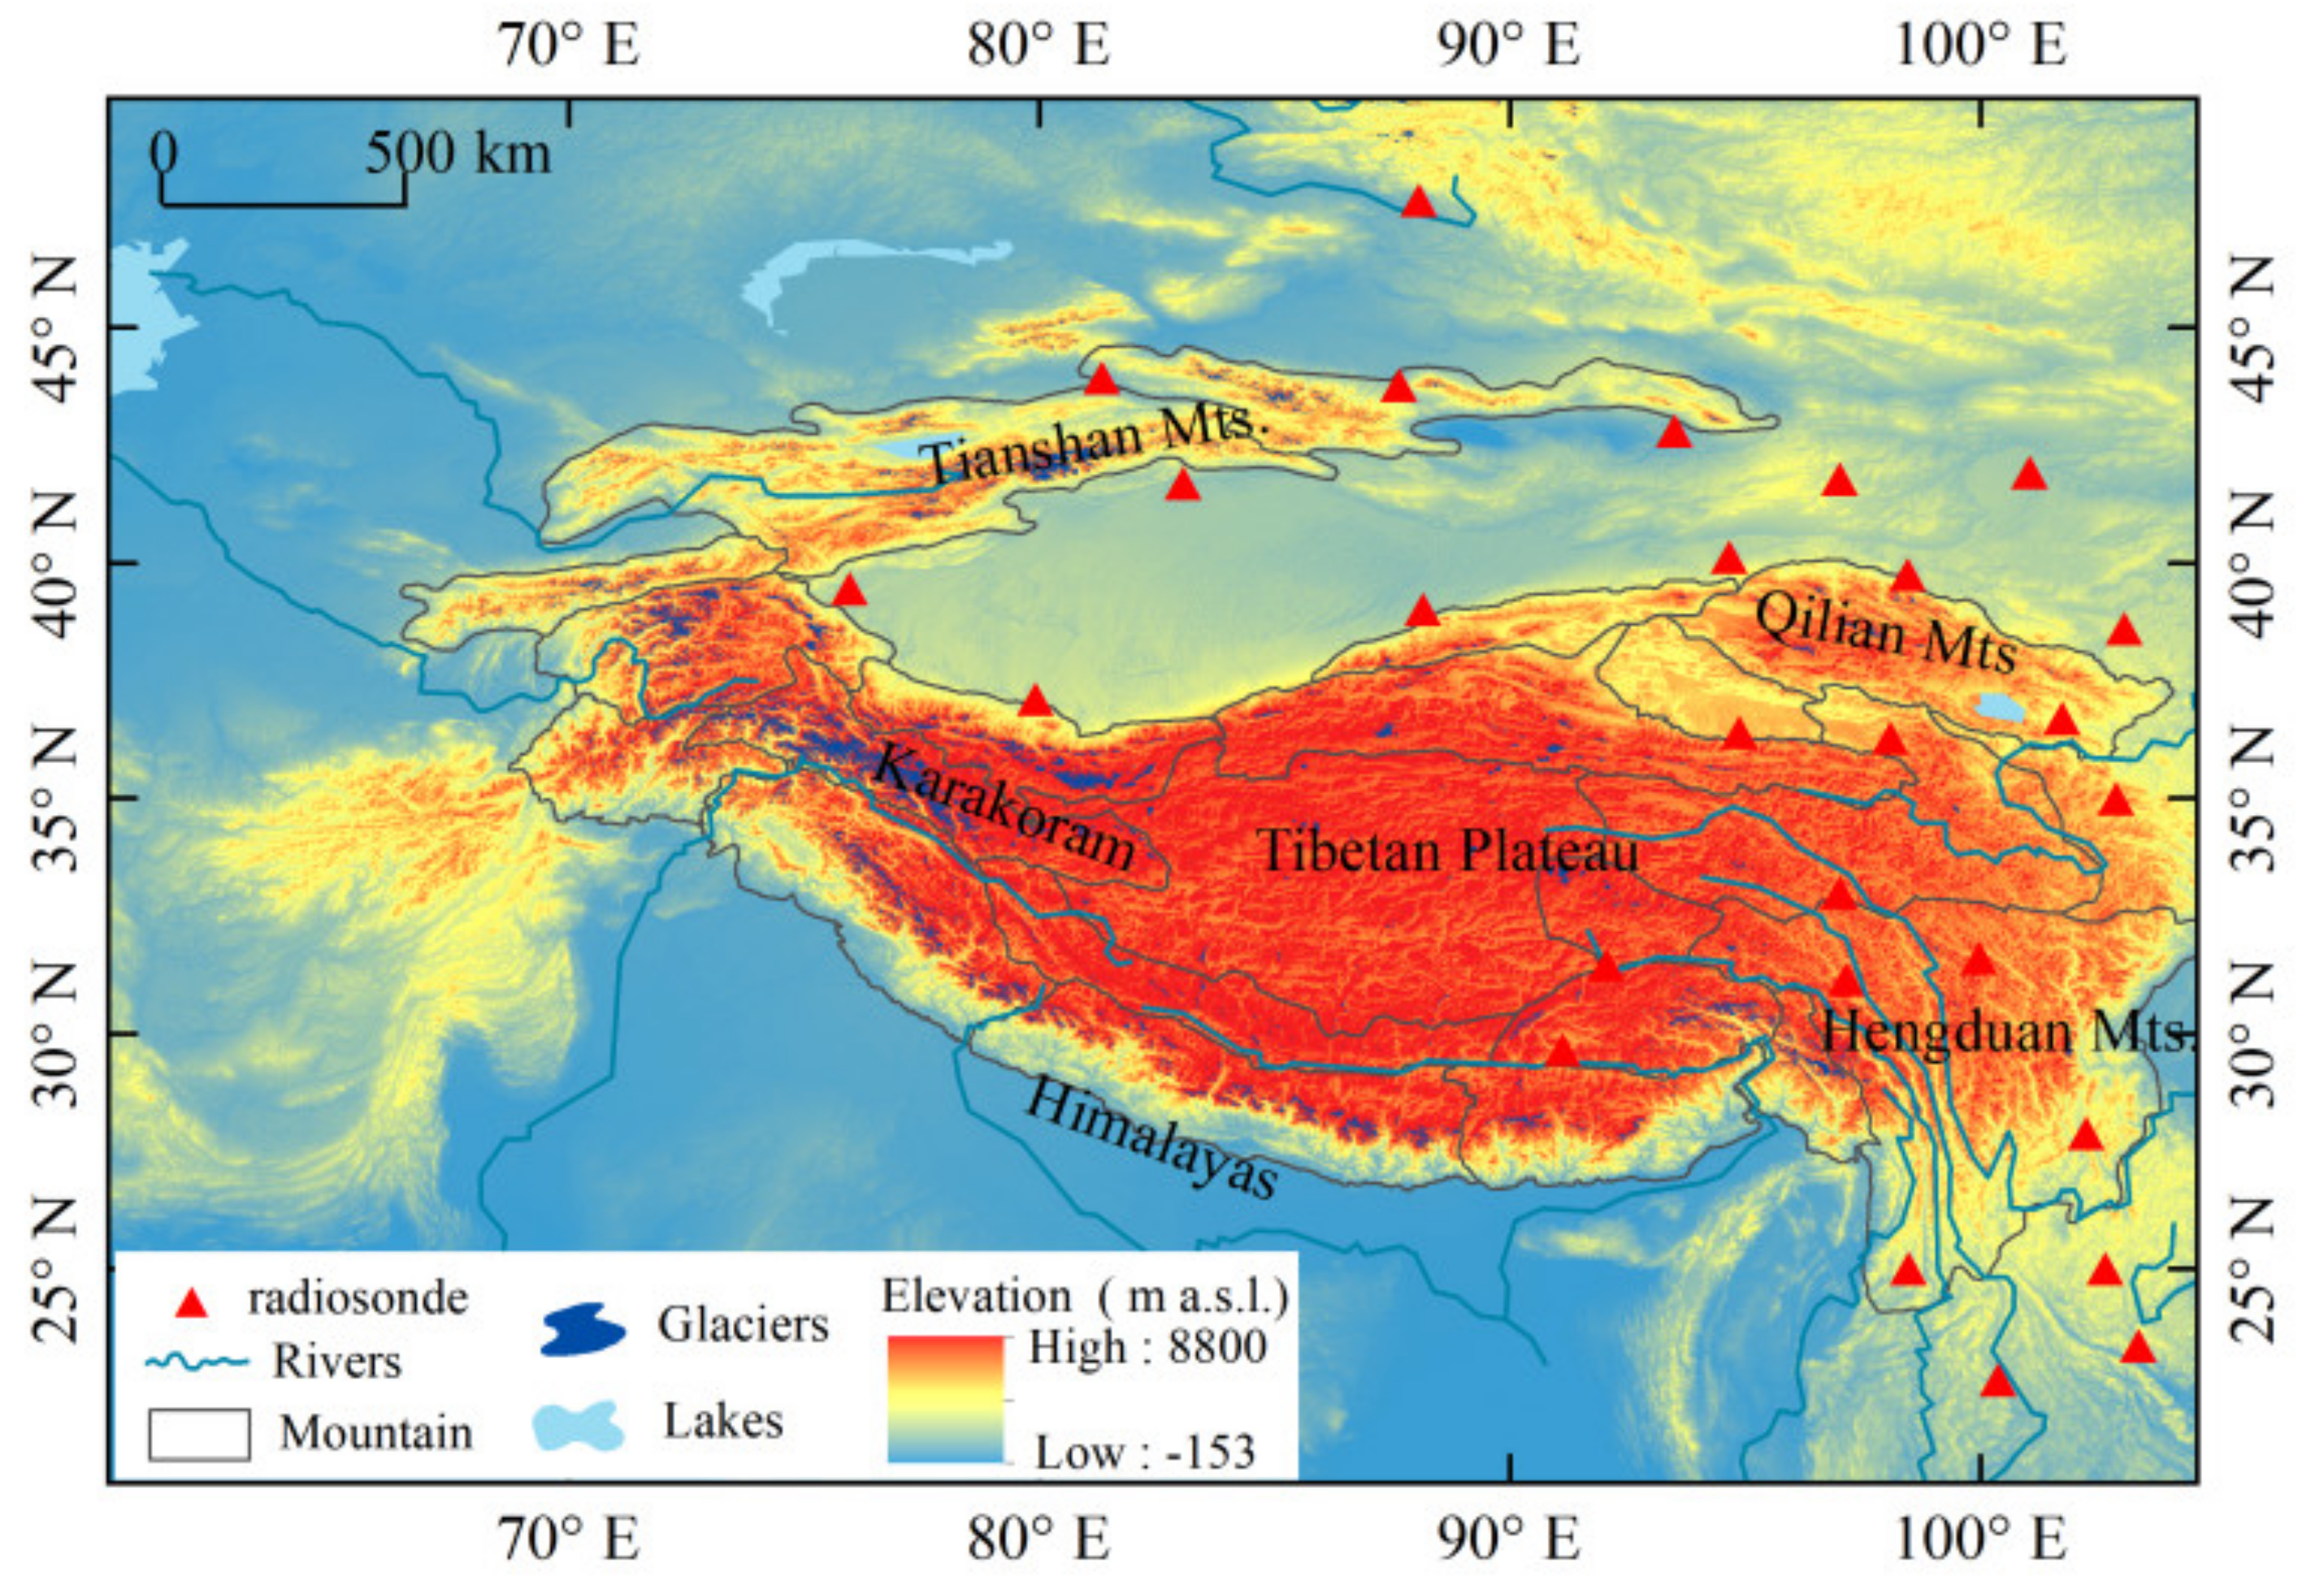
The TP and its surroundings are located in the central arid and semi-arid zone of Asia and Europe, as shown in Figure 1. The TP consists of the Pamir and Hindu Kush area in the west to the Hengduan Mountains in the east, and the Altai Mountains in the north to the Himalayas in the south, covering an area of 2.4 million square kilometers [25]. This area contains the densest distribution of glaciers in the world outside of the two polar regions and is the source of 12 important rivers in Asia [26]. Due to differences in latitude, geographic conditions, and circulation forms, the TP and its surroundings have different moisture sources, with the west and north mainly impacted by westerly circulation, the southwest influenced by the South Asian monsoon, and the east and southeast affected by the East Asian monsoon [27]. As the Third Pole of the world [28], to study the variation of water vapor content and its relationship with precipitation and temperature on the TP is important in understanding the formation and change of the cryosphere as well as the cyclical effects of the climate system.
2.2. Data
2.2.1. Measured Data from Radiosonde Stations
The radiosonde stations data from the China Meteorological Information Service Center (CMSDC), contains mandatory level data for 88 stations in China from 1951–2013, including atmospheric pressure (hPa), altitude (geopotential meters), temperature (0.1 °C), dew point temperature difference (0.1 °C), and wind speed (0.1 m/s). Through a series of quality control measures, namely statistical, we finally selected temperature, altitude, and dew point temperature difference at 0000 UTC and 1200 UTC for each month. In this paper, a total of 27 stations in the TP and surrounding areas from 1980–2019 were selected, as shown in Figure 1. These data have been extensively used in studies on climate change [29,30], and are used to evaluate the quality of satellite datasets and reanalysis datasets.
2.2.2. Satellite Data: AIRS-Only and TRMM
The Atmospheric Infrared Sounder (AIRS) is an instrument on board the Aqua satellite, provided by NASA as part of the Earth Observation System (EOS) [31]. This paper uses monthly water vapor content data from AIRS-only version 6 Level 3 (gridded) [10]. Tropical Rainfall Measuring Mission satellite (TRMM) is a joint mission of the National Aeronautics and Space Administration (NASA) and the Japan Aerospace Exploration Agency (JAXA) [32], choosing TRMM satellite month mean precipitation data to research precipitation on the TP and surrounding areas.
2.2.3. Reanalysis Data: ERA-5 and MERRA2
ERA-5 and the Second Modern-Era Retrospective analysis for Research and Applications (MERRA2) reanalysis datasets were selected. ERA-5 from the European Centre for Medium Weather Forecasting (ECMWF) covers the data-rich period since 1979 [33]. We used the month mean temperature and water vapor content for ERA-5 products from 1980 to 2019. MERRA2 is an atmospheric reanalysis product issued by NASA from 1980 [34], which uses an upgraded data assimilation system from the Goddard Earth Observing System Model Version 5 (GEOS-5). It mainly includes elements such as 2-m air temperature, water vapor content, surface wind speed etc. We chose water vapor content data from 1980–2019 with a temporal monthly resolution.
2.2.4. Datasets of Daily Values of Terrestrial Climate Information for China (V3.0)
In this paper, we calibrated the TRMM precipitation data based on Gauge V3.0 data, the Gauge V3.0 measured precipitation data from the CMSDC, which includes 830 meteorological observation stations. In view of the late establishment of some meteorological stations and the lack of data measurement, the precipitation data of the selected stations were verified and quality controlled. The spatial coverage of data from 1980–2019 was selected as 157 stations from 60° N to 105° E and 20° N to 50° N. More details about these datasets are given in Table 1.
2.3. Methodology
2.3.1. Calculation of Water Vapor Content
Water vapor content (W, in kg m−2) refers to the mass of water vapor in an atmospheric column of any unit area, also known as atmospheric precipitation water. It refers to the depth of the water layer formed at the bottom of an atmospheric column if all the water vapor in the column has condensed [35]. Water vapor content of radiosonde stations need to be calculated with the following formulas. q is the relative humidity (kg. kg−1), Pt is the pressure at the top of the atmosphere at 300 hPa, Ps is the pressure near the ground (hPa), and g is the acceleration due to gravity (m·s−2).
where
P is the air pressure (hPa), e is the water vapor pressure (hPa), E0 is the saturated water vapor pressure at 0 °C (6.11 hPa), t is the temperature of the air at a certain altitude (°C), Δt is the temperature dew point difference (°C), and Td is the dew point temperature (°C).
2.3.2. Evaluation of Water Vapor Content
The product accuracy is measured using the Pearson correlation coefficient (R), relative bias (bias), and root mean square error (RMSE). R can indicate the degree of linear correlation between multi-source datasets and radiosonde stations data. The value range is [−1,1], and the closer to 1, the better the correlation. Bias can reflect the deviation, with a positive value indicating overestimation and a negative value indicating underestimation compared to the radiosonde stations data. The RMSE is used to measure the degree of dispersion, indicating the standard error of multi-source datasets. The optimal value is 0.
2.3.3. Weight Assignment Method
The weight assignment method used in this study is based on the normalization of the accuracy test results of AIRS-only, MERRA2, ERA-5, and the three indicators of R, bias and RMSE are used to give weights to the three products respectively. The principle is as follows.
The larger the R, the better the correlation assessment result, but the larger the bias and RMSE, the greater the degree of deviation and dispersion from the radiosonde stations data, and the less satisfactory are the bias and RMSE results. Thus, it is necessary to take the inverse of R before the normalization process, and the formula is as follows:
Normalization is performed and the equation is as follows:
where m is the number of multi-source products; n is the number of accuracy evaluation indicators; Xi, j is the value of the i-th water vapor content product corresponding to the j-th indicator; Xi is the value of the i-th water vapor content product after normalization of all indicators.
2.3.4. Method of Trend Analysis
The linear trend of water vapor content is expressed as:
where a is the regression coefficient, calculated by the least-squares method, which represents the long-term variation characteristics. The Mann–Kendall trend test is utilized to calculate the Z statistic, and the Z test indicator is used to determine whether the linear trend of change is significant. The value of Z of 1.96–2.58 indicates that water vapor content has passed the significance test of 0.05, and the value of Z greater than 2.58 indicates that it has passed the significance test of 0.01.
2.3.5. Empirical Orthogonal Function (EOF)
EOF is an effective method to study the characteristics and regularity of temporal and spatial changes of an elemental field sequence, and can retain most of the information provided by the original data. EOF plays the role of downscaling and simplification, and effectively extracts spatial field information [36]. To examine whether the individual modes are independent of each other, the EOF results need to be checked by the North test [37]. The EOF can separate the temporal and spatial changes of the variable field. The dominant EOF modes and main components of water vapor content, precipitation, and temperature are obtained by analyzing the first two modes of EOF.
3. Results
3.1. Product Accuracy Evaluation
Compared with the radiosonde stations from the annual scale, the R values of several datasets are higher than 0.94 (Table 2). The R of the satellite product is smaller than the reanalysis datasets. Comparing the two reanalysis datasets, the ERA-5 has the highest correlation (R = 0.97). The bias of AIRS-only and ERA-5 is negative, but MERRA2 is positive, indicating that AIRS-only and ERA-5 underestimate water vapor content and MERRA2 overestimates water vapor content relative to the radiosonde stations data over the TP and surrounding areas. Among the three sets of products, ERA-5 has the highest weighting coefficient of water vapor content, which is 0.36 (Table 3). The weighted ensemble data also has a negative bias, but the deviation (−0.01) is lower compared to the other three datasets. ERA-5 has the smallest RMSE (1.74), and AIRS-only has the largest RMSE (2.38).
Seasonally, the correlation between all datasets (AIRS-only, MERRA2, ERA-5, weighted ensemble data) and radiosonde stations data in descending order is as follows: winter, spring, autumn, and summer. The correlation of all datasets and radiosonde stations data is higher than 0.93, except for AIRS-only (0.88) in summer. Bias of the MERRA2 is smallest in autumn (bias = 0.02 kg m−2) and winter (bias = −0.01 kg m−2), AIRS-only is smallest (bias = 0.02 kg m−2) in spring, weighted ensemble data is smallest (−0.03 kg m−2) in summer. It is worth noting that the bias of the ERA-5, AIRS-only, MERRA2, and weighted ensemble data relative to the radiosonde stations data is overestimated in the spring and underestimated in the winter. With regard to the RMSE, the ERA-5 is the smallest in all seasons but spring is the smallest for MERRA2 (RMSE = 1.60 kg m−2), in order: summer (RMSE = 3.06 kg m−2), autumn (RMSE = 2.04 kg m−2), and winter (RMSE = 0.97 kg m−2). We conclude that the ability of ERA-5 to reproduce the spatial distribution of water vapor content is greater, comparing MERRA2 and AIRS-only. Except for spring when AIRS-only has the highest weighting coefficients of 0.61, the MERRA2 has the highest weighting coefficients of 0.39, 0.55, and 0.58 in summer, autumn, and winter, respectively (Table 3). Obviously, the reliability of different datasets in reproducing the water vapor content distribution characteristics varies with the different time scales over the TP. Compared with the simple unweighted products, the weighted ensemble data showed better fusion as weighted ensemble data are more capable of capturing water vapor content characteristics. The correlation between the weighted ensemble data and the radiosonde stations data generally increases, the deviation decreases significantly, and the dispersion reduces distinctly.
3.2. Spatiotemporal Distribution of Water Vapor Content
3.2.1. Spatial Variability of Water Vapor Content
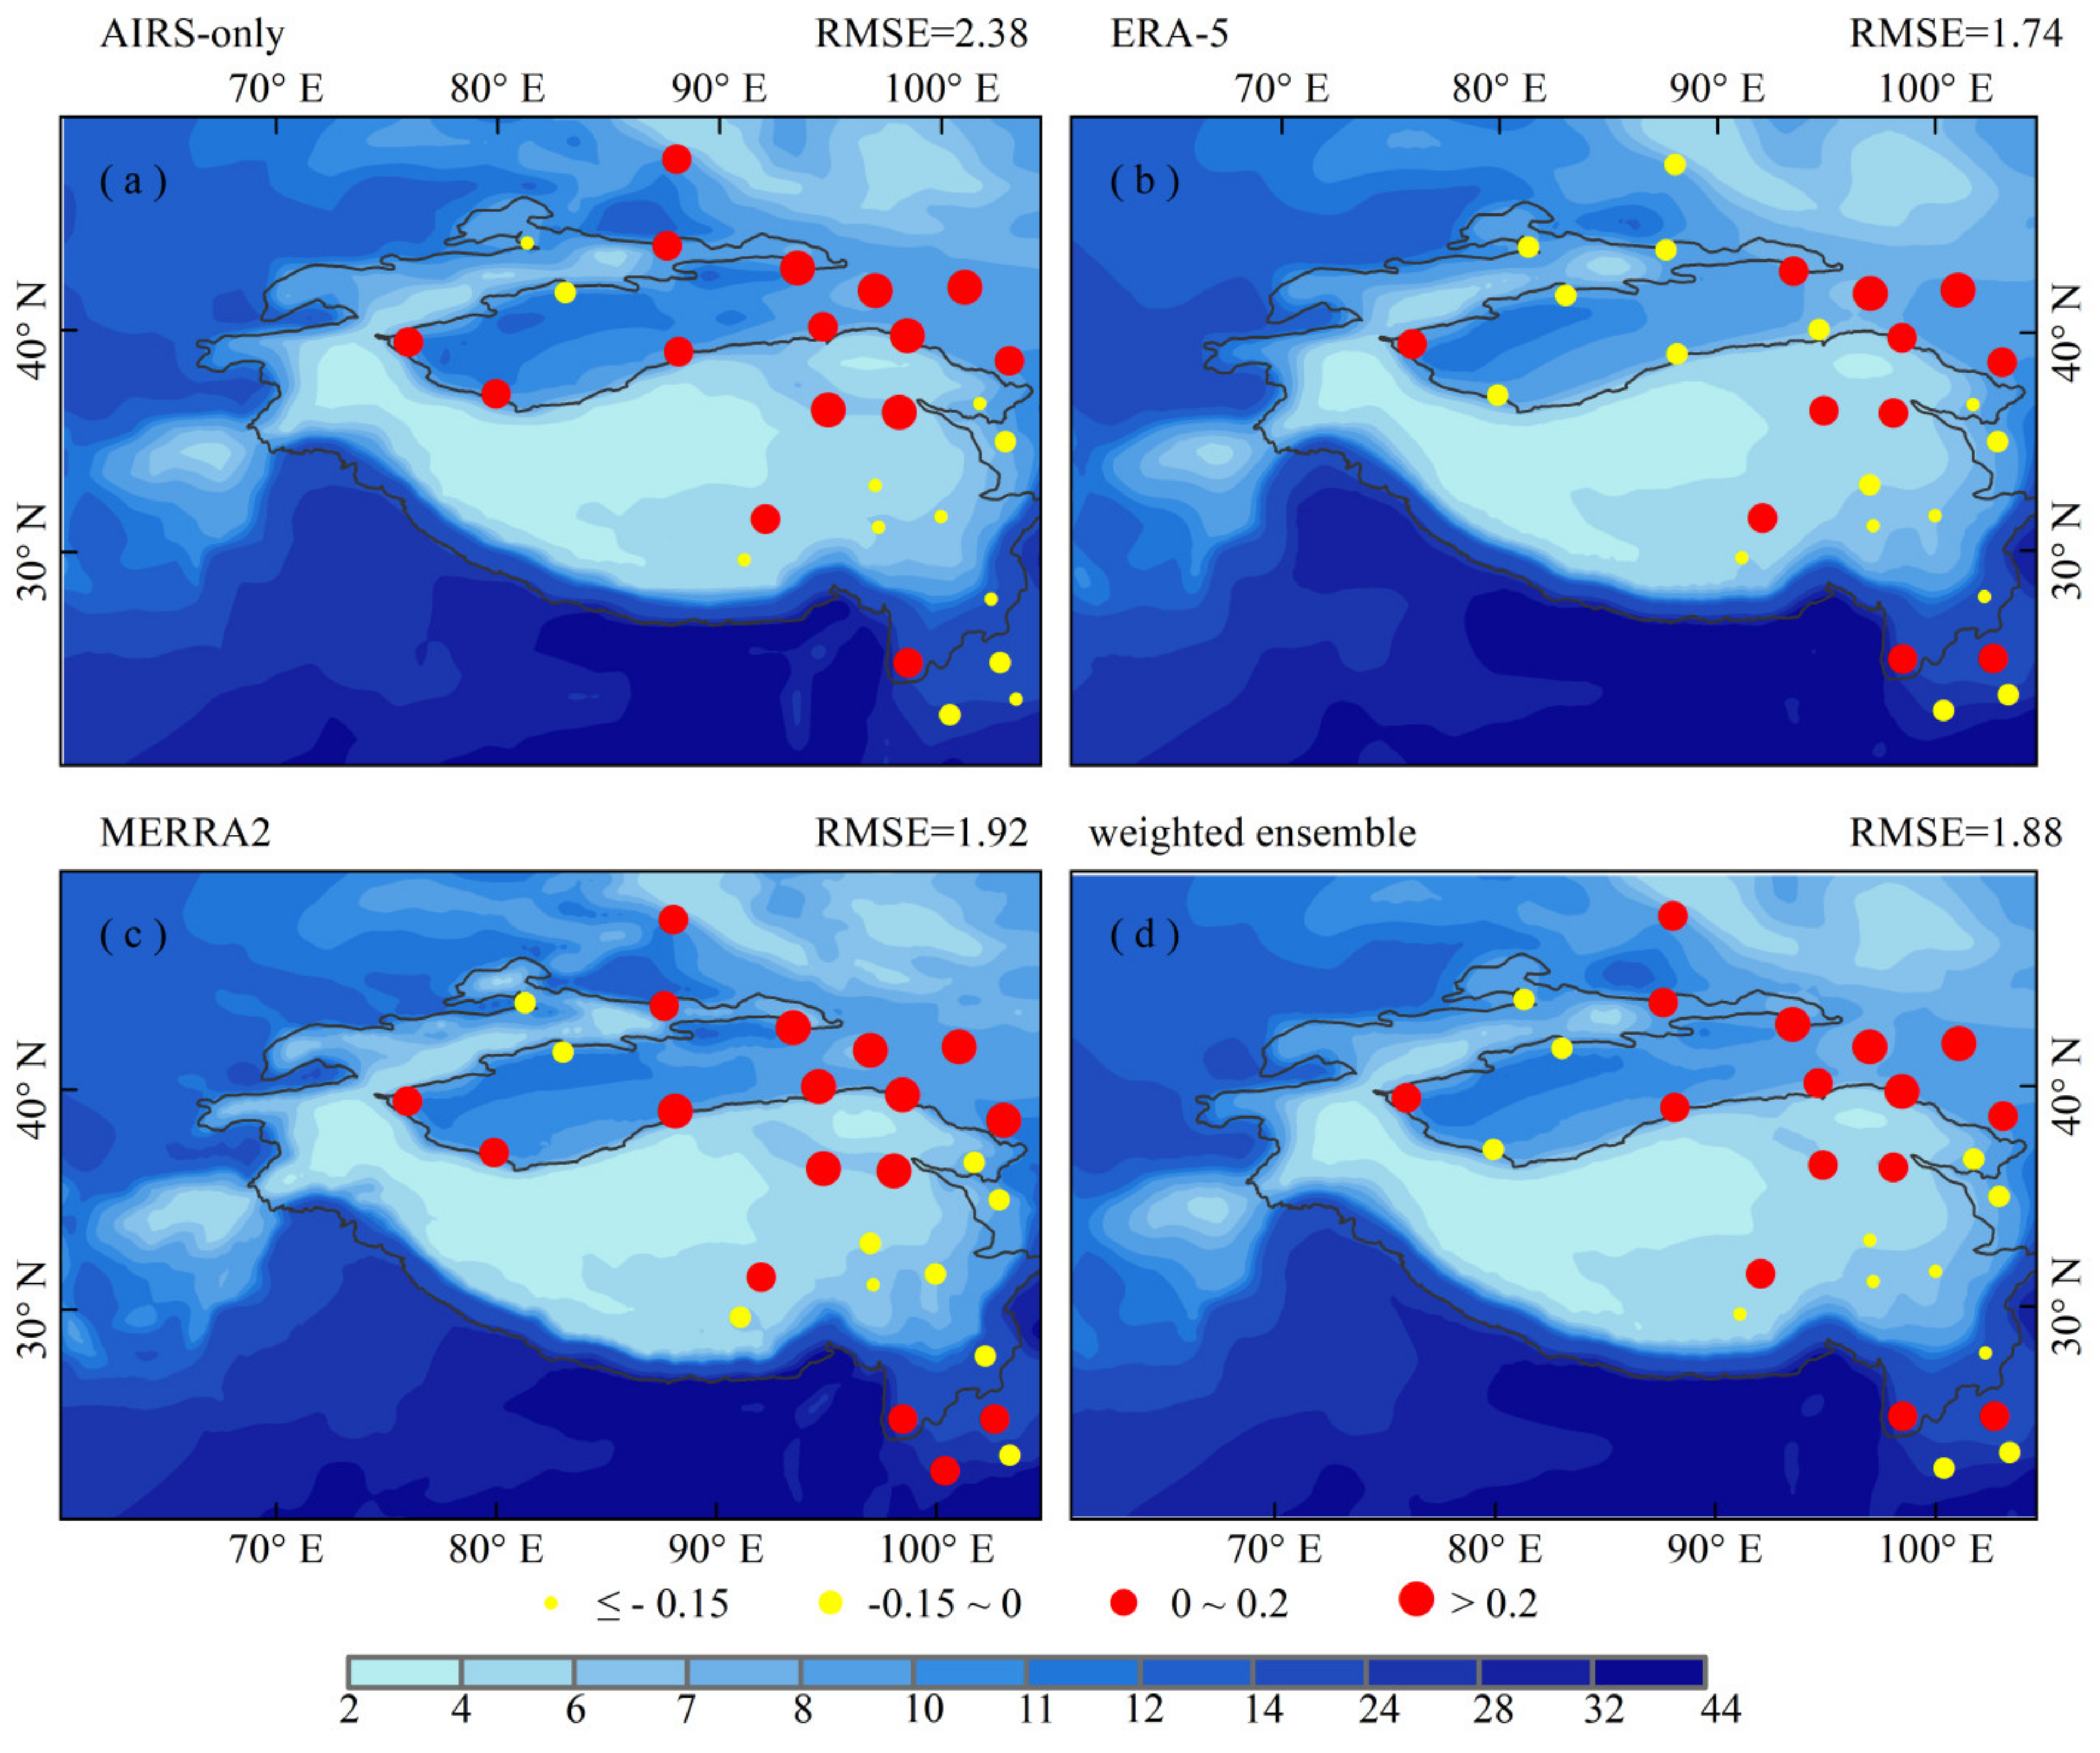
The spatial distribution of AIRS-only, ERA-5, MERRA2, and weighted ensemble data of annual mean water vapor content over the TP and its surroundings from 2003–2017 is shown in Figure 2. The average water vapor contents of all datasets over the TP are smaller than those over the surrounding areas, which is consistent with previous study [12]. The annual mean of water vapor content in the TP is between 2–12 kg m−2, while in the surrounding regions such as the southern part of the TP, the water vapor content is between 12–32 kg m−2. Water vapor content in the TP interior mainly comes from the lower latitudes. There are two main moisture transport channels in the south [38], the Indian Ocean summer monsoon and the mid-latitude westerly zone which enter through huge canyons such as the Brahmaputra River, making it difficult for water vapor to enter the interior.
To evaluate the ability of the AIRS-only, ERA-5, MERRA2, and weighted ensemble data in reproducing the characteristics of the annual mean water vapor content on the TP, we interpolated all the gridded data into each radiosonde station using kriging interpolation and calculated the difference between them (Figure 2). Compared with the radiosonde stations data, AIRS-only, ERA-5, MERRA2, and weighted ensemble data overestimate the water vapor content around the Qilian Mountains, and underestimate in the northern part of the Hengduan Mountains. It is of interest to note that AIRS-only (bias = 0.48 kg m−2), ERA-5 (bias = 0.35 kg m−2), MERRA2 (bias = 0.5 kg m−2), and weighted ensemble data (bias = 0.44 kg m−2) have the largest positive bias at the Ejinnak station, while Changdu station have the largest negative bias of −0.35 kg m−2, −0.28 kg m−2, −0.27 kg m−2 and −0.3 kg m−2, respectively. Overall, the bias of ERA-5 is smaller than other datasets. In the upper right corner of Figure 2, the RMSE of each dataset is shown, with the largest RMSE for AIRS-only (2.38 kg m−2) and the smallest for ERA-5 (1.74 kg m−2). In conclusion, ERA-5, AIRS-only, MERRA2, and weighted ensemble data can represent the spatial distribution of water vapor content over the TP and its surroundings.
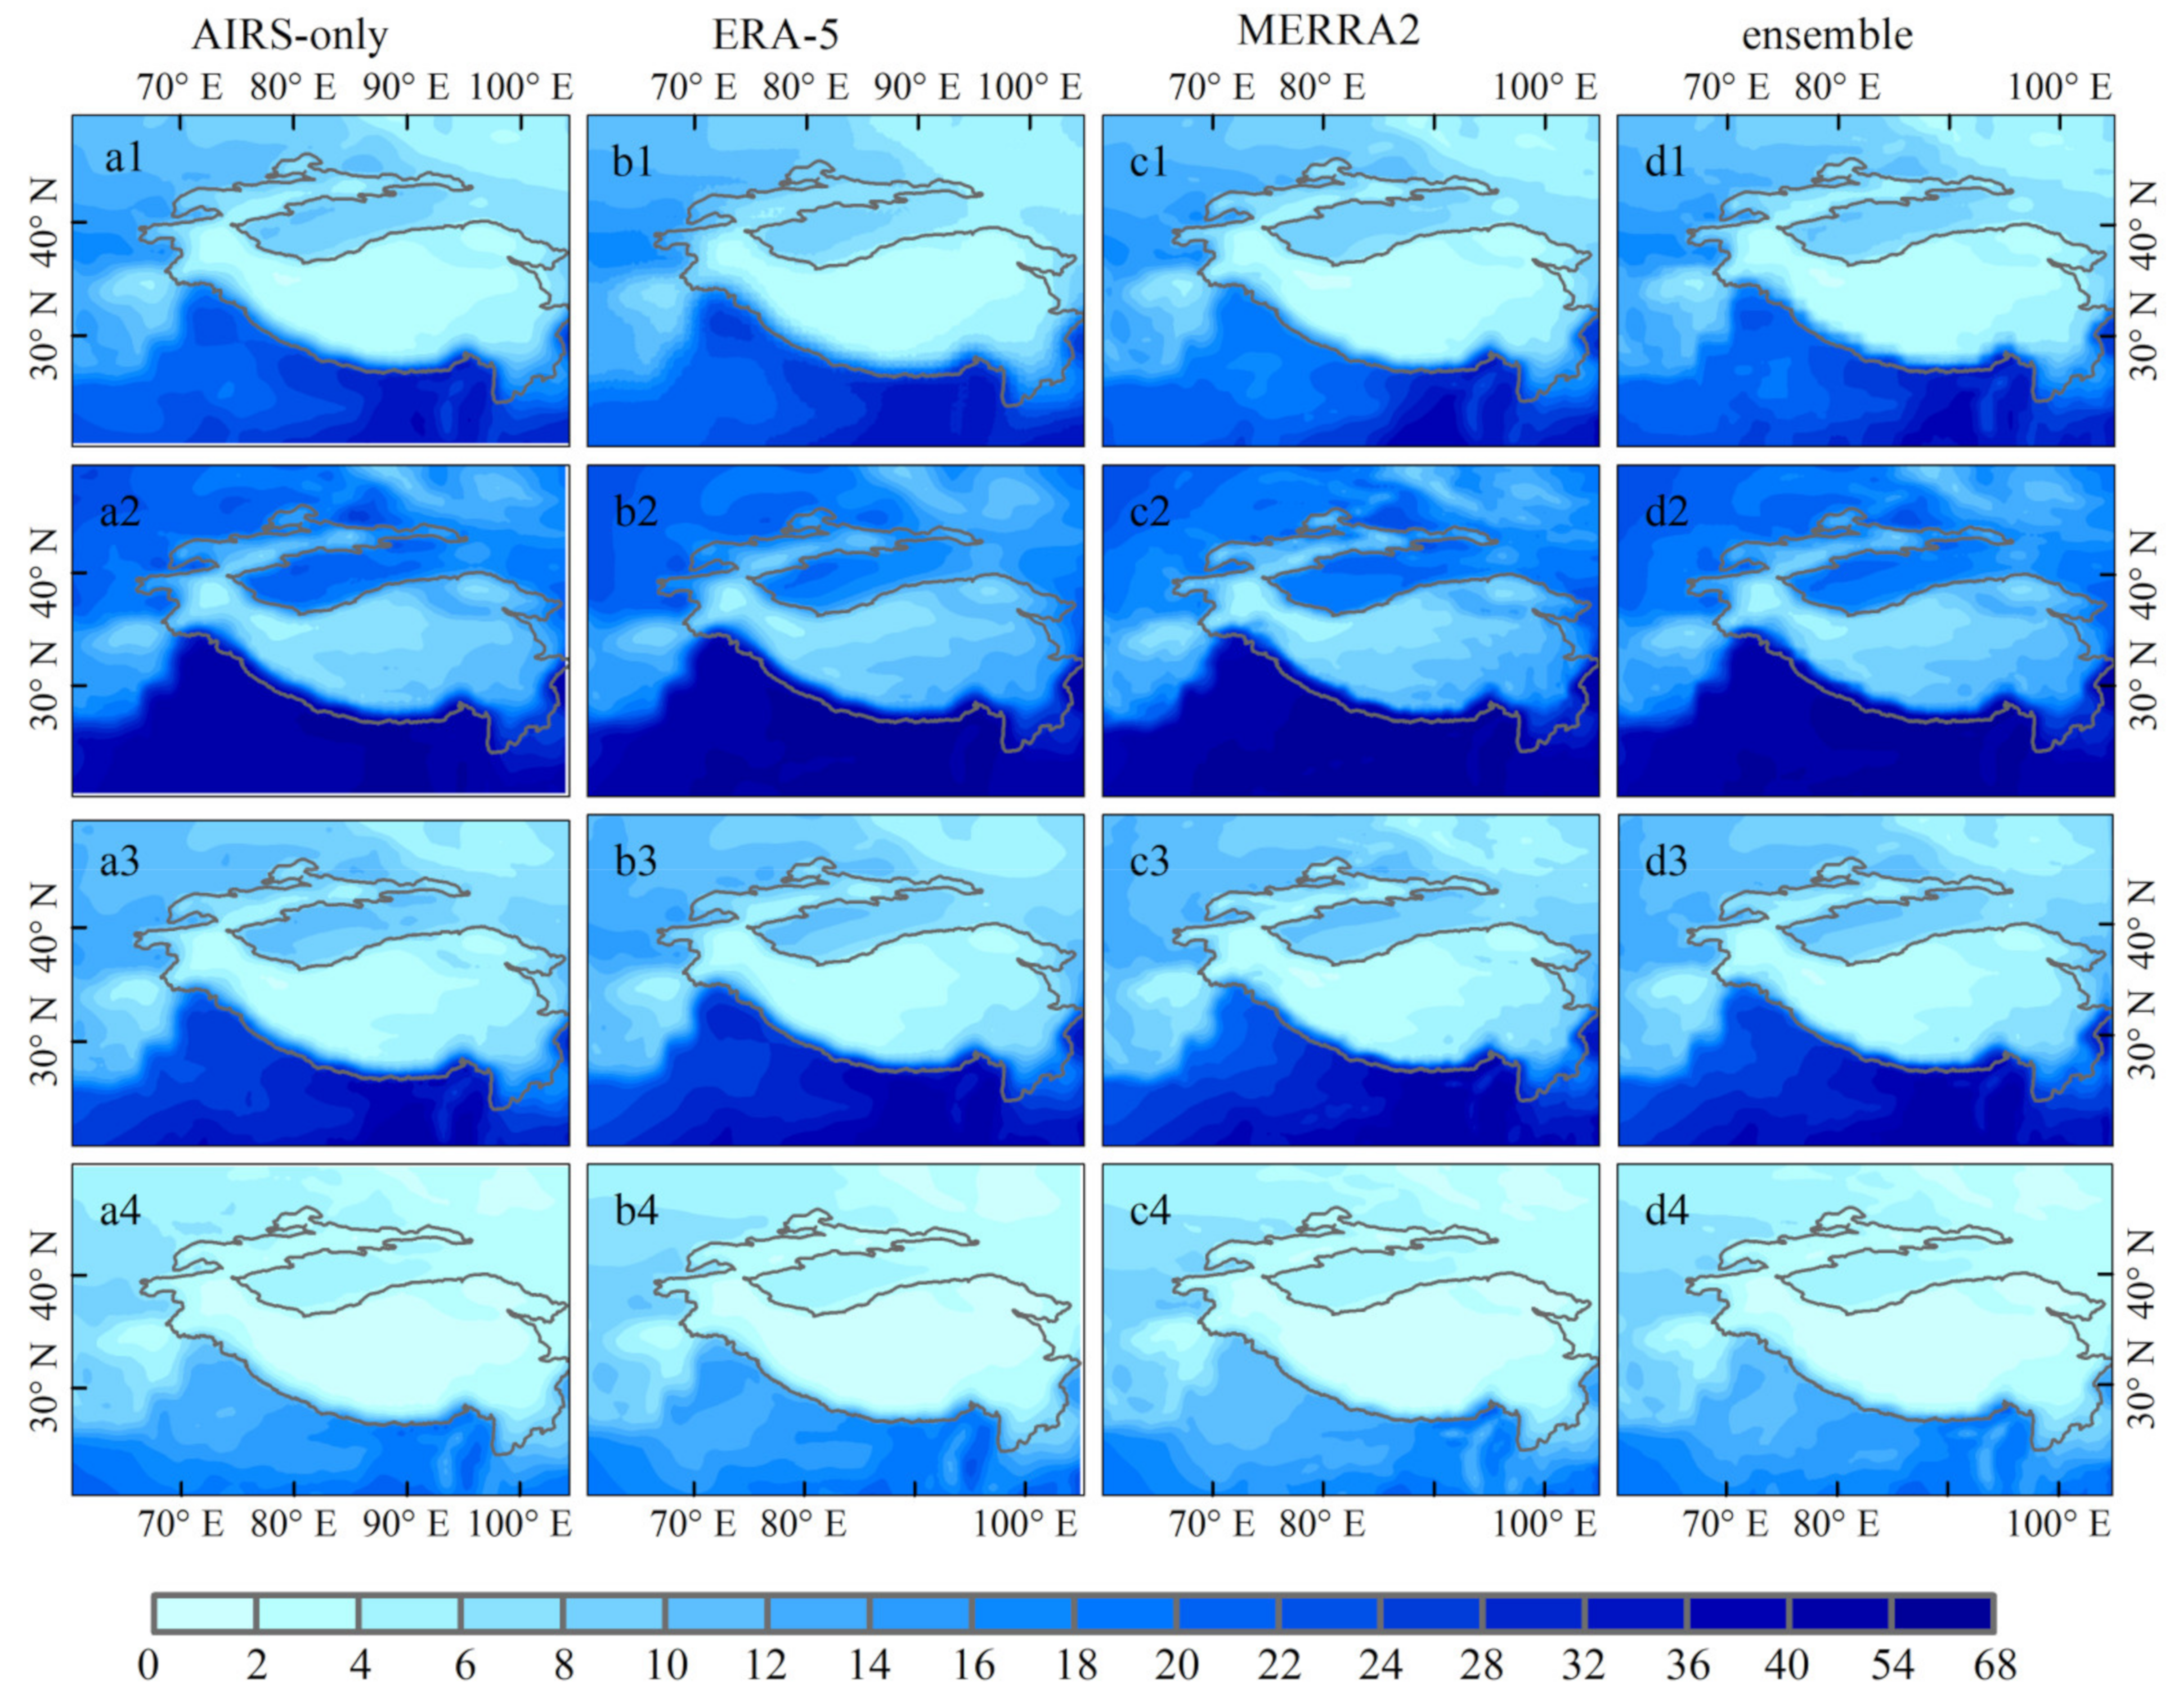
Spatial distribution of seasonal water vapor content variations over the TP and surrounding areas is shown in Figure 3. Much higher water vapor content is observed during the summer than other seasons, the largest water vapor contents of AIRS-only, ERA-5, MERRA2, and weighted ensemble data are 59.76 kg m−2, 66.44 kg m−2, 67.74 kg m−2, and 64.62 kg m−2, respectively, because of the large amount of water vapor brought by the summer monsoon from the lower latitudes (the Bay of Bengal and the Arabian Sea) northward [38]. In winter, the smallest value of water vapor content is less than 1 kg m−2 (Figure 3a4–d4), which is due to TP and the surrounding areas being mainly controlled by the prevailing western wind, while the low temperature over the plateau has limited capacity to hold more water vapor, resulting in a dry atmosphere. Water vapor content in spring and autumn lies between that of summer and winter.
3.2.2. Temporal Trends of Water Vapor Content
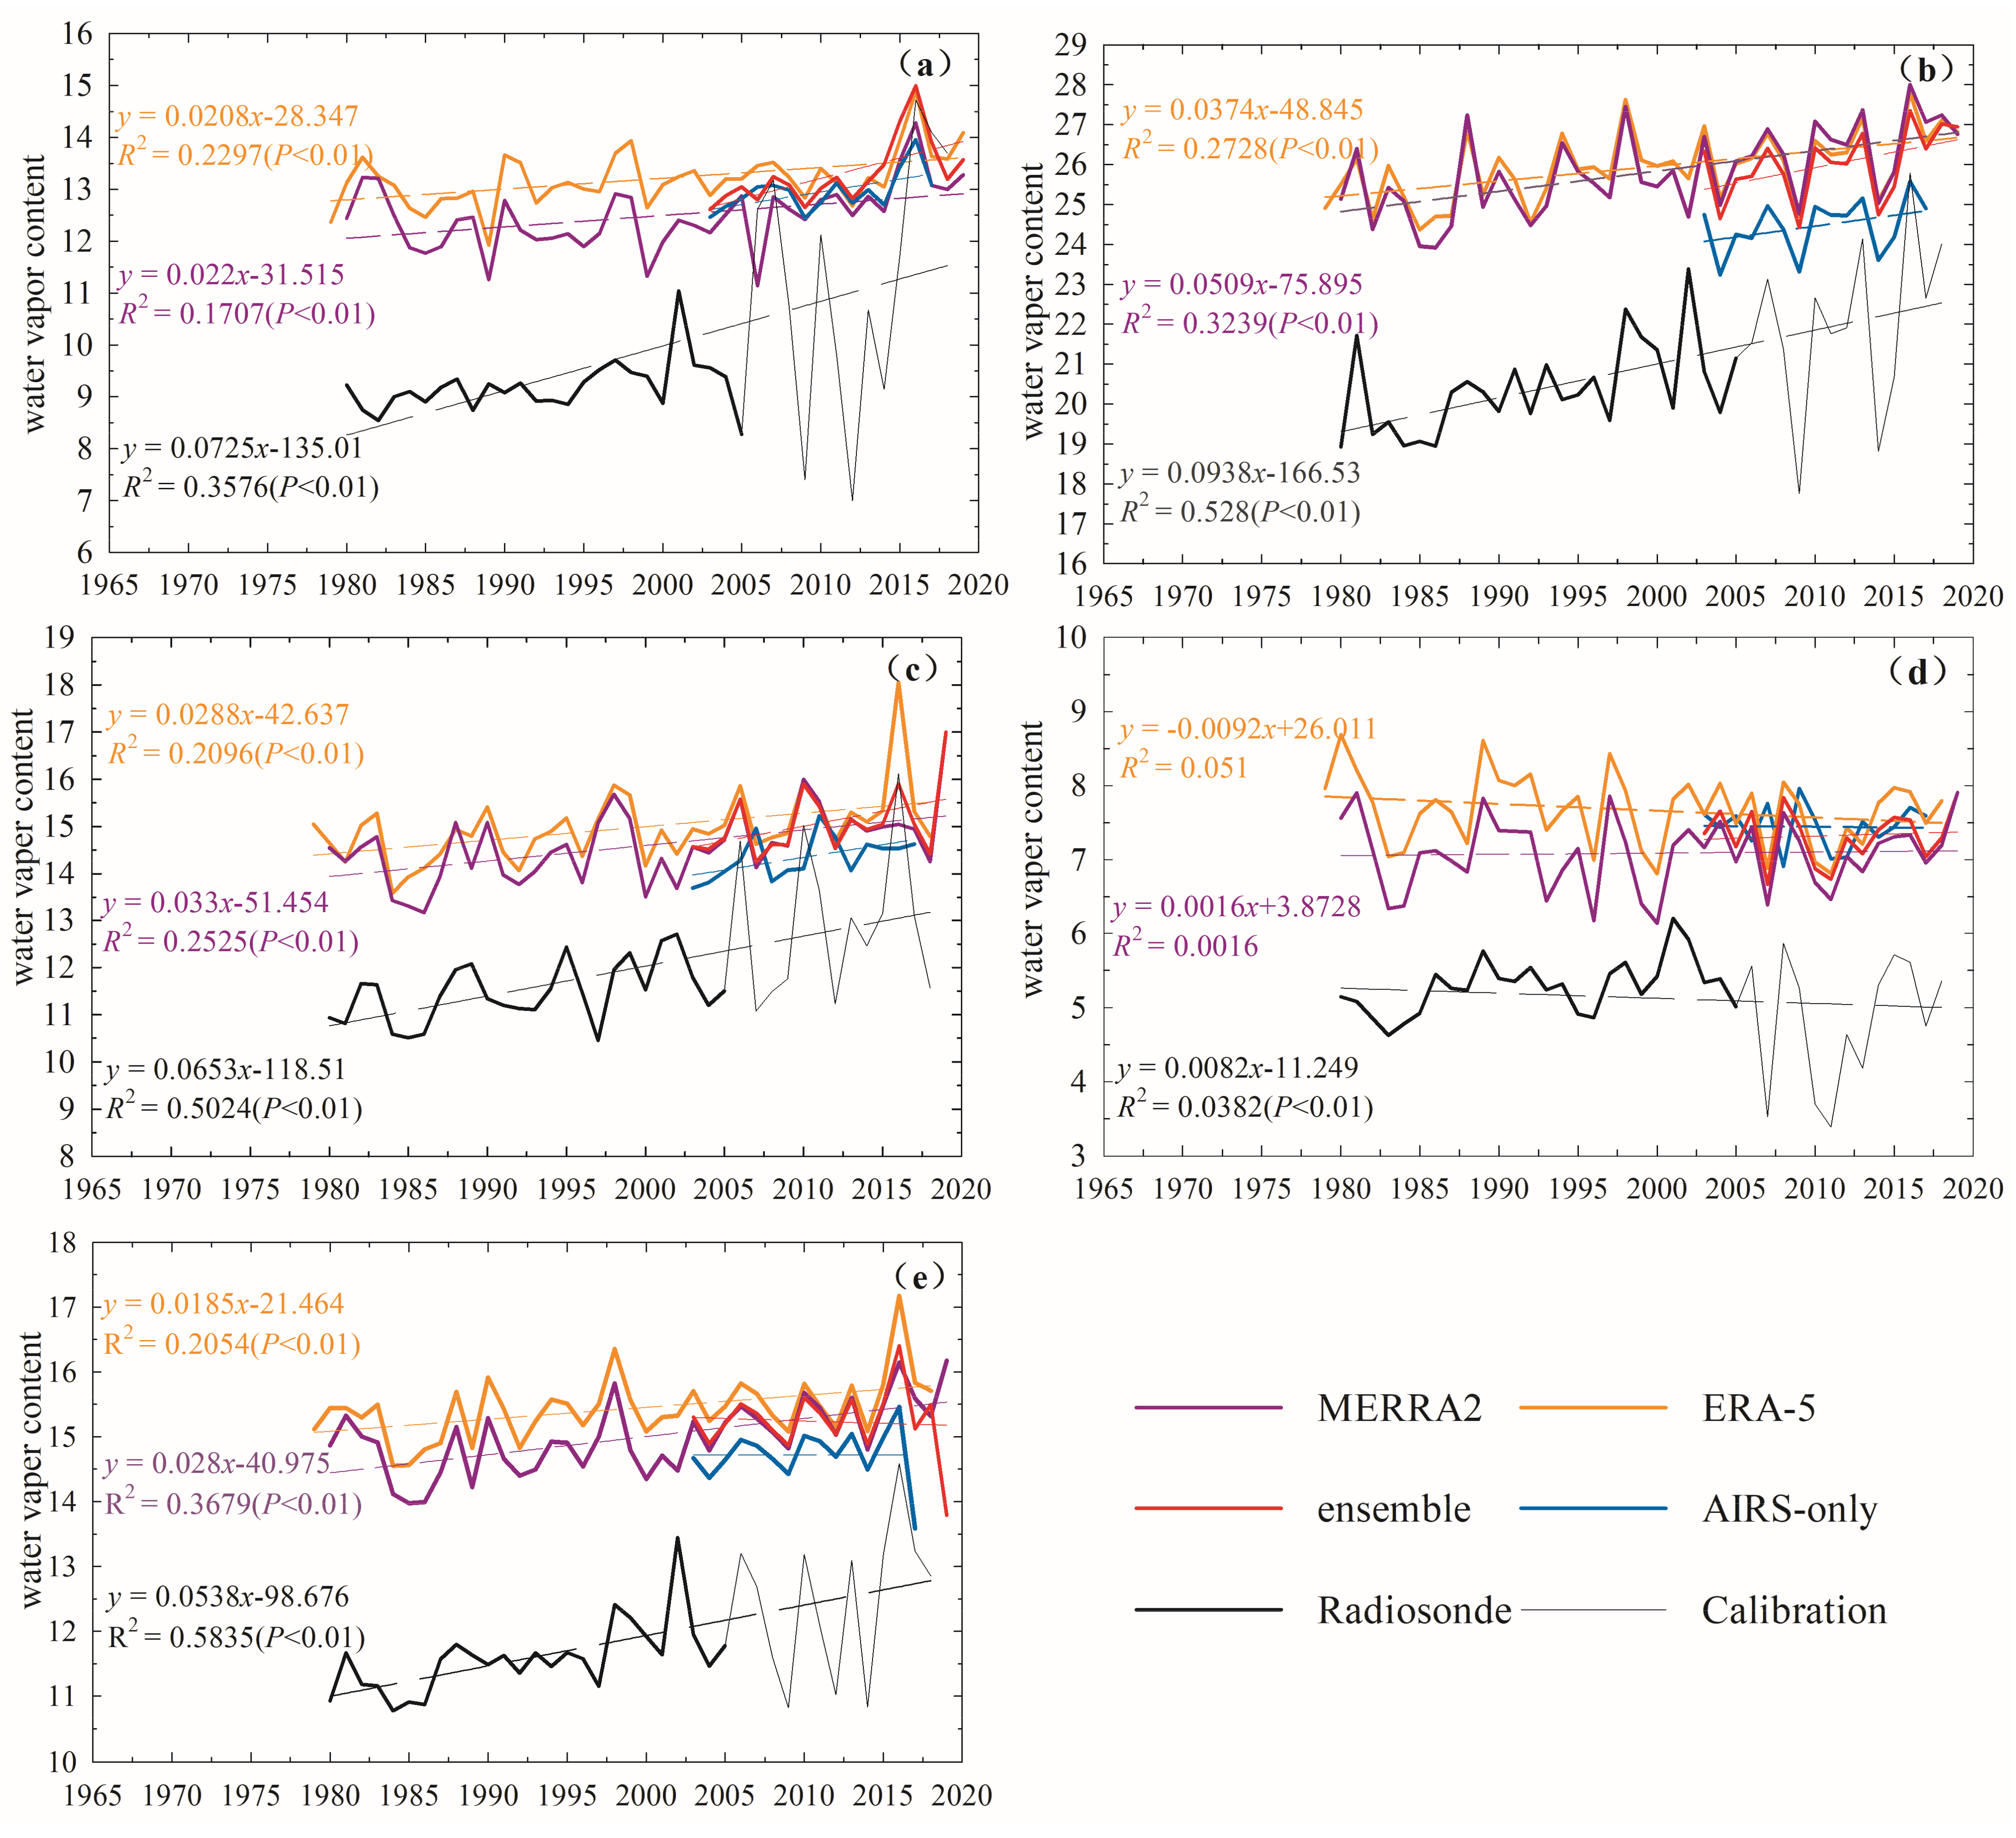
Guo et al. [39] and Hao et al. [40] showed that Chinese sounder data underwent a change in instrument type in the early 2000s, the humidity sensor was abnormally dry. Thus, it is necessary to correctly interpolate the water vapor content of radiosonde stations data after 2006. The temporal variation and linear trend of the annual mean water vapor content on the TP and its surroundings from 1980 to 2019 can be seen in Figure 4e. Water vapor content of ERA-5, MERRA2, weighted ensemble data, and radiosonde stations data show a positive trend in the annual variation with an increase of 0.018 kg m−2, 0.028 kg m−2, 0.019 kg m−2, 0.07 kg m−2, respectively, of which ERA-5, MERRA2, and radiosonde stations data has a positive trend at 99% confidence level. AIRS-only shows a negative trend, and the negative trend is not significant owing to the shorter time series, decreasing by −0.0001 kg m−2. In terms of values, ERA-5, MERRA2, AIRS-only, and weighted ensemble data are higher than the radiosonde stations data. It can be seen that ERA-5, MERRA2, weighted ensemble data, and radiosonde stations data had the largest values of water vapor content in 2016, with values of 17.17 kg m−2, 16.15 kg m−2, 15.46 kg m−2, 16.40 kg m−2, and 14.58 kg m−2, respectively.
There are significant seasonal differences of water vapor content in TP and surrounding areas, the amount of season mean water vapor content increases in the order of winter, spring, autumn, and summer. Consistent with the annual variation, the values of AIRS-only, MERRA2, ERA-5, and weighted ensemble data are almost higher than the radiosonde stations data. This is probably because the high values of water vapor content are mainly located in the south part of the TP and surrounding areas, while the radiosonde stations are mainly concentrated in the eastern part of the TP and surrounding areas. For ERA-5, MERRA2, AIRS-only, weighted ensemble data, and radiosonde stations data, the season mean water vapor content tends to increase in spring, summer, and autumn, with ERA-5, MERRA2 and radiosonde stations data passing the 99% significance test, while the trend of AIRS-only and weighted ensemble data is not significant. In contrast, the water vapor content in winter showed a constant or slightly decreasing trend, but the decreasing trend was not significant for the datasets except for the radiosonde stations data. There is a small difference between MERRA2 and the radiosonde stations data in terms of time variation, while the fluctuation trend of MERRA2 is almost the same as radiosonde stations data.
3.3. The Relationship between Water Vapor Content and Climatic Elements
3.3.1. Spatial Distribution of Temperature and Precipitation
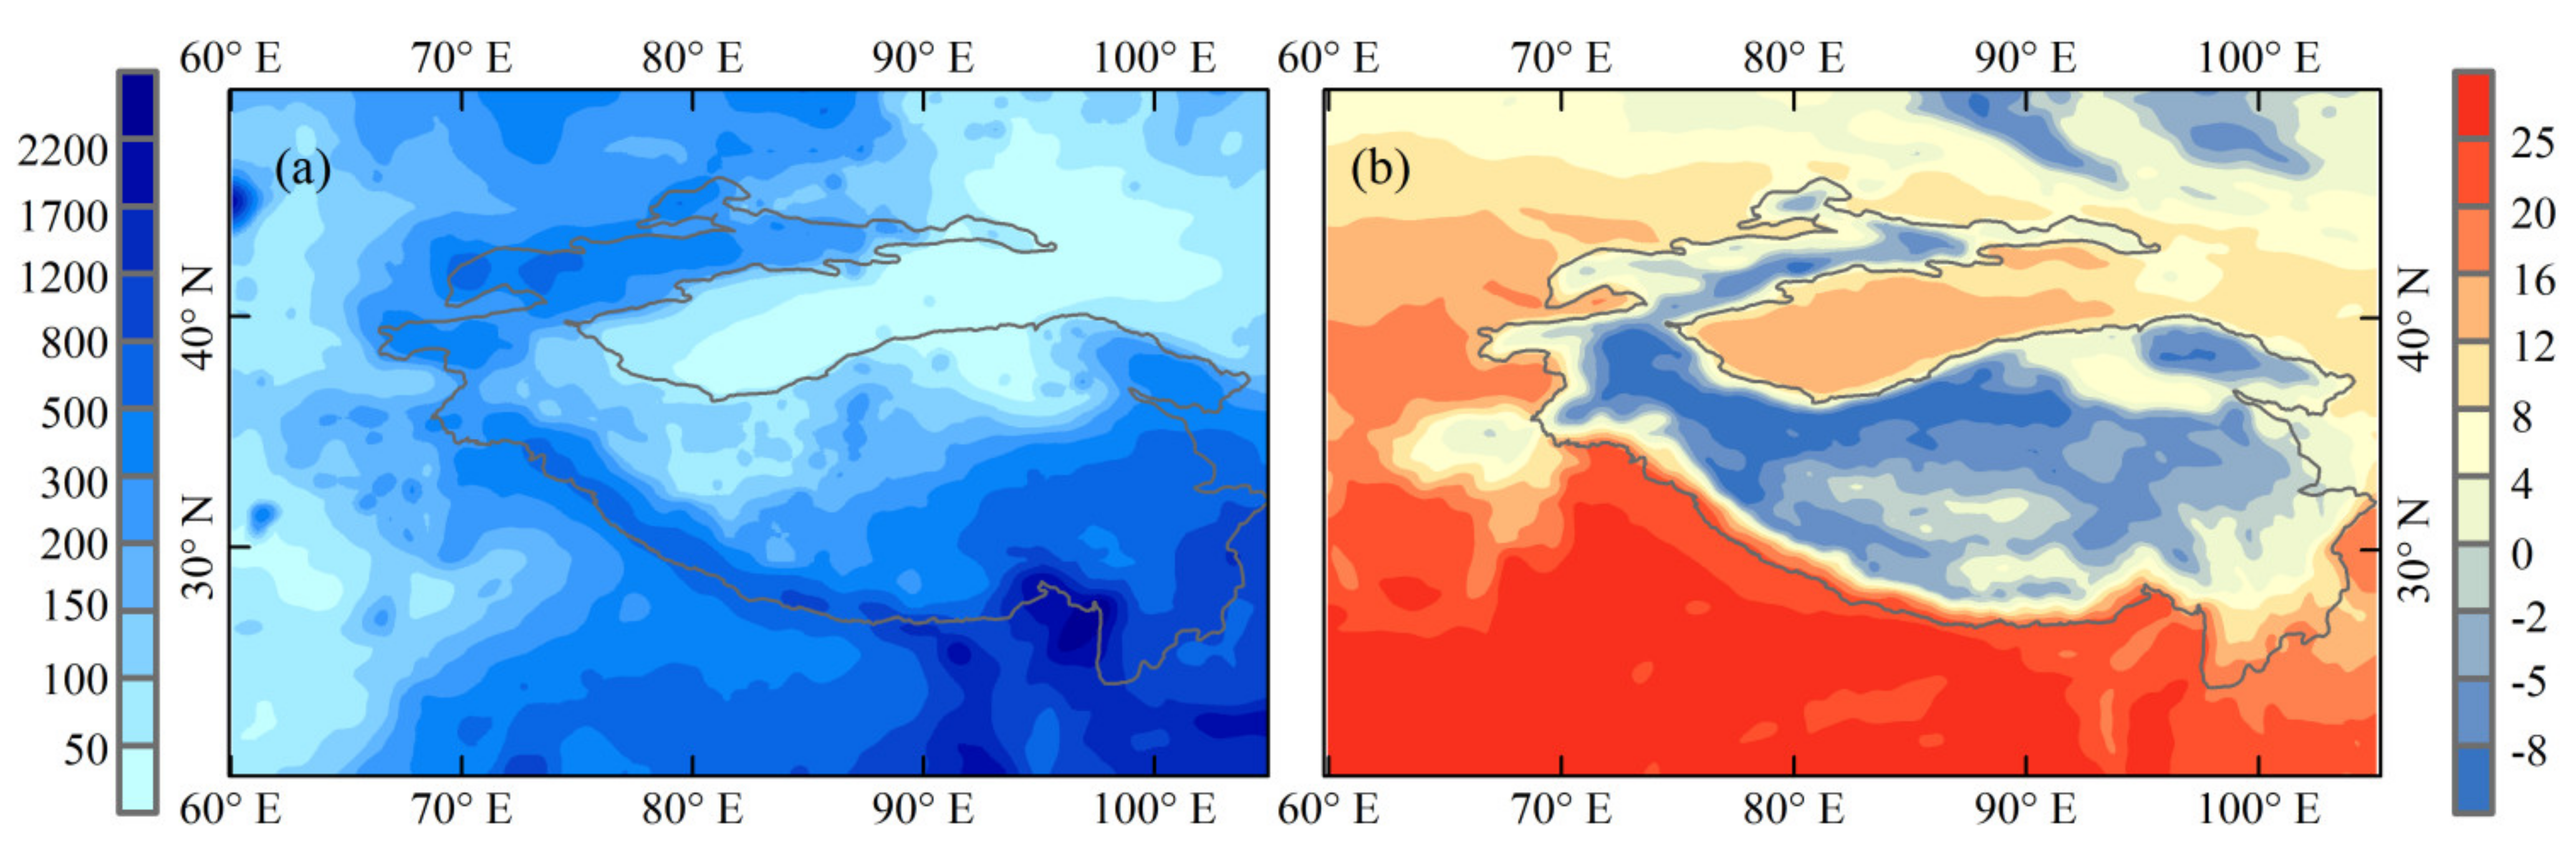
Figure 5 shows the spatial distribution of annual mean temperature and precipitation on the TP and surrounding areas. Precipitation and temperature in general decrease from the southeast to the northwest over the TP (Figure 5a). The high values of precipitation appear in the southern part of the TP with a maximum value of over 2500 mm. It is worth noting that precipitation has a weak negative correlation with altitude, which is consistent with the findings of Qin et al. [41]. The high value zone of temperature occurs in the southern part of the TP (above 25 °C) (Figure 5b). The distribution of temperature on the plateau is intimately related to the topography. The southern part of the TP is relatively low-lying, and is influenced by the warm and humid air currents of the South Asian monsoon and East Asian monsoon. Therefore, the southern part of the TP is warmer.
3.3.2. The Relationships between Water Vapor Content and Temperature and Precipitation
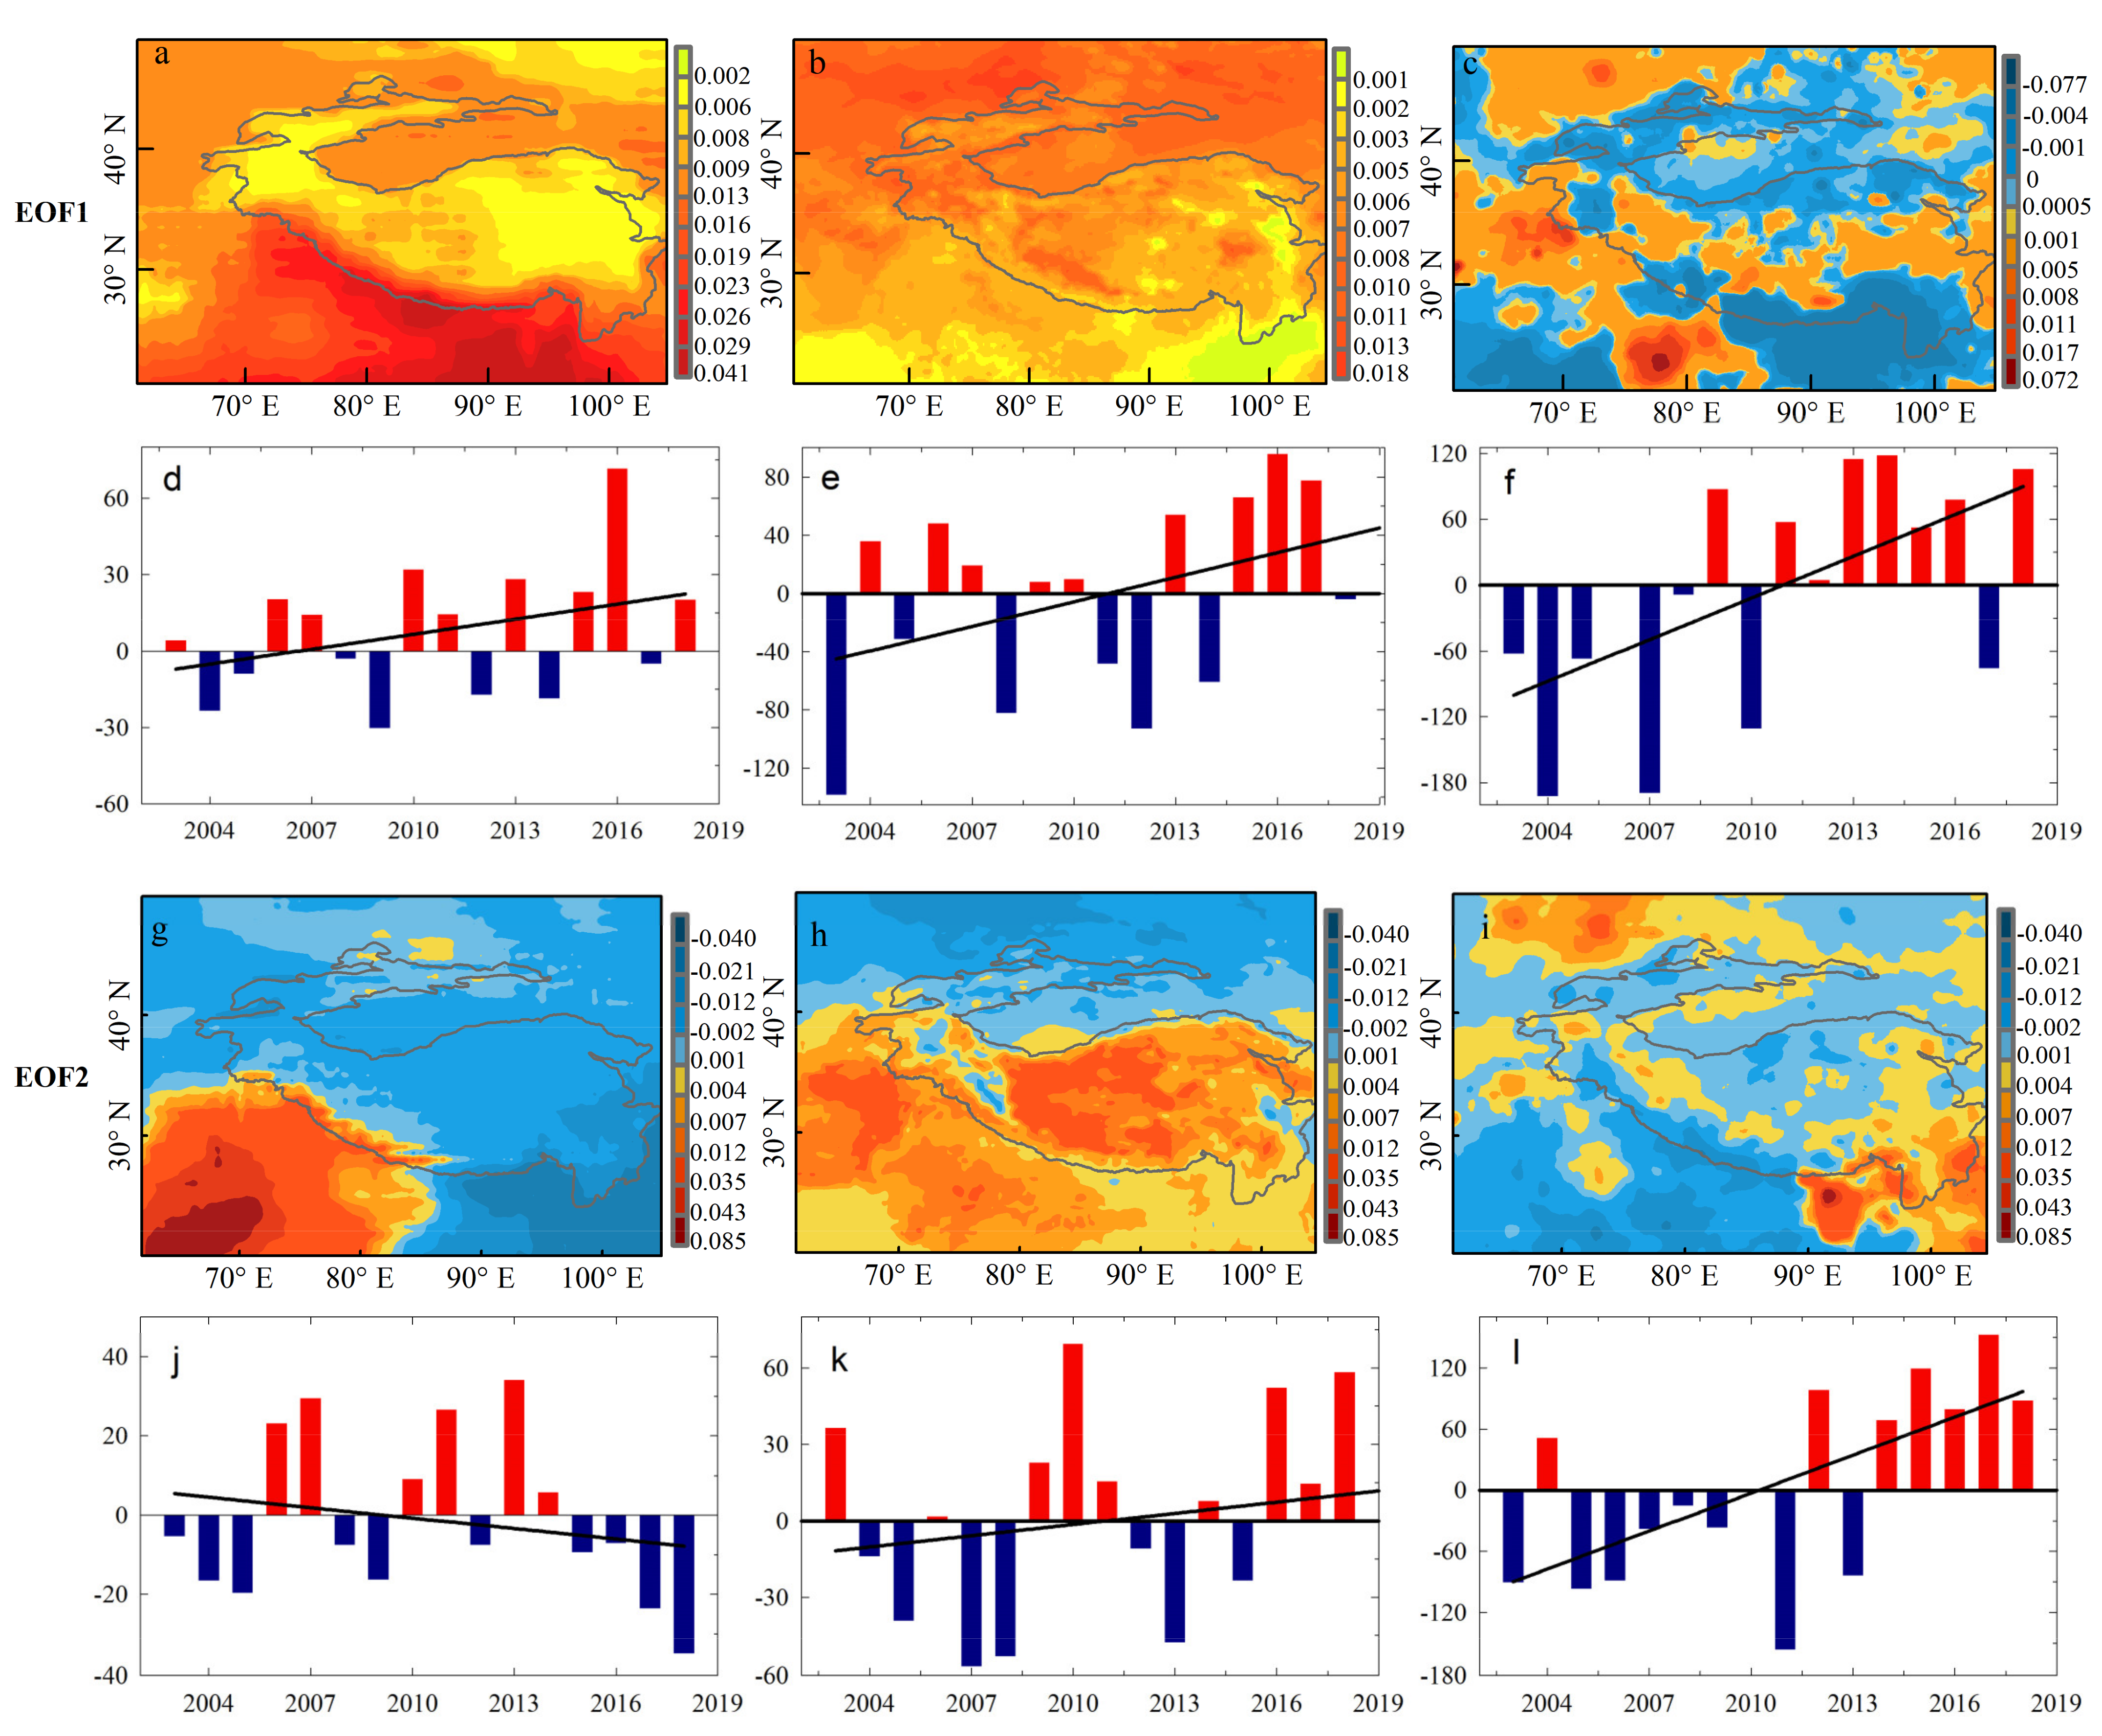
Based on the annual water vapor content of weighted ensemble data, annual precipitation of calibrated TRMM, and annual temperature of ERA-5 from 2003–2017, the spatial and temporal distribution characteristics of the three meteorological elements were analyzed using EOF. The first two modes of EOF of the three meteorological elements passed the North test. Figure 6a shows the water vapor content values of the first spatial mode of EOF, which are all positive over the TP. Interpretation variance in the first mode is 52.7%, indicating that the water vapor content has good convergence in space. Figure 6g shows the water vapor content value of the second spatial mode of EOF, which is negative in most areas except for the southwestern part of the plateau, which is roughly northwest–southeast trending, and is basically consistent with the distribution pattern of positive in the south and negative in the north found by Zhou et al. [19] and Yao et al. [21]. Guo et al. [42] suggested that this phenomenon is due to the fact that water vapor from the Yarlung Tsangpo valley is blocked by the mountains during its northward movement, which makes it difficult for it to reach the north, and it accumulates on the south windward slope of the Tanggula Mountains. From Figure 6b, the first spatial mode of EOF analysis value of the temperature is positive across the region, indicating that the average temperature variation on the TP is consistent. Interpretation variances of the first mode of temperature is 45.5%, showing that the temperature has good convergence in space. From Figure 6h, the second spatial mode of EOF analysis value of the temperature is basically inverse north–south type, roughly bounded by 30° N, displaying a “south positive and north negative” pattern. The interpretation variance of the first mode of precipitation is only 17.3%, the convergence is slow and the value of precipitation of the first spatial mode of EOF presents a “negative-positive-negative” pattern from south to north on the TP (Figure 6c). The results of the first two temporal modes of EOF analysis demonstrate that water vapor content, temperature, and precipitation have shown similar increasing trends over the past 15 years (Figure 6d–f,k,l), except for the second temporal mode of the water vapor content of EOF (Figure 6j).
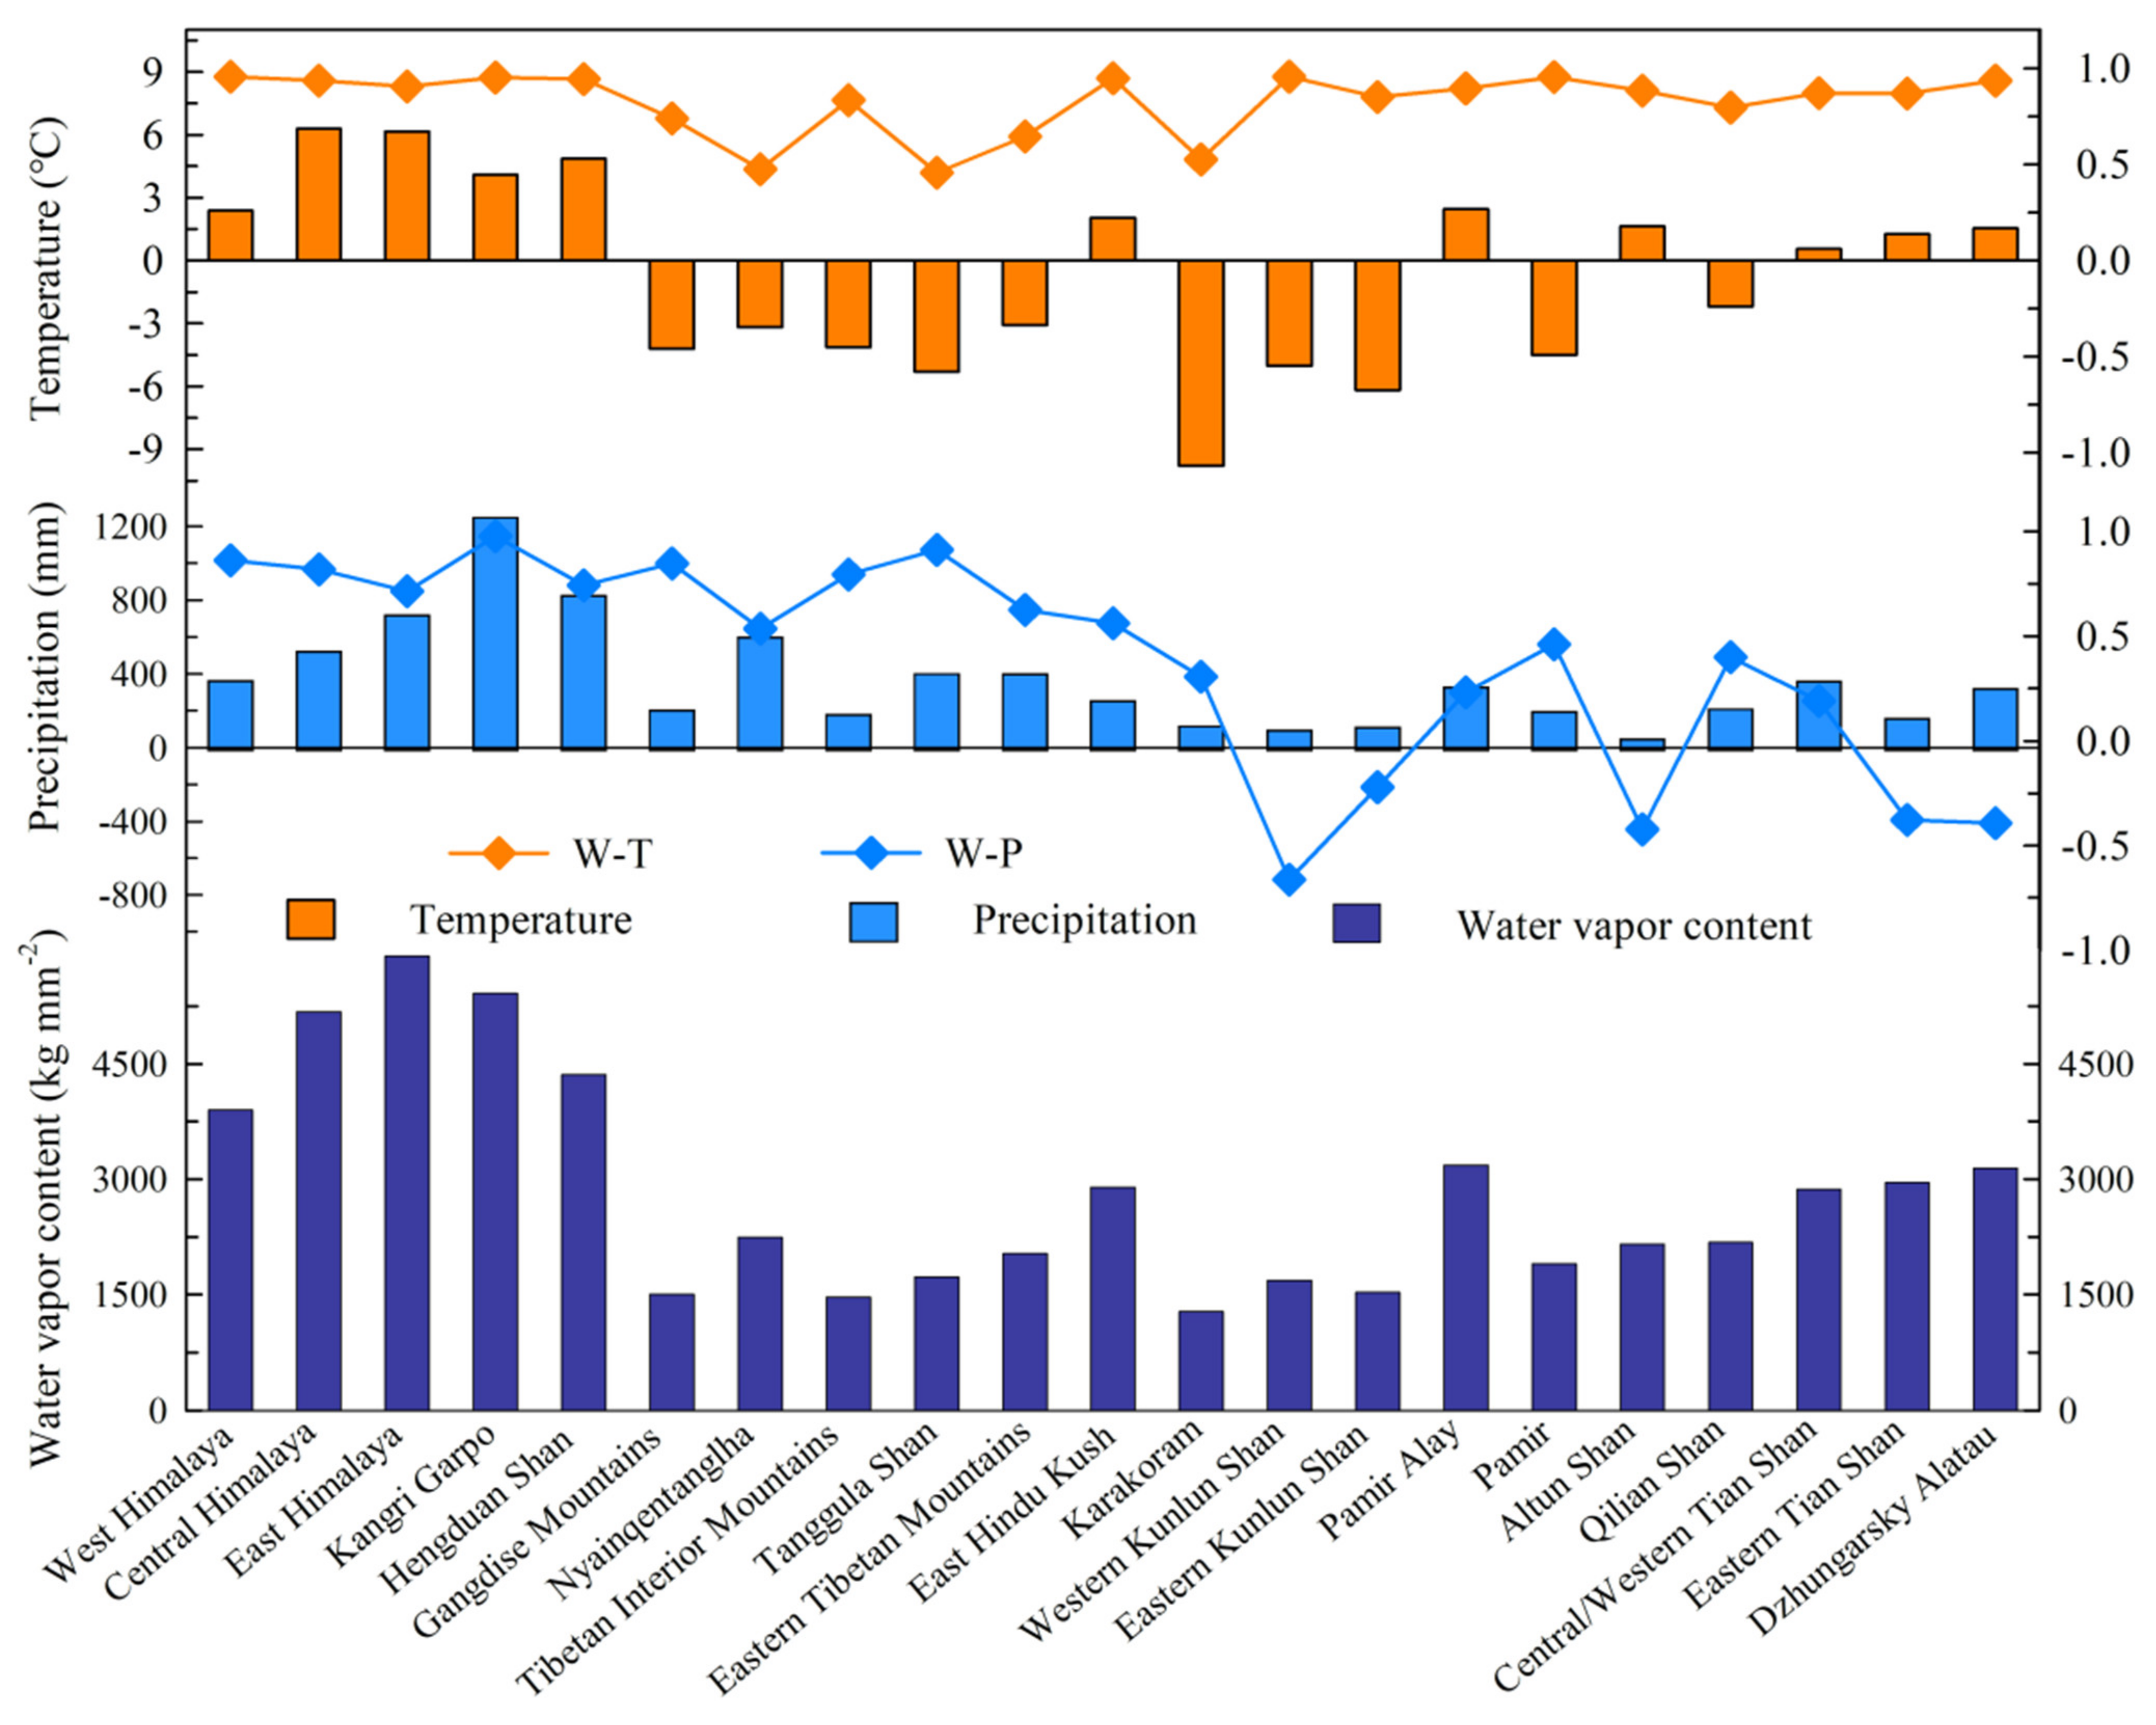
To further analyze the relationship between water vapor content and temperature and precipitation from 2003–2017 (Figure 7). ArcGIS was used to select the water vapor content, precipitation and temperature of the 15 mountain ranges on the TP. Annual water vapor content in the southern (Himalaya, Kangri Garpo and Hengduan Shan) part of the TP is higher than other ranges, all above 4300 kg m−2, consistent with this, the annual precipitation is above 500 mm and annual mean temperature above 4 °C in the south. Besides Altun Shan, the temperature of the mountains with water vapor content lower than 2242 kg m−2 is below 0 °C. On the whole, the annual water vapor content on the TP has a high correlation with temperature and annual precipitation at 0.88 and 0.72 respectively. The correlation between temperature and water vapor content is higher than 0.7 in all mountains except Nyainqentanglha (0.48), Tanggula Shan (0.46), and Karakoram (0.53), with the highest correlation (0.95) occurring in Kangri Garpo. The correlation between precipitation and water vapor content is above 0.53 for all mountains excluding Karakomam (0.31), Kunlun Shan (−0.29), Altun Shan (−0.42), Qilian Shan (0.40), and Tian Shan (0.005).
4. Conclusions and Discussion
Based on radiosonde stations data, comprehensive assessment of water vapor content on the TP and surrounding areas derived from satellite datasets, reanalysis datasets, and weighted ensemble data was performed in the context of spatial and temporal distribution at the annual and seasonal scale while exploring the interaction between water vapor content and temperature and precipitation using EOF. The results indicated that: Annual and seasonal water vapor content decrease from the southeast to the northwest over the TP. Compared with AIRS-only and MERRA2, ERA-5 is recommended to reproduce the spatial distribution of water vapor content in the TP. In terms of time scale, water vapor content showed an increasing trend over the last 50 years, which was consistent with the background of global warming and humidification. Seasonal differences of water vapor content are obvious, with the largest water vapor content appearing in summer, followed by spring and autumn, and the smallest in winter. In general, all of the products can capture the temporal variation of water vapor content on the TP and the surrounding areas, with MERRA2 being more reliable in capturing water vapor content throughout the time series. Weighted ensemble data is more capable of capturing water vapor content characteristics than simple unweighted products. Both precipitation and temperature decrease from southeast to northwest over the TP. The results of EOF analysis show that there is a close relationship between the water vapor content and temperature and precipitation. The highest correlation between water vapor content and temperature and precipitation occurs in the southern part of the TP.
The conclusions of this paper are generally consistent with the results of previous studies (Table 4). In terms of content, this paper not only reflects the ability of reanalysis and satellite products to reproduce water vapor content, but also describes the characteristics of water vapor content at different time scales and different spatial distributions, and explores the interaction mechanism between water vapor content and meteorological elements. For the TP, which lacks long-term observation data, it is important to effectively evaluate the strengths and weaknesses of various datasets for reproducing water vapor content. Our analysis provides basic information on the level of accuracy for each product. However, the number of products used in this paper is limited, and the datasets need to be supplemented later to explore the characteristics of water vapor content change more comprehensively. Although the R between the ERA-5, MERRA2, weighted ensemble data and radiosonde stations data is high, the bias and RMSE remain large. Therefore, the way to improve the water vapor content simulation needs further study over the TP and surrounding areas.
The relationship between water vapor content and meteorological elements on the TP was initially explored. The warming rate of the TP region (0.4 °C/10 a) was almost three times faster than the global average warming rate [33,43,44]. There was an overall upward trend in precipitation on the TP [45,46,47]. Water vapor, which not only reflects solar radiation, but also absorbs terrestrial long-wave radiation, is the most dominant component of greenhouse gas, 60% of the greenhouse effect is formed by water vapor, which is much more than the sum of ozone and carbon dioxide combined [48,49,50]. The increased evaporation caused by climate warming leads to more water vapor in the atmosphere, which in turn strengthens the greenhouse effect, thus exacerbating climate warming. Precipitation is formed from two main sources of water vapor, one by external water vapor transport and the other by local evaporation while the material basis of precipitation, the intensity of water vapor transport, and the evaporation capacity have a direct bearing on the quantity and frequency of precipitation. Therefore, water vapor content and temperature and precipitation have an apparent positive feedback regulation.
There are negative correlations between water vapor content and precipitation in some mountain ranges, such as Kunlun Shan, Altun Shan. It can be said that precipitation is a complex process that requires three conditions to be fulfilled: sufficient water vapor, dynamic uplift, and unstable energy. The topography of each mountain range on the TP is complex, thus water vapor content is not the only factor affecting precipitation. Li et al. [51] researched the Western Tibetan vortex and found deeper anticyclonic and cyclonic wind anomalies in winter and summer due to warmer (cooler) near-surface and mid-lower troposphere temperatures of the Karakorum, indicating that the Western Tibetan Vortex is one of the main drivers of precipitation variability on the northern side of the TP. Further research is needed to fully reveal the underlying causes of this phenomenon. On this basis, a comprehensive study of the water vapor transport, evapotranspiration, and precipitation recycling rates of TP is an urgent requirement to further understand the atmospheric process of the TP water cycle.

Table 4.
Comparison of the accuracy and content of different water vapor products (↑ indicates an increasing trend in water vapor content).
Table 4.
Comparison of the accuracy and content of different water vapor products (↑ indicates an increasing trend in water vapor content).
| Period | Datasets | Measured Data | R | Bias (kg m−2) | RMSE (kg m−2) | Spatiotemporal Variation of Water Vapor Content (kg m−2) | References |
|---|---|---|---|---|---|---|---|
| 2003–2012 | Satellite | radiosonde stations data | 0.85–0.87 | −1.55–−1.58 | 2.05–2.07 | interannual: JRA55, ERA-I, MERRA2, CFSR; annual cycle: ERA-I; 2–12; | Zhao et al. (2020) |
| reanalysis | 0.72–0.91 | −1.78–−1.15 | 1.34–2.12 | ||||
| ensemble | 0.87 | −1.53 | 1.86 | ||||
| 2007–2013 | Satellite | GPS stations data | 0.74–0.93 | −1.84–3.52 | 1.83–4.06 | AIRS Level-2; | Wang et al. (2017) |
| reanalysis | 0.87–0.9 | 0.72–1.49 | 2.19–2.35 | ||||
| 1979–2014 | ERA-Interim | radiosonde stations data | −0.03 | 0.50 | ERA-I; 5–10; Annual (16%/10a) ↑; spring, summer, autumn ↑; winter (no changes) | Yao et al (2016) | |
| 2001 | MOD05_L2 | GPS stations | 0.9 | 0.18 | Annual: southeast:3–30; other regions:2–20February: 2–6; April: 3–8; July: 8–20 | Liang et al. (2006) [52] | |
| 2004 | AIRS | radiosonde stations data | 500 hpa: 0.9 250 hpa: 0.8 | 500 hpa: 0.5–1205 hpa: 0–2 | AIRS: recommended in the annual and summerNovember to March: 7; June to September: 8–50 | Zhan et al (2008) | |
| 1979–2012 | 9 reanalysis | radiosonde stations data | 0.96–0.98 | −60%–20% | 2–6 | Underestimate about 60% 1–20; Annual: (0.1/10a–0.6/10a) ↑ | Zhao et al. (2015) [53] |
| 1979–2008 (summer) | 14 radiosonde stations | 5–19; EOF interpretation variances: First mode: 63.03%; second mode:16.13% | Zhou et al. (2011) | ||||
| 1979–2008 (summer) | 14 radiosonde stations | 7–18; Annual: ↑ Mann-Kendall: 1994(mutate) | Han et al (2012) [54] | ||||
| NCEP/NCAR | |||||||
| 2000–2010 | ERA-Interim | Monsoon season:10.9 ± 5.9; non-monsoon: 3.5 ± 2.9; | Lu et al (2015) | ||||
| MODIS | |||||||
| 1984–2009 | AIRS | AIRS/AMSU; January to December: 2–12, largest on July(12) warm: 7–12; cold: 2–5.5 | Zhang et al. (2013) | ||||
| NVAP |
Author Contributions
Data curation, Z.W.; Formal analysis, M.S., X.Y.; Funding acquisition, M.S.; Investigation, H.Z. and L.Z.; Methodology, X.Y. and Z.W.; Software, Z.W.; Writing—original draft, Z.W.; Writing-review and editing, M.S., H.Z. and L.Z. All authors have read and agreed to the published version of the manuscript.
Funding
Funding information: This research was founded by National Natural Science Foundation of China, Grant/Award Numbers: 41801052, 41861013; 2020 and Graduate Research Grant Program of Northwest Normal University, Grant/Award Numbers: 2020KYZZ001124.
Institutional Review Board Statement
Not applicable.
Informed Consent Statement
Not applicable.
Data Availability Statement
Publicly available datasets were analyzed in this study. This data can be found here: The radiosonde stations data was available online from http://data.cma.cn (accessed on 21 January 2021). The Gauge V3.0 data was available online from http://data.cma.cn (accessed on 21 January 2021). The ERA-5 reanalysis data was available online from https://cds.climate.copernicus.eu/#!/search?text=ERA5&type=dataset (accessed on 21 January 2021). The MERRA2 reanalysis data was available online from https://disc.gsfc.nasa.gov/datasets?keywords=MERRA2&page=1 (accessed on 21 January 2021). The AIRS-only satellite product data was available online from https://disc.gsfc.nasa.gov/datasets?keywords=AIRS-only&page=1 (accessed on 21 January 2021). The TRMM satellite product data was available online from https://disc.gsfc.nasa.gov/datasets?keywords=TRMM&page=1 (accessed on 21 January 2021).
Acknowledgments
This work was supported by the National Natural Science. Foundation of China (Grant Nos. 41801052 and 41861013); 2020 Graduate Research Grant Program of Northwest Normal University, Grant/Award Numbers: 2020KYZZ001124.
Conflicts of Interest
The authors declare no conflict of interest.
References
- Varamesh, S.; Hosseini, S.M.; Rahimzadegan, M. Estimation of atmospheric water vapor using MODIS data 1 (Case study: Golestan province of Iran). J. Mater. Environ. Sin. 2017, 8, 1690–1695. [Google Scholar]
- Liu, G.W. The Atmospheric Process of the Hydrologic Cycle; China Science Press: Beijing, China, 1997. [Google Scholar]
- Zhang, Q.; Zhang, J.; Sun, G.W.; Di, X.H. Research on atmospheric water vapor distribution over Qilianshan mountains. Acta Meteor. Sinica. 2007, 65, 633–643. [Google Scholar]
- Cess, R.D. Water vapor feedback in climate models. Science 2005, 310, 795–796. [Google Scholar] [CrossRef] [PubMed] [Green Version]
- Yang, Q.; Liu, X.Y.; Cui, C.X.; Li, J.; Liu, R. The computation and characteristics analysis of water vapor contents in the Tarim Basin. Acta Geogr. Sin. 2010, 65, 853–862. [Google Scholar]
- Wang, A.H.; Zeng, X.B. Evaluation of multireanalysis products with in situ observations over the Tibetan Plateau. J. Geophys. Res. Atmos. 2012, 117, 214–221. [Google Scholar] [CrossRef]
- Liu, J.J.; You, Q.L.; Wang, N. Interannual anomaly of cloud water content and its connection with water vapor transport over the Tibetan Plateau in summer. Plateau Meteor. 2019, 38, 449–459. [Google Scholar] [CrossRef]
- Zhu, B.; Zhang, Q.; Lu, G.Y.; Li, D.H.; Li, C.H. Analysis of the distribution characteristics and trend of air vapor in Qilian Mountains. Plateau Meteor. 2019, 38, 935–943. [Google Scholar] [CrossRef]
- Chen, D.; Zhou, C.Y.; Deng, M.Y. A comparison analysis of three reanalysis datasets in the change of atmospheric water vapor content in the summer of the Tibetan Plateau. Plateau Mt. Meteor. Res. 2018, 38, 1–6. [Google Scholar] [CrossRef]
- Zhao, Y.; Zhou, T.J. Asian water tower evinced in total column water vapor: A comparison among multiple satellite and reanalysis data sets. Clim. Dyn. 2020, 54, 231–245. [Google Scholar] [CrossRef] [Green Version]
- Wang, Y.; Yang, K.; Pan, Z.; Qin, J.; Chen, D.; Lin, C.; Chen, Y.Y.; Zhu, L.; Tang, W.J.; Han, M.L.; et al. Evaluation of precipitable water vapor from four satellite products and four reanalysis datasets against GPS measurements on the southern Tibetan Plateau. J. Clim. 2017, 5699–5713. [Google Scholar] [CrossRef]
- Zhang, Y.W.; Wang, D.H.; Zhai, P.M.; Gu, G.J.; He, J.H. Spatial distributions and seasonal variations of tropospheric water vapor content over the Tibetan Plateau. J. Clim. 2013, 26, 5637–5654. [Google Scholar] [CrossRef]
- Zhuo, G.; Bian, B.C.R.; Yang, X.H.; Luo, B. Spatial and temporal changes of atmospheric precipitable water in Tibet Region in recent 30 years. Plateau Meteor. 2013, 32, 23–30. [Google Scholar]
- Zhan, R.F.; Li, J.P. Validation and Characteristics of Upper Tropospheric Water Vapor over the Tibetan Plateau from AIRS Satellite Retrieval. J. Atmos. Sci. 2008, 32, 242–260. [Google Scholar]
- Skliris, N.; Zika, J.D.; Nurser, G.; Josey, S.A.; Marsh, R. Global water cycle amplifying at less than the Clausius-Clapeyron rate. Sci. Rep. 2016, 6, 38752. [Google Scholar] [CrossRef] [PubMed] [Green Version]
- Wu, F.T.; Fu, C.B. Change of precipitation intensity spectra at different spatial scales under warming conditions. Chin. Sci. Bull. 2013, 58, 1385–1394. [Google Scholar] [CrossRef] [Green Version]
- Zhang, J.; Xiao, H.B.; Xu, W.X.; Qi, D.L.; Wei, X.D. Precipitable water variation and its impact factors in recent 40 years in Qaidam Basin. Resour. Sci. 2013, 11, 2289–2297. [Google Scholar]
- Yao, J.Q.; Yang, Q.; Hu, W.F.; Zhao, L.; Liu, Z.H.; Han, X.Y.; Zhao, L.; Meng, X.Y. Characteristics analysis of water vapor contents around Tianshan Mountains and the relationships with climate factors. Sci. Geogr. Sin. 2013, 33, 859–864. [Google Scholar] [CrossRef]
- Zhou, S.W.; Wu, P.; Wang, C.H.; Han, J.C. Spatial distribution of atmospheric water vapor and its relationship with precipitation in summer over the Tibetan Plateau. J. Geogr. Sci. 2012, 22, 795–809. [Google Scholar] [CrossRef]
- Xie, H.; Ye, J.S.; Liu, X.M.; Chongyi, E. Warming and drying trends on the Tibetan Plateau (1971–2005). Appl. Climatol. 2010, 101, 241–253. [Google Scholar] [CrossRef]
- Yao, Y.B.; Lei, X.X.; Zhang, L.; Zhang, B.; Peng, H.; Zhang, J.H. Analysis of precipitable water vapor and surface temperature variation over Qinghai-Tibetan Plateau from 1979 to 2014. Chin. Sci. Bull. 2016, 61, 1462–1477. [Google Scholar] [CrossRef] [Green Version]
- Li, W.; Liu, J.C.; Shang, B.; Xu, C. Analysis on the relationship between atmospheric water vapor content and temperature and precipitation in Changchun. Meteorol. Disaster Prev. 2019, 26, 6–9. [Google Scholar]
- Yang, Q.; Wei, W.S.; Li, J. Spatial and temporal distribution of atmospheric water vapor in Taklamakan desert with its surrounding regions. Chin. Sci. Bull. 2008, 53, 62–68. [Google Scholar]
- IPCC (Intergovernmental Panel on Climate Change). Climate change 2013: The Physical Science Basis. In Contribution of Working Group I to the Fifth Assessment Report of the Intergovernmental Panel on Climate Change; Cambridge University Press: Cambridge, UK, 2013. [Google Scholar]
- Xiong, C.; Yao, R.Z.; Shi, J.C.; Lei, Y.H. Change of snow and ice melting time in High Mountain Asia. Chin. Sci. Bull. 2019, 64, 2885–2893. [Google Scholar] [CrossRef] [Green Version]
- Zhou, T.J.; Gao, J.; Zhao, Y.; Zhang, L.X.; Zhang, W.X. Water vapor transport processes on Asian Water Tower. Bull. Chin. Acad. Sci. 2019, 34, 1210–1219. [Google Scholar] [CrossRef]
- Yao, T.D.; Thompson, L.; Yang, W. Different glacier status with atmospheric circulations in Tibetan Plateau and surroundings. Nat. Clim. Chang. 2012, 2, 663–667. [Google Scholar] [CrossRef]
- Xie, Z.C.; Zhou, Z.G.; Li, Q.Y.; Wang, S.H. Progress and prospects of mass balance characteristic and responding to global change of glacier system in High Asia. Adv. Earth Sci. 2009, 24, 1065–1072. [Google Scholar]
- Wang, S.J.; Zhang, M.J.; Pepin, N.C.; Li, Z.Q.; Sun, M.P.; Huang, X.Y.; Wang, Q. Recent changes in freezing level heights in High Asia and their impact on glacier changes. J. Geophys. Res. Atmos. 2014, 119, 1753–1765. [Google Scholar] [CrossRef] [Green Version]
- Xu, B.R.; Zou, S.B.; Du, D.Y.; Xiong, J.J.; Lu, Z.X.; Ruan, H.W.; Xiao, H.L. Variation of tropospheric specific humidity upon the middle-lower reaches of the Heihe River during 1981–2010. J. Glaciol. Geocryol. 2016, 38, 57–68. [Google Scholar] [CrossRef]
- Chahine, M.T.; Pagano, T.S.; Aumann, H.H.; Atlas, R.; Granger, S. AIRS: Improving weather forecasting and providing new data on greenhouse gases. Bull. Am. Meteor. Soc. 2006, 87, 911–926. [Google Scholar] [CrossRef] [Green Version]
- Kummerow, C.; Barnes, W.; Kozu, T. The Tropical Rainfall Measuring Mission (TRMM) sensor package. J. Atmos. Ocean Technol. 1998, 15, 809–817. [Google Scholar] [CrossRef]
- Lu, N.; Qin, J.; Gao, Y.; Yang, K.; Trenberth, K.E.; Gehne, M.; Zhu, Y. Trends and variability in atmospheric precipitable water over the Tibetan Plateau for 2000–2010. Int. J. Climatol. 2015, 35, 1394–1404. [Google Scholar] [CrossRef]
- Molod, A.; Takacs, L.; Suarez, M.; Bacmeister, J. Development of the GEOS-5 atmospheric general circulation model: Evolution from MERRA to MERRA2. Geosci. Model. Dev. 2015, 7, 339–1356. [Google Scholar] [CrossRef] [Green Version]
- Wang, B.Z.; Liu, G.S. An estimation of total atmospheric water vapor in the mainland of China. Acta Geogr. Sin. 1993, 48, 244–253. [Google Scholar]
- Lorenz, E.N. Statistical forecasting program: Empirical orthogonal functions and statistical weather prediction. Sci. Rep. 1956, 409, 997–999. [Google Scholar] [CrossRef]
- North, G.R.; Bell, T.L.; Cahalan, R.F.; Moeng, F.J. Sampling errors in the estimation of empirical orthogonal functions. Mon. Weather Rev. 1982, 110, 699–706. [Google Scholar] [CrossRef]
- Feng, L.; Zhou, T.J. Water vapor transport for summer precipitation over the Tibetan Plateau: Multi-source datasets analysis. J. Geophys. Res. 2012, 117, D20114. [Google Scholar] [CrossRef] [Green Version]
- Guo, Q.Y.; Zhao, P.T.; Zhang, Y.C.; Liu, F.Q. Technical improvement and experimental analysis of GTS1 radiosonde. Meteor. Sci. Technol. 2013, 41, 254–258. [Google Scholar] [CrossRef]
- Hao, M.; Gong, J.D.; Wang, R.W.; Wan, X.M.; Liu, Y. The quality assessment and correction of the radiosonde humidity data biases of L-band in China. Acta Meteor. Sin. 2015, 73, 187–199. [Google Scholar] [CrossRef]
- Qin, J.; Yang, K.; Liang, S.L.; Guo, X.F. The altitudinal dependence of recent rapid warming over the Tibetan Plateau. Clim. Chang. 2009, 97, 321–327. [Google Scholar] [CrossRef]
- Guo, Y.P. The Changing Characteristics of Water Cycle over the Qinghai-Xizang Plateau in Last 40 Years. Master’s Thesis, Lanzhou University, Lanzhou, China, 2013. [Google Scholar]
- Qiu, J. China: The third pole. Nature 2008, 454, 393–396. [Google Scholar] [CrossRef] [Green Version]
- Wang, P.L.; Tang, G.L.; Cao, L.J.; Liu, Q.F.; Ren, Y.Y. Surface air temperature variability and its relationship with altitude & latitude over the Tibetan Plateau in 1981–2010. Adv. Clim. Chang. Res. 2012, 5, 4–10. [Google Scholar] [CrossRef]
- Li, S.C.; Li, D.L.; Zhao, P.; Zhang, G.Q. Water vapor transport characteristics of the rainy season in the “Three River Source Area” on the Qinghai-Tibet Platea. Acta Meteor. Sin. 2009, 67, 591–598. [Google Scholar]
- Lin, H.B.; You, Q.L.; Jiao, Y.; Min, J.Z. Water vapor transportation and its influences on precipitation in summer over Tibetan Plateau. Plateau Meteor. 2016, 35, 309–317. [Google Scholar] [CrossRef]
- Han, Y.Z.; Ma, W.Q.; Wang, B.Y.; Ma, Y.M. Climatic characteristics of rainfall change over the Tibetan Plateau from 1980 to 2013. Plateau Meteor. 2017, 36, 1477–1486. [Google Scholar] [CrossRef]
- Held, I.M.; Soden, B.J. Water vapor feedback and global warming. Annu. Rev. Energy Environ. 2000, 25, 445–475. [Google Scholar] [CrossRef] [Green Version]
- Philipona, R.B.; Diirr, C. Marty A Ohmura Radiative forcing-measured at Earth’s surface—Corroborate the increasing greenhouse effect. Geogr. Res. Lett. 2004, 31, L03202. [Google Scholar] [CrossRef]
- Philipona, R.B.; Diirr, B.; Ohmura, A.; Ruckstuhl, C. Anthropogenic greenhouse forcing and strong water vapor feedback increase temperature in Europe. Geogr. Res. Lett. 2005, 32, L19809. [Google Scholar] [CrossRef]
- Li, X.F.; Fowler, H.J.; Forsythe, N.; Blenkinsop, S.; Pritchard, D. The karakoram/western tibetan vortex: Seasonal and year-to-year variability. Clim. Dyn. 2018, 51. [Google Scholar] [CrossRef] [Green Version]
- Liang, H.; Liu, J.J.; Li, S.K. Analysis of water vapor content distribution and its seasonal variation characteristics over Tibetan Plateau and its surroundings. J. Nat. Res. 2006, 21, 526–534. [Google Scholar]
- Zhao, T.B.; Wang, J.H.; Dai, A.G. Evaluation of atmospheric precipitable water from reanalysis products using homogenized radiosonde observations over China. J. Geophys. Res. Atmos. 2015, 120, 10703–10727. [Google Scholar] [CrossRef]
- Han, C.J.; Zhou, S.W.; Wu, P.; Wang, C.H.; Yang, S.Y.; Yang, M. Spatial Distribution of water vapor content over the Tibetan Plateau in Summer. Arid Zone Res. 2012, 29, 457–463. [Google Scholar]
Figure 1.
The topography on the Tibetan Plateau and its surroundings.

Figure 2.
AIRS-only, ERA-5, MERRA2, and weighted ensemble data on annual mean water vapor of the TP and surrounding areas from 2003 to 2017 (unit: kg m−2). AIRS-only (a), ERA-5 (b), MERRA2 (c), weighted ensemble data (d). (Dots and related numbers represent biases compared to radiosonde stations data, red dots denote positive biases, and yellow dots denote negative biases, their RMSE are printed on the top-right of each panel).

Figure 3.
AIRS-only, ERA-5, MERRA2, and weighted ensemble data on seasonal mean water vapor content of the TP and surrounding areas from 2003 to 2017 (unit: kg m−2). spring (a1–d1), summer (a2–d2), autumn (a3–d3) and winter (a4–d4).
Figure 3.
AIRS-only, ERA-5, MERRA2, and weighted ensemble data on seasonal mean water vapor content of the TP and surrounding areas from 2003 to 2017 (unit: kg m−2). spring (a1–d1), summer (a2–d2), autumn (a3–d3) and winter (a4–d4).

Figure 4.
Annual and seasonal changes of water vapor content between AIRS-only, ERA-5, MERRA2, weighted ensemble, and radiosonde data in the TP and surrounding areas for the period of 1980–2019 (unit: kg m−2). (p < 0.01 indicates trends passing the 99% significance test). spring (a), summer (b), autumn (c), winter (d), and annual (e).

Figure 5.
Annual mean precipitation (a) and temperature (b) spatial distribution in the TP and surrounding areas from 2003 to 2017 (unit: precipitation mm, temperature °C).
Figure 5.
Annual mean precipitation (a) and temperature (b) spatial distribution in the TP and surrounding areas from 2003 to 2017 (unit: precipitation mm, temperature °C).

Figure 6.
EOF analysis (the first two modes of EOF): water vapor content (a,d,g,j), temperature (b,e,h,k), precipitation (c,f,i,l) from 2003 to 2017.
Figure 6.
EOF analysis (the first two modes of EOF): water vapor content (a,d,g,j), temperature (b,e,h,k), precipitation (c,f,i,l) from 2003 to 2017.

Figure 7.
The distribution of water vapor content, temperature, and precipitation in 15 main mountain ranges on the TP and surrounding areas from 2003 to 2017, analyzing the correlation between water vapor and temperature and precipitation (unit: water vapor content kg m−2, temperature °C, and precipitation mm).

Table 1.
Information about the datasets in this study.
| Source | Time Range | Horizontal Resolution | |
|---|---|---|---|
| AIRS-only | NASA | 2003–2017 | 1° × 1° |
| MERRA2 | NASA | 1980–2019 | 0.5° × 0.625° |
| ERA-5 | ECMWF | 1980–2019 | 0.75° × 0.75° |
| Radiosonde | China Meteorological Science Data Center | 1980–2013 | 27 stations data |
| Gauge V3.0 | China Meteorological Science Data Center | 1980–2019 | 157 stations data |
| TRMM | NASA | 1998–2019 | 0.25° × 0.25° |
Table 2.
R, bias (kg m−2) and RMSE (kg m−2) for each product on annual and seasonal time basis relative to the measured data from the radiosonde stations.
Table 2.
R, bias (kg m−2) and RMSE (kg m−2) for each product on annual and seasonal time basis relative to the measured data from the radiosonde stations.
| Annual | Spring | Summer | Autumn | Winter | ||
|---|---|---|---|---|---|---|
| AIRS-only | R | 0.94 | 0.96 | 0.88 | 0.94 | 0.97 |
| bias | −0.05 | 0.02 | −0.07 | −0.07 | −0.02 | |
| RMSE | 2.38 | 1.74 | 4.58 | 2.79 | 1.13 | |
| ERA-5 | R | 0.97 | 0.97 | 0.95 | 0.97 | 0.98 |
| bias | −0.04 | 0.09 | −0.06 | −0.04 | −0.05 | |
| RMSE | 1.74 | 5.27 | 3.06 | 2.04 | 0.97 | |
| MERRA2 | R | 0.96 | 0.97 | 0.93 | 0.96 | 0.98 |
| bias | 0.04 | 0.05 | 0.05 | 0.02 | −0.01 | |
| RMSE | 1.92 | 1.60 | 3.34 | 2.12 | 1.04 | |
| weighted ensemble data | R | 0.96 | 0.97 | 0.94 | 0.96 | 0.97 |
| bias | −0.01 | 0.02 | −0.03 | −0.03 | −0.03 | |
| RMSE | 1.88 | 1.61 | 3.20 | 2.17 | 1.09 |
Table 3.
Annual and seasonal scale weighting coefficients of AIRS-only, ERA-5, MERRA2.
| Annual | Spring | Summer | Autumn | Winter | |
|---|---|---|---|---|---|
| AIRS-only | 0.30 | 0.61 | 0.27 | 0.18 | 0.30 |
| ERA-5 | 0.36 | 0.14 | 0.34 | 0.27 | 0.12 |
| MERRA2 | 0.34 | 0.25 | 0.39 | 0.55 | 0.58 |
Publisher’s Note: MDPI stays neutral with regard to jurisdictional claims in published maps and institutional affiliations. |
© 2021 by the authors. Licensee MDPI, Basel, Switzerland. This article is an open access article distributed under the terms and conditions of the Creative Commons Attribution (CC BY) license (https://creativecommons.org/licenses/by/4.0/).
Share and Cite
MDPI and ACS Style
Wang, Z.; Sun, M.; Yao, X.; Zhang, L.; Zhang, H. Spatiotemporal Variations of Water Vapor Content and Its Relationship with Meteorological Elements in the Third Pole. Water 2021, 13, 1856. https://doi.org/10.3390/w13131856
AMA Style
Wang Z, Sun M, Yao X, Zhang L, Zhang H. Spatiotemporal Variations of Water Vapor Content and Its Relationship with Meteorological Elements in the Third Pole. Water. 2021; 13(13):1856. https://doi.org/10.3390/w13131856
Chicago/Turabian StyleWang, Zhilan, Meiping Sun, Xiaojun Yao, Lei Zhang, and Hao Zhang. 2021. "Spatiotemporal Variations of Water Vapor Content and Its Relationship with Meteorological Elements in the Third Pole" Water 13, no. 13: 1856. https://doi.org/10.3390/w13131856
Note that from the first issue of 2016, this journal uses article numbers instead of page numbers. See further details here.