
3D Numerical Simulation of Gravity-Driven Motion of Fine-Grained Sediment Deposits in Large Reservoirs

1
State Key Laboratory of Hydrology-Water Resources and Hydraulic Engineering, Nanjing Hydraulic Research Institute, Nanjing 210029, China
2
Changjiang River Scientific Research Institute, Wuhan 430010, China
3
State Key Laboratory of Hydroscience and Engineering, Tsinghua University, Beijing 100084, China
*
Author to whom correspondence should be addressed.
Water 2021, 13(13), 1868; https://doi.org/10.3390/w13131868
Submission received: 9 May 2021
/
Revised: 21 June 2021
/
Accepted: 29 June 2021
/
Published: 4 July 2021
(This article belongs to the Special Issue Modelling of River Flows, Sediment and Contaminants Transport)
Abstract
:Deposits in dam areas of large reservoirs, which are commonly composed of fine-grained sediment, are important for reservoir operation. Since the impoundment of the Three Gorges Reservoir (TGR), the sedimentation pattern in the dam area has been unexpected. An integrated dynamic model for fine-grained sediment, which consists of both sediment transport with water flow and gravity-driven fluid mud at the bottom, was proposed. The incipient motion driven by gravity in the form of fluid mud was determined by the critical slope. Shallow flow equations were simplified to simulate the gravity-driven mass transport. The gravity-driven flow model was combined with a 3D Reynolds-averaged water flow and sediment transport model. Solution routines were developed for both models, which were then used to simulate the integral movement of the fine-grained sediment. The simulated sedimentation pattern agreed well with observations in the dam area of the TGR. Most of the deposits were found at the bottom of the main channel, whereas only a few deposits remained on the bank slopes. Due to the gravity-driven flow of fluid mud, the deposits that gathered in the deep channel formed a nearly horizontal surface. By considering the gravity-driven flow, the averaged error of deposition thickness along the thalweg decreased from −13.9 to 2.2 m. This study improved our understanding of the mechanisms of fine-grained sediment transport in large reservoirs and can be used to optimize dam operations.
1. Introduction
The impoundment of large reservoirs results in numerous changes, including decreases in water flow velocity, sediment deposition, and sorting [1]. In the reservoir, coarser sediments tend to be deposited in the upstream regions of the reservoir, advancing downstream steadily but slowly in the form of a delta, whereas fine sediments reach the reservoir in the form of suspended load, by means of homogeneous or stratified dense flow [2].
Sedimentation is an important issue that receives a significant amount of attention in reservoir construction and operations [3]. The excess of sedimentation in a reservoir leads to sediment entrainment in waterway systems and hydraulic schemes [4]. During the demonstration phase and early operational periods of the Three Gorges Reservoir (TGR), several hydraulic research institutes studied the problem of reservoir sedimentation [5,6]. After the impoundment, the sediment influx conditions of the TGR changed significantly, and the actual reservoir sedimentation conditions were different from the predictions made during the demonstration phase [3,7]. With the increase in the water level in front of the dam during flood seasons, the trap efficiency increases [8,9]. In the TGR, deposited sediment is mostly fine sediment with median diameters of less than 0.01 mm, which was not forecasted by previous studies [7]. In addition, fine-grained sediments with median sizes of approximately 0.004–0.010 mm have been observed in the dam area as early as the initial stage of the impoundment [10]. This sediment was deposited due to the significant increase in water depth of more than 100 m that occurred after the water storage operation. Although reservoir deposition is common, the sedimentation pattern in the dam area of the TGR is unusual. Generally, in the dam area, the distribution of sediment concentration is uniform, which would cause cross-sectional uniform deposition in the dam area, and then lead to an uneven surface across the section [11,12]. However, the deposits of fine-grained sediment in the dam area of the TGR have mainly accumulated in the deep channel and have a flat surface [13,14]. This has led to a rapid rise in the bed surface in the deep channel despite the small total amount of siltation. The elevations of the bottom discharge hole and deep discharge hole of the Three Gorges Dam (TGD) are 55 and 90 m, respectively. The bottom elevations of the water inlets of the power plant are 108 m. However, the surface elevation of the deposits in the deep channel before the TGD reached 60 m in September 2006, which was 20 m higher than that before the first impoundment in June 2003 [14]. Furthermore, the deposition has been persistently increasing. From 2003 to 2017, the total amount of accumulated sediment deposition in the near-dam area was 1.594 × 10⁸ m3; among them, the channel below 90 m elevation accounts for 73% of the total siltation. The average deposition thickness in the deep channel before the dam is 33.5 m, with a maximum deposition thickness of 63.7 m [15]. Of all the deposits, 0.47 × 10⁸ m3 was deposited during the period of 2008–2013, with a maximum thickness of 16.8 m [3]. Until recently, the elevation of the deposits was lower than that of the power plant inlets [16].
The rapid rise in the silt surface has greatly increased the probability of sediment entering the turbines. Hydraulic turbines may be subject to abrasion and corrosion by the heavier specific gravities of quartz and albite particles in sediment passing though, which will shorten its service life. On the other hand, the accumulation of sediment in the deep channel is conducive to the discharge of sediment from the reservoir. As the deposits have a certain fluidity (demonstrated below), the sediment can be discharged from the reservoir more easily by optimizing the dispatching measures [16].
The unique sedimentation pattern near the TGD requires a reasonable explanation based on scientific research. Models depicting the physical processes based on dynamic mechanisms are efficient research tools that would help to optimize dam operations and improve the theory of sediment transport in large reservoirs.
Many factors affect the cross-sectional deposition pattern in the reservoir, such as the sediment concentration, gradation, and lateral distributions of the flow velocity and water depth. The local river regime and cross-sectional shapes are also important. Han [17] ascribed the sedimentation pattern in which most deposits accumulate in the deep channel to the nonuniform crosswise distribution of sediment concentration and gradation. Jia et al. [18] proposed that the sedimentation pattern in the dam area of the TGR should be related to both the three-dimensional flow structure and the particle characteristics. During the early stage of reservoir impoundment, the medium size of suspended sediment before the dam was about 0.003–0.005 mm and the dry bulk density within the top 1 m of the deposits was about 0.4–1.0 t/m3 [19]. Particles deposited in the dam area are so fine that their initial dry bulk density is small, and they are able to move as a fluid. Previous simulations of the sedimentation pattern in the dam area of the TGR did not consider the fluid characteristics of the deposits, and their predictions were significantly different from the observations [11,12,20]. The differences indicate the significance of considering the fluid characteristics of the deposits. By coupling a 1D gravity-driven flow model, which depicts the motion of sediment deposits, with a traditional 1D flow and sediment transport model, the accumulation processes of fine-grained sediments in the dam area of the TGR had been preliminarily identified [21,22]. However, more work is necessary to determine the mechanisms of the fine-grained sedimentation pattern in large reservoirs.
Considering the sedimentation features in the dam area of the TGR, we proposed a physical-based numerical model for fine-grained sediment deposition in large reservoirs. A method of modeling fine-grained sediment movement that includes gravity-driven motion in reservoirs was developed and applied, along with a 3D Reynolds-averaged numerical model of water flow and sediment transport, to simulate the uncommon sedimentation pattern in the dam area of the TGR. Our method can be applied to other reservoirs with similar sedimentation problems.
2. Materials and Methods
2.1. Features of Fine-Grained Sediment Deposition in Deep Reservoirs
The Three Gorges Dam (TGD), which is located in the Three Gorges reach along the trunk of the Yangtze River in China, is a key backbone project for flood control, navigation, and water resources development and has a total installed capacity of 18.2 GW and an average annual output of 84.7 billion kWh. The dam is located in Sandouping, 40 km upstream from Yichang City, as shown in Figure 1. The normal pool level of the Three Gorges Reservoir (TGR) is 175 m (relative to the Chinese water level zero point), which corresponds to an aggregated storage capacity of 39.3 billion m3. The TGR has been in operation since June 2003. The construction of large hydraulic projects such as the TGD has generated problems in navigation, environment, and ecology, all of which are related to sediment transport processes, including advection, diffusion, deposition, and erosion.
Figure 1.
Location of the TGD on the Yangtze River. (The left part of the figure is based on [23]).
Figure 1.
Location of the TGD on the Yangtze River. (The left part of the figure is based on [23]).

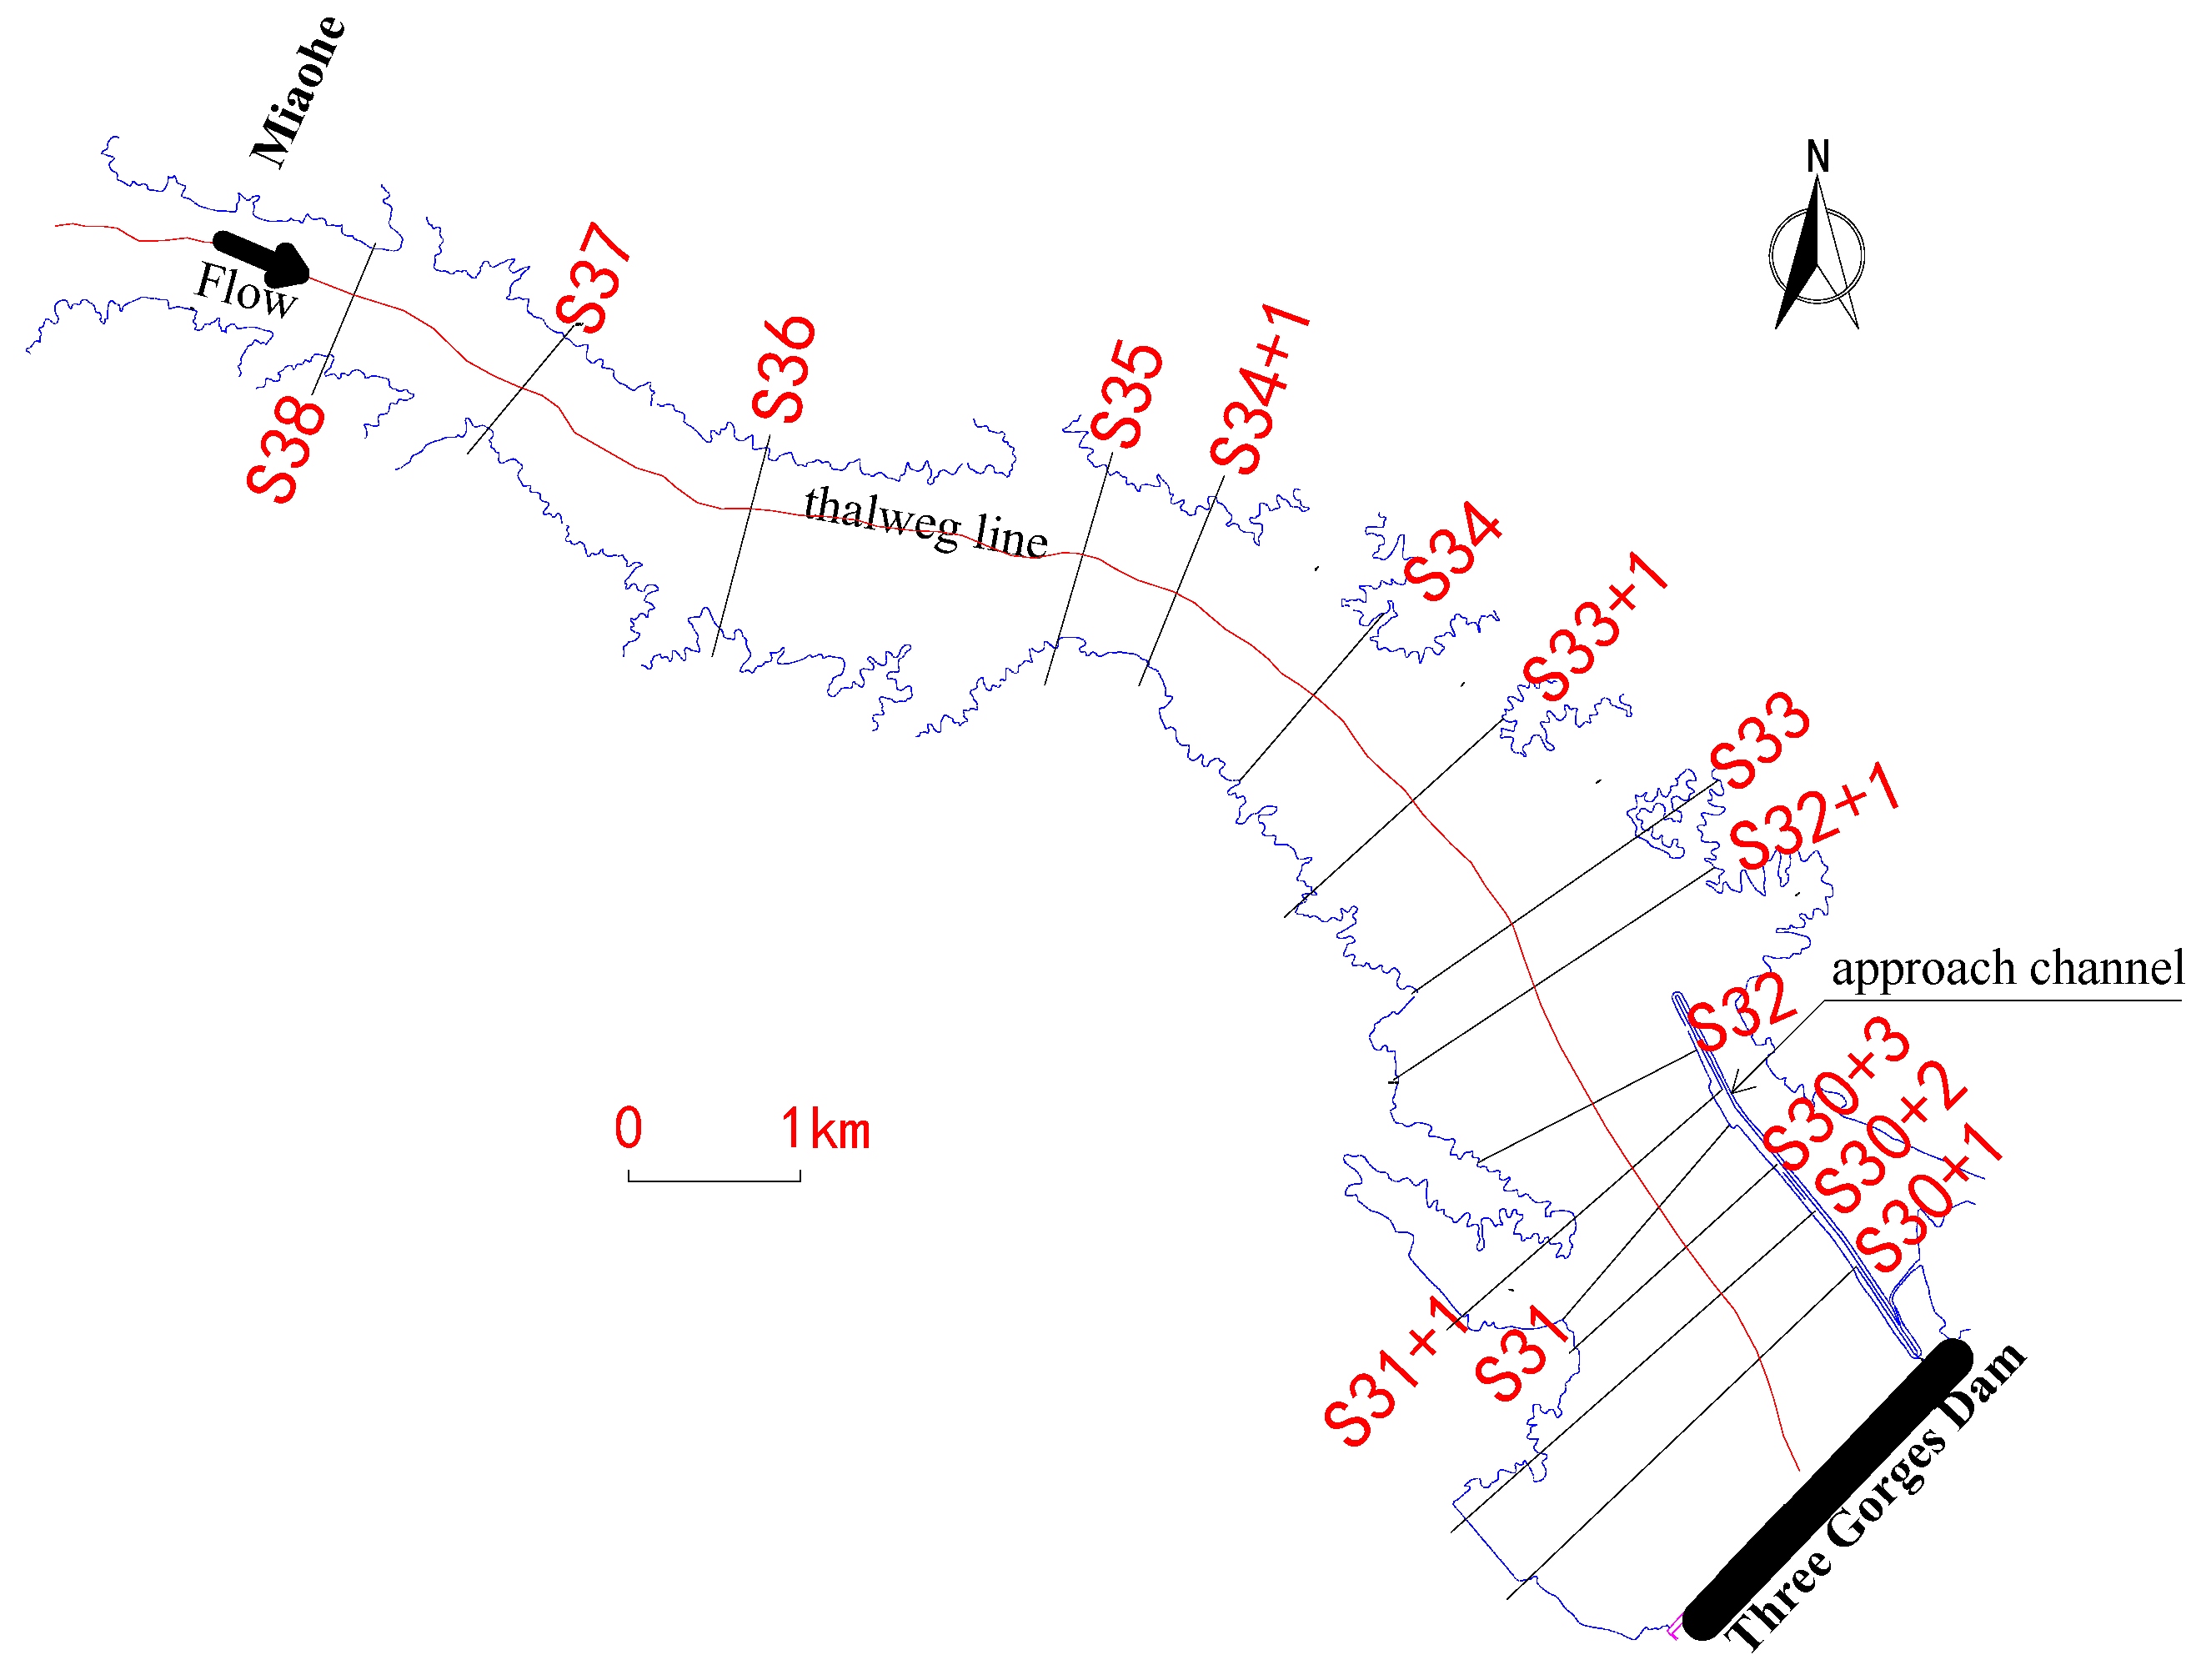
Observations of the sedimentation pattern in the dam area of a typical section (S34#, see Figure 2 for the location) of the TGR have shown that the sediment mainly accumulated in the deep channel with a nearly horizontal surface (Figure 3) in the early years of reservoir operation. Conversely, deposits of fine-grained sediment in reservoirs typically have a relatively uniform distribution across the section. The physical and dynamic characteristics of the sediment deposits in the dam area can be used to understand this difference.
Before impoundment, the median size of the riverbed materials near the dam was approximately 0.10 mm. With the initial impoundment of the TGR, the water level rose to 135 m, and large amounts of siltation occurred in the river reach before the dam. In October 2003, the observed median particle size of the bed materials had decreased significantly to 0.02 mm. With further deposition, the median size had further decreased to 0.008 mm in May 2006. After the 156 m water storage operation of the TGR, the observed median size of the bed materials in the dam area was 0.005 mm in December 2006 and October 2007 [10]. The silt particles deposited in the dam area are extremely fine and require a long time to compact. Before compaction, the low-density deposits (the bulk density is approximately 1.00–1.20 t/m3) in the form of sludge are called fluid mud. The fluid mud has significant fluidity and can flow or deform under its own weight. If the surface slope exceeds a certain value, the fluid mud will move down the slope. This may be the main reason that most of the deposits were found in the deep channel of the TGR and that the surface of the sludge is horizontal.
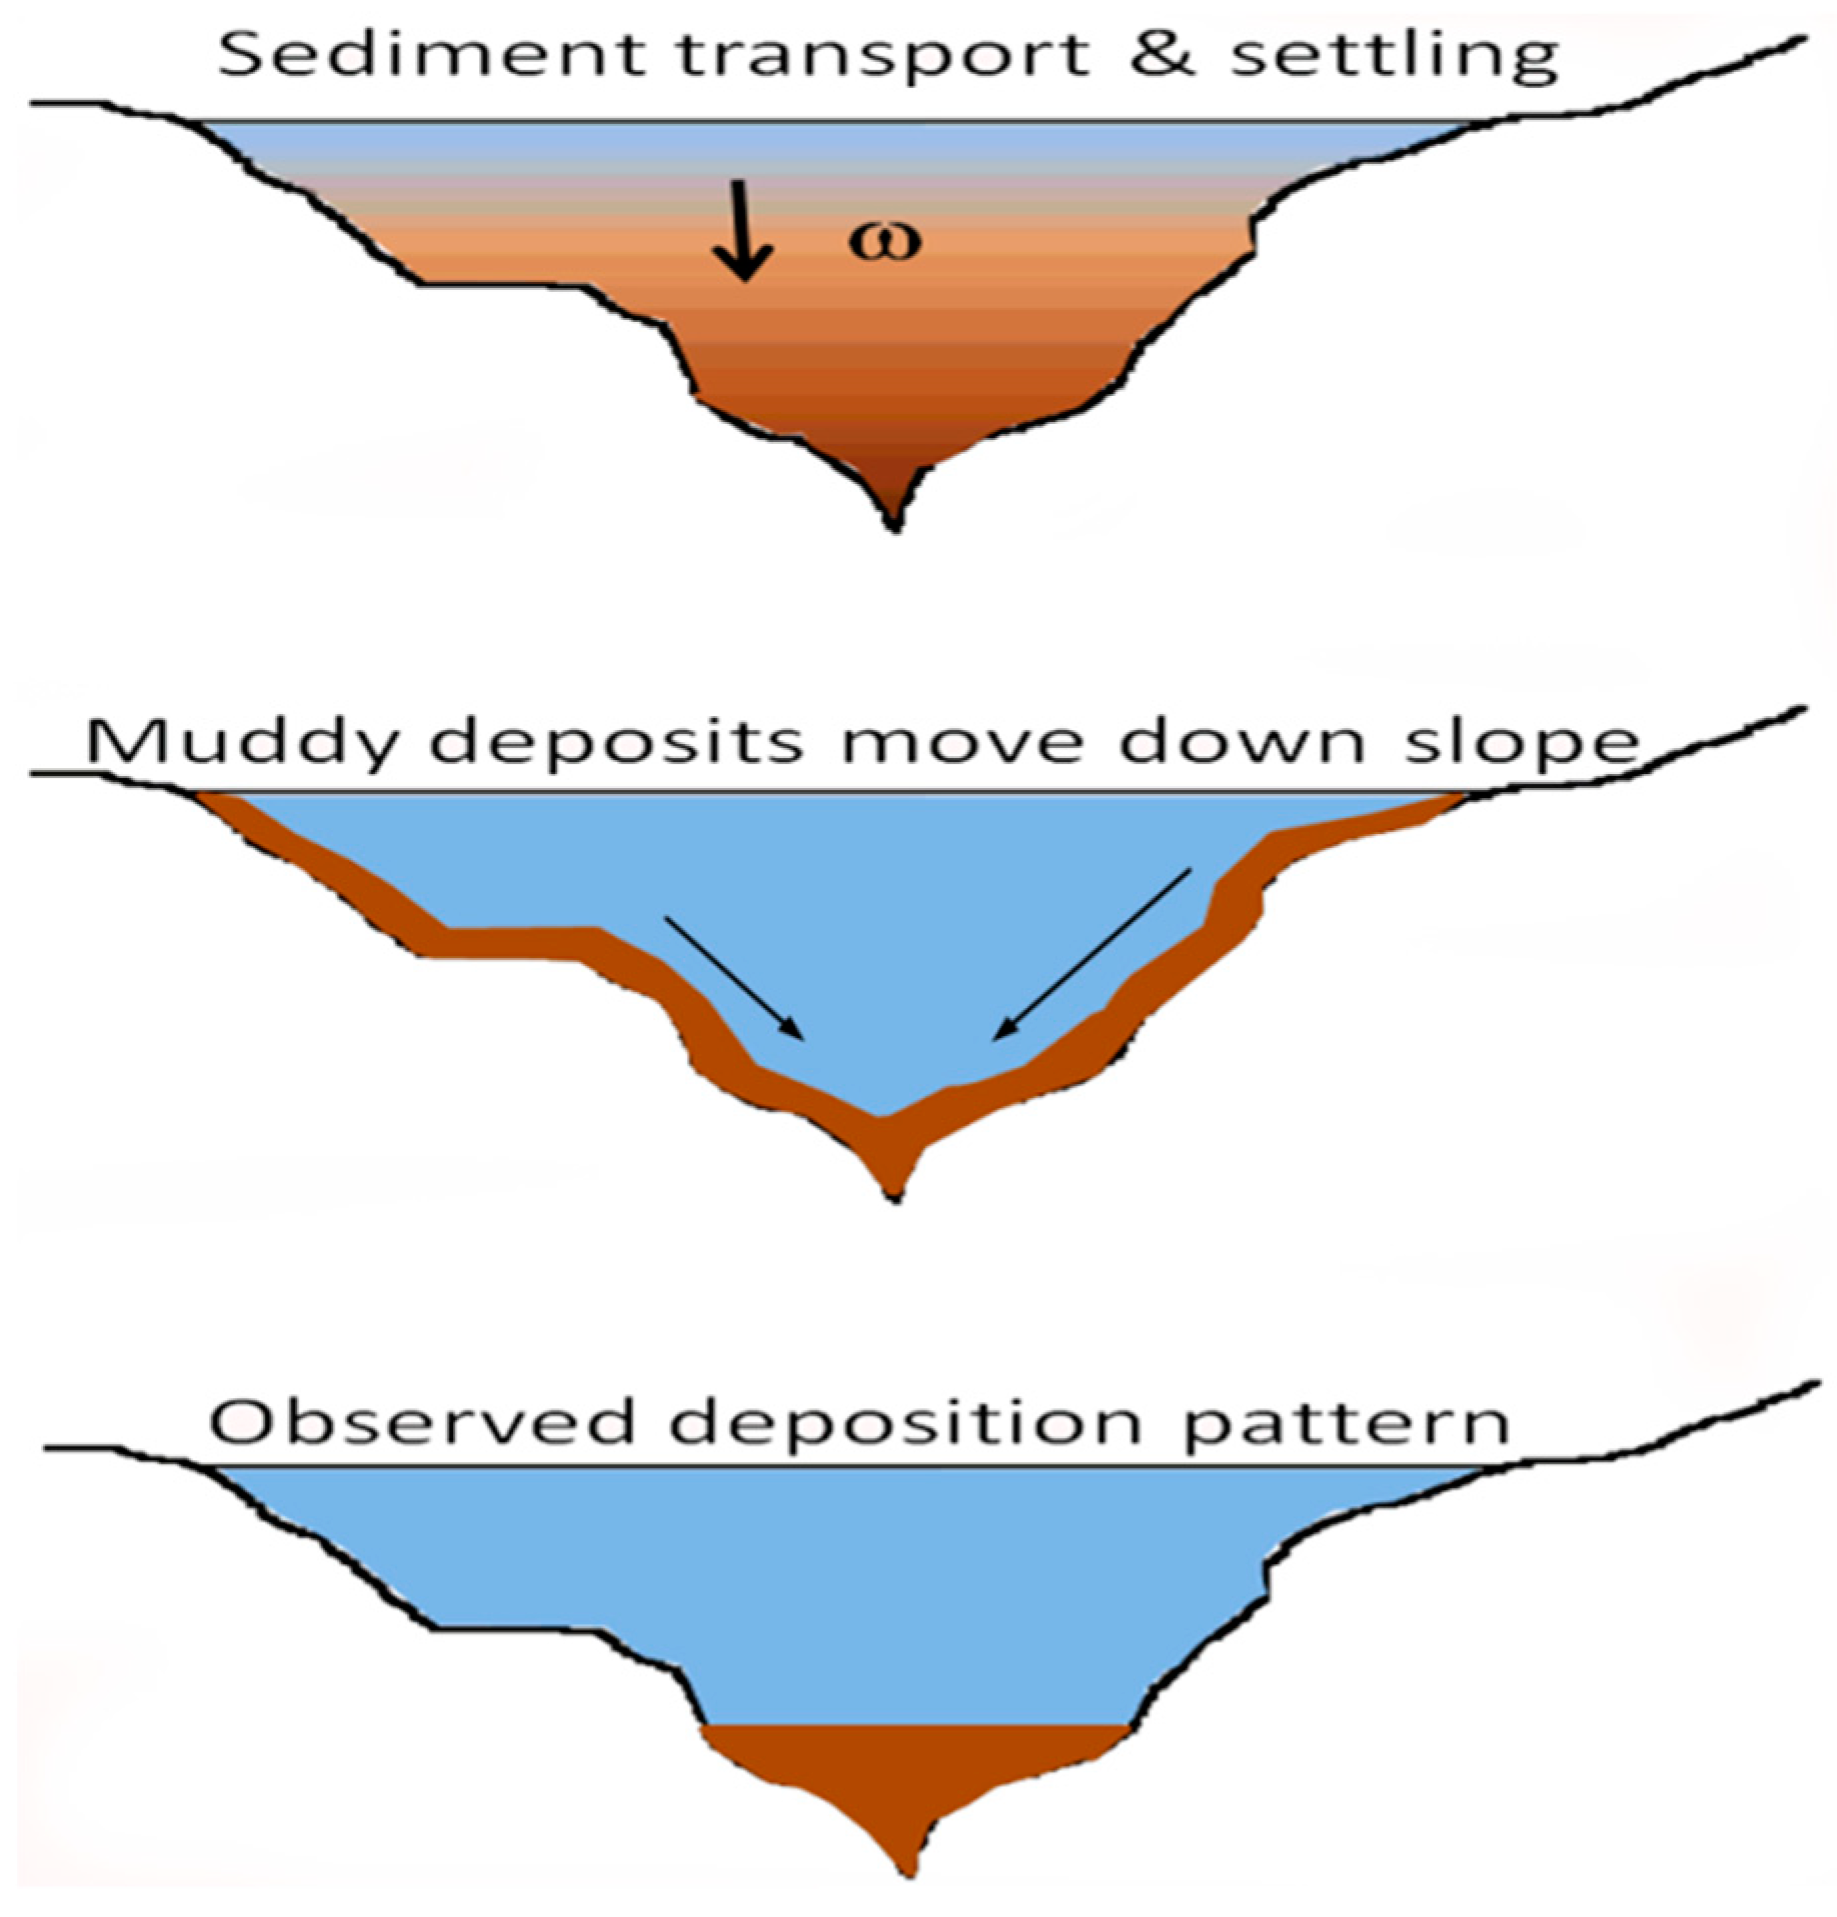
Therefore, the sedimentation process of fine sediment in deep areas of reservoirs can be summarized as several physical processes, including the dynamic process of sediment transport and settlement in flowing water, gravity-driven fluid flow of deposits, and compaction and consolidation.
The gravity-driven fluid flow of fine deposits is similar to that of fluid mud. Suppose that the surface slope of the fluid mud layer is . If (where is the Bingham ultimate shear force, and and are the weight and thickness of the fluid mud layer, respectively), the fluid mud would move down the slope under its own weight, as shown in Figure 4. Field observations have shown that the deposits in the deep channel are thick and that their surface is nearly horizontal in the dam area of the TGR (as shown in Figure 3). The main reason for this phenomenon is that the suspended sediment that was deposited during the early period of the TGR impoundment was so fine (median size of 0.004–0.01 mm) that the resulting deposits had a low initial dry bulk density and could move like fluid mud. The mud-like deposits moved downward of the surface slope due to gravity and accumulated in the deep channel of the riverbed, forming an uncommon sedimentation pattern in the early stage of the impoundment of the large reservoir.
2.2. Numerical Simulation Method for Transport and Settlement of Fine-Grained Sediment
Based on the analysis presented above, the whole processes of fine-grained sediment in the deep reservoir can be summarized as transport and settlement, gravity-driven fluid flow, and consolidation. The 3D Reynolds-averaged numerical model that depicts flow, sediment transport, and sediment settlement in a reservoir can be found in the related literature [20]. Here, we briefly describe the method.
The governing equations for water flow are given as:
where (i = 1,2,3) are velocity components; is the gravitational force per unit volume; is the density of water; and is the pressure. In this model, turbulence stresses are calculated with the standard turbulence model.
The 3D nonuniform suspended sediment transport equation can be expressed in Cartesian coordinates as:
where , , and are the flow velocities in the , , and directions, respectively; is the sediment concentration of group ; is the settling velocity of group ; and is the sediment diffusion coefficient.
The equation of bed evolution caused by suspended sediment transport (deposition) is
where is the dry bulk density of the deposits; and are the real and equilibrium sediment concentrations of group near the bed, respectively; is the bed level; and is the total number of sediment groups.
2.3. Numerical Simulation Method for Gravity-Driven Motion of Fine-Grained Sediment Deposits
Solid consolidation can be determined using existing methods. Here, we mainly discuss the method of simulating the gravity-driven flow of the fine-grained sediment deposits. Newly deposited fine-grained sediment deposits are a non-Newtonian fluid and are generally considered to be a Bingham fluid. Before movement, it is necessary to overcome the Bingham ultimate shear force. In this paper, a critical slope is used as a criterion for the destabilizing flow of fine-grained sediment deposits. The shallow water flow model is used to describe the gravity-driven flow process of the destabilized deposits.
When the surface slope of fine-grained sediment deposits satisfies the condition (where is the Bingham ultimate shear force, and and are the weight and thickness of the fluid mud layer, respectively), the deposits will move down the slope under their own weight [24]. Fine-grained deposits with different bulk densities have different Bingham ultimate shear forces. Here, we apply the formula for the Bingham ultimate shear force on fluid mud on a muddy shore [25],
where and are empirical parameters; = 9 × 10⁻⁹; and = 16.719 based on previous research [25].
After losing stability, the fine-grained deposit will flow. As the thickness of the deposits is small compared to the horizontal scale of the reservoir, we assume that the flow of the fine-grained deposit can be described by the 2D shallow flow equations.
Continuity equation:
Momentum equation:
where is the surface elevation of the fine-grained deposits; M = uh; N = vh; h is the thickness of the deposits; u and v are the velocities in the x and y directions, respectively; q is the source/sink of the fine deposit in a unit area, which can be calculated according to the instability as , where is the maximum thickness that can remain stable, and ; is the acceleration due to gravity; D is the kinematic viscosity; and n is the integrated Manning’s roughness. As gravity is the main driving force of the flow, the diffusion terms in Equations (7) and (8) can be neglected.
2.4. Numerical Simulation Procedure
Consistent with the 3D flow and sediment transport model, the gravity-driven flow equations of fine deposits are discretized based on the finite volume method, which has the advantage of conservation. The SIMPLEC algorithm is used to solve the problem. The solution process is shown in Figure 5 and illustrated as follows.
Step (1): Use the 3D numerical model to simulate the flow, sediment transport, and sediment deposition and to obtain the distribution of the deposition thickness .
Step (2): Based on the silt thickness and terrain slope, determine whether the deposits in a cell are stable or not. If , the deposit is unstable and the source term q will be calculated; otherwise, the deposit is stable and q is zero.
Step (3): Solve the deposit flow equations and apply the SIMPLEC algorithm to obtain the surface elevation of the deposits after being redistributed.
Step (4): Repeat steps (1)–(3) until the end of the calculation.
3. Results
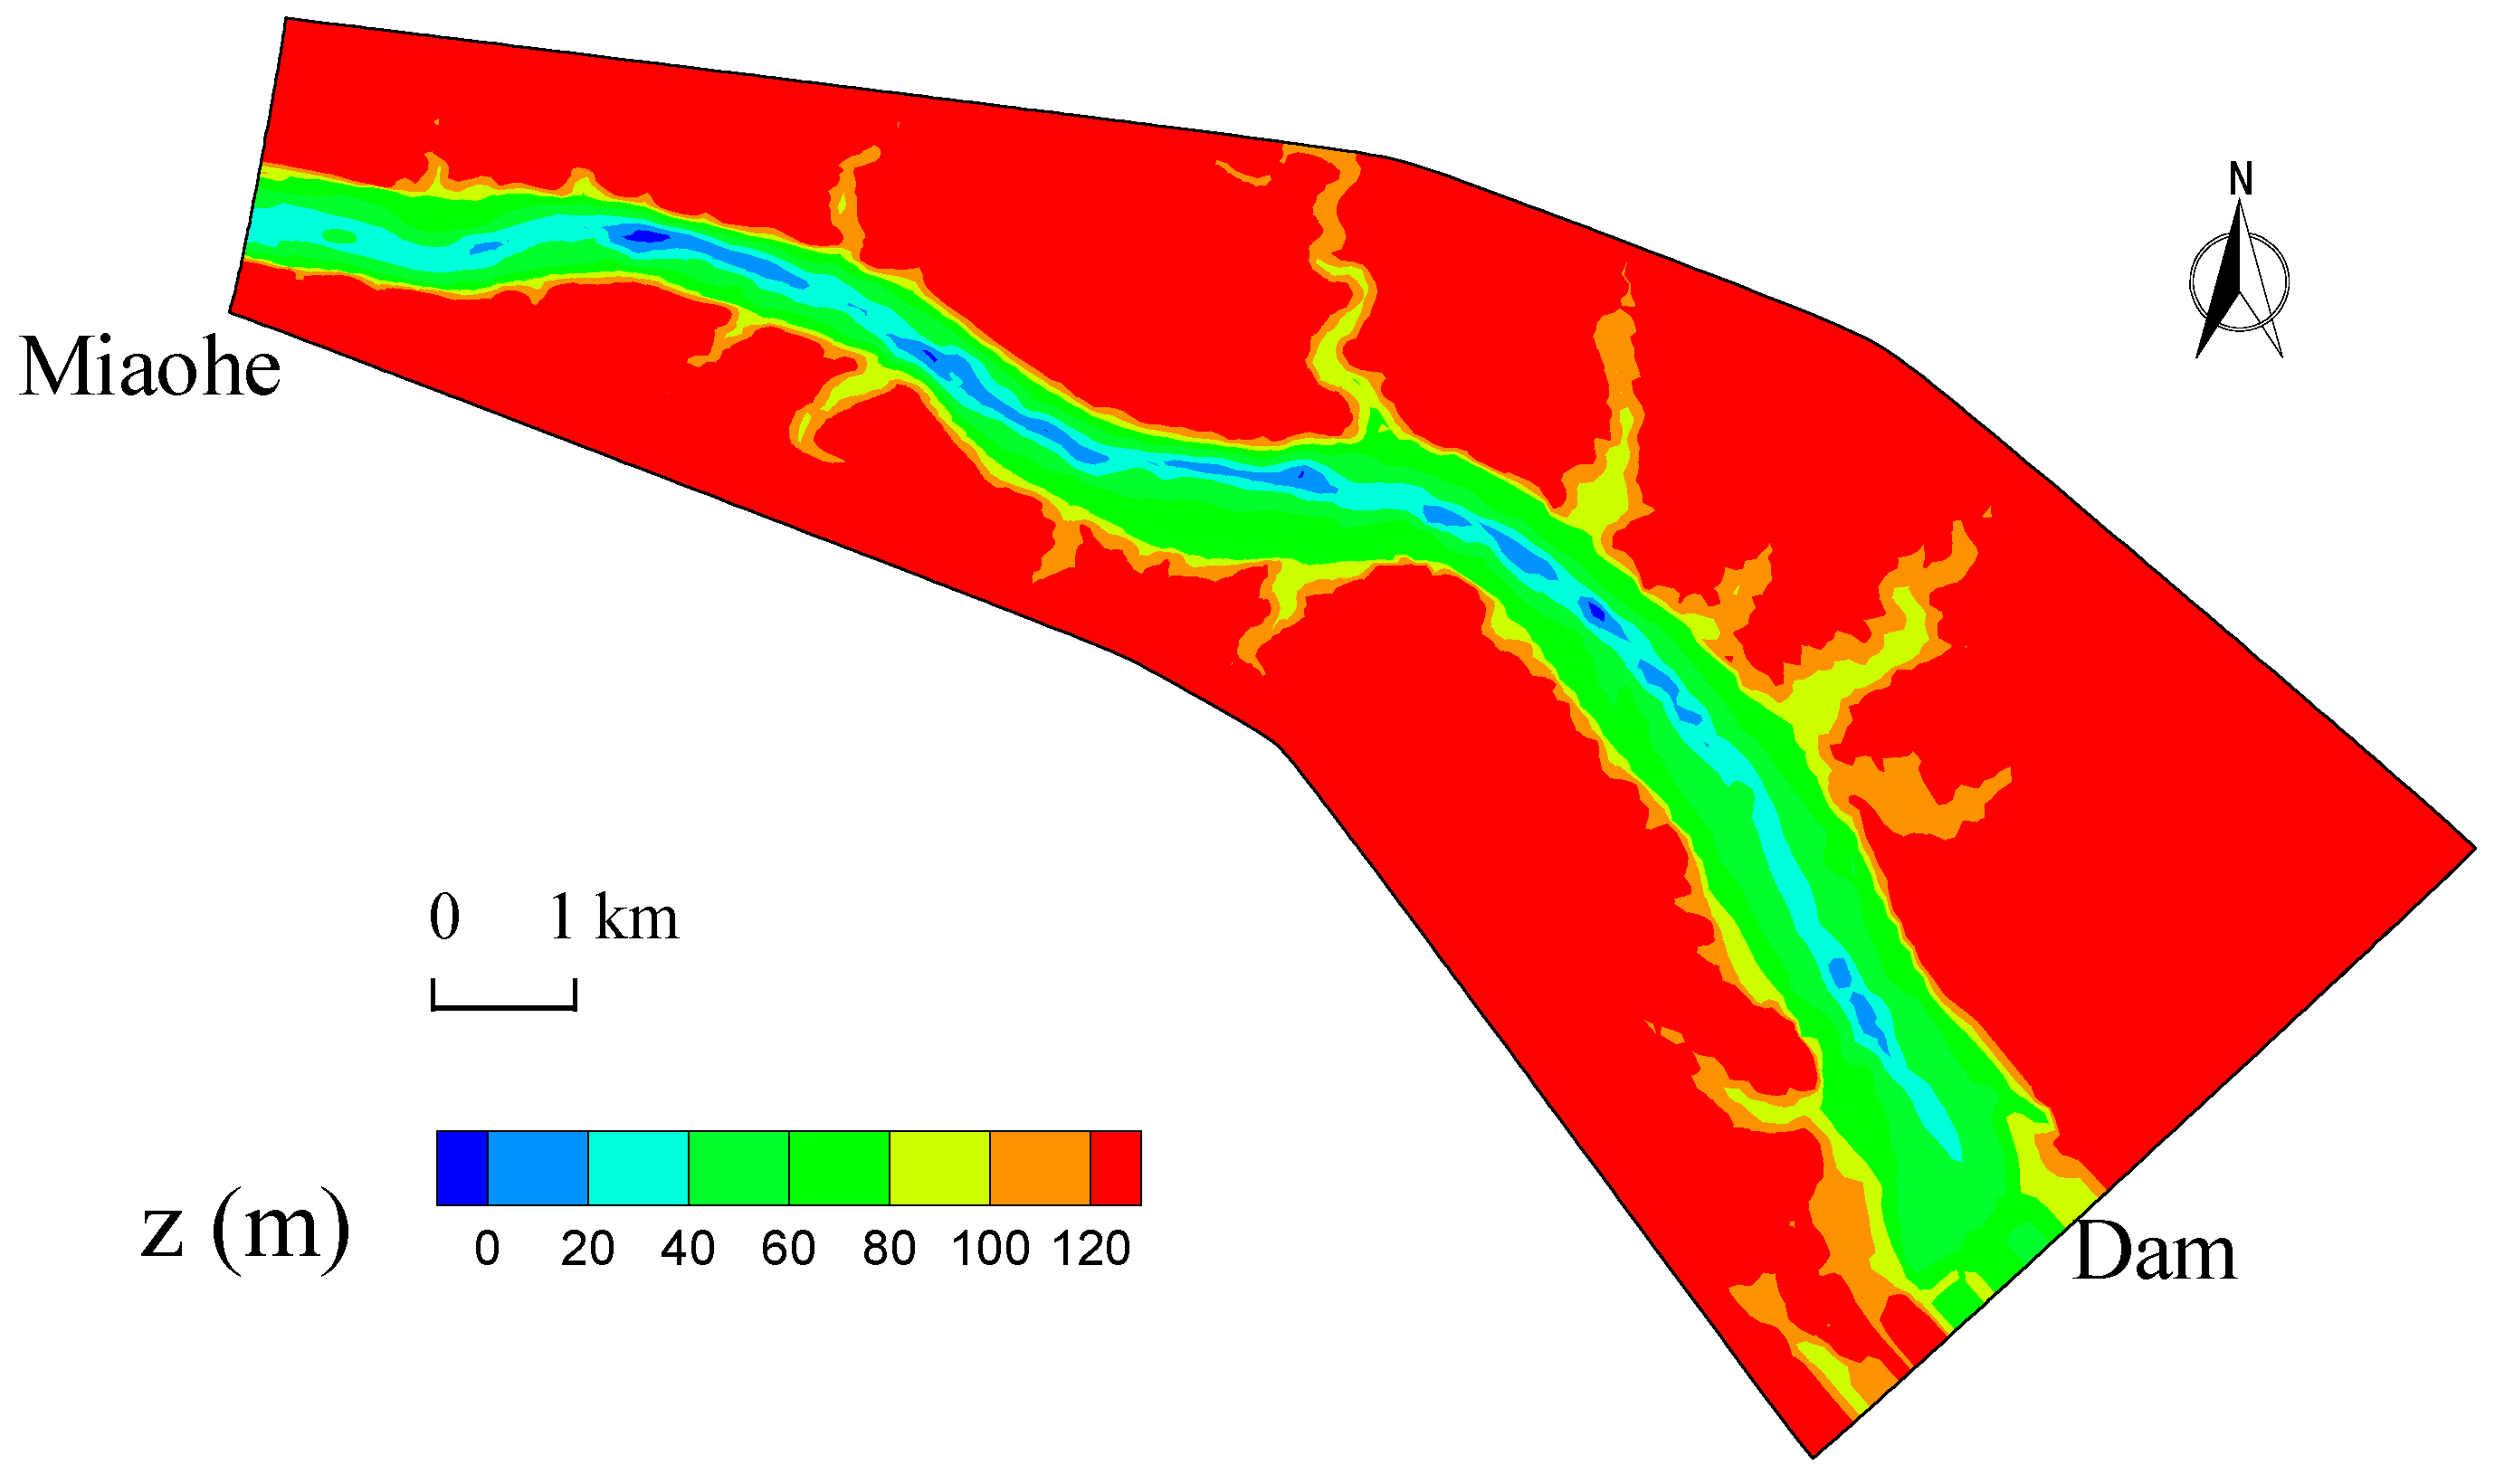
Based on the topographic, hydrological, and sediment data measured in the initial stage of the TGR impoundment, a 3D Reynolds-averaged water flow and sediment transport numerical model in the dam area of the TGR (from Miaohe to the dam, see Figure 2) was established. The simulated area was approximately 15 km long. The initial terrain for the simulation was measured in June 2003 (Figure 6). Flow and sediment data at Miaohe from June 2003 to November 2008 were used for the inflow conditions. The water level in front of the dam was used for the outflow conditions. The numbers of grid points in the longitudinal, lateral, and vertical directions were 198, 97, and 18, respectively.
3.1. Flow Field and Suspended Sediment Concentration
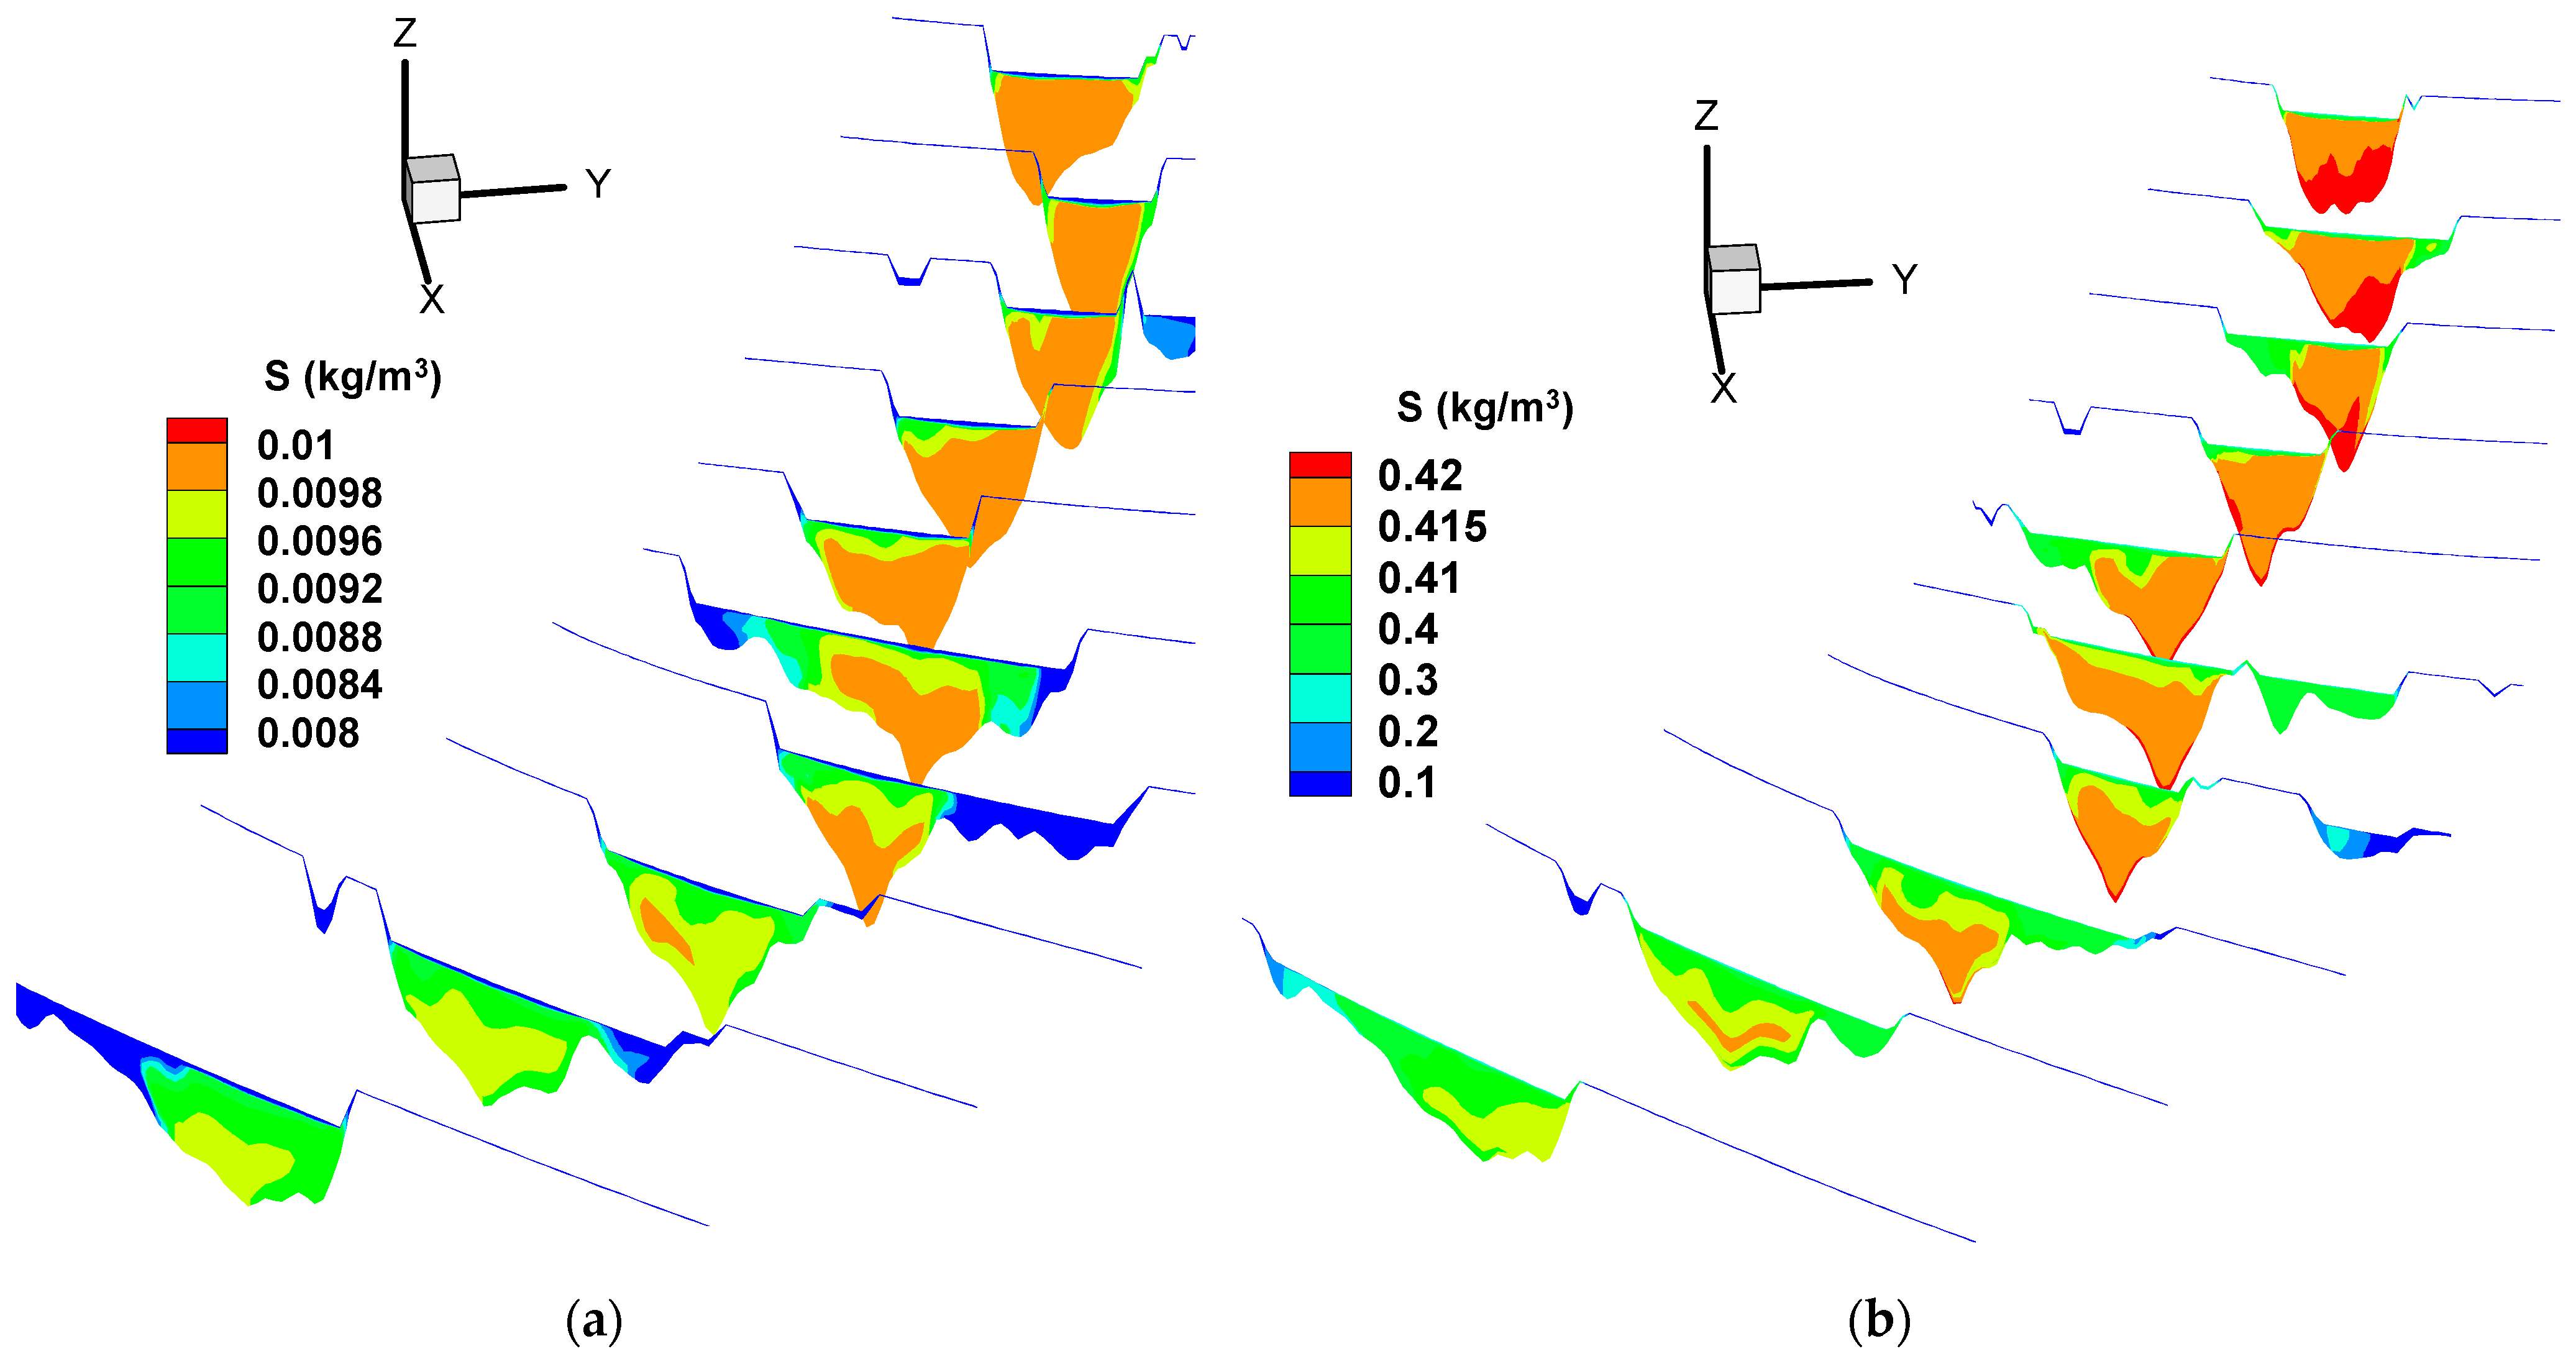
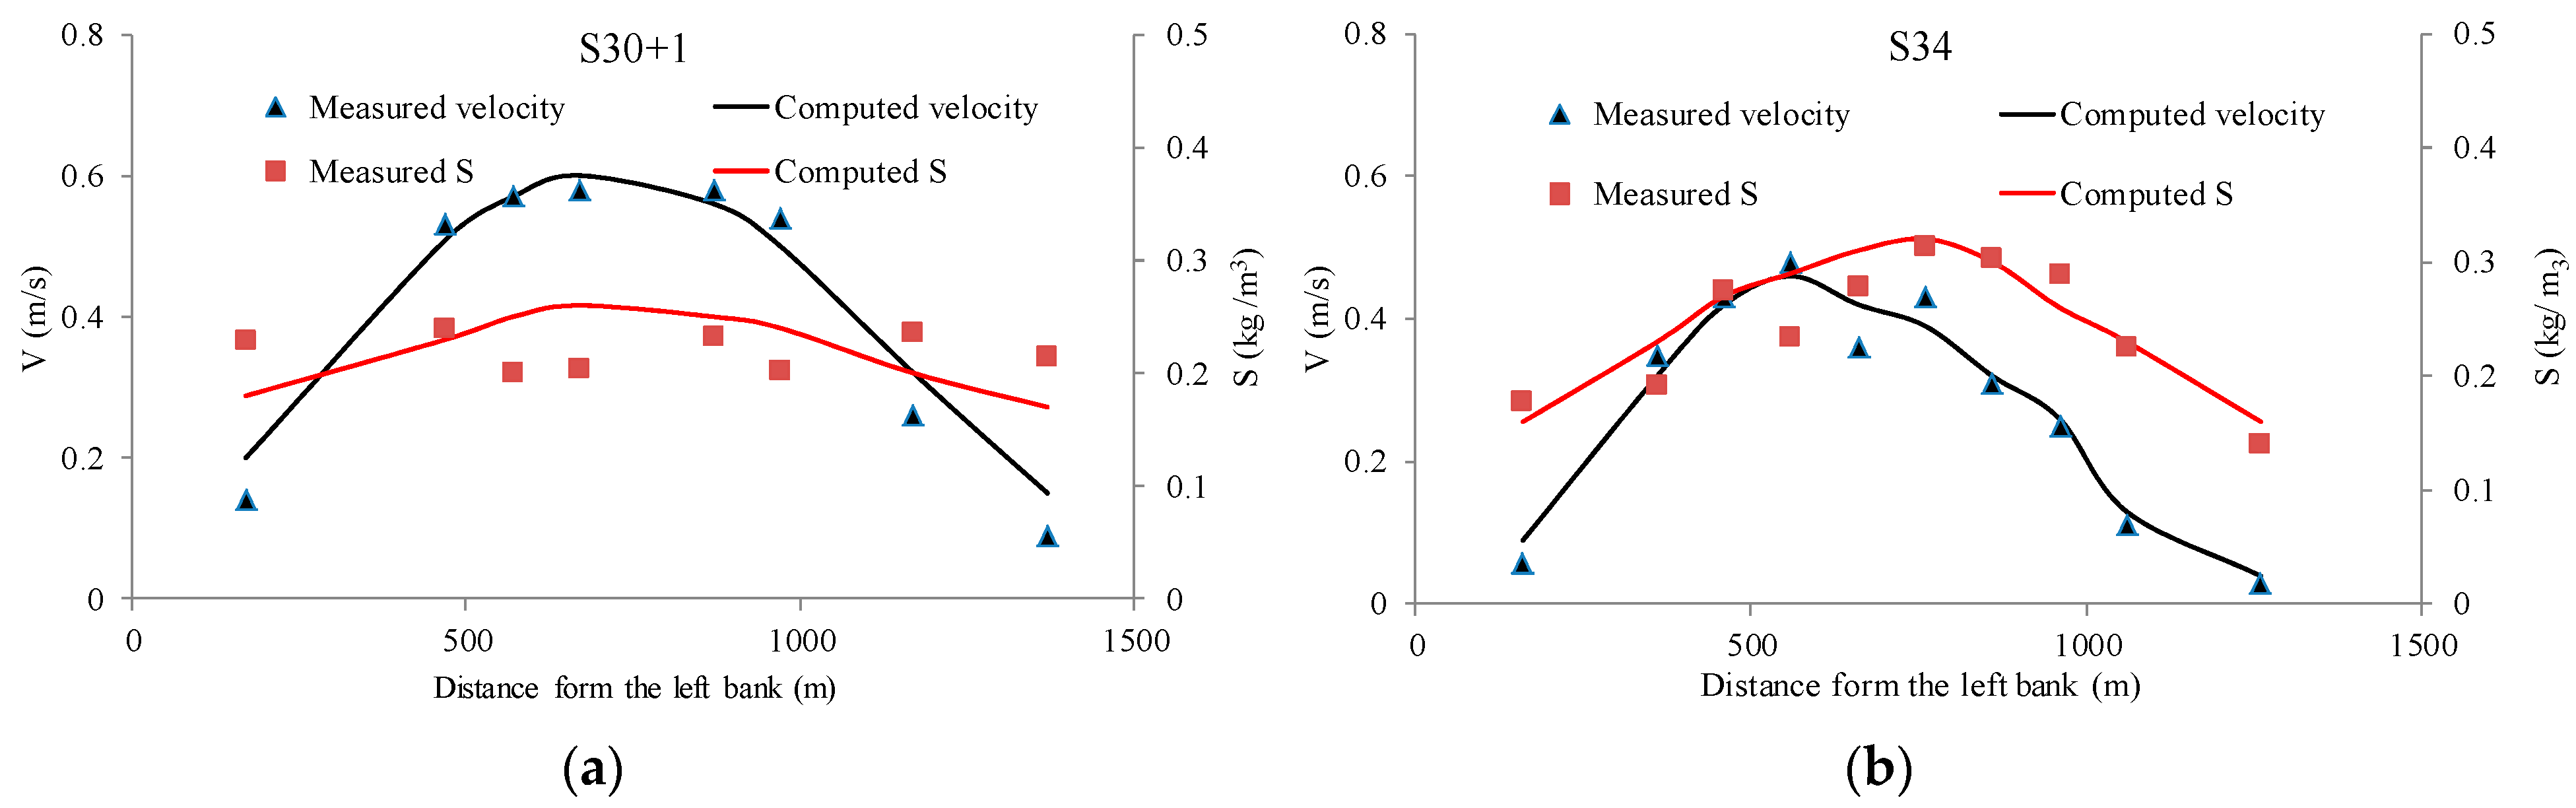
Figure 7 shows the calculated flow field for a flow discharge of 16,700 m3/s and a pool level of 135 m above sea level. Strong 3-D flow features can be observed in the bends near the dam area, and secondary currents are significant. The velocity vectors near the bottom point to the convex bank, whereas the surface vectors point to the concave bank. Based on the calculated flow velocities, the suspended load concentration can be calculated by solving the convection–diffusion equation. Figure 8 shows the calculated suspended load concentrations on typical cross-sections. The sediment concentration decreases much more rapidly in wider valley areas. Due to the impact of the secondary currents shown in Figure 7, the maximum concentration occurs at the convex side, whereas the minimum occurs at the concave side. Figure 9 shows a comparison of the observed and simulated velocities and suspended load concentrations on typical cross-sections (see Figure 2 for the locations of the sections) for a flow discharge of 24,600 m3/s. In general, the 3D numerical model accurately predicted the flow patterns and suspended load concentrations in the dam area of the TGR.
3.2. Features of Sedimentation Pattern
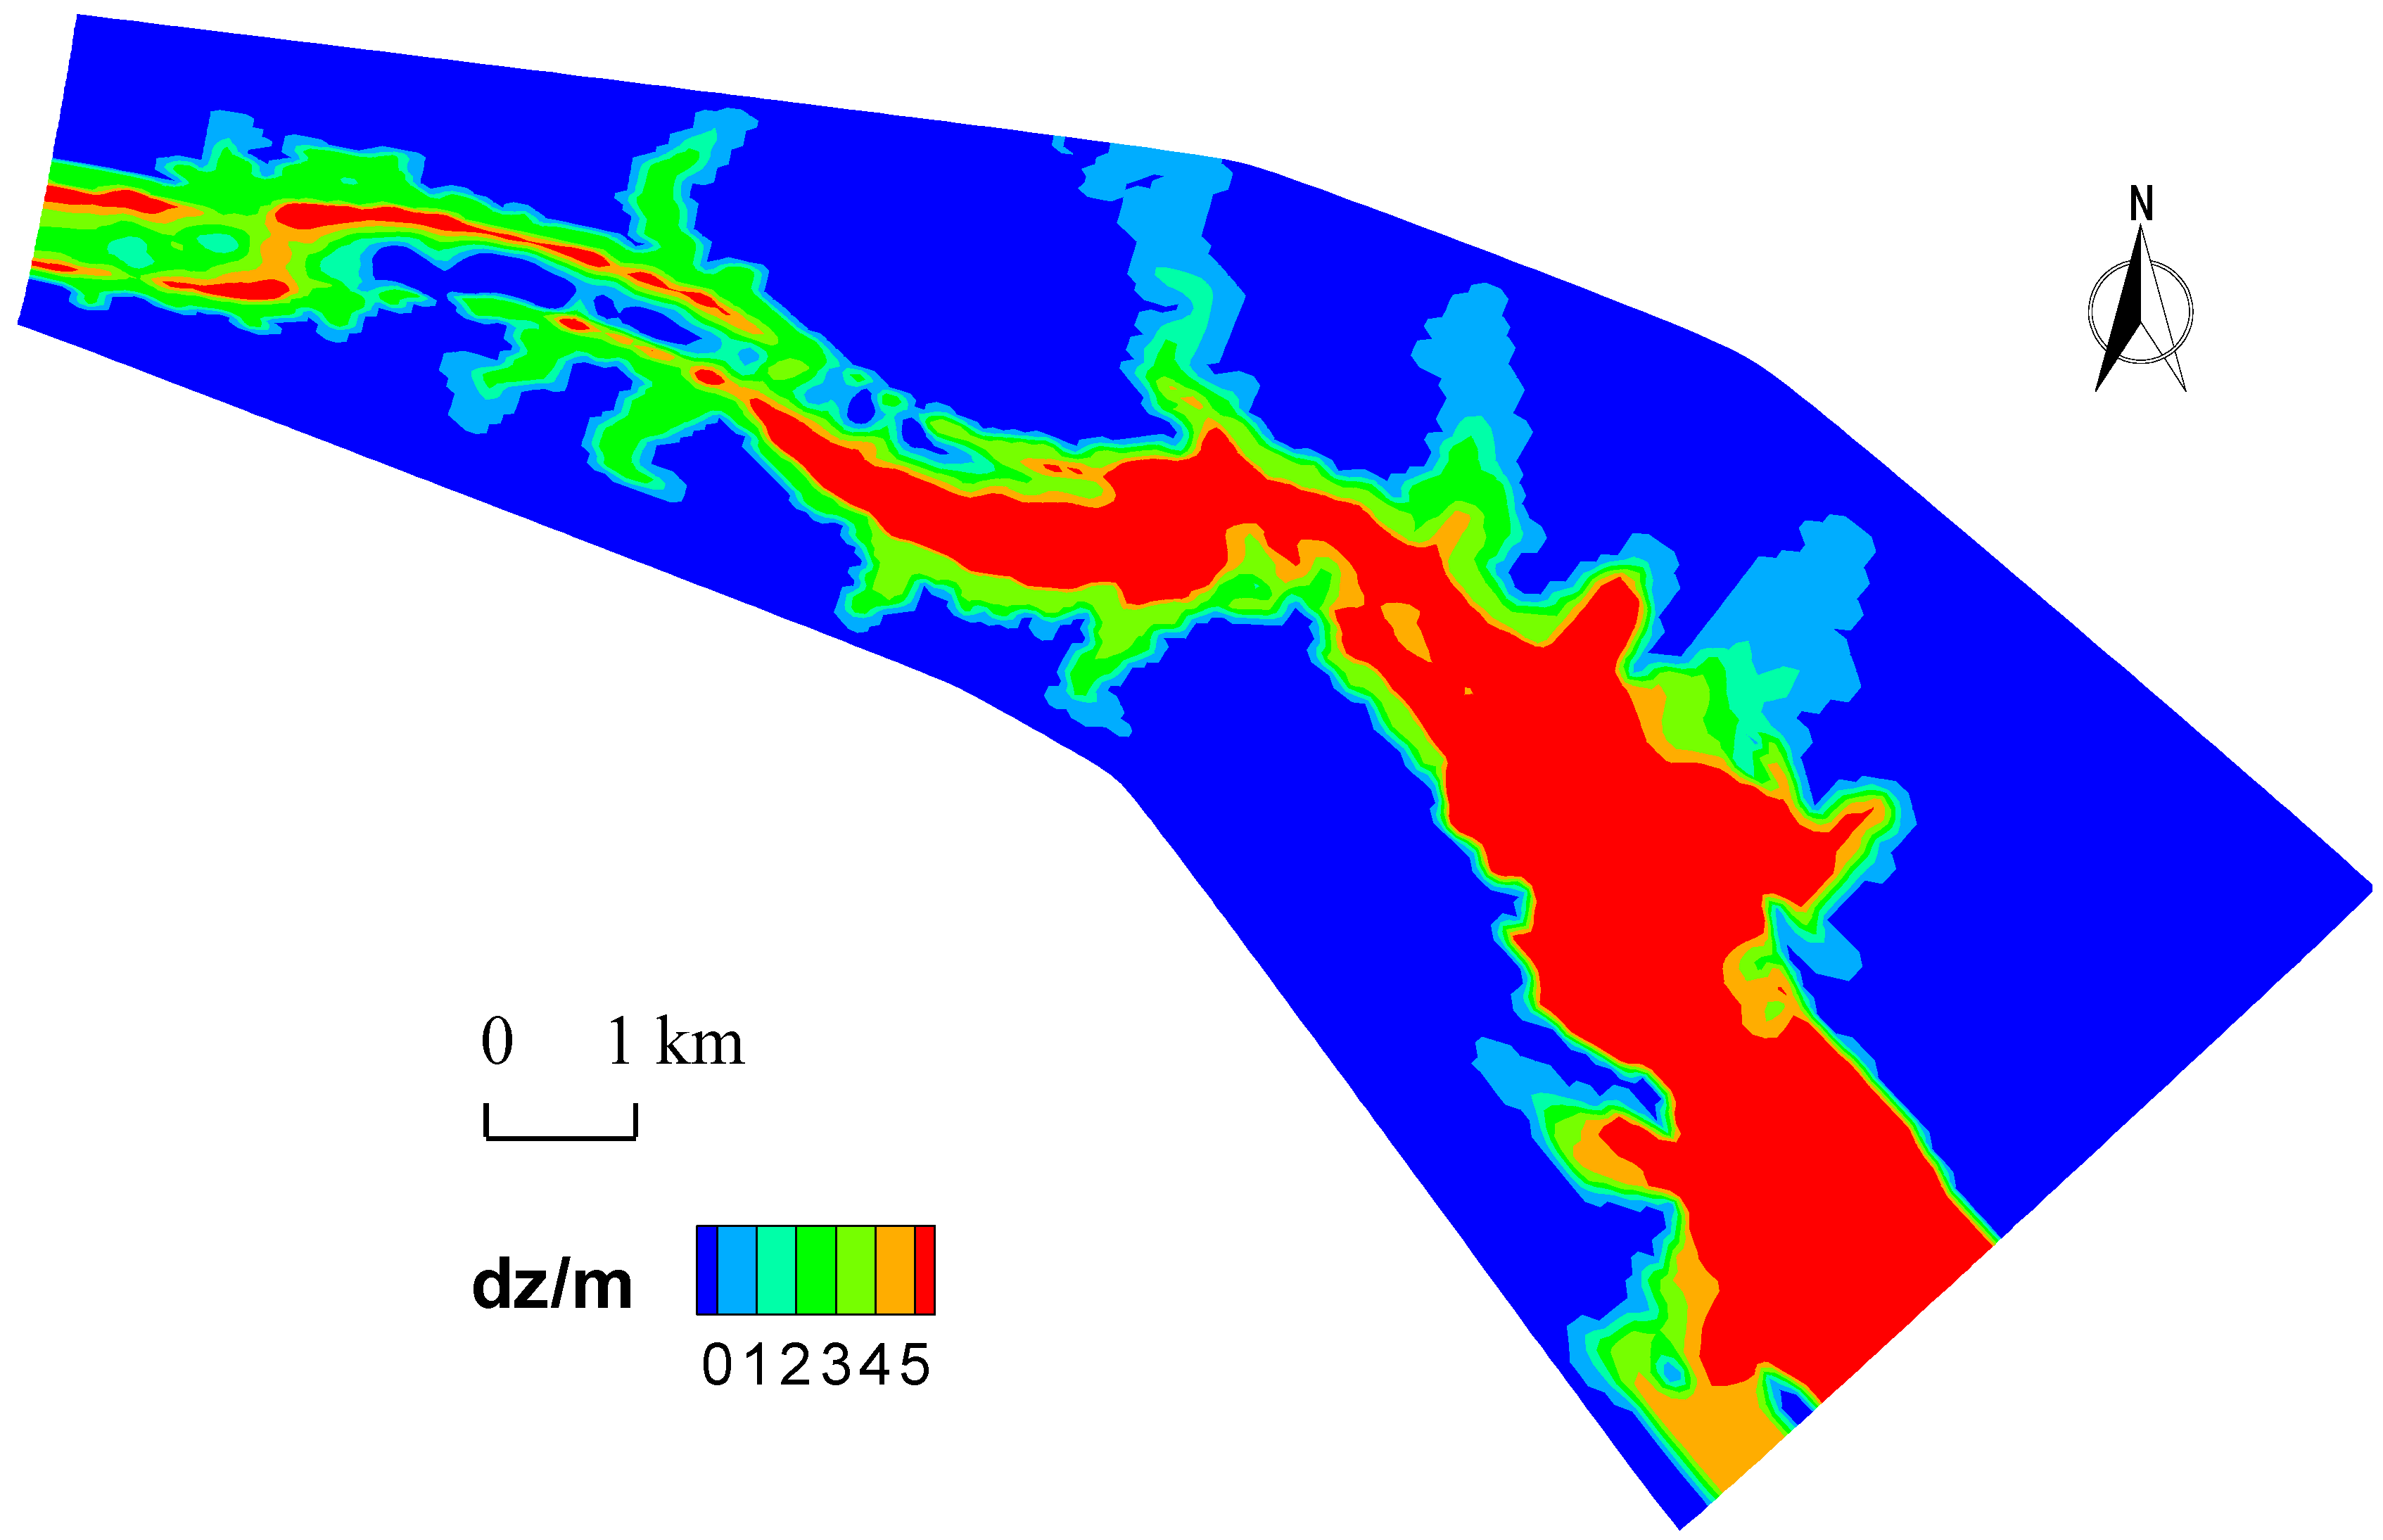
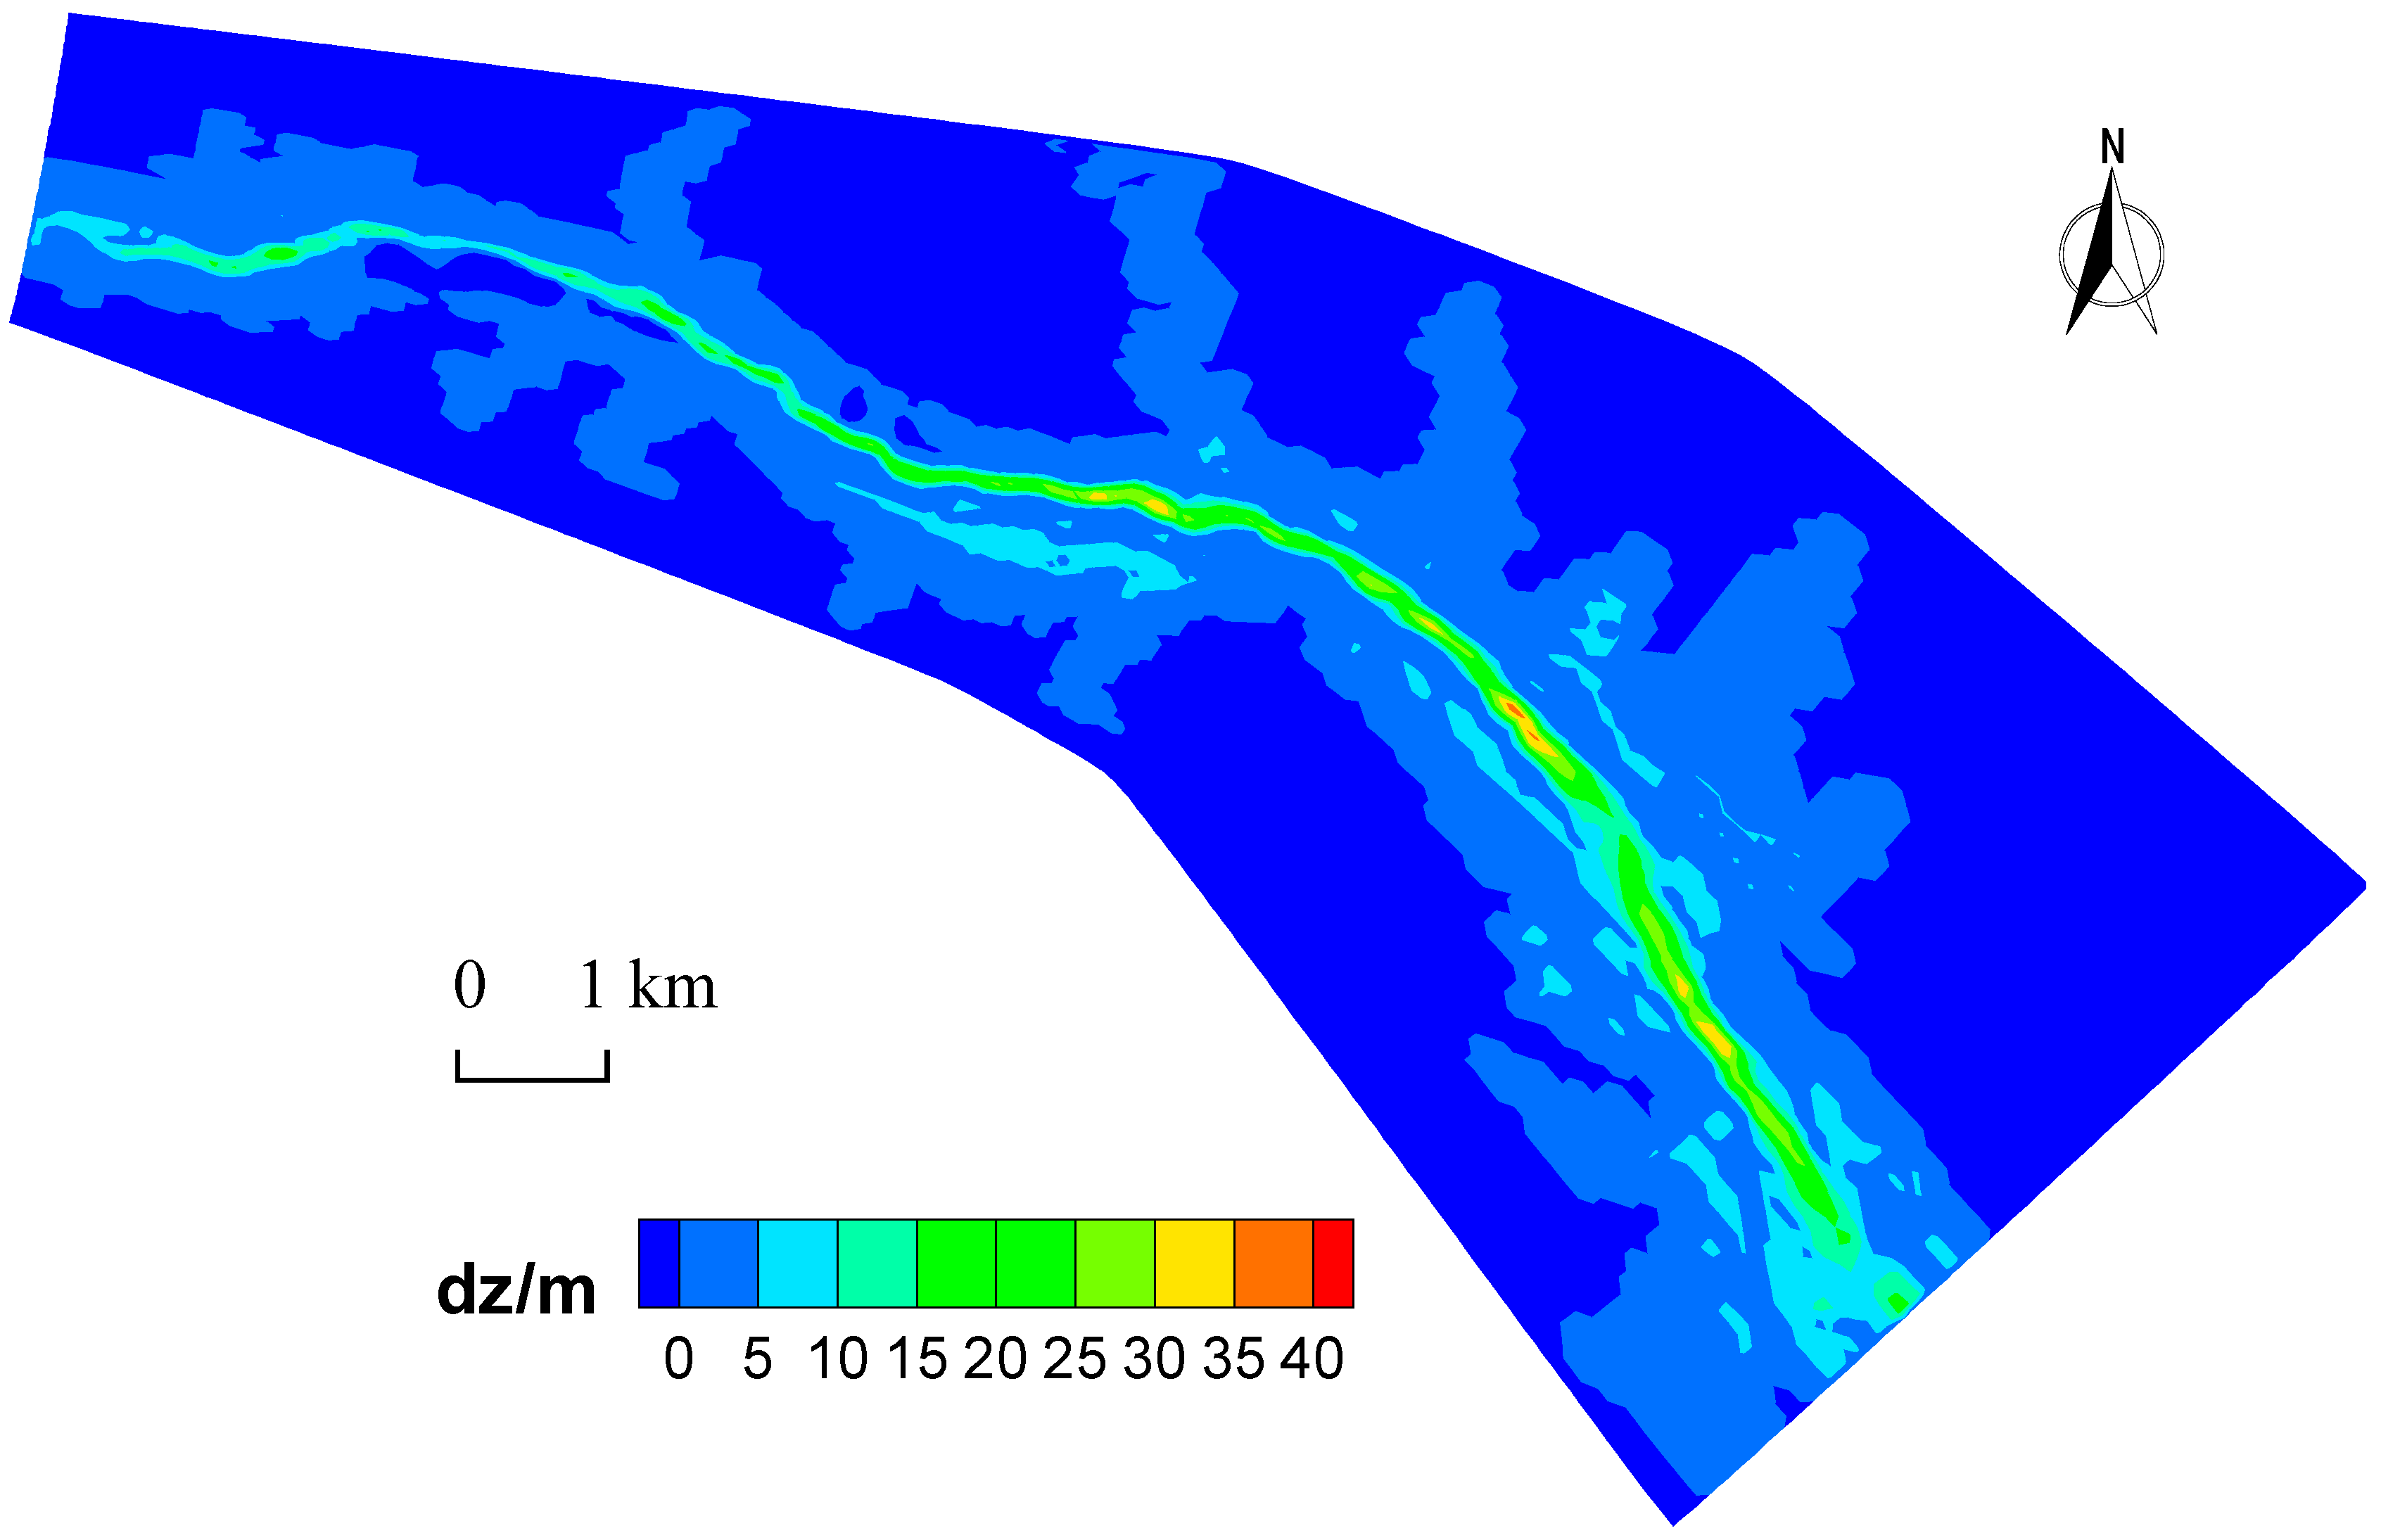
The river reach in front of the TGD is a wide valley of crystalline rocky hills with significant slopes on both banks. Fine-grained sediment settled in this area after the impoundment of the TGR. If the thickness of the deposits in a certain location exceeds a critical value, the deposits will flow down the slope under their own weight. Based on the verifications of the flow velocity and sediment concentration (Figure 9), Figure 10 shows the sediment thickness near the dam calculated by traditional 3D flow and sediment transport modeling (without considering the gravity-driven fluid flow of the deposits), and Figure 11 shows the results calculated using the proposed method. Although the total amounts of sediments are consistent, the sediment distributions are quite different. The sediment thickness calculated by the traditional method, which does not consider the fluid flow of the fine-grained deposit, is relatively uniform in map view (Figure 10). In contrast, the proposed model (Figure 11) predicts that most of the deposits will accumulate in the deep channel and that a few deposits will remain on the flat terraces on both sides, which is consistent with the observations.
Figure 12 shows comparisons between the observed and calculated sedimentation on several typical cross-sections (section locations are shown in Figure 2). The cross-sectional sedimentation pattern that considers gravity-driven motion is more similar to the observations than the pattern that does not consider the motion. This again confirms the significance of the gravity-driven flow of fine deposits.
Figure 13 compares the surface elevations along the thalweg between the observations and the results calculated with and without considering the gravity-driven deposit flow. It can be seen that the calculated results that consider the deposit flow match the observations quite well. Except the point at the entrance, the maximum error at the other points is 5.1 m, which is located at section S31# (see Figure 2 for the location). Based on measured data, the averaged and maximum deposition thickness along the thalweg are 22.22 and 57.3 m, respectively. Based on simulating results without considering the gravity-driven flow, the two values are 8.32 and 31.5 m correspondingly. The corresponding values based on simulating results that consider the gravity-driven flow are 24.43 and 56.5 m. By considering the gravity-driven flow, the averaged error of deposition thickness along the thalweg decreases from −13.9 to 2.2 m.
4. Discussion
4.1. Difference between Calculation and Measurement
Although the comparison strongly confirmed the necessity and advantage of considering the gravity-driven movement of the deposits, there was some discrepancy between the observations and simulating results.
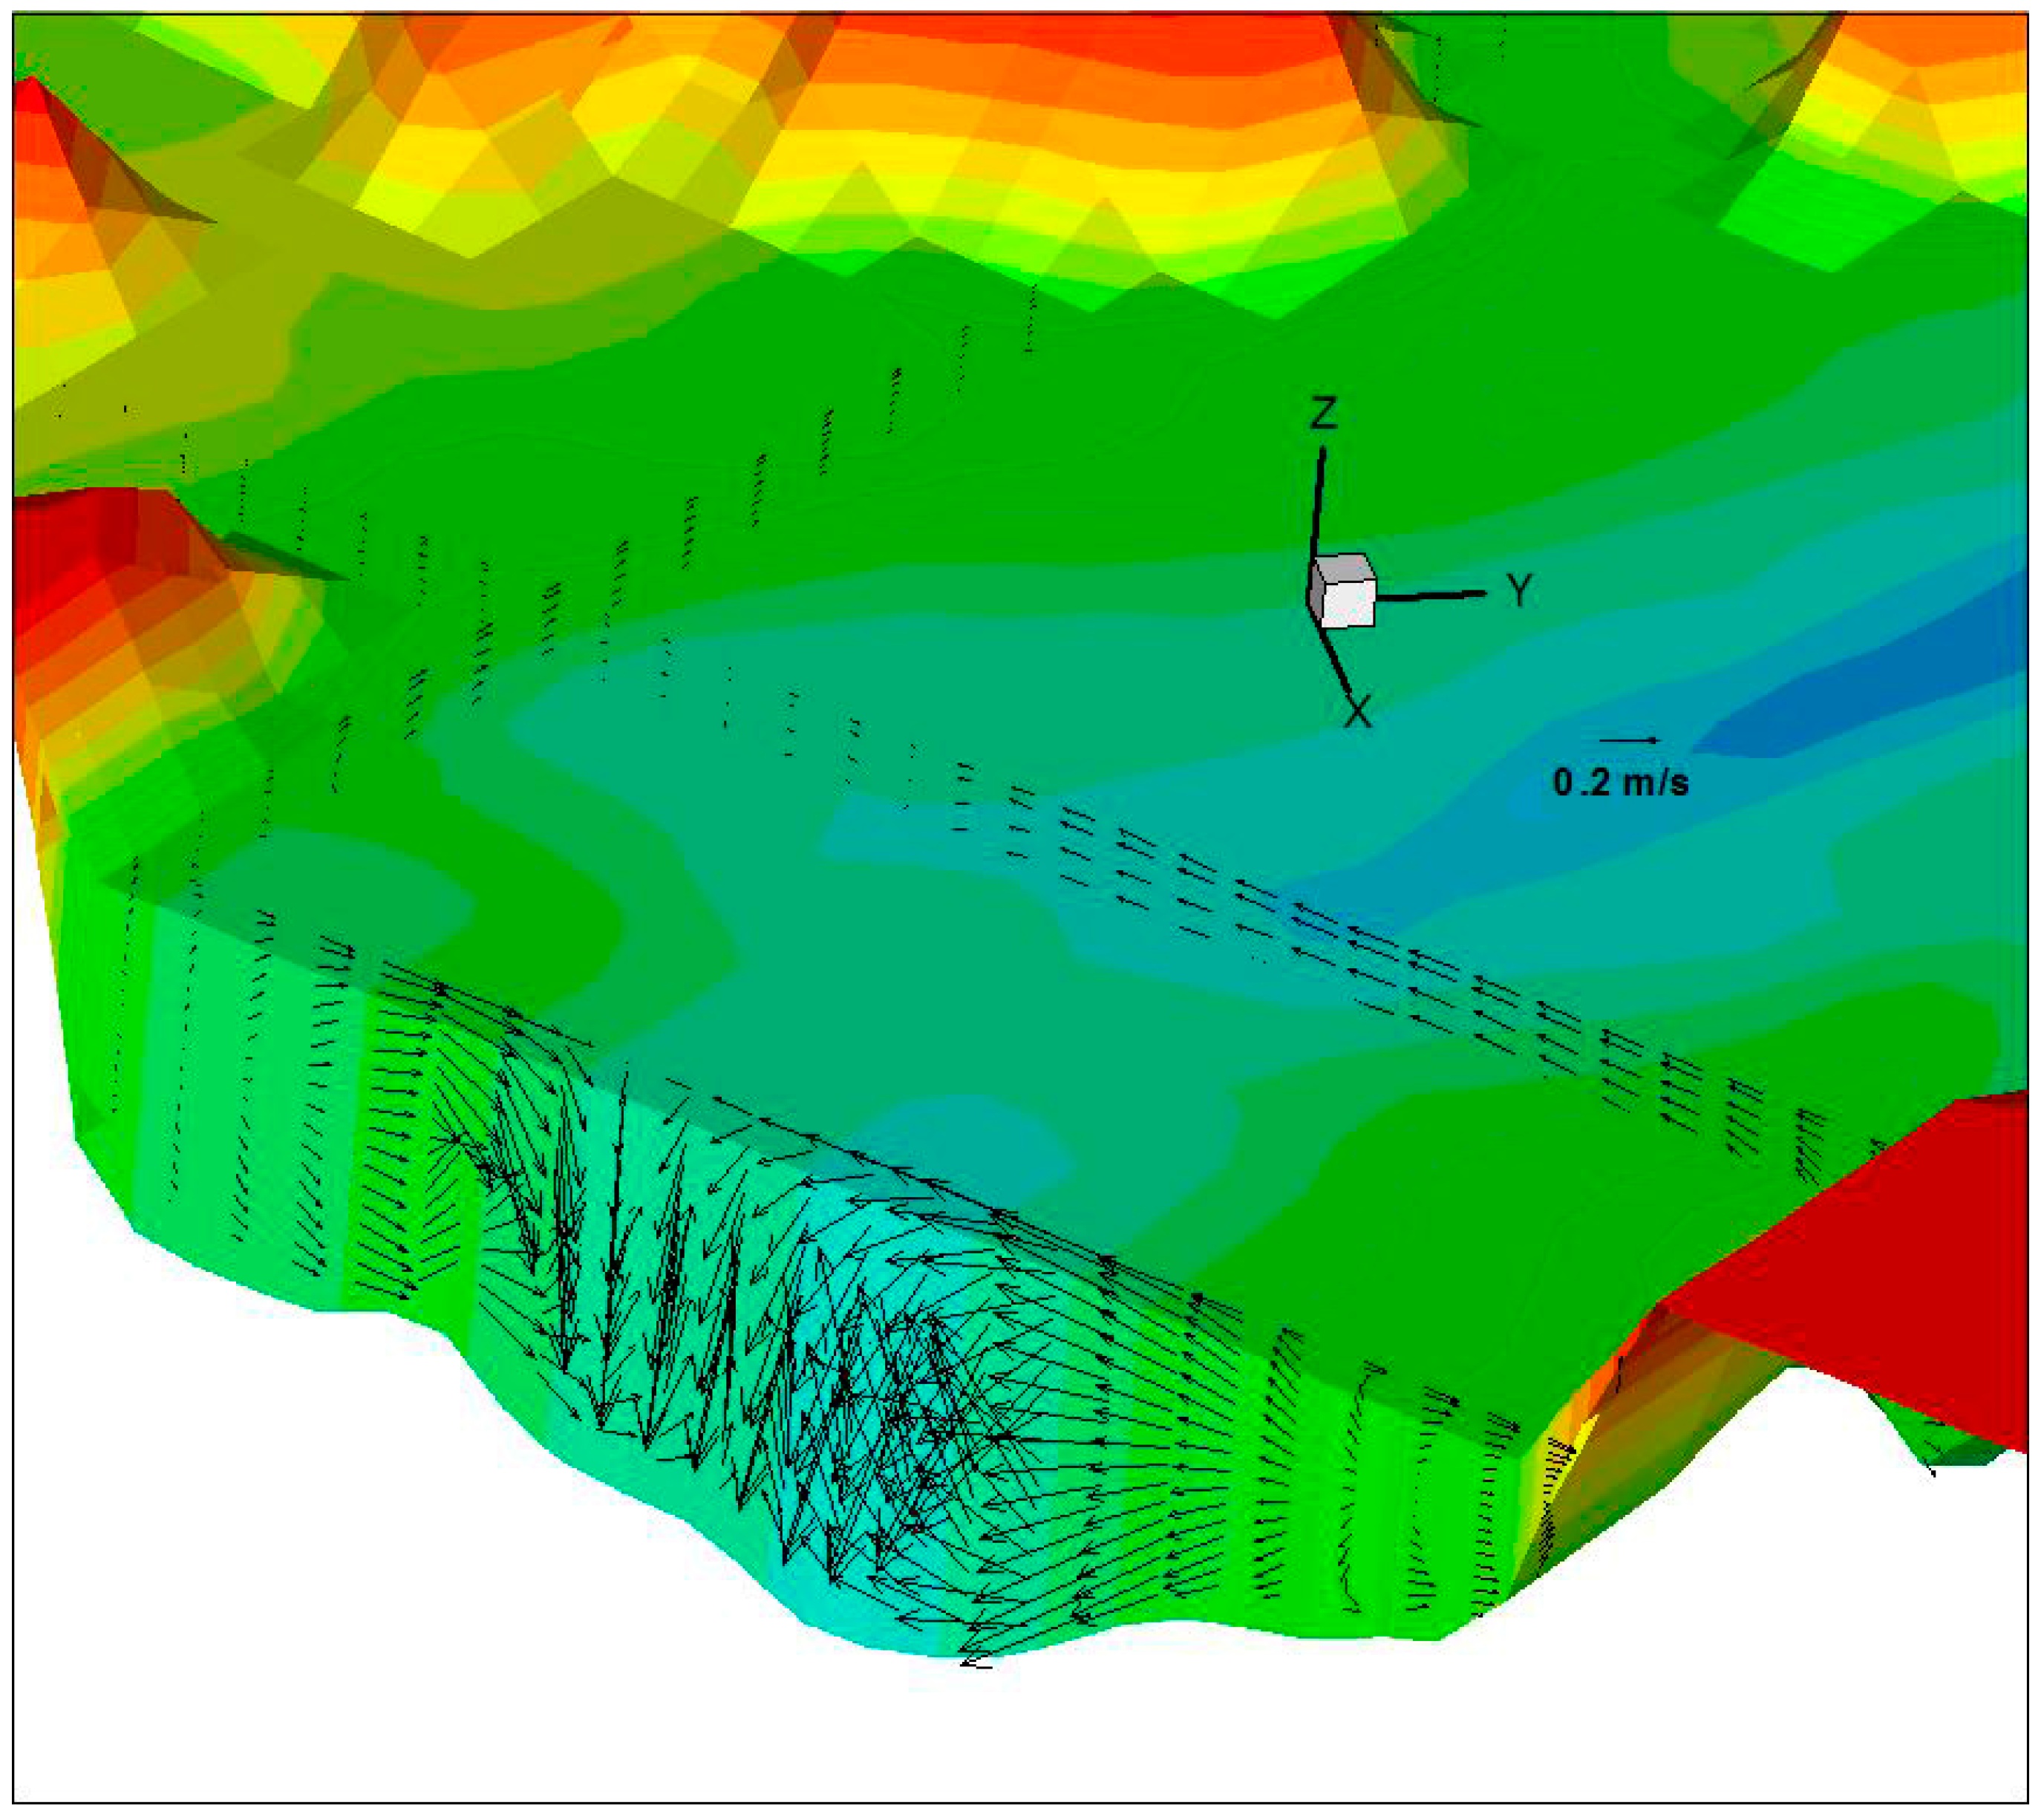
Near the dam, as shown in Figure 12a and Figure 13, the depth of the deposit at the thalweg is greater than that of the observation. This is probably because this section is near the discharge hole, so the fluid deposits may be scoured and flushed by the flow. The effect of discharge flow was not simulated precisely in this study, which may have caused the deviation. Figure 14 shows the computed velocity distribution in front of the dam. In this work, the outlets of the power plant were generalized as a single outlet area, which would flatten the flow speed nearby. Another possible reason is the terrain flattening caused by mesh interpolation in the numerical simulation. Without terrain flattening, some of the deposit may be blocked by local terrain undulation, reducing the amount of deposits that gathered in the deep channel. It is easy to imagine that those cross-sections with wider sides, more undulating, relatively gentle side slopes would suffer greater impact from terrain flattening. As the reach of the near-dam area gradually widens from Miaohe to the dam, the terrain flattening error is generally more obvious at the sections before the dam, which can explain the relatively larger discrepancy within 5 km before the dam than that of the upstream results in Figure 13.
4.2. Shortcomings of Present Method
In this work, shallow water equations are applicable to a Newtonian fluid. For a Bingham fluid, when integrating the continuity and momentum equations with depth to obtain the 2D governing equations, the nonlinear relationship between the shear stress and strain would generate significant differences with the shallow water equations [26]. If the shallow water equations are used, the resistance term would be more complicated than that of Manning’s formula [27]. Therefore, the modeling of gravity-driven flow of fine-grained deposits should be improved further. In addition, due to the discretization, the topographic data used in the numerical simulation are not consistent with the real topography. This also contributed to the discrepancy between the simulated results and observations. However, considering the gravity-driven fluid flow of the deposits, the simulation results of the overall sedimentation trend and distribution showed good agreements with the observations.
5. Conclusions
The deposition processes of fine-grained sediment in large reservoirs can be summarized as the settling of suspended sediment, gravity-driven fluid flow of the deposits, and sludge consolidation and compaction. Based on the physical mechanisms, we analyzed the dynamic causes of the patterns of fine-grained sedimentation in the dam area of the TGR during the initial stage of impoundment. The sediment deposited in the dam area of the TGR during this stage is mostly fine-grained sediment with a grain size generally between 0.004 and 0.010 mm. These fine-grained sediment deposits have a low dry bulk density and can move downslope toward the bottom of the riverbed due to the effect of gravity. These fluid deposits finally gather in the deep channel and have a horizontal surface, which is an uncommon feature of sedimentation in large reservoirs. The rapid increase in the surface elevation of the silt in front of the dam threatens the operations of the dam.
By coupling a traditional 3D water flow and sediment transport model with a newly proposed numerical method for the gravity-driven flow of fine-grained sediment deposits, a new method was developed and used to simulate the sedimentation pattern in the dam area of the TGR. The results showed that sediment would be deposited relatively uniformly in the dam area without considering the gravity-driven flow. When the gravity-driven fluid flow of the fine-grained deposits is considered, the distribution of the sediment deposits was more consistent with the observations than the results that do not consider gravity-driven flow. The simulation results showed that the deposits mainly accumulated in the deep channel with a flat surface, which agreed well with the observations. This study revealed the key role of the gravity-driven flow of deposits in simulating the deposition of fine-grained sediment in large reservoirs.
Author Contributions
Conceptualization, D.J. and X.S.; funding acquisition, D.J. and X.Z.; investigation, D.J. and X.Z.; methodology, D.J. and J.Z.; project administration, D.J. and X.Z.; resources, D.J. and X.Z.; software, D.J.; supervision, X.S.; validation, D.J. and J.Z.; writing—original draft, J.Z.; writing—review and editing, D.J. All authors have read and agreed to the published version of the manuscript.
Funding
This research was funded by the National Key R&D Program of China (Nos. 2018YFC0407402) and the National Natural Science Foundation of China (Nos. 51579151, 51779148 and U2040215).
Institutional Review Board Statement
Not applicable.
Informed Consent Statement
Not applicable.
Data Availability Statement
No new data were created or analyzed in this study. Data sharing is not applicable to this article.
Conflicts of Interest
The authors declare no conflict of interest.
References
- Zhou, J.J.; Zhang, M.; Cao, H.Q. Removing coarse sediment by sorting of reservoirs. Sci. China Technol. Sci. 2011, 41, 833–844. (In Chinese) [Google Scholar] [CrossRef]
- Schleiss, A.J.; Franca, M.J.; Juez, C.; De Cesare, G. Reservoir sedimentation. J. Hydraul. Res. 2016, 54, 595–614. [Google Scholar] [CrossRef]
- Huang, Y.; Wang, J.; Yang, M. Unexpected sedimentation patterns upstream and downstream of the Three Gorges Reservoir: Future risks. Int. J. Sediment. Res. 2019, 34, 108–117. [Google Scholar] [CrossRef]
- Faghihirad, S.; Lin, B.; Falconer, R. Application of a 3D Layer Integrated Numerical Model of Flow and Sediment Transport Processes to a Reservoir. Water 2015, 7, 5239–5257. [Google Scholar] [CrossRef] [Green Version]
- The Science and Technology Department of Ministry of Water Conservancy and Electric Power. Reports Collection on the Sediment Issues of the Three Gorges Reservoir; The Science and Technology Department of Ministry of Water Conservancy and Electric Power: Beijing, China, 1988. (In Chinese)
- State Council Three Gorges Project Construction Committee Executive Office Sediment Experts Group, China Three Gorges Project Corporation Sediment Experts Group. Sediment Research of the Three Gorges Project (1996–2000, Volume 8); Intellectual Property Press: Beijing, China, 2008; Chapter 3. (In Chinese)
- Li, W.J.; Yang, S.F.; Fu, X.H.; Xiao, Y. Study on the sedimentation characteristics in the Three Gorges Reservoir during the initial operation stage. Adv. Water Sci. 2015, 26, 676–685. (In Chinese) [Google Scholar]
- Chen, G.Y.; Yuan, J.; Xu, Q.X. On sediment diversion ratio after the impoundment of the Three Gorges Project. Adv. Water Sci. 2012, 23, 355–362. (In Chinese) [Google Scholar]
- Yang, C.R.; Deng, J.Y.; Qi, Y.M.; Wang, Y.X.; Lin, J.Y. Study on Long-term Impact of Small and medium-sized floods regulation on sedimentation of the Three Gorges Reservoir. Water Resour. Power 2020, 38, 34–37. (In Chinese) [Google Scholar]
- Bureau of Hydrology, Changjiang Water Resources Commission. Analysis of Sedimentation and Erosion in the Three Gorges Reservoir and the River Reach Between TGP and Gezhouba Project in 2007; Bureau of Hydrology, Changjiang Water Resources Commission: Wuhan, China, 2008. (In Chinese)
- Fang, H.W.; Rodi, W. Three-dimensional calculations of flow and suspended sediment transport in the neighborhood of the dam for the Three Gorges Project reservoir in the Yangtze River. J. Hydraul. Res. 2003, 41, 379–394. [Google Scholar] [CrossRef]
- Lu, Y.J.; Dou, G.R.; Han, L.X.; Shao, X.J.; Yang, X.H. 3D mathematical model for suspended load transport by turbulent flows and its applications. Sci. China. Ser. E. 2004, 47, 237–256. [Google Scholar] [CrossRef]
- Zhang, N.; Yi, D.R.; Dai, W.L. Analysis of scouring and silting in the reach from dam to Lidu town in the Three Gorges Reservoir. Yangtze River 2006, 37, 95–98. (In Chinese) [Google Scholar]
- Department of Hydraulic Engineering, Tsinghua University. Analysis of the Field Data of Reservoir Sedimentation in the Three Gorges Reservoir; Tsinghua University: Beijing, China, 2009. (In Chinese) [Google Scholar]
- Hu, C. Analysis on sediment scouring and silting variation of Three Gorges Reservoir since 175 m trial impoundment for past ten years. Water Resour. Hydropower Eng. 2019, 50, 18–26. (In Chinese) [Google Scholar]
- Ren, S.; Zhang, B.; Wang, W.; Yuan, Y.; Guo, C. Sedimentation and its response to management strategies of the Three Gorges Reservoir, Yangtze River, China. Catena 2021, 199, 105096. [Google Scholar] [CrossRef]
- Han, Q.W. Reservoir Sedimentation; Science Press: Beijing, China, 2003. (In Chinese) [Google Scholar]
- Jia, D.D.; Shao, X.J.; Zhang, X.N.; Zhou, J.Y. Preliminary analysis on the causes of reservoir sedimentation pattern in the vicinity of Three Gorges Project during its early filling. Adv. Water Sci. 2011, 22, 539–545. (In Chinese) [Google Scholar]
- Zhang, N.; Dai, W.; Zhu, H.; Li, J. Initial dry density of sediments in the Three Gorges Reservoir. Yangtze River 2006, 37, 59–61. (In Chinese) [Google Scholar]
- Jia, D.D.; Shao, X.J.; Zhang, X.N.; Ye, Y.T. Sedimentation patterns of fine-grained particles in the dam area of the Three Gorges Project: 3D numerical simulation. J. Hydraul. Eng-ASCE 2013, 139, 669–674. [Google Scholar] [CrossRef]
- Zhou, J.Y.; Shao, X.J.; Jiang, L.; Jia, D.D. Gravity-driven transport of fine grained reservoir sediments. J. Zhejiang Univ. 2014, 48, 2254–2258. (In Chinese) [Google Scholar]
- Xiao, Y.; Yang, F.S.; Zhou, J.Y.; Chen, W.S. 1-D numerical modeling of the mechanics of gravity-driven transport of fine sediments in the Three Gorges Reservoir. Lake. Reserv. Manag. 2015, 31, 83–91. [Google Scholar] [CrossRef]
- Jiang, L.; Ban, X.; Wang, X.; Cai, X. Assessment of Hydrologic Alterations Caused by the Three Gorges Dam in the Middle and Lower Reaches of Yangtze River, China. Water 2014, 6, 1419–1434. [Google Scholar] [CrossRef] [Green Version]
- Chien, N.; Zhang, R.; Zhou, Z.D. Fluvial Processes; Science Press: Beijing, China, 1987. (In Chinese) [Google Scholar]
- Tang, L.; Zhang, W.; Wu, F.L. Study on sediment movement forms and mechanism causing mild slope on nearshore muddy coast. J. Sediment Res. 2016, 6, 66–73. (In Chinese) [Google Scholar]
- Imran, J.; Parker, G.; Locat, J.; Lee, H. 1D numerical model of muddy subaqueous and subaerial debris flows. J. Hydraul. Eng. 2001, 127, 959–968. [Google Scholar] [CrossRef]
- Laigle, D.; Coussot, P. Numerical modeling of mud flows. J. Hydraul. Eng. 1997, 123, 617–623. [Google Scholar] [CrossRef]
Figure 2.
Sketch of the dam area in the TGR.

Figure 3.
Observed sedimentation pattern on a typical cross-section (Section S34#) near the TGD.

Figure 4.
Schematic processes of fine-grained particle sedimentation in the dam area [20].
Figure 4.
Schematic processes of fine-grained particle sedimentation in the dam area [20].

Figure 5.
Numerical simulation procedure.

Figure 6.
Observed bed elevation near the Three Gorges Dam (June 2003).

Figure 7.
Calculated velocity fields near the bottom and the water surface (the blue lines are the velocity vectors close to the water surface, and the black lines are the vectors close to the bottom).
Figure 7.
Calculated velocity fields near the bottom and the water surface (the blue lines are the velocity vectors close to the water surface, and the black lines are the vectors close to the bottom).

Figure 8.
Simulated suspended load concentrations on typical cross-sections. (a) the discharge is 6300 m3/s and water level is 139 m; (b) the discharge is 32,100 m3/s and water level is 135 m.
Figure 8.
Simulated suspended load concentrations on typical cross-sections. (a) the discharge is 6300 m3/s and water level is 139 m; (b) the discharge is 32,100 m3/s and water level is 135 m.

Figure 9.
Verification of the velocity and sediment concentration distributions on typical cross-sections. (a) on section S30+1; (b) on section S34.
Figure 9.
Verification of the velocity and sediment concentration distributions on typical cross-sections. (a) on section S30+1; (b) on section S34.

Figure 10.
Computed sediment distribution using the traditional method.

Figure 11.
Computed sediment distribution considering gravity-driven processes.

Figure 12.
Comparisons of the sediment distributions on a typical cross-section between the observations and simulated results. (a) on section S30+1; (b) on section S32; (c) on section S34; (d) on section S37.
Figure 12.
Comparisons of the sediment distributions on a typical cross-section between the observations and simulated results. (a) on section S30+1; (b) on section S32; (c) on section S34; (d) on section S37.


Figure 13.
Computed and observed elevations of the thalweg.

Figure 14.
Computed velocity distribution in front of the dam (the discharge is 35,600 m3/s and water level is 135.1 m).
Figure 14.
Computed velocity distribution in front of the dam (the discharge is 35,600 m3/s and water level is 135.1 m).

Publisher’s Note: MDPI stays neutral with regard to jurisdictional claims in published maps and institutional affiliations. |
© 2021 by the authors. Licensee MDPI, Basel, Switzerland. This article is an open access article distributed under the terms and conditions of the Creative Commons Attribution (CC BY) license (https://creativecommons.org/licenses/by/4.0/).
Share and Cite
MDPI and ACS Style
Jia, D.; Zhou, J.; Shao, X.; Zhang, X. 3D Numerical Simulation of Gravity-Driven Motion of Fine-Grained Sediment Deposits in Large Reservoirs. Water 2021, 13, 1868. https://doi.org/10.3390/w13131868
AMA Style
Jia D, Zhou J, Shao X, Zhang X. 3D Numerical Simulation of Gravity-Driven Motion of Fine-Grained Sediment Deposits in Large Reservoirs. Water. 2021; 13(13):1868. https://doi.org/10.3390/w13131868
Chicago/Turabian StyleJia, Dongdong, Jianyin Zhou, Xuejun Shao, and Xingnong Zhang. 2021. "3D Numerical Simulation of Gravity-Driven Motion of Fine-Grained Sediment Deposits in Large Reservoirs" Water 13, no. 13: 1868. https://doi.org/10.3390/w13131868
Note that from the first issue of 2016, this journal uses article numbers instead of page numbers. See further details here.