Article

Advances in Egyptian Mediterranean Coast Climate Change Monitoring

by
Matteo Gentilucci
1,*,
Abdelraouf A. Moustafa
2,
Fagr Kh. Abdel-Gawad
3,
Samira R. Mansour
2,
Maria Rosaria Coppola
4,
Lidia Caserta
4,
Sara Inglese
4,
Gilberto Pambianchi
1 and
Giulia Guerriero
4,5,*
1
Department of Earth Sciences, University of Camerino, Via Gentile III da Varano, 62032 Camerino, Italy
2
Botany Department, Faculty of Science, Suez Canal University, Ismailia 41522, Egypt
3
Centre of Research and Applied Studies on Climate Change and Sustainable Development, Water Research Department, Environmental Research Division, National Research Centre, Dokki, Giza 12622, Egypt
4
Comparative Endocrinology Laboratories (EClab), Department of Biology, University of Naples Federico II, Complesso Universitario di Monte S. Angelo, Via Cinthia 26, 80126 Naples, Italy
5
Interdepartmental Research Center for Environment (I.R.C.Env.), University of Naples Federico II, Via Mezzocannone 16, 80134 Naples, Italy
*
Authors to whom correspondence should be addressed.
Water 2021, 13(13), 1870; https://doi.org/10.3390/w13131870
Submission received: 9 May 2021 / Revised: 24 June 2021 / Accepted: 30 June 2021 / Published: 5 July 2021
(This article belongs to the Special Issue Climate Impact on Sustainability of Aquatic Organisms)

Abstract

:
This paper characterizes non-indigenous fish species (NIS) and analyses both atmospheric and sea surface temperatures for the Mediterranean coast of Egypt from 1991 to 2020, in relation to previous reports in the same areas. Taxonomical characterization depicts 47 NIS from the Suez Canal (Lessepsian/alien) and 5 from the Atlantic provenance. GenBank accession number of the NIS mitochondrial gene, cytochrome oxidase 1, reproductive and commercial biodata, and a schematic Inkscape drawing for the most harmful Lessepsian species were reported. For sea surface temperatures (SST), an increase of 1.2 °C to 1.6 °C was observed using GIS software. The lack of linear correlation between annual air temperature and annual SST at the same detection points (Pearson r) could suggest a difference in submarine currents, whereas the Pettitt homogeneity test highlights a temperature breakpoint in 2005–2006 that may have favoured the settlement of non-indigenous fauna in the coastal sites of Damiette, El Arish, El Hammam, Alexandria, El Alamain, and Mersa Matruh, while there seems to be a breakpoint present in 2001 for El Sallum. This assessment of climate trends is in good agreement with the previous sightings of non-native fish species. New insights into the assessment of Egyptian coastal climate change are discussed.

1. Introduction

As known, the average global temperature has increased by 0.74 °C in the last 100 years. A period of 100 years is significant and testifies to a rapidly warming Mediterranean basin. However, throughout its history, there is evidence of even higher temperature peaks from the analysis of oxygen isotopes, especially after the last glaciations [1]. Rainfall patterns have changed and the frequency of extreme events has increased. Climate change has not been uniform on either a spatial or temporal scale, nor in the range of change; therefore, it is possible to say that, in all areas of the planet, it has a different magnitude [2,3,4] linked to different atmospheric dynamics. Climate change affects the entire environment and has a major impact on both animal and plant species in particular, and many of those changes have been reported in the redistribution of species [5,6]. Biological systems are being affected by increasing temperatures, which introduce changes in biophysical conditions that influence their development and maintenance. Changes in water availability affect the flowering and survival of aquatic plant species, as well as the abundance of wildlife species, in affected areas. Shifting seasonal changes, which are already being recorded in most temperate regions, affect the timing of animal migrations and the flowering of plants [7], and thus destabilize the equilibrium of ecosystems that are geographically far apart. One large potential ecological impact of such changes is mistiming, where, for instance, migrating animals arrive at times when their necessary food plants or prey animals are not available [8]. According to Seppälä [9], the impact of average global temperature rise on habitats and species will depend on many factors, including local topography [10], changes in ocean currents, wind and rainfall patterns, and changing albedo. In addition to variations in the extent and rate of temperature increases at different latitudes [11], there may be changes in the length and severity of seasons, including decreases in temperature in some areas. Rainfall patterns may likewise be affected in terms of overall annual quantity, seasonal distribution of precipitation, and year-to-year regularity [12]. Extreme weather events, such as droughts and floods, are expected to occur more frequently. In particular, droughts are projected to become more frequent and intense in subtropical and southern temperate forests [13]; this will increase the prevalence of fire and predisposition to pests and pathogens [14,15,16] and acidification of water [17]. As far as biological aspects, there has been much proof of physiological change in antioxidants, as well as steroid receptor defenses, affecting biodiversity [18,19,20,21,22].
The marine ecosystem is affected by high temperatures and one of the most endangered habitats is the Mediterranean Sea, which is considered a “miniature ocean” [23] and a “biodiversity hotspot” [24,25,26]. The sea surface temperature (SST) is analyzed over the years to assess its fluctuations and possible consequences [27,28,29,30].
The temperature of the Mediterranean waters has increased by 0.041 ± 0.006 °C/year from 1982 to 2018 [31]. Studies on biodiversity in the Mediterranean highlight an increase in the number of non-indigenous species [32,33,34,35,36,37,38,39] and report on methods to accurately detect their presence [40,41]. Tropicalization and southernization phenomena are also evidenced by DNA barcoding analysis [40,41,42]. At present, many climate studies focus on forecasting models based on emission scenarios and on bioinvasions, and seek an answer to objective 13 of Agenda 2030 integrating diverse methodologies [43,44,45,46]. In Agenda 2030, there is a clear indication about the necessity to improve human, technical, and institutional capacities and infrastructure, and particularly in developing climate and water-related services. At objective 13, there is an alert on climate change and the importance of monitoring adaptations and understanding how these adaptations affect biodiversity [47]. Monitoring of biological events related to climate change have given rise to an assessment of measures that may be taken towards enhancement of species adaptations and sustainability. Changes in biodiversity and the biological community due to climate change are not all negative and may sometimes be beneficial, with certain species either flourishing or successfully adjusting [48,49,50]. The majority of these observed changes are modest because of the relatively limited change in atmosphere that has occurred so far. Nonetheless, future anticipated changes in atmosphere are much larger, and thus the IPCC AR5 proposes that the 10% of species surveyed so far will be at an undeniably higher danger of extinction for each 1 °C rise in worldwide mean temperature. These large anticipated changes are within the scope of future scenarios for evaluation of the effect of such temperature changes (normally <5 °C worldwide temperature rise) [4]. Modeling studies predict biodiversity species distributions over both horizontal and vertical dimensions, but such an approach requires high-quality local information on both thermal conditions and species occurrences across the depth gradient. These data are apparently not currently available for the Mediterranean Sea. Furthermore, climate change monitoring by Mediterranean countries has been reported extensively in the literature, but our bioinformatic search has not revealed any studies on the Egyptian coast that correlate data on water temperature from the other Mediterranean areas with the effects of climate change on fish bioinvasion. This article reviews the Egyptian Mediterranean coast literature on biological pollution from 1991 to 2020. Moreover, fish species are characterized and tools are proposed to enable discrimination of harmful species in order to help identify local priorities and opportunities related to the phenomenon of climate change in the Egyptian Mediterranean coast and to the sustainability of autochthonous aquatic organisms. In addition, an ex novo assessment of aerial and sea surface harbour temperatures is provided.

2. Materials and Methods

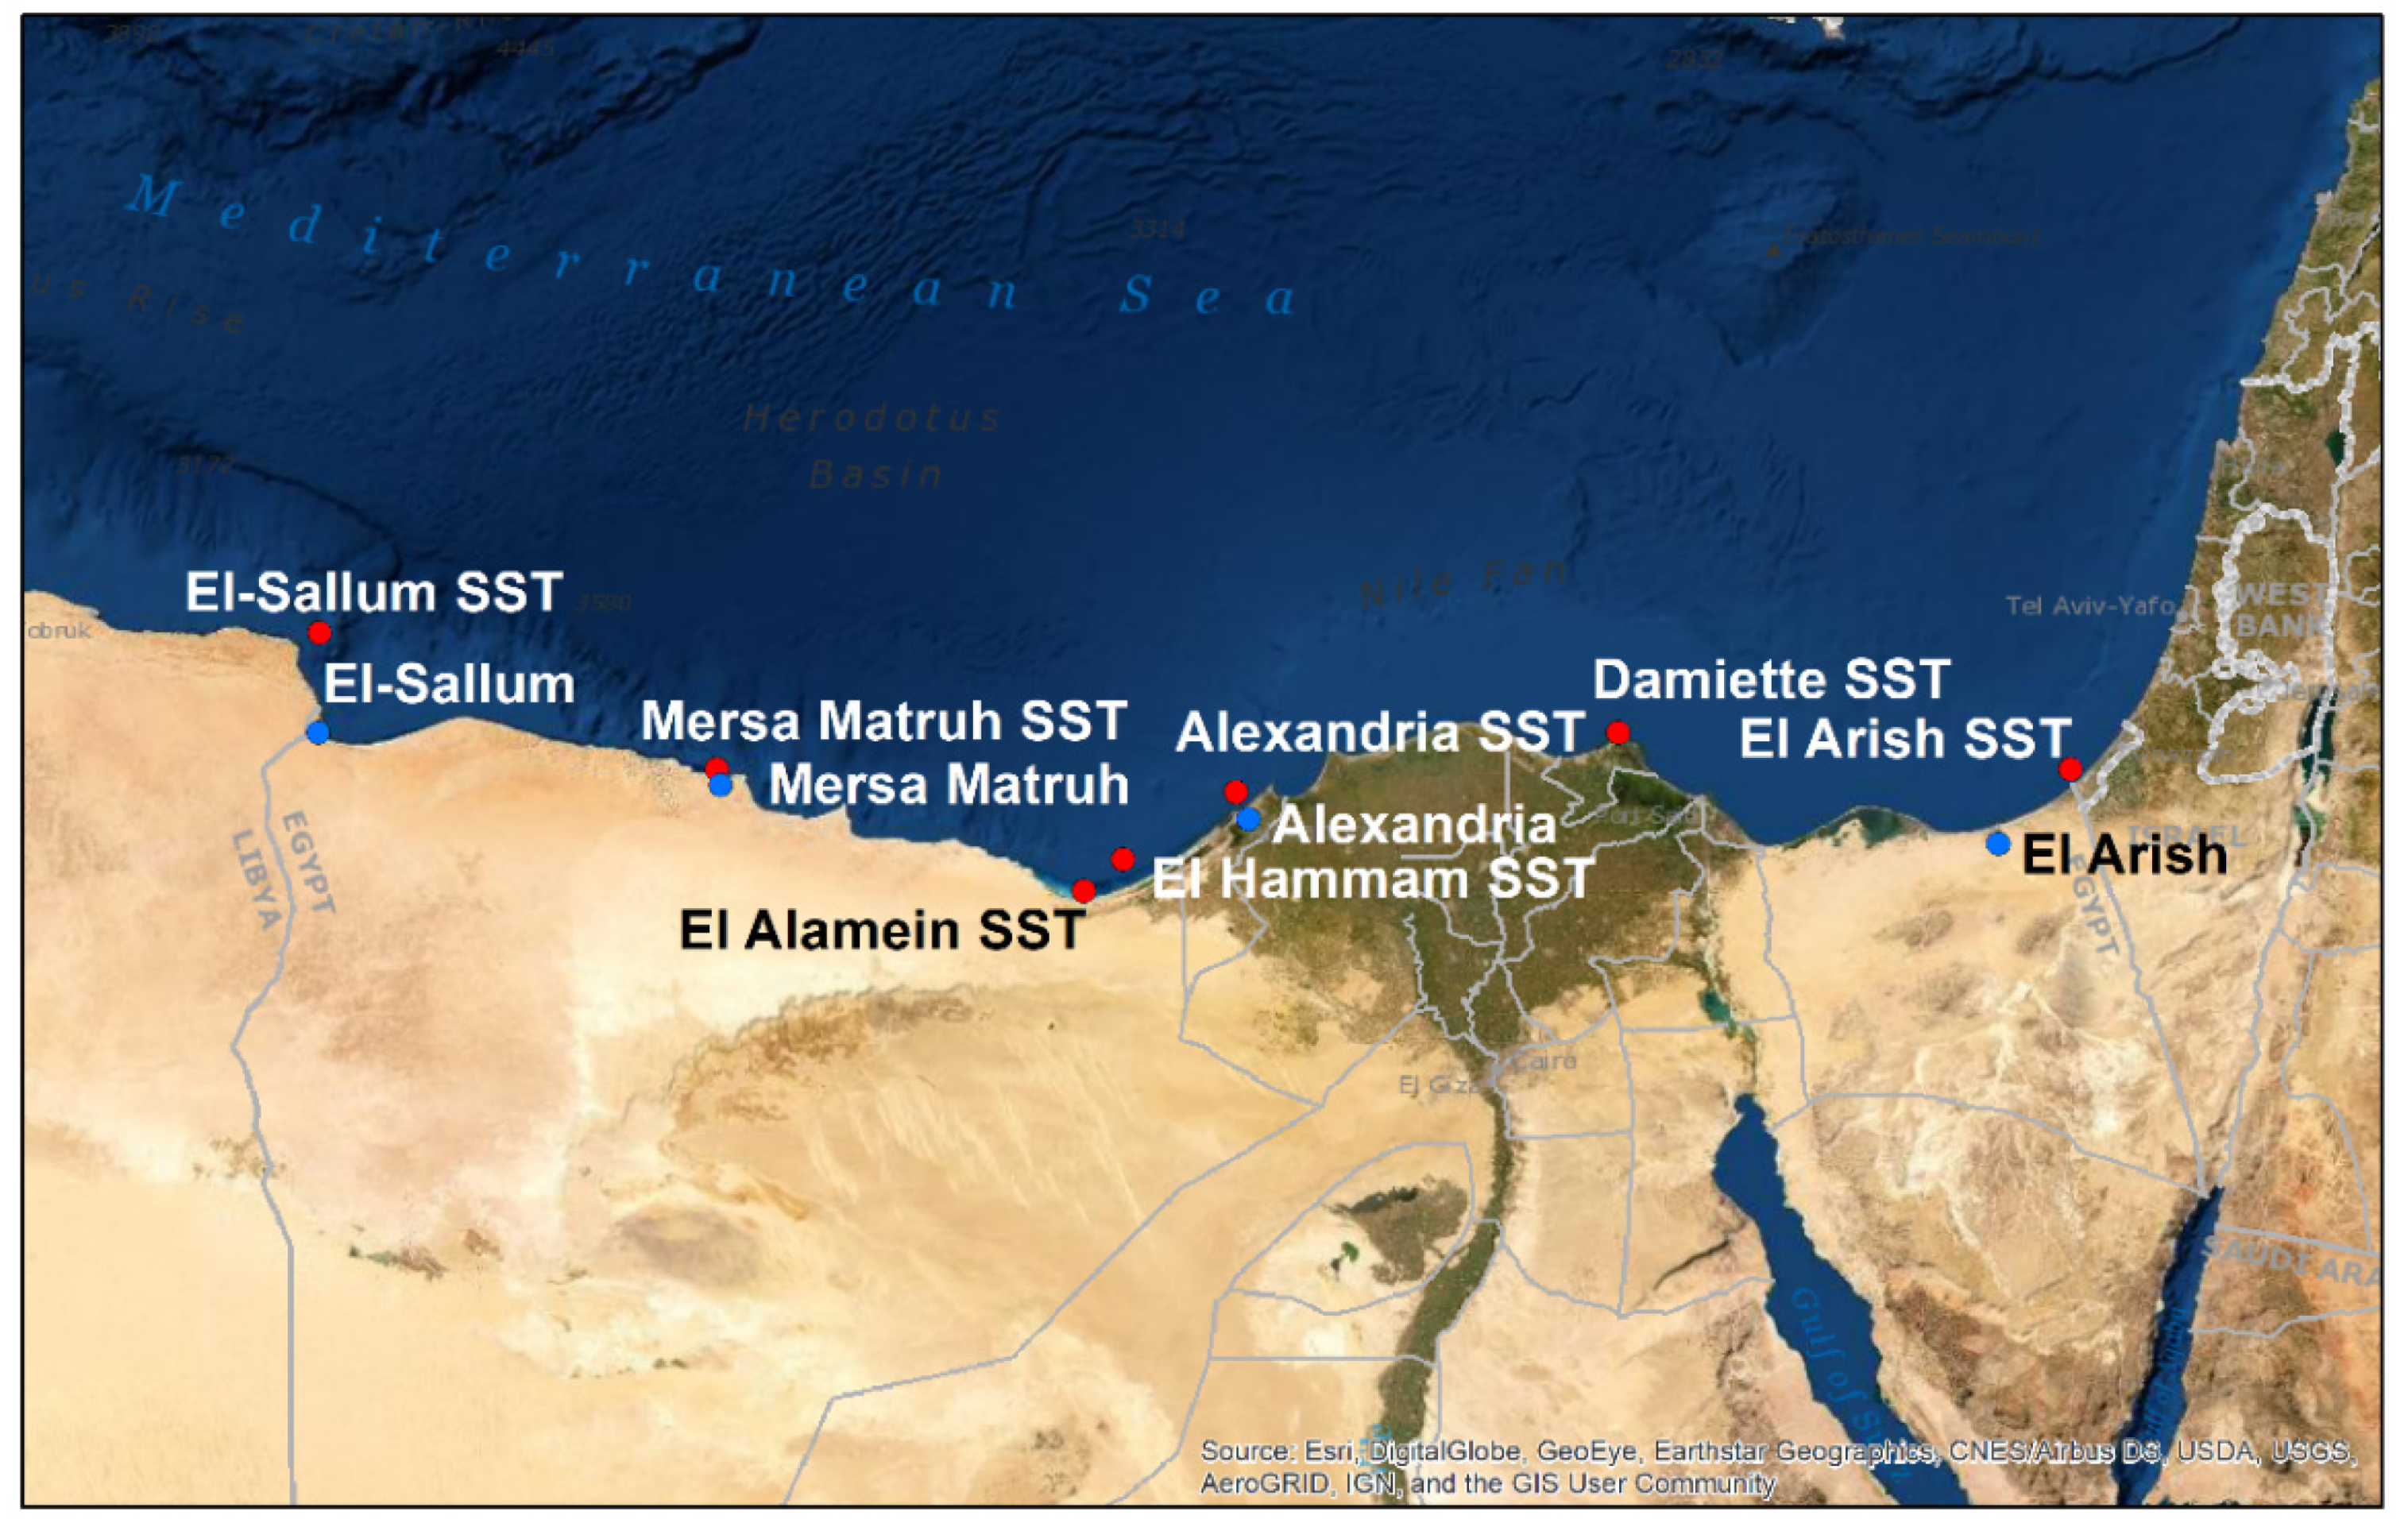
2.1. Egyptian Mediterranean Sites of Study

Examination sites were selected by a strategic bioinformatics study examining data provided in previous reports from 1991 to 2020 by the National Center for Biotechnology Information (NCBI), SciFinder and Fishbase, wherein specific keywords such as the following were searched: climate change effects, Lessepsian fish and Egypt (selecting each harbour), Egyptian Mediterranean biological pollution, alien, and Mediterranean sea. See Figure 1.

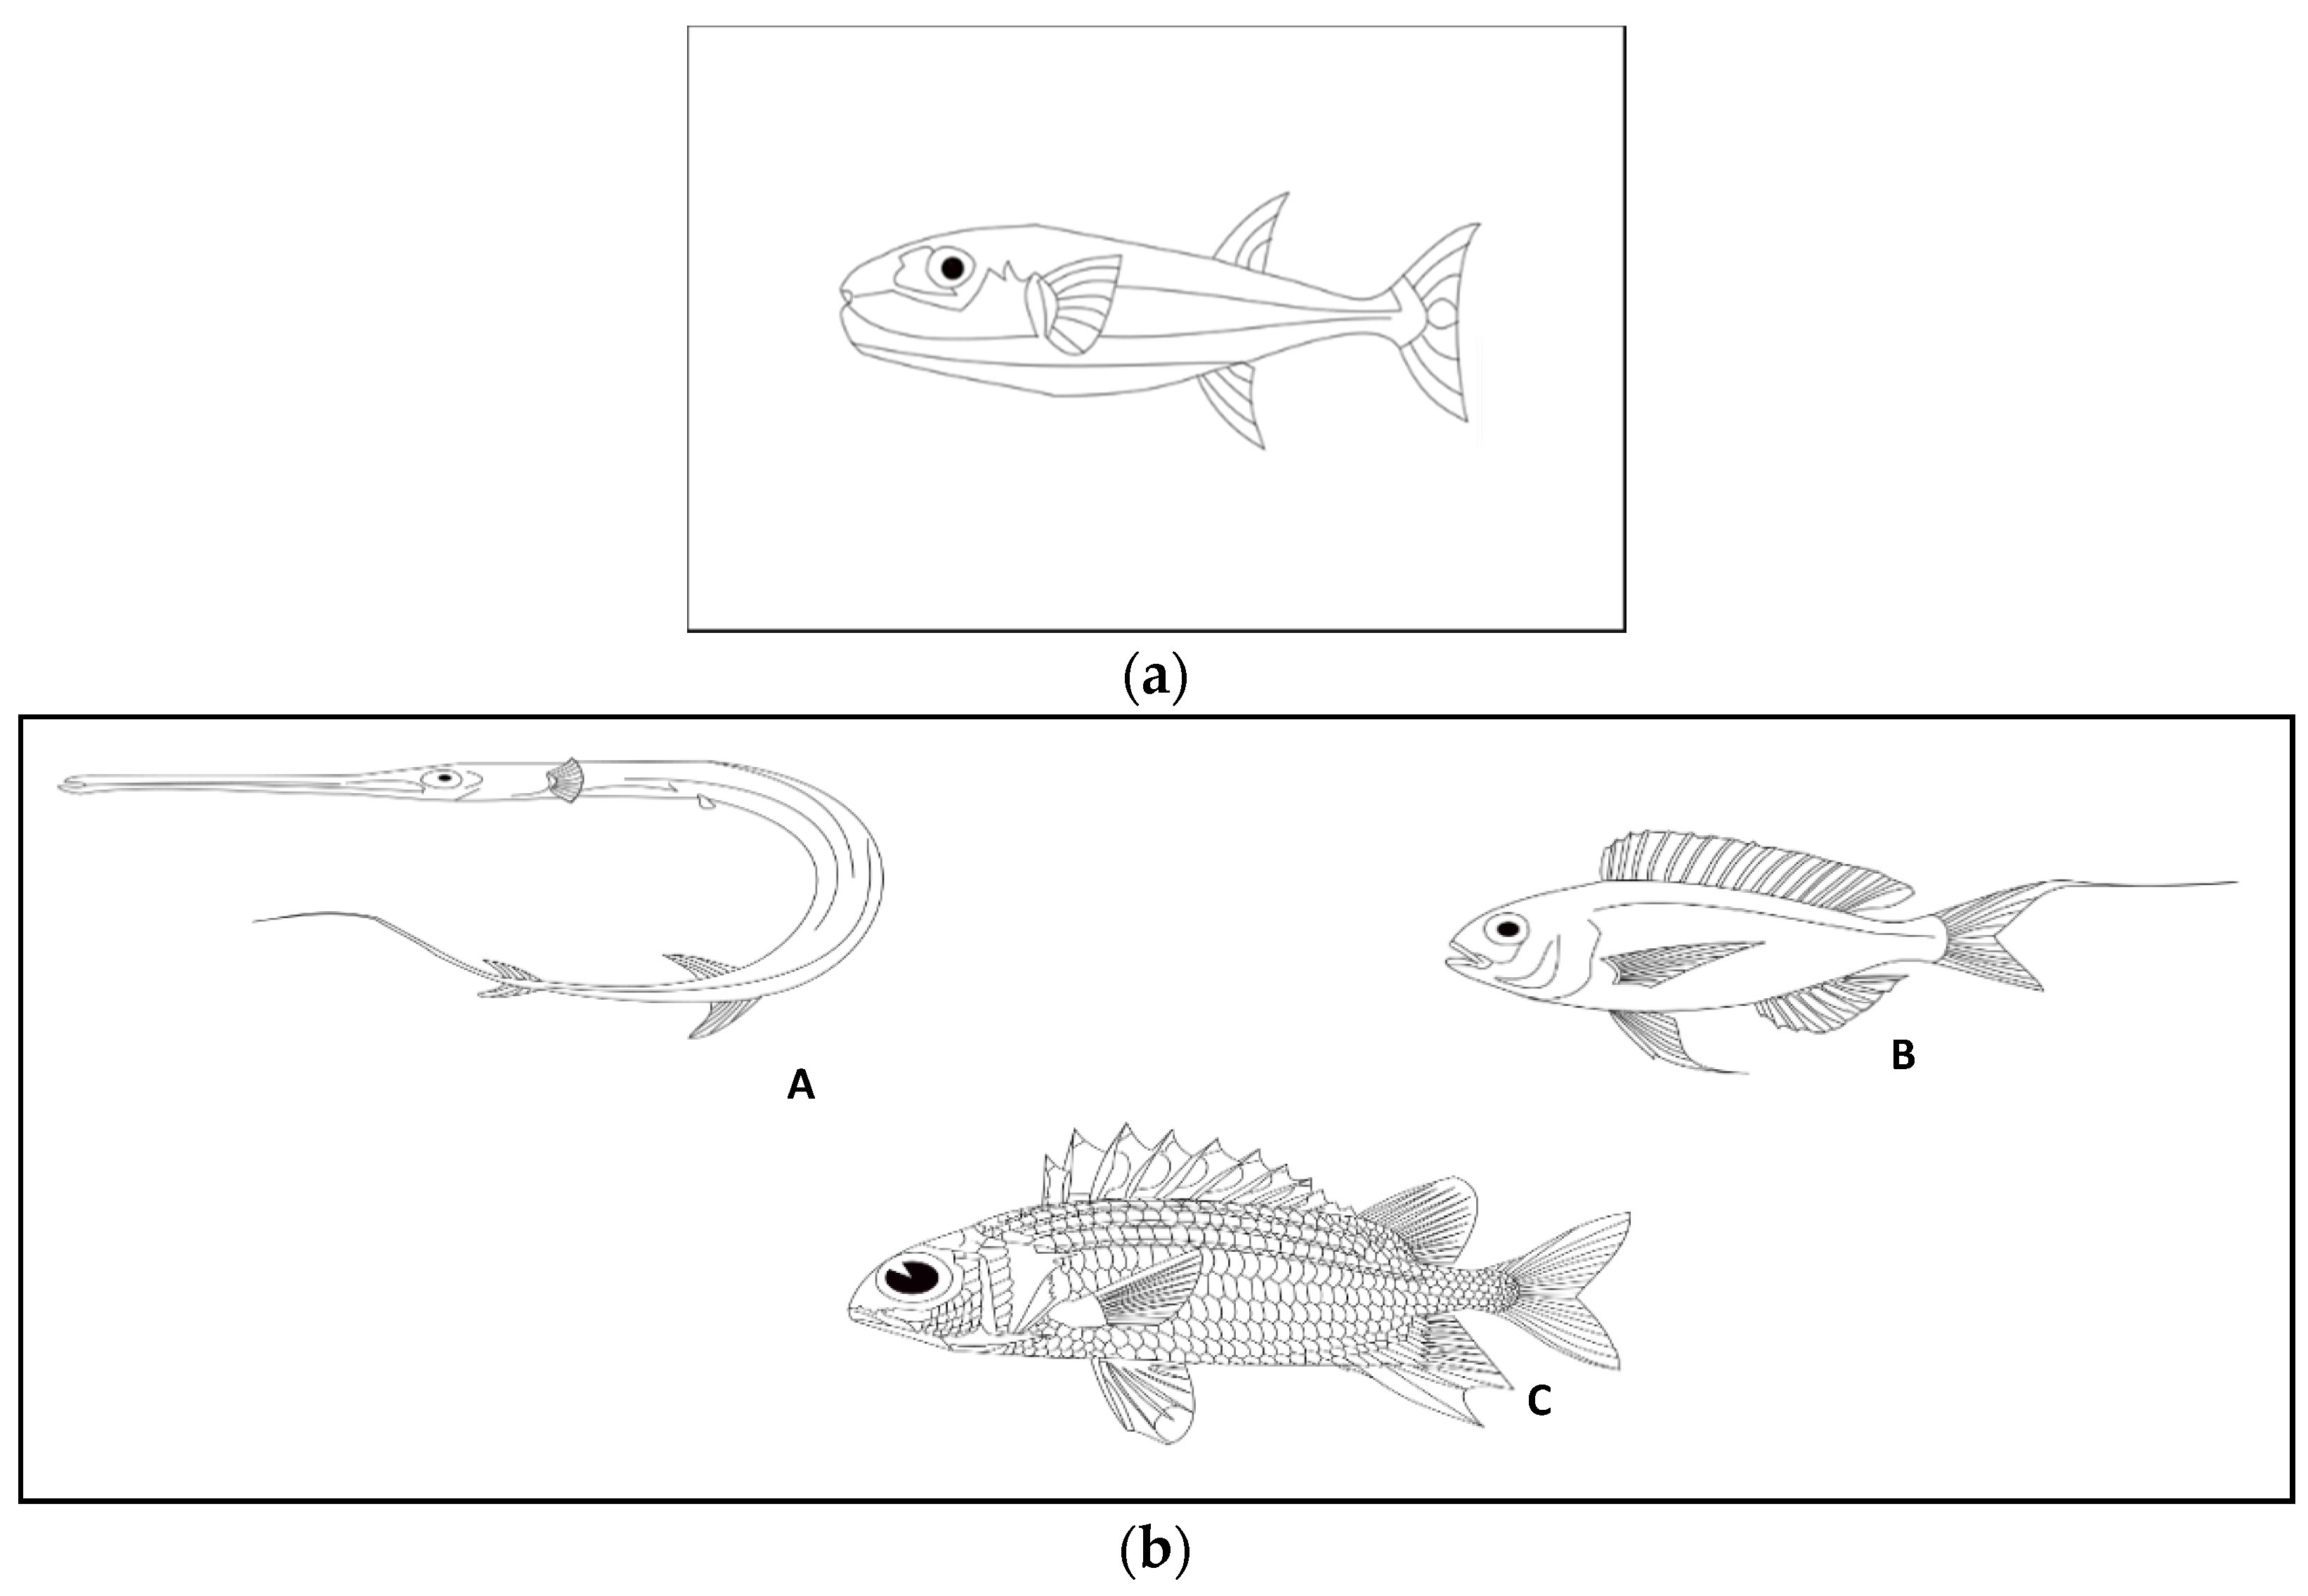
2.2. Biological Characterization of Invading Species in the Egyptian Mediterranean Coast (1999–2020)

To obtain information about non-native species sighted in the literature from 1991 to 2020 [39,51,52,53,54,55,56,57,58,59,60,61], especially those Lessepsian species coming from the Canals of the Suez, bioinformatics techniques were used. For each Lessepsian species, Fishbase (http://www.fishbase.org/home.htm, accessed on 2 March 2021) and the NCBI (https://www.ncbi.nlm.nih.gov/, accessed on 15 March 2021) data sources were used. Fishbase provided listing of information regarding taxonomy, reproductive biology, and ecology and the NCBI gave molecular fish sequences access (COI GenBank ID), which is useful for identifying species. For each species, the following data have been reported: their natural habitat, which can be either benthic, pelagic, epipelagic, or demersal; the type of eggs (benthic or pelagic); and their native depths. In addition, their native temperatures have been reported by classifying them into two ranges: tropical, greater than 20 °C, and subtropical, between 10 °C and 20 °C. Access numbers of cytocrome oxidase I (COI) found in the GenBank (https://www.ncbi.nlm.nih.gov/genbank/, accessed on 2 March 2021) database and potential harmful species and their commercial value found in Fishbase are reported. To help in the identification of harmful Lessepsian species, drawings have been created for morphological identification and monitoring. The Lessepsian fish images were created using the Inkscape program (https://inkscape.org/it/, accessed on 3 March 2021).

2.3. Temperature Trends along the Egyptian Mediterranean Coast

Our climatic monitoring studies were done along the Mediterranean coast of Egypt, and assessed on the basis of eight stations (red and blue dots in Figure 1) at coordinates associated (Table 1) with sightings of previous non-indigenous fish species (NIS) [39,51,52,53,54,55,56,57,58,59,60,61]. For all studied sites, mean, minimum, and maximum air and sea surface temperatures were assessed over an interval of approximately 30 years. This was done in order to follow the World Meteorological Organization (WMO) guidelines and necessary for the accuracy of the climate survey. The data from these weather stations were validated and homogenized in order to make them reliable, based on the prescriptions of the WMO, following the procedure reported in Gentilucci et al. [62]. Average, minimum, and maximum air temperature data were collected from the NOAA (National Oceanic and Atmospheric Administration) database, while the calibrated maps derived from the AVHRR (until 2005) and AQUA/MODIS (until 2020) satellite maps were downloaded from the NASA website for the sea surface temperatures, and the temperatures were measured at the points indicated on the map, usually in the harbour area. Sea surface temperature determination is based on MODIS-calibrated mid- and far-infrared (IR) radiances, using an algorithm to estimate temperature differences. For this dataset, only the observations without clouds were considered, through a system of spatio-temporal homogenization. SST data are all validated and have very small errors, never exceeding ±0.3–0.4 °C [63].
Among the available methods, the Mann–Kendall test was chosen to assess the presence of a trend because it does not require the data to be normally distributed. In fact, the data were found to be at least seasonally non-Gaussian distributed after verification by the Kolmogorov–Smirnov test. In addition to the Mann–Kendall test to assess the presence of trends, the Sen slope estimator was used to assess trend intensity. The Mann–Kendall test can give rise to two results; if the null hypothesis (H0) is verified, then there is no trend in the data set, whereas if, on the other hand, the alternative hypothesis (H1) is verified, there is a trend.
The Mann–Kendall test results were calculated for both atmospheric and sea surface temperatures as follows.
s i g n ( T i T j ) = {       1     i f   T i T j > 0       0     i f   T i T j = 0 1   i f   T i T j < 0 }
S = k = 1 n 1 j = k + 1 n s i g n ( T i T j )
The sum of these results determines the S value and this value can be entered into the Z test.
Z = S 1 V A R ( S )   i f   S > 0 0                                 i f   S = 0 S 1 V A R ( S )   i f   S < 0
The variance of S is calculated using the following equation:
V A R ( S ) = 1 18 [ n ( n 1 ) ( 2 n + 5 ) i = 1 g t p ( t p 1 ) ( 2 t p + 5 ) ]
  • g = n u m b e r   o f   t i d e s   g r o u p s
  • t p = n u m b e r   o f   o b s e r v a t i o n s   i n   t h e   p t h   g r o u p
Sen’s test assesses the true slope of a trend line only if the trend can be assumed to be linear of the following form:
f ( t ) = Q t + B
  • Q = s l o p e   o f   t h e   l i n e
  • B = c o n s t a n t
Q i = x j x k j k
The median of the N pairs of Qi values (slope of the line), which are obtained from the differences between the previous and the next values (xjxk), is necessary for the estimation of the angular coefficient according to the method of the Theil Sen estimator. Then, from the obtained values, after being arranged in increasing order, the angular coefficient was calculated as follows:
Q = Q [ ( N + 1 ) 2 ]   i f   N   i s   o d
Q = 1 2 ( Q ( N / 2 ) + Q [ ( N + 2 ) / 2 ] )   i f   N   i s   e v e n
The confidence interval is calculated from the following formula:
C α = Z 1 α / 2 V A R ( S )
Thus, the upper threshold is identified as follows:
M 1 = ( N C α ) / 2
with Qmin represented by the (M1)th largest in the N estimates of ordered slope Qi.
While the lower threshold is calculated as follows:
M 2 = ( N + C α ) / 2
with Qmax represented by the (M2+1)th largest in the N estimates of the ordered slope Qi.
In order to obtain the value of the constant B, the n values of the differences xi − Qti were subtracted by calculating the confidence intervals with a similar procedure as described above. In addition to the classical Mann–Kendall test, the seasonal Mann–Kendall was calculated. It takes into account the seasonality of the series, in this case, 12 months, not in order to find if there is a trend in the overall series, whether there is a trend between January of different years and between February of different years, and so on. The Mann–Kendall statistic for the gth season is calculated as follows:
S = i = 1 n 1 j = i + 1 n s i g n ( X j g X i g ) ,       g = 1 , 2 , ,   m
According to Hirsch et al. [63], the seasonal Mann–Kendall statistic, Ŝ, for the entire series is calculated according to the following:
S ^ = g = 1 m S g
All these procedures were performed using Microsoft Excel software, through XLSTAT, which is a complete statistical add-in for Microsoft Excel. In addition, in order to identify the year in which the trend showed a clear increase marking a difference between previous and following years, in-depth analyses were carried out. This type of analysis, aimed at identifying the breakpoint in the time series, was carried out by means of the Pettitt test, again using the XLSTAT software. The Pettitt’s test was chosen after calculating homogeneity through the SNHT test [64] and the Buishand range test [65], although they were in considerable agreement and all showed this inhomogeneity in the same years although in different months for all weather stations. The choice fell on the Pettitt test because it gave intermediate mean values between the SNHT test and the Buishand range test. The Pettitt’s test is a nonparametric test that requires no assumption about the distribution of data, so it is a very versatile test. The test explores two hypotheses: H0 signifying there is no point change in the time series and H1 signifying there is change point in the time series, as follows:
K t = max | U t , T |
where
U t , T = i = 1 t j = t + 1 T s i g n ( X i X j ) .  
The change-point of the series is located at KT, provided that the statistic is significant. The significance probability of KT is approximated for p ≤ 0.05 as follows:
p 2 exp ( 6 K T 2 T 3 T 2 )

3. Results

3.1. Analysis of the Biological Invasions along the Egyptian Mediterranean Coast (1999–2020)

3.1.1. Update on Non-Indigenous Species (NIS)

Through the papers consulted from 1991 to 2020, we can report the presence of 52 NIS species, of which 47 are Lessepsian species and 5 species are of Atlantic origin. In Port Said, there has been sighted only 1 NIS species that is Lessepsian: Siganus rivulatus; in Damiette, only 1 NIS species of Atlantic origin: Anthias anthias; in Alexandria, 31 NIS species of which 27 are Lessepsian and 4 are of Atlantic origin; in El-Hamam, 1 species that is Lessepsian, the Etrumeus teres; in El-Alamain, 5 species, all Lessepsian, including Herklotsichths punctatus, Pteragogus pelycus, Sargocentron rubrum, Siganus luridus, and Siganus rivulatus; and in Mersa Matruh, 6 species, all Lessepsian, including Nemipterus randalli, Pterois miles, Sargocentron rubrum, Scaurus ghobban, Siganus rivulatus, and Upeneus moluccensis. In the manuscripts examined, where no clear indication of coordinates was reported, the whole Egyptian Mediterranean coast was reported from El-Arish to El-Sallum. This extended area includes many harbours where 42 NIS species, all Lessepsian, were sighted. The complete list of NIS fish is reported in Supplementary Table S1.

3.1.2. Biodata on Lessepsian Species

Additional research has shown that the 47 Lessepsian fish species belong to 17 orders: Perciformes (Table 2a); Beloniformes, Clupeiformes, Scorpaeniformes, Tetraodontiformes, and Kurtiformes (Table 2b); Aulopiformes, Atheriniformes, Beryciformes, Callionymiformes, Carangiformes, Gobiiformes, Mugiliformes, Myliobatiformes, Pleuronectiformes, Scombriformes, and Syngnathiformes (Table 2c), and 33 families. In particular, between Lessepsian fish species, 3 species were identified in the Mullidae and Tetraodontidae family; 2 in the Apogonidae, Dussumieriidae, Gobiidae, Nemipteridae, Pempheridae, Scombridae, Scorpaenidae, Siganidae, Sphyraenidae, and Terapontidae family; and 1 species in the Atherinidae, Belonidae, Callionymidae, Carangidae, Clupeidae, Cynoglossidae, Dasyatidae, Exocoetidae, Fistularidae, Leiognathidae, Hemiramphidae, Holocentridae, Labridae, Monacanthidae, Mugilidae, Oxudercidae, Scaridae, Sparidae, Serranidae, Sillaginidae, and Synodontidae family. As reported in Fishbase, most of the species (n = 28) have pelagic eggs (p), 12 species have benthic eggs (b), 1 species has both pelagic and benthic (p-b), 2 species have an egg type that is stored in the mouth (mb), and 4 species have unidentified egg types. These species are found at depths from zero to two hundred and fifty meters and most are native to tropical temperature environments, as found in Fishbase research reports (Table 2a–c). Further, there are 25 Lessepsian fish species included that have commercial interest. In Table 2a–c, those species with commercial interest may have their molecular identification and barcoding confirmed through alignment of their nucleotidic sequences with the sequences provided by the GenBank accession number for Cytochrome oxidase 1 (COI). The sequences for Lessepsian fish species: Sebastapistes nuchalis, Oxyurichtys petersi, Coryogalops ochetica, Callionymus filamentosus, and Aulopareia unicolor are not yet included in GenBank.
Eighteen of the Lessepsian species are dangerous to humans directly or because they supplant herbivorous or carnivorous species. They are the following: the shrimp scad Alepes djedaba, the wide-banded hardyhead silverside Atherinomorus lacunosus, the blotchfin dragonet Callionymus filamentosus, the karanteen seabream Crenidens crenidens, the malabar grouper Epinephelus malabaricus, the bluespotted cornetfish Fistularia commersonii, the black-barred halfbeak Hemiramphus far, the honeycomb stingray Himantura uarnak, the silver-cheeked toadfish Lagocephalus sceleratus, the japanese threadfin bream Nemipterus japonicus, the randall’s threadfin bream Nemipterus randalli, the indian mackerel Rastrelliger kanagurta, the redcoat Sargocentron rubrum, the brushtooth lizardfish Saurida undosquamis, the narrow-barred Spanish mackerel Scomberomorus commerson, the dusky spinefoot Siganus luridus, the marbled spinefoot Siganus rivulatus, and the silver sillago Sillago sihama.
To help in their identification, we have provided, in Figure 2a–d, drawings of those Lessepsian species that are reported the most. The images were created using the Inkscape program. In Figure 2a, we report the species Lagocephalus sceleratus, which is the species that, in the manuscripts examined, was found only in Alexandria; however, it was very recurrent in the various articles as it creates economic/ecosystem damage due to its toxins. This species is a member of the Tetraodontidae family, a small to moderate-sized fish (up to 75 cm in length) with a heavy, blunt body capable of rapid inflation by intake of water (or air); pelvic fins absent; dorsal and anal fins located far posteriorly; containing no spines, but 7 to 15 soft rays; caudal fin truncate, rounded, or emarginate to somewhat lunate.
As in all members of this genus, they have a caudal fin lunate to emarginate, as can be recognized in sceleratus having a dorsal fin with 10–12 rays; anal fin with 8–11 rays; pectoral fin with 15–18 rays; body almost square in cross-section; body and caudal peduncle elongate, depressed; backward extended spinules; caudal fin moderately lunate.
In Figure 2b, we report the most omnivorous invasive species: Fistularia commersonii, Nemipterus randalli, and Sargocentron rubrum.
Fistularia commersonii has an elongated and depressed body. Small mouth, at end of a long tubular snout hexagonal in cross section; small teeth in jaws. Dorsal and anal fins short-based and opposite, with 14 to 17 segmented soft rays; elongate filament produced by the middle 2 caudal fin rays, as characteristic in the Fistulariidae family. It shows no elongate bony plates along midline of back; posterior lateral-line ossifications without a spine; rows of blue spots on back, sides, and snout as characteristic in its genus (Fistularia); and ridges on snout with antrorse serrations, with the upper ridges diverging anteriorly, as characteristic of the species commersonii.
Nemipterus randalli displays an elongation to moderately deep, compressed, small to medium-sized (to about 35 cm) body, as in Sparidae fishes. Mouth terminal, small to moderate; premaxillaries moderately protrusible; conical teeth in jaws; enlarged canines present anteriorly in Nemipterus and Pentapodus; vomer and palatine without teeth. A single continuous dorsal fin, with X spines and 9 soft rays; anal fin with III spines and 7 (except Nemipterus virgatus, with 8) soft rays. First and second infraorbitals deep; the third infraorbital never deep, and the second infraorbital typically projecting backward below it (this posterior projection developed as an externally visible spine in Scolopsis), as in members of Nemipteridae family. It shows suborbital spine absent; 3 transverse scale rows on preopercle as characteristic of the genus Nemipterus and pectoral fins very long, reaching to or beyond level of origin of anal fin; caudal filament long N. randalli.
Sargocentron rubrum shows an anal fin with IV spines, the third stoutest and often longest, and 7 to 16 soft rays; pelvic fins with I spine and 7 soft rays; caudal fin forked with 17 branched rays. Lateral-line complete, the pored scales 25 to 56; strongly ctenoid body scales, as all members of Holocentridae family. It has the shortest last dorsal-fin spine, equidistant between penultimate spine and first soft ray; lower jaw not projecting (except in S. spiniferum); colour red as Sargocentron genus. Further, we can see oblique rows of scales on cheek; lateral-line scales modally; least interorbital width 4.5 to 5.2 times in head length; upper-jaw length 2.5 to 2.75 times in head length; dark pigment on pelvic fins confined to distal part of second to sixth (or fewer) membranes as characteristic of the species S. rubrum.
The species Siganus luridus, Siganus rivulatus, and Hemiramphus far, which are herbivorous, are dangerous because they can disrupt the equilibrium between the local species and their green feeding material, as reported in Figure 2c.
Siganus luridus has body laterally compressed, oval, deep or slender, covered with small scales, mouth small with a single row of fine, close-set teeth in each jaw; dorsal fin with 13 stiff spines and 10 soft rays, preceded by a forward projecting spine, embedded to varying degrees in the nape; pelvic fins with 2 stiff spines separated by 3 soft rays, a characteristic unique to the family; anal fin with 7 stiff spines and 9 soft rays (variations in the number of dorsal and anal spines and rays are extremely rare); the spines are venomous as in all members of Siganidae family. This family has only one genus, Siganus. It shows a truncated caudal fin for the species S. luridus.
The fish Siganus rivulatus shows similar body characteristics reported in all members of the Siganidae family. This family has only one genus, Siganus. It has characteristic yellow and blue wavy lines on head in combination with the brown ground colour and the great body for the species Siganus rivulatus.
Hemiramphus far has an elongated body with a prolonged lower jaw (except in Oxyporhamphus, Arrhamphus, and Melapedalion) and short triangular upper jaw (except in Oxyporhamphus) as all members of Hemiramphidae family and scales absent on upper jaw; and preorbital ridge absent, as characteristic of its genus Hemiramphus in adults, it usually shows with 3 to 9 (usually 4 to 6) short dark vertical bars on sides of body; anal-fin rays 9 to 12, usually 11 as in H. far.

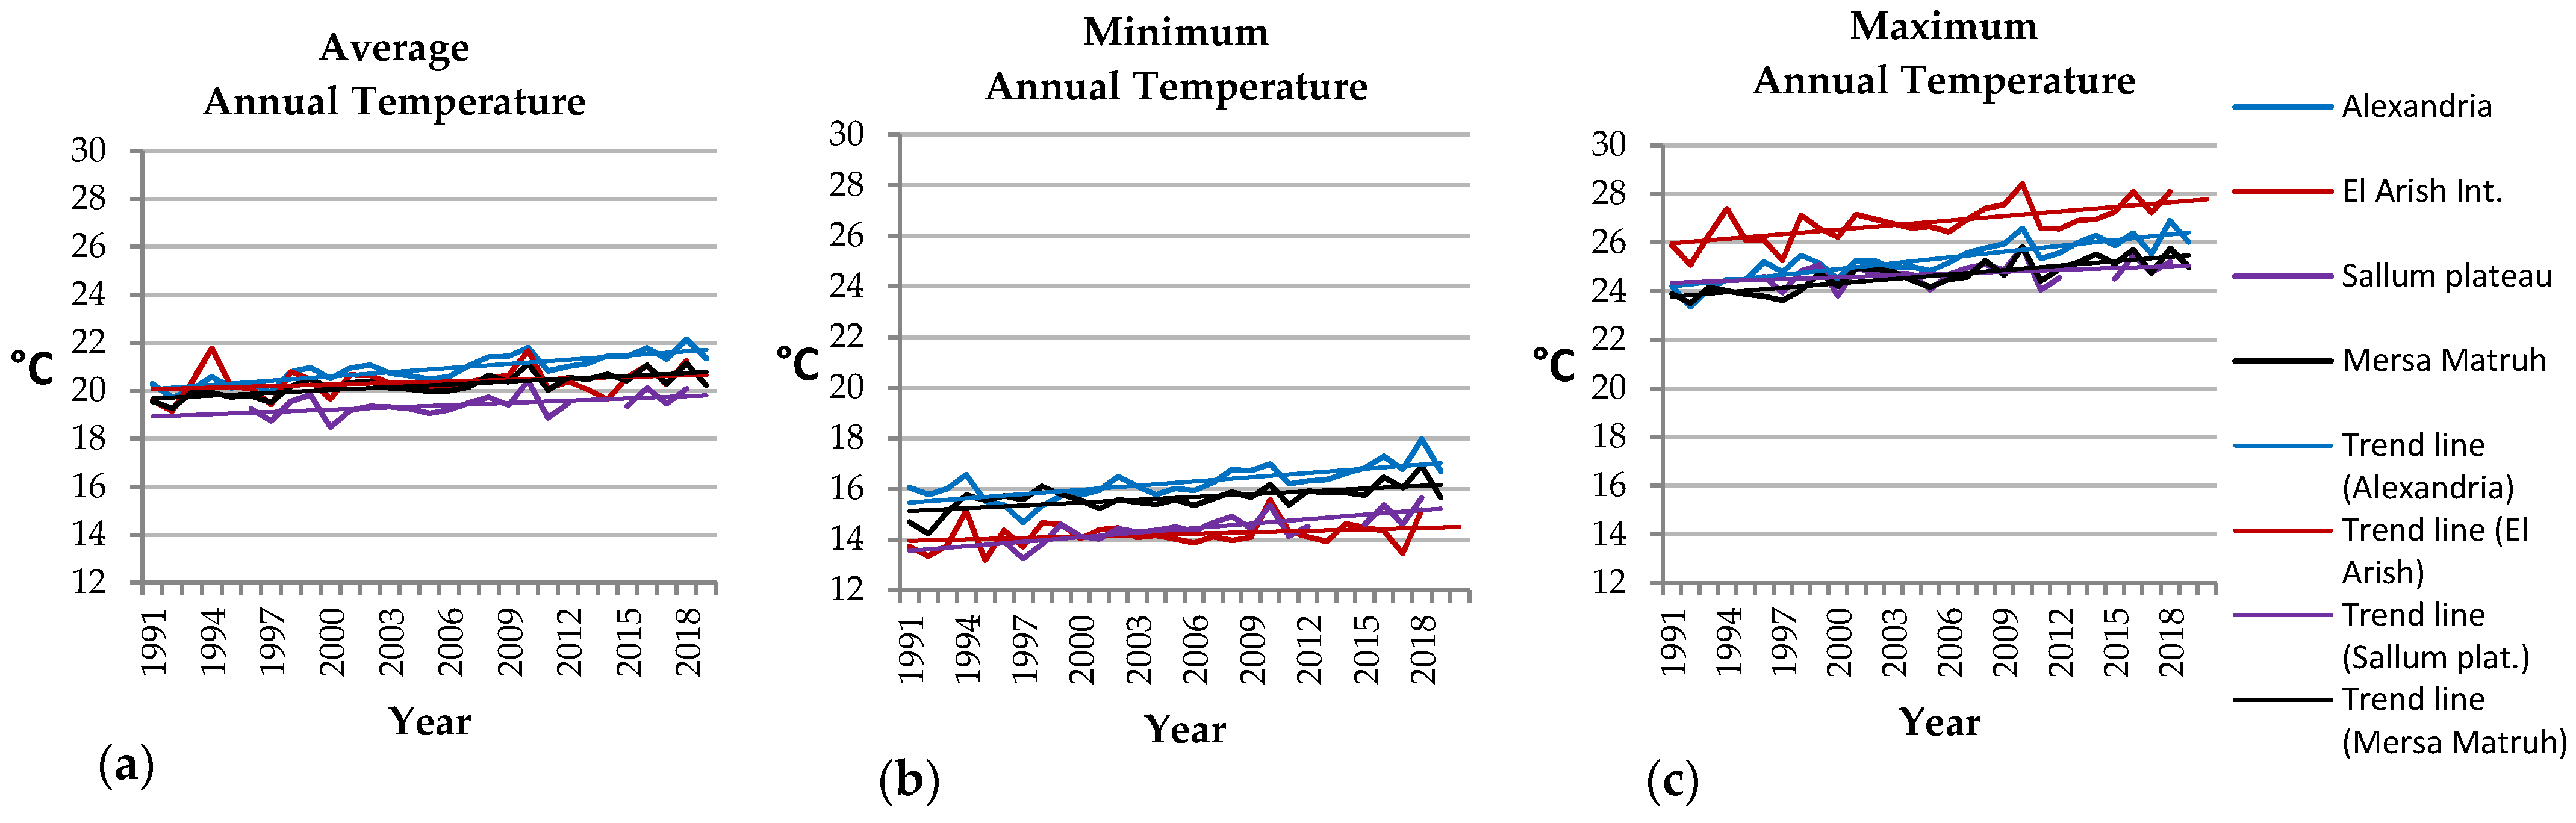
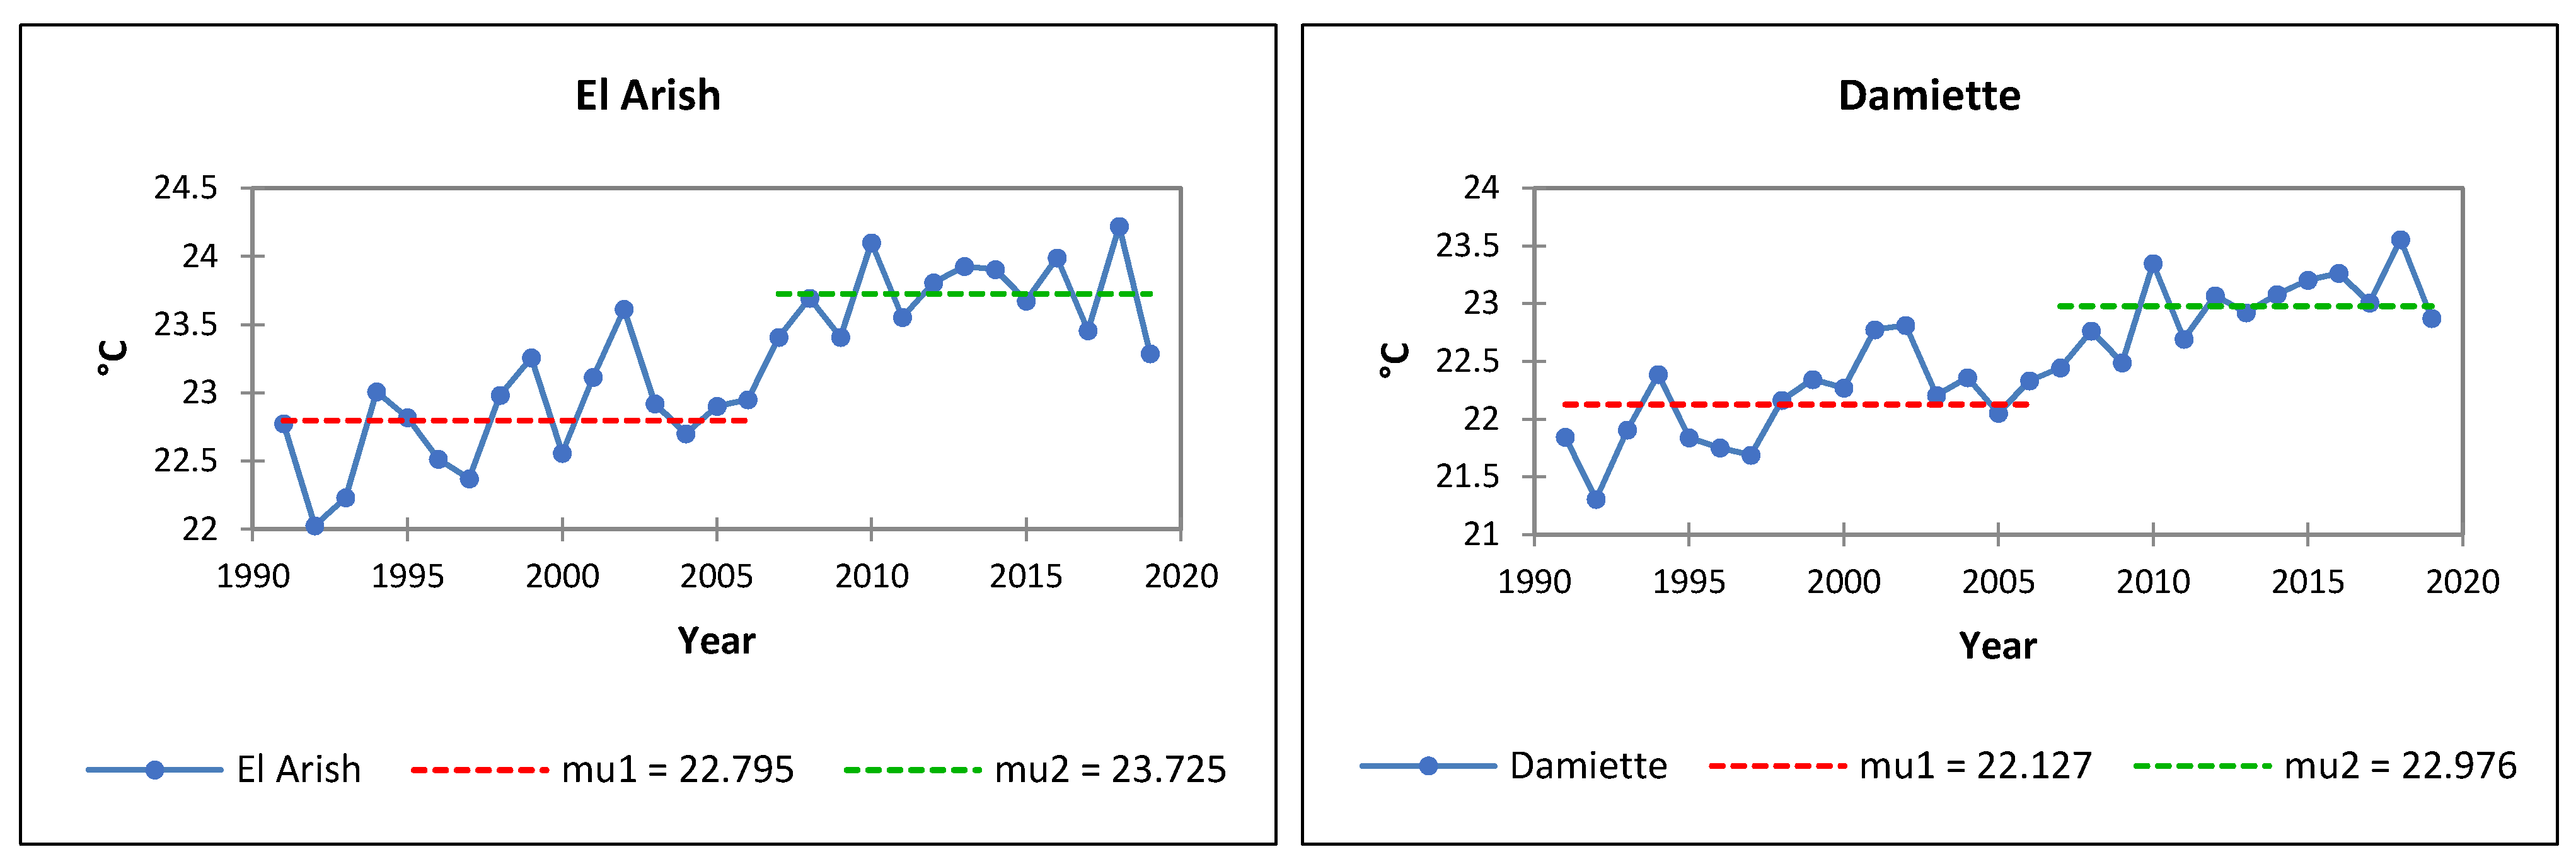
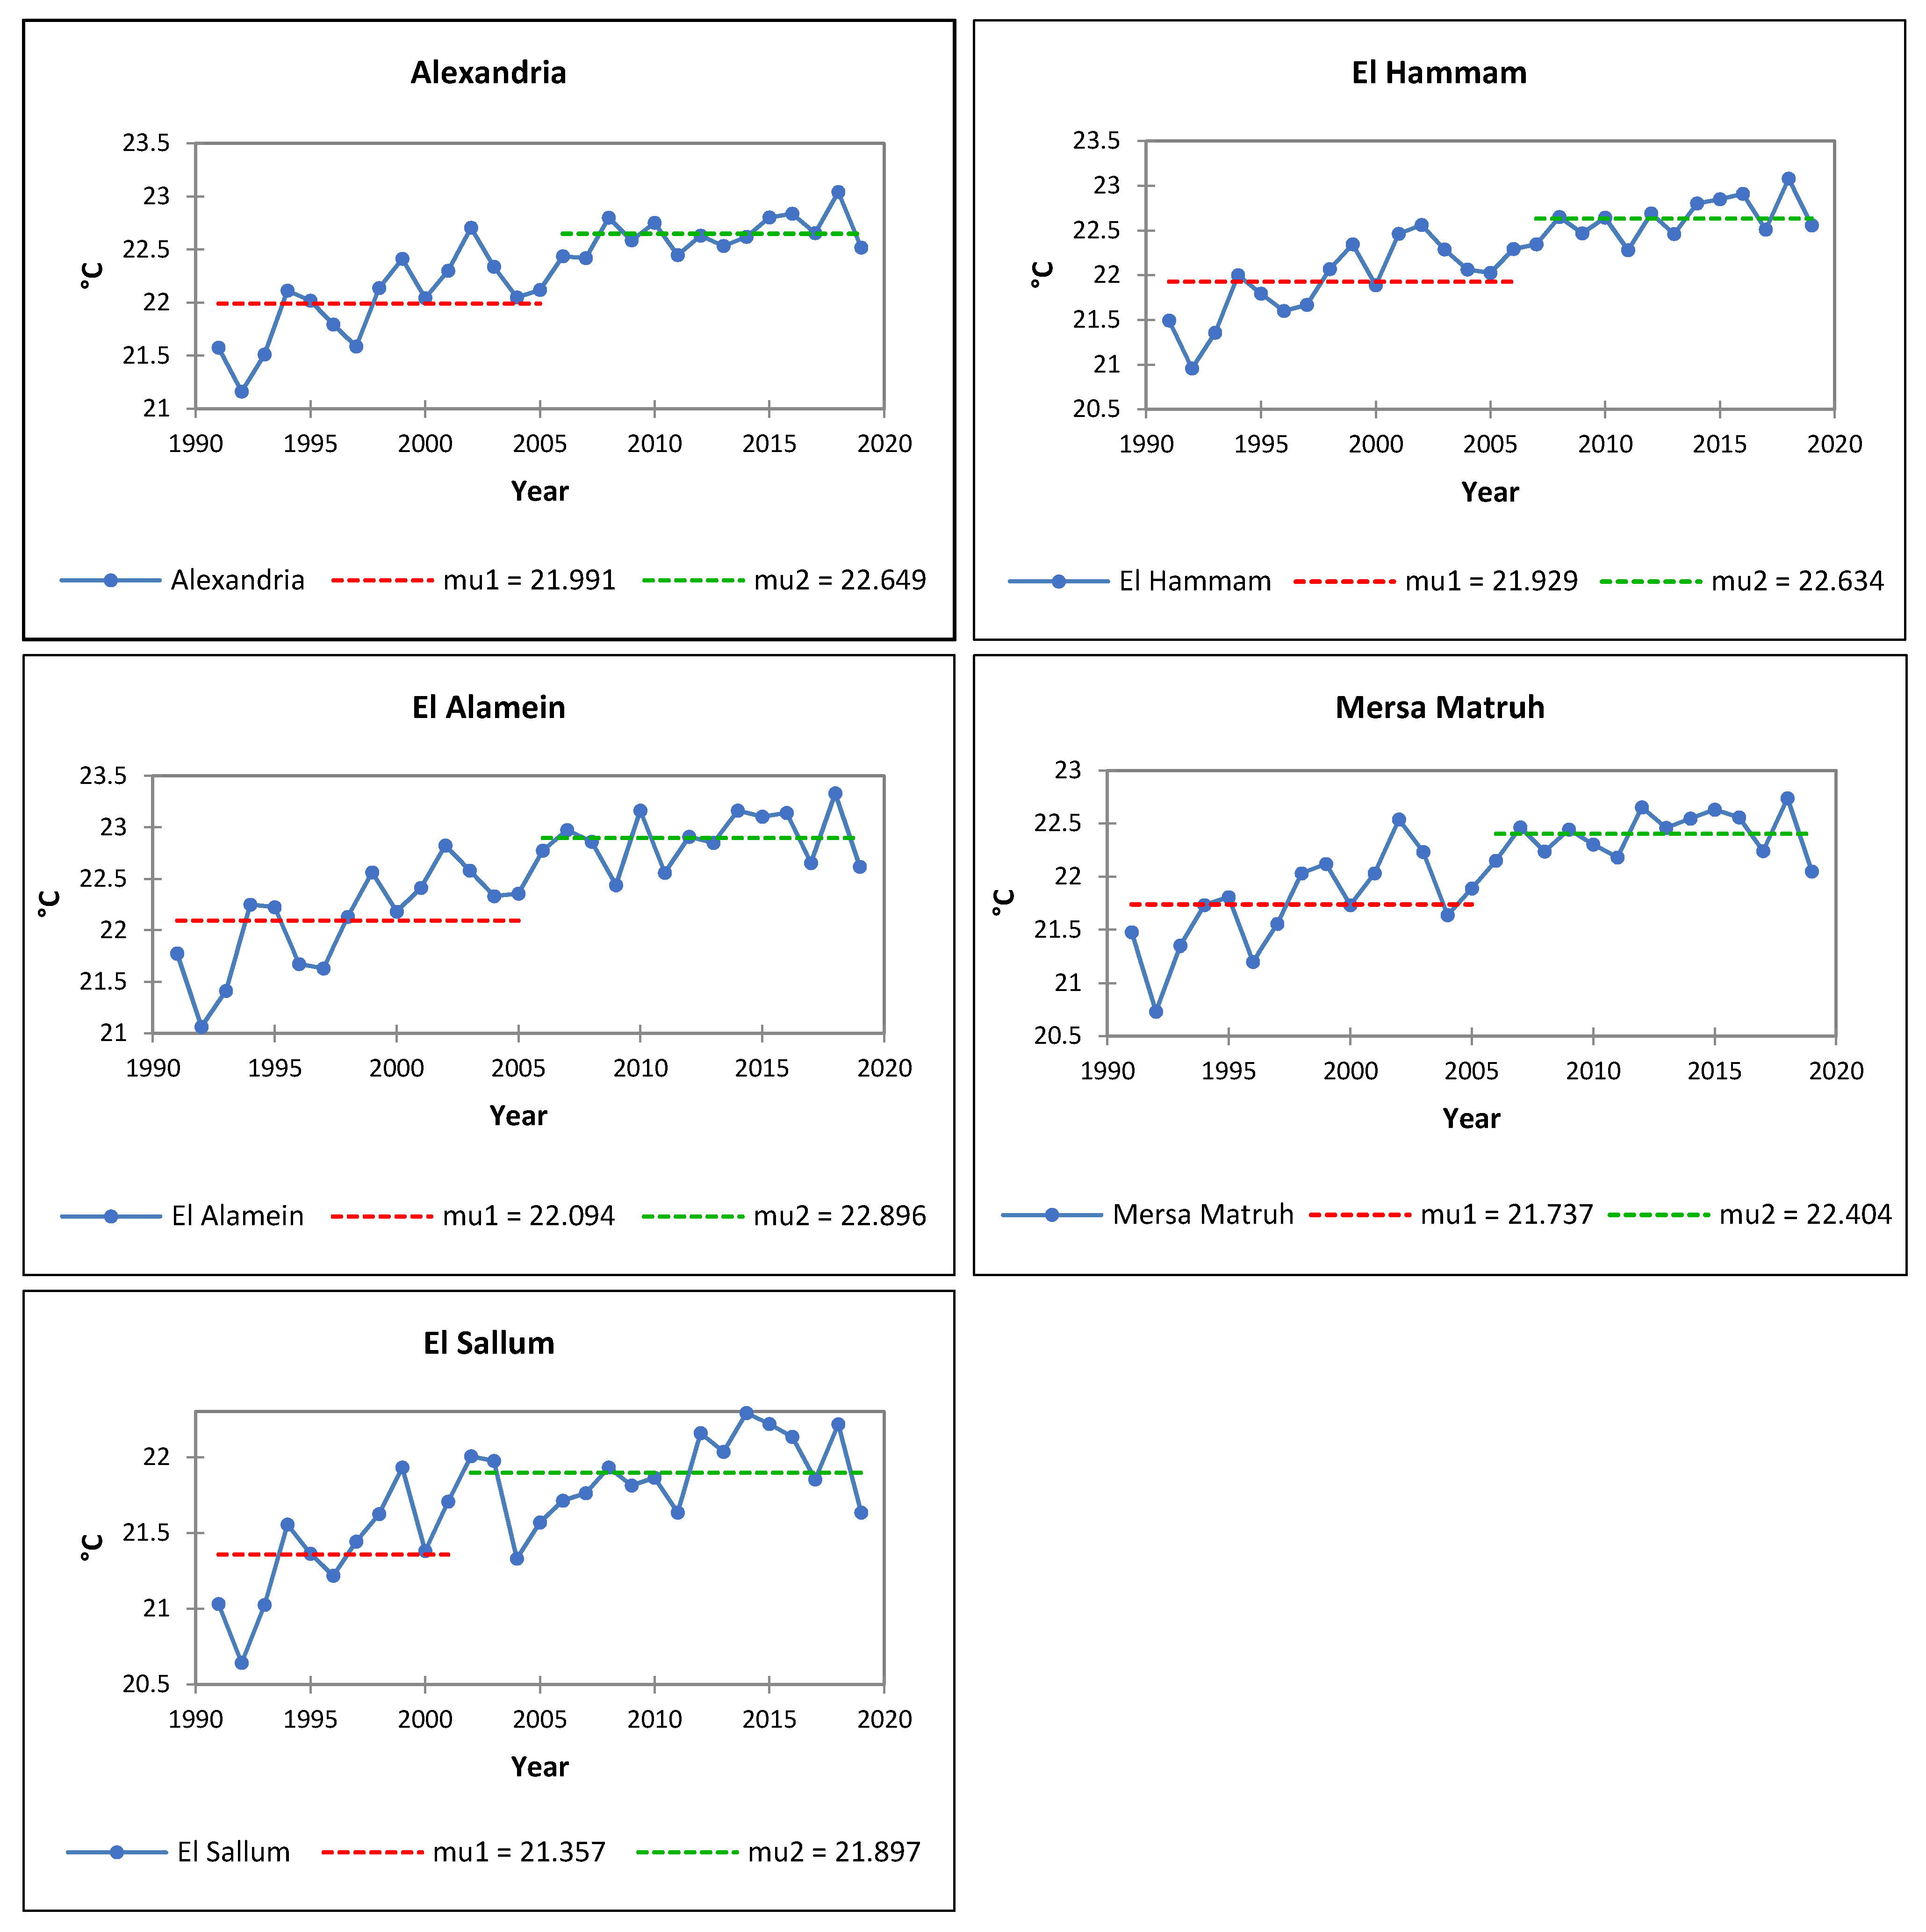
3.2. Analysis of Air Temperatures

Although the average annual temperatures are relatively close to each other, the difference in maximum temperatures between the colder Mersa Matruh and the warmer El-Arish is remarkable, with an average discrepancy over the period 1991–2020 of more than 2 °C (Table 3). It is also interesting to note that the El-Arish weather station has a considerably wide temperature range; in fact, it is also the coldest from the point of view of minimum annual temperatures, followed by El-Sallum. Both the Alexandria and Mersa Matruh weather stations can certainly be considered to have the mildest temperatures. In addition, the seasonally adjusted Mann–Kendall test was used to assess a possible trend in the data, using the monthly temperature observations of the last 30 years. This non-parametric test returns an estimate of the increase or decrease in temperature on an annual basis, evaluating the actual presence of trends by calculating a confidence level. The weather stations analyzed at both annual and monthly intervals show statistically significant trends, as evidenced by Mann–Kendall’s test (Table 4 and Table 5). The only exceptions are El-Arish for average annual temperatures and minimum annual temperatures, in addition to El-Sallum, which both monthly and annually show a lack of trend for maximum temperatures.
The trend lines show a strong and steady increase in temperatures over the last 30 years (Figure 3). The temperature increase rates for the investigated weather stations are as follows:
  • El-Arish: Ta +0.6 °C, Tm +0.5 °C, TM +1.8 °C;
  • Alexandria: Ta +1.7 °C, Tm +1.6 °C, TM +2.2 °C;
  • Mersa Matruh: Ta +1.1 °C, Tm +1.2 °C, TM +1.6 °C;
  • El-Sallum: Ta +0.9 °C, Tm +1.6 °C, TM +0.9 °C.

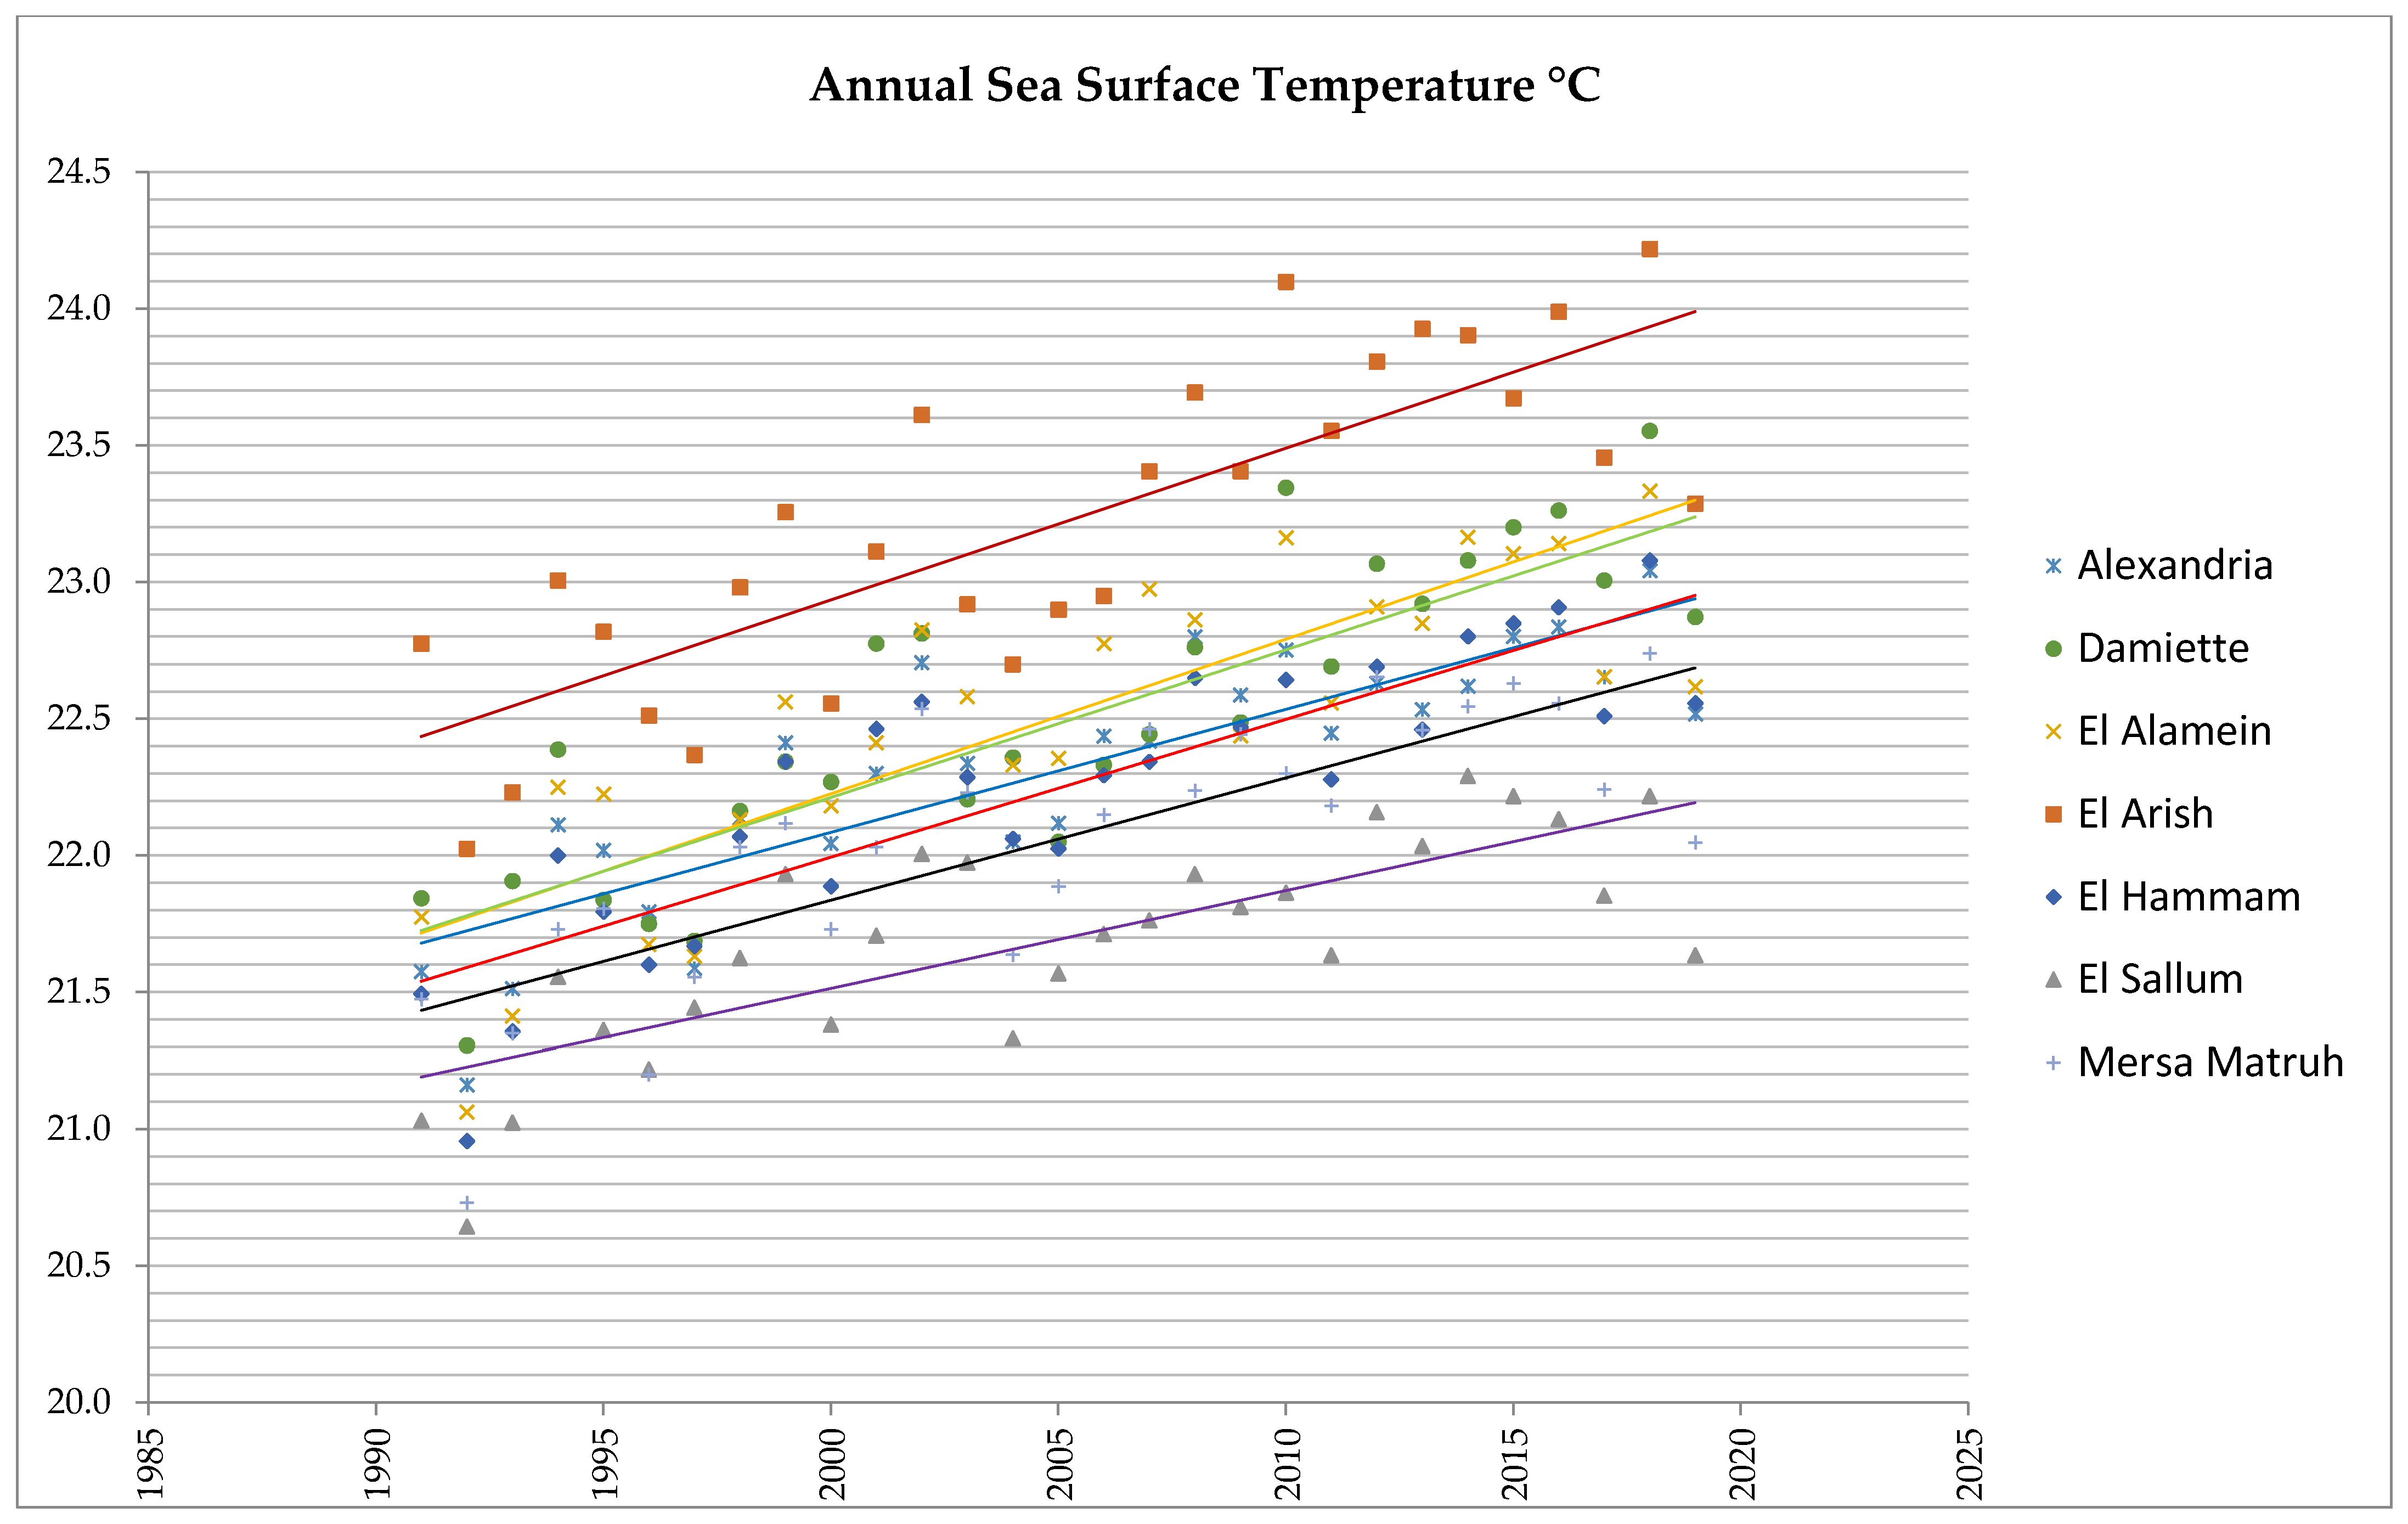
3.3. Analysis of Sea Surface Temperatures

Data obtained include different weather stations collected from the experimental locations reported in Table 1. A first analysis shows in Table 6 that, from an annual point of view, the SSTs are very similar between the various detection points considered in the last 30 years with a maximum recorded value off the coasts of El Arish (23.2 °C) and a minimum value near the coasts of El-Sallum (21.7 °C). It is also interesting to analyze how, although Damiette is not the coldest point on average, it is clearly the coldest point in winter (January, February, and December). Similarly to what was done for the air temperatures, in this case, the presence of significant trends in the series both on an annual and monthly scale was also tested by Mann–Kendall’s test (Table 7).
The rate of increase in SST from 1991 to 2020 is reported in Figure 4: Alexandria 1.2 °C, Damiette 1.5 °C, El-Alamain 1.4 °C, El-Arish 1.6 °C, El-Hammam 1.4 °C, El-Sallum 1 °C, and Mersa Matruh 1.2 °C. In addition, the Pearson correlation coefficient was evaluated to assess the correlation of annual SST between different detection points; the R2 was very high and almost always higher than 0.9 for all pairs; only in three cases, the correlations were 0.8, between Damiette and Mersa Matruh, between El-Sallum and El-Arish, and between Damiette and El-Sallum.
Finally, in order to try to understand when the analyzed time series has undergone an increase that could have been decisive for the adaptability to the environment of marine species, the homogeneity test of Pettitt was used (see Figure 5). This test led to an analysis of annual SST, in order to assess whether there is a breakpoint in the time series; in particular, all breakpoints identified are significant at 99%.
The breakpoint is identified in 2006 for Damiette, El Arish, and El Hammam; in 2005 for Alexandria, El Alamein, and Mersa Matruh; and in 2001 for El Sallum.

4. Discussion

Egyptian biodiversity, as in many other areas of the Mediterranean and around the world, is suffering from increasingly important and severe climate change. Temperature, as known, may shape community structure of the marine organisms, through its direct influence on the survival and reproduction of the organisms [22,33,34,35,36,37,38]. The effects of temperature can be mediated indirectly by water circulation modification with clear consequences on food provision and quality and on larval dispersal and expansion of non-indigenous fish species. Furthermore, impacts of climate warming can vary in magnitude and timing as a function of local environmental conditions. [32,37]. Modeling studies are predicting increased global warming, which will further alter marine ecosystems and their biodiversity species distributions over both horizontal and vertical dimensions [4,66]. These evaluations clearly indicate that the Mediterranean local response of biological communities with high-quality information on both thermal conditions and species occurrences across the depth gradient are currently not available and can be substantial [66]. Climate change monitoring by Mediterranean countries has been reported extensively in the literature, but our bioinformatic search has not revealed any studies on the Egyptian coast that correlate data on water temperatures from the other Mediterranean areas with the effects of climate change on fishes bioinvasion.
The innovativeness of our research is represented by an in-depth climate survey, from the point of view of both air and sea surface temperatures, with a view toward assessing changes in marine biodiversity in Egyptian harbours dictated by the incursion of non-indigenous species. Therefore, from a biological point of view, our research reviews previous publications that have identified the presence of NIS along the Egyptian coast of the Mediterranean Sea. We obtained and examined temporally and spatially NIS data and found a strict correlation with air and SST data obtained from the same coordinates of fish collection locations, taking into account a time interval equal to the standard reference period of 1991–2020 established by the World Meteorological Organization.
Data collected on fish species of warm water affinity provided identification of each non-indigenous fish species as well as a clear indication and traceability to their natural depth. Special attention has been given to the year of collection of each single fish species.
Despite some limitations related to unclear indication of sighting coordinates, we collected much data from the harbours, specifically concerning spatial variation between the harbours. These data represent a preliminary rational evaluation that may be used to avoid future biodiversity loss.
The bioinformatic monitoring carried out on NIS depicts 52 new NIS, with 47 from the Suez Canal (Lessepsian/alien) and 5 from Atlantic provenience, including their native temperature and invasiveness.
Furthermore, we report for the first time the spatial distribution in the different harbours of each NIS examined (see in Supplementary Table S1). Of course, NIS may interact and interfere with each other, leading to a lower establishment success of the later immigrants owing to competition. These interactions are difficult to observe and to verify, but more detailed air and SST can be used to generate powerful models for potential early detection of NIS encroachment to specific ports. With time, our data can also be used to develop decision-support tools for assessing the effects of NIS on biodiversity, human health, and sustainable development, as well as for evaluating the ecological, social, and economic consequences of invasive alien species. Alexandria was highlighted as the most bioinvaded harbor, with 31 NIS species of which 27 species are Lessepsian and 4 are from the Atlantic.
The total number of non-indigenous species was higher than in years before 1991 (data available in Farrag et al. [58]). Many bioinvader sightings have been identified during the collection done by the authors in Alexandria [42], confirming the literature examined.
In this study, we focused our attention on the Lessepsian species (17 orders and 33 families) by their taxonomical characterization, and the possibility of confirming their presence through a molecular approach by alignment of their cytochrome oxidase 1 (COI) sequences with sequences that correspond to a GenBank accession number. Inkscape schematic drawings were produced of the most harmful Lessepsian species (Figure 2a–d). These drawings may be used as a discrimination tool for identifying harmful invasive species.
Further, the analysis of air temperatures and sea surface temperatures is very important in the assessing correlation of these temperatures with the occurrence of allochthonous marine species. Data from the investigated weather stations after validation and homogeneization were analyzed with Mann–Kendall test, seasonal Mann–Kendall test, and the Sen slope estimator. The results from these analyses show very different air temperatures, at times, among the El-Arish, Alexandria, Mersa Matruh, and El-Sallum detection points located on the Egyptian coast overlooking the Mediterranean.
The analysis of air temperatures at weather stations at Alexandria, El Arish, Mersa Matruh, and El Sallum (Salloum) led to the observation of a general upward trend in temperatures ranging from 0.5 °C to 1.6 °C for average annual temperatures. The same trend was verified for minimum (0.6–1.7 °C) and maximum temperatures (0.9–2.2 °C), and it is possible to consider the trend as statistically significant, per analysis with the Mann–Kendall test and the seasonal Mann–Kendall test. The trends and increases observed in air temperatures are comparable with previous studies in the area [45,67], although in recent years, there has been increased intensity of temperature rise and variation compared with the average for the period 1991–2020.
The air temperatures are very important for assessing changes in sea surface temperature (SST); however, marine currents can be very sensitive to temperature and changes in these currents may produce unusual effects in the SST. This paper investigates the chances that an increase in SST may generate changes in marine fauna; therefore, the reported results are indispensable toward our understanding, with extreme precision, of the fluctuations in SST in the last 30 years from 1991 to 2020.
Sea surface temperatures, on the other hand, were managed using GIS software and showed an unequivocal positive trend and, consequently, a warming of the sea surface over the last 30 years. In fact, sea surface temperatures of the Alexandria, Damiette, El Alamein, El Arish, El Hammam, El Sallum (Salloum), and Mersa Matruh detection points show a rise of between 1.2 and 1.6 °C, in agreement with other publications [68,69], and it is possible to understand that this increase in sea surface temperature is very sustained and certainly affecting the adaptability of the species.
It has also been pointed out that there is no linear correlation between air and sea surface temperature, which could be due to sea currents or a possible phase shift due to the different thermal capacity of water and air. This lack of correlation could suggest a difference in marine currents that could affect SST, or it could simply be dictated by the different heat capacity between air and water. In particular, the surface sea current that laps the Egyptian coast is an Atlantic current that is colder in summer and warmer in winter, entering the Strait of Gibraltar from the Atlantic Ocean and touching part of the North African coast. This could introduce a significant phase shift that would generate a lack of correlation between SST and air temperatures, which, however, could also be dictated by the different heat capacities of water of 4186 J/(Kg·K) and air of 1005 J/(Kg·K). Finally, from the climatic point of view, this research looked for breakpoints that could give a clear signal of climate change within the same SST time series. The Pettitt test is very often used to validate data by looking for inhomogeneities within a time series and, in this case, it was used to identify the year that marks the watershed line between previous and subsequent thermometric data [70]. This analysis showed a clear breakpoint around the years 2005 and 2006 for almost all stations. From the point of view of the literature, the Mediterranean does not seem to have been investigated with the Pettitt test in order to find surface temperature change points over the last 30 years. This 2005–2006 breakpoint is a very important marker because it allows us to identify a date at which time there was a clear discontinuity that may have favoured the settlement of non-indigenous fauna. This seems to be confirmed by the numerous biological studies that have assessed these non-indigenous species and have seen the proliferation of these species only after the breakpoint identified for SST. The breakpoint is identified in 2006 for Damiette, El Arish, and El Hammam; in 2005 for Alexandria, El Alamein, and Mersa Matruh; and in 2001 for El Sallum. This is a very interesting fact because there is a change in average temperature in the historical time series and this average was very consistent for several years. A similar event could generate problems of adaptation in the marine fauna, or possibly recall allochthonous species. The breakpoint detected in our experimental climatic evaluations in Alexandria supports our informatics data collection on non-indigenous species reported in the literature from 2016 to the present [39,57,58,59]. The migration and dispersion of non-indigenous species in the Mediterranean is, in fact, a phenomenon related to climate change in relation to the biology and ecology of the species in question. The amount of time since their introduction into a new habitat and prevailing climatic conditions is decisive for the dispersion of a species, while the type of egg determines the main route of propagation in the Mediterranean [40,71]. The data show that there are more species with pelagic eggs. This shows that pelagic eggs are most favoured for the migration and dispersion process. As for their native temperature, 20 species are subtropical and 27 are tropical. This explains the fact that tropical species living at temperatures above 20 °C are more favoured in adapting to the new habitat, demonstrating that the Mediterranean basin is experiencing a warming trend [72].
We can expect that the risk of continued invasion of fishes from the Red Sea is high and that the phenomenon can accelerate with the further overheating of the sea surface. Many of these species have already expanded towards the west and north ends of the Mediterranean basin [73,74,75], while in the northern part of the Adriatic Sea and Aegean Sea, there are few invasions owing to an unfavorable climate. The tropical species are introduced into a temperate habitat, such as that of the Mediterranean basin, thus their persistence and spread should be severely hampered by abiotic conditions, such as salinity and seasonal temperatures. However, biotic interactions that determine species distributions also come into play. It has been found that most of these Lessepsian fishes have unique characteristics that give them biotic resistance and allow them to avoid direct competition with Mediterranean species and their sustainability [76]. This is another fundamental reason for their success in the invasion of Mediterranean waters. For example, Pterois miles and Fistularia commersonii are skilled predators as they exploit the deficient anti-predator defenses of native prey [77]. Instead, Siganus rivulatus and Siganus luridus benefit from the scarcity of competing herbivorous species in the host area [78]. On the other hand, they could negatively affect overseas habitats, such as has occurred with these last two mentioned species, which have become dominant in rocky habitats and have negatively affected the local biota owing to their intense algae grazing [79]. These Lessepsian species can also have positive impacts as they contribute to the biodiversity of the ecosystem [66,80] and where tropical organisms could actually replace lost ecological roles [68]. We provided the GenBank accession number of Cytochrome oxidase 1 (COI) to permit analysis of their nucleotidic sequences. These data can improve the database for these five Lessepsian species: Sebastapistes nuchalis, Oxyurichtys petersi, Coryogalops ochetica, Callionymus filamentosus, and Aulopareia unicolor. Of these Lessepsian migrants, some species are also attractive targets for local fishing operations [69,70]. This is because many species have similarities in both appearance and taste with local commercial species. For example, Nemipterus randalli, first identified in the Mediterranean in 2005 [69], is incorporated into local markets thanks to its great anatomical resemblance to native seabreds, although not part of the Sparidae. Alien species are considered a substitute for local ones, because they are preferred in terms of taste and even marketed at a higher price than local species [50]. Tropical fish generally grow faster [81], which can lead to a higher percentage of individuals reaching maturity [82], resulting in more numerous quantities than species of temperate origin. As reported by van Rijn et al. [50], Lessepsian alien species are an advantage for fishermen for two main reasons. Firstly, because they show stability or increase the size of the population even when they are exploited. Secondly, the tendency of alien fish species to prefer shallow habitats reduces fuel costs, which are an important part of trawling costs [83], and small vessels very often return to port every 1–3 days to unload their catch. Therefore, the fishermen must decide where to fish afterwards, often without prior knowledge of the distribution of the target species in the available fishing zone. In this uncertainty, even a shorter travel distance between possible locations is advantageous [50]. Periodic checks on diversity and on the community catalog can become a potential management tool for local administrations to protect and adapt the harbours for human and ecosystem health [84,85], and it can be done with alerts provided by local ecological knowledge (LEK), with morphological discrimination and/or molecular identification by barcoding using COI sequencing. The two Suez Canals support new species that are well adapted to the temperature and precipitation that influence the Mediterranean waters [41]. Many of the species are actually of great interest for the local economy, as already reported in Akel and Philips [56], and can be barcoded, but the invasive and/or the toxic species [58] must be under strict control. Among the various documented non-indigenous species, the most harmful were chosen to have information sheets created, listing their morphological characteristics in order for them to be identified more quickly. The species reported are eighteen out of forty-seven examined and represent the most harmful based on three characteristics: voracity, depth at which they live, and abundance in Egyptian and in many Mediterranean harbours (see [39] for review).
The data obtained with respect to the current global warming situation can help define the occurrence and spatial distribution of invasive species. Assessment of this type of year-to-year compiled data can then be used to as an NIS movement prediction tool for initiation, when needed, of appropriate actions, which make use of the full range of measures for early detection, control, and/or eradication of the invader, along with a corresponding risk analysis [84]. Furthermore, this information can be used for raising awareness at all levels (policy makers and general public) on the impacts of invasive species, including the possible social, economic, and ecological costs and the benefits of taking action to prevent their introduction or to mitigate their impacts.

5. Conclusions

Monitoring of biological events related to climate change allows assessment of their adaptation and sustainability. In this research, climatic changes in Egyptian coastal areas over the last decades were analyzed in order to determine a possible correlation with the entry of non-native species into the Mediterranean basin. It would certainly be very important for environmental sustainability to know the relationships between rising temperatures and NIS invasions. In our analysis, a time period of 30 years (1991–2020) was investigated, which is statistically significant and easily comparable with other observations in other parts of the world, because we are referring to a standard period established by the World Meteorological Organization. This study aims to address the need to integrate different methodologies in order to preserve the biodiversity of each individual environment, in this case, the Egyptian coast, as an Agenda 2030 request and give new insights into the assessment of Egyptian coastal climate change. Certainly, the identified temperature breakpoints can be a warning about climate change, which must alert us to the deleterious effects it may cause. Knowing the long-term effects of climate variation can be significant to make us both reflect on and adopt the appropriate countermeasures to limit the warming of the Mediterranean Sea. Examined reports from scientific literature have allowed us to taxonomically and ecologically characterize the NIS detected and to propose tools to enable easy discrimination by a molecular approach and by morphological schematization of the harmful species while using harbours’ coordinates to allow us to make an ex novo assessment of atmospheric and sea surface temperatures. Further, our data represent a good start toward the aim of spatial monitoring of climate changes in the Egyptian Mediterranean coast, and thus to provide the required information for implementation of biodiversity assessment from ship ballast waters. This will also provide timely information for managers and policy-advisors focusing on alien species at particular harbours.
Monitoring the movements of species over the years could represent an important objective for the study of marine biodiversity on a large spatial scale and address fundamental ecological questions. Yearly temporal and spatial assessment of NIS and SST and air temperature may guide conservation practices and management. This work is intended to contribute indirectly to the overall scope of reducing biodiversity vulnerability to climate change, and to enable managers to respond in a timely manner to the projected Agenda 2030 goals in the dynamics of marine resources and ecosystems, and improving the resilience of fisheries.

Supplementary Materials

The following are available online at https://www.mdpi.com/article/10.3390/w13131870/s1, Table S1: An inventory of non-indigenous fish species (NIS) sighted in Egyptian Mediterranean harbours from 1991 to 2020.

Author Contributions

Conceptualization, A.A.M., M.G., S.R.M. and G.G.; methodology, M.G., G.P., F.K.A.-G. and G.G.; validation, M.G., G.P. and G.G.; formal analysis, M.G., A.A.M., S.R.M., M.R.C., L.C., S.I., F.K.A.-G. and G.G. investigation, all authors; resources, M.G. and G.G.; data curation, all authors; writing—original draft preparation, M.G., M.R.C., L.C., S.I. and G.G.; writing—review and editing, M.G. and G.G.; visualization, M.G. and G.G.; supervision, G.G. All authors have read and agreed to the published version of the manuscript.

Funding

This research received no external funding.

Institutional Review Board Statement

Not applicable.

Informed Consent Statement

Not applicable.

Acknowledgments

This work was realized in the framework of the international agreement (MoU) between Suez Canal University, National Research Centre (Egypt), and Federico II University (Italy) in collaboration with Matteo Gentilucci and Gilberto Pambianchi of the University of Camerino (Italy). We acknowledge the English critical revision of our visiting researcher, Emidio M. Sivieri, Biomedical Engineer at The Children’s Hospital of Philadelphia, Philadelphia, PA-USA.

Conflicts of Interest

The authors declare no conflict of interest.

References

  1. Roberts, N.; Jones, M.D.; Benkaddour, A.; Eastwood, W.J.; Filippi, M.L.; Frogley, M.R.; Zanchetta, G. Stable isotope records of Late Quaternary climate and hydrology from Mediterranean lakes: The ISOMED synthesis. Quat. Sci. Rev. 2008, 27, 2426–2441. [Google Scholar] [CrossRef]
  2. Gentilucci, M.; Barbieri, M.; D’Aprile, F.; Zardi, D. Analysis of extreme precipitation indices in the Marche region (central Italy), combined with the assessment of energy implications and hydrogeological risk. Energy Rep. 2020, 6, 804–810. [Google Scholar] [CrossRef]
  3. Ren, G.; Ding, Y.; Zhao, Z.; Zheng, J.; Wu, T.; Tang, G.; Xu, Y. Recent progress in studies of climate change in China. Adv. Atmos. Sci. 2012, 29, 958–977. [Google Scholar] [CrossRef]
  4. Cramer, W.; Guiot, J.; Fader, M.; Garrabou, J.; Gattuso, J.P.; Iglesias, A.; Lange, M.A.; Lionello, P.; Llasat, M.C.; Paz, S.; et al. Climate change and interconnected risks to sustainable development in the Mediterranean. Nat. Clim. Chang. 2018, 8, 972–980. [Google Scholar] [CrossRef] [Green Version]
  5. Georges, A.; Holleley, C.E. How does temperature determine sex? Science 2018, 360, 601–602. [Google Scholar] [CrossRef]
  6. Giangrande, A.; Pierri, C.; Del Pasqua, M.; Gravili, C.; Gambi, M.C.; Gravina, M.F. The Mediterranean in check: Biological invasions in a changing sea. Mar. Ecol. 2020, 41, e12583. [Google Scholar] [CrossRef]
  7. Gentilucci, M.; Materazzi, M.; Pambianchi, G.; Burt, P.; Guerriero, G. Temperature variations in Central Italy (Marche region) and effects on wine grape production. Theor. Appl. Climatol. 2020, 140, 303–312. [Google Scholar] [CrossRef]
  8. Visser, M.E.; Both, C. Shifts in phenology due to global climate change: The need for a yardstick. Proc. R. Soc. B Biol. Sci. 2005, 272, 2561–2569. [Google Scholar] [CrossRef]
  9. Seppälä, R. Adaptation of Forests and People to Climate Change: A Global Assessment Report; IUFRO: Vienna, Austria, 2009. [Google Scholar]
  10. Gentilucci, M.; Bisci, C.; Burt, P.; Fazzini, M.; Vaccaro, C. Interpolation of rainfall through polynomial regression in the Marche region (Central Italy). In The Annual International Conference on Geographic Information Science; Springer: Cham, Switzerland, 2018; pp. 55–73. [Google Scholar]
  11. Gentilucci, M.; Materazzi, M.; Pambianchi, G.; Burt, P.; Guerriero, G. Assessment of variations in the temperature-rainfall trend in the province of Macerata (Central Italy), comparing the last three climatological standard normals (1961–1990; 1971–2000; 1981–2010) for biosustainability studies. Environ. Process. 2019, 6, 391–412. [Google Scholar] [CrossRef]
  12. Mohammat, A.; Wang, X.; Xu, X.; Peng, L.; Yang, Y.; Zhang, X.; Myneni, R.B.; Piao, S. Drought and spring cooling induced recent decrease in vegetation growth in Inner Asia. Agric. For. Meteorol. 2013, 178, 21–30. [Google Scholar] [CrossRef]
  13. Maracchi, G.; Sirotenko, O.; Bindi, M. Impacts of present and future climate variability on agriculture and forestry in the temperate regions: Europe. Clim. Chang. 2005, 70, 117–135. [Google Scholar] [CrossRef]
  14. Harvell, C.D.; Mitchell, C.E.; Ward, J.R.; Altizer, S.; Dobson, A.P.; Ostfeld, R.S.; Samuel, M.D. Climate warming and disease risks for terrestrial and marine biota. Science 2002, 296, 2158–2162. [Google Scholar] [CrossRef] [PubMed] [Green Version]
  15. Van Lierop, P.; Lindquist, E.; Sathyapala, S.; Franceschini, G. Global forest area disturbance from fire, insect pests, diseases and severe weather events. Forest Ecol. Manag. 2015, 352, 78–88. [Google Scholar] [CrossRef] [Green Version]
  16. Regev, Y.; Davidovich, N.; Berzak, R.; Lau, S.C.; Scheinin, A.P.; Tchernov, D.; Morick, D. Molecular Identification and Characterization of Vibrio Species and Mycobacterium Species in Wild and Cultured Marine Fish from the Eastern Mediterranean Sea. Microorganisms 2002, 8, 863. [Google Scholar] [CrossRef]
  17. Harrould-Kolieb, E.R. Framing ocean acidification in the context of the United Nations Framework Convention on climate change (UNFCCC) and Paris Agreement. Clim. Policy 2019, 19, 1225–1238. [Google Scholar] [CrossRef]
  18. Guerriero, G. Seasonal steroids variations and maturity stages in the female chub, Leuciscus cephalus L. (Pisces, Cyprinidae). Ital. J. Zool. 2007, 74, 317–324. [Google Scholar] [CrossRef]
  19. Cheng, C.; MacIntyre, L.; Abdelmohsen, U.R.; Horn, H.; Polymenakou, P.N.; Edrada-Ebel, R.; Hentschel, U. Biodiversity, anti-trypanosomal activity screening, and metabolomic profiling of actinomycetes isolated from Mediterranean sponges. PLoS ONE 2015, 10, e0138528. [Google Scholar] [CrossRef]
  20. Guerriero, G.; Bassem, S.M.; Khalil, W.K.; Temraz, T.A.; Ciarcia, G.; Abdel-Gawad, F.K. Temperature changes and marine fish species (Epinephelus coioides and Sparus aurata): Role of oxidative stress biomarkers in toxicological food studies. Emir. J. Food Agric. 2018, 30, 205–211. [Google Scholar] [CrossRef] [Green Version]
  21. Wang, Y.; Cadotte, M.W.; Chen, Y.; Fraser, L.H.; Zhang, Y.; Huang, F.; Luo, S.; Shi, N.; Loreau, M. Global evidence of positive biodiversity effects on spatial ecosystem stability in natural grasslands. Nat. Commun. 2019, 10, 3207. [Google Scholar] [CrossRef]
  22. Parisi, C.; Guerriero, G. Antioxidative defense and fertility rate in the assessment of reprotoxicity risk posed by global warming. Antioxidants 2019, 8, 622. [Google Scholar] [CrossRef] [Green Version]
  23. Bethoux, J.P.; Gentili, B. Functioning of the Mediterranean Sea: Past and present changes related to freshwater input and climate changes. J. Mar. Syst. 1999, 20, 33–47. [Google Scholar] [CrossRef]
  24. Bianchi, C.N.; Morri, C. Marine biodiversity of the Mediterranean Sea: Situation, problems and prospects for future research. Mar. Pollut. Bull. 2000, 40, 367–376. [Google Scholar] [CrossRef]
  25. Myers, N.; Mittermeier, R.A.; Mittermeier, C.G.; Da Fonseca, G.A.; Kent, J. Biodiversity hotspots for conservation priorities. Nature 2000, 403, 853–858. [Google Scholar] [CrossRef] [PubMed]
  26. Lejeusne, C.; Chevaldonné, P.; Pergent-Martini, C.; Boudouresque, C.F.; Pérez, T. Climate change effects on a miniature ocean: The highly diverse, highly impacted Mediterranean Sea. Trends Ecol. Evol. 2010, 25, 250–260. [Google Scholar] [CrossRef]
  27. Metaxas, D.A.; Bartzokas, A.; Vitsas, A. Temperature fluctuations in the Mediterranean area during the last 120 years. Int. J. Climatol. 1991, 11, 897–908. [Google Scholar] [CrossRef]
  28. Abudaya, M. Seasonal and spatial variation in Sea Surface Temperature in the South-East Mediterranean Sea. J. Environ. Earth Sci. 2013, 3, 42–52. [Google Scholar]
  29. Mohamed, B.; Abdallah, A.M.; El-Din, K.A.; Nagy, H.; Shaltout, M. Inter-annual variability and trends of sea level and sea surface temperature in the mediterranean sea over the last 25 years. Pure Appl. 2019, 176, 3787–3810. [Google Scholar]
  30. Kubin, E.; Poulain, P.M.; Mauri, E.; Menna, M.; Notarstefano, G. Levantine Intermediate and Levantine Deep Water Formation: An Argo Float Study from 2001 to 2017. Water 2019, 11, 1781. [Google Scholar] [CrossRef] [Green Version]
  31. Pisano, A.; Marullo, S.; Artale, V.; Falcini, F.; Yang, C.; Leonelli, F.E.; Santoleri, R.; Buongiorno Nardelli, B. New evidence of mediterranean climate change and variability from sea surface temperature observations. Remote Sens. 2020, 12, 132. [Google Scholar] [CrossRef] [Green Version]
  32. Galil, B.S. Alien species in the Mediterranean Sea—which, when, where, why? In Challenges to Marine Ecosystems; Springer: Dordrecht, The Netherlands, 2008; pp. 105–116. [Google Scholar]
  33. Galil, B.S.; Zenetos, A. A sea change—exotics in the Eastern Mediterranean Sea. In Invasive Aquatic Species of Europe. Distribution, Impacts and Management; Springer: Dordrecht, The Netherlands, 2002; pp. 325–336. [Google Scholar]
  34. Galil, B.S.; Marchini, A.; Occhipinti-Ambrogi, A. East is east and West is west? Management of marine bioinvasions in the Mediterranean Sea. Estuar. Coast. Shelf Sci. 2018, 201, 7–16. [Google Scholar] [CrossRef]
  35. Galil, B.S.; Marchini, A.; Occhipinti-Ambrogi, A. Mare Nostrum, mare quod invaditur—the history of bioinvasions in the mediterranean sea. In Histories of Bioinvasions in the Mediterranean; Springer: Cham, Switzerland, 2018; pp. 21–49. [Google Scholar]
  36. Yasuhara, M.; Danovaro, R. Temperature impacts on deep-sea biodiversity. Biol. Rev. 2016, 91, 275–287. [Google Scholar] [CrossRef]
  37. Galil, B.S.; Boero, F.; Campbell, M.L.; Carlton, J.T.; Cook, E.; Fraschetti, S.; Gollasch, S.; Hewitt, C.L.; Jelmert, A.; Macpherson, E.; et al. ‘Double trouble’: The expansion of the Suez Canal and marine bioinvasions in the Mediterranean Sea. Biol. Invasions 2015, 17, 973–976. [Google Scholar] [CrossRef] [Green Version]
  38. Azzurro, E.; Sbragaglia, V.; Cerri, J.; Bariche, M.; Bolognini, L.; Ben Souissi, J.; Busoni, G.; Coco, S.; Chryssanthi, A.; Fanelli, E.; et al. Climate change, biological invasions, and the shifting distribution of Mediterranean fishes: A large-scale survey based on local ecological knowledge. Glob. Chang. Biol. 2019, 25, 2779–2792. [Google Scholar] [CrossRef] [PubMed]
  39. Katsanevakis, S.; Poursanidis, D.; Hoffman, R.; Rizgalla, J.; Rothman, S.B.S.; Levitt-Barmats, Y.A.; Espinosa Torre, F. Unpublished Mediterranean records of marine alien and cryptogenic species. BioInvasions Rec. 2020, 9, 165–182. [Google Scholar] [CrossRef]
  40. Gentilucci, M.; Parisi, C.; Coppola, M.R.; Majdoubi, F.Z.; Madonna, A.; Guerriero, G. Influence of Mediterranean Sea Temperature Increase on Gaeta Gulf (Tyrrhenian Sea) Biodiversity. In Proceedings of the Zoological Society; Springer: Kolkata, India, 2021; pp. 1–3. [Google Scholar]
  41. Guerriero, G.; Di Finizio, A.; Ciarcia, G. Biological pollution: Molecular identification of non-native species in the Central Tyrrhenian Sea. Catrina Int. J. Environ. Sci. 2010, 5, 41–47. [Google Scholar]
  42. Guerriero, G.; Rabbito, D.; Alwany, M.A.; Madonna, A.; Temraz, T.A.; Sulaiman, O.O.; Bassem, S.M.; Trocchia, S.; Abdel-Gawad, F.K.; Ciarcia, G. Fisheries and biodiversity along Mediterranean Sea: Italian and Egyptian coast overview. EuroMediterr. J. Environ. Integr. 2017, 2, 1–14. [Google Scholar] [CrossRef] [Green Version]
  43. Redolat, D.; Monjo, R.; Lopez-Bustins, J.A.; Martin-Vide, J. Upper-Level Mediterranean Oscillation index and seasonal variability of rainfall and temperature. Theor. Appl. Climatol. 2019, 135, 1059–1077. [Google Scholar] [CrossRef]
  44. Ruela, R.; Sousa, M.C.; deCastro, M.; Dias, J.M. Global and regional evolution of sea surface temperature under climate change. Glob. Planet. Chang. 2002, 190, 103190. [Google Scholar] [CrossRef]
  45. Mačić, V.; Albano, P.G.; Almpanidou, V.; Claudet, J.; Corrales, X.; Essl, F.; Evagelopoulos, A.; Giovos, L.; Jimenez, C.; Kark, S.; et al. Biological invasions in conservation planning: A global systematic review. Front. Mar. Sci. 2018, 5, 178. [Google Scholar] [CrossRef] [Green Version]
  46. Saygu, İ.; Heymans, J.J.; Fox, C.J.; Özbilgin, H.; Eryaşar, A.R.; Gökçe, G. The importance of alien species to the food web and bottom trawl fisheries of the Northeastern Mediterranean, a modelling approach. J. Mar. Syst. 2020, 202, 103253. [Google Scholar] [CrossRef]
  47. Trasforming Our World: The 2030 Agenda for Sustainable Development. Available online: https://sustainabledevelopment.un.org/post2015/transformingourworld (accessed on 16 March 2021).
  48. Bonan, G.B. Forests and climate change: Forcings, feedbacks, and the climate benefits of forests. Science 2008, 320, 1444–1449. [Google Scholar] [CrossRef] [PubMed] [Green Version]
  49. Ouizgane, A.; Farid, S.; Majdoubi, F.Z.; Droussi, M.; Guerriero, G.; Hasnaoui, M. Assessment of climate change effects on predation activity and growth of largemouth bass, Micropterus salmoides (Lacepède, 1802) by water temperature variations. Emir. J. Food Agric. 2018, 30. [Google Scholar] [CrossRef]
  50. Van Rijn, I.; Kiflawi, M.; Belmaker, J. Alien species stabilize local fisheries catch in a highly invaded ecosystem. Can. J. Fish. Aquat. 2020, 77, 752–761. [Google Scholar] [CrossRef] [Green Version]
  51. Halim, Y.; Rizkalla, S. Aliens in Egyptian Mediterranean waters. A check-list of Erythrean fish with new records. Mediterr. Mar. Sci. 2011, 12, 479–490. [Google Scholar] [CrossRef] [Green Version]
  52. Farrag, M.; El-Haweet, A.; Akel, E.S.; Moustafa, M. Occurrence of puffer fishes (Tetraodontidae) in the eastern Mediterranean, Egyptian coast—Filling in the gap. BioInvasions Rec. 2016, 5, 47–54. [Google Scholar] [CrossRef]
  53. Akel, E.H.; Karachle, P. The Marine Ichthyofauna of Egypt. Egypt. J. Aquat. Biol. Fish. 2017, 21, 81–116. [Google Scholar] [CrossRef] [Green Version]
  54. Lipej, L.; Acevedo, I.; Akel, E.H.K.; Anastasopoulou, A.; Angelidis, A.; Azzurro, E.; Castriota, M.; Çelik, L.; Cilenti, F.; Crocetta, A.; et al. “New Mediterranean Biodiversity Records” (March 2017). Mediterr. Mar. Sci. 2017, 18, 179. [Google Scholar] [CrossRef] [Green Version]
  55. Osman, A.G.M.; Farrag, M.M.S.; El Sayed, H.K.; Moustafa, M.A. Feeding behavior of lessepsian fish Etrumeus teres (Dekay, 1842) from the Mediterranean Waters, Egypt. Egypt. J. Aquat. Res. 2013, 39, 275–282. [Google Scholar] [CrossRef] [Green Version]
  56. Akel, E.H.K.; Philips, A.E. Fisheries and biodiversity of the beach seine catch from the Eastern Harbor, Alexandria, Egypt. Egypt. J. Aquat. Res 2014, 40, 79–91. [Google Scholar] [CrossRef] [Green Version]
  57. Sahar, F.M.; Usama, M.M.; Eman, M.H. First occurrence of the Red Sea goatfish, Parupeneus forsskali (Fourmanoir Guz, 1976) in the coastal waters of Egyptian Mediterranean Sea. Int. J. Fish. Aquac. 2016, 8, 94–97. [Google Scholar] [CrossRef] [Green Version]
  58. Farrag, M.M.S.; El-Naggar, H.A.; Abou-Mahmoud, M.M.A.; Alabssawy, A.N.; Ahmed, H.O.; Abo-Taleb, H.A.; Kostas, K. Marine biodiversity patterns off Alexandria area, southeastern Mediterranean Sea, Egypt. Environ. Monit. Assess. 2019, 191, 367. [Google Scholar] [CrossRef]
  59. Ragheb, E.; Rizkalla, S.I. First record of the Fang tooth morayeel Enchelycore anatina (Lowe, 1838) and the diagnostic features of three fish species and a decapod crab from the southeastern Mediterranean Sea, off Alexandria (Egypt). Egypt. J. Aquat. Biol. Fish. 2020, 24, 639–653. [Google Scholar] [CrossRef] [Green Version]
  60. Sghaier, Y.R.; Zakhama-Sraieb, R.; Hmida, A.B.; Charfi, F. An inventory of non-indigenous species (NIS) inside and outside three tourist marinas from the southern Mediterranean coast. J. Black Sea Mediterr. Environ. 2019, 25, 29–48. [Google Scholar]
  61. Al Mabruk, S.A.A.; Rizgalla, J.; Giovos, I.; Bariche, M. Social media reveals the first records of the invasive lionfish Pterois miles (Bennett, 1828) and parrotfish Scarus ghobban Forsskål, 1775 from Egypt (Mediterranean Sea). BioInvasions Rec. 2020, 9. in press. Available online: https://www.researchgate.net/publication/341425846 (accessed on 2 March 2021). [CrossRef]
  62. Gentilucci, M.; Barbieri, M.; Burt, P.; D’Aprile, F. Preliminary data validation and reconstruction of temperature and precipitation in Central Italy. Geosciences 2018, 8, 202. [Google Scholar] [CrossRef] [Green Version]
  63. Hirsch, R.M.; Slack, J.R.; Smith, R.A. Techniques of trend analysis for monthly water quality data. Water Resour. Res. 1982, 18, 107–121. [Google Scholar] [CrossRef] [Green Version]
  64. Alexandersson, H.; Moberg, A. Homogenization of Swedish temperature data. Part I: Homogeneity test for linear trends. Int. J. Climatol. 1997, 17, 25–34. [Google Scholar] [CrossRef]
  65. Costa, A.C.M.; Negreiros, J.; Soares, A. Identification of inhomogeneities in precipitation time series using stochastic simulation. In geoENV VI–Geostatistics for Environmental Applications; Springer: Dordrecht, The Netherlands, 2008; pp. 275–282. [Google Scholar]
  66. Albouy, C.; Guilhaumon, F.; Leprieur, F.; Lasram, F.B.R.; Somot, S.; Aznar, R.; Velez, L.; Le Loc’h, F.; Mouillot, D. Projected climate change and the changing biogeography of coastal Mediterranean fishes. J. Biogeogr. 2013, 40, 534–547. [Google Scholar] [CrossRef]
  67. Schilling, J.; Hertig, E.; Tramblay, Y.; Scheffran, J. Climate change vulnerability, water resources and social implications in North Africa. Reg. Environ. Chang. 2020, 20, 15. [Google Scholar] [CrossRef] [Green Version]
  68. Rilov, G. Multi-species collapses at the warm edge of a warming sea. Sci. Rep. 2016, 6, 36897. [Google Scholar] [CrossRef] [PubMed] [Green Version]
  69. Stern, N.; Levitt, Y.; Galil, B.S.; Diamant, A.; Yokeş, M.B.; Goren, M. Distribution and population structure of the alien Indo-Pacific Randall’s threadfin bream Nemipterus randalli in the eastern Mediterranean Sea. J. Fish Biol. 2014, 85, 394–406. [Google Scholar] [CrossRef] [PubMed]
  70. Dikbas, F.; Firat, M.; Koc, A.C.; Güngör, M. Homogeneity test for Turkish temperature series. In Proceedings of the BALWOIS 2010, Ohrid, Republic of Macedonia, 25–29 May 2010; pp. 1–5. [Google Scholar]
  71. Ben Rais Lasram, F.; Tomasini, J.A.; Guilhaumon, F.; Romdhane, M.S.; Do Chi, T.; Mouillot, D. Ecological correlates of dispersal success of Lessepsian fishes. Mar. Ecol. Prog. Ser. 2008, 363, 273–286. [Google Scholar] [CrossRef] [Green Version]
  72. D’Amen, M.; Azzurro, E. Lessepsian fish invasion in Mediterranean marine protected areas: A risk assessment under climate change scenarios. ICES J. Mar. Sci. 2020, 77, 388–397. [Google Scholar] [CrossRef]
  73. Azzurro, E.; Soto, S.; Garofalo, G.; Maynou, F. Fistularia commersonii in the Mediterranean Sea: Invasion history and distribution modeling based on presence-only records. Biol. Invasions 2013, 15, 977–990. [Google Scholar] [CrossRef] [Green Version]
  74. Azzurro, E.; Franzitta, G.; Milazzo, M.; Bariche, M.; Fanelli, E. Abundance patterns at the invasion front: The case of Siganus luridus in Linosa (Strait of Sicily, Central Mediterranean Sea). Mar. Freshw. Res. 2017, 68, 697–702. [Google Scholar] [CrossRef]
  75. Coro, G.; Vilas, L.G.; Magliozzi, C.; Ellenbroek, A.; Scarponi, P.; Pagano, P. Forecasting the ongoing invasion of Lagocephalus sceleratus in the Mediterranean Sea. Ecol. Model. 2018, 371, 37–49. [Google Scholar] [CrossRef]
  76. Azzurro, E.; Tuset, V.M.; Lombarte, A.; Maynou, F.; Simberloff, D.; Rodríguez-Pérez, A.; Solé, R.V. External morphology explains the success of biological invasions. Ecol. Let. 2014, 17, 1455–1463. [Google Scholar] [CrossRef]
  77. Sih, A.; Bolnick, D.I.; Luttbeg, B.; Orrock, J.L.; Peacor, S.D.; Pintor, L.M.; Preisser, E.; Rehage, J.S.; Vonesh, J.R. Predator–prey naïveté, antipredator behavior, and the ecology of predator invasions. Oikos 2010, 119, 610–621. [Google Scholar] [CrossRef]
  78. Fanelli, E.; Azzurro, E.; Bariche, M.; Cartes, J.E.; Maynou, F. Depicting the novel Eastern Mediterranean food web: A stable isotopes study following Lessepsian fish invasion. Biol. Invasions 2015, 17, 2163–2178. [Google Scholar] [CrossRef]
  79. Giakoumi, S. Distribution patterns of the invasive herbivore Siganus luridus (Rüppell, 1829) and its relation to native benthic communities in the central Aegean Sea, Northeastern Mediterranean. Mar. Ecol. 2014, 35, 96–105. [Google Scholar] [CrossRef]
  80. Schlaepfer, M.A.; Sax, D.F.; Olden, J.D. The potential conservation value of non-native species. Conserv. Biol. 2011, 25, 428–437. [Google Scholar] [CrossRef] [PubMed]
  81. Henderson, P.A. The growth of tropical fishes. Fish Physiol. 2005, 21, 85–100. [Google Scholar]
  82. Goldberg, S.R. Notes on Reproduction of Hurter’s Spadefoot Toads, Scaphiopus hurterii (Anura: Scaphiopodidae), from Oklahoma. Chic. Herpetol. Soc. 2019, 54, 9–11. [Google Scholar]
  83. Poos, J.J.; Turenhout, M.N.; AE van Oostenbrugge, H.; Rijnsdorp, A.D. Adaptive response of beam trawl fishers to rising fuel cost. ICES J. Mar. Sci. 2013, 70, 675–684. [Google Scholar] [CrossRef]
  84. Guerriero, G. Non-native species and biodiversity assessment. J. Biodivers. Endanger. Species 2013, 1, e104. [Google Scholar] [CrossRef] [Green Version]
  85. Gentilucci, M.; Madonna, A.; Guerriero, G. The Influence of Sea Surface Temperatures on Biodiversity of Gaeta Gulf, Italy. In Recent Advances in Environmental Science from the Euro-Mediterranean and Surrounding Regions, 2nd ed.; Ksibi, M., Ed.; Springer: Cham, Switzerland, 2019. [Google Scholar] [CrossRef]
Figure 1. Stations collecting biological and meteorological data (red and blue dots) along the north coast of Egypt. The red dots indicate localities where detailed analyses were performed. SST: sea surface temperature.
Water 13 01870 g001
Figure 2. (a) Toxic harmful species, Lagocephalus sceleratus. (b) Omnivorous harmful species found in the Egyptian Mediterranean harbours examined through 1991 to 2021 A. Fistularia commersonii; B. Nemipterus randalli; C. Sargocentron rubrum. (c) Erbivores harmful species found in the Egyptian Mediterranean harbours examined from 1991 to 2021: A. Hemiramphus far; B. Siganus huridus; C. Siganus rivulatus. (d) Additional harmful species A. Alepes djedaba; B. Atherinomorus lacunosus; C. Callionymus filamentosus; D. Crenidens crenidens; E. Epinephelus malabaricus F. Himantura uarnak G. Nemipterus japonicus H. Rastrelliger kanagurta; I. Saurida undosquamis; J. Scomberomorus commerson; K. Sillago sihama. Schematic images created by Sara Inglese.
Water 13 01870 g002aWater 13 01870 g002b
Figure 3. (ac) Average annual temperature (a), minimum temperature (b), maximum temperature (c); the trend lines were obtained through Sen slope estimator from 1991 to 2020 in El Arish, Alexandria, Mersa Matruh, and El-Sallum.
Water 13 01870 g003
Figure 4. Sea surface temperature and trend lines obtained through Sen slope estimator in El-Arish, Alexandria, Mersa Matruh, and El-Sallum and in additional stations such as Damiette, El-Hammam, and El-Alamain.
Water 13 01870 g004
Figure 5. Pettit homogeneity test for all stations in each site of measurement of SST.
Water 13 01870 g005aWater 13 01870 g005b
Table 1. Overview of study area and related coordinates; year of collection from 1991 to 2020; references and progressive reference number of the Egyptian Mediterranean coast studies where non-indigenous species were evaluated.
Study AreaCoordinatesYear of Non-Indigenous Species (NIS) Fish CollectionReference
From Al-Arish
To El-Sallum
From 31°15′00″ N; 34°12′36″ E
To 31°60′00″ N; 25°08′42″ E
Until 2010Halim and Rizkalla [51]
2012–2015Farrag et al. [52]
Akel et al. [53]
Port Said 31°15′12″ N; 32°18′28″ E2010–2012Katsanevakis et al. [39]
Damiette 31°33′39″ N; 31°51′43″ E2016Lipej et al. [54]
Alexandria From 31°00′ N; 29°18′ E
To 31°36′ N; 30°05′ E
2009Akel and Philips [56]
31°19′29″ N; 30°3′11″ E2012–2014Katsanevakis et al. [39]
31°16′00″ N; 30°10′00″ E31 January 2016Sahar et al. [57]
From 31°00′ N; 29°18′ E
To 31°36′ N; 30°05′ E
2017Farrag et al. [58]
31°13′1″ N; 29°53′1″ EMarch–May 2018Ragheb and Rizkalla [59]
From El Hamam (Alexandria)
to Rashid (Alexandria)
31°00′ N; 29°18′00″ E
31°35′00″ N; 30°30′00″ E
2008Osman et al. [55]
El Alamain (Mersa Matrouh)30°50′1″ N; 28°59′5″ EDecember 2013Sghaier et al. [60]
Mersa Matrouh 31°22′23″ N; 27°12′13″ E2010–2019Katsanevakis et al. [39]
2018Al Mabruk et al. [61]
Egyptian Mediterranean Stations not indicated with coordinates are reported as “From Al-Arish to El-Sallum”.
Table 2. (a–c) Biodata on Lessepsian Specie of Egyptian Mediterranean Harbours.
SpeciesTaxonomy
(Order
Family)
Egg TypeNative
Depth
Native TCOI GenBank
ID
Value
(a)
Perciformes
Aulopareia unicolorGobiidaen.d.n.d.tn.d.n.d.
Coryogalops ocheticaGobiidaebn.d.tn.d.n.c.
Pteragogus pelycusLabridaep50–100 mstKY176585.1n.c.
Equulites klunzingeriLeiognathidaep10–100 mtKM538355.1n.c.
Upeneus poriMullidaep50–100 mstKM538636.1n.c.
Upeneus moluccensisMullidaep0–50 mstJN313347.1c.
Parupeneus forsskaliMullidaen.d.1–45 mstLC543903.1n.c.
Nemipterus randalliNemipteridaep-b20–450 mtKM538438.1c. (l.)
Nemipterus japonicusNemipteridaep0–250 mtHQ561008.1c.
Pempheris rhomboideaPempheridaen.d.n.d.tKJ020198.1n.d.
Pempheris vanicolensisPempheridaep0–25 mtMF123980.1n.c.
Scarus ghobbanScaridaep0–90 mtJQ350329.1n.c.
Scomberomorus commersonScombridaep0–100 mtKY372120.1c. (h.)
Epinephelus malabricusSerranidaep0–150 mtMH707766.1c.
Siganus luridusSiganidaeb50–100 mstMF409629.1c.
Siganus rivulatusSiganidaeb0–100 mstMF124055.1c.
Sillago sihamaSillaginidaepn.dtJN312946.1c.
Crenidens crenidensSparidaepn.dstJF493282.1c.
Sphyraena chrysotaeniaSphyraenidaep50 m tJF494556.1n.d.
Sphyraena flavicaudaSphyraenidaep0–25 mtMF124057.1c.
Terapon putaTerapontidaep0–50 mtKR861565.1n.c.
Pelates quadrilineatusTerapontidaepn.dstJN313121.1c. (l.)
(b)
Beloniformes
Tylosurus choramBelonidaebn.d.tMF124076.1c.
Parexocoetus mentoExocoetidaeb>20 mtHQ956399.1c. (l.)
Hemiramphus farHemiramphidaeb0–6 mstHQ564418.1c.
Clupeiformes
Herklotsichthys punctatusClupeidaep0–50 mstKM538362.1c. (l.)
Dussumieria elopsoidesDussumieriidaep0–50 mstJF93400.1c. (l.)
Etrumeus teres p<50 mstJF952733.1n.c.
Scorpaeniformes
Sebastapistes nuchalisScorpaenidaen.d.n.d.tn.d.n.d.
Pterois miles p0–85 mtMF124021.1c.
Tetraodontiformes
Stephanolepis diasprosMonacanthidaep0–50 mtKM538599.1c.
Lagocephalus sceleratusTetraodontidaeb50–100 mtKM538364.1n.c.
Lagocephalus spadiceus b50–100 mstJN312835.1n.c.
Lagocephalus suezensis b40 mstKM538405.1n.c.
Kurtiformes
Apogonichthyoides pharaonicApogonidaemb0–50 mtKM538173.1n.c.
Jaydia smithi mb22–230 mtHQ956586.1n.c.
(c)
Atheriniformes
Atherinomorus lacunosusAtherinidaeb0–39 mstHQ956401.1c.
Aulopiformes
Saurida undosquamisSynodontidaep50–250 mstHQ956239.1c.
Beryciformes
Sargocentron rubrumHolocentridaep0–84 mstKJ202198.1c. (l.)
Callionymiformes
Callionymus filamentosusCallionymidaep0–350 mstn.d.n.c.
Carangiformes
Alepes djedabaCarangidaep<50 mstHQ560999.1c.
Gobiiformes
Oxyurichtys petersiOxudercidaebn.d.tn.d.n.c.
Mugilifomes
Liza carinataMugilidaepn.d.tKX929970.1c.
Myliobatiformes
Himantura uarnakDasyatidaeb0–50 mstJX263360.1n.c.
Pleuronectiformes
Cynoglossus sinusarabiciCynoglossidaep0–25 mtKM538311.1n.c.
Scombriformes
Rastrelliger kanagurtaScombridaep20–90 mtKY372082.1c. (h.)
Syngnathiformes
Fistularia commersoniiFistulariidaep50–100 mtMK567525.1c.
Abbreviations: n.d. = not detected; b = benthic; p = pelagic; native T = native temperature; st = subtropical (from 10° to 20°); t = tropical (>20°); c., commerciality; n.c., no commerciality; (h.), high commerciality; c. (l.), low commerciality.
Table 3. Monthly and annual air temperatures from 1991 to 2020 for the weather stations of El-Arish, Alexandria, Mersa Matruh, and El-Sallum.
El-ArishAlexandriaMersa MatruhEl-Sallum
MonthTaTMTmTaTMTmTaTMTmTaTMTm
January12.919.47.013.918.98.913.618.29.512.117.27.6
February13.820.57.514.419.59.114.118.79.512.817.98.0
March15.922.69.516.421.211.115.820.510.815.220.610.0
April18.925.911.919.023.713.818.223.212.917.723.312.3
May21.828.515.222.126.717.221.025.715.920.826.515.3
June24.831.118.425.229.221.424.228.319.524.029.518.8
July26.832.621.027.030.523.726.229.922.026.131.720.9
August27.332.921.727.631.224.026.830.522.626.331.721.4
September25.931.620.026.330.622.125.729.621.224.930.320.0
October23.229.417.123.628.218.923.027.418.421.626.716.8
November18.625.512.519.624.214.419.023.614.517.822.813.2
December14.421.48.515.520.810.415.219.711.013.818.99.4
Annual20.426.814.220.925.316.220.224.615.619.424.814.5
TM: maximum temperature (°C); Tm: minimum temperature (°C); Ta: average temperature (°C).
Table 4. Results of Mann–Kendall test for all weather stations at annual scale from 1991 to 2020 in El Arish, Alexandria, Mersa Matruh, and El-Sallum.
El-ArishAlexandriaMersa MatruhEl-Sallum
ParameterTaTMTmTaTMTmTaTMTmTaTMTm
Tau0.220.480.210.650.690.580.540.580.460.0310.020.61
S’90196862813012532372531996640128
p-value0.10<0.0010.11<0.001<0.001<0.001<0.001<0.001<0.0010.0490.24<0.001
alfa0.050.050.050.050.050.050.050.050.050.050.050.05
Sen0.030.050.020.060.080.050.040.060.030.030.020.06
CI−−0.27−0.22−0.20−0.12−0.14−0.19−0.12−0.17−0.12−0.24−0.30−0.15
CI+0.340.380.260.240.340.290.210.310.230.320.440.34
Tau: a measure of concordance between two observed variables; TM: maximum temperature (°C); Tm: minimum temperature (°C); S’: Mann–Kendall statistic; p-value: level of uncertainty in the test; alfa: confidence level; Sen: value of the coefficient of Sen; CI−: lower threshold of the confidence interval; CI+: upper threshold of the confidence interval.
Table 5. Results of Mann–Kendall test seasonally adjusted for all weather stations at monthly scale from 1991 to 2020 in El Arish, Alexandria, Mersa Matruh, and El-Sallum.
El-ArishAlexandriaMersa MatruhEl-Sallum
ParameterTaTMTmTaTMTmTaTMTmTaTMTm
Tau0.180.290.150.390.380.330.290.310.250.140.080.3
S’8821412752200719981739151916161282386218833
p-value<0.001<0.001<0.001<0.001<0.001<0.001<0.001<0.001<0.0010.00170.08<0.001
alfa0.050.050.050.050.050.050.050.050.050.050.050.05
Tau: a measure of concordance between two observed variables; TM: maximum temperature (°C); Tm: minimum temperature (°C); S’: Mann–Kendall statistic; p-value: level of uncertainty in the test; alfa: confidence level.
Table 6. Sea surface temperature (SST, °C) from 1991 to 2020 in El-Arish, Alexandria, Mersa Matruh, and El-Sallum and in additional stations such as Damiette, El-Hammam, and El-Alamain.
El-ArishDamietteAlexandriaEl-HammamEl-AlamainMersa MatruhEl-Sallum
MonthSSTSSTSSTSSTSSTSSTSST
January18.417.218.518.518.118.318.1
February17.416.617.417.517.217.217.0
March17.817.417.417.317.517.216.9
April19.319.118.518.418.818.017.7
May22.421.921.220.921.720.320.0
June25.525.224.224.024.823.923.3
July28.227.426.426.226.926.225.6
August29.328.527.627.428.127.426.9
September28.828.027.227.227.527.126.7
October26.926.225.825.825.725.725.2
November23.823.023.323.223.223.222.7
December20.519.620.420.520.120.220.1
Annual23.222.522.322.222.522.121.7
Table 7. Results of Mann–Kendall test (MK) and seasonally adjusted Mann–Kendall test (MK*) in El-Arish, Alexandria, Mersa Matruh, and El-Sallum and in additional stations such as Damiette, El-Hammam, and El-Alamain.
El-ArishDamietteAlexandriaEl-HammamEl-AlamainMersa MatruhEl-Sallum
ParameterMKMK*MKMK*MKMK*MKMK*MKMK*MKMK*MKMK*
Tau0.420.390.690.650.670.610.36
S’201318732802622702481759
p-value<0.001<0.001<0.001<0.001<0.001<0.001<0.001
alfa0.050.050.050.050.050.050.05
Sen 0.0430.0520.0580.057
CI− −0.08−0.12−0.10−0.15
CI+ 0.180.220.210.25
Tau: measure of concordance between two observed variables; TM: maximum temperature (°C); Tm: minimum temperature (°C); S’: Mann–Kendall statistic; p-value: level of uncertainty in the test; alfa: confidence level; Sen: value of the coefficient of Sen; CI−: lower threshold of the confidence interval; CI+: upper threshold of the confidence interval.
Publisher’s Note: MDPI stays neutral with regard to jurisdictional claims in published maps and institutional affiliations.

