
Evaluation of Drought Resilience Reflecting Regional Characteristics: Focused on 160 Local Governments in Korea


Department of Civil Engineering, The University of Suwon, Hwaseong-si 445-743, Gyeonggi-do, Korea
*
Author to whom correspondence should be addressed.
Water 2021, 13(13), 1873; https://doi.org/10.3390/w13131873
Submission received: 2 June 2021
/
Revised: 30 June 2021
/
Accepted: 1 July 2021
/
Published: 5 July 2021
(This article belongs to the Special Issue Assessing and Managing Risk of Flood and Drought in a Changing World)
Abstract
:It is critical to prepare appropriate responses and countermeasures against droughts caused by a complex hazard process as the range of its damage and duration are very large. In this study, 160 local governments in Korea evaluated drought resilience. A total of 18 qualitative and quantitative drought recovery indicators were selected to collect and analyze data from each region. Comparative analysis of indicators through regional drought assessment was conducted to derive results and present directions for enhancing resilience. Lastly, a resilience curve of drought that can utilize the results of the evaluation was suggested and applied to the actual region, and the results were analyzed. The proposed method can be expected to be used as a basic and essential resources to prepare various local government measures against drought.
1. Introduction
Drought is one of the natural disasters with not only an environmental and economic impact but also a social impact, in various and complex ways, and is classified into meteorological, hydrological, agricultural, and socioeconomic drought due to the various paths and effects of drought [1]. Several drought indexes have been developed for various drought categories to date [2,3,4,5,6,7]. Drought indicators have strengths and weaknesses for each category, and for drought, appropriate indicators for that category are used. For this reason, using another drought index to evaluate other categories of drought may relatively deteriorate the reliability of the evaluation results. Compound drought indicators such as meteorological drought and hydrological drought, which can evaluate various characteristics of drought, have been recently proposed [8,9,10,11,12,13]. The main goal of a drought index is to evaluate, monitor, and warn the current state of drought.
Recently, it is not only vulnerability evaluation and monitoring methods, but the concept of resilience being introduced to evaluate the capacity to recover the system against emergency accidents, natural and social disasters and to establish countermeasures against possible accidents and disasters in the future. In this regard, resilience has been becoming an important concept concerning response and the establishment of countermeasures in droughts [14,15]. In the field of safety, resilience falls into three categories: human-centered human resilience, community resilience focused on recovery, and system resilience capable of operating normally in unpredictable and ever-changing situations. Human resilience refers to the process of overcoming or recovering from tragedy, trauma, and stress [15]. Community resilience is a field that studies factors that can recover from natural disasters such as typhoons and heavy rains, or social infrastructure, disaster management systems, human and material resources, etc., and it applies the concept of prevention–preparation–response–recovery. Human resilience and community resilience share the basic concept that prevention is possible, if removing the cause of an accident or event. Further, it can recover to its original state of resilience. System resilience has a more advanced perspective and goal than the common concept of human and community resilience and requires coordination and performance capabilities to bring out the intended results. System resilience refers to the ability of an organization, hardware and software systems to mitigate the severity and possibility of failure or loss, adapt to changing conditions, and respond appropriately afterward.
In this way, resilience from the perspective of managing natural disasters is one of the indicators of the possibility of recovering to the state before the disaster occurred. Bruneau et al. [14] classified resilience into four categories: robustness, redundancy, resourcefulness, and rapidity, and suggested a method for quantitative evaluation and improvement of resilience against earthquakes.
After that, it was gradually expanded and applied across the diverse field of disasters such as safety management, flood, and wastewater treatment infrastructure [15,16,17,18,19,20]. The application of the concept of resilience to drought disasters has been carried out by several researchers since 2010 [21,22,23,24]. Mihunov et al. [21,22], Kamara et al. [23], and Khatibi et al. [24] have studied the community resilience assessment and enhancement framework for drought. Karamouz et al. [8] assessed the resilience of a particular area that reflect regional characteristics. Lin et al. [25] and Venton [26] analyzed drought resilience only from a meteorological and economic perspective and presented its results. Thus far, research on drought disaster recovery has been aimed at integrating the concept of resilience to compute community resilience and to present various applications in the direction of communication and policy improvement between stakeholders or related fields.
In this study, drought was explained based on four Rs (robustness, redundancy, resourcefulness, and rapidity) suggested above as the resilience concept, and indicators that could cause regional differences were selected and proposed to reflect regional drought characteristics focusing on all local governments in Korea. Next, the results of each local government index were compared and analyzed through a nationwide drought resilience evaluation to derive the causes of regionally different results and suggest directions for reinforcing resilience. Lastly, a method was suggested to apply the results of resilience evaluation to determining drought conditions through the revised current drought index. To this end, a resilience-based drought indicator curve in which the results of resilience evaluation are combined with the drought index was suggested, and the results of the difference in droughts entry and resolution according to the resilience level were analyzed and presented.
2. Methodologies
2.1. Research Flow
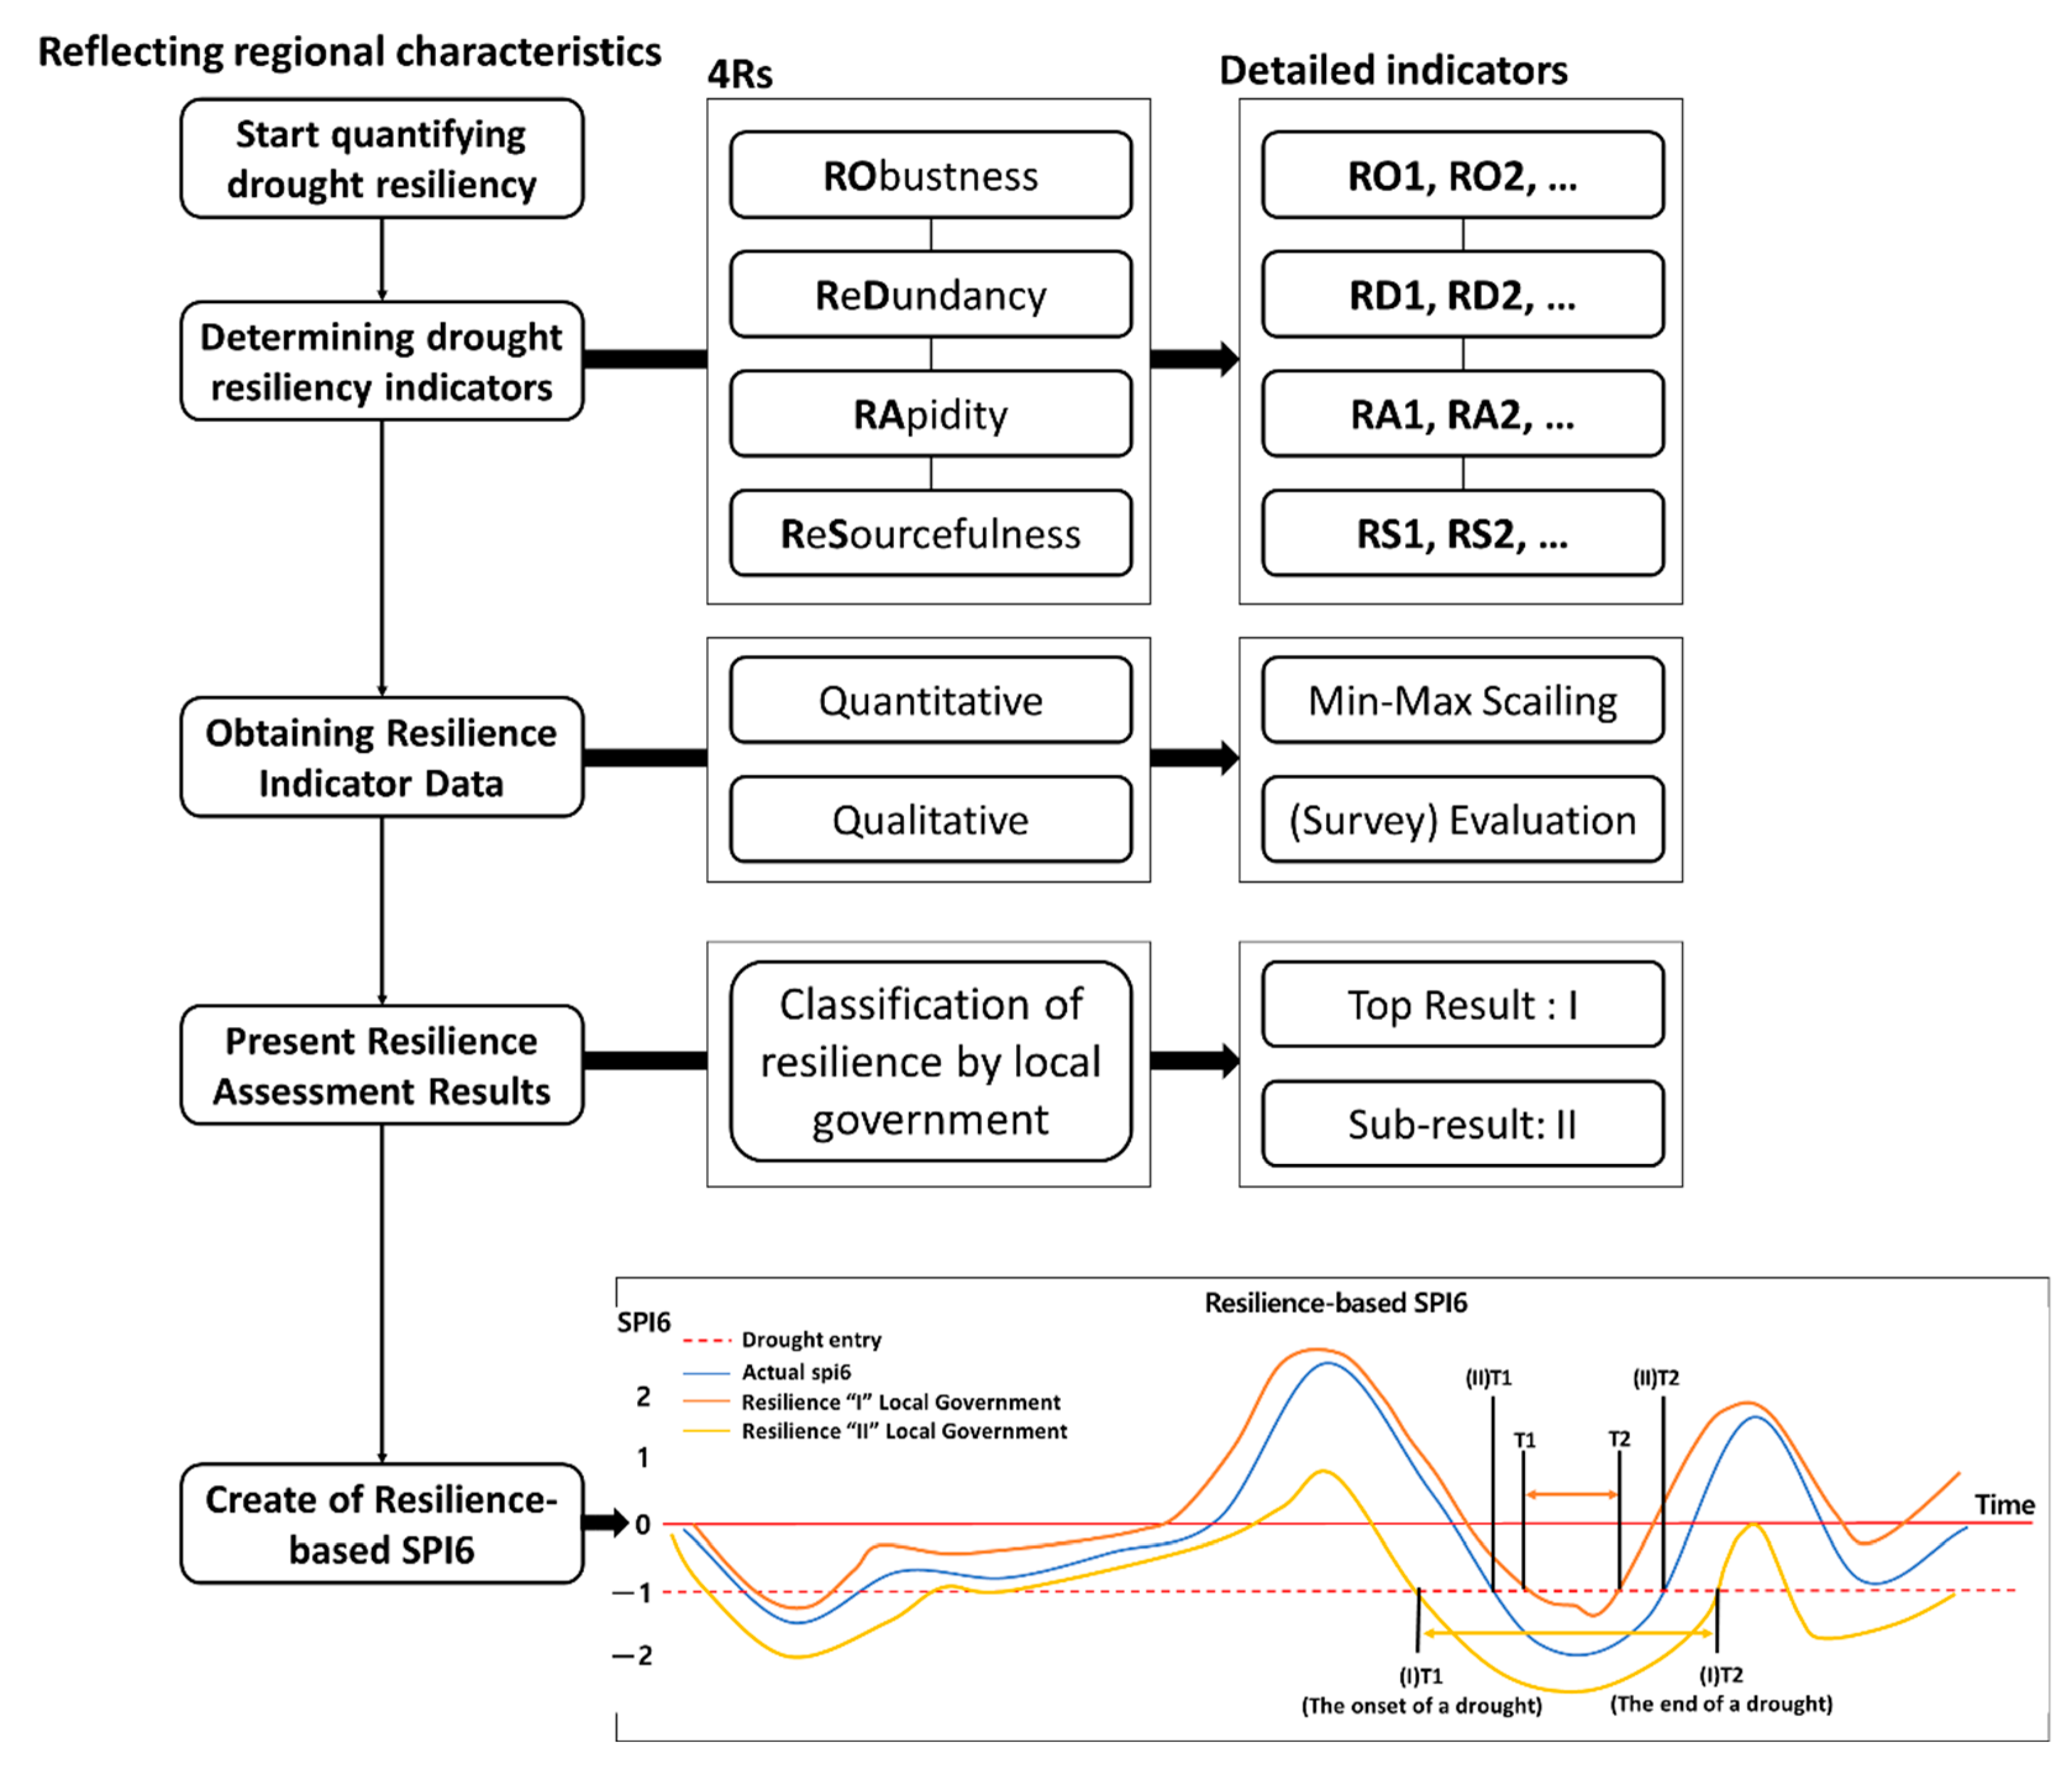
In the study, the procedure shown in Figure 1 was performed to evaluate drought resilience reflecting regional characteristics. It is necessary to select proper indicators that can take into account regional characteristics to derive regional drought resilience in preparation for drought. Drought resilience can be largely classified into four sub-categories: robustness, redundancy, resourcefulness, and rapidity (4Rs), and based on this, sub-indicators that can be distinguished regionally are created. Next, a plan for securing the indicators is prepared.
Drought resilience can be evaluated through quantitative data as well as qualitative data. Therefore, data of sub-indicators can be obtained not only numerically but also through interviews with public officials in charge of the local government. In this case, qualitative data was secured by conducting an in-depth questionnaire survey with local government officials in this study. After both quantitative and qualitative data are secured, scoring is performed through min-max scaling (normalization) between 0 and 1 points. Finally, it is subdivided by region based on the evaluated drought resilience results. For ratings, based on the average resilience value, local governments above average are classified as “Level I”, and local governments below average are classified as “Level II”. Resilience in Level I refers to the relatively high of resilience among all local governments. In the other words, the Level I group means that relatively adequate response to drought is possible, and Level II means relatively difficult response to drought. If the level is classified by the drought resilience evaluation result, it is used to create a standard precipitation index (SPI) curve based on resilience as shown in the figure at the bottom.
SPI is one of the meteorological drought indices, which is an indicator often used to describe general drought conditions. In addition, the SPI has classified drought by values derived as shown in Table 1. Based on this, the time of becoming moderate drought was assumed to be the time of entry into the drought (SPI < −1.00) in this study. If local governments of resilience Levels I and II are classified, the time of entry into the drought by the existing SPI is different for each stage of resilience, and the time of being released from drought is also different as shown in the resilience curve presented in Figure 1. The resilience curve is a new method proposed in this study from a new perspective to more practical reflect regional characteristics of resilience and can be written as follows: First, derive the slope of each point based on the actual SPI data of the local government. Next, if the resilience level is I, raise the slope by α times (in this study, a value of 1.1 is applied collectively). On the contrary, when the resilience level is derived as II, lower the slope by β times (in this study, a value of 0.9 is applied collectively). When all calculations are completed, the adjusted resilience SPI is derived based on the adjusted slope. For the basic SPI data, SPI6 data was used in this study, which is the most commonly used one in South Korea [27].
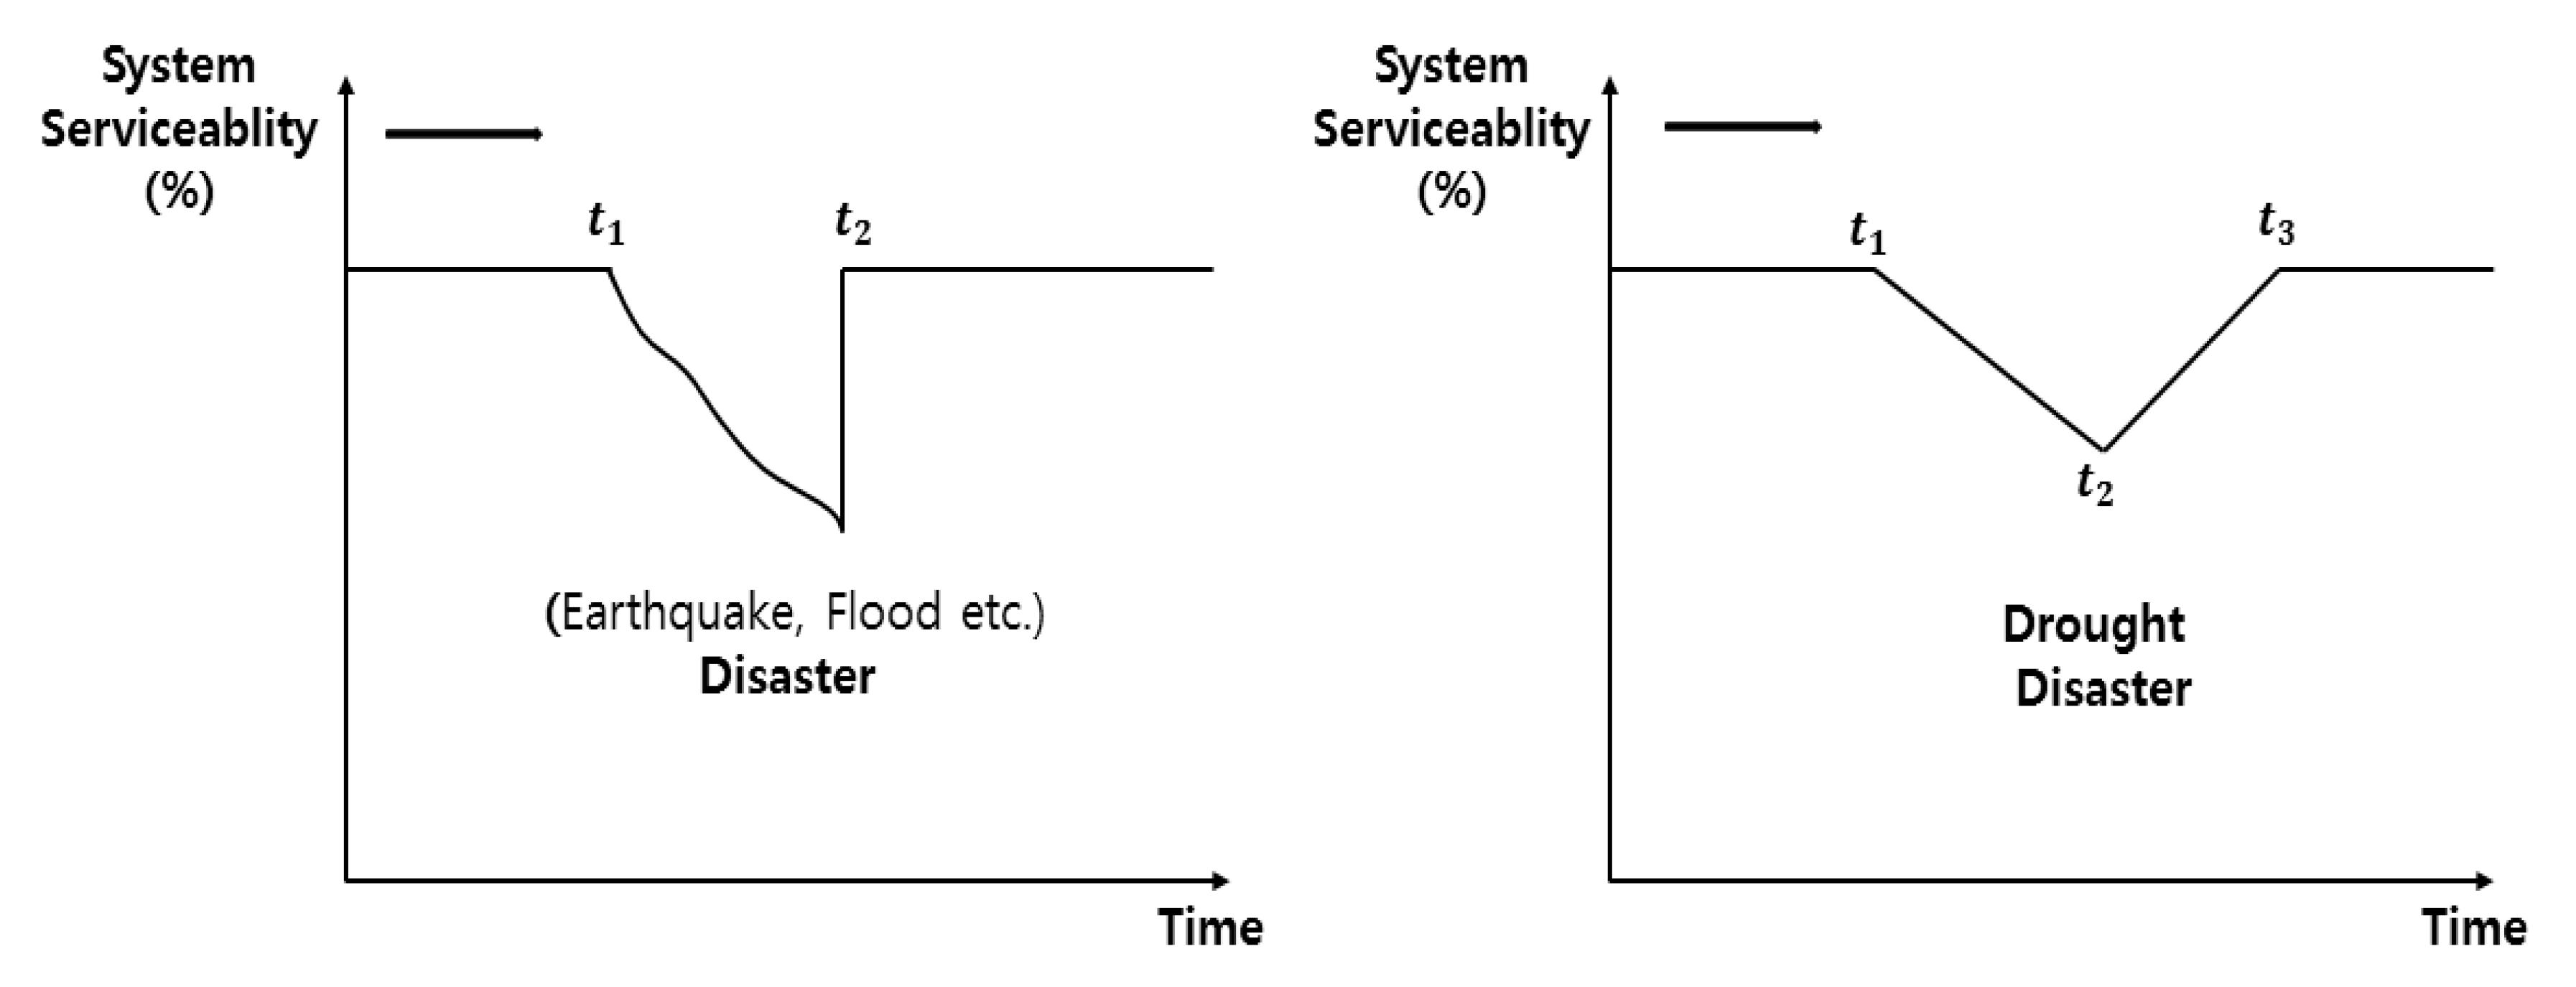
In general, the graph that the system applied concerning the disaster is restored is the same as shown in Figure 2. Figure 2 is a diagram showing the shape of the system’s performance being restored as a disaster occurs. When an earthquake or flood occurs, the performance of the system is rapidly degraded as large-scale damage is caused in a short time. It also gradually recovers since additional damage does not significantly affect the system performance compared to drought. On the other hand, a drought disaster occurs from a long-term perspective, and the damage from it occurs slowly for a long time compared to other disasters, and it also takes a long time to be relieved from drought. A large-scale degradation does not occur from the point of view of the system’s performance, but various damages may occur as it persists for a long time. From this point of view, the concept of the proposed resilience curve is considered to have sufficient utility in drought disasters.
2.2. Determining Drought Resilience Indicators
The detailed indicators for evaluating drought resilience established in this work are presented in Appendix A, Appendix B, Appendix C, and Appendix D. We establish five indicators from RO1 to RO5 for the inherent function (robustness) that withstand a given dry level under initial stability (Appendix A). The concepts of redundancy and resourcefulness establish five indicators each in the event of a disaster (Appendix B, and Appendix C) and whether nearby resources can be utilized if the system is compromised. Finally, rapidity has set three indicators regarding the system’s rapid restoration capabilities (Appendix D). The 18 indicators corresponding to 4Rs were determined to be suitable for Korea. Eighteen resilience indicators were again converted into 29 computable detailed indicators. The source and method of calculation for that detailed indicator are specified in the Appendix A, Appendix B, Appendix C, and Appendix D.
The 29 detailed indicators given above require data to be obtained to perform drought resilience assessments and converted to more detailed indicators if necessary. Accordingly, appropriate detailed indicators that can be explained for each indicator have been set. Among them, there were a total of 9 data that were not presented numerically (RD1). Availability of water resources in the surrounding area, (RS3) availability of drought prediction and warning systems, etc.), and an in-depth survey was conducted through questionnaires for more accurate resilience evaluation. The survey was conducted on one local government official in charge of disasters, and 160 public officials from 160 local governments were selected as the subjects of the survey, and the questionnaire consisted of score evaluation queries ranging from 0 to 5 points. The result of the survey for each question was converted into a score between 0 and 1 point through Equation (1), and a maximum of 1 point was derived for each index, and the maximum value of the score result of the qualitative resilience evaluation was summed up to be 9 points. Here, X means the score that the official in charge responded to by the survey.
As for the indicators that can be derived quantitatively, there were 9 indicators, the same as the qualitative indicators. Table 2 presents the calculation method for each detailed indicator. A regularization equation such as Equation (2) was used to make 1 point based on 1 indicator for all quantitative indicators. Here, if there are 3 sub-indicators of one indicator, each weight is divided into 3 equal parts and 1 point is obtained, and the total sum of the final quantitative indicators is 9 points. Here, X means the value of the quantitative sub-indicator.
Therefore, there are total of 20 quantitative indicators, and if both quantitative and qualitative indicators are combined, there are a total of 28 indicators. All the proposed indicators were used to quantify drought resilience in this study. However, the priority goal of this study is to propose sub-indicators and analyze the results to present a plan to utilize the concept of resilience to quantify drought resilience that has not been applied to Korea, the weights of the derived quantitative and qualitative drought resilience indicators were assumed to be the same. Of course, an in-depth interview was conducted on the qualitative indicators, but since there is ample room for personal opinions to be reflected, the weight calculation is considered required through further research in the future.
3. Application and Results
3.1. Target Region
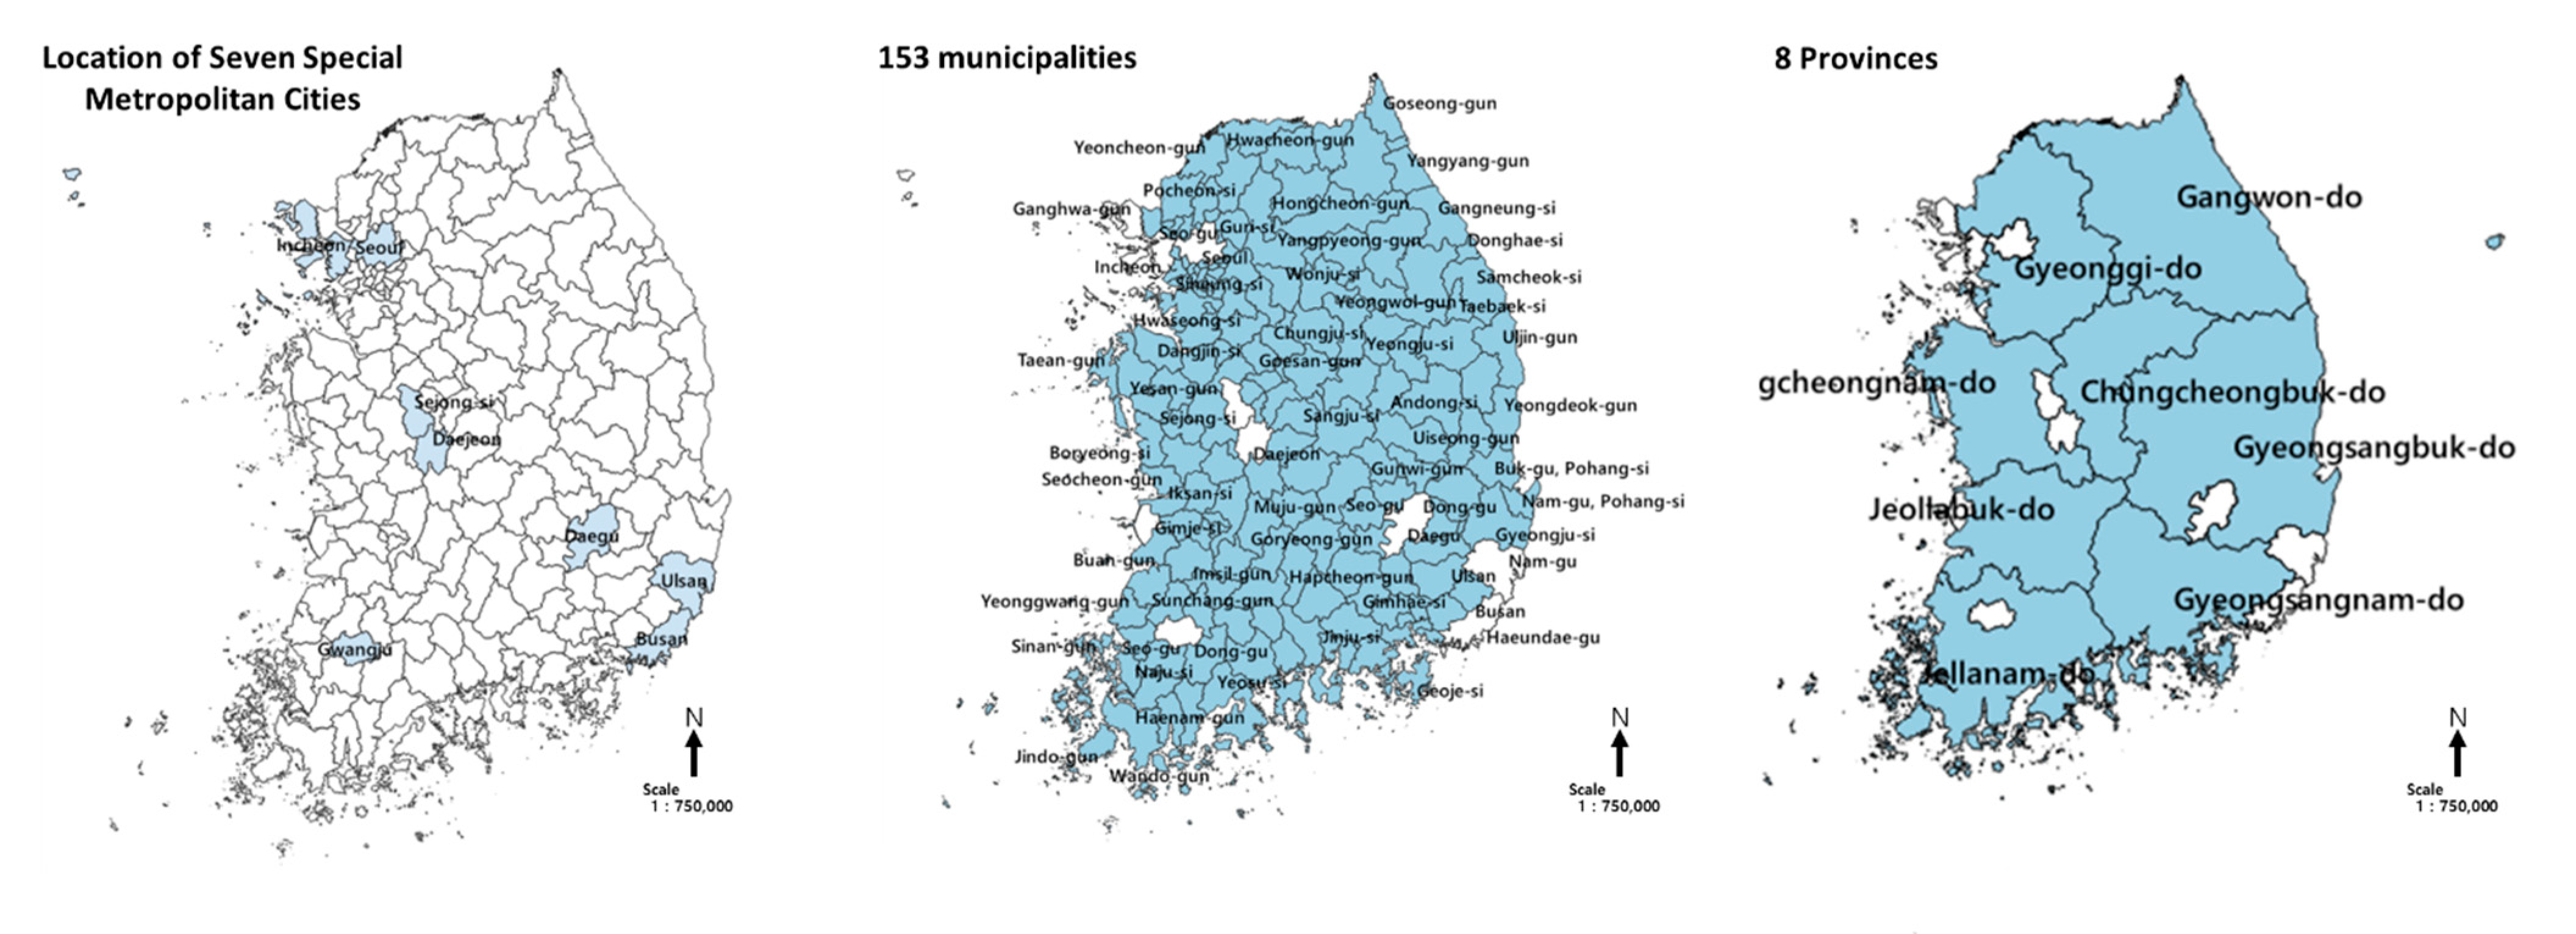
In this study, Korea was selected as the target region, to which the concept of drought resilience has not been applied as described above. Korea is divided into seven metropolitan cities and 153 municipalities (Figure 3). Recently, the population has been concentrated in large cities with aging population. In addition, due to the nature of Korea, GRDP and the size of the disaster management system and organization in metropolitan cities are higher than in other municipalities. Therefore, the evaluation of 160 local governments, including special metropolitan cities, may result in a tendency to bias the results due to the high resilience value of special metropolitan cities. Therefore, in this study, drought resilience was quantified by dividing it into seven metropolitan cities and 153 municipalities. Furthermore, the drought resilience quantification was performed for eight provinces.
3.2. Drought Resilience Evaluation Results (Nationwide)
3.2.1. Drought Resilience Evaluation Results (Metropolitan Cities; 7 Locations)
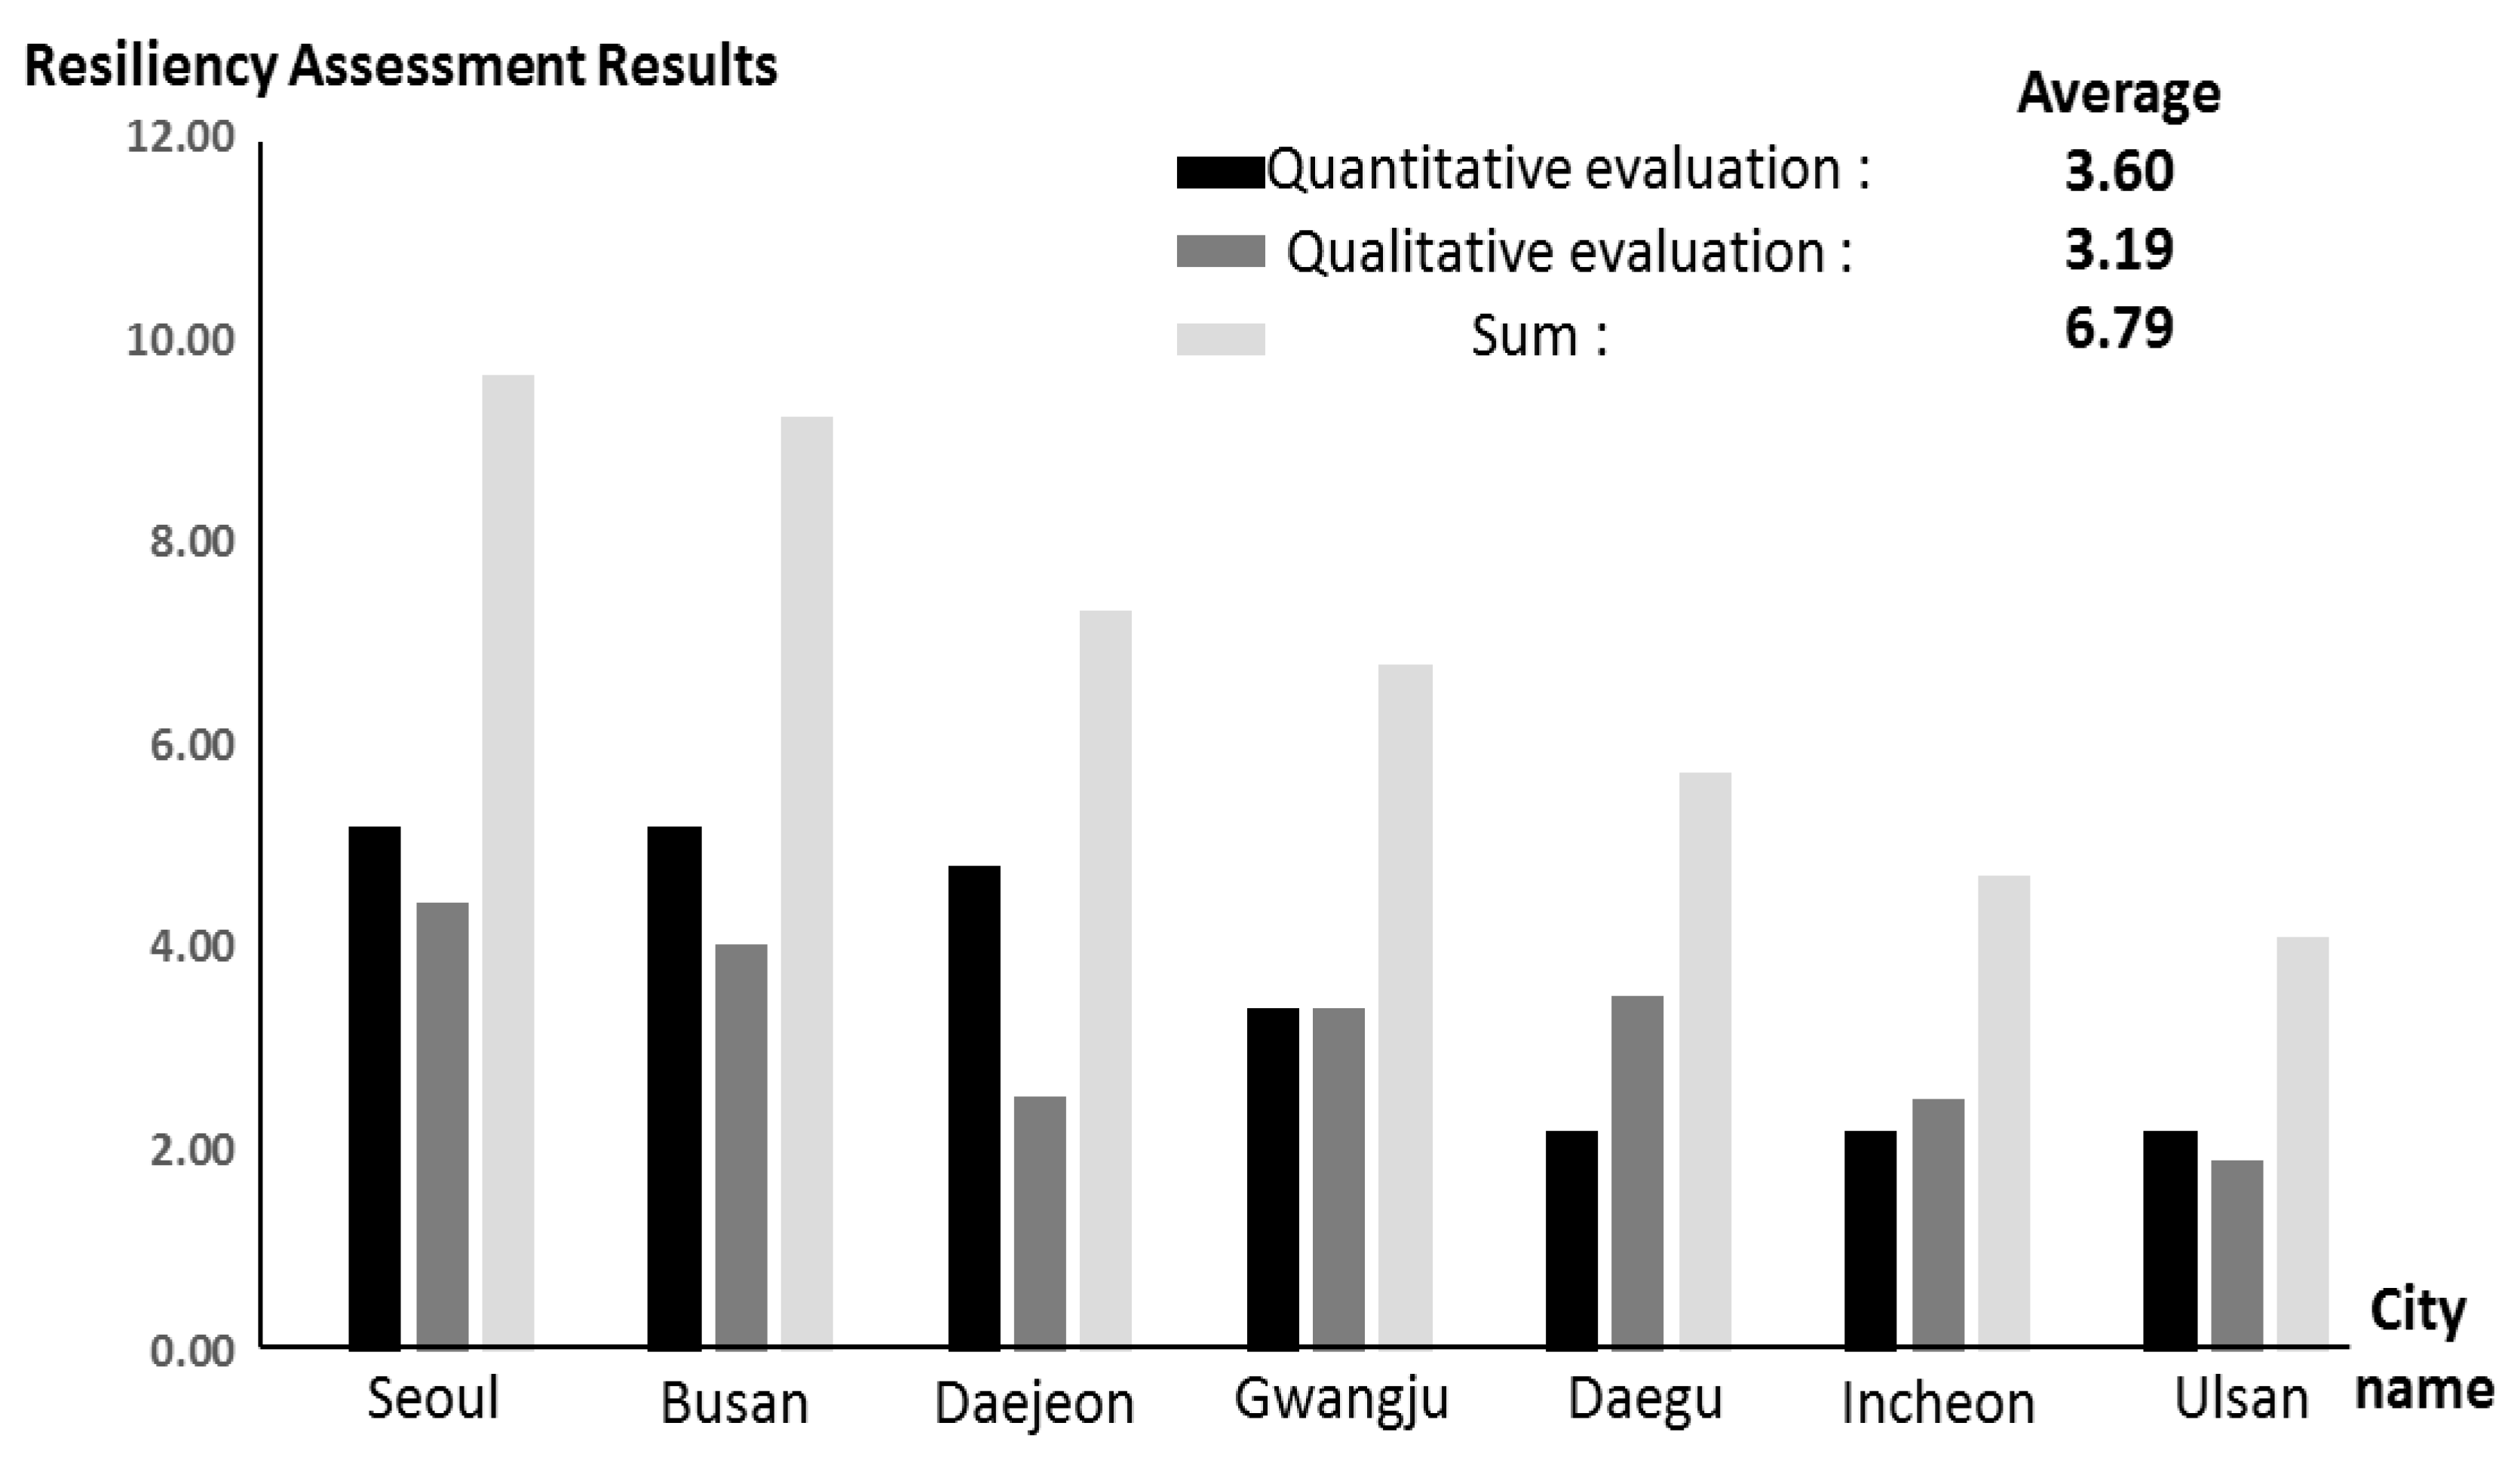
The results of drought resilience evaluation in metropolitan cities of Korea based on 18 quantitative and qualitative indicators are the same as in Table 3 and Figure 4. Seoul obtained the highest score, and in particular, very high results were found in the RO2 (regional economic vulnerability) and RA1 (regional population). However, a relatively low score was derived in the RD2 (groundwater resource availability) due to the characteristics of large cities.
The average of the qualitative resilience evaluation results was 3.60. According to the evaluation result by resilience item, although RS5 (specificity of an organizational management plan for drought) was relatively high, indicators such as RS4 (whether there is a drought vulnerability map) and RD4 (whether there is a priority for water allocation in case of drought) were low in general. There is an organization to respond to drought, but it is judged that the indicators related to prevention and preparation, such as specific training, are relatively low. Therefore, the capability of the response organization structure for recovery after a drought is considered high, but the specific capability related to the items concerning prevention of drought is considered relatively low. Seoul and Busan Metropolitan City appeared to have high levels of awareness of drought, enabling rapid response.
As previously defined, the derived resilience evaluation results were used to divide the drought resilience curve into Level I and II based on the average value. As a result, four metropolitan cities, including Seoul and Busan, belonged to Level I, and two other local governments, including Daegu, belonged to Level II. However, although the quantitative results are relatively low compared to other local governments, the resilience level may change due to qualitative evaluation results, like Daejeon Metropolitan City. Since the result of the qualitative evaluation is derived from a survey for one public official in charge, it may be difficult to give a practical meaning. This result was used as it is in this study since the primary goal is to propose a direction of application of drought resilience evaluation, but in the future, it will be necessary to analyze through weight setting for each indicator based on more in-depth discussion.
3.2.2. Drought Resilience Evaluation Results (City and County Region; 153 Locations)
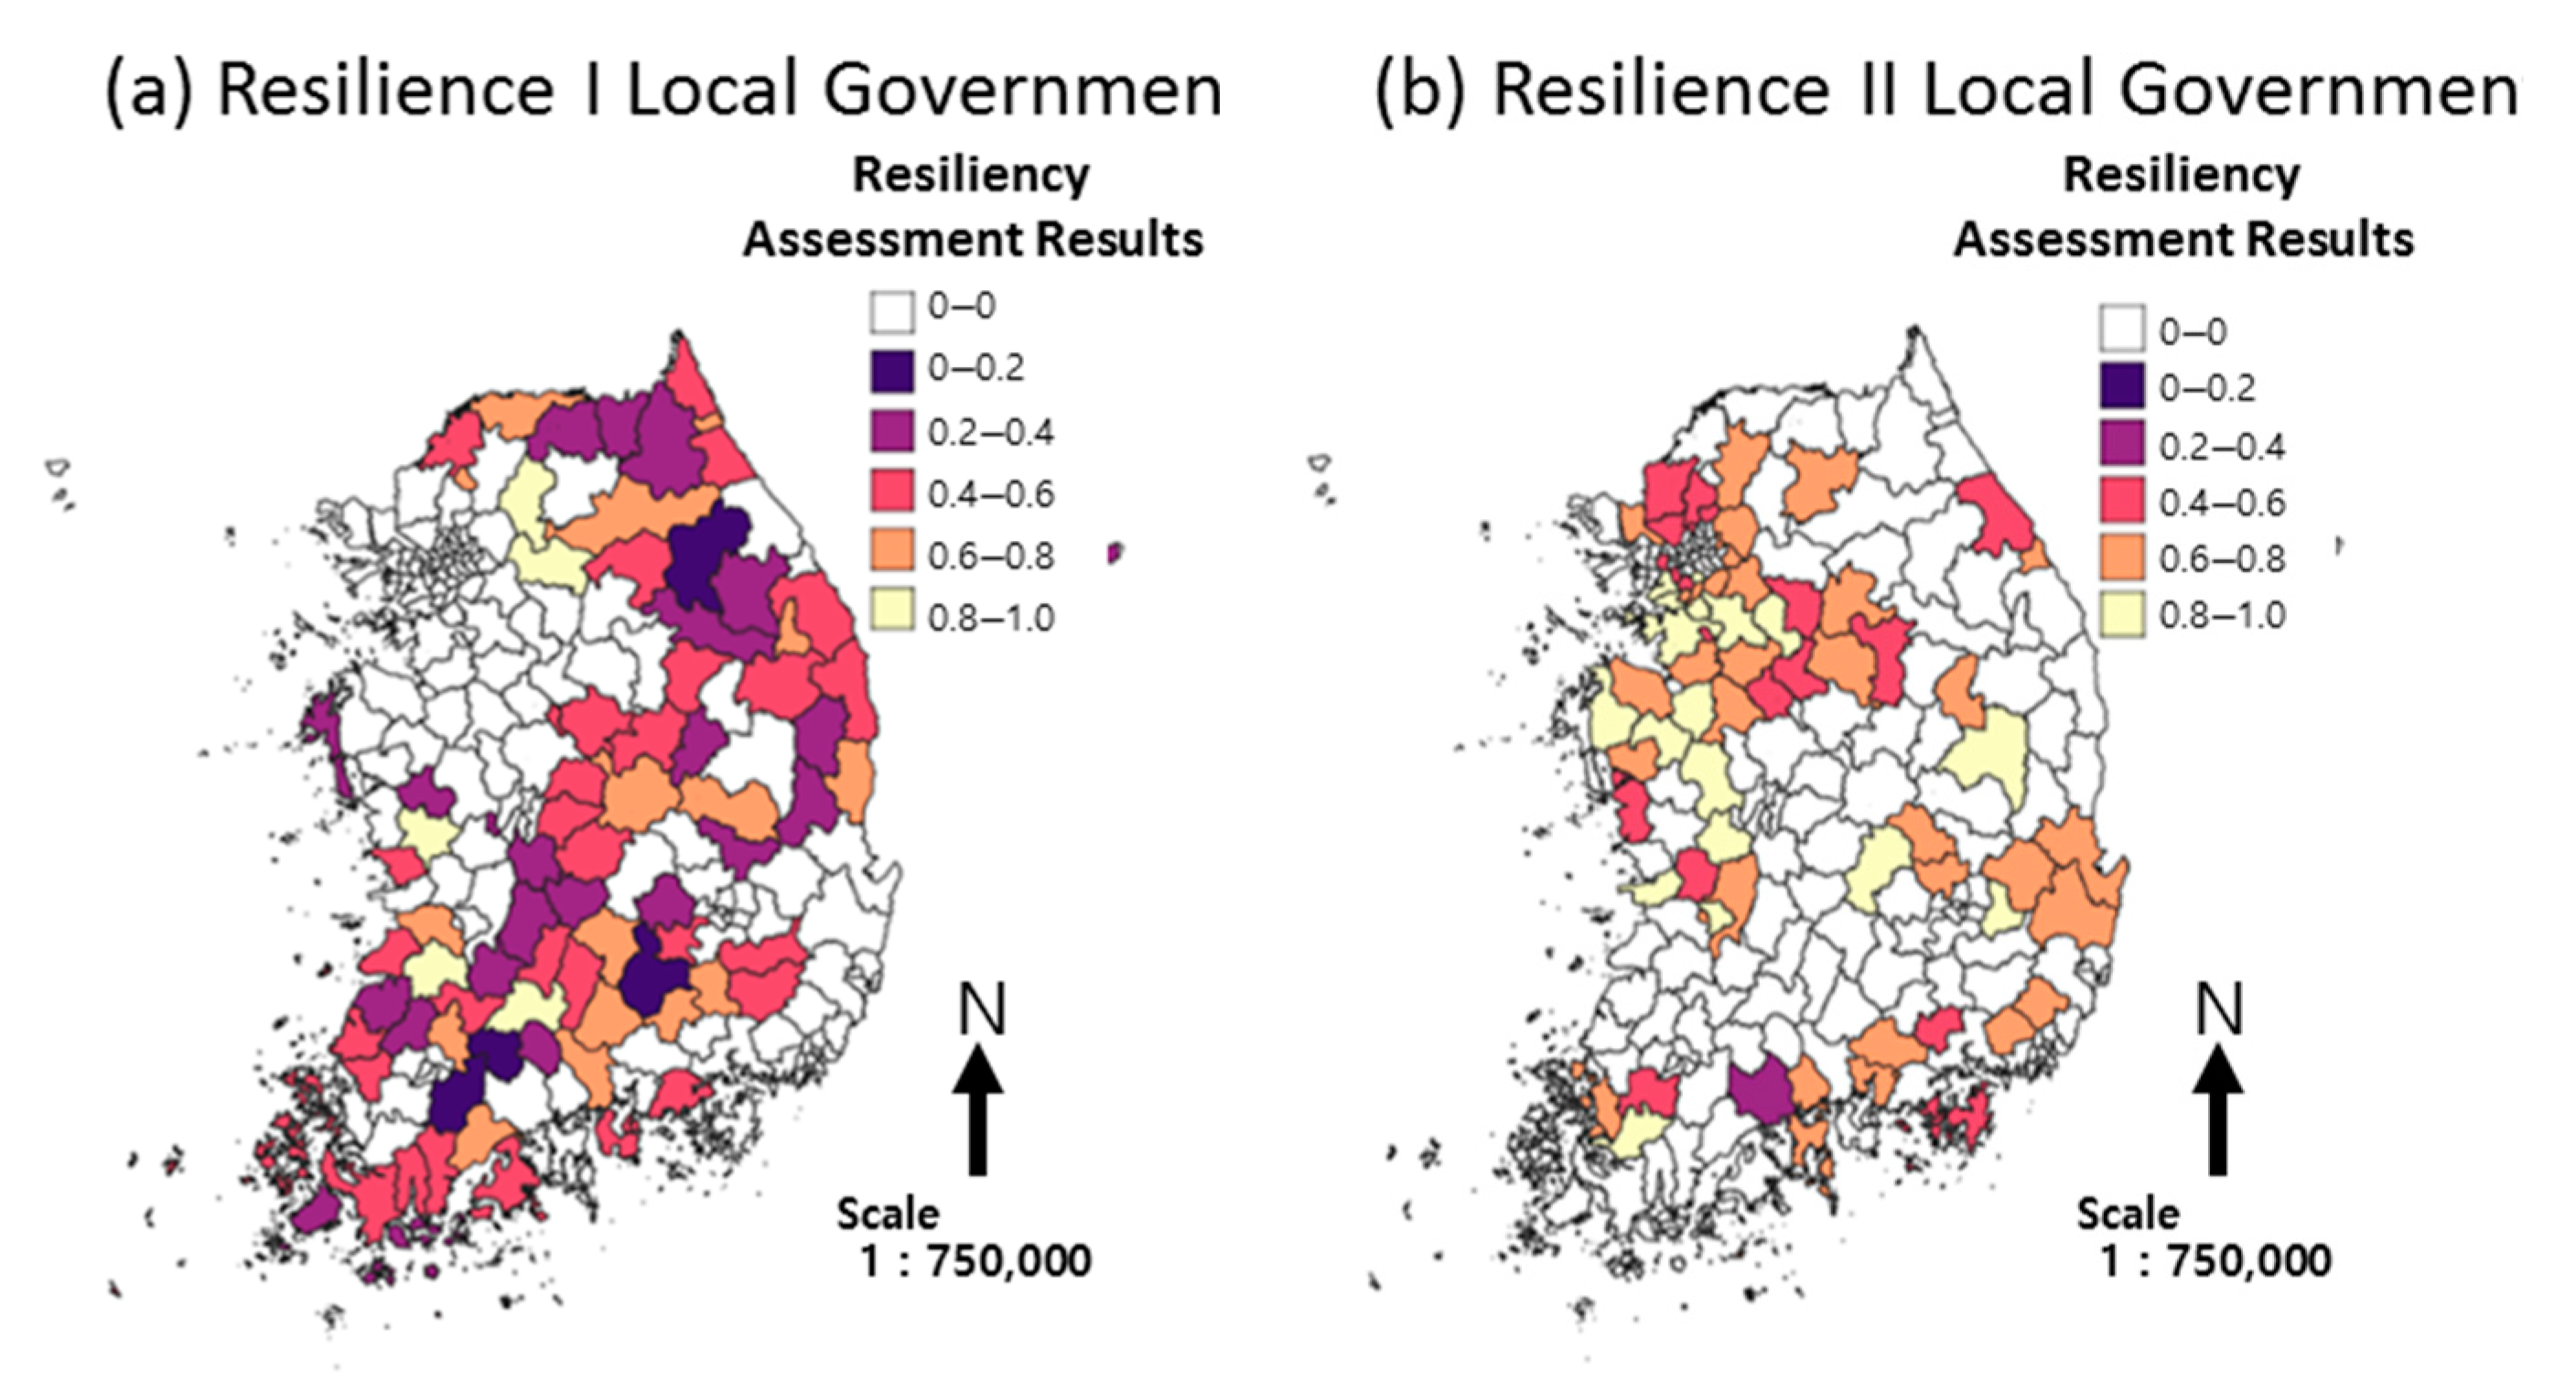
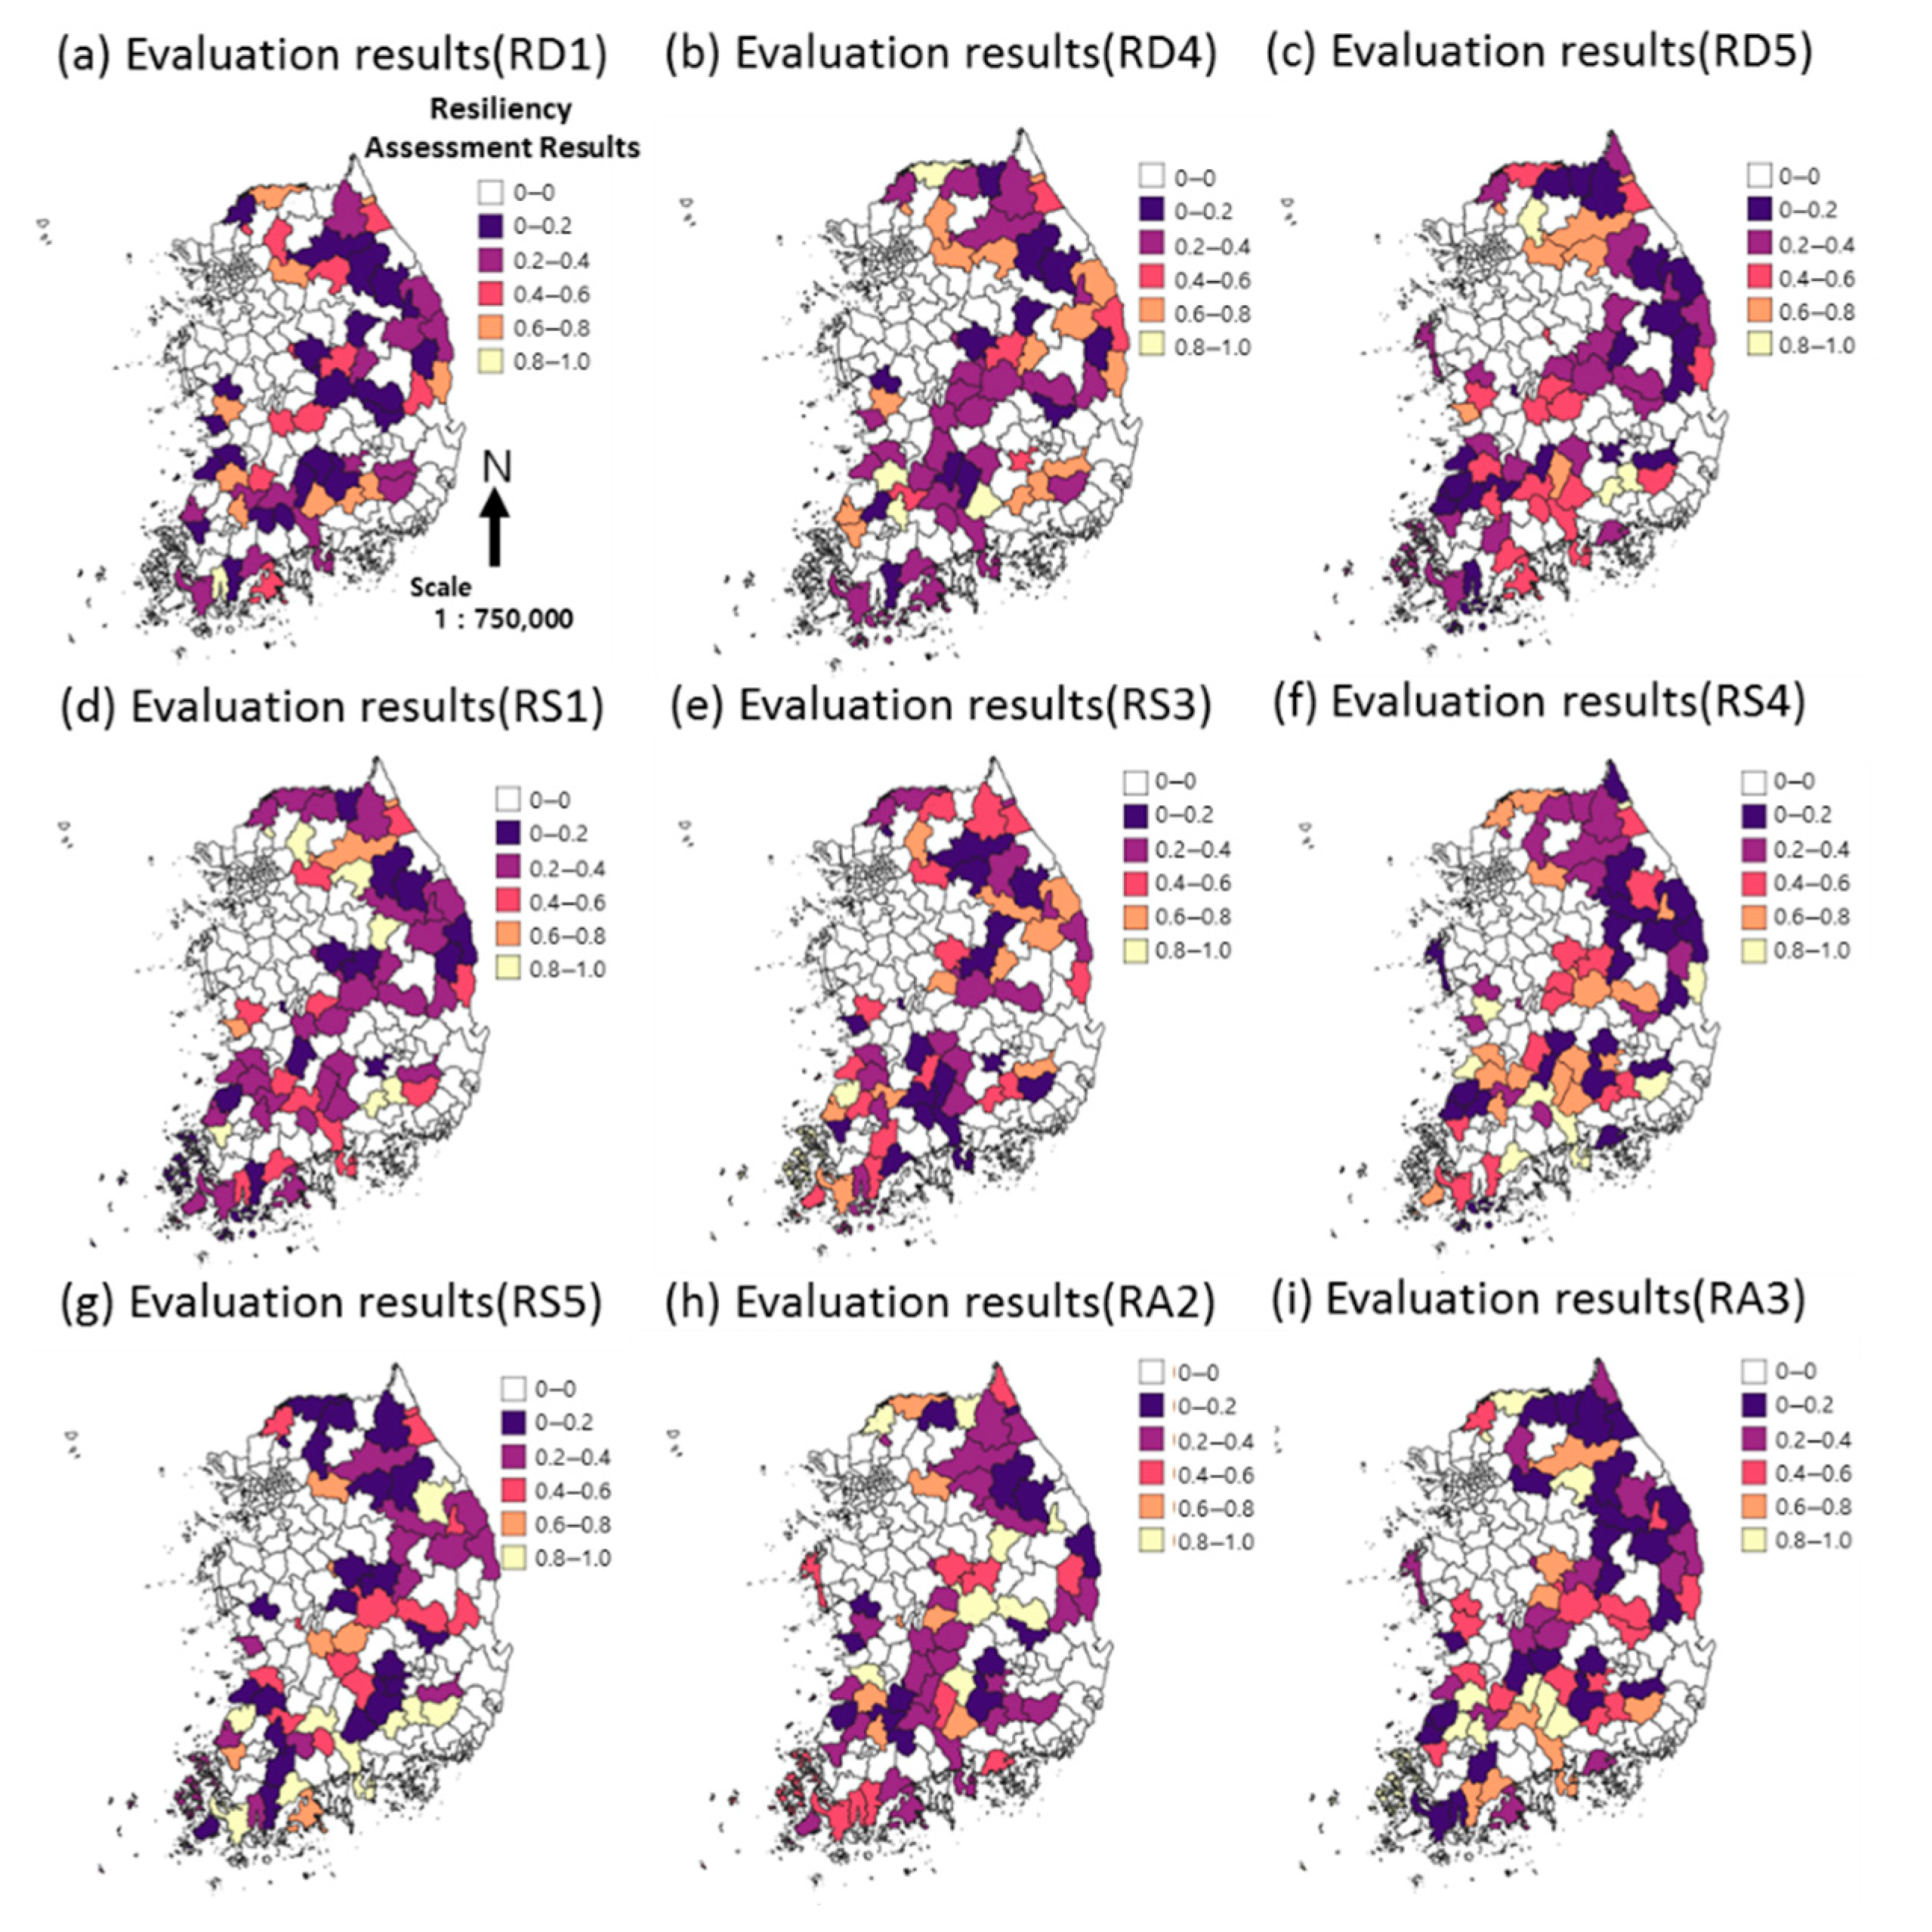
The evaluation of drought resilience was conducted on 153 municipalities and seven metropolitan cities, and the evaluation of resilience classified in the same manner as the evaluation of metropolitan cities is as shown in Table 4. Based on the average overall drought resilience assessment, Level I was determined to be 72 municipalities and Level II to be 81. As a result of the qualitative evaluation, the Level I local governments had a lower coefficient of variation than those corresponding to II, and the average value was also evaluated as high as 1.5 times. This means that the qualitatively derived values (B) by the investigation have greater deviation than the results by quantitative indicators. Therefore, it is determined that a weight should be applied to future qualitative assessments. In addition, based on Figure 5a,b, it was confirmed that local governments in the southern region and Gang-won-do region have Level I and that other urban regions and neighboring local governments have Level II. The recent droughts of 2014–2015 and 2017 in Korea occurred frequently in the south-central and northeast regions, and most of the local governments in the region were found to have Level I. This can be explained by the results of qualitative indicators. Since disaster officials of local governments who have experienced frequent droughts are likely to have accumulated various stresses related to drought, they have likely performed a high-scoring drought resilience evaluation. The above could be proved based on the following reasons: the availability of drought prediction and alarm systems (RS3) or RS5 (specificity of organizational management plans for droughts) can be supplemented by the frequency of droughts. This area is an area where existing droughts occur frequently, and an alarm system is needed along with drought forecasting. As a result, it was determined that a higher-quality system would be established compared to other local governments and was consistent with the results. In particular, RA3 (public perception and level of understanding of the concept of drought) was evaluated higher than that of other local governments (Figure 6).
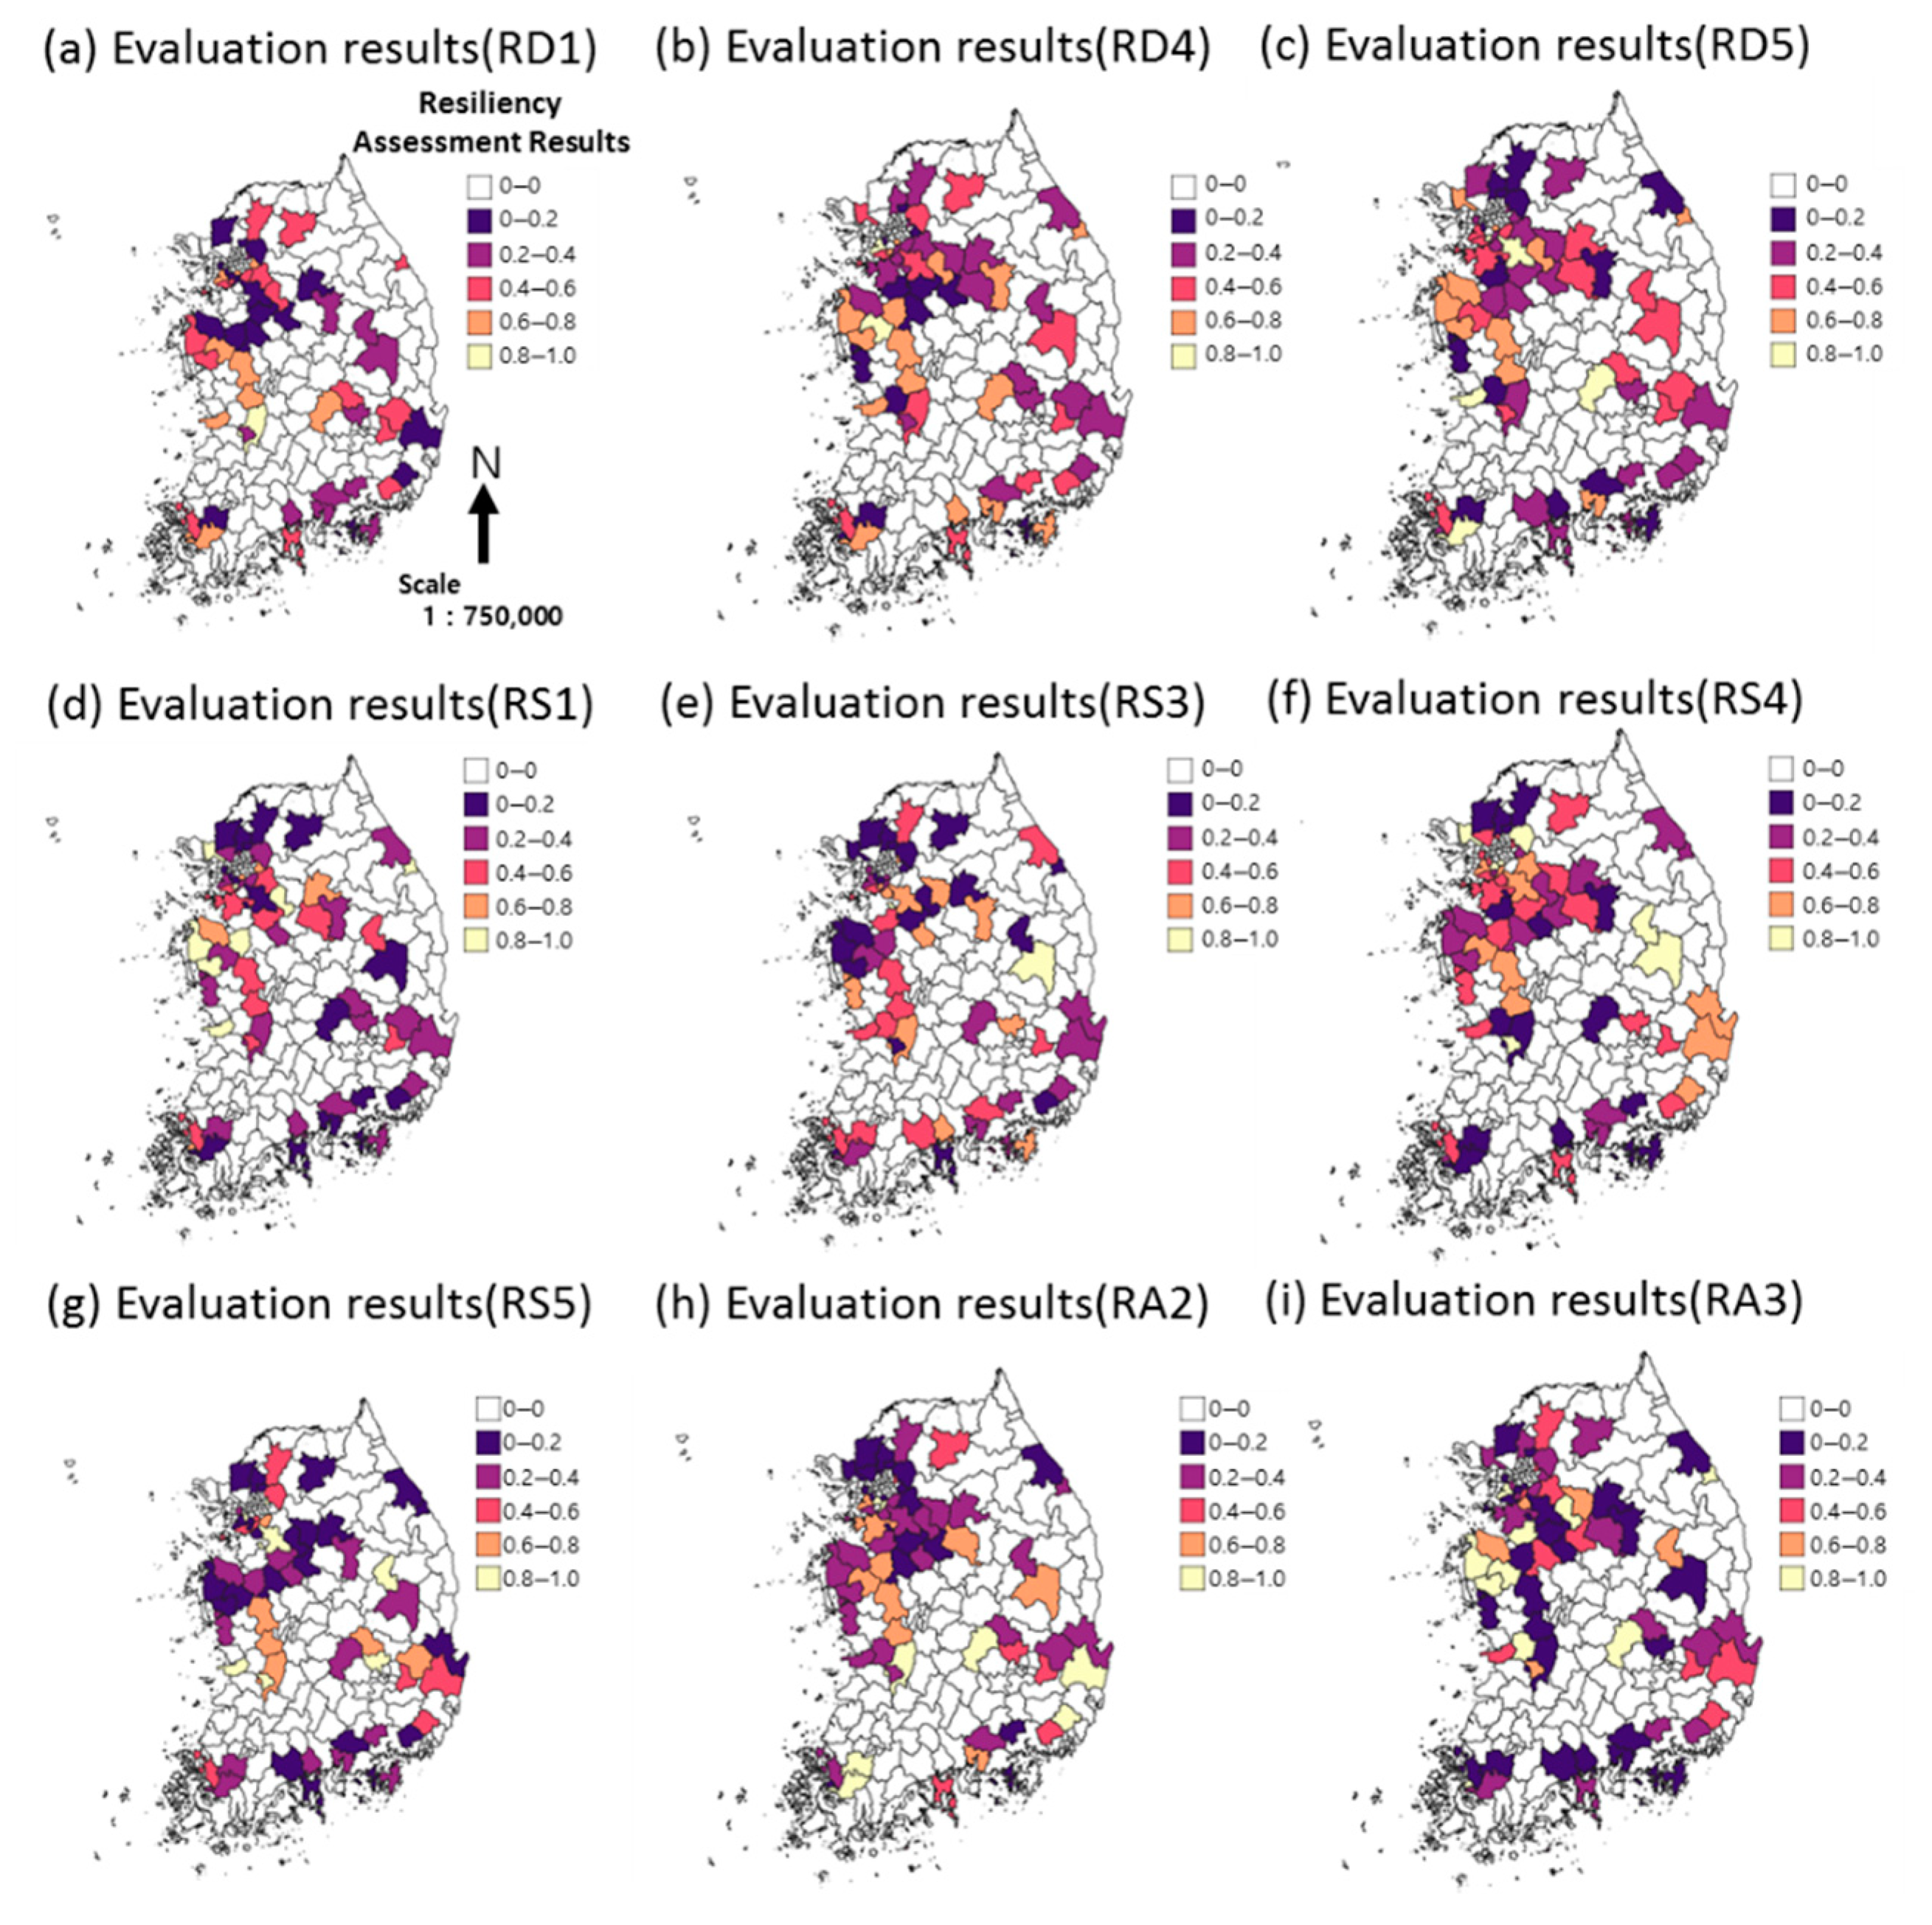
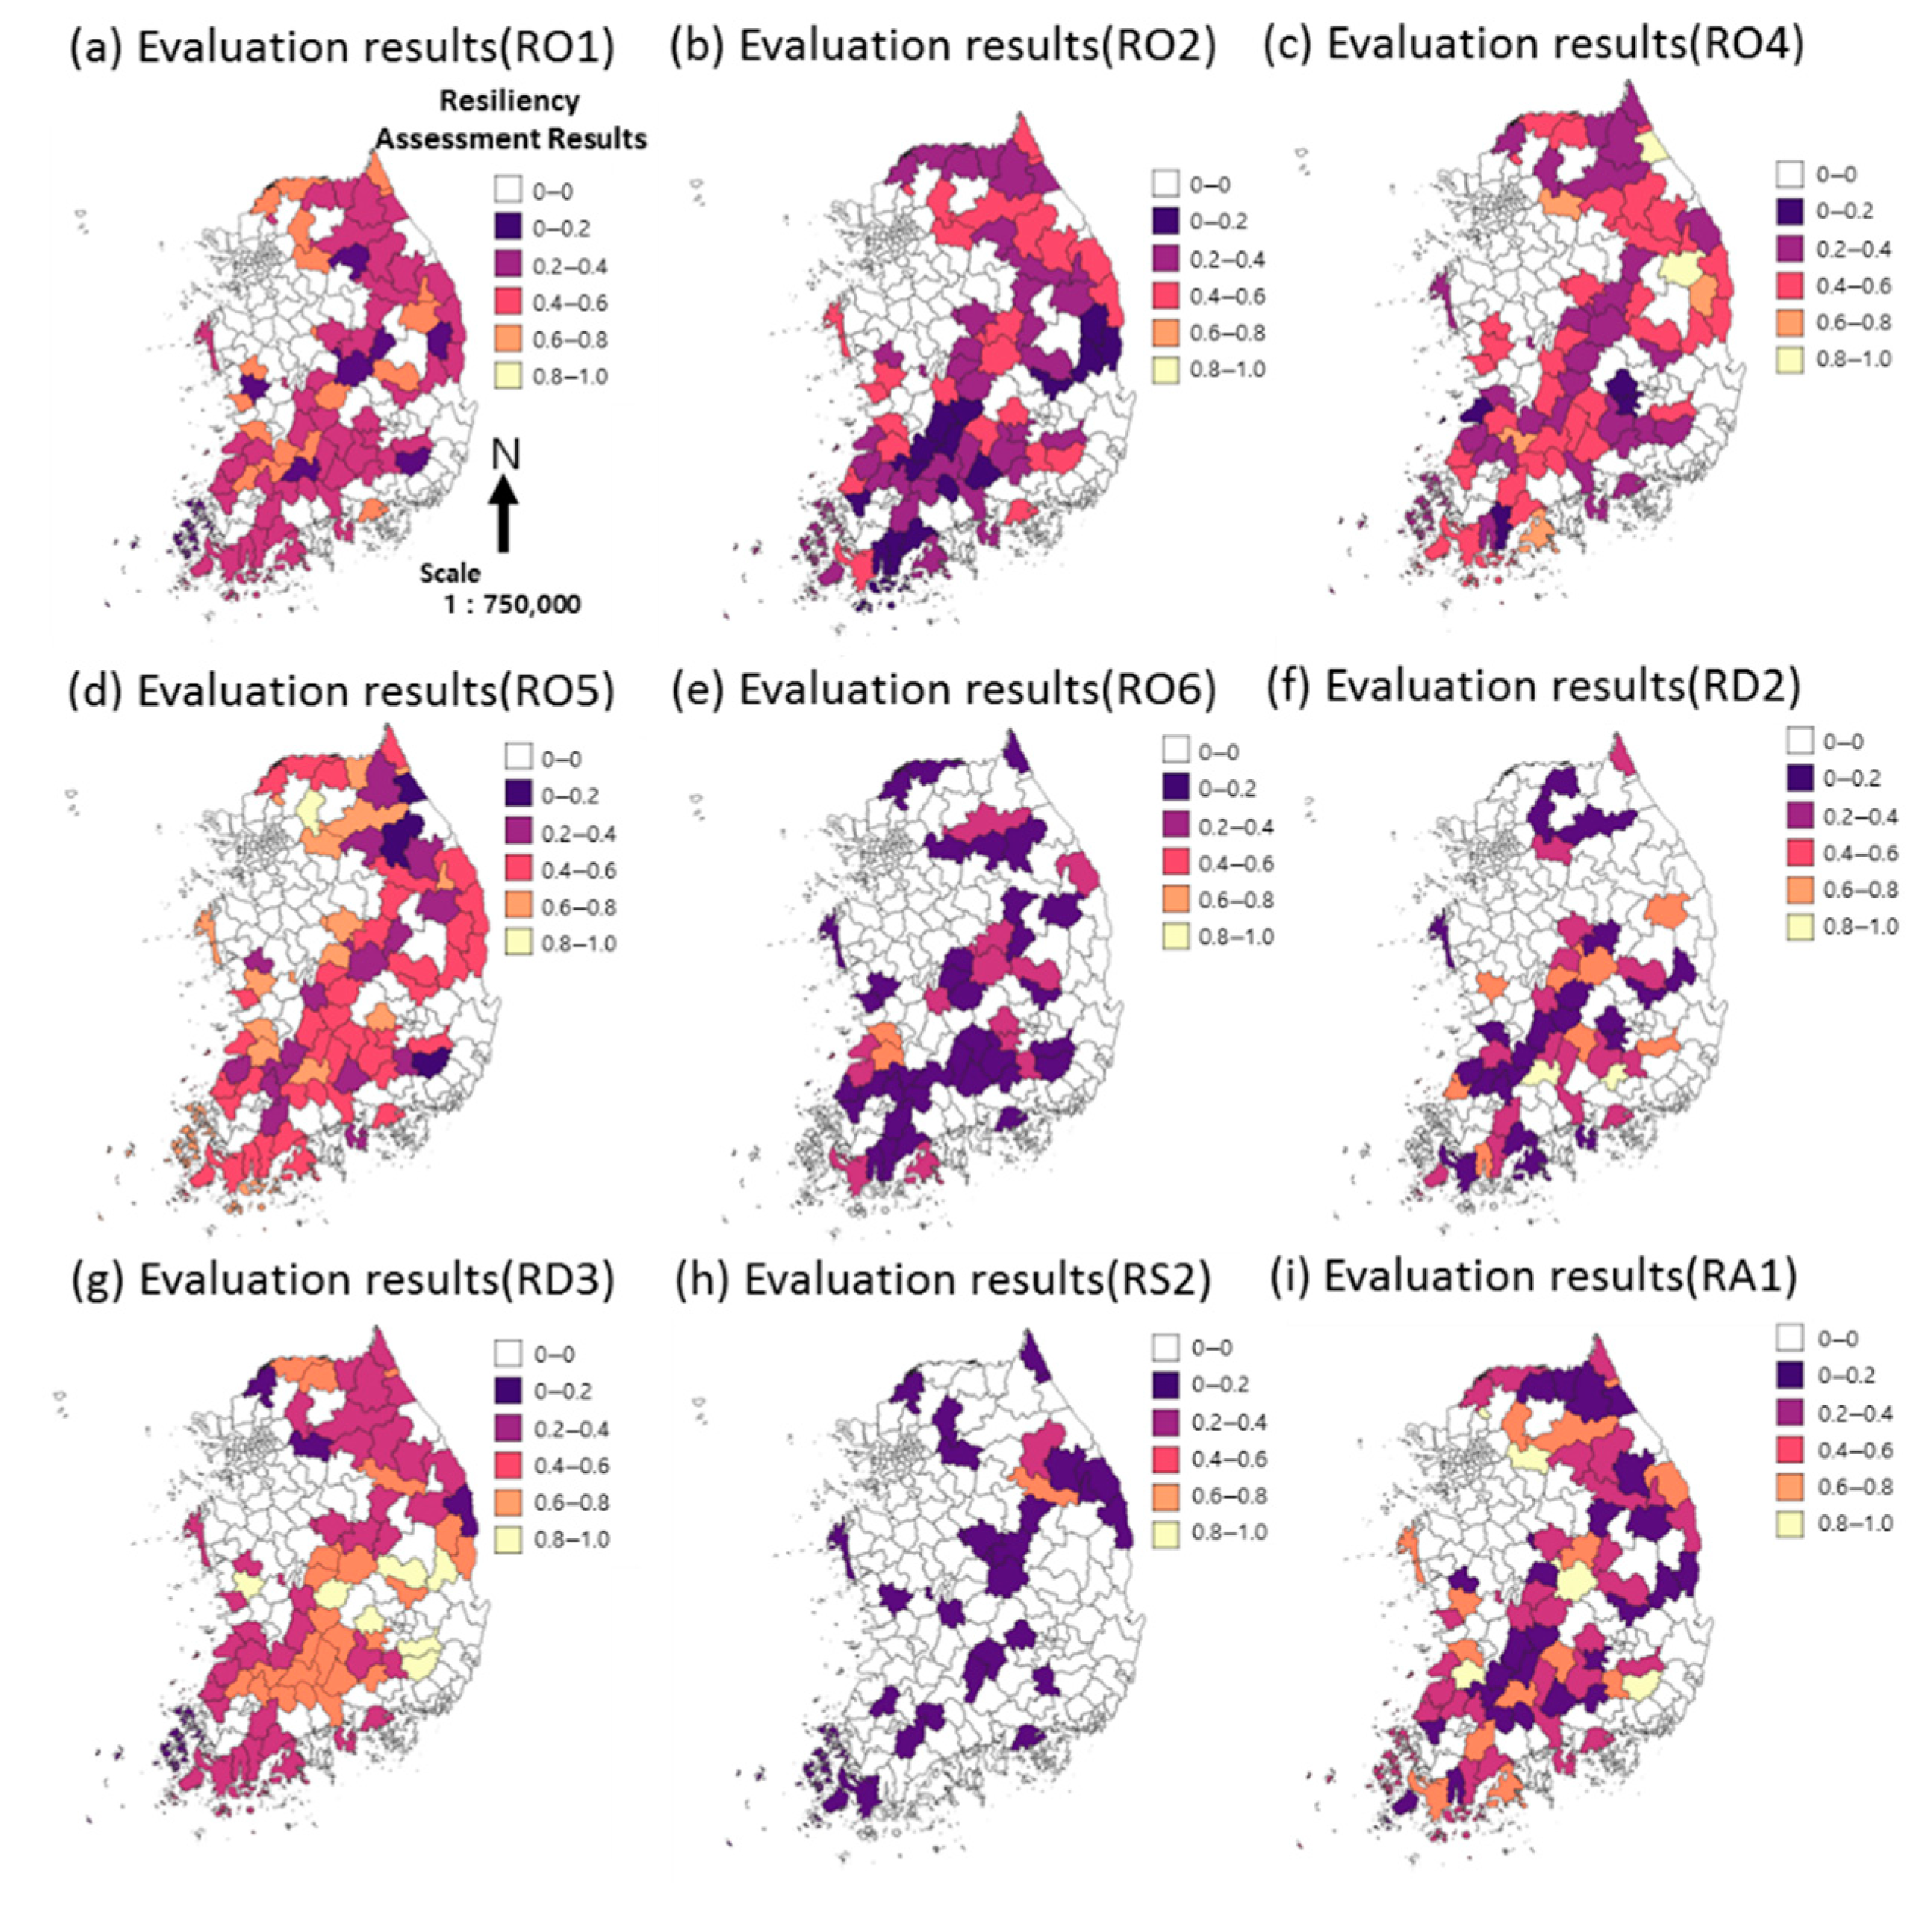
As a result of the quantitative indicator evaluation, the difference between the average of the local governments in resilience Level I (2.70) and the average of the local governments in Level II (2.49) was not significantly greater than the difference from the qualitative indicators. This means that it did not have a significant impact compared to the qualitative indicators, which may have high variability, as explained earlier in the evaluation of drought resilience in metropolitan cities. In particular, there have been cases in which the local governments in some places (southern, northeast) belonged to the resilience Level I as a result of qualitative evaluation even though the quantitative indicator is below average (Figure 7, Figure 8 and Figure 9). Local governments in the resilience Level I had relatively higher RO2 (regional economic vulnerability) and RA1 (local population) than those in the resilience Level II. However, quantitative indicators such as RO2 (regional economic vulnerability), RD3 (water resource management method), and RA1 (regional population) showed higher results than that of the local governments of Level I.
The main purpose of the drought resilience evaluated in this study was to establish drought resilience indicators that can reflect the characteristics of local governments and discuss ways to use them rather than the analysis of the results of resilience evaluation for a specific local government in Korea, hence, detailed discussions on each indicator for local governments were not performed. However, when establishing a guideline for actual preparation and response to drought in the future based on the drought resilience evaluation performed previously, it is believed that such a drought resilience assessment can be conducted to develop a strategy that can be strengthened locally. Of course, sufficient discussion on weight sets will be needed in the future since appropriate weights should be assigned to each of the proposed indicators for each region.
3.3. Drought Resilience Evaluation (“Province” Unit)
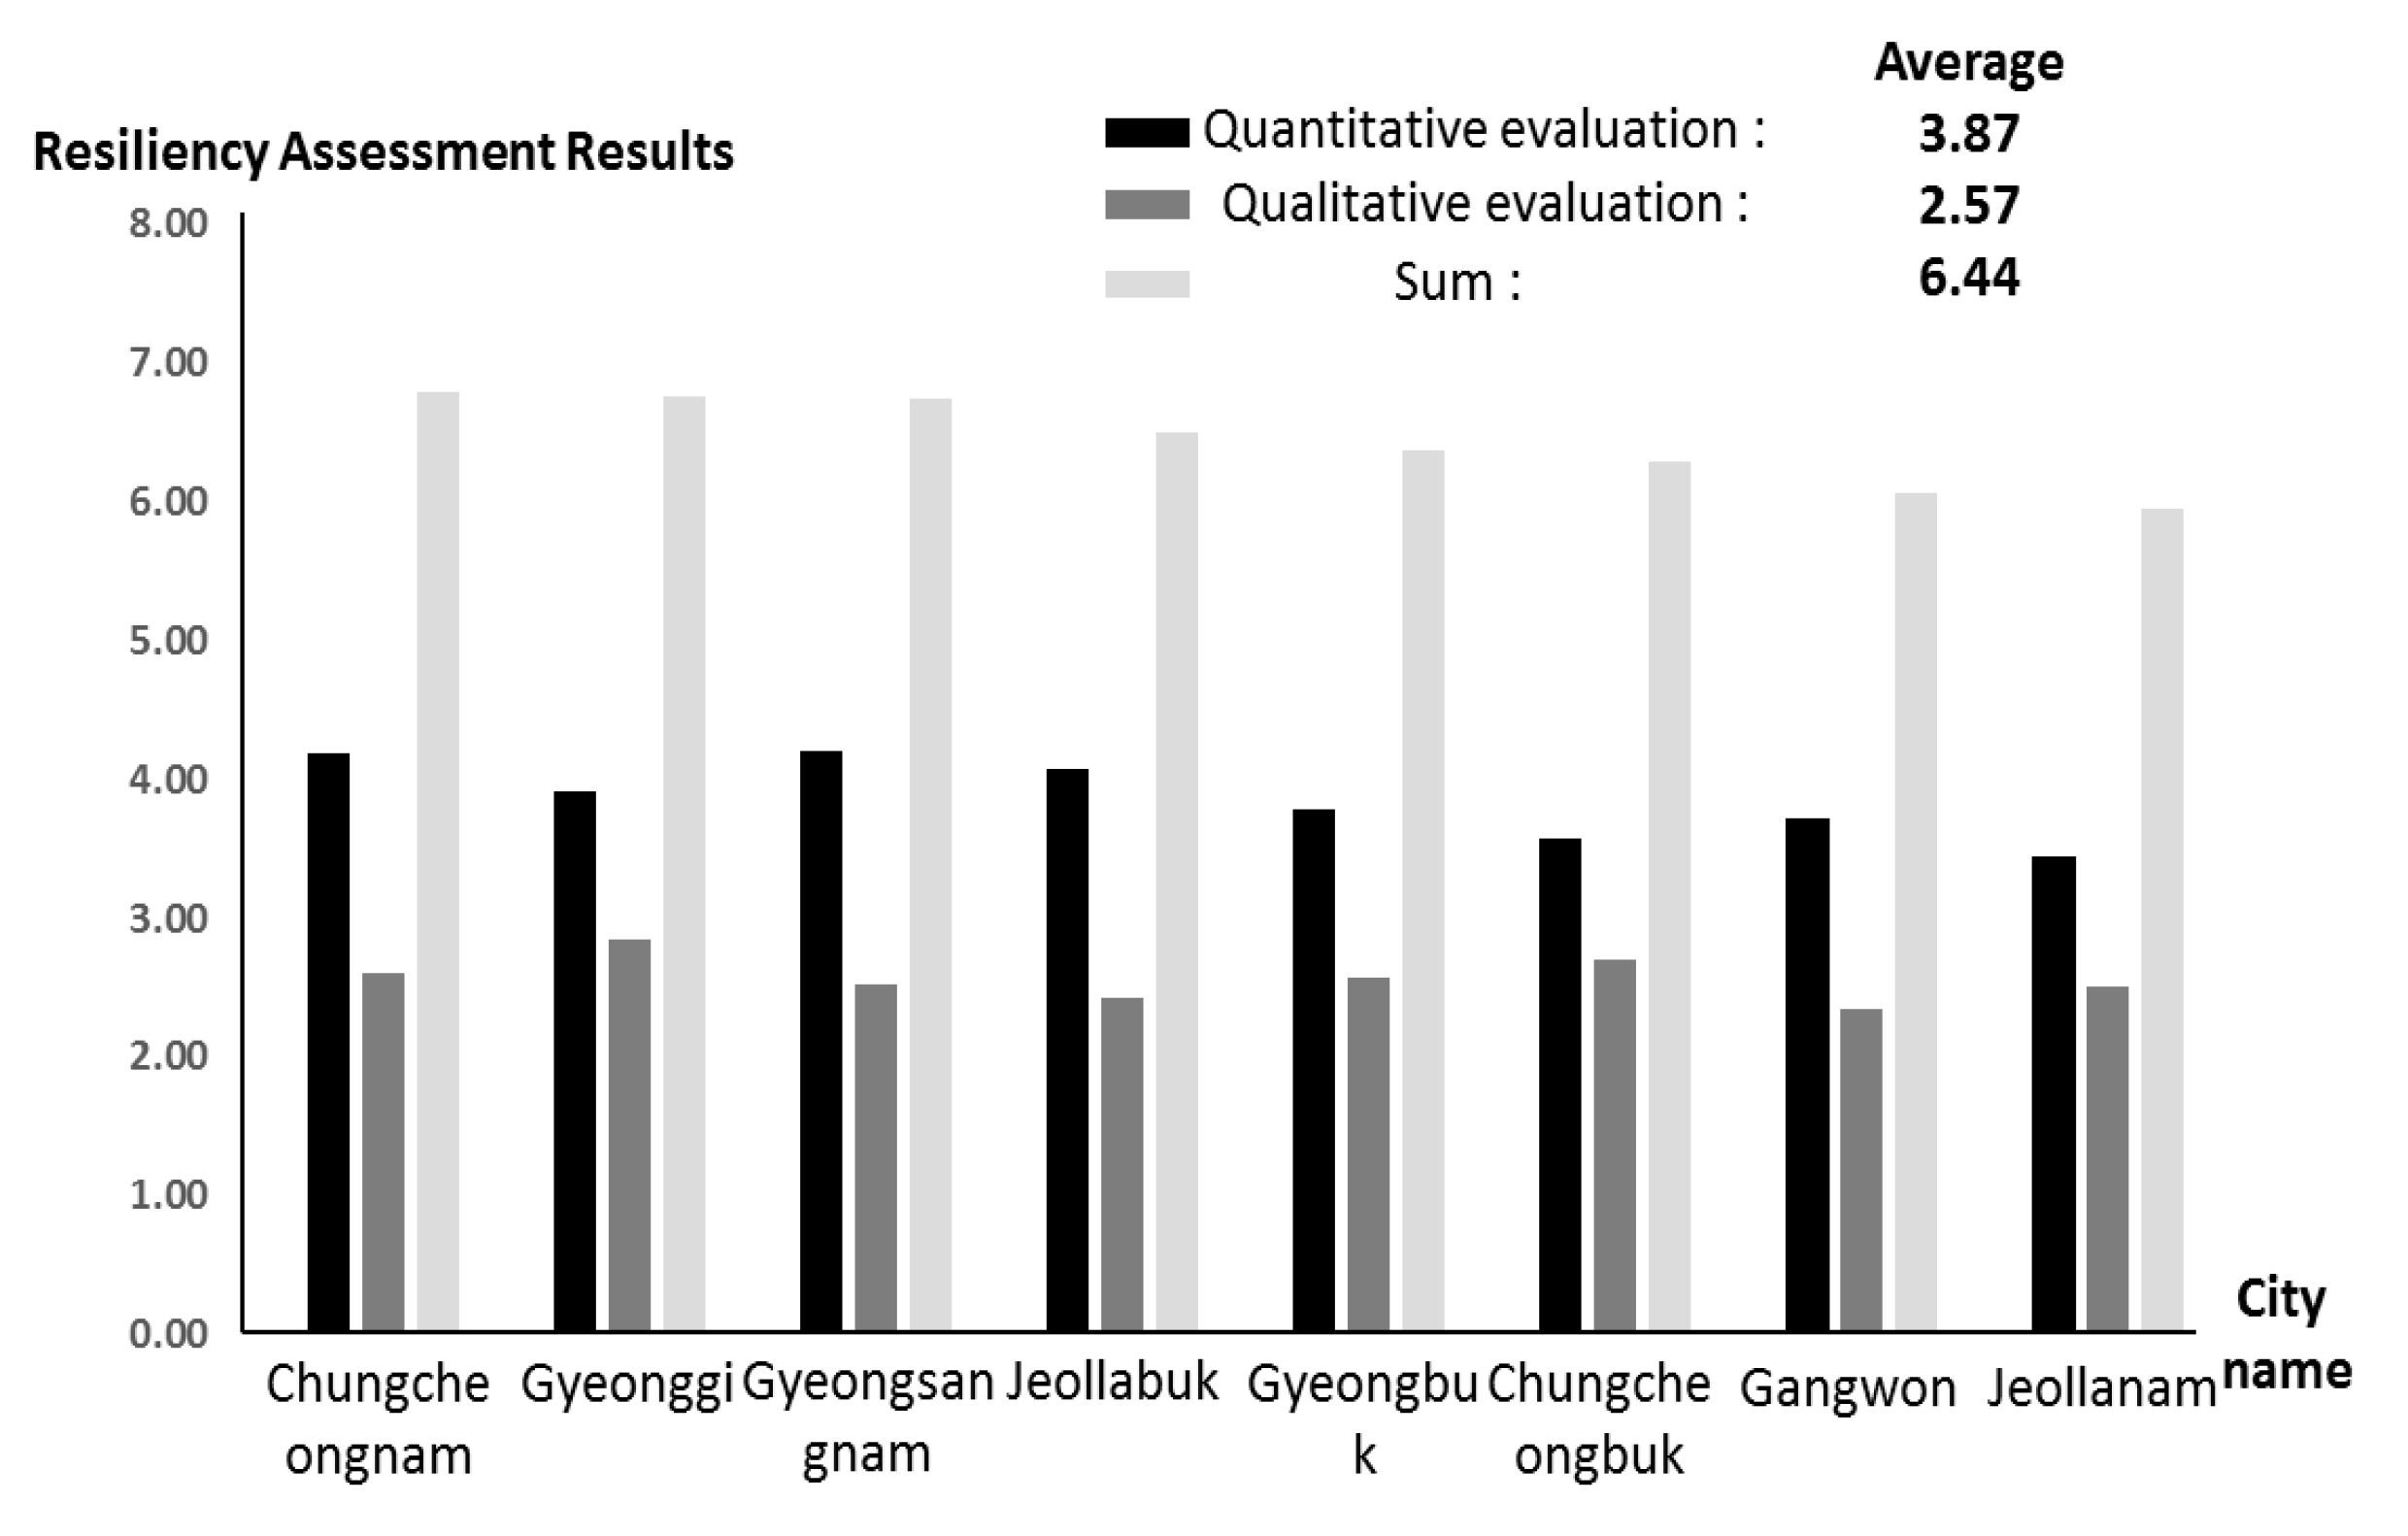
The results of the additional evaluation of resilience by expanding the spatial range to “province” unit rather than individual local governments are shown in Table 5 and Figure 10. A total of 160 local governments will belong to eight provincial units, and the average value of resilience of each local government was utilized. For example, Chungchungnam-do belongs to Level I and Chungcheongbuk-do belongs to Level II according to the results. In the case of Chungcheongnam-do, the region suffered the most severe drought in 2014–2015 and 2017, deriving the highest resilience evaluation result. The above result was obtained with a relatively high result of evaluation on qualitative indicators such as the level of understanding (RA3) due to the drought that occurred in the past.
When performing drought resilience assessment by reflecting regional characteristics, a drought response plan can be established in a relatively small-sized local city according to the guidelines suggested by the central government. Therefore, more appropriate guidelines can be established through such an evaluation of a larger group (“province” unit). Of course, it may be focused on the part where randomness with a relatively high average result of the qualitative indicator evaluation as mentioned above. Therefore, further research on ways to assign appropriate weights will be needed in the future, independently from quantitative factors.
3.4. Drought Resilience Curve
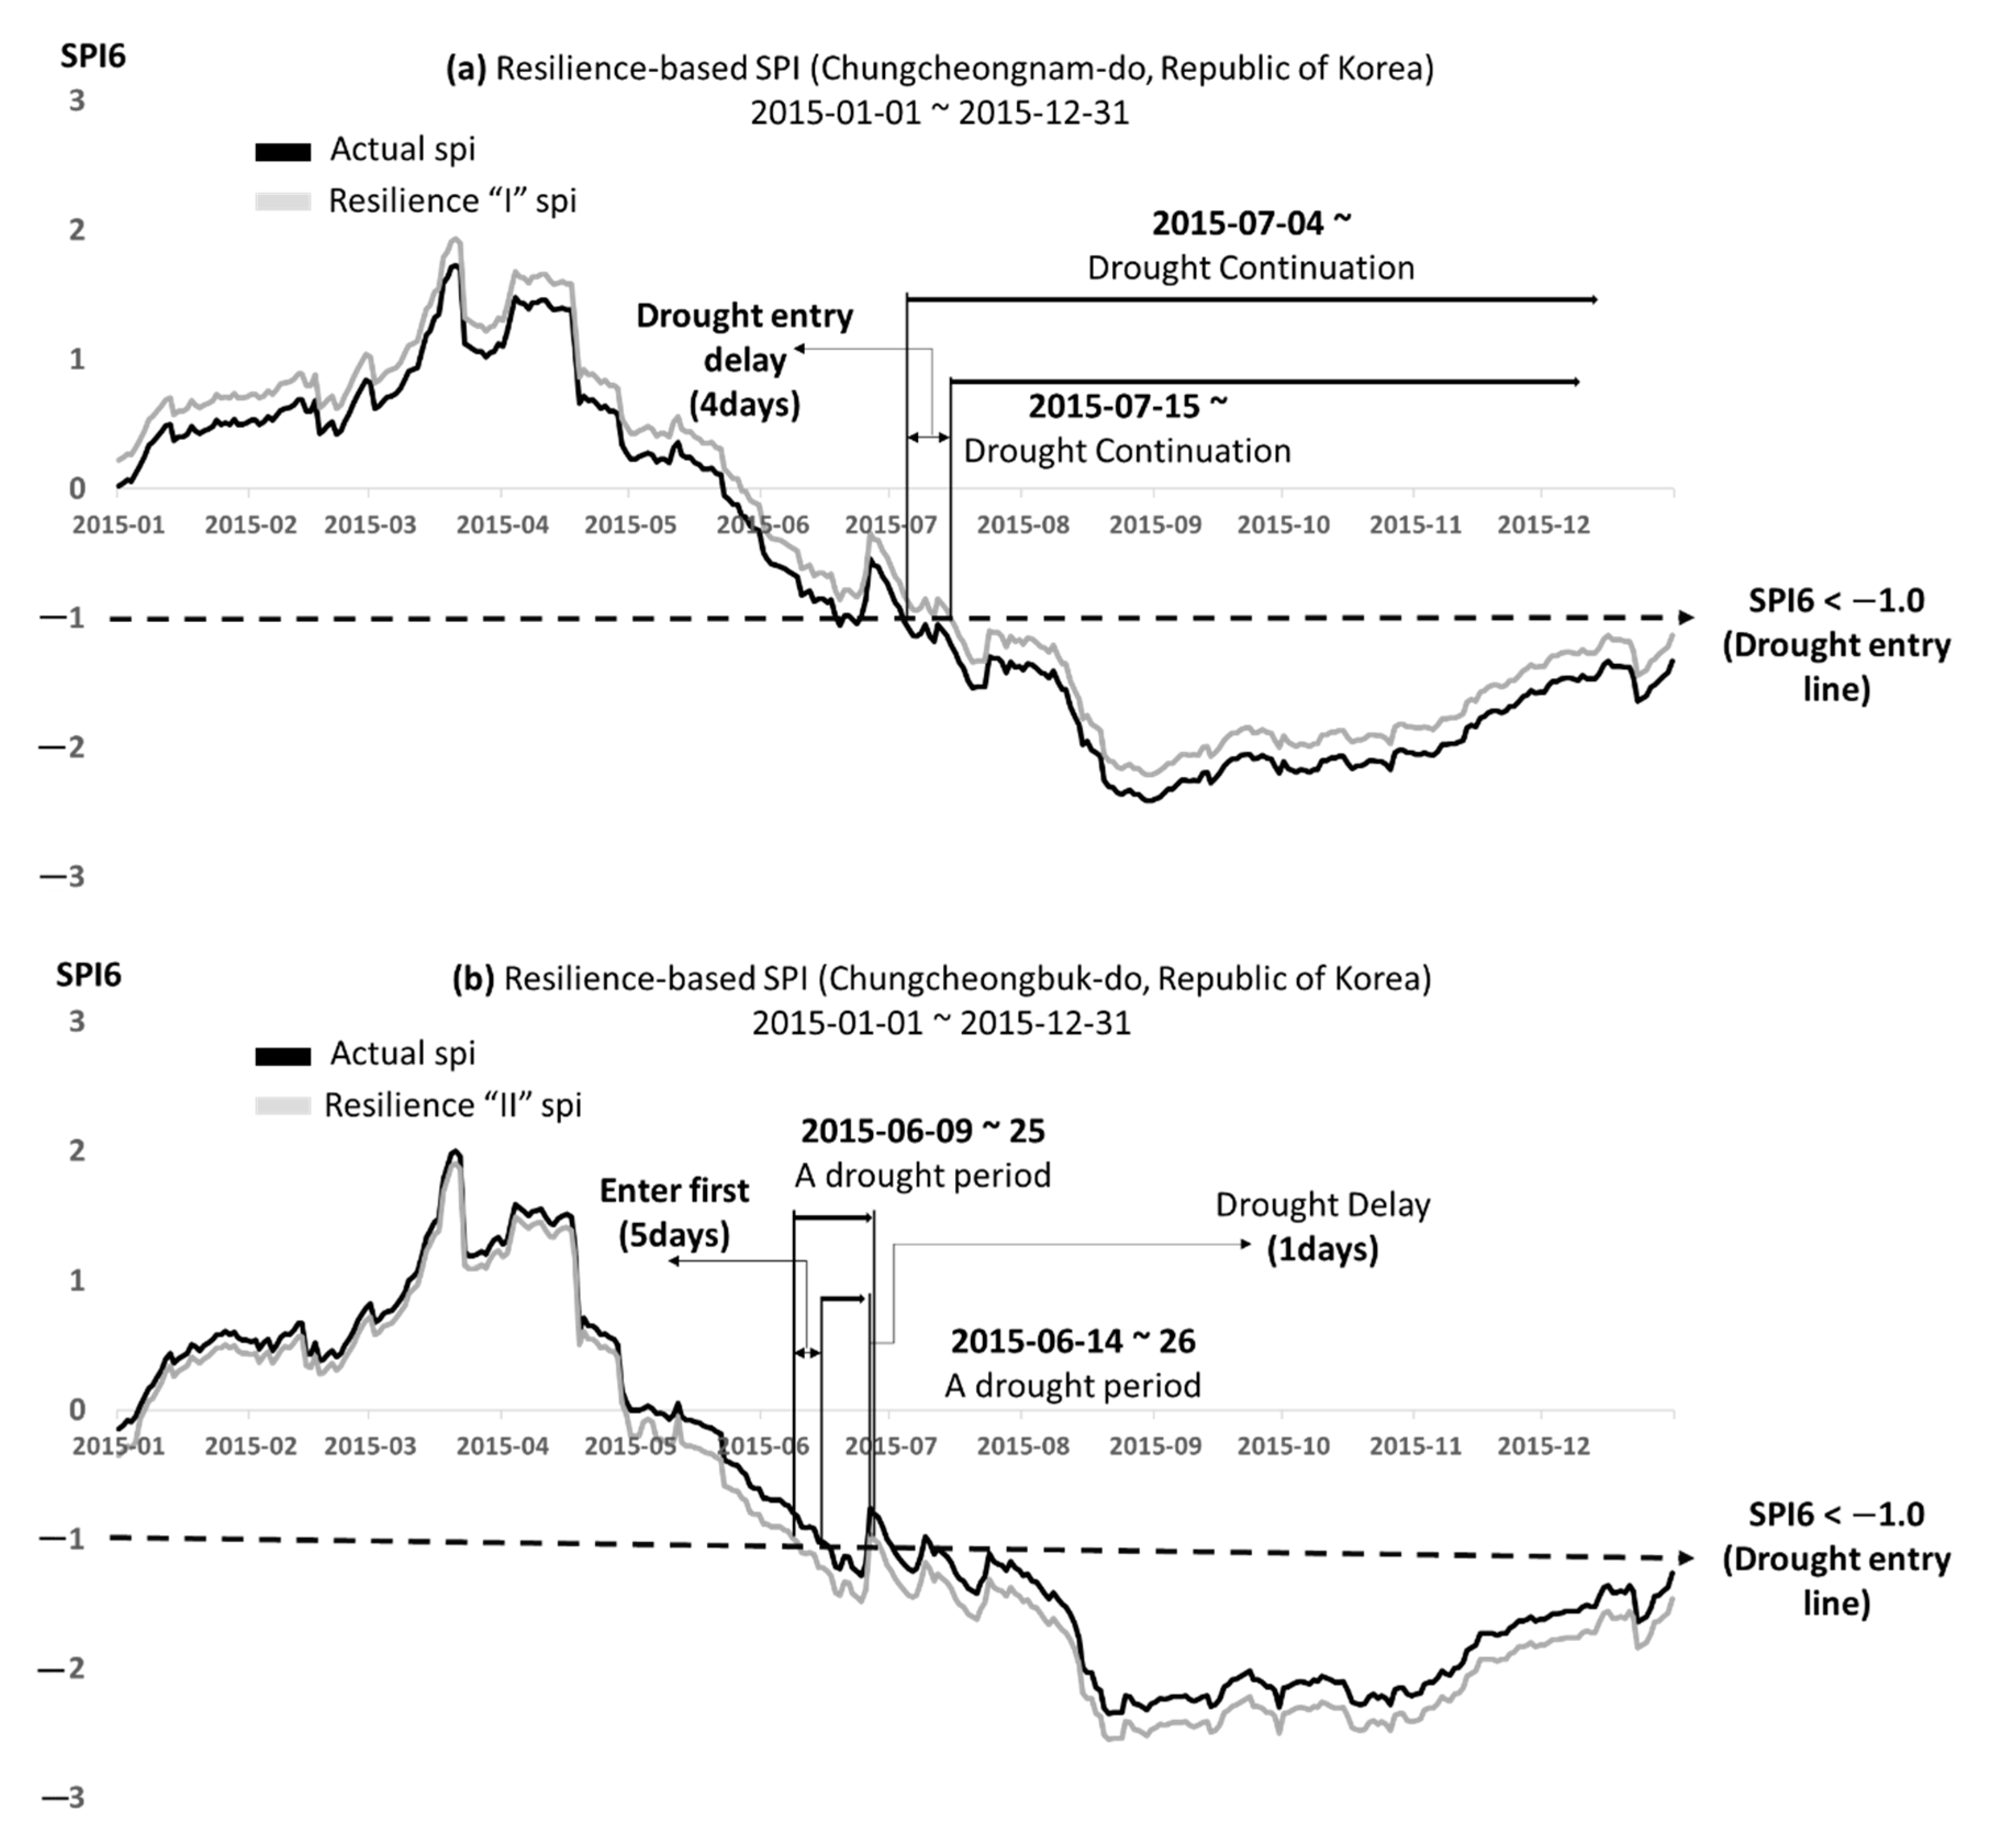
Table 5 is the summarized result of the evaluation of seven metropolitan cities and 153 municipalities in eight provincial units in Korea. Drought resilience curves were created by applying two representative provinces of different resilience level. SPI6 data from 1 June to 31 December 2015 of the Hydrological Weather Information Analysis System was used for Chungcheongnam-do and Chungcheongbuk-do, and the weight value of the resilience slope was discriminated by using 1.1 times for Level I and 0.9 times for Level II.
As a representative result of applying the resilience curve to Chungcheongnam-do, it was confirmed that the drought of the actual SPI standard (less than −1.00) lasted from 4 July to December. As a result of applying the Level I curve, the drought entry slowed on the 11th, and the drought lasted until December, which is the same in reality, as shown in Figure 11a. It means that there was time to respond to the drought for about 11 days even if the drought persists, considering the resilience. On the other hand, in the case of Chungcheongbuk-do, the drought of the actual SPI standard (less than −1.00) lasted from 14 June to 26 June as a result of applying the resilience curve. As a result of applying the Level I curve, the drought entry accelerated by 5 days, and the relief from the drought was delayed by 1 day as shown in Figure 11b. This means that more than 6 days compared to the existing drought became closer to the drought. From this point of view, in the case of Chungcheongbuk-do, a preemptive response to the existing drought is considered necessary. It is impossible to come up with a perfect response within 11 days and recover faster, in case of droughts that last more than 3–4 months. However, from the perspective of extreme drought, it can be considered a considerable number of days depending on the results of resilience curve. Furthermore, it is determined that the weights of the resilience curves applied in this work can be changed if they can be quantified through comparative analysis with real drought ideas in the future.
Even if a drought is entered by the drought index, actual damage may not occur due to regional characteristics. In this way, the application of the resilience curve can be utilized in a way that can reflect more regional characteristics. Of course, although the slope of the resilience curve based on the drought index was arbitrarily set in this study, it will be possible to generate a more appropriate resilience curve by a comparative analysis by applying it to various local governments and arranging the actual drought and the damage suffered by the local government.
4. Conclusions
In this study, drought resilience evaluation was performed on 160 local governments in Korea to suggest directions for responding to drought caused by complex processes among natural disasters and establishing guidelines. For the drought resilience evaluation, quantitative and qualitative indicators in 18 large frameworks that reflect regional characteristics were proposed, and based on this, the drought resilience level was divided into two levels. By dividing the resilience levels, a resilience curve for drought in terms of the actual drought and the resilience that the local government can experience was proposed. In addition, there was a discussion on the resilience curve based on the drought index proposed. Based on the research results, it will be possible to evaluate the system performance of each local government against drought using regional characteristics.
In the case of regional-based resilience evaluation, the results can be very different depending on the comparative local government since it is very relative. In addition, the weight of all proposed resilience indicators may be increased or decreased depending on the characteristics of each local government. Therefore, it is necessary to suggest a more appropriate approach from a regional perspective in the future. Even in the case of the drought resilience curve, the comparison with the actual drought may differ greatly depending on the value of the slope. To verify this, it is necessary to compare actual drought data with qualitative and quantitative data when the local government suffered from drought. It is judged that it can be used as basic data to prepare appropriate guidelines for each local government in case of drought disaster by supplementing the limitations presented above are supplemented and applying it to various scenarios (lasting no rainfall, etc.) as well as nationwide, and evaluating the results.
Author Contributions
C.-W.L. and D.-G.Y. surveyed the previous studies. C.-W.L. wrote the original manuscript. C.-W.L. conducted simulations. C.-W.L. and D.-G.Y. conceived the original idea of the proposed method. All authors have read and agreed to the published version of the manuscript.
Funding
This research was supported by a grant (2019-MOIS31-010) from Fundamental Technology Development Program for Extreme Disaster Response funded by Korean Ministry of Interior and Safety (MOIS).
Conflicts of Interest
The authors declare no conflict of interest.
Appendix A. Indicators for Quantifying Drought Resiliency (Robustness)
| 4Rs (Robustness) | Indicator | Sub-Indicator | Calculation Data | Sources |
| Robustness (RO) | [RO1] Available Regional Water Resources | Water supply rate (representing the percentage of the total population receiving tap water) | Utilize water supply (%) data | Ministry of Environment (water supply statistics) |
| Regional reservoir capacity (total reservoir capacity in the region) | Utilize local reservoir capacity () data | Water Resources Management Information System (regional reservoir capacity) | ||
| Total amount of local tube-well information (use of groundwater irrigation in the region) | Use the total amount of local government information data (annual usage) | K-water (tube-well management information) | ||
| [R02] Regional Economic Vulnerability | Financial self-reliance (tax analysis indicators indicating the ability to self-provision financial income) | Use fiscal self-reliance (%) data | Statistics Korea (General Regional Statistics Department) | |
| Gross regional product (GRDP, production by unit, consumption, prices, etc.) | Use gross regional product (GRDP) | |||
| [R03] Average Annual Precipitation and Variability of the Region (Coefficient of Variation) | The average annual precipitation in the region | Utilization of annual precipitation data (local distribution based on observatory) | Korea Meteorological Administration (average annual precipitation) | |
| Variation of regional annual precipitation (coefficient of variation) | Coefficient of variation based on annual average precipitation data | |||
| [R04] Historical drought experience and local adaptation to drought levels | Meteorological: SPI6 standard (number of days) the number of past severe drought anomalies | Calculation and utilization of the number of SPI6 drought standards (SPI6 < 2.0) that lasted more than 30 days | Hydrologic Weather, Drought Information Analysis System (drought index) | |
| Agricultural: Number of occurrences of severe drought in the past based on the soil moisture index (SMI) | Calculation and utilization of the number of heavy SMI droughts (15% or less) occurred | Agricultural Drought Management System (drought index) | ||
| Water for living: past number of water-outage, intermittent water supply | Utilization of past number of water-outage, intermittent water supply | National Drought Information Portal (emergency water supply status) | ||
| [RO5] Regional average water consumption | The amount of water used per person | Leverage annual usage data | Water Resources Management Information System (usage of living, agricultural and industrial water) | |
| Amount of industrial water used per person | ||||
| Amount of agricultural water used per person |
Appendix B. Indicators for Quantifying Drought Resiliency (Redundancy)
| 4Rs (Redundancy) | Indicator | Sub-Indicator | Calculation Data | Sources |
| Redundancy (RD) | [RD1] Availability of water resources in surrounding areas | Securing data through interviews with disaster officials | ||
| [RD2] Groundwater resource availability | Total amount of local tube well—use of groundwater irrigation in the region | The amount of planned tube well water intake | K-water (Annual water intake plan) | |
| [RD3] Agricultural water use method (irrigation status, etc.: ratio of field irrigation) | The ratio of irrigated paddy—paddies supplied with water by irrigation facilities such as reservoirs, waterworks, reservoirs, and groundwater pipes | The ratio of irrigated paddy | Water Resources Management Information System (cultivated acreage) | |
| Percentage of field irrigation—fields supplied by agricultural water supply facilities | Percentage of field irrigation | |||
| [RD4] Presence of water allocation priorities for drought | Securing data through interviews with disaster officials | |||
| [RD5] Presence of reservoir operation policy during drought | ||||
Appendix C. Indicators for Quantifying Drought Resiliency (Resourcefulness)
| 4Rs (Resourcefulness) | Indicator | Sub-Indicator | Calculation Data | Sources |
| Resourcefulness (RS) | [RS1] Specified degree of drought comprehensive measures | |||
| [RS2] Degree of budgeting for water resource (drought) disasters | Ratio of local taxes among past disaster management-related expenditures | Use local tax rate (%) data | The Ministry of the Interior and Safety (MOIS) (Statistical Yearbook of Local Taxes) | |
| Percentage of self-recovery expenses in case of natural disasters | Utilize recovery cost ratio (%) | e-Country Indicators: public data request required (natural disaster recovery expenses) | ||
| [RS3] Drought prediction and alarm system availability and utilization | Securing data through interviews with disaster officials | |||
| [RS4] Drought vulnerability map existence and utilization | ||||
| [RS5] Specified degree of organizational management in drought | ||||
Appendix D. Indicators for Quantifying Drought Resiliency (Rapidity)
| 4Rs (Rapidity) | Indicator | Sub-Indicator | Calculation Data | Sources |
| Rapidity (RA) | [RA1] A local population | Population count by administrative district (city) | Use the population by city and county | The Ministry of the Interior and Safety (MOIS) (resident registered population status) |
| Percentage of vulnerable class by administrative district (city) | Ratio of 63 years of age or older by city and county | The Ministry of the Interior and Safety (MOIS) (resident registered population status) | ||
| [RA2] Virtual drought training status and specificity | Securing data through interviews with disaster officials | |||
| [RA3] Public awareness and understanding of the concept of drought | ||||
References
- Wilhite, D.A.; Glantz, M.H. Understanding: The drought phenomenon: The role of definitions. Water Int. 1985, 10, 111–120. [Google Scholar] [CrossRef] [Green Version]
- Palmer, W.C. Meteorological Drought; US Department of Commerce Weather Bureau: Washington, DC, USA, 1965; Volume 30.
- McKee, T.B.; Doesken, N.J.; Kleist, J. The relationship of drought frequency and duration to time scales. In Proceedings of the 8th Conference on Applied Climatology, Anaheim, CA, USA, 1–22 January 1993; Volume 17, pp. 179–183. [Google Scholar]
- Nalbantis, I. Evaluation of a hydrological drought index. Eur. Water 2008, 23, 67–77. [Google Scholar]
- Shafer, B.A.; Dezman, L.E. Development of surface water supply index (swsi) to assess the severity of drought condition in snowpack runoff areas. In Proceeding of the Western Snow Conference, Reno, NV, USA, 19–23 April 1982. [Google Scholar]
- Kwon, H.J.; Kim, S.J. Evaluation of semi-distributed hydrological drought using SWSI (Surface Water Supply Index). J. Korean Soc. Agric. Eng. 2006, 48, 37–43. [Google Scholar]
- Dyer, J.A.; Baier, W. An index for soil moisture drying patterns. Can. Agric. Eng. 1979, 21, 117–118. [Google Scholar]
- Karamouz, M.; Zeynolabedin, A.; Olyaei, M.A. Regional drought resiliency and vulnerability. J. Hydrol. Eng. 2016, 21, 05016028. [Google Scholar] [CrossRef]
- Karamouz, M.; Rasouli, K.; Nazif, S. Development of a hybrid index for drought prediction: Case study. J. Hydrol. Eng. 2009, 14, 617–627. [Google Scholar] [CrossRef]
- Park, J.H.; Lee, J.H.; Kim, T.W.; Kwon, H.H. A development of multivariate drought index using the simulated soil moisture from a GM-NHMM model. J. Korea Water Resour. Assoc. 2019, 52, 545–554. [Google Scholar]
- Balint, Z.; Mutua, F.; Muchiri, P.; Omuto, C.T. Monitoring drought with the combined drought index in Kenya. In Developments in Earth Surface Processes; Elsevier: Amsterdam, The Netherlands, 2013; Volume 16, pp. 341–356. [Google Scholar]
- Al-Bakri, J.T.; Alnaimat, M.J.; Al-Karablieh, E.; Qaryouti, E.A. Assessment of combined drought index and mapping of drought vulnerability in Jordan. Int. J. Eng. Res. Appl. 2019, 9, 59–68. [Google Scholar]
- Skoulikaris, C.; Makris, C.; Katirtzidou, M.; Baltikas, V.; Krestenitis, Y. Assessing the Vulnerability of a Deltaic Environment due to Climate Change Impact on Surface and Coastal Waters: The Case of Nestos River (Greece). Environ. Model. Assess. 2021, 1–28. [Google Scholar]
- Bruneau, M.; Chang, S.E.; Eguchi, R.T.; Lee, G.C.; O’Rourke, T.D.; Reinhorn, A.M.; Von Winterfeldt, D. A framework to quantitatively assess and enhance the seismic resilience of communities. Earthq. Spectra 2003, 19, 733–752. [Google Scholar] [CrossRef] [Green Version]
- Hollnagel, E. Resilience Engineering and Safety Management; Mines Paris Tech: Paris, France, 2011. [Google Scholar]
- Karamouz, M.; Rasoulnia, E.; Zahmatkesh, Z.; Olyaei, M.A.; Baghvand, A. Uncertainty-based flood resiliency evaluation of wastewater treatment plants. J. Hydroinform. 2016, 18, 990–1006. [Google Scholar] [CrossRef]
- Karamouz, M.; Rasoulnia, E.; Olyaei, M.A.; Zahmatkesh, Z. Prioritizing investments in improving flood resilience and reliability of wastewater treatment infrastructure. J. Infrastruct. Syst. 2018, 24, 04018021. [Google Scholar] [CrossRef]
- Harrison, C.G.; Williams, P.R. A systems approach to natural disaster resilience. Simul. Model. Pract. Theory 2016, 65, 11–31. [Google Scholar] [CrossRef] [PubMed]
- Paton, D.; Johnston, D. Disaster Resilience: An Integrated Approach; Charles C Thomas Publisher: Springfield, IL, USA, 2017. [Google Scholar]
- Zhou, H.; Wan, J.; Jia, H. Resilience to natural hazards: A geographic perspective. Nat. Hazards 2010, 53, 21–41. [Google Scholar] [CrossRef]
- Mihunov, V.V.; Lam, N.S.; Zou, L.; Rohli, R.V.; Bushra, N.; Reams, M.A.; Argote, J.E. Community resilience to drought hazard in the south-central United States. Ann. Am. Assoc. Geogr. 2018, 108, 739–755. [Google Scholar] [CrossRef]
- Mihunov, V.V.; Lam, N.S. Modeling the dynamics of drought resilience in South-Central United States using a Bayesian Network. Appl. Geogr. 2020, 120, 102224. [Google Scholar] [CrossRef]
- Kamara, J.K.; Sahle, B.W.; Agho, K.E.; Renzaho, A. Governments’ policy response to drought in eswatini and lesotho: A systematic review of the characteristics, comprehensiveness, and quality of existing policies to improve community resilience to drought hazards. Discret. Dyn. Nat. Soc. 2020, 2020, 3294614. [Google Scholar] [CrossRef]
- Khatibi, S.A.; Golkarian, A.; Mosaedi, A.; Sojasi Qeidari, H. Assessment of Resilience to Drought of Rural Communities in Iran. J. Soc. Serv. Res. 2019, 45, 151–165. [Google Scholar] [CrossRef]
- Lin, Y.C.; Kuo, E.D.; Chi, W.J. Analysis of Meteorological Drought Resilience and Risk Assessment of Groundwater Using Signal Analysis Method. Water Resour. Manag. 2021, 35, 179–197. [Google Scholar] [CrossRef]
- Venton, C.C. Economics of Resilience to Drought; USAID: Washington, DC, USA, 2018; p. 43.
- Korea Meteorological Administration (KMA) Drought Monitoring, South Korea. 2019. Available online: https://hydro.kma.go.kr (accessed on 7 August 2019).
Figure 1.
Region-based drought resilience evaluation procedure.

Figure 2.
System performance curve by disaster.

Figure 3.
Application areas (metropolitan cities, municipalities, provinces) subject to drought resiliency evaluation.
Figure 3.
Application areas (metropolitan cities, municipalities, provinces) subject to drought resiliency evaluation.

Figure 4.
Metropolitan drought resilience results.

Figure 5.
Drought resilience assessment results. (a) Resilience I Local Government, (b) Resilience II Local Government.
Figure 5.
Drought resilience assessment results. (a) Resilience I Local Government, (b) Resilience II Local Government.

Figure 6.
City, county (Level I) qualitative indicator assessment results. (a) Evaluation results (RD1), (b) Evaluation results (RD4), (c) Evaluation results (RD5), (d) Evaluation results (RS1), (e) Evaluation results (RS3), (f) Evaluation results (RS4), (g) Evaluation results (RS5), (h) Evaluation results (RA2), (i) Evaluation results (RA3).

Figure 7.
City, county (Level II) qualitative indicator assessment results. (a) Evaluation results (RD1), (b) Evaluation results (RD4), (c) Evaluation results (RD5), (d) Evaluation results (RS1), (e) Evaluation results (RS3), (f) Evaluation results (RS4), (g) Evaluation results (RS5), (h) Evaluation results (RA2), (i) Evaluation results (RA3).

Figure 8.
City, county (Level II) qualitative indicator assessment results. (a) Evaluation results (RO1), (b) Evaluation results (RO2), (c) Evaluation results (RO4), (d) Evaluation results (RO5), (e) Evaluation results (RO6), (f) Evaluation results (RD2), (g) Evaluation results (RD3), (h) Evaluation results (RS2), (i) Evaluation results (RA1).

Figure 9.
City, county (Level II) qualitative indicator assessment results. (a) Evaluation results (RO1), (b) Evaluation results (RO2), (c) Evaluation results (RO4), (d) Evaluation results (RO5), (e) Evaluation results (RO6), (f) Evaluation results (RD2), (g) Evaluation results (RD3), (h) Evaluation results (RS2), (i) Evaluation results (RA1).

Figure 10.
“Province” unit drought resilience assessment results.

Figure 11.
Resilience-based SPI6 (2015). (a) Resilience-based SPI (Chungcheongnam-do, Republic of Korea) 2015-01-01~2015-12-31, (b) Resilience-based SPI (Chungcheongbuk-do, Republic of Korea) 2015-01-01~2015-12-31.
Figure 11.
Resilience-based SPI6 (2015). (a) Resilience-based SPI (Chungcheongnam-do, Republic of Korea) 2015-01-01~2015-12-31, (b) Resilience-based SPI (Chungcheongbuk-do, Republic of Korea) 2015-01-01~2015-12-31.


Table 1.
SPI index range by drought stage.
| Drought Category | SPI Values | Ref. | |
|---|---|---|---|
| Mild drought | 0~−0.99 | [3] | |
| Moderate drought | −1.00~−1.49 | ||
| Severe drought | 1.50~−1.99 | ||
| Extreme drought | Experience | −2.00 ≥ SPI | |
Table 2.
Metropolitan drought resilience results.
| Metropolitan City | ||||
|---|---|---|---|---|
| Area Name | Quantitative Indicators (A) | Qualitative Indicators (B) | (A) + (B) | Resilience Level |
| Seoul | 5.20 | 4.45 | 9.65 | I |
| Busan | 5.20 | 4.04 | 9.24 | |
| Daejeon | 4.80 | 2.53 | 7.33 | |
| Gwangju | 3.40 | 3.40 | 6.80 | |
| Daegu | 2.20 | 3.52 | 5.72 | II |
| Incheon | 2.20 | 2.51 | 4.71 | |
| Ulsan | 2.20 | 1.90 | 4.10 | |
| Average | 3.60 | 3.19 | 6.79 | |
| Stdev | 1.44 | 0.91 | 2.13 | |
| CV (Coefficient of Variation) | 0.40 | 0.29 | 0.31 | |
Table 3.
City and county drought resilience assessment results.
| Evaluation Results | |||||||
|---|---|---|---|---|---|---|---|
| Quantitative Indicators (A) | Qualitative Indicators (B) | (A) + (B) | |||||
| Resilience Level | I | II | I | II | I | II | I + II |
| Average | 5.06 | 2.79 | 2.70 | 2.49 | 7.76 | 5.28 | 6.45 |
| Stdev | 0.82 | 0.81 | 0.47 | 0.36 | 0.76 | 0.81 | 1.47 |
| CV (Coefficient of Variation) | 0.16 | 0.29 | 0.17 | 0.15 | 0.10 | 0.15 | 0.23 |
Table 4.
Province unit drought resilience assessment results.
| Province (“Do”) | Quantitative Indicators (A) | Qualitative Indicators (B) | (A) + (B) | Resilience Level |
|---|---|---|---|---|
| Chungcheongnam-do | 4.20 | 2.60 | 6.80 | I |
| Gyeonggi-do | 3.92 | 2.85 | 6.76 | |
| Gyeongsangnam-do | 4.21 | 2.53 | 6.74 | |
| Jeollabuk-do | 4.09 | 2.42 | 6.51 | |
| Gyeongsangbuk-do | 3.79 | 2.58 | 6.37 | II |
| Chungcheongbuk-do | 3.58 | 2.70 | 6.29 | |
| Gangwon-do | 3.72 | 2.35 | 6.07 | |
| Jeollanam-do | 3.45 | 2.51 | 5.96 | |
| Average | 3.87 | 2.57 | 6.44 | - |
| Stdev | 0.28 | 0.16 | 0.32 | |
| CV (Coefficient of Variation) | 0.07 | 0.06 | 0.05 |
Table 5.
Distinguish resilience levels based on drought resilience assessment.
| Resilience Level | Metropolitan City | Other Local Governments Based on “Province” |
|---|---|---|
| I | Seoul | Chungcheongnam-do |
| Busan | Gyeonggi-do | |
| Daejeon | Gyeongsangnam-do | |
| Gwangju | Jeollabuk-do | |
| II | Daegu | Gyeongsangbuk-do |
| Chungcheongbuk-do | ||
| Incheon | Gangwon-do | |
| Ulsan | Jeollanam-do |
Publisher’s Note: MDPI stays neutral with regard to jurisdictional claims in published maps and institutional affiliations. |
© 2021 by the authors. Licensee MDPI, Basel, Switzerland. This article is an open access article distributed under the terms and conditions of the Creative Commons Attribution (CC BY) license (https://creativecommons.org/licenses/by/4.0/).
Share and Cite
MDPI and ACS Style
Lee, C.-W.; Yoo, D.-G. Evaluation of Drought Resilience Reflecting Regional Characteristics: Focused on 160 Local Governments in Korea. Water 2021, 13, 1873. https://doi.org/10.3390/w13131873
AMA Style
Lee C-W, Yoo D-G. Evaluation of Drought Resilience Reflecting Regional Characteristics: Focused on 160 Local Governments in Korea. Water. 2021; 13(13):1873. https://doi.org/10.3390/w13131873
Chicago/Turabian StyleLee, Chan-Wook, and Do-Guen Yoo. 2021. "Evaluation of Drought Resilience Reflecting Regional Characteristics: Focused on 160 Local Governments in Korea" Water 13, no. 13: 1873. https://doi.org/10.3390/w13131873
Note that from the first issue of 2016, this journal uses article numbers instead of page numbers. See further details here.