
Toward Decentralised Sanitary Sewage Collection Systems: A Multiobjective Approach for Cost-Effective and Resilient Designs


1
Faculty of Civil Engineering and Architecture, Shahid Chamran University of Ahvaz, Ahvaz 61357831351, Iran
2
Department of Civil Engineering, Institute of Urban Water Management, TU Kaiserslautern, 67663 Kaiserslautern, Germany
*
Author to whom correspondence should be addressed.
Water 2021, 13(14), 1886; https://doi.org/10.3390/w13141886
Submission received: 1 June 2021
/
Revised: 4 July 2021
/
Accepted: 5 July 2021
/
Published: 7 July 2021
(This article belongs to the Special Issue Resilience of Interdependent Urban Water Systems)
Abstract
:In recent years, the concept of a centralized drainage system that connect an entire city to one single treatment plant is increasingly being questioned in terms of the costs, reliability, and environmental impacts. This study introduces an optimization approach based on decentralization in order to develop a cost-effective and sustainable sewage collection system. For this purpose, a new algorithm based on the growing spanning tree algorithm is developed for decentralized layout generation and treatment plant allocation. The trade-off between construction and operation costs, resilience, and the degree of centralization is a multiobjective problem that consists of two subproblems: the layout of the networks and the hydraulic design. The innovative characteristics of the proposed framework are that layout and hydraulic designs are solved simultaneously, three objectives are optimized together, and the entire problem solving process is self-adaptive. The model is then applied to a real case study. The results show that finding an optimum degree of centralization could reduce not only the network’s costs by 17.3%, but could also increase its structural resilience significantly compared to fully centralized networks.
1. Introduction
Sanitary sewage collection systems, or simply speaking sewer networks, are essential parts of any modern city; they directly influence public health and are vital for environmental protection. Sewer networks have traditionally been designed and developed in the form of centralized networks to collect and transfer wastewater from homes and factories, preferably by gravity, to a centralized wastewater treatment plant located far enough from urban areas [1,2]. Increasing population growth and industrial and agricultural developments have added to the demand for water in societies. In addition to the pollution and scarcity of available water resources, the increasing water demands have introduced significant challenges. This issue is particularly critical in arid and semi-arid countries suffering from freshwater scarcity; hence, the need for the sustainable management and protection of water resources is striking.
The expansion, reconstruction, and rapid growth of cities and industries have resulted in fundamental challenges for developing and upgrading urban water systems. Due to rapid urbanization and increased costs on one hand and reduced budgets on the other hand, the construction, operation, maintenance, and rehabilitation of centralized sewer networks present severe challenges and obstacles. Additional concerns relate to the reliability and lack of resilience of centralized systems. In flat areas, particularly with high-level groundwater, poor geotechnical conditions for civil engineering activities, and with highly populated and fully urbanized cities, it is expensive or even unfeasible to install sewer lines of sufficiently large diameter and depth. As a result, in such areas sewers are often designed and constructed with minimum slopes. Although the minimum slope approach generally leads to a cost-effective sewer system, it causes operational problems such as increased sedimentation rates and risk of clogging due to a lack of proper flow velocity in sewers, which is required for self-cleaning. To compensate for a lack of natural ground slope, centralized networks serving large and flat areas mostly require pumping stations, which bring about additional costs, consume energy, and make the system fragile.
Recently, decentralized systems have been introduced to overcome the drawbacks mentioned above. Such approaches involve treating and reusing wastewater near the source using independent units [3,4,5,6]. In decentralized systems, it is expected that increasing the number of treatment plants will reduce operating costs by reducing the diameter of the sewers and the excavation volumes, as well as the number of pumping and lift stations. Furthermore, independent units (subnetworks and treatment packages) dramatically enhance the reliability and resilience of a sewer system. Decentralized urban water systems have recently received more attention in developing countries lacking reliable systems and financial resources to afford the high construction, operation, maintenance, and rehabilitation costs of centralized systems [2,7,8,9,10,11,12,13,14].
It is also worth mentioning that advances in the design and operation of modern wastewater treatment processes such as sequencing batch reactors (SBRs), which are efficient, small in size, and suitable for urban environments, make these promising for use in decentralized urban sewer networks. Such systems have much more potential for recycling and reusing treated wastewater (e.g., for irrigation of urban green spaces) and are more efficient and cost-effective than centralized systems. Additionally, recent developments in network design and optimization algorithms have facilitated the design of decentralized sewer systems.
A literature review showed that despite many innovative methods being used for designing centralized wastewater collection networks [15,16,17,18,19,20,21,22,23,24,25,26,27,28], only a few studies have proposed decentralized sewer networks [2,25,29]. Overall, systematically generating feasible decentralized layouts is a bottleneck in optimizing decentralized sewer networks [28]. Recently, several investigations have been published regarding decentralization aspects for stormwater networks. The layout generator algorithms [9,30], single-objective optimization algorithm [9], multiobjective optimization algorithms [12,31,32,33,34,35,36], and multicriteria decision-making algorithms [11,37,38] are some of the main approaches investigated so far for decentralized stormwater systems.
In general, the design of a sewer network needs to solve two mathematically different subproblems: (1) generate feasible layouts employing algorithms from the graph theory; (2) measure the network’s components by solving the hydraulic governing equations concerning a set of design criteria. The latter includes calculating the sewer diameters and installation depths (or sewer slopes) and the pumping capacities. The subproblems are nonlinear and discrete, with many complex constraints from the hydraulics principles, technical criteria, and regional limitations [16]. It is possible to simplify the sewer network design by separately solving the subproblems mentioned above. For this purpose, a near-optimum layout is first derived using engineering judgments or a simplified objective function and optimization. Then, for the layout at hand, the network is hydraulically designed [39]; however, for the above subproblems, the layout and the hydraulic designs are highly interrelated. The layout can significantly affect the network hydraulic design characteristics and vice versa. This issue is particularly significant in flat and wide areas in which the layout alternatives are numerous. Additionally, the inter-relationship between the subproblems is much more critical when designing a decentralized sewer network.
Consequently, the global optimum design of a sewer network can only be achieved when these two subproblems are solved implicitly and simultaneously. In this respect, the current study introduces a multiobjective optimization framework for decentralized sewer system design. The layout and hydraulic design subproblems are optimized implicitly using a coupled design package. The objective functions include the construction and operational costs of the network and the wastewater treatment plant(s), the structural resilience, and the degree of centralization. For this purpose, a systematic network layout generator and hydraulic simulation–design model are developed to produce all feasible network configurations with a vast degrees of centralization. The multiobjective optimization is used to drive the optimum trade-off between the aforementioned objective functions.
2. Materials and Methods
As mentioned earlier, in order to optimize a sewer collection network, the layout and hydraulic design subproblems must be solved simultaneously. Mathematically, a sewer network optimization problem can be expressed as follows:
where represents the objective functions, represents the annualized cost of construction and operation, represents the structural resilience, and represents the degree of network centralization. Additionally, is the vector of decision variables, including the layout parameters; the number and locations of treatment plants; the depth of roots (outlets); and the hydraulic characteristics of the network, consisting of the sewer diameters and slopes and the locations of pumping (lift) stations. Additionally, is an optimal solution and is the feasible space of the problem. The above objective functions are optimized subject to a train of physical and technical constraints on the layout and hydraulic designs. For centralized sanitary sewer networks, the constraints and design criteria have usually been well explained in the previous investigations, especially in [16,39], which are adopted in this study. Subject to the constraints, the following objective functions are optimized together using the Borg multiobjective evolutionary algorithm (MOEA) [40].
2.1. Cost Function ()
A sewer network cost function consists of the construction and operational costs of sewers (), manholes (), pressurized transmission pipelines (), pumping and lift stations (), and wastewater treatment plants (). Accordingly, the total cost function of a sewer network design to be used as an objective function is defined as follows:
In which is the buried sewer depth or manhole installation depth, is the sewer diameter, is the sewer length, and is the pumping or treatment flow rate. For each particular case study, the above functions are estimated and derived through nonlinear regressions.
To establish the objective function , the annual cash flow method is applied to the estimated cost as the following:
where is the interest rate; is the design period, which can be different for each component of the design cost function; is a parameter used to calculate the profit from selling the design, which can be different for each component during its design period; is a parameter used to estimate the annual operation cost.
2.2. Structural Resilience Analysis ()
Structural resilience as an objective function is the network’s ability to minimize the frequency and magnitude of structural failures, such as clogging and sewer cracking or pump failure [41]. The maximum structural resilience is obtained when clogging in the sewers has the least effect on the upstream parts [42]. To quantify the clogging consequence in sewer networks, Bakhshipour et al. (2021) [12] proposed a criterion, Equation (4), which uses layout design properties. The principle is that the lower the proportion of the population affected by sewer clogging, the more resilient the network will be.
where is the area connected to and is the total area covered by the network. To account for the effects of DC (degree of centralization) on Equation (4), Bakhshipour et al., 2020 proposed Equation (5) to quantify the structural resilience:
in which is the number of sewers with structural resilience of more than 90% and is the number of sewers with structural resilience of less than 90%. SRI is zero when all sewers are connected to more than 10% percent of the total area and 100% if each root (outlet) is connected to up to 10 % of the total area . More details on this index are found in the given references.
2.3. Degree of Centralization ()
Despite the increasing attention being paid to decentralized urban water management, no explicit definitions have been proposed to measure the degree of centralization (DC) [2]. The available definitions are mostly limited to fully centralized or fully decentralized systems; however, a wide range of solutions with different DCs is feasible. Eggimann et al. (2015) [2] adopted a weighted DC by considering a continuum of possible facility sizes for wastewater management infrastructure. Following that idea, the present study introduces a weighted index to measure the DC based on the network’s layout and the sewer pipes’ accumulative flow (Equation (6)). The main idea behind this formulation is that “the more unbalanced the distribution of sewers and flow rates between the subgraphs, the more centralized the network will be”.
where is the number of selected locations (sites) of the treatment plants, is the number of candidate locations of the treatment plants, and and are calculated as follows:
where is the flow received at each treatment plant, is the number of sewers in each subgraph, and is the total number of sewers in the network. Equation (6) considers both distributions of infrastructure (sewers and pumping facilities) and flow in different parts of the network by applying the coefficient . The more balanced the distribution of wastewater flows between the subgraphs, the closer the coefficient is to 1 and the lower the DC the network will have.
Based on Equation (6), the DC is 1 when the system is fully centralized and merely one treatment plant is selected from the candidate list. In contrast, the DC is almost zero when the system is fully decentralized, meaning that all candidate treatment plants are chosen. In decentralized cases, the network has two or more roots (treatment plant); according to the above formula, the DC is a function of both the number of roots (treatment plants) and the distribution of sewers and wastewater flows. In other words, for the same number of treatment plants, the flow distribution between the subgraphs governs the DC value.
2.4. Subproblem 1: Layout Generator Algorithm
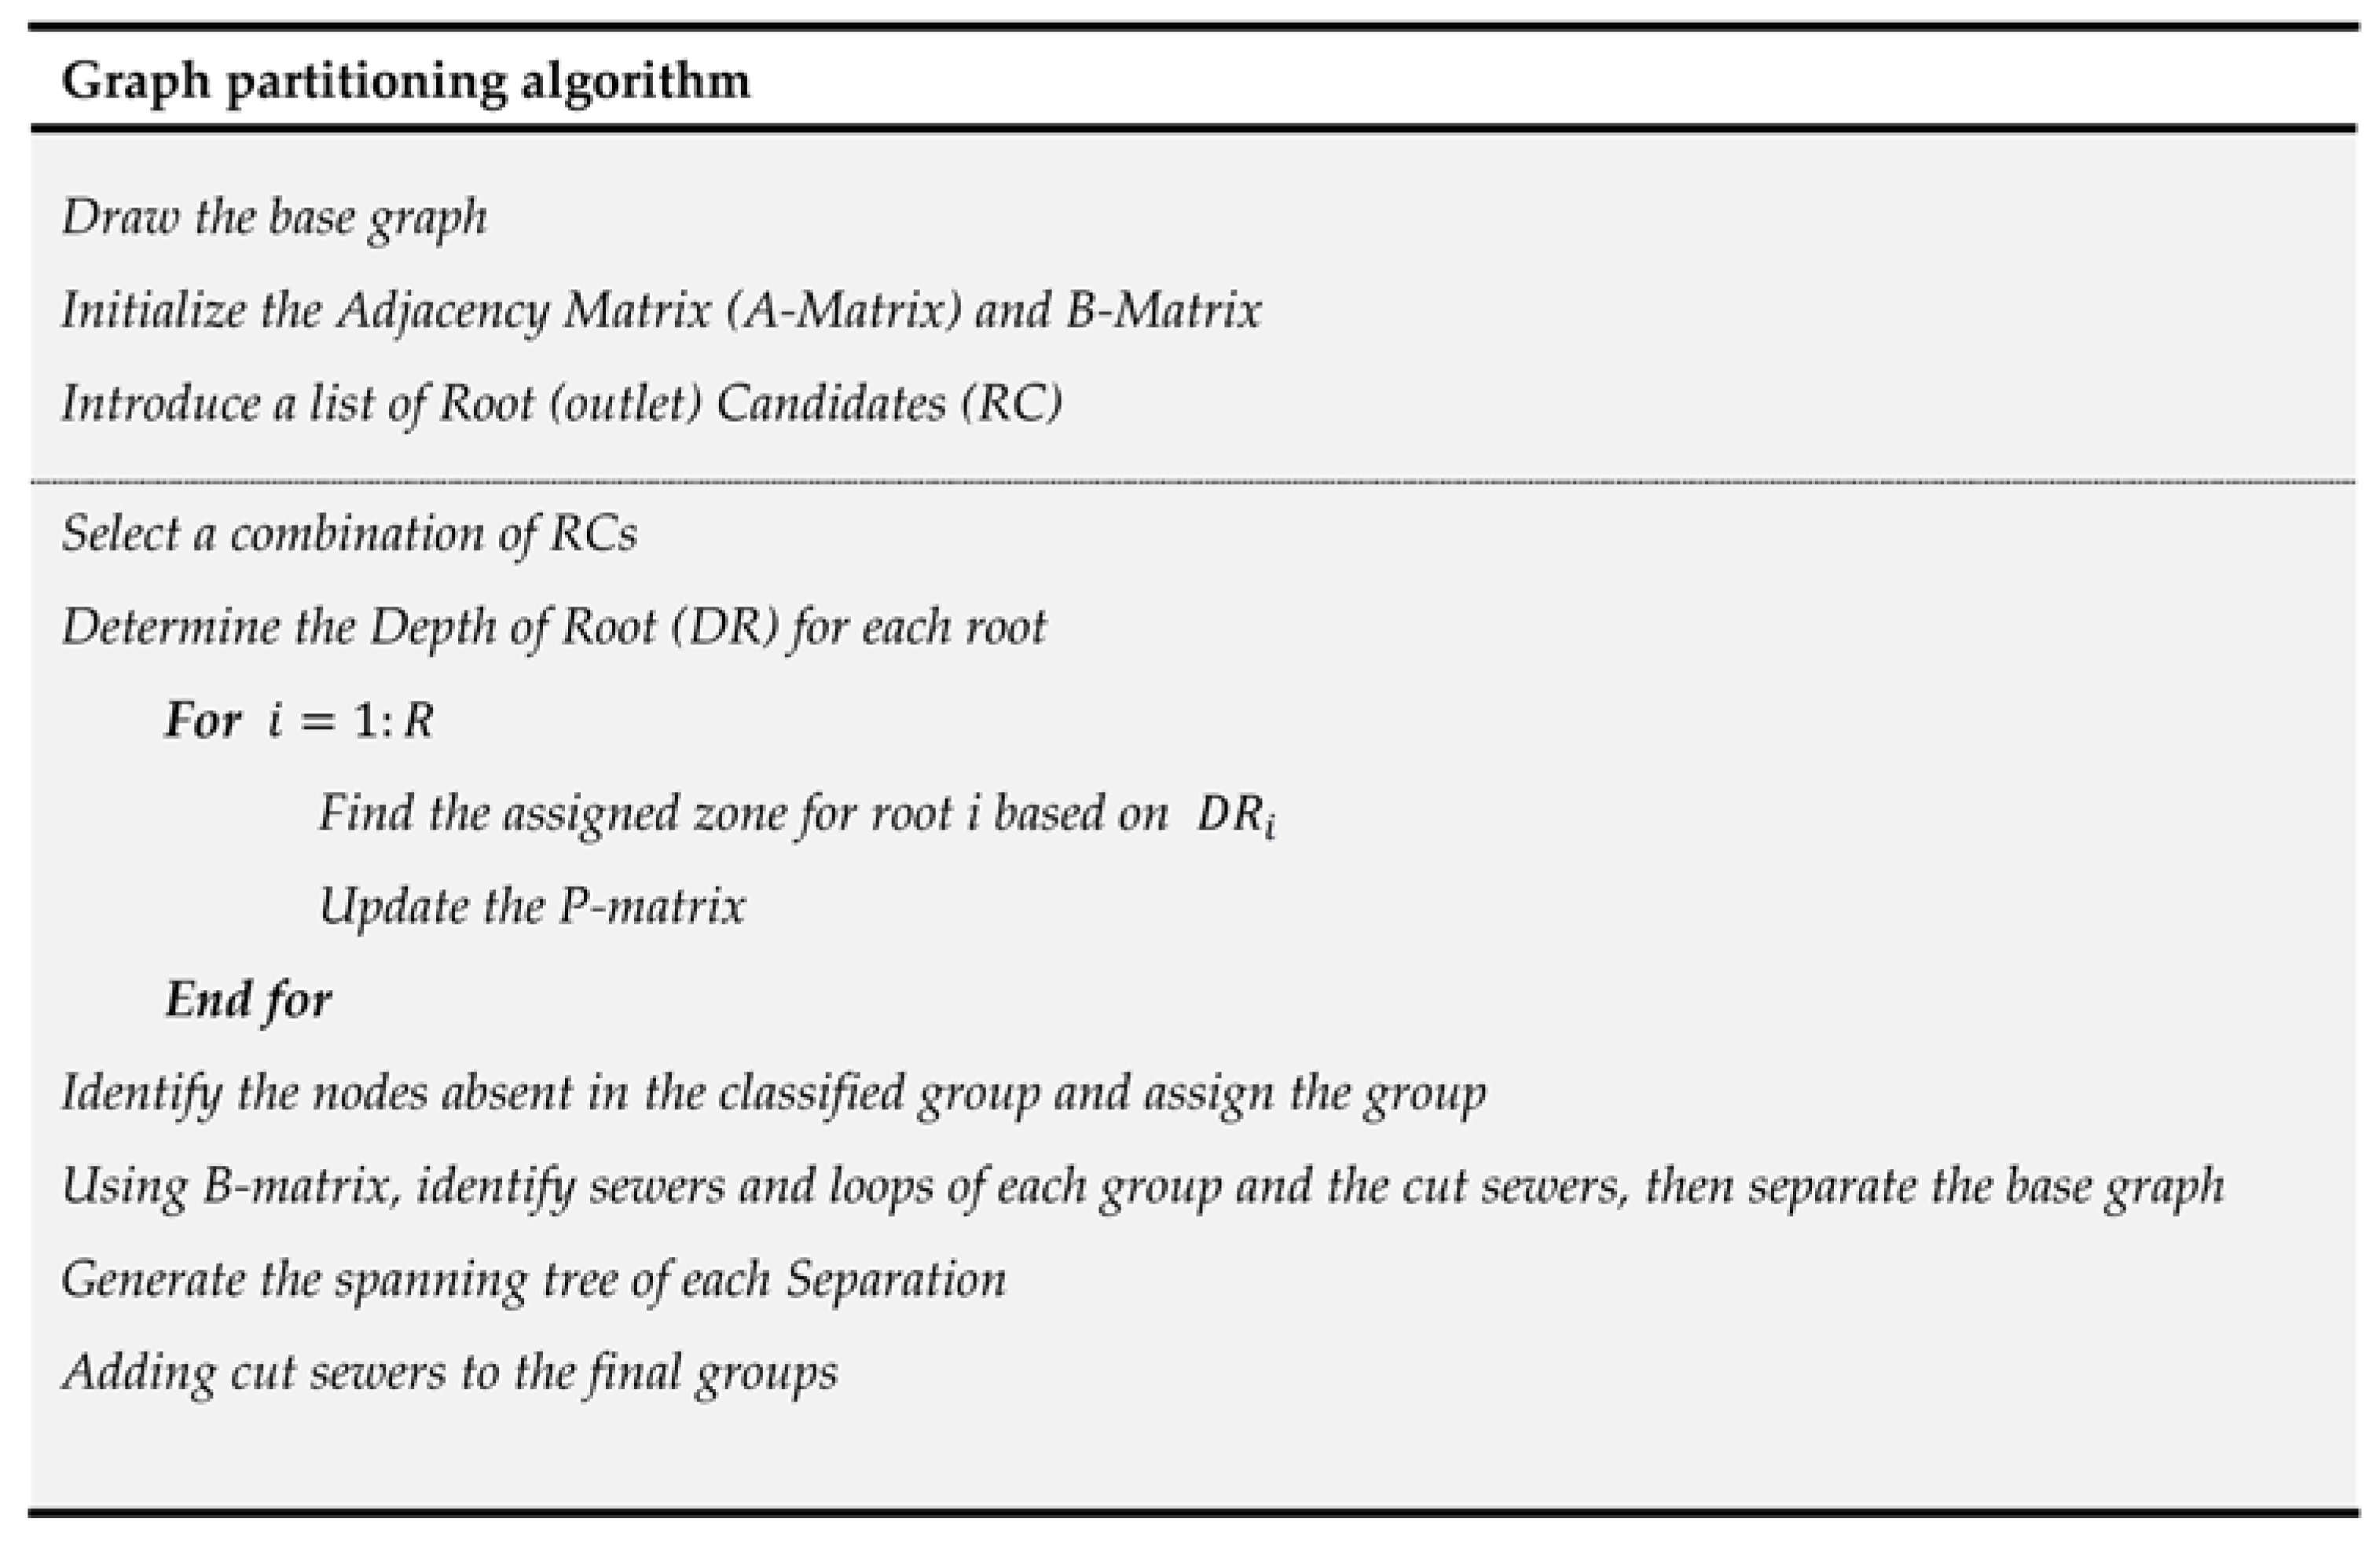
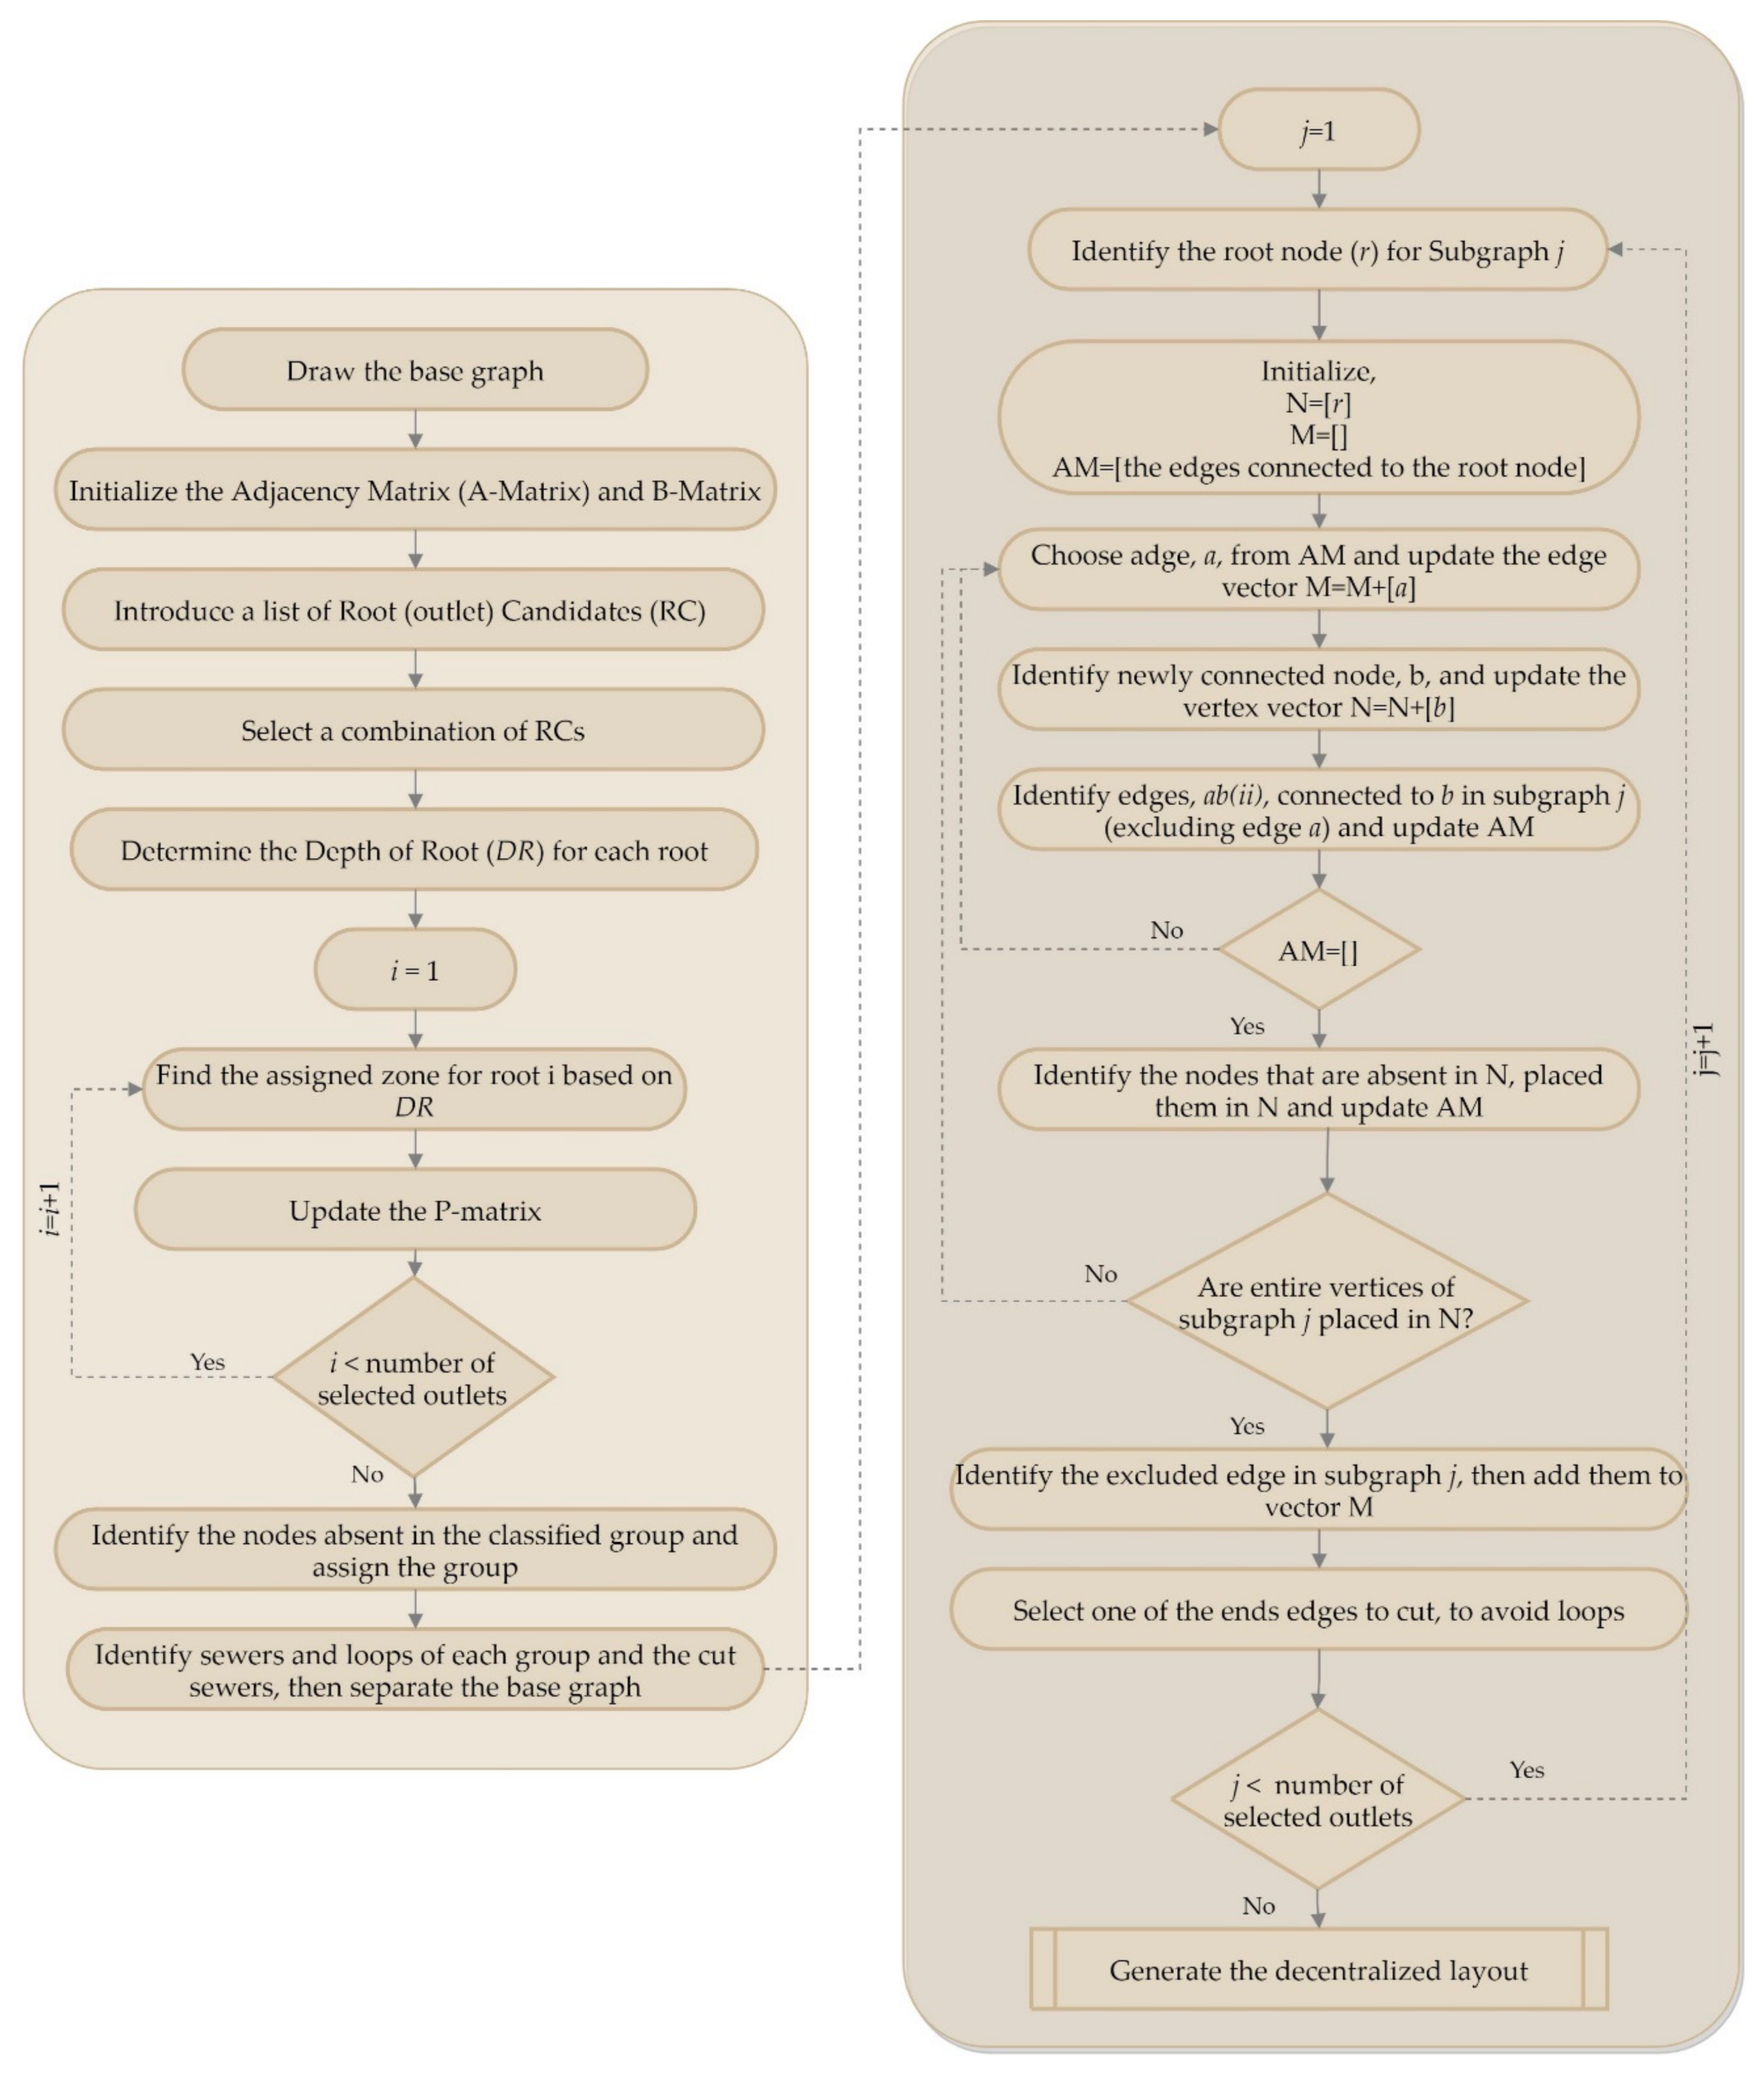
To generate a decentralized sewer layout, first the network’s base graph is drawn. In a base graph, all sewer possibilities are included so that manholes (vertices) and sewers (edges) constitute a connected cyclic graph. With respect to the street alignment, topology, barriers, watercourses, outlets, and existing sewers in the city, an undirected base graph can be drawn for the network [43]. To design feasible sewer layouts, an algorithm is developed to partition the base graph into several sub-base graphs and to extract spanning trees for each. The proposed algorithm used to generate decentralized layouts is described through the pseudocode in Figure 1. The base graph partitioning algorithm consisting of three modules is described below by solving a simple example.
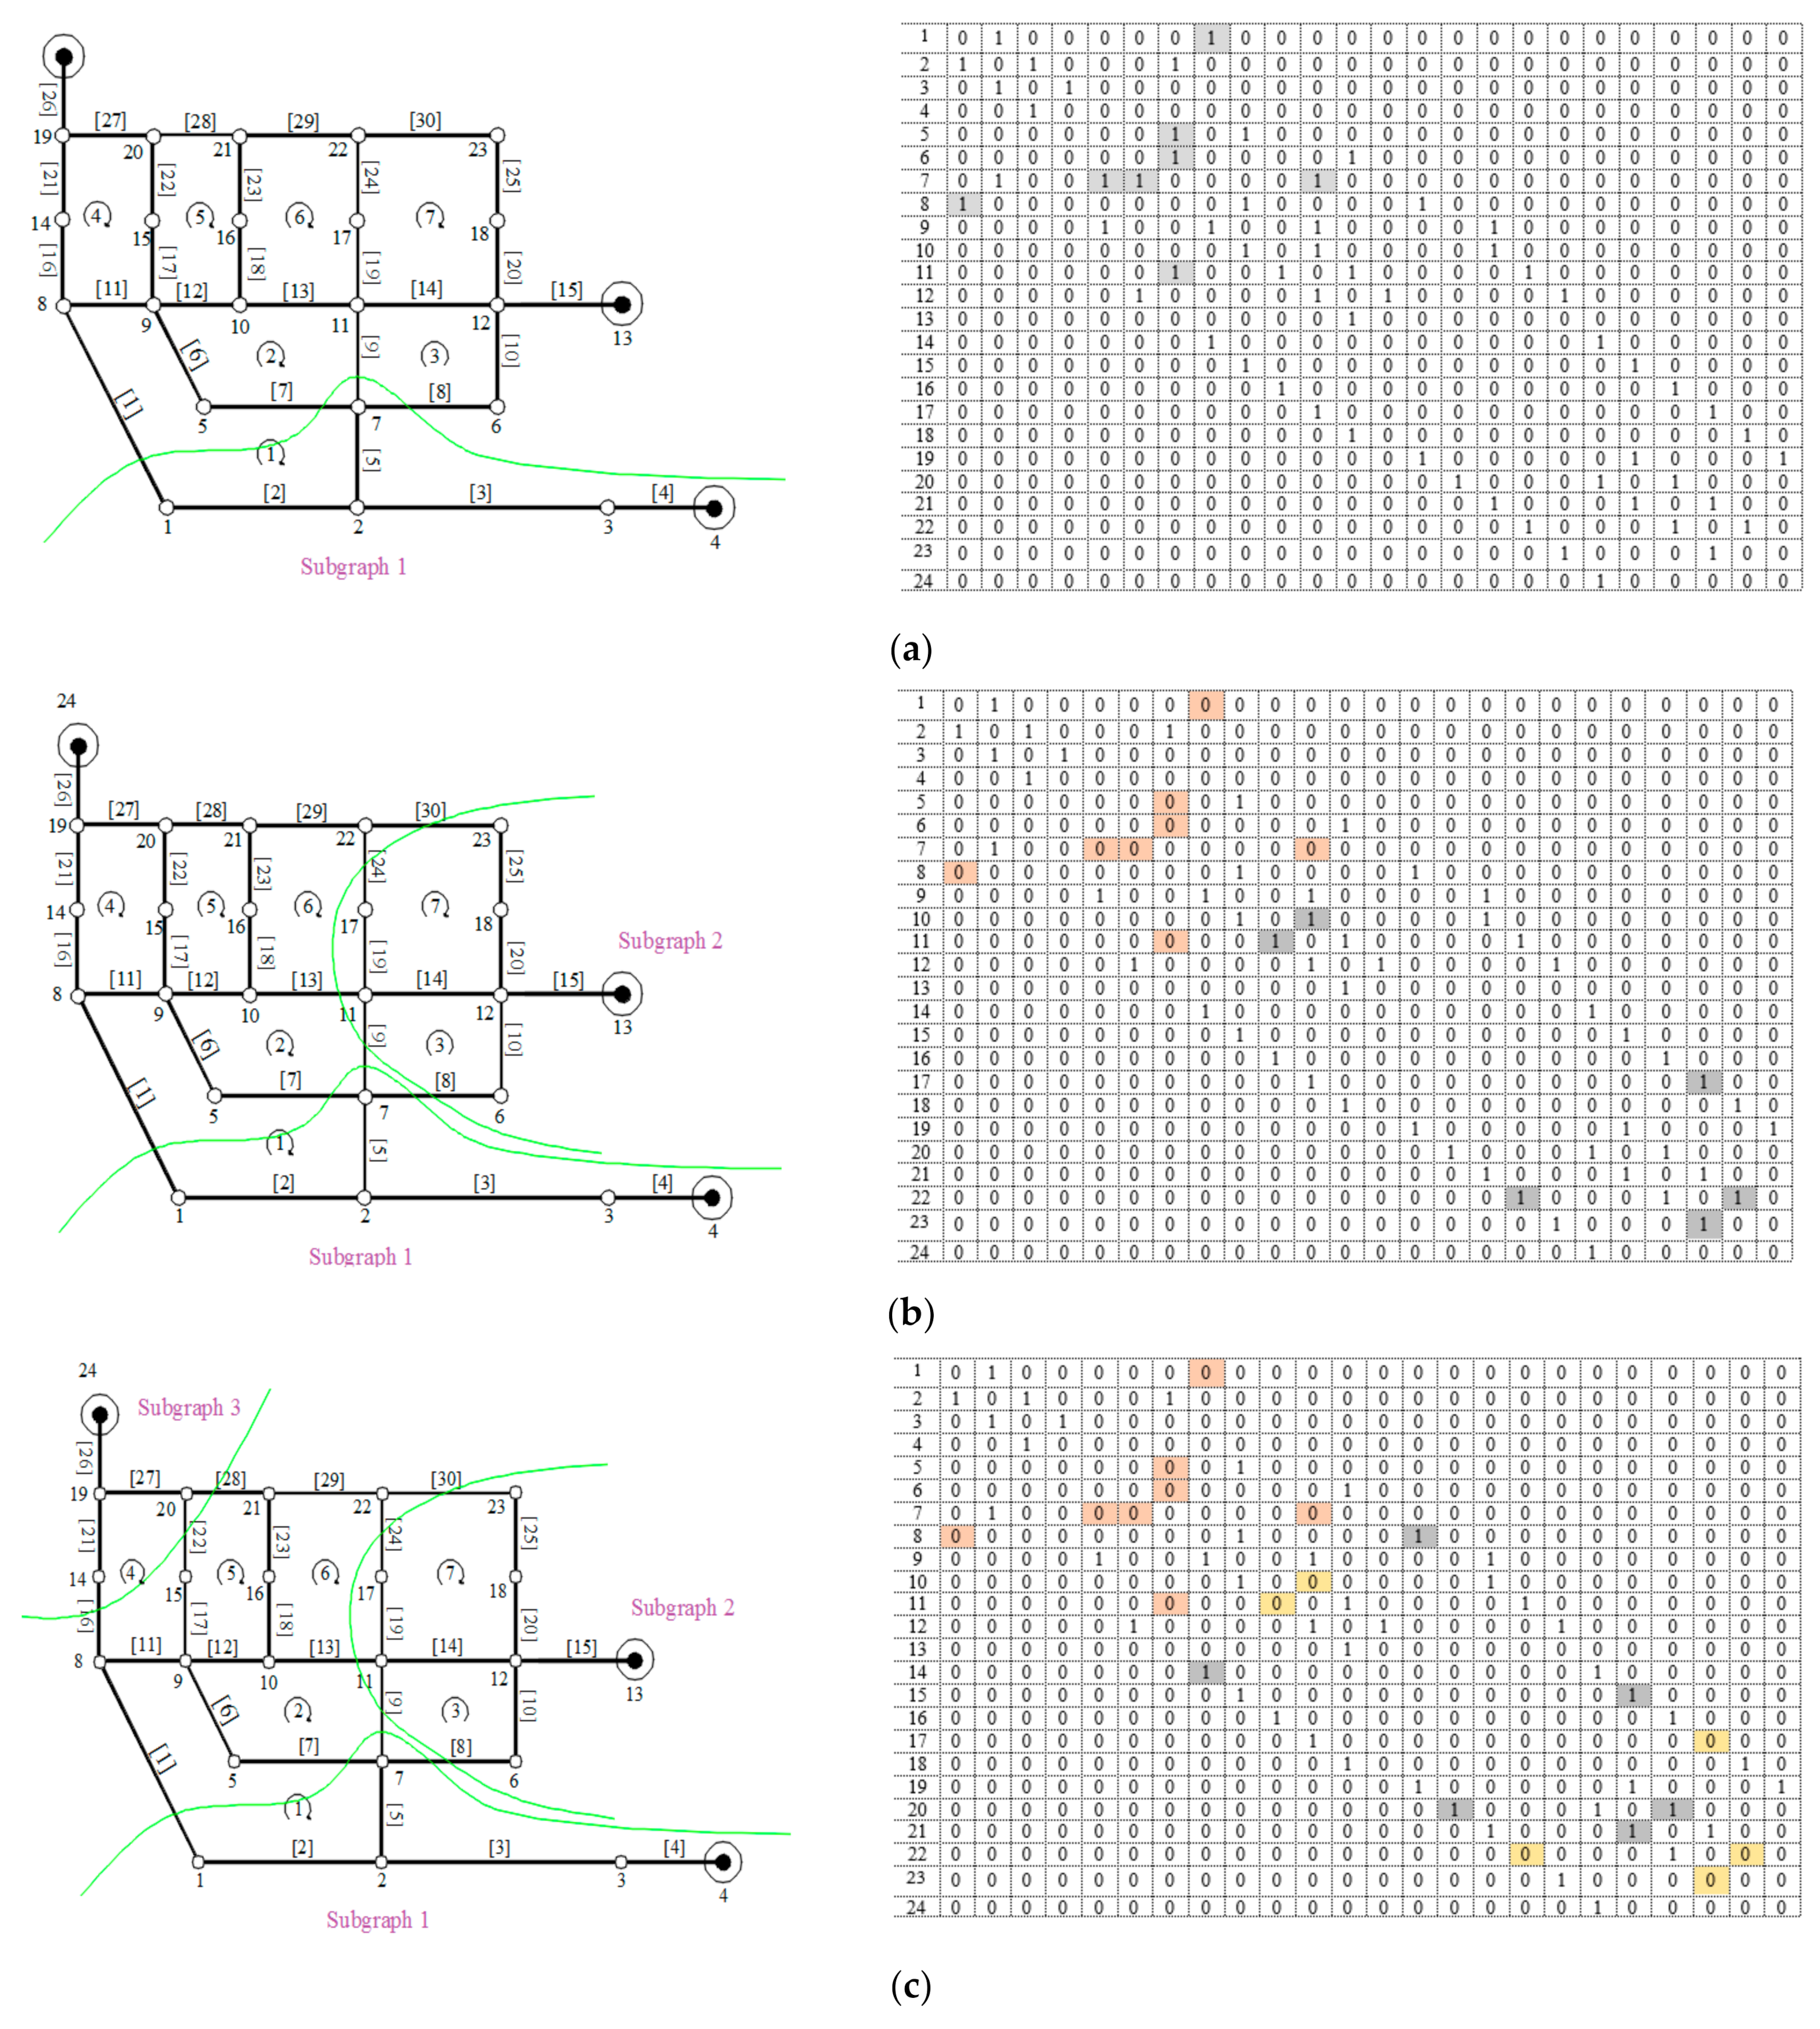
Figure 2a illustrates the base graph of a wastewater network. This graph is mathematically represented and introduced to the model by an adjacency matrix (A-Matrix, Figure 2c) and an information matrix (B-Matrix, Figure 2b) containing sewers and connections data. Let N be the number of nodes (manholes), M be the number of edges (sewers), and NL be the number of loops in the base graph. The B-Matrix involves M rows and NL+3 columns. Column 1 contains the sewer names from 1 to M, while columns 2 to NL+1 are sewer-in-loop indicators determining whether a sewer is in a loop (value 1) or not (value 0). Columns NL+2 and NL+3 include the sewer ends without any order, since the base graph is undirected. The adjacency matrix is an with binary elements; element (i, j) is 1 if nodes i and j are connected and zero if they are not connected.
2.4.1. The Assigned Zone to Each Root
The first step is finding the assigned zone to each root (outlet) and partitioning the base graph according to the number and location of roots. To this end, a notion called the depth of root (DR) is introduced here. Either engineering judgment or systematic optimization can determine a DR. This study employs optimization by defining a decision variable as follows:
where is a real value number in the range of (0, 1), R is the number of roots in the base graph, and is the path between the closest root and the desired root. The closest root to another root is the one with the shortest path. Finding the shortest path between two nodes is possible using the shortest path algorithms in the graph theory. Here, Dijkstra’s algorithm is adopted to calculate . The calculation of is performed based on the P-Matrix, which is initially equal to the adjacency matrix of the base graph A-Matrix.
For example, suppose nodes 4, 13, and 24 are potential roots in Figure 2a; thus, R = ([4,13,24]) is the vector of roots. Once a DR is found for a root, the nodes of the base graph whose shortest path to the root is smaller than the DR are classified into a group. For instance, for the first root (node 4), node 13 with is the closest root. Given that and , nodes 1, 2, 3, and 7 are classified into the group of root node 4 (Figure 3a). After this, in order to identify the assigned zone of the next root, some modifications are required. Since Nodes 1, 2, 3, and 7 have already been assigned to node 4, they are excluded from the base graph’s node set N. As the subgraphs should remain connected with the nodes excluded from N, the paths including nodes 1, 2, 3, and 7 are no longer used for the shortest paths in the following stages. Accordingly, the P-Matrix needs to be modified to identify the assigned nodes of the next root, node 13. This is performed by disconnecting nodes 1, 2, 3, and 7 from the node set N by setting elements (7, 6), (7, 5), (7, 11), and (1, 8) to zero in the P-Matrix. The elements related to nodes 2 and 3 do not require modification as they are not connected to the node-set N. It is also worth noting that nodes 1 and 7 are now called upstream nodes. This approach is implemented step-by-step until all members of vector R are covered.
Figure 3 demonstrates a schematic of the proposed procedure on the base graph. Once the above procedure is implemented for all roots, the base graph vertices absent in the classified groups are identified and assigned to relevant groups. As mentioned, the subgraphs must remain connected; thus, the strategy selected for this purpose is based on the development of subgraphs through the upstream nodes. For example, to assign the nodes of set N to subgraphs, subgraph 1 develops through nodes 1 and 7; subgraph 2 develops through nodes 11, 17, and 23; and subgraph 3 develops through nodes 14 and 20. Using the adjacency matrix, the A-Matrix, the nodes connected to the upstream nodes of these subgraphs are identified and considered new upstream nodes of the corresponding group. It should be noted that set N needs to be updated at each node assignment step. These steps continue until the all nodes of set N are assigned to the subgraphs.
2.4.2. Base Graph Partitioning
Once the assigned zone for each root is determined, the base subgraphs are extracted through the following steps:
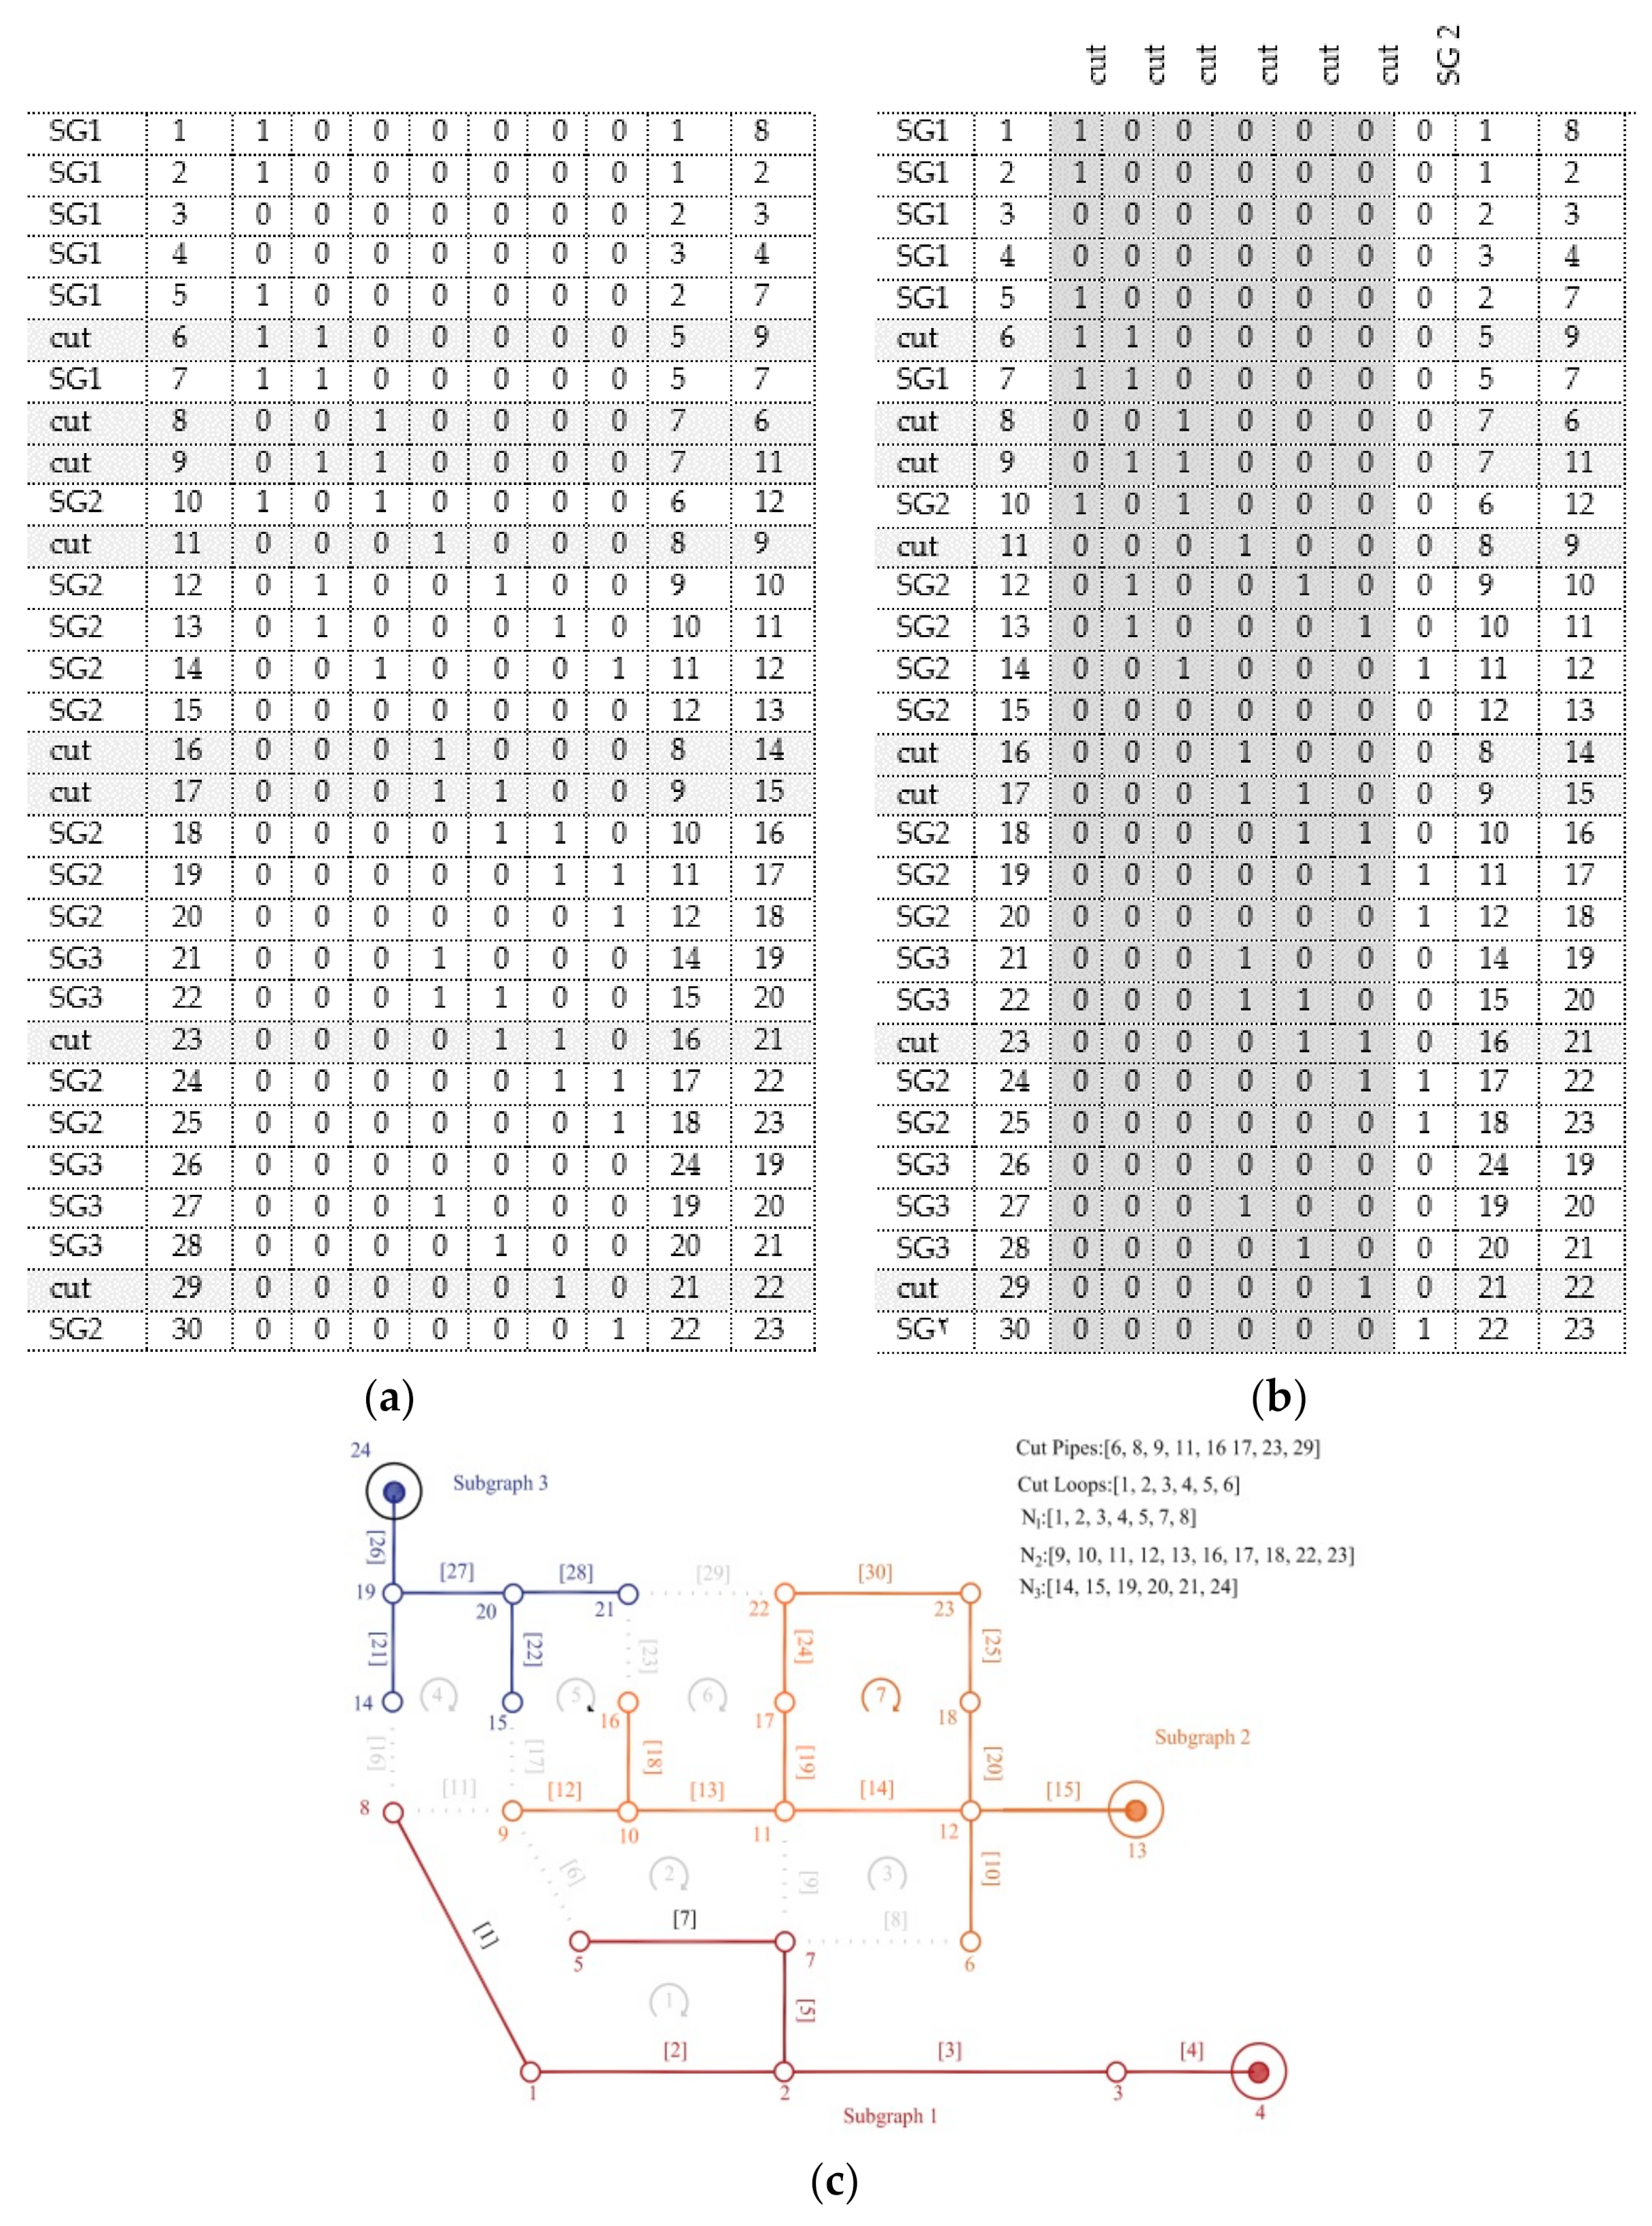
- The sewers of each subgraph are identified. For each sewer in the B-Matrix, the upstream and downstream nodes are identified. If the nodes are in the same group, the corresponding sewer belongs to that group; otherwise, it is a cut sewer;
- The loops of each subgraph are identified. For each loop in the B-Matrix, the corresponding sewers are placed. If there are cut sewers among the sewers of a loop, the loop is excluded; otherwise, the sewers of the loop indicate to which subgraph the loop belongs.
After the sewers and loops of each base subgraph are identified (Figure 4), their corresponding B-Matrices are created.
2.4.3. Generating the Spanning Trees of Base Subgraphs
A feasible layout for a decentralized sewer network is a forest of spanning trees with roots each, including a treatment plant. The present study adopts the algorithm of growing spanning trees (Walters and Smith 1995) to extract the tree-like sewer network from the undirected looped base graphs. Through this approach, a sewer of each loop is cut rather than excluded. In the growing spanning tree method, each tree begins to grow from a root defining three growing vectors:
- (i)
- Vector , consisting of the edges (sewers) of the growing tree;
- (ii)
- Vector , consisting of the vertices (nodes or manholes) of the growing tree;
- (iii)
- Vector , consisting of the base graph edges adjacent to the growing tree. Each of these edges may be considered a decision variable in order to construct another growing tree branch.
According to the above definitions, the spanning tree growth algorithm applied to the base graph includes the following steps:
- The root node, root r, is identified;
- The vector N is initialized with a single member . No edge has yet been selected, meaning ;
- The AM vector is updated in each stage; in the beginning, only edges connected to the root are included, i.e., (the edges connected to the root node);
- An edge from vector is chosen through optimization. For this purpose, a decision variable () in the range of (0, 1) is defined and is the total number of vertices in the base graph. Let be the current number of adjacent edges; the chosen edge number from variable is as follows, where represents the sewer “a” in the network;
- The edge vector is updated, ;
- The selection of edge “a” adds a new vertex “b” to the growing tree; therefore, it is required to update the vertex vector, ;
- All edges except “a” connected to vertex “b” are denoted as ;
- Vector is updated by excluding edge “a” and adding edges . then contains all choices for the next edge of the growing tree. Before going to the next step, the following query should be applied to each new member of to make it feasible: Is already in or are both end nodes of present in ?If yes, then edge is removed from , since its selection causes a loop in the growing tree; ; if no, vector is acceptable;
- The algorithm goes back to step 5 and the tree continues growing until vector becomes empty. After this, a branch of the growing tree is generated, including vertices of the base graph and edges according to variables to ;
- The vertices of the base graph that are not present in the vertex vector are identified. The number of these vertices is ;
- A vertex absent in is selected and placed in and vector is updated accordingly. Then, the algorithm goes to step 5 and a new edge is identified using Equation (10);
- This process continues until all absent vertices are placed in . The algorithm eventually generates a root-ending spanning tree based on the decision variables ; however, there are a number of excluded sewers—as many as the number of loops in the base graph. These sewers must be included in the final design of the sewer network. To meet this constraint, the following modification is applied;
- Let be the number of edges in the base graph. The number of edges in the grown spanning tree at the end of the previous step is . The excluded edges are identified as and added to vector ;
- Since the excluded edges are returned to the spanning tree, they should be cut to avoid loops. For this purpose, one of the ends of the edge is selected to be cut. This introduces another decision variable to the problem. A binary variable ) is used for this purpose. When , the edge is cut from its upstream, otherwise it is cut from the downstream. As an is cut, a new vertex appears at the truncation end, which is named . The process continues until all elements are cut.
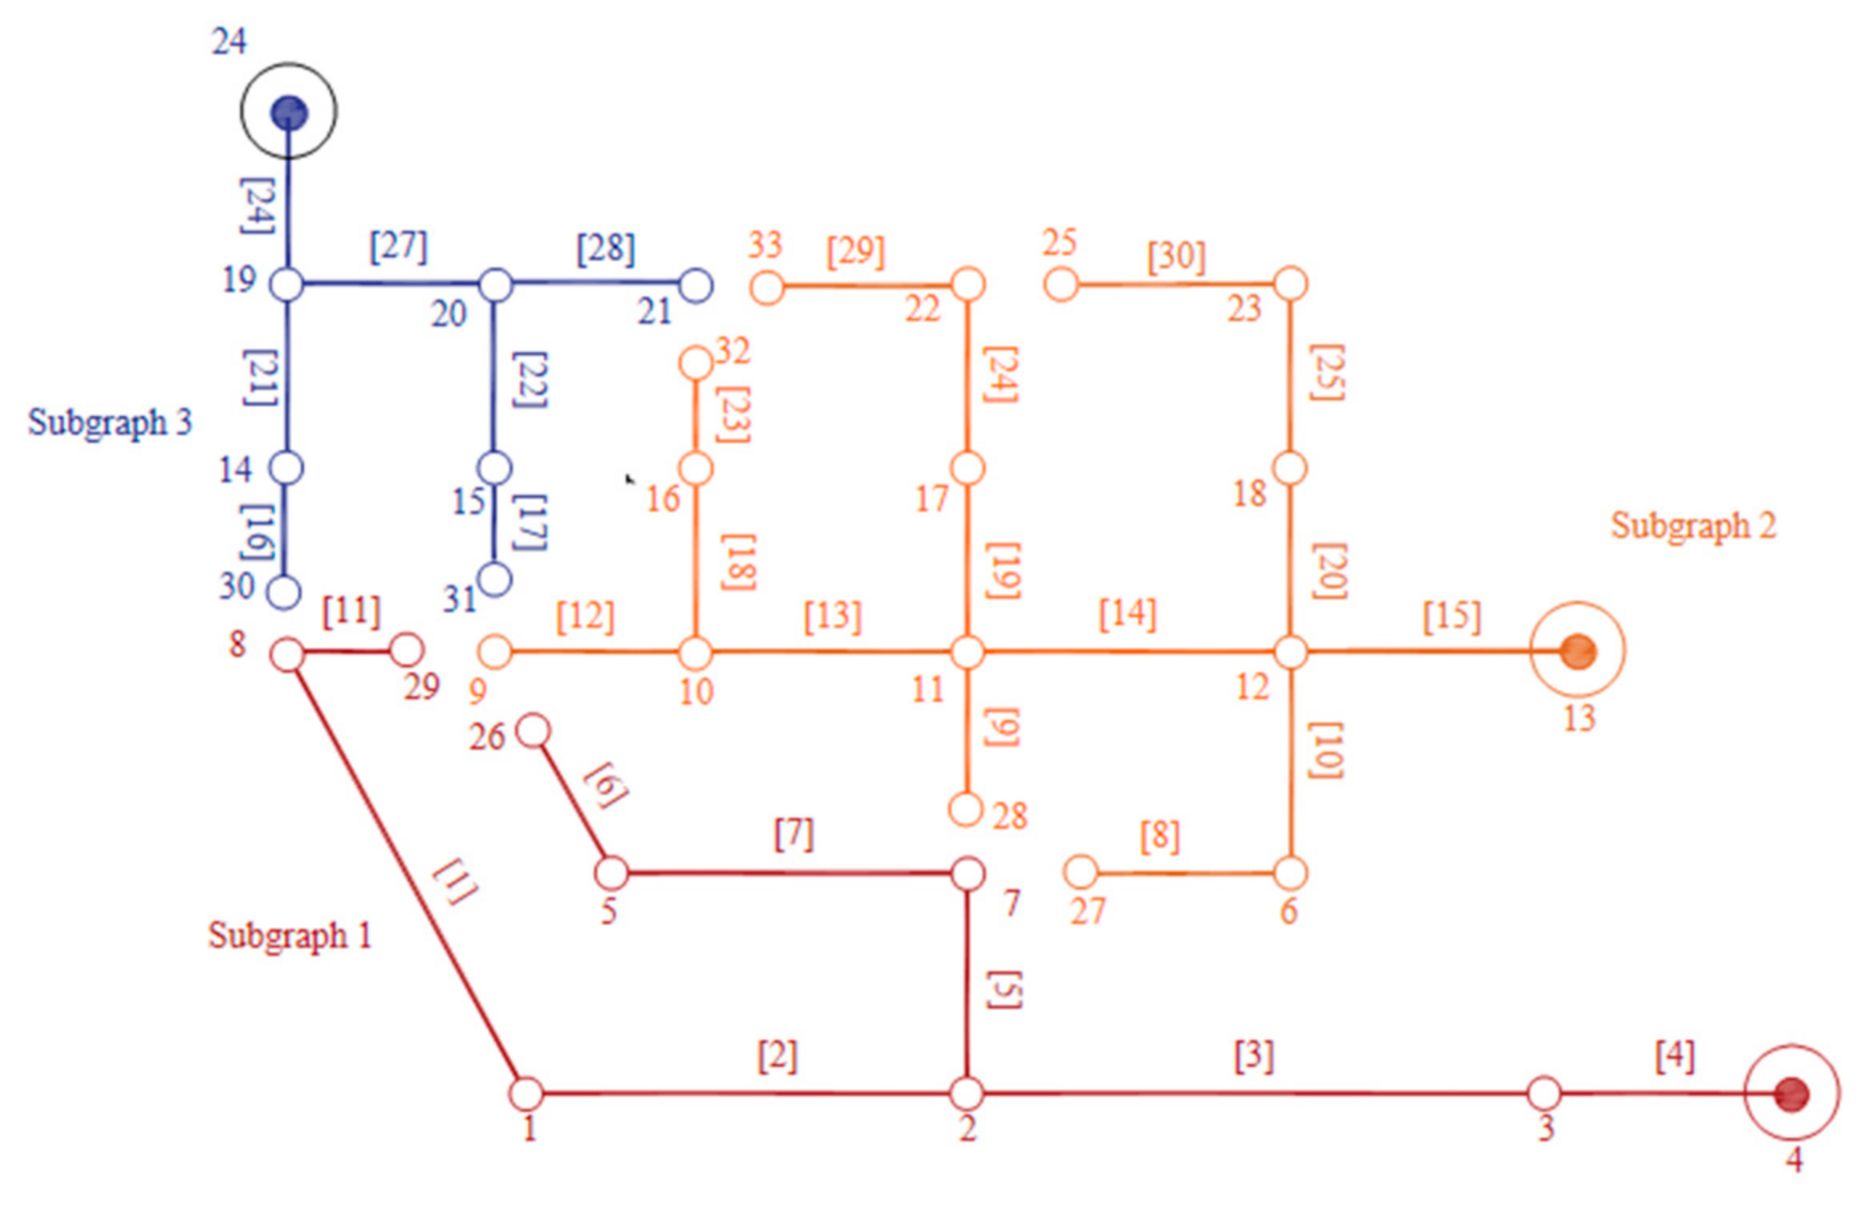
Eventually, all excluded edges are added to the tree, while c new vertices (vertex n + 1 to n + c) are created in the network. Then, a feasible wastewater collection network is at hand, whose edges can be easily directed to the root node r as shown in Figure 5.
The proposed algorithm is applied to all partitions of the base graph to extract the base graph’s spanning forest (decentralized layout). Figure 6 explains this algorithm schematically.
2.5. Solving Subproblem 2: Hydraulic Design of the Network
After generating layouts, the second subproblem is the hydraulic design (sizing) of the sewer diameters (d), slopes (s), and pump stations (p) for each layout directed to a root. This subproblem includes many complex constraints, which are nonlinear and discrete, and should be satisfied ordinarily. Handling such constraints introduces intractable challenges to the design of sewer systems. For this purpose, a hydraulic design algorithm proposed by Haghighi and Bakhshipour (2012) [15] is adopted in this study. Employing this approach, the entire design criteria and constraints of wastewater collection networks are systematically satisfied through a self-adaptive step-by-step hydraulic design algorithm; therefore, there is no need to impose any penalty function on the objective functions used to handle the constraints. This capability is a significant relief for the optimization process and dramatically reduces blind searches to approach feasible decision spaces.
3. Case Study
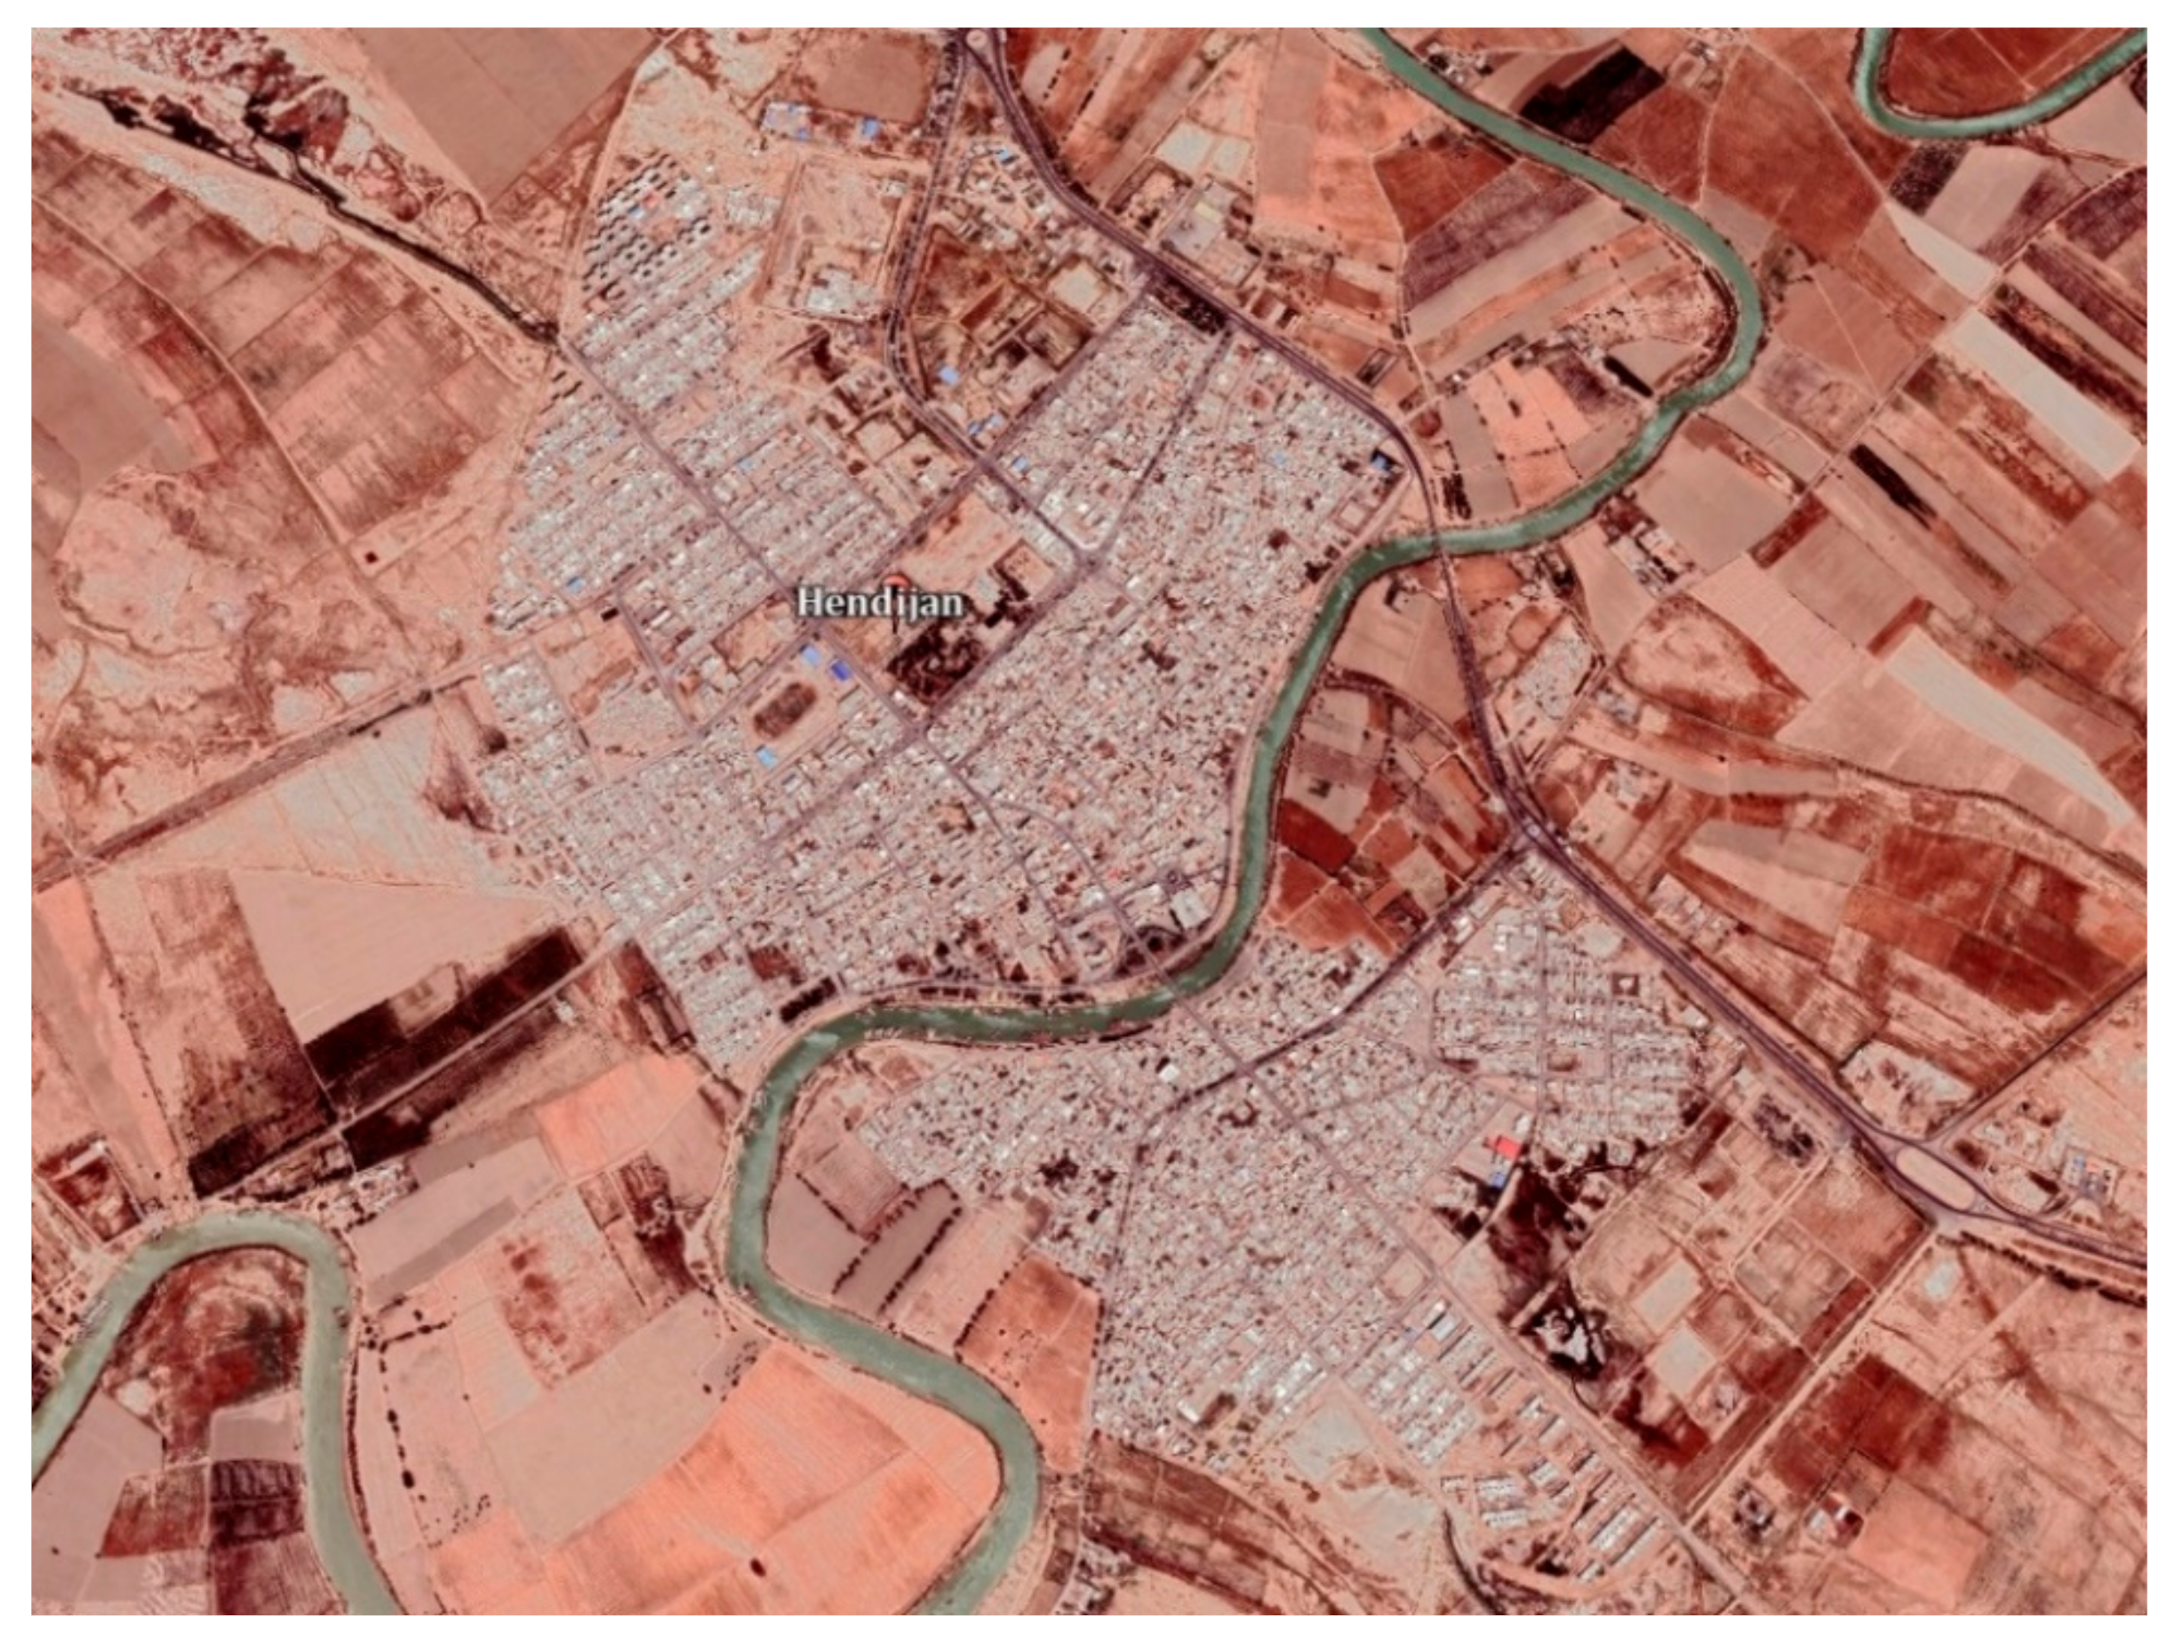
As a case study to investigate the proposed algorithms, the sewage collection network of Hendijan city, located in the southwest of Iran (Figure 7), with about 700 hectares area and a population of 50,000, was designed. Some natural features of this city have made it a suitable candidate for developing a decentralized sewer network. The city crosses a large river dividing it into northern and southern parts, has high-level groundwater due to its proximity to the Persian Gulf, is fully flat in topography, and has poor geotechnical conditions, which are the main challenges for designing a fully centralized sewer network. In such a case, a feasibility study for decentralized systems is necessary.
The base graph (Figure 8) of Hendijan city’s sewer network consists of 208 sewers, 64 loops, and 8 candidate locations for treatment plant installation (i.e., network roots). Table 1 represents the hydraulic and other technical criteria and the constraints on the network design, while Table 2 shows the problem’s decision variables. Due to lack of space and other regional limitations, only the treatment plant at candidate location T.P. 8 can treat 100% of the produced wastewater in this area. The treatment plant at location T.P. 3 can treat up to 75%, while the plants at the other candidate locations can treat 50% of the total wastewater at most.
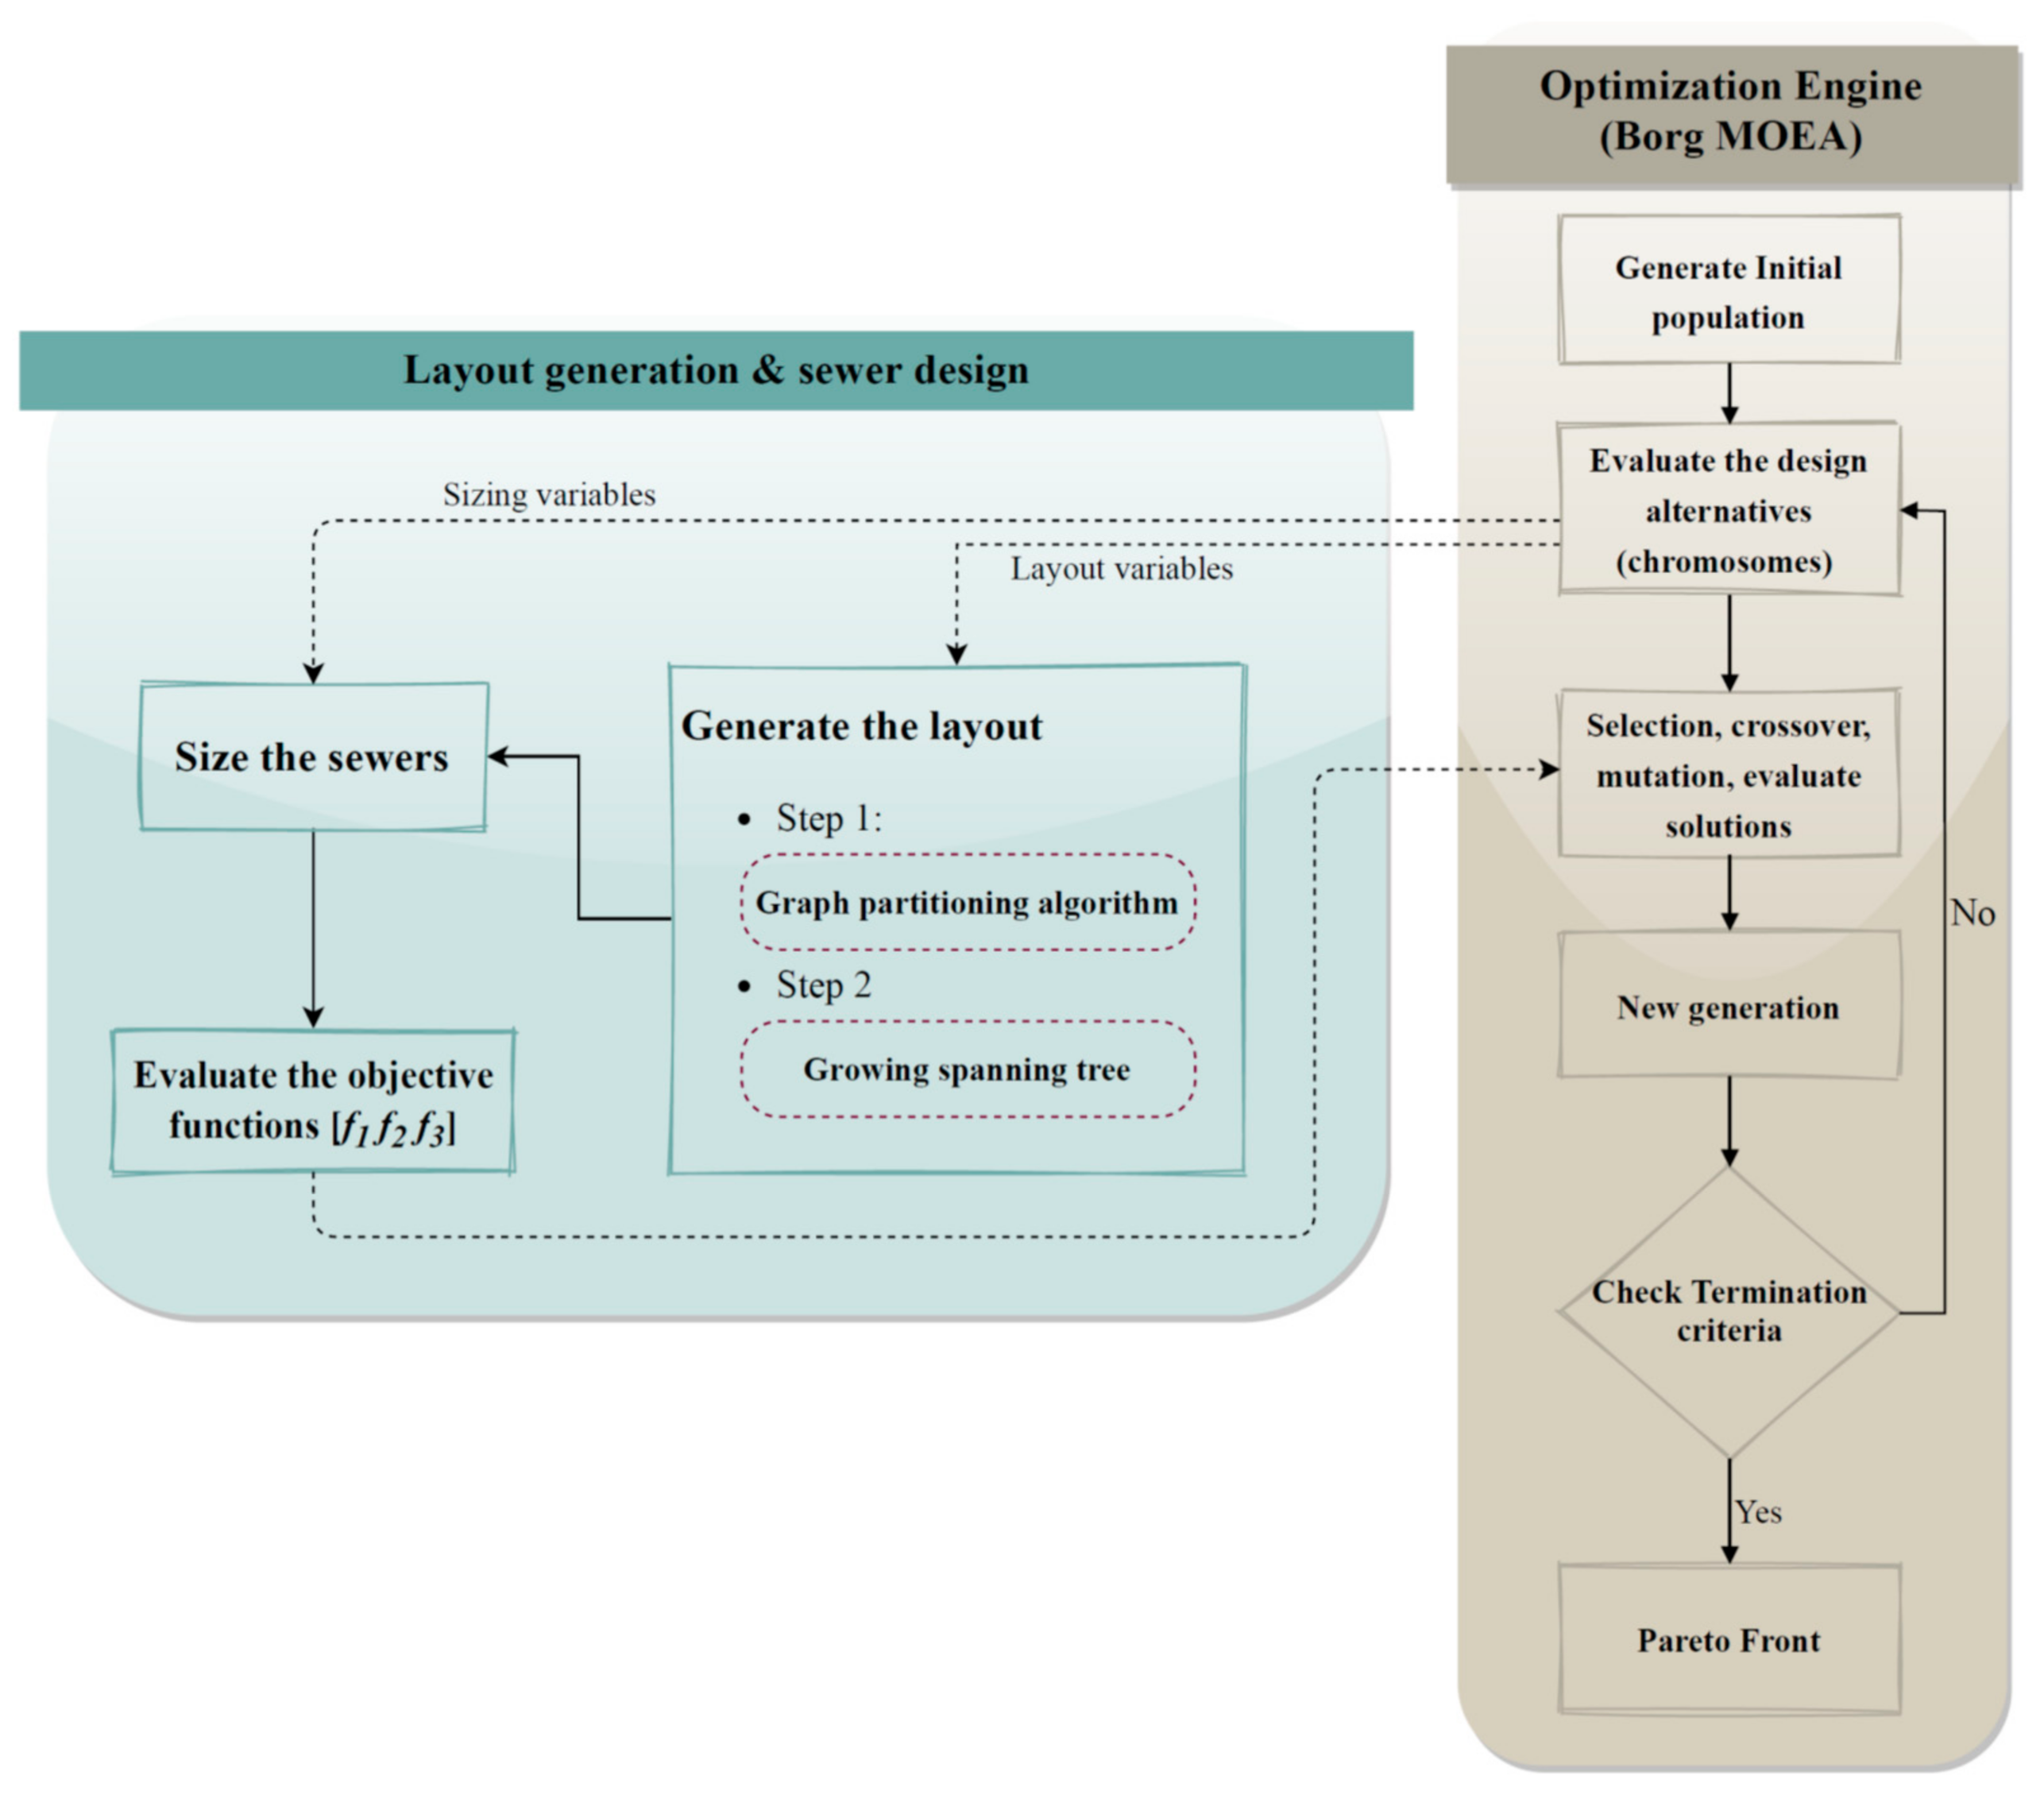
To set up the optimization model, the number and locations of the roots (treatment plants) and layout and hydraulic design parameters are considered the decision variables. Then, to drive the optimum trade-off between the objective functions, the construction and operation costs (Table 3), the network structural resilience (Equation (5)), and the degree of centralization (Equation (6)), the Borg multiobjective solver is applied.
According to the described framework, the optimization generates and optimizes the layouts and hydraulic design parameters simultaneously. In contrast, all physical constraints and design criteria for both subproblems (layout and hydraulic designs) are systematically satisfied in the algorithms. The process continues until the best Pareto front is achieved (Figure 9).
It is also worth mentioning that for this case study, initially the costs of a wide range of sewer diameter sizes with different buried depths were estimated to derive the cost functions of sewers and manholes through mathematical regression (Table 3). Similarly, the costs for a wide range of pumping stations and wastewater treatment plants (the sequential batch reactor process) with different flow rates and pumping heads were estimated to attain the corresponding cost functions in Table 3. Although the derived cost functions may have uncertainty and errors, they help state the problem mathematically and facilitate automated optimization. In addition, since they are used in optimization to compare the design alternatives, the errors mentioned above would not play a significant role in the comparative nature of optimization.
4. Results and Discussion
After optimization, it was found that on average, 200,000 (de)centralized layouts were generated and hydraulically designed and evaluated during a multiobjective run. The computational time for solving the case study was estimated at around 15 h using a personal laptop with an Intel(R) Core i7-7700HQ CPU, 2.8 GHz quad-core CPU, and 16 GB random access memory (RAM).
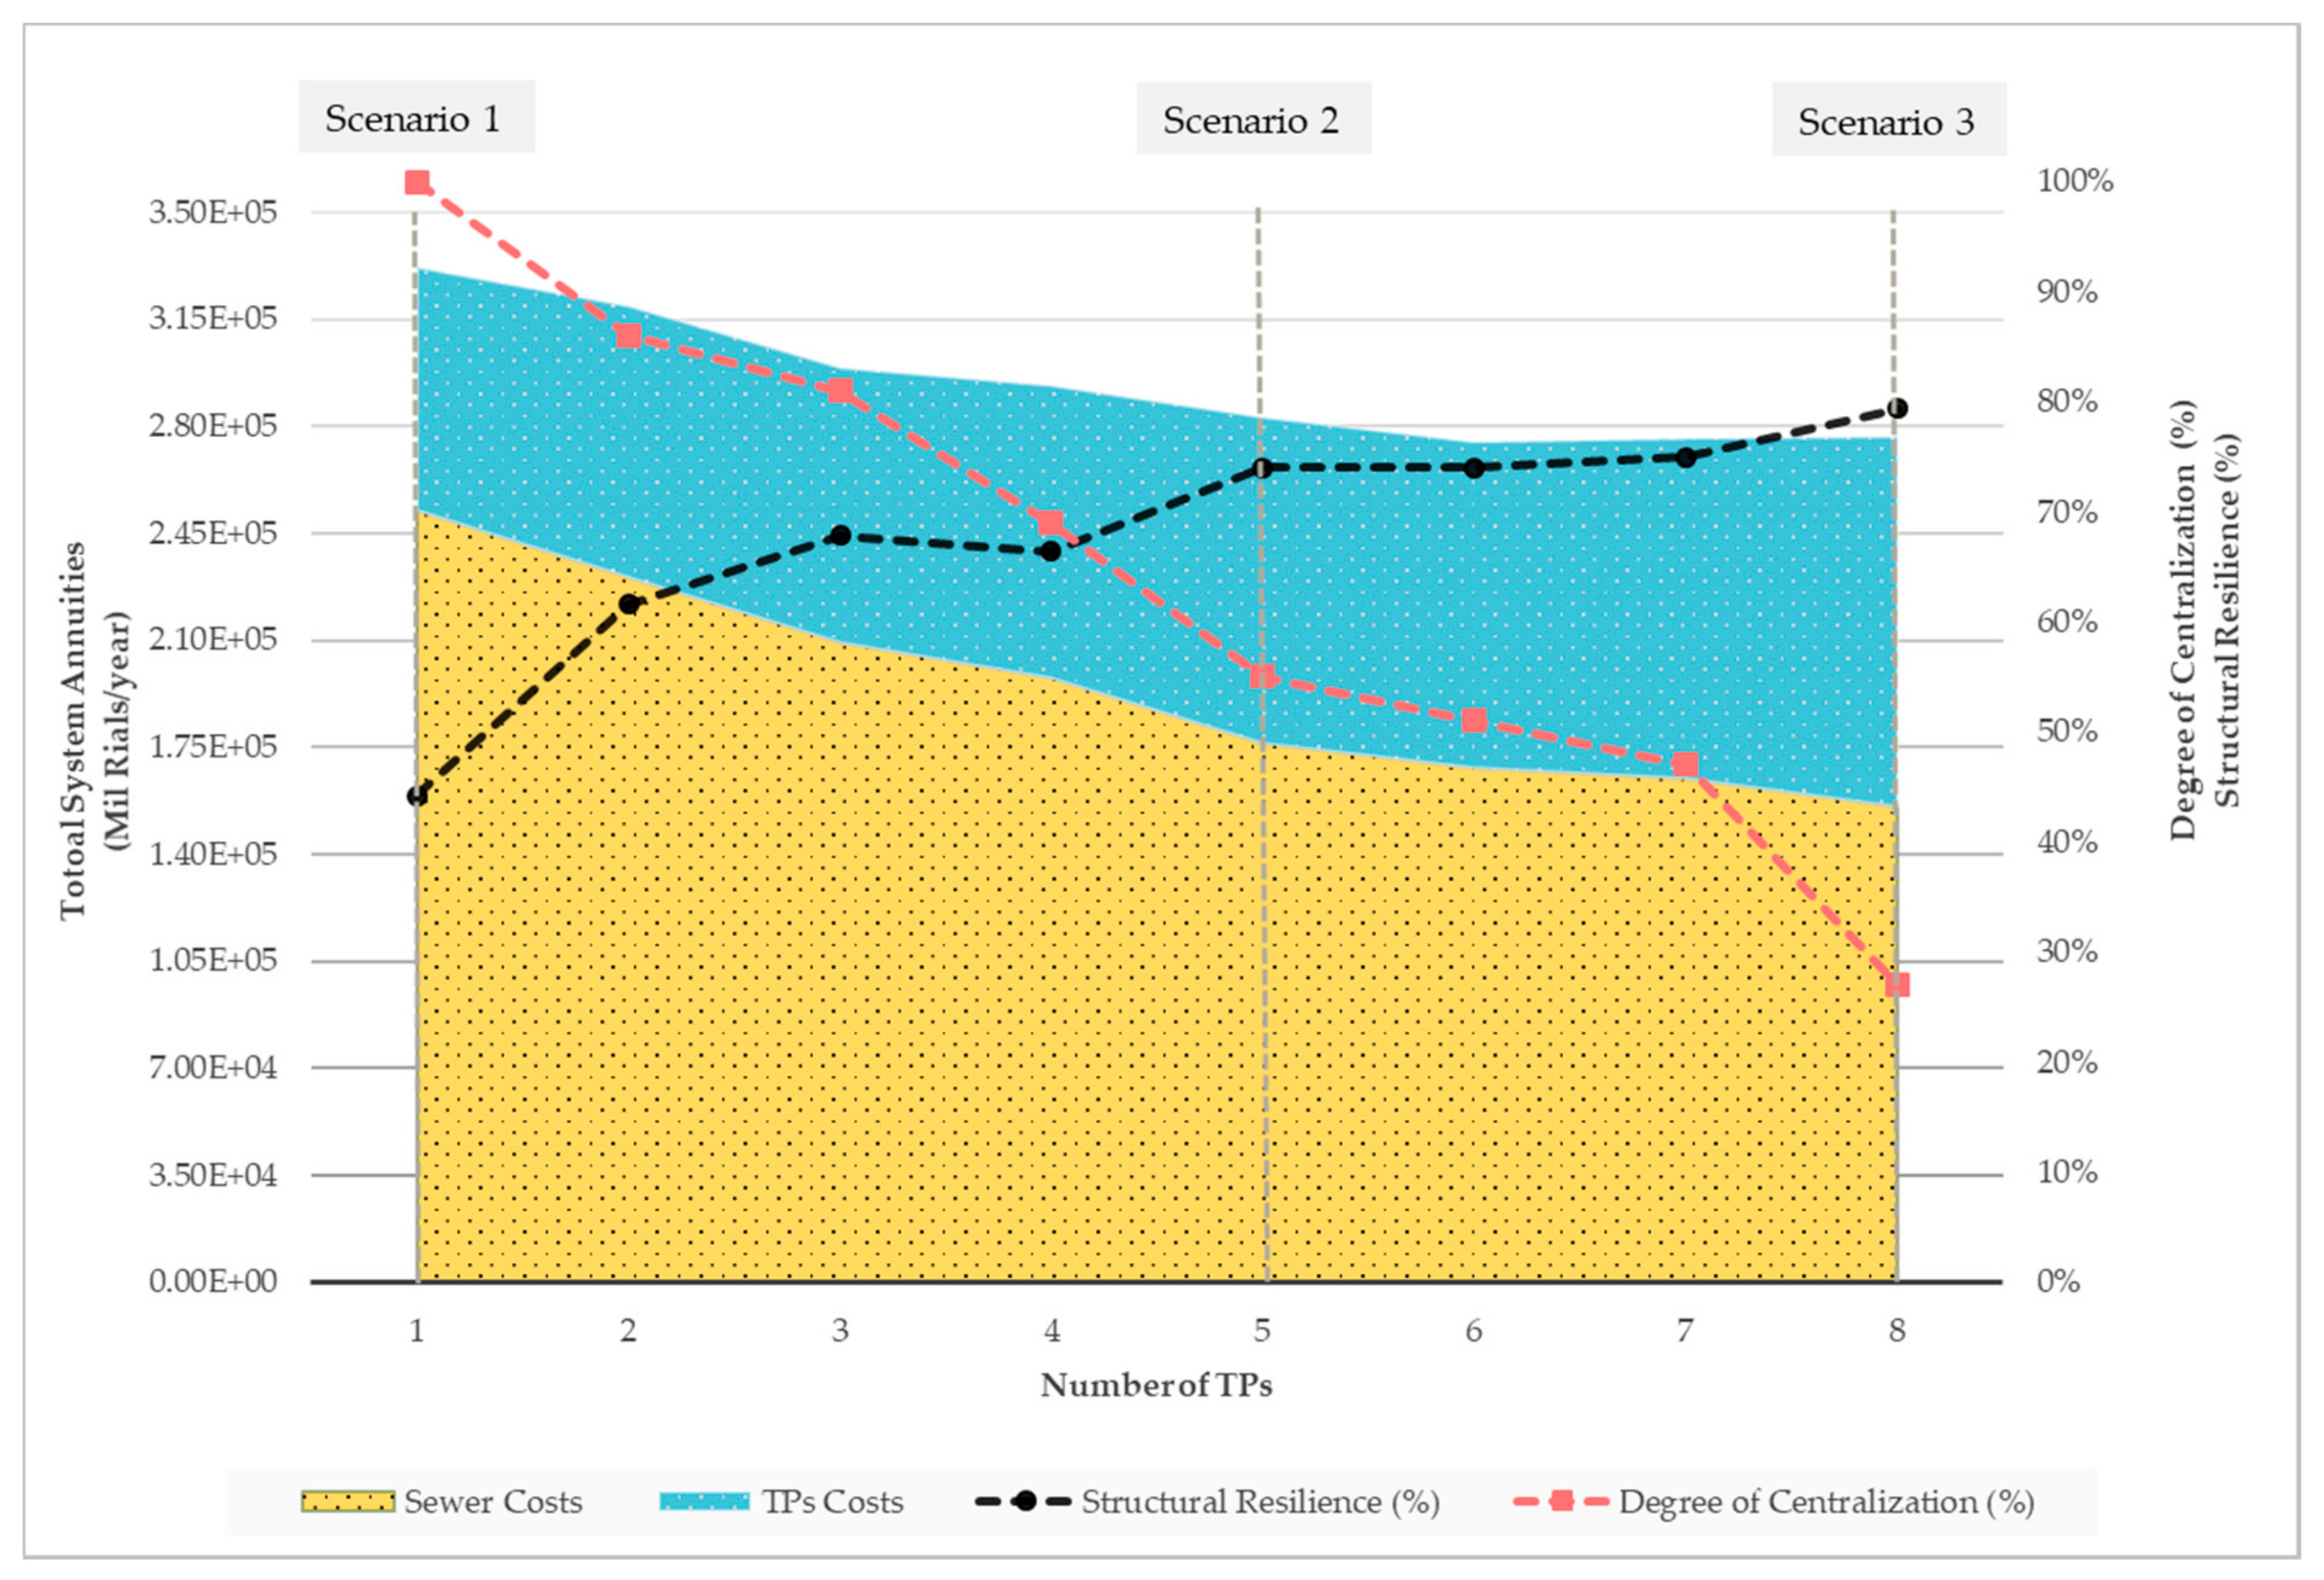
Certain optimum solutions with a different number of treatment plants were chosen from the obtained Pareto front for presentation in Figure 10 (8 optimum designs in total). Three designs among them were considered for further investigation through the following scenarios:
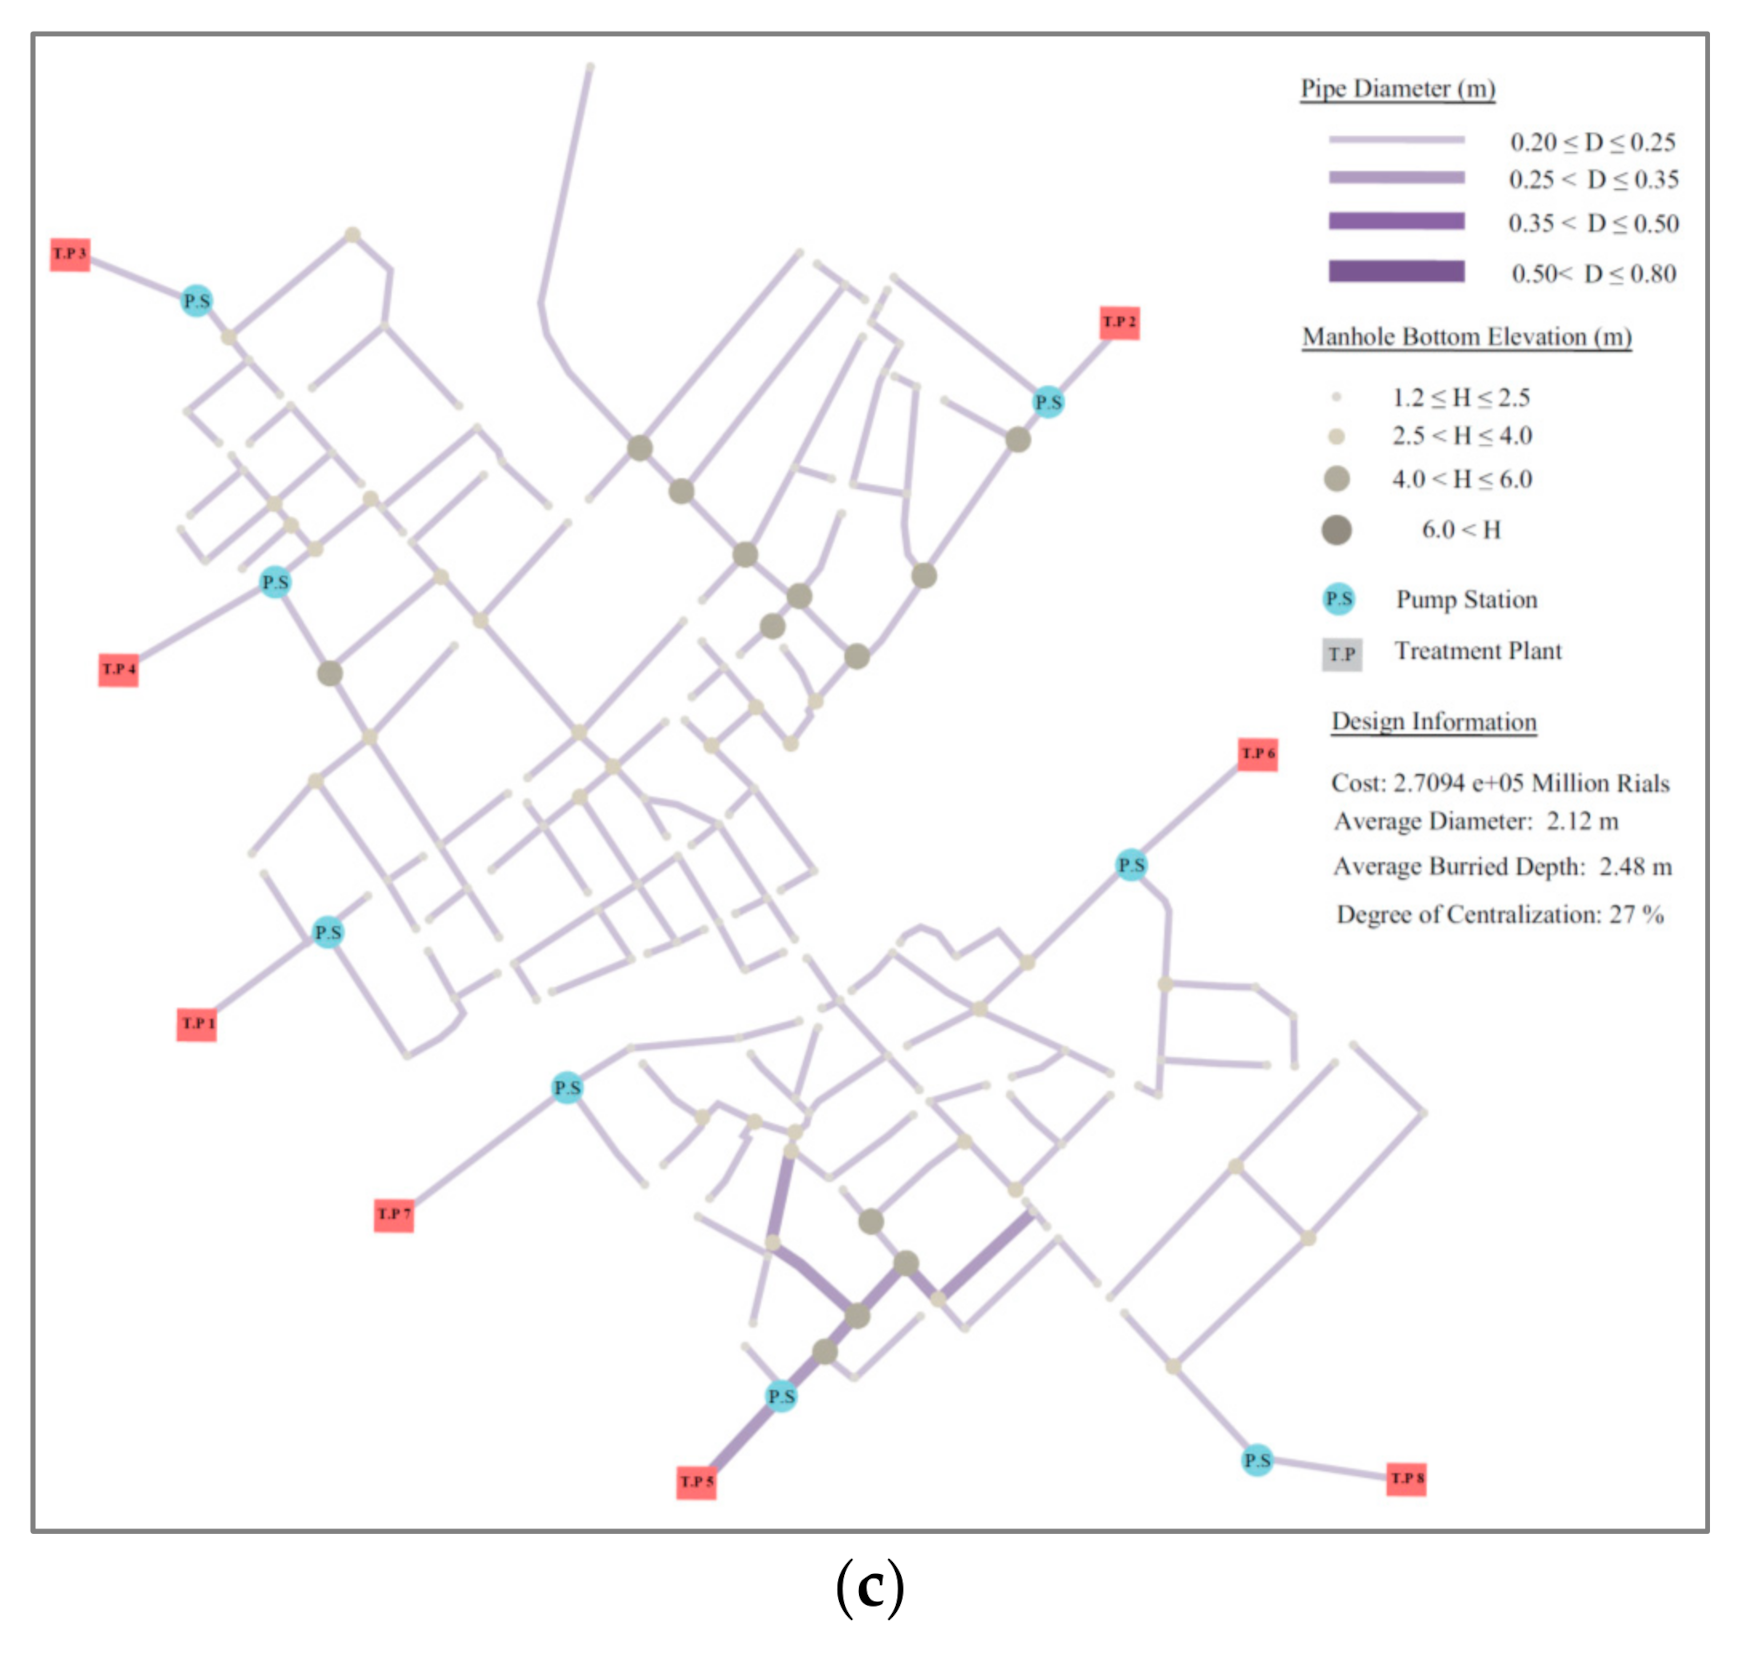
The last scenario cannot be called a fully decentralized design, since by definition DC is a function of both the number of network roots and the sewage flow distribution between the network’s sublayouts. The minimum DC found for this case study is about 27%.
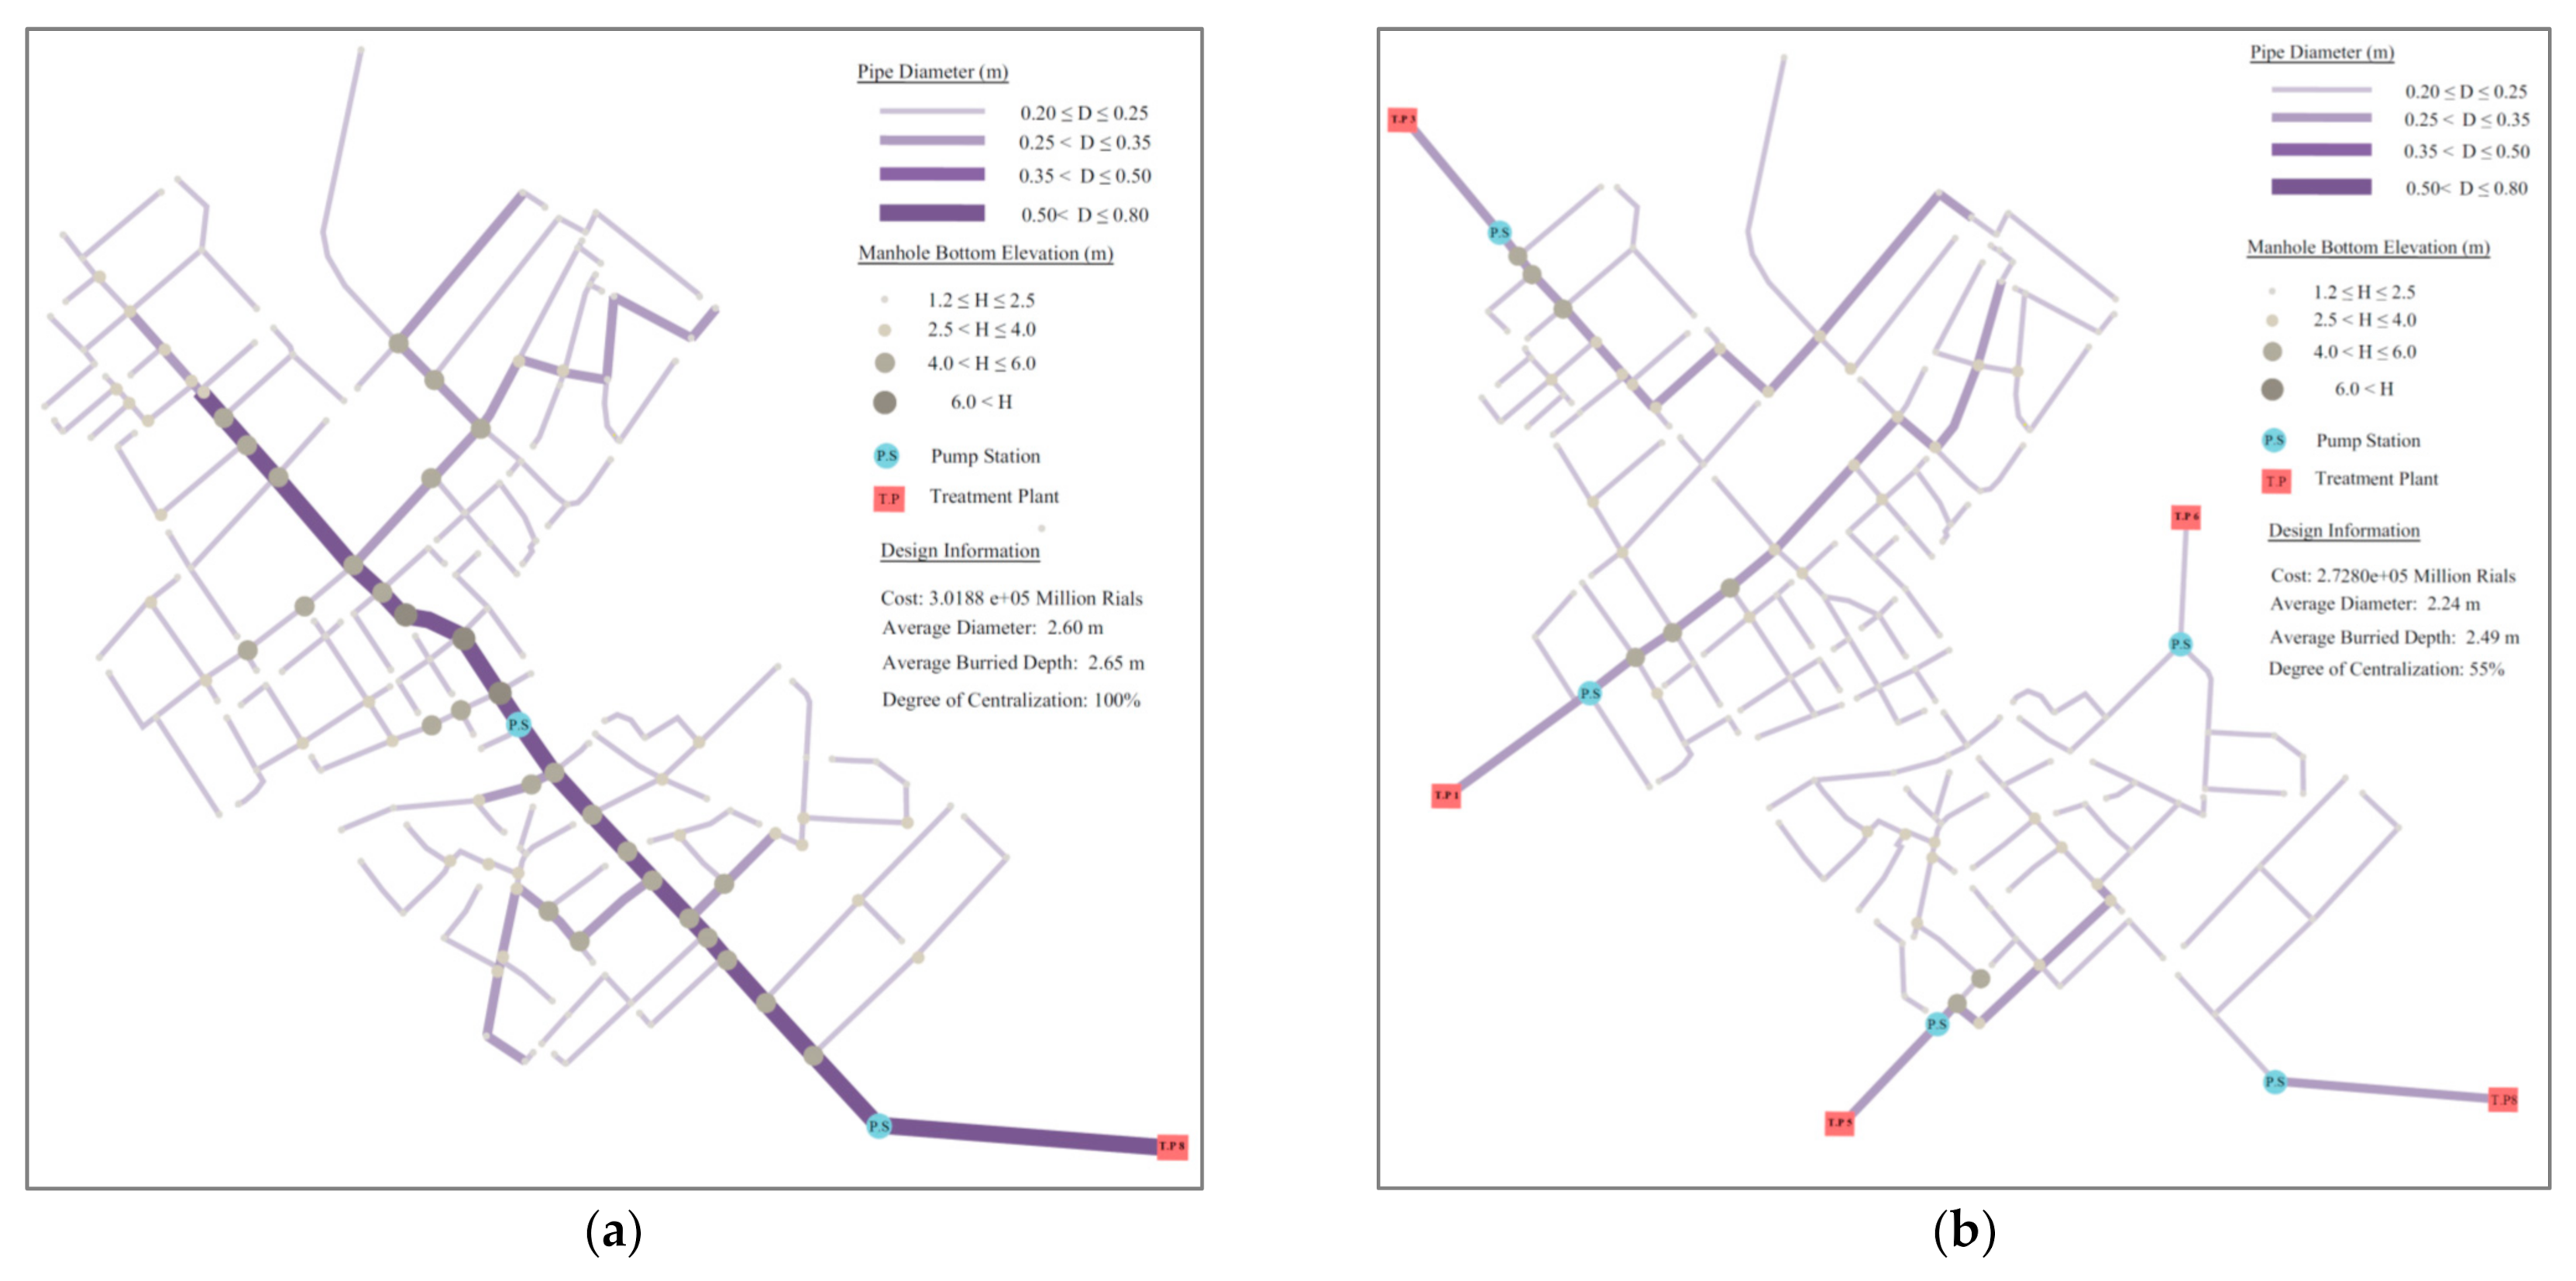
As expected, solving the case study revealed that most of the entire budget for constructing and operating a centralized sewage collection network is spent on the sewers. In scenario 1, around 24% of the total cost is spent on a single wastewater treatment plant (scenario 1). At the same time, in the most decentralized design with 8 treatment plants (scenario 3), the portion of total cost spent on treatment plants increases to about 44%. In other words, as the number of treatment plants increases, toward the more decentralized network, the cost of the sewer system decreases because of the reductions in excavation depths and sewer diameter sizes and the need for pumping energy. Conversely, the total costs for construction and operation of multiple small treatment facilities increase. Indeed, economies of scale are essential issues to consider when designing a decentralized urban water system. Multiobjective optimization is a helpful tool to investigate this importance, as applied to the case study.
Figure 10 shows that the total annuities of the system do not change significantly for DCs above 55%, corresponding to design alternatives with more than 5 treatment plants (scenario 2). In these cases, the other considerations and criteria might be used to differentiate the optimum designs. Table 4 provides a comprehensive comparison between scenarios 1 to 3.
As shown in Figure 10, decentralization strikingly increases the structural resilience by distributing the risk of system failure between multiple small subsystems. The structural resilience is increased from 44% in the fully centralized design in scenario 1 to 79% in the most decentralized system in scenario 3. According to Figure 10, the structural resilience of the optimum design in scenario 2 with is 74%, which is very close to the most decentralized system in scenario 3. In other words, it is concluded that the decentralization benefits in terms of the both the system costs and structural resilience do not improve dramatically for . Obviously, this finding is case-dependent, and different results are expected for different case studies.
5. Summary and Conclusions
Wastewater management systems rely heavily on network-based infrastructure, traditionally designed and constructed with a high degree of centralization, conveying the whole collected sewage flow to a large treatment plant very far from urban areas. In general, centralized sewer networks are expensive in terms of construction, operation, maintenance, and upgrades. They also cause serious concerns regarding long-term sustainability, resilience, and adaptiveness to upcoming challenges such as rapid urbanization. The challenges associated with centralized sewer networks are much more significant in flat areas and when water recycling and reuse are of interest.
Recent studies have proposed a shift from centralized systems to decentralized ones to overcome the challenges mentioned above. The superiority of decentralized sewer systems over centralized systems is case-dependent, although they are generally found to be more cost-effective and resilient if their network configuration and degree of centralization are optimized. This requires sophisticated graph-based algorithms for layout design and multiobjective optimization.
The current study introduced a new algorithm to generate all feasible layouts of a decentralized sewer network, resulting in a wide range of degrees of centralization. The layout generator algorithm was coupled to a self-adaptive hydraulic design model to measure the network components hydraulically. A multiobjective optimization problem was introduced to find the optimum trade-off between the cost, resilience, and degree of centralization for the network at hand. The optimization problem is quite self-adaptive, without any penalty function. It optimizes the network’s layout and hydraulic components implicitly.
The proposed model was applied to a coastal city in Iran. The city is flat with a large river running through it, the groundwater level is high, and the geotechnical conditions are unfavorable, making the installation of deep and large sewers expensive. These issues made the case study a proper candidate for investigating the advantages of decentralized sewer networks. The results demonstrated the good performance of the proposed algorithms in generating decentralized layouts, with a wide range of degrees of centralization and with the algorithms finding near-optimum solutions. As expected, the decentralization increases the structural resilience by distributing the risk of system failure to multiple small subsystems. By deriving the optimal trade-offs between the system’s costs, structural resilience, and degree of centralization, one can decide on the best design depending on further considerations and limitations.
For this purpose, developing a multicriteria decision-making framework to be used as a post-processing model is suggested for further investigations in the future. This model would facilitate the stakeholders in picking the best solution from the derived optimum Pareto front.
Author Contributions
Conceptualization, A.Z. and A.H.; methodology, A.Z., A.E.B. and A.H.; programming, A.Z.; writing—original draft preparation, A.E.B. and A.H.; writing—review and editing, U.D. and A.H.; supervision, U.D., A.E.B. and A.H. All authors have read and agreed to the published version of the manuscript.
Funding
This research was funded by the Alexander von Humboldt Foundation and Shahid Chamran University of Ahvaz (grant number: Scu.c99.436).
Institutional Review Board Statement
Not applicable.
Informed Consent Statement
Not applicable.
Data Availability Statement
The data presented in this study are available on request from the corresponding author.
Conflicts of Interest
The authors declare no conflict of interest.
References
- Sitzenfrei, R.; Rauch, W. Investigating Transitions of Centralized Water Infrastructure to Decentralized Solutions—An Integrated Approach. Procedia Eng. 2014, 70, 1549–1557. [Google Scholar] [CrossRef] [Green Version]
- Eggimann, S.; Truffer, B.; Maurer, M. To connect or not to connect? Modelling the optimal degree of centralisation for wastewater infrastructures. Water Res. 2015, 84, 218–231. [Google Scholar] [CrossRef] [Green Version]
- Dhakal, K.P.; Chevalier, L.R. Urban Stormwater Governance: The Need for a Paradigm Shift. Environ. Manag. 2016, 57, 1112–1124. [Google Scholar] [CrossRef] [PubMed]
- Goncalves, M.L.R.; Zischg, J.; Rau, S.; Sitzmann, M.; Rauch, W.; Kleidorfer, M. Modeling the Effects of Introducing Low Impact Development in a Tropical City: A Case Study from Joinville, Brazil. Sustainability 2018, 10, 728. [Google Scholar] [CrossRef] [Green Version]
- Poustie, M.S.; Deletic, A.; Brown, R.R.; Wong, T.; de Haan, F.J.; Skinner, R. Sustainable urban water futures in developing countries: The centralised, decentralised or hybrid dilemma. Urban Water J. 2014, 12, 543–558. [Google Scholar] [CrossRef]
- Libralato, G.; Volpi Ghirardini, A.; Avezzu, F. To centralise or to decentralise: An overview of the most recent trends in wastewater treatment management. J. Environ. Manag. 2012, 94, 61–68. [Google Scholar] [CrossRef] [PubMed]
- Tchobanoglous, G.; Ruppe, L.; Leverenz, H.; Darby, J. Decentralized wastewater management: Challenges and opportunities for the twenty-first century. Water Sci. Technol. Water Supply Water Sci. 2004, 4, 95–102. [Google Scholar] [CrossRef]
- Bakir, H.A. Sustainable wastewater management for small communities in the Middle East and North Africa. J. Environ. Manag. 2001, 61, 319–328. [Google Scholar] [CrossRef]
- Bakhshipour, A.E.; Bakhshizadeh, M.; Dittmer, U.; Haghighi, A.; Nowak, W. Hanging Gardens Algorithm to Generate Decentralized Layouts for the Optimization of Urban Drainage Systems. J. Water Resour. Plann. Manag. 2019, 145, 04019034. [Google Scholar] [CrossRef]
- Bakhshipour, A.E.; Dittmer, U.; Haghighi, A.; Nowak, W. Hybrid green-blue-gray decentralized urban drainage systems design, a simulation-optimization framework. J. Environ. Manag. 2019, 249, 109364. [Google Scholar] [CrossRef]
- Bakhshipour, A.E.; Dittmer, U.; Haghighi, A.; Nowak, W. Towards sustainable urban drainage infrastructure planning: A combined multiobjective optimization and multicriteria decision-making platform. J. Water Resour. Plan. Manag. 2021, 147, 04021049. [Google Scholar] [CrossRef]
- Bakhshipour, A.E.; Hespen, J.; Haghighi, A.; Dittmer, U.; Nowak, W. Integrating Structural Resilience in the Design of Urban Drainage Networks in Flat Areas Using a Simplified Multiobjective Optimization Framework. Water 2021, 13, 269. [Google Scholar] [CrossRef]
- Massoud, M.A.; Tarhini, A.; Nasr, J.A. Decentralized approaches to wastewater treatment and management: Applicability in developing countries. J. Environ. Manag. 2009, 90, 652–659. [Google Scholar] [CrossRef] [PubMed]
- Brown, V.; Jackson, D.W.; Khalifé, M. 2009 Melbourne metropolitan sewerage strategy: A portfolio of decentralised and on-site concept designs. Water Sci. Technol. 2010, 62, 510–517. [Google Scholar] [CrossRef] [PubMed]
- Haghighi, A.; Bakhshipour, A.E. Optimization of Sewer Networks Using an Adaptive Genetic Algorithm. Water Resour. Manag. 2012, 26, 3441–3456. [Google Scholar] [CrossRef]
- Haghighi, A.; Bakhshipour, A.E. Deterministic Integrated Optimization Model for Sewage Collection Networks Using Tabu Search. J. Water Resour. Plann. Manag. 2015, 141, 4014045. [Google Scholar] [CrossRef]
- Moeini, R.; Afshar, M.H. Arc Based Ant Colony Optimization Algorithm for optimal design of gravitational sewer networks. Ain Shams Eng. J. 2017, 8, 207–223. [Google Scholar] [CrossRef] [Green Version]
- Moeini, R.; Afshar, M.H. Layout and size optimization of sanitary sewer network using intelligent ants. Adv. Eng. Softw. 2012, 51, 49–62. [Google Scholar] [CrossRef]
- Karovic, O.; Mays, L.W. Sewer System Design Using Simulated Annealing in Excel. Water Resour. Manag. 2014, 28, 4551–4565. [Google Scholar] [CrossRef]
- Ahmadi, A.; Zolfagharipoor, M.A.; Nafisi, M. Development of a Hybrid Algorithm for the Optimal Design of Sewer Networks. J. Water Resour. Plann. Manag. 2018, 144, 4018045. [Google Scholar] [CrossRef]
- Navin, P.K.; Mathur, Y.P. Layout and Component Size Optimization of Sewer Network Using Spanning Tree and Modified PSO Algorithm. Water Resour Manag 2016, 30, 3627–3643. [Google Scholar] [CrossRef]
- Tekel, S.; Belkaya, H. Computerized layout generation for sanitary sewers. J. Environ. Eng. 1986, 112, 500–515. [Google Scholar] [CrossRef]
- Diogo, A.F.; Graveto, V.M. Optimal Layout of Sewer Systems: A Deterministic versus a Stochastic Model. J. Hydraul. Eng. 2006, 132, 927–943. [Google Scholar] [CrossRef]
- Diogo, A.F.; Barros, L.T.; Santos, J.; Temido, J.S. An effective and comprehensive model for optimal rehabilitation of separate sanitary sewer systems. Sci. Total Environ. 2018, 612, 1042–1057. [Google Scholar] [CrossRef]
- Diogo, A.F.; Walters, G.A.; Ribeiro de Sousa, E.; Graveto, V.M. Three-Dimensional Optimization of Urban Drainage Systems. Comp-Aided Civ. Eng. 2000, 15, 409–425. [Google Scholar] [CrossRef]
- Duque, N.; Duque, D.; Aguilar, A.; Saldarriaga, J. Sewer Network Layout Selection and Hydraulic Design Using a Mathematical Optimization Framework. Water 2020, 12, 3337. [Google Scholar] [CrossRef]
- Steele, J.C.; Mahoney, K.; Karovic, O.; Mays, L.W. Heuristic Optimization Model for the Optimal Layout and Pipe Design of Sewer Systems. Water Resour. Manag. 2016, 30, 1605–1620. [Google Scholar] [CrossRef]
- Afshar, M.H. A parameter free Continuous Ant Colony Optimization Algorithm for the optimal design of storm sewer networks: Constrained and unconstrained approach. Adv. Eng. Softw. 2010, 41, 188–195. [Google Scholar] [CrossRef]
- Jung, Y.T.; Narayanan, N.C.; Cheng, Y.-L. Cost comparison of centralized and decentralized wastewater management systems using optimization model. J. Environ. Manag. 2018, 213, 90–97. [Google Scholar] [CrossRef]
- Eggimann, S. The optimal degree of centralisation for wastewater infrastructures. A model-based geospatial economic analysis. Ph.D. Thesis, University of Zurich, Zurich, Switzerland, November 2016. [Google Scholar]
- Oraei Zare, S.; Saghafian, B.; Shamsai, A. Multiobjective optimization for combined quality–quantity urban runoff control. Hydrol. Earth Syst. Sci 2012, 16, 4531–4542. [Google Scholar] [CrossRef] [Green Version]
- Eckart, K. Multiobjective Optimization of Low Impact Development Stormwater Controls Under Climate Change Conditions. Master’s Thesis, University of Windsor, Windsor, ON, Canada, July 2015. [Google Scholar]
- Damodaram, C.; Zechman, E.M. Simulation-Optimization Approach to Design Low Impact Development for Managing Peak Flow Alterations in Urbanizing Watersheds. J. Water Resour. Plann. Manag. 2013, 139, 290–298. [Google Scholar] [CrossRef]
- Dandy, G.C.; Di Matteo, M.; Maier, H.R. Optimization of WSUD Systems. In Approaches to Water Sensitive Urban Design: Potential, Design, Ecological Health, Economics, Policies and Community Perceptions; Sharma, A.K., Gardner, T., Begbie, D., Eds.; Woodhead Publishing: Oxford, UK, 2018; pp. 303–328. ISBN 9780128128435. [Google Scholar]
- Di Matteo, M.; Dandy, G.C.; Maier, H.R. Multiobjective Optimization of Distributed Stormwater Harvesting Systems. J. Water Resour. Plann. Manag. 2017, 143, 4017010. [Google Scholar] [CrossRef]
- Giacomoni, M.H.; Joseph, J. Multi-Objective Evolutionary Optimization and Monte Carlo Simulation for Placement of Low Impact Development in the Catchment Scale. J. Water Resour. Plann. Manag. 2017, 143, 4017053. [Google Scholar] [CrossRef]
- Wang, M.; Sweetapple, C.; Fu, G.; Farmani, R.; Butler, D. A framework to support decision making in the selection of sustainable drainage system design alternatives. J. Environ. Manag. 2017, 201, 145–152. [Google Scholar] [CrossRef]
- Sweetapple, C.; Fu, G.; Butler, D. Reliable, Robust, and Resilient System Design Framework with Application to Wastewater-Treatment Plant Control. J. Environ. Eng. 2017, 143, 4016086. [Google Scholar] [CrossRef]
- Haghighi, A. Intelligent Optimization of Wastewater Collection Networks. In Intelligence Systems in Environmental Management: Theory and Applications; Kahraman, C., Ucal Sari, I., Eds.; Springer: Berlin/Heidelberg, Germany, 2016; pp. 41–65. [Google Scholar]
- Hadka, D.; Reed, P. Borg: An auto-adaptive many-objective evolutionary computing framework. Evol. Comput. 2013, 21, 231–259. [Google Scholar] [CrossRef] [PubMed]
- Mugume, S.N.; Gomez, D.E.; Fu, G.; Farmani, R.; Butler, D. A global analysis approach for investigating structural resilience in urban drainage systems. Water Res. 2015, 81, 15–26. [Google Scholar] [CrossRef] [Green Version]
- Haghighi, A.; Bakhshipour, A.E. Reliability-based layout design of sewage collection systems in flat areas. Urban Water J. 2015, 13, 790–802. [Google Scholar] [CrossRef]
- Haghighi, A. Loop-by-Loop Cutting Algorithm to Generate Layouts for Urban Drainage Systems. J. Water Resour. Plann. Manag. 2013, 139, 693–703. [Google Scholar] [CrossRef]
Figure 1.
Pseudocode of the decentralized layout generation algorithm.

Figure 2.
Mathematical representation of a base graph: (a) example base graph; (b) B-Matrix; (c) A-Matrix.
Figure 2.
Mathematical representation of a base graph: (a) example base graph; (b) B-Matrix; (c) A-Matrix.

Figure 3.
Finding the assigned zone for each outlet: (a) finding the assigned zone for the first root (node 4); (b) finding the assigned zone for the second root (node 13); (c) finding the assigned zone for the last root (node 24).
Figure 3.
Finding the assigned zone for each outlet: (a) finding the assigned zone for the first root (node 4); (b) finding the assigned zone for the second root (node 13); (c) finding the assigned zone for the last root (node 24).

Figure 4.
Pipe identification process: (a) identifying the pipes for each subgraph; (b) identifying the loops for each subgraph; (c) partitioning of the base graph.
Figure 4.
Pipe identification process: (a) identifying the pipes for each subgraph; (b) identifying the loops for each subgraph; (c) partitioning of the base graph.

Figure 5.
Generated decentralized network.

Figure 6.
Flowchart of the proposed algorithm for generating the spanning trees.

Figure 7.
The case study (Google maps).

Figure 8.
The base graph of the case study.

Figure 9.
Proposed framework for optimization case study.

Figure 10.
Selected solutions from the Pareto front for different numbers of treatment plants.

Figure 11.
Various design scenarios: (a) scenario 1, optimal fully centralized design (DC = 100%); (b) scenario 2, design with 5 treatment plants (DC = 55%); (c) scenario 3, the most decentralized design (DC = 27%).
Figure 11.
Various design scenarios: (a) scenario 1, optimal fully centralized design (DC = 100%); (b) scenario 2, design with 5 treatment plants (DC = 55%); (c) scenario 3, the most decentralized design (DC = 27%).


Table 1.
Design constraints for the case study.
| Item Name | Item Value |
|---|---|
| Maximum velocity | 5 m/s |
| Minimum velocity | 0.6 m/s |
| Minimum Slope | 0.003 (if Q < 15 l/s) |
| Maximum Slope | 0.5 |
| Maximum proportional water depth | 0.75 |
| Minimum cover depth | 1.2 m |
Table 2.
Optimization variables of the case study.
| Variable | Type | Number | Note |
|---|---|---|---|
| α | Real | 8 | Input parameter of the graph partitioning algorithm (according to the number of candidate outlets) |
| x | Real | 145 | Input parameter of growing spanning tree algorithm (according to the number of vertices in the base graph) |
| y | Binary | 64 | Input parameter of growing spanning tree algorithm (according to the number of loops in the base graph) |
| d | Real | 208 | Sewer diameter |
| s | Real | 208 | Sewer slope |
| p | Binary | 208 | Locations of lift pump stations |
Table 3.
The cost function of the case study.
| Description | Construction Cost | Operation Cost (Million Rial/Years) | ||
|---|---|---|---|---|
| D (mm) | Pipe (Million Rial/m) | Manhole (Million Rial) | ||
| Network | 200 | 0.15 × Construction Cost | ||
| 250 | ||||
| 350 | ||||
| 400 | ||||
| 500 | ||||
| 630 | ||||
| 800 | ||||
| 1000 | ||||
| Pressurized pipeline (Million Rial/m) | 0.15 × Construction Cost | |||
| Pump Station | ||||
| Treatment Plant | ||||
Table 4.
Comparison between scenarios 1 and 3.
| Scenario | Total System Annuities (Million Rials/Year) | Sewer Networks (Million Rials/Year) | Treatment Facilities (Million Rials/Year) | Average Buried Depth (m) | Average Sewer Diameters (m) | DC (%) | Structural Resilience (%) |
|---|---|---|---|---|---|---|---|
| 1 | 3.31 × 10⁵ | 2.52 × 10⁵ | 0.795 × 10⁵ | 2.65 | 0.26 | 100 | 44 |
| 2 | 2.82 × 10⁵ | 1.76 × 10⁵ | 1.07 × 10⁵ | 2.49 | 0.22 | 55 | 74 |
| 3 | 2.76 × 10⁵ | 1.56 × 10⁵ | 1.21 × 10⁵ | 2.48 | 0.21 | 27 | 79 |
Publisher’s Note: MDPI stays neutral with regard to jurisdictional claims in published maps and institutional affiliations. |
© 2021 by the authors. Licensee MDPI, Basel, Switzerland. This article is an open access article distributed under the terms and conditions of the Creative Commons Attribution (CC BY) license (https://creativecommons.org/licenses/by/4.0/).
Share and Cite
MDPI and ACS Style
Zahediasl, A.; E. Bakhshipour, A.; Dittmer, U.; Haghighi, A. Toward Decentralised Sanitary Sewage Collection Systems: A Multiobjective Approach for Cost-Effective and Resilient Designs. Water 2021, 13, 1886. https://doi.org/10.3390/w13141886
AMA Style
Zahediasl A, E. Bakhshipour A, Dittmer U, Haghighi A. Toward Decentralised Sanitary Sewage Collection Systems: A Multiobjective Approach for Cost-Effective and Resilient Designs. Water. 2021; 13(14):1886. https://doi.org/10.3390/w13141886
Chicago/Turabian StyleZahediasl, Arezoo, Amin E. Bakhshipour, Ulrich Dittmer, and Ali Haghighi. 2021. "Toward Decentralised Sanitary Sewage Collection Systems: A Multiobjective Approach for Cost-Effective and Resilient Designs" Water 13, no. 14: 1886. https://doi.org/10.3390/w13141886
Note that from the first issue of 2016, this journal uses article numbers instead of page numbers. See further details here.