
A Comparative Analysis of Root Growth Modules in HYDRUS for SWC of Rice under Deficit Drip Irrigation
by
 , , and
Mohamed Galal Eltarabily
1,2 ,
,
Ronny Berndtsson
3,4,*,
Nasr M. Abdou
5,
Mustafa El-Rawy
6,7 and
and
Tarek Selim
1 1
Civil Engineering Department, Faculty of Engineering, Port Said University, Port Said 42523, Egypt
2
Kearney Agricultural Research and Extension Center, University of California, Parlier, CA 93648, USA
3
Division of Water Resources Engineering, Lund University, P.O. Box 118, 22100 Lund, Sweden
4
Centre for Advanced Middle Eastern Studies, Lund University, P.O. Box 201, 22100 Lund, Sweden
5
Soil and Water Department, Faculty of Agriculture, Fayoum University, Fayoum 63514, Egypt
6
Civil Engineering Department, Faculty of Engineering, Minia University, Minia 61111, Egypt
7
Civil Engineering Department, College of Engineering, Shaqra University, Ar Riyadh 11911, Saudi Arabia
*
Author to whom correspondence should be addressed.
Water 2021, 13(14), 1892; https://doi.org/10.3390/w13141892
Submission received: 14 June 2021
/
Revised: 2 July 2021
/
Accepted: 5 July 2021
/
Published: 8 July 2021
(This article belongs to the Section Water, Agriculture and Aquaculture)
Abstract
:Root distribution during rice cultivation is a governing factor that considerably affects soil water content (SWC) and root water uptake (RWU). In this study, the effects of activating root growth (using growth function) and assigning a constant average root depth (no growth during simulation) on SWC and RWU for rice cultivation under four deficit drip irrigation treatments (T90, T80, T70, and T60) were compared in the HYDRUS-2D/3D model version 3.03. A secondary objective was to investigate the effect of applied deficit irrigation treatments on grain yield, irrigation water use efficiency (IWUE), and growth traits of rice. The simulated DI system was designed to reflect a representative field experiment implemented in El-Fayoum Governorate, Egypt, during two successive seasons during 2017 and 2018. The deficit treatments (T90, T80, T70, and T60) used in the current study represent scenarios at which the first irrigation event was applied when the pre-irrigation average SWC within the upper 60 cm of soil depth was equal to 90%, 80%, 70%, and 60% of plant-available water, respectively. Simulation results showed that as water deficiency increased, SWC in the simulation domain decreased, and thereby, RWU decreased. The average SWC within the root zone during rice-growing season under different deficit treatments was slightly higher when activating root growth function than when considering constant average root depth. Cumulative RWU fluxes for the case of no growth were slightly higher than for the case of root growth function for T90, T80, and T70 accounting for 1289.50, 1179.30, and 1073.10 cm2, respectively. Average SWC during the growth season (24 h after the first irrigation event, mid-season, and 24 h after the last irrigation event) between the two cases of root growth was strongly correlated for T90, T80, T70, and T60, where r2 equaled 0.918, 0.902, 0.892, and 0.876, respectively. ANOVA test showed that there was no significant difference for SWC between treatments for the case of assigning root growth function while the difference in SWC among treatments was significant for the case of the constant average root depth, where p-values equaled 0.0893 and 0.0433, respectively. Experimental results showed that as water deficiency decreased, IWUE increased. IWUE equaled 1.65, 1.58, 1.31, and 1.21 kg m−3 for T90, T80, T70, and T60, respectively. Moreover, higher grain yield and growth traits of rice (plant height, tillers number plant−1, panicles length, panicle weight, and grain number panicles−1) were obtained corresponding to T90 as compared with other treatments. Activating the root growth module in HYDRUS simulations can lead to more precise simulation results for specific dates within different growth stages. Therefore, the root growth module is a powerful tool for accurately investigating the change in SWC during simulation. Users of older versions of HYDRUS-2D/3D (version 2.05 and earlier) should consider the limitations of these versions for irrigation scheduling.
1. Introduction
Rice is the most widely consumed staple food in the world, feeding approximately 50% of the world’s population [1]. It is cultivated in an area of more than 165 million ha in 125 countries worldwide [2]. Egypt is the largest producer of rice in Africa and has the most productive farms [3]. In Egypt, rice ranks as the second most consumed staple food and is mainly cultivated in the North Delta and coastal areas. Annually, rice consumes about 10 billion m3 of Nile River water (approximately 18%) [4]. Egypt faces several challenges related to its increasing water demand [5]. The sustainability of rice production in Egypt is becoming threatened by limited water resources [6,7]. Thus, during the past ten years (2008-2018), Egypt reduced the allotted area for rice cultivation by 59% from 745,000 ha to 304,080 ha [8].
The traditionally used method for rice cultivation is the transplanting of rice (TPR) [9]. Other methods of rice cultivation, such as direct-seeded rice (DSR), dry, and wet have also emerged [10]. Similar to many countries worldwide, rice is commonly cultivated in Egypt under continuous flooding, with about 5 cm of water during the growing season [11]. Rice cultivation by this method involves salt leaching from the root zone. Subsequently, poorly drained parts (thick clay layers) of the Nile Delta are used for rice and berseem (Egyptian clover) production only and are not suitable for other alternatives of crop rotations [12]. The irrigation water requirement of rice under continuous flooding is more than 20,000 m3 ha−1 [13], meanwhile, rice biologically needs only 6000–8000 m3 ha−1 [14]. A drip irrigation (DI) system has been highly recommended for increasing irrigation water use efficiency and crop productivity [15].
Recently, many researchers (e.g., references [16,17,18,19]) recommended using DI instead of flood irrigation for watering rice to save irrigation water. Sharda et al. [16] investigated the performance of drip irrigated DSR in South Asia through a two-year field experiment. They found that a higher grain yield and higher root density at the top 30 cm soil layer occurred under DI as compared with flood irrigation. The grain yield ranged from 7.34 to 8.01 ton ha−1 and from 6.63 to 7.60 ton ha−1 under DI and flood irrigation, respectively. Moreover, higher water use efficiency was achieved under DI as compared with flood irrigation, with more than 40% of water conserved. He et al. [17] stated that by using drip irrigation, 60% of irrigation water needed for watering rice through conventional methods can be conserved. Zhu et al. [18] recommended applying small water amounts by means of emitters to keep the soil at 90% of its water-holding capacity to improve rice yields under drip irrigation. Guo and Chen [19] stated that with good management the rice yield under DI can be as high as paddy rice. Coltro et al. [20] explored the environmental impact of using DI instead of flood irrigation for watering rice. They concluded that by converting irrigation from flood to drip many environmental benefits can be achieved, such as 50% less water consumption with 15% higher yield, 66% less acidification, 30% less eutrophication, and 66% lower GWP.
Water flow in paddy fields involves interaction with complex processes, and their observation and evaluation under field conditions are relatively difficult, costly, and time-consuming [21]. HYDRUS-2D/3D software packages [22] are widely used to simulate water and heat, and solute transport in one-, two-, and three-dimensional, variably saturated porous media. The governing equation for water flow (Richard’s equation) that is solved in the model incorporates a macroscopic sink term to account for root water uptake (RWU) [23], which may be reduced due to salinity and drought stress. Water flow is greatly affected by RWU [24] and the pattern of RWU is determined by the root distribution [25]. The RWU model in the standard versions of the HYDRUS-2D/3D model [26] does not consider root growth [27]. Later, a root growth module was adapted and incorporated into the HYDRUS-2D/3D software packages to model root growth as a function of different environmental factors [28].
Compared with traditional transplanting rice (TPR), direct-seeded rice (DSR) requires different water management, particularly during its seedling stage. During the first two weeks after seeding, rather than being flooded as with TPR, the topsoil needs only an adequate amount of soil water content (SWC) to allow for seed germination [29]. As a result, the root mass of DSR is distributed shallower than that of traditional TPR, which consequently produces different vertical profiles of water content [30]. Thus, the root distribution of rice entirely depends on the method of cultivation and on environmental factors. These processes and the way they are reflected in HYDRUS 2D/3D are not yet fully understood. Thus, to improve this knowledge, there are needs to compare model results with representative field applications. Consequently, the main aims of the current study were to (i) compare observed environmental factors in a representative field drip irrigation setup with model simulations, (ii) simulate root water uptake (RWU) and SWC for the representative paddy field setup under different deficit drip irrigation treatments using the HYDRUS 2D/3D model, and (iii) compare soil water content (SWC) along the soil vertical profile while considering root growth (using growth function) with the results of assigning a constant average root depth (no growth) during irrigation season. As secondary objectives, the effects of deficit irrigation treatments on grain yield (kg ha−1), irrigation water use efficiency (IWUE), and growth traits of rice were investigated. The assumption of constant average root depth (no growth) is the only available option in the oldest version of the HYDRUS-2D/3D model (e.g., version 2.05). Thus, simulations with newer model versions need to be evaluated using field observations. Moreover, the effect of assigning constant average root depth (no growth) on SWC and RWU will be better understood. Results of the current study are important for sustainable use of irrigation water, especially in areas where water resources are scarce and under threat of salinization.
2. Materials and Methods
The HYDRUS-2D/3D model was used for simulating water flow and solute transport in 2D/3D variably saturated porous media. The old version of HYDRUS software (version 2.05) does not contain a root growth module, but has been incorporated in the newest versions (e.g., version 3.03). As these processes have not yet been evaluated for different soil types and environmental factors it is important to compare observations of root growth with simulations. It is important to examine the limitations (if any) of older versions of HYDRUS (version 2.05 and earlier) with newer model versions. In the current study, a comparison between the results obtained from HYDRUS (version 3.03) while deactivating and activating the root growth module was conducted. The comparison included SWC at different dates throughout the soil profile during the rice-growing season in sandy loam soil under surface deficit drip irrigation (DI) and different irrigation treatments. Moreover, the cumulative RWU, evaporation, free drainage, and variable flux (emitter discharge) were investigated at the end of the growing season.
2.1. Experimental Design and Model Setup
The simulated DI system was designed to reflect a representative field experiment carried out in El-Fayoum Governorate, Egypt, on a private farm (29°7′28′’ N, 30°43′20′’ E) during two successive seasons (2017–18), growing rice under surface deficit drip irrigation in sandy loam soil. The average salinity of the field soil was 2.4 dS m−1 (soil paste extract), while soil pH was 7.85. The groundwater was observed at 2.0 m below the ground surface. Four deficit irrigation treatments (T90, T80, T70, and T60) were applied during the experiment. These treatments represent the scenarios at which the first irrigation event was applied when the pre-irrigation average SWC within the upper 60 cm soil depth was equal to 90%, 80%, 70%, and 60% of plant-available soil water capacity (=FC–PWP), respectively. The experimental layout was designed in a randomized complete block with three replications. The irrigation system was designed so that the distance between drip lines was 60 cm while the distance between emitters along the drip line was 30 cm and the emitter discharge was 2 L h−1. On 19 June 2017, and 17 June 2018, seedlings (37 days old) of the rice variety Giza 179 were transplanted to the field (3–4 seedlings/hill) and the harvesting date was on 27 September 2017, and 24 September 2018, respectively (100 days after transplanting). The same procedure was approximately applied in the field experiments during the two successive agricultural seasons (2017 and 2018); the irrigation schedule of 2018 was only considered while using the HYDRUS-2D/3D model. In 2018, the number of irrigation events was 25, 22, 19, and 15 for T90, T80, T70, and T60, respectively. This led to a total amount of applied water of 5000, 4400, 3800, and 3000 m3 ha−1 for T90, T80, T70, and T60, respectively. Table 1 shows the dates of irrigation events for the different irrigation treatments and the day of irrigation (in the model simulation) from the transplanting date (17 June 2018).
The climate at the experimental field was arid and characterized by low precipitation (less than 150 mm y−1). From May to September (rice-growing season 2017 and 2018), the minimum and maximum temperatures were 21 and 39 °C, respectively. The relative humidity ranged from 31 to 45% (meteorological station of Fayoum Governorate) [31].
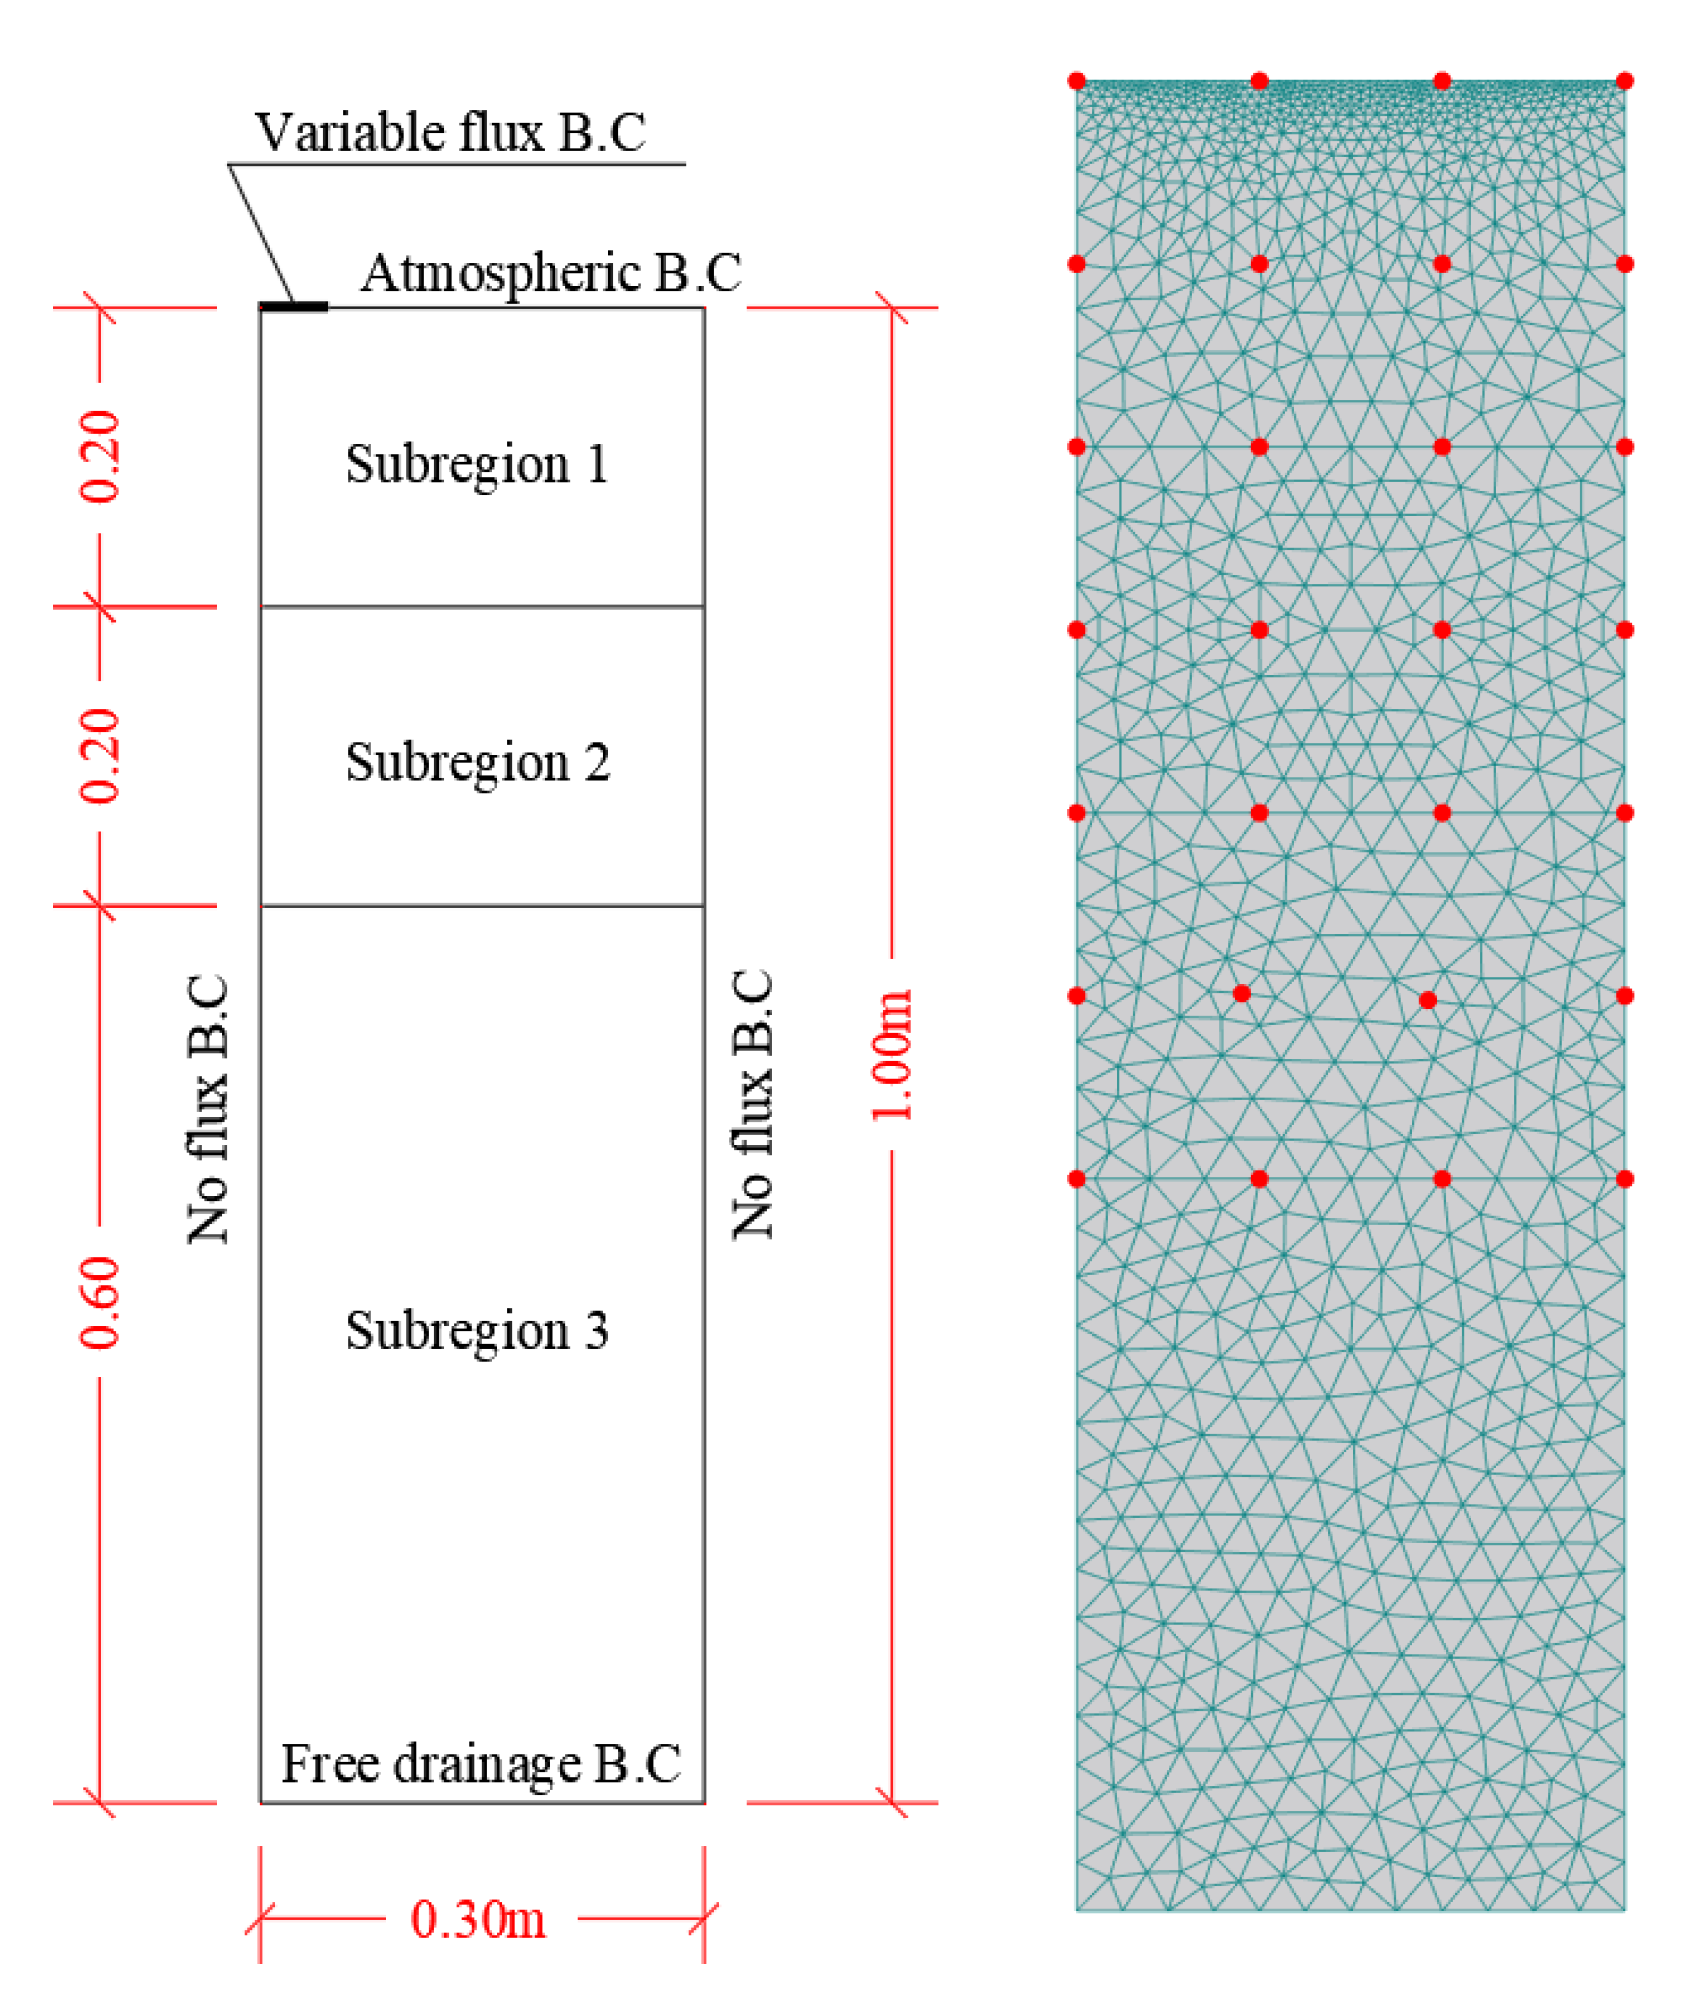
The simulated domain was rectangular, 30 cm wide, and 100 cm deep and represented a vertical plane normal to the drip lines from the emitter to halfway between drip lines. The model domain was spatially discretized by unstructured triangle mesh with 2166 2D elements. As the flux rapidly changed near the soil surface, mesh refinement was applied. To minimize the potential water balance error, the error tolerance for water content and pressure head was set to 0.0002 m3 m−3 and 0.2 cm, respectively. In addition, a minimum time step of 10−7 d was assigned. Twenty-eight observation points were set within the simulation domain (Figure 1). These points were situated at seven depths between the upper boundary of the simulation domain, a depth of 60 cm (at intervals of 10 cm), and four horizontal distances 10 cm apart (starting from the left edge of the simulation domain). These observation points were selected to capture the variation in SWC within the flow domain during the simulation period. The SWC at these points was used while performing the statistical analyses to determine the effect of activating and deactivating the root growth module on simulation results.
2.2. Soil Hydraulic Properties
Table 2 shows the soil physical properties obtained from soil samples collected every 20 cm, from the soil surface to 60 cm depth. These properties include particle size distribution, bulk density, hydraulic conductivity, SWC at field capacity (FC), and permanent wilting point (PWP). SWC at FC and at PWP were obtained via a pressure plate apparatus with applied tensions of 0.33 and 15 bar, respectively. Table 3 shows SWC corresponding to different suction pressures varying from 0.001 to 15 bar for soil samples collected at depths from 0–20 cm, 20–40 cm, and 40–60 cm. The ROSETTA software package [32] within the HYDRUS model was used to estimate soil hydraulic properties [33]. To consider variation in soil hydraulic properties, the flow domain was divided into three subregions (Figure 1). Particle size distribution, bulk density, and SWC corresponding to FC and PWP were used in ROSETTA for hydraulic property calculations (Table 4). Table 4 shows estimated soil hydraulic properties for the three subregions in the simulation domain. Soil properties from a 60 to 100 cm depth (3rd layer) were assumed to be similar to the properties of the overlying layer (from 40 to 60 cm depth).
2.3. Initial and Boundary Conditions
The initial SWC (θi) was assumed to be uniform for all simulated irrigation treatments equal to 0.20 m3 m−3. This value represents the average plant-available SWC within the top 60 cm soil layer. Figure 1 illustrates the simulation domain with the imposed boundary conditions. No flux boundary condition (BC) was assigned along the right and left edges of the simulation domain. The left side was assigned as no flux BC due to symmetry. Because of the wide flow domain (≥ the half distance between emitters), the right side was also assumed as no flux BC. As the water table is located 2.0 m below the soil surface, the lower edge of the simulation domain was assumed as free drainage BC. The upper edge of the simulation domain was set as atmospheric BC except for the part that represents the emitter (assigned as variable flux).
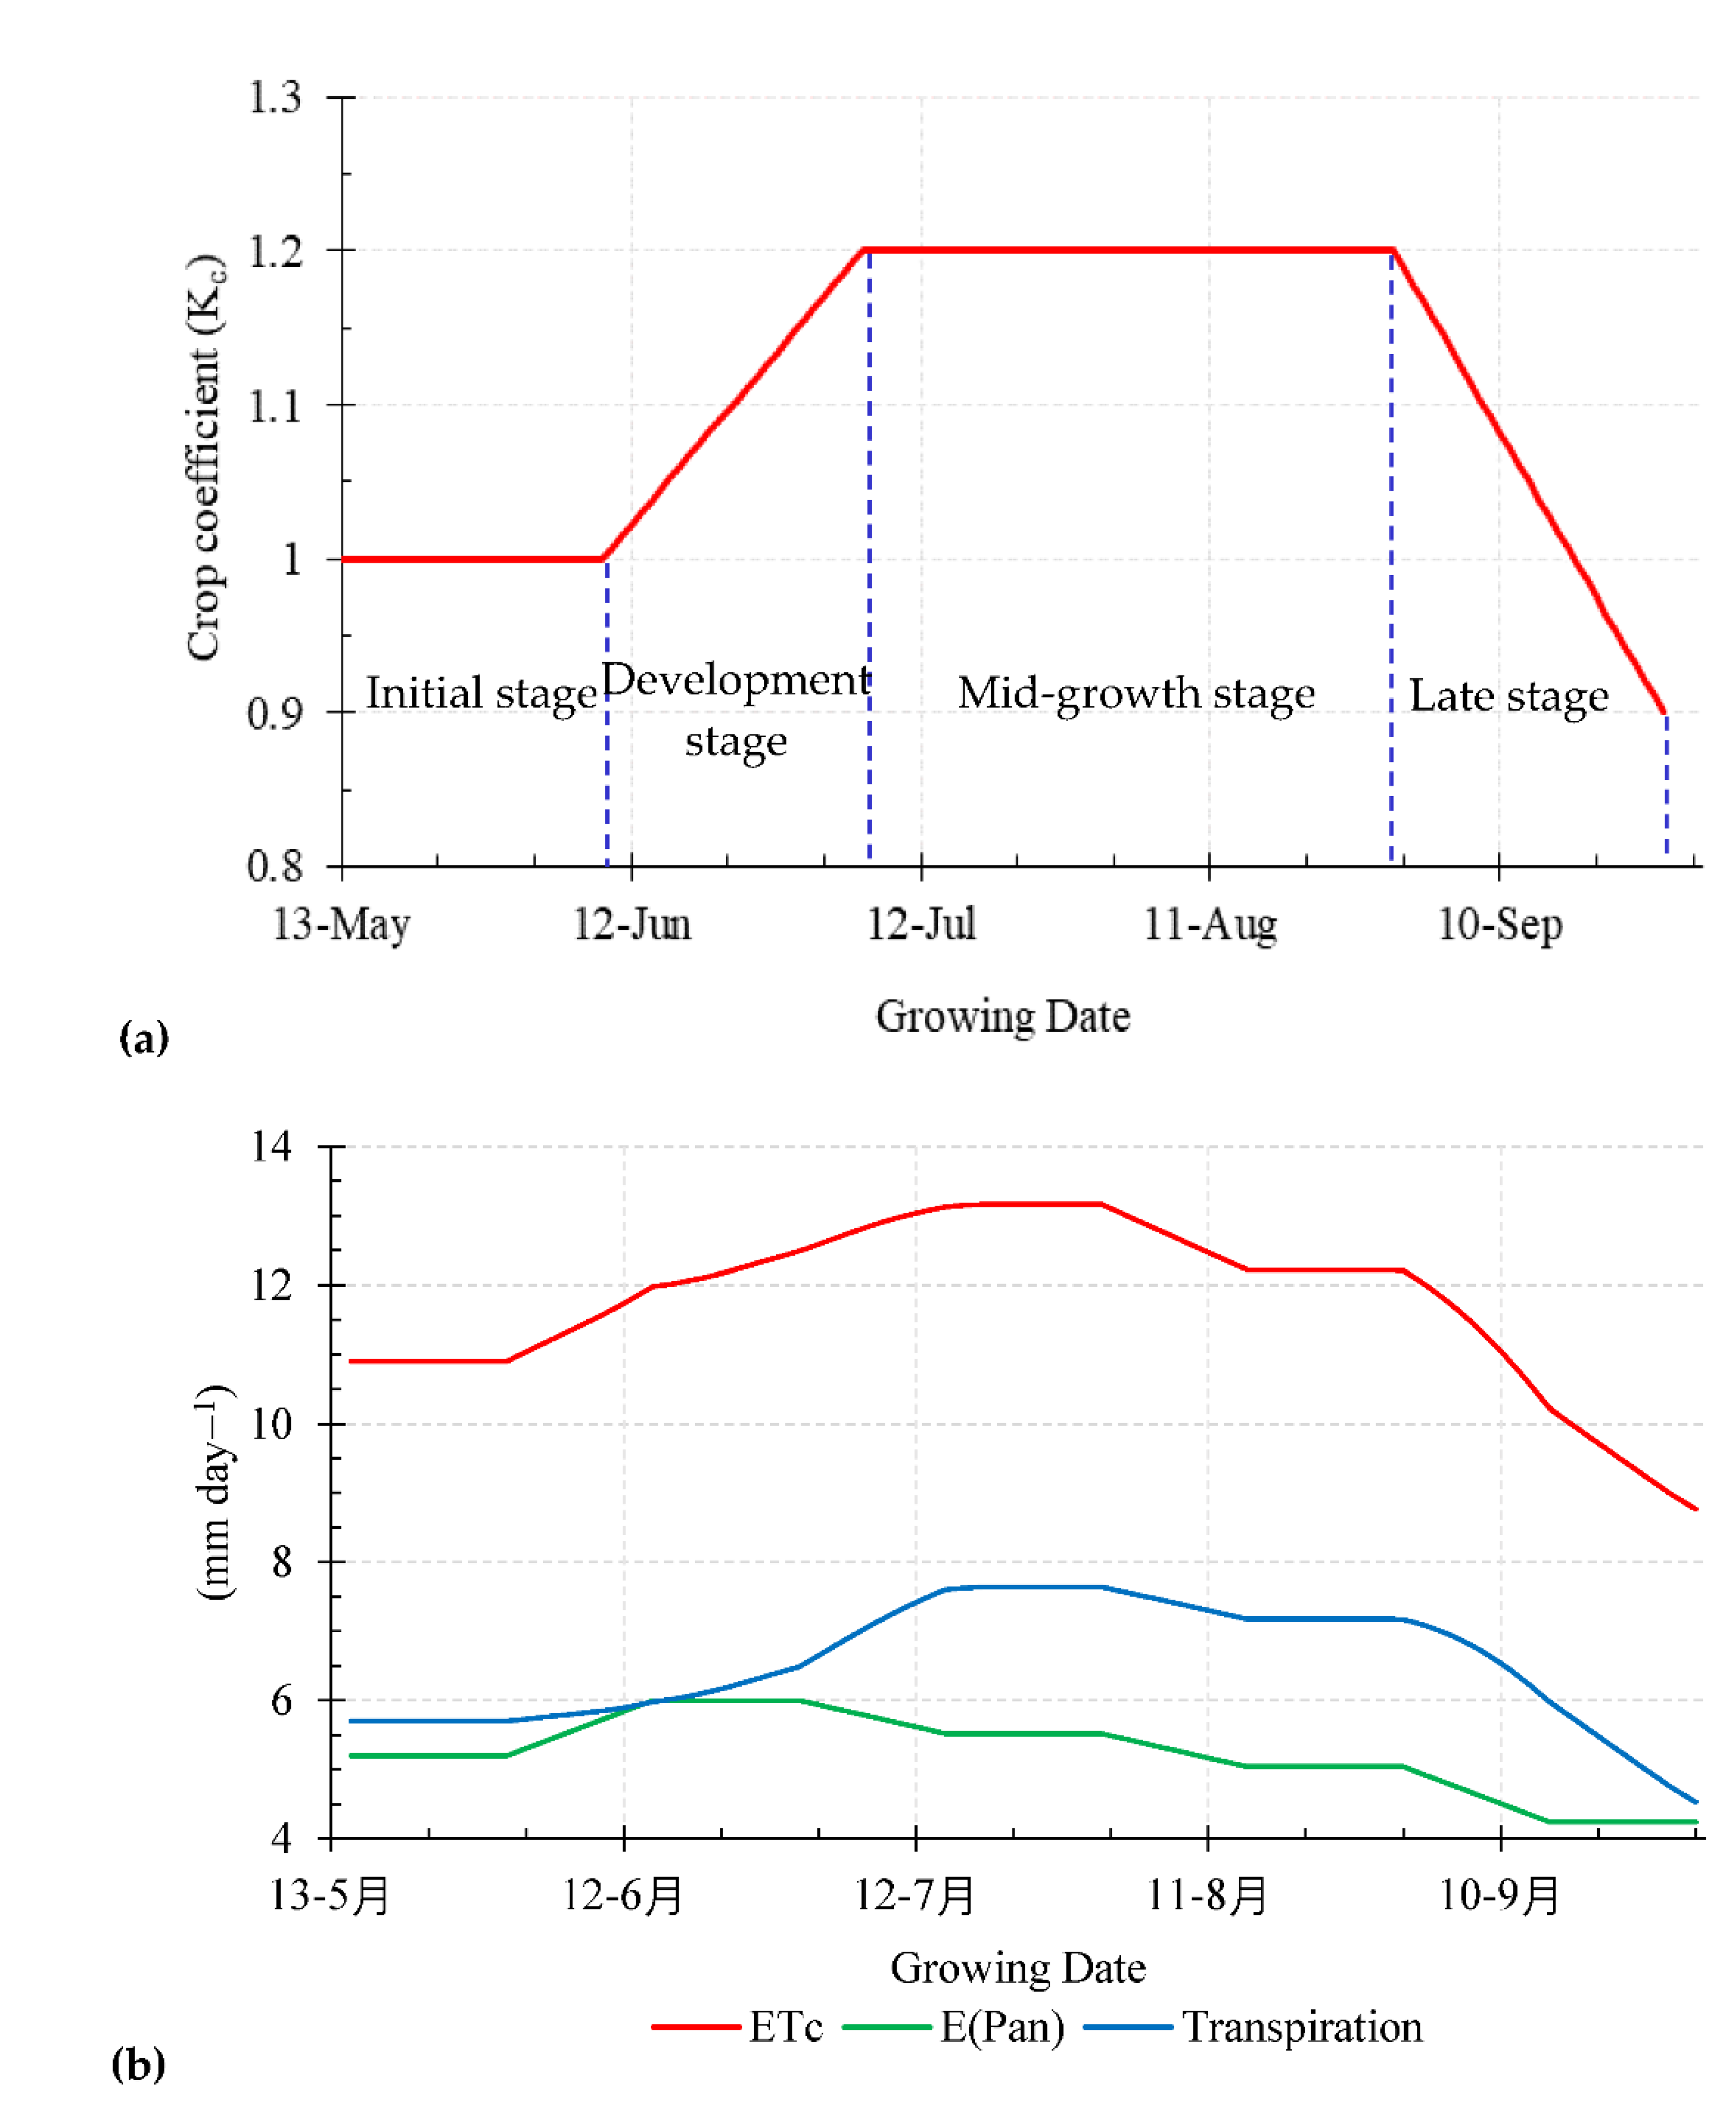
Reference crop evapotranspiration (ETo) was estimated using the CROPWAT 8.0 model [34] and meteorological data (minimum and maximum temperature, relative humidity, wind speed, sun hours, and solar radiation) was used for the study area [31]. Evapotranspiration (ETc) was estimated by multiplying ETo by crop coefficient (Kc) for rice. The Kc values equal to 1.00, 1.20, and 0.90 were used corresponding to initial, mid-, and late growth stages, respectively [35]. The growth period of rice was 137 days divided into 37 days in a nursery and 100 days in the field. The growth period was divided into 27, 27, 56, and 27 days for initial, development, mid, and late stages, respectively. These four growing stages correspond to the phenological phases of rice, namely, transplanting, vegetative, reproductive, and maturity [36]. Different methods can be used for monitoring phenological stages, such as field survey, bioclimatic simulation models, or remote sensing. In this study, rice phenology monitoring was not our main objective, we mainly focused on comparing rice grain yield for four different irrigation treatments for two successive seasons considering other factors (e.g., water utilization characteristics) constant. The HYDRUS model requires separation of ETc into transpiration (T) and evaporation (E). The T was estimated by subtracting ETc from E values recorded at the meteorological station of El-Fayoum Governorate. Moreover, the surface length associated with transpiration was set to 30 cm during simulations. Figure 2a shows crop coefficients for the different growth stages. Figure 2b displays the estimated evapotranspiration (ETC), evaporation, and transpiration in mm during the growing season. A variable flux was assigned at the emitter location during irrigation events, which was equal to zero during fallow. The variable flux was calculated based on the emitter discharge and the drip tubing surface area. Irrigation duration was estimated based on emitter discharge, area served by each emitter, and variable flux.
2.4. Root Water Uptake Parameters
Rice is characterized by shallow roots. The root zone occupies about 60 cm of the soil domain while the maximum root density lies 25 cm below the ground surface [37,38]. Root growth function is used to express root evolution during the growing season by specifying given parameters. These parameters can be either initial root growth and harvesting times, initial and maximum rooting depths, and root depth at a specific time or all the previous parameters and replacing root depth at a specific time with the hypothesis that 50% of the rooting depth is reached at the middle of the growing season.
Root distribution parameters were assumed based on Vrugt et al. [39]. Parameters of Vrugt’s model used in the simulations of all irrigation treatments were as follows: maximum rooting depth = 60 cm, depth of maximum root density = 25 cm, and Pz = 1. However, when considering root growth during the simulation period, initial and harvesting times of zero and 100 days were assigned. Moreover, an initial root depth of 5 cm and a maximum root depth of 60 cm were assigned. The assigned Feddes parameters [23] were Po = 100 cm, Popt = 55 cm, P2H = −160 cm, P2L = −250 cm, P3 = −15,000 cm, r2H = 0.50 cm·d−1, and r2L = 0.10 cm·d−1. No solute stress was assumed during simulations.
2.5. Statistical Analyses
The root mean square error (RMSE) was calculated by comparing the measured SWC in the case of an assigned constant average root depth and considered root growth. The RMSE was calculated according to:
where Sv and Sc are simulated outputs (e.g., pressure heads, water fluxes) for considered root growth (using growth function) and constant average root depth (no growth), respectively. N is the number of observations.
The one-way analysis of variance (ANOVA) test was performed using SPSS (statistical package of the social sciences) 24.0 software (IBM Corporation, New York, NY, USA) to compare SWC obtained from the HYDRUS-2D/3D model for activating and deactivating the root growth module for each treatment. The SWC was compared for the different irrigation treatments to check if the p-value between treatments was significant at a 95% level of confidence. Irrigation water use efficiency (IWUE) and growth traits of rice (plant height, tillers number plant−1, panicles length, panicles weight, and grain number panicles−1) during the two successive agricultural seasons of 2017 and 2018 were determined to investigate the effect from different deficit irrigation treatments. IWUE was estimated to evaluate the productivity of applied irrigation water in the treatments at the level of crop yield production (IWUE = yield/applied irrigation water, where yield is in kg ha−1, applied irrigation water in m3 ha−1, and IWUE in kg m−3) [40,41,42].
3. Results
3.1. SWC at the Middle of the Growing Season
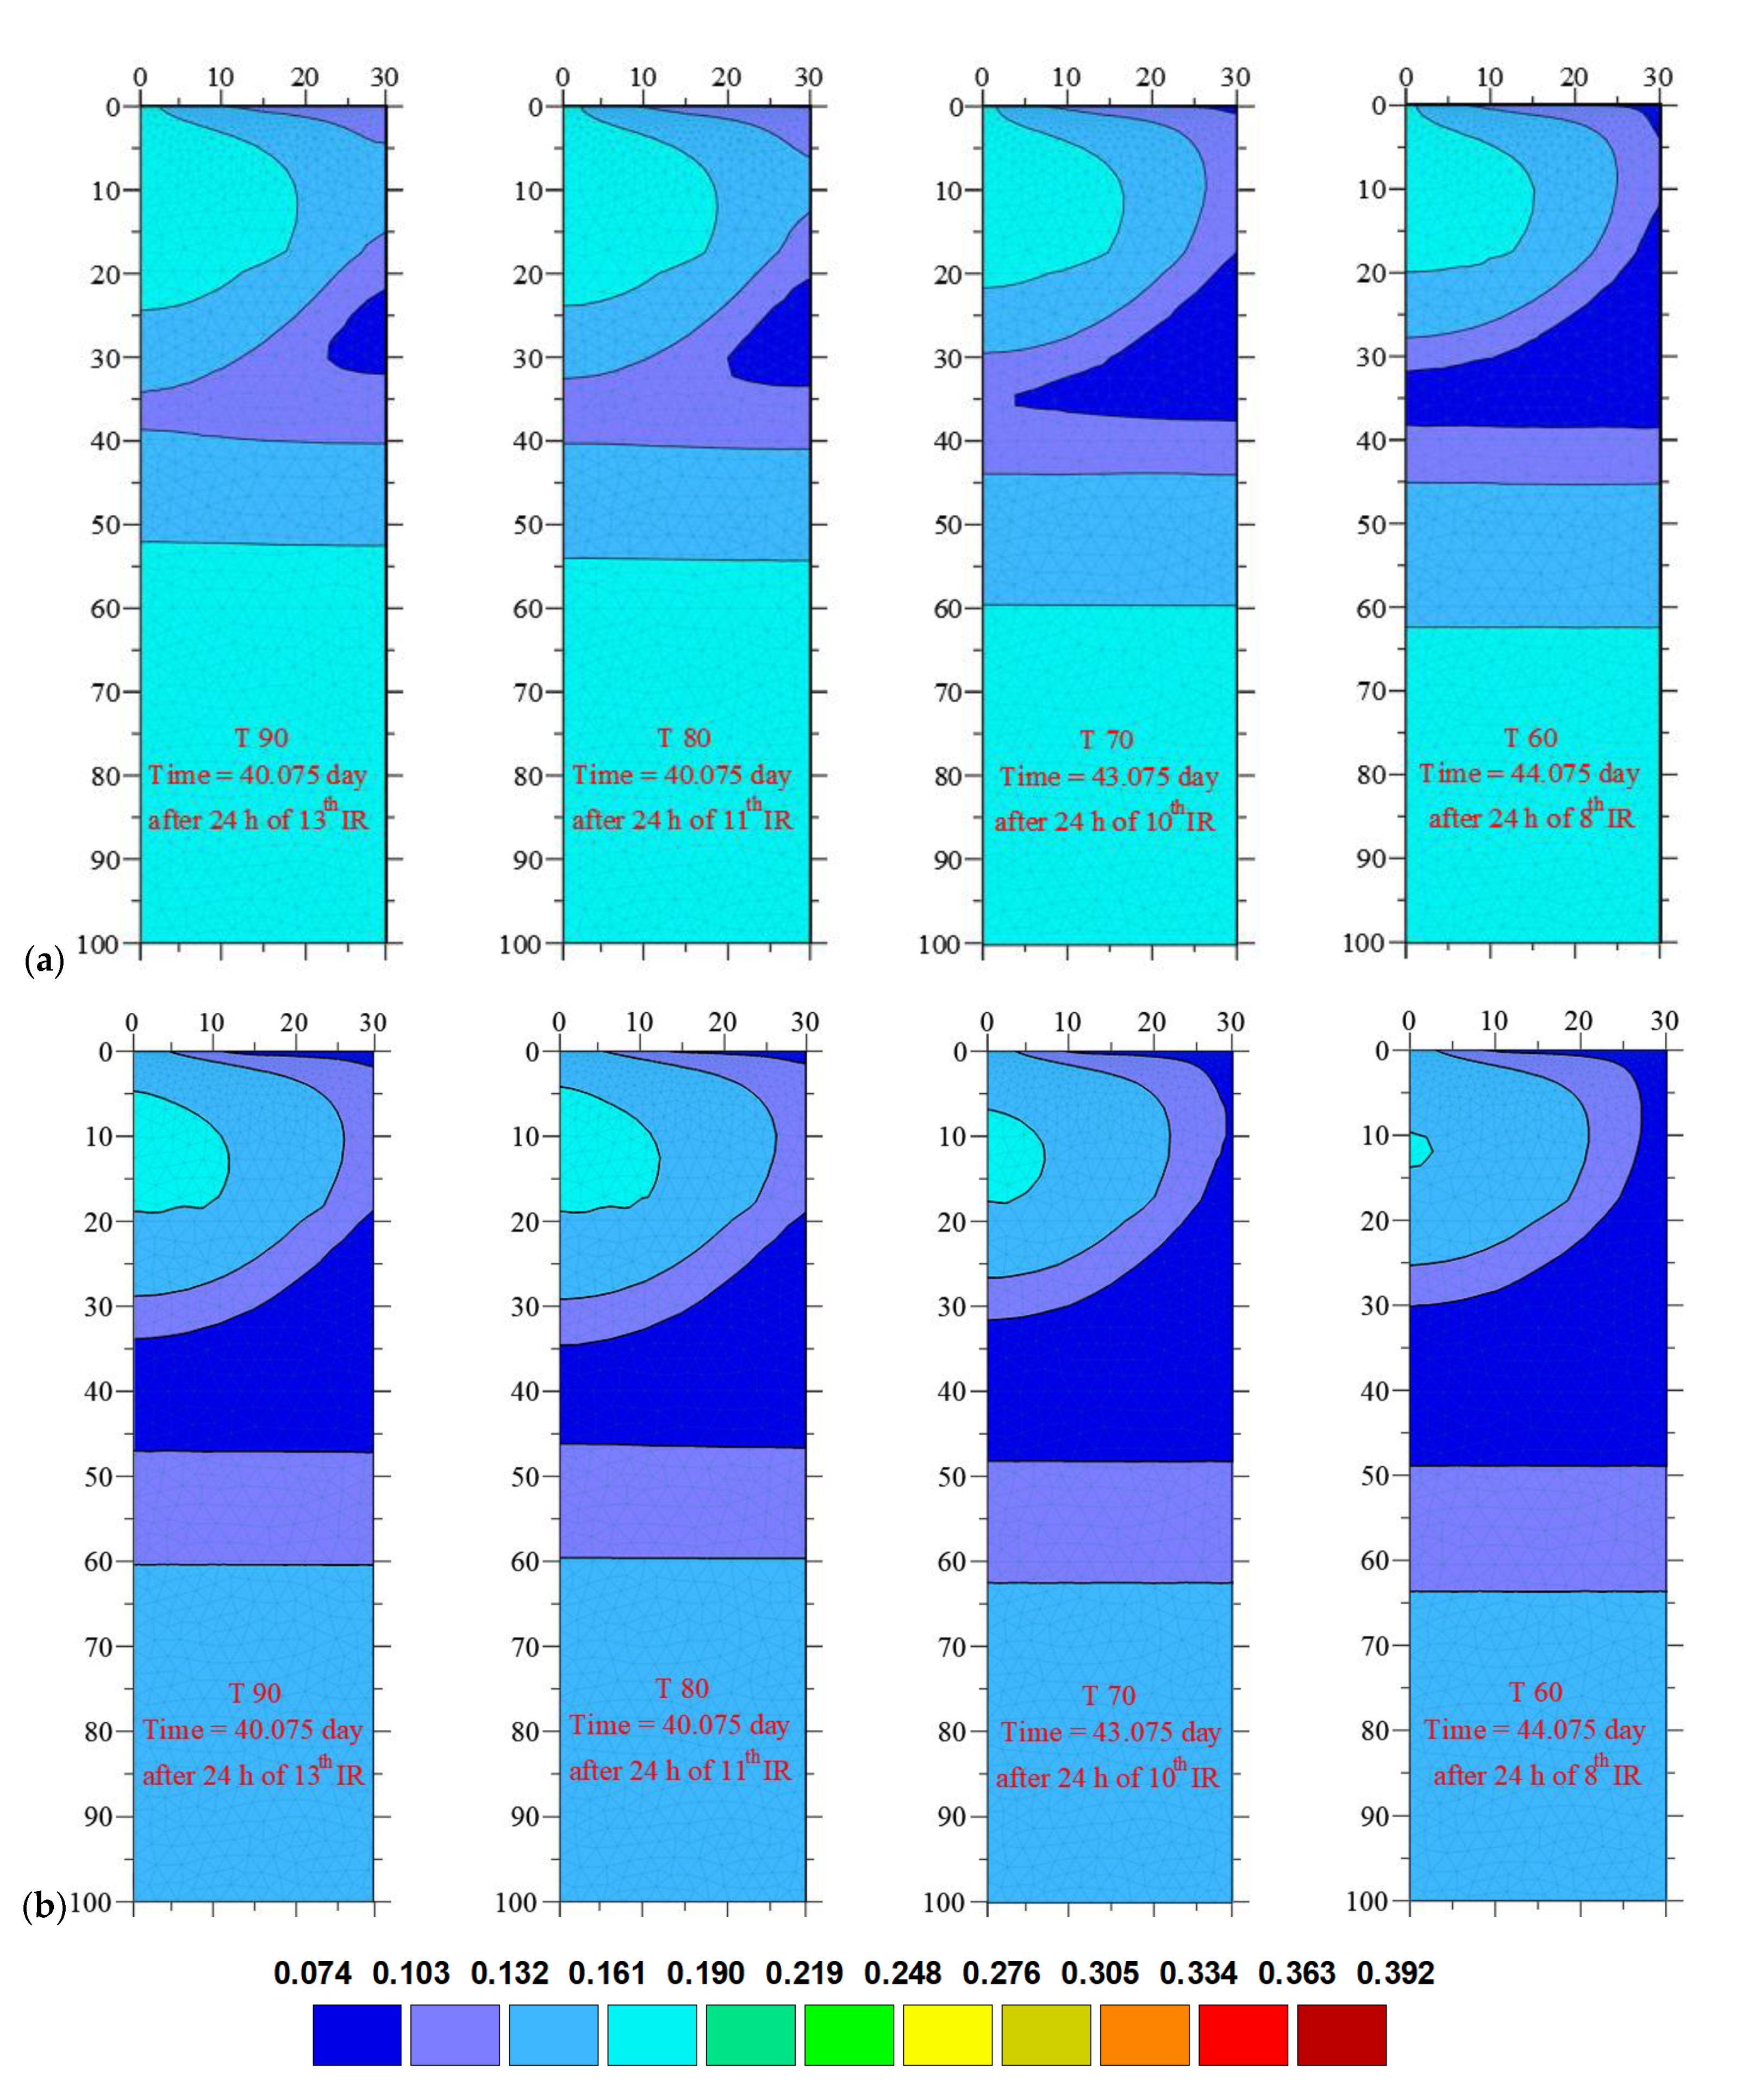
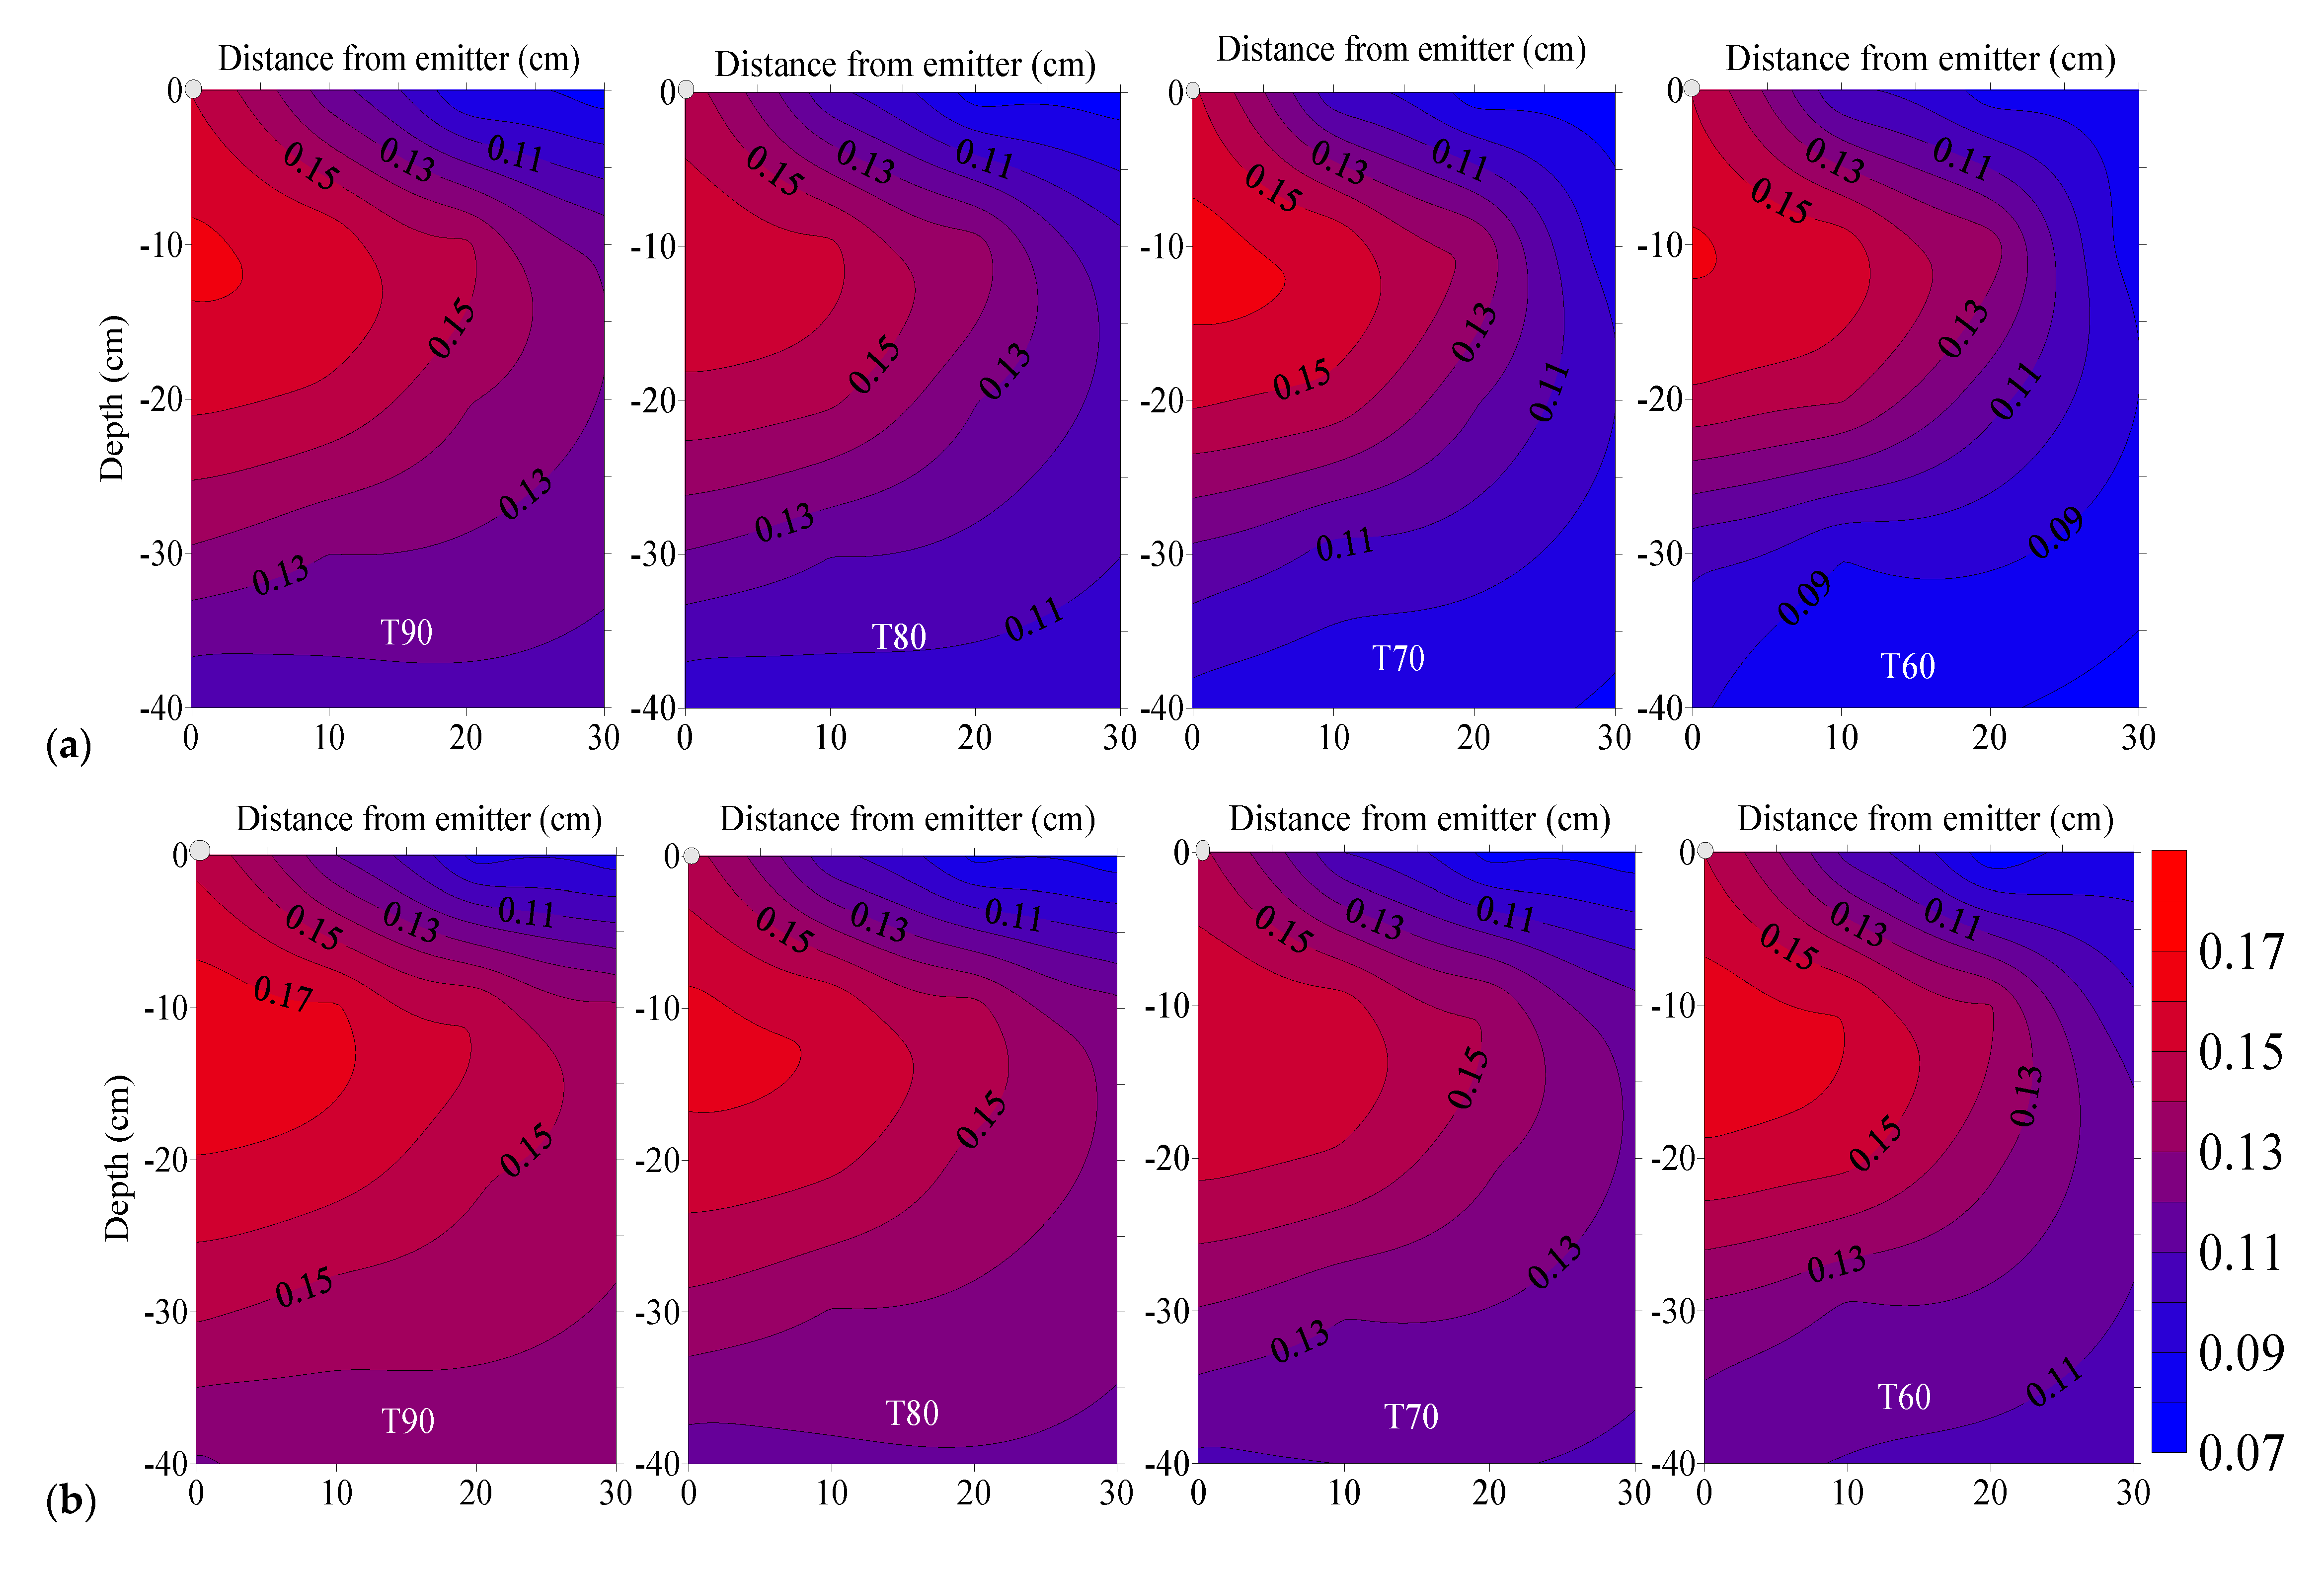
SWC, throughout the simulation domain and 24 h after applying the middle irrigation event for all irrigation treatments (i.e., T90, T80, T70, and T60) when activating and deactivating the root growth module, is shown in Figure 3. The corresponding day for the middle irrigation event of T90, T80, T70, and T60 was 39.1, 39.1, 42.1, and 43.1 days from the onset of simulation, respectively. The SWC for the upper two subregions, especially at the upper 20 cm soil depth close to the emitter, was slightly higher in all irrigation treatments when activating the root growth module compared to the case of constant average root depth (no growth). Higher RWU rates occurred when assigning constant average root depth compared to the case of using the root growth module. Figure 3 shows that, for both root growth modules, as applied irrigation water increased SWC increased throughout the entire simulation domain. The SWC was higher in T90 compared with other irrigation treatments. Thus, the deficit irrigation greatly impacted the SWC distribution throughout the simulation domain.
3.2. SWC at the End of the Growing Season
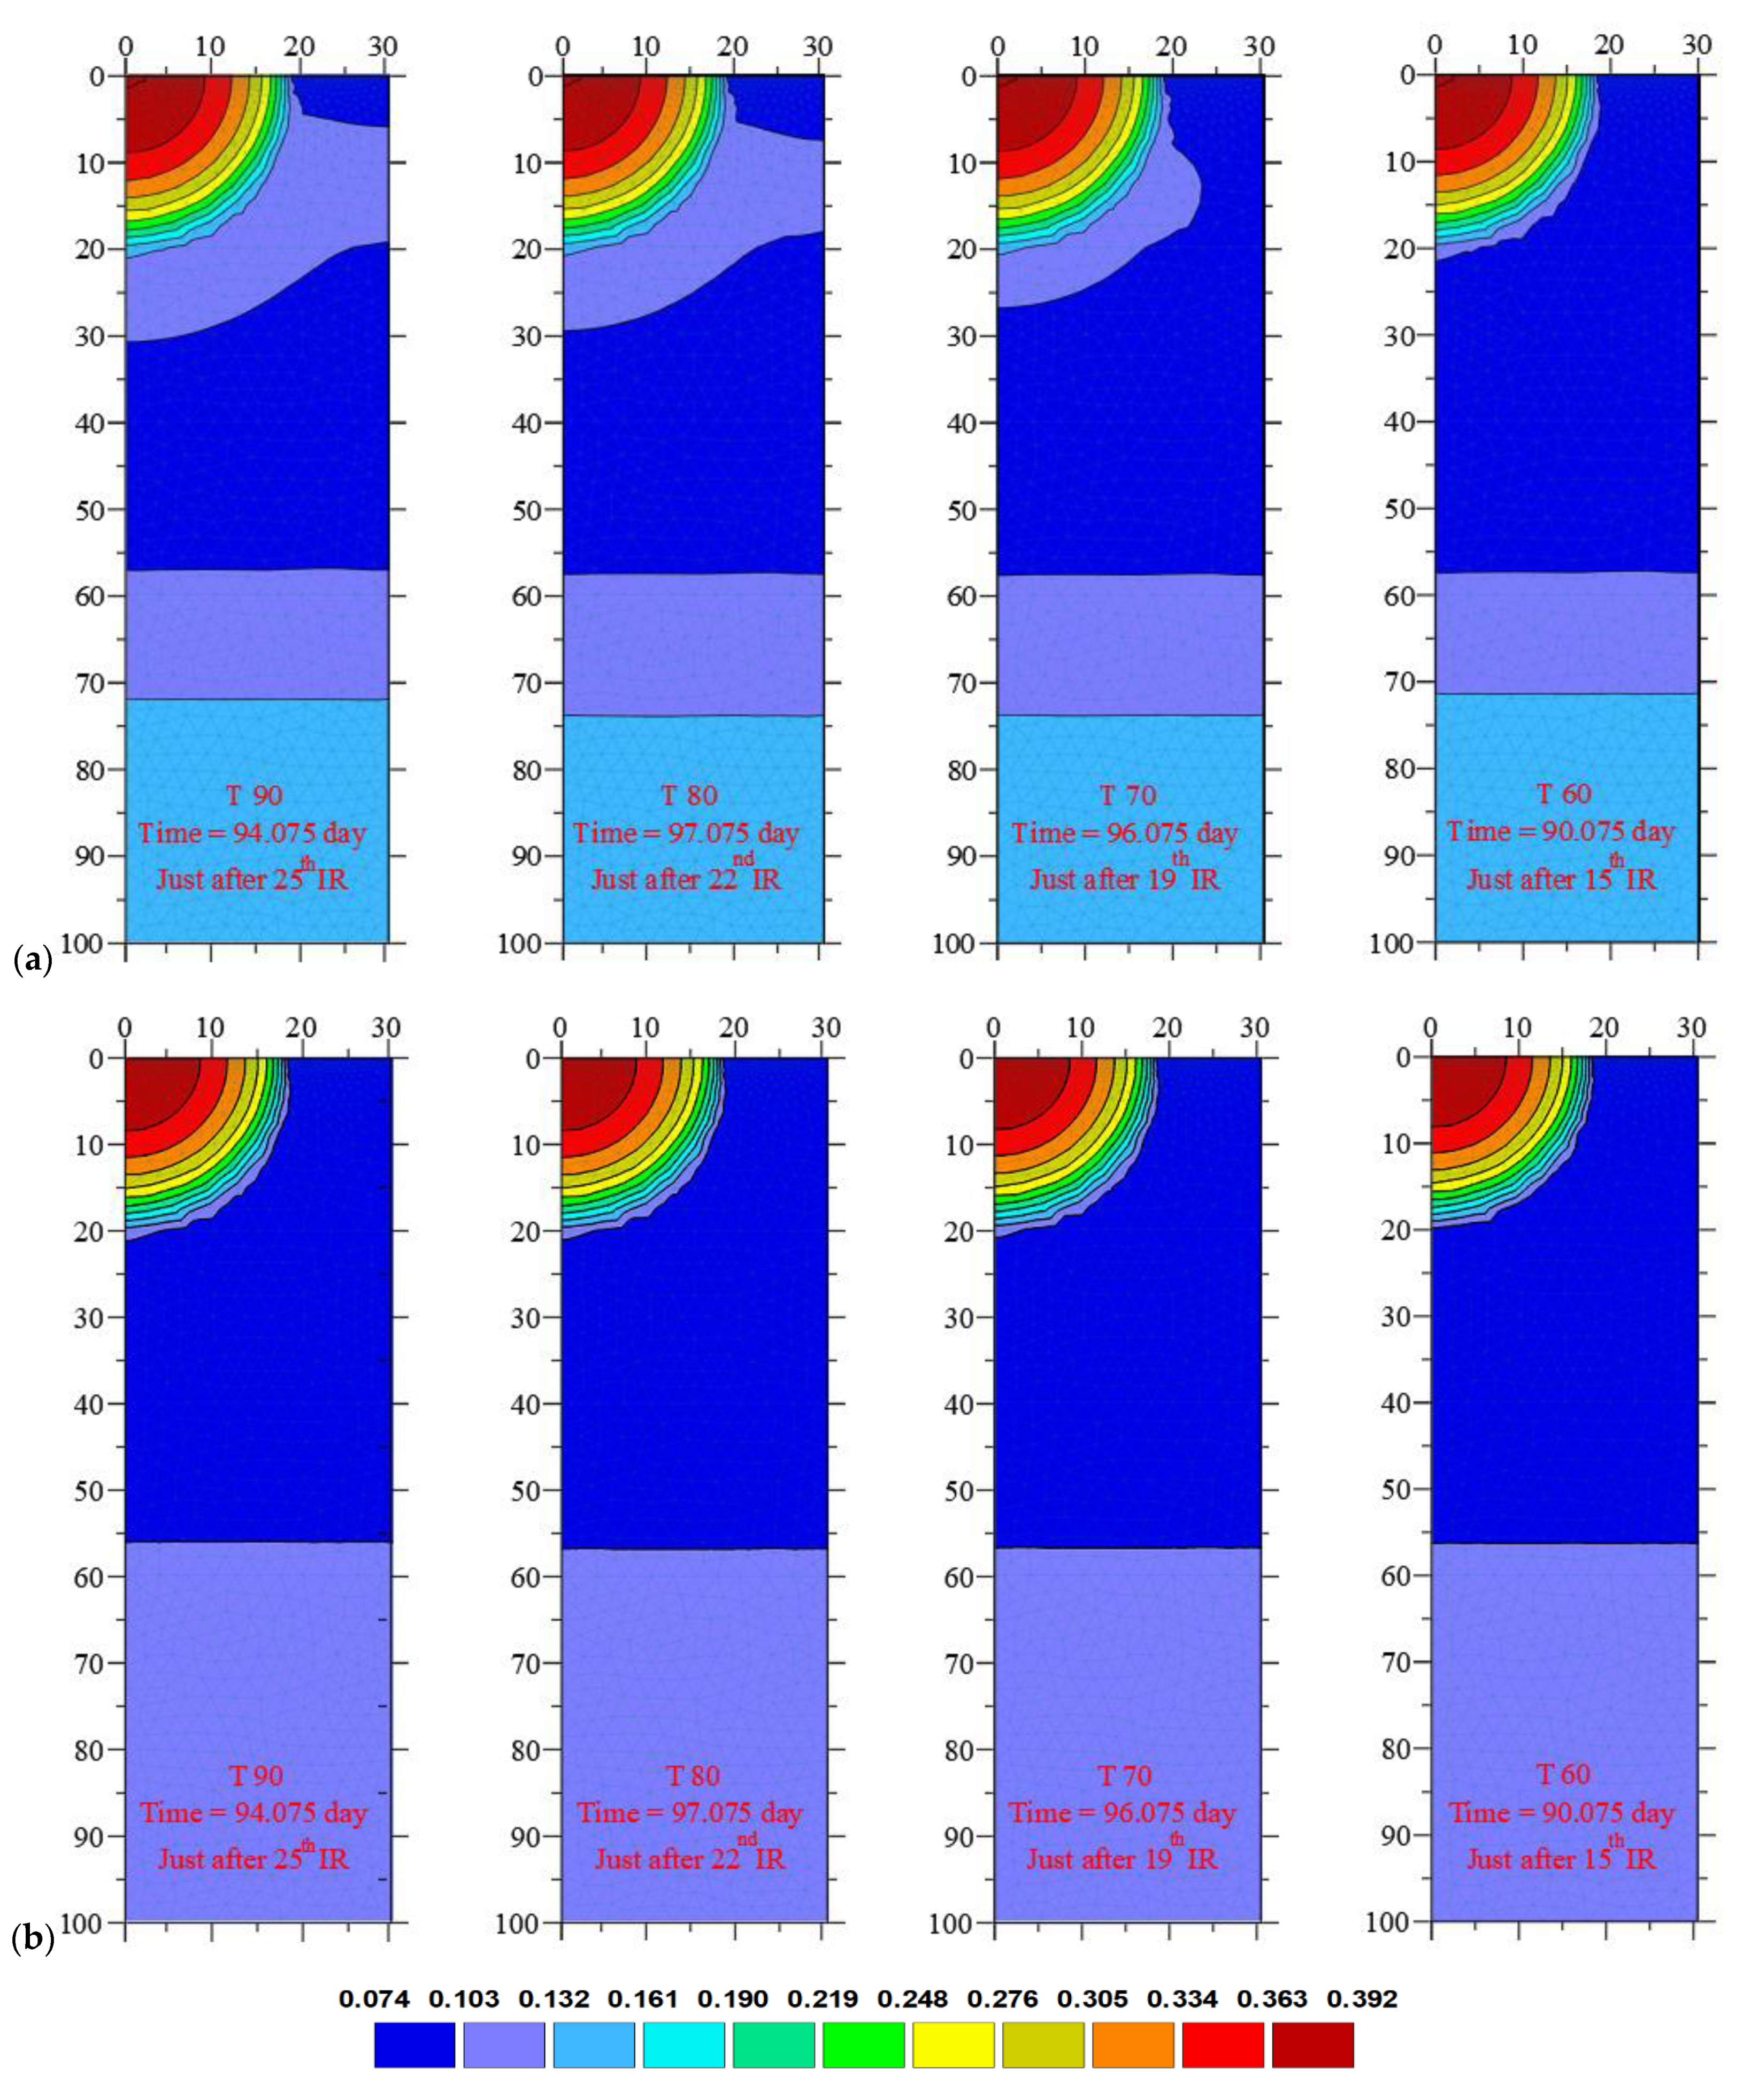
The SWC distribution directly after applying the last irrigation event for all deficit irrigation treatments is shown in Figure 4a,b. The last irrigation event ended on day 94.1, 97.1, 96.1, and 90.1 after the transplanting date for T90, T80, T70, and T60, respectively. The figure illustrates that SWC was approximately the same for the simulations in both modules of root distribution under the same irrigation treatment. No obvious difference is noted in SWC, especially in the region close to the emitter and in the region containing maximum root density (upper 25 cm). Conversely, insignificant differences in SWC were observed in the upper 30 cm soil layer far from the emitter for treatments T90, T80, and T70. The SWC was higher when activating the root growth module. However, T60 showed no significant differences in SWC at the upper 55 cm while activating and deactivating the root growth modules.
3.3. Spatial Distribution of SWC and Statistical Results
The average SWC 24 h after the three irrigation events (first, middle, and last) for both cases of root growth and no growth, for the upper two subregions, and for the four irrigation treatments is shown in Figure 5a,b. The 40 cm depth represents the two upper subregions where maximum root density was established and where maximum root water uptake occurred. The results show that the average SWC throughout the upper two subregions was higher when applying the root growth module compared to the constant average root depth (no growth). This can be attributed to higher RWU rates when a constant average root depth is applied. For this case, the root system was constant from the beginning to the end of the simulation period. Thereby, RWU was higher compared to results obtained from the root growth module. Figure 5 shows that SWC was higher in T90 compared to other irrigation treatments, regardless of the root growth module. As irrigation increases, SWC in the upper 40 cm soil depth increases. To investigate and assess the differences between water contents while applying different root growth models, statistical tests were performed.
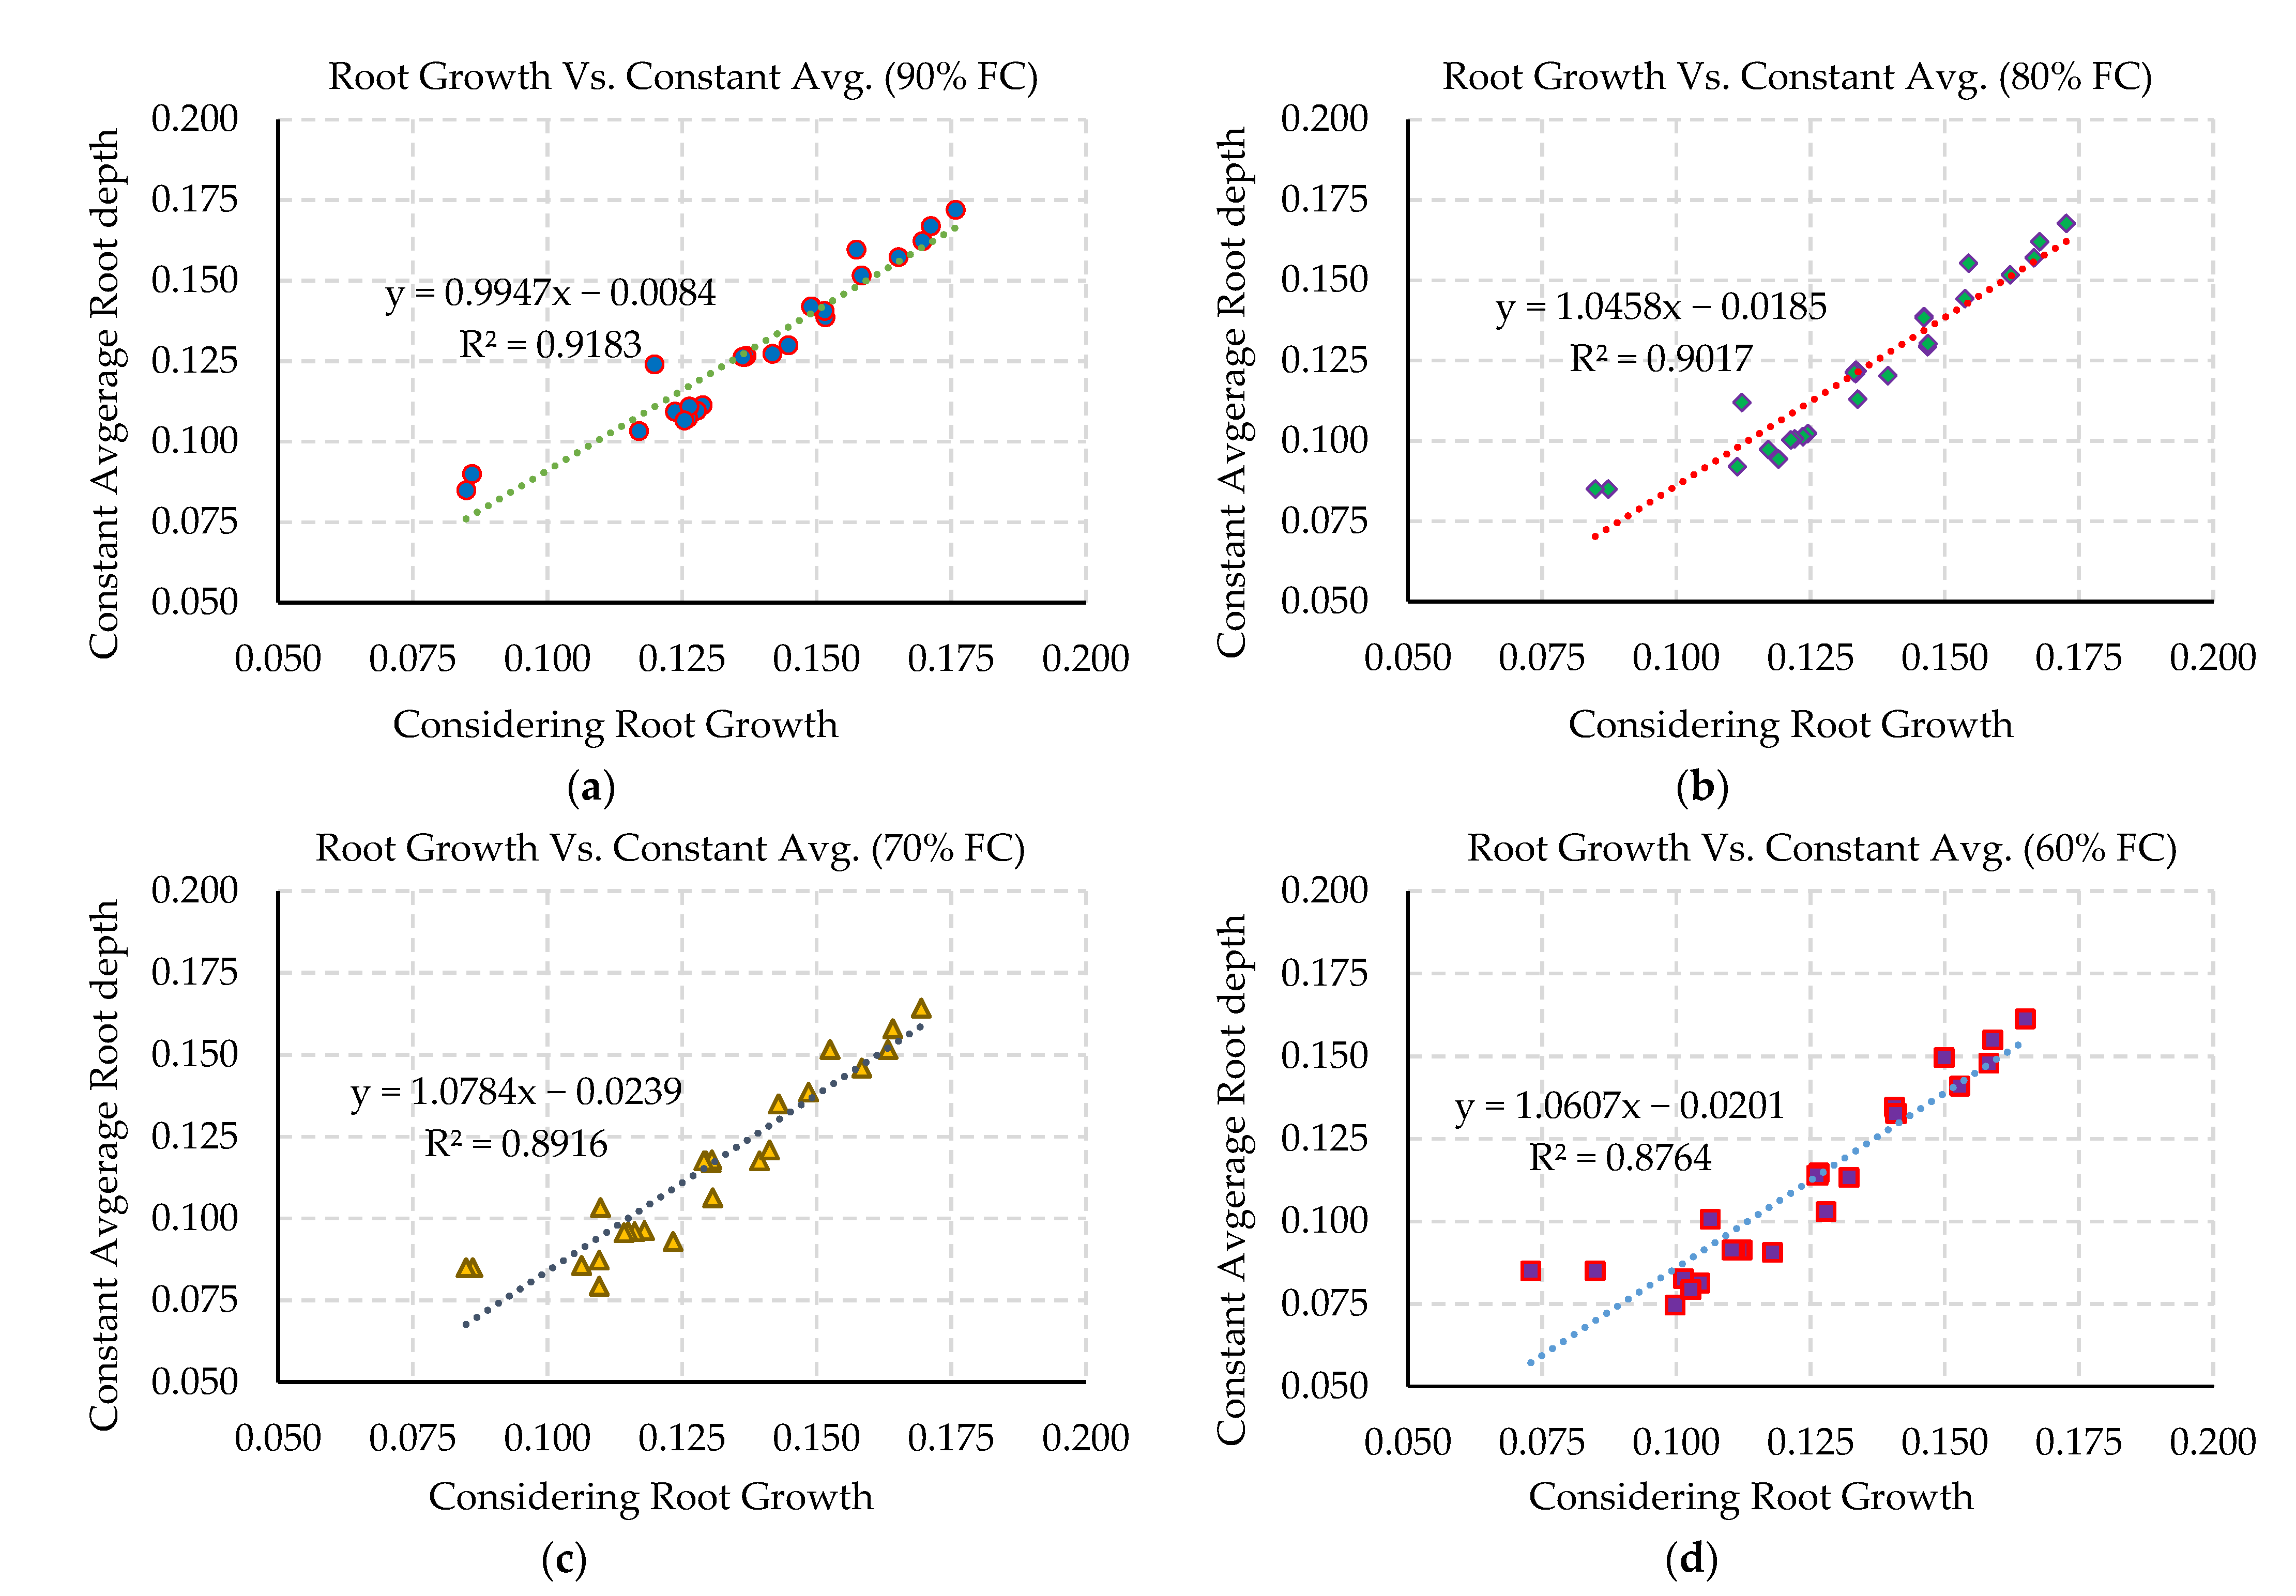
The correlation analysis for average SWC between root growth and constant average root depth (no growth) is shown in Figure 6a–d for T90, T80, T70, and T60, respectively. Average SWC was calculated at the location of the twenty-eight observation points exactly at the emitter, along the 30 cm domain width with 10 cm apart, and along the 60 cm depth with 10 cm apart. The SWC at each location was calculated as an average of three dates: 24 h after the first irrigation event (during the initial stage), 24 h after the mid-irrigation event (mid-growth stage), and 24 h after the last irrigation event (reflects the late stage). Root mean square error was calculated by which the relationship between the root growth case and constant average root depth was linear. The R2 was 0.918 for T90, 0.902 for T80, 0.892 for T70, and 0.876 for T60.
The analysis of variance of SWC average between deactivating and activating the root growth module (assigning constant average root depth with no growth and considering root growth during simulation) for each irrigation treatment is shown in Table 5. The results show that there is no significant difference for SWC between the case of constant average root depth and considered root growth for T90 and T60 treatments where p-values equal 0.1314, and 0.0599, respectively. Results of the ANOVA test show that the difference between SWC for the case of constant average root depth and root growth was significant for the T80 and T70 irrigation treatments where p-values equaled 0.0492, and 0.0337, respectively.
3.4. Comparison of Different Cumulative Fluxes
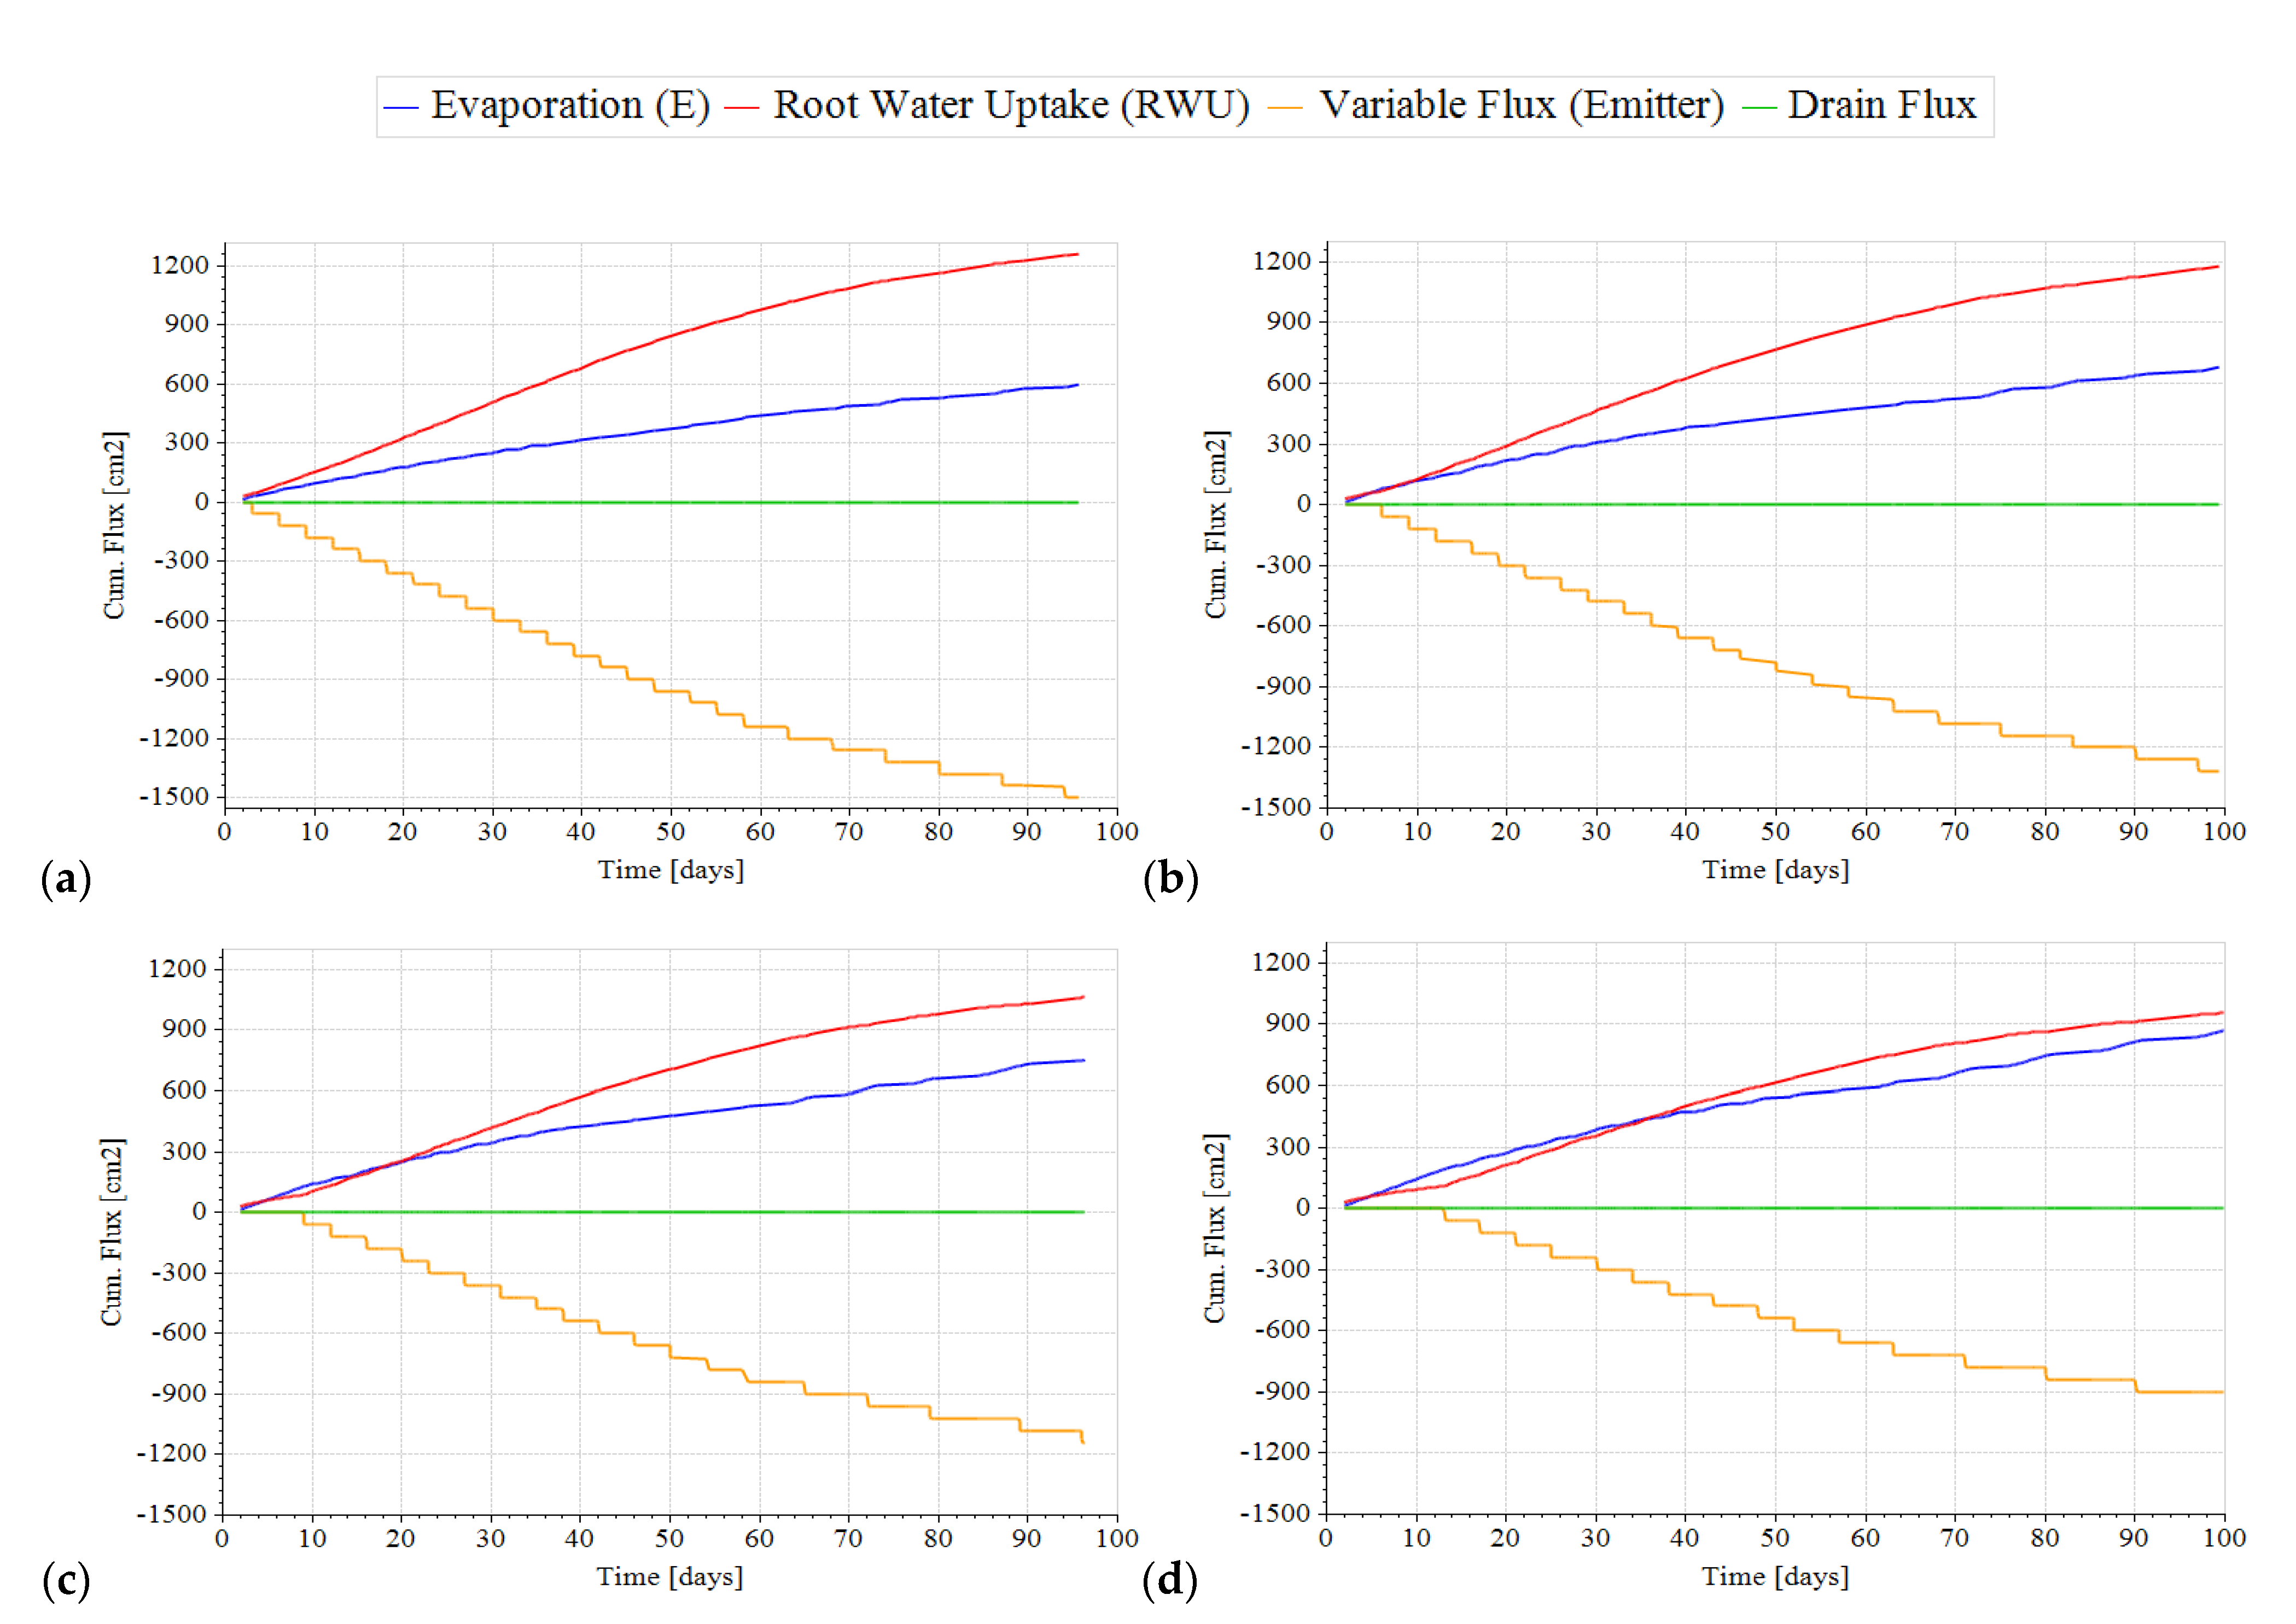
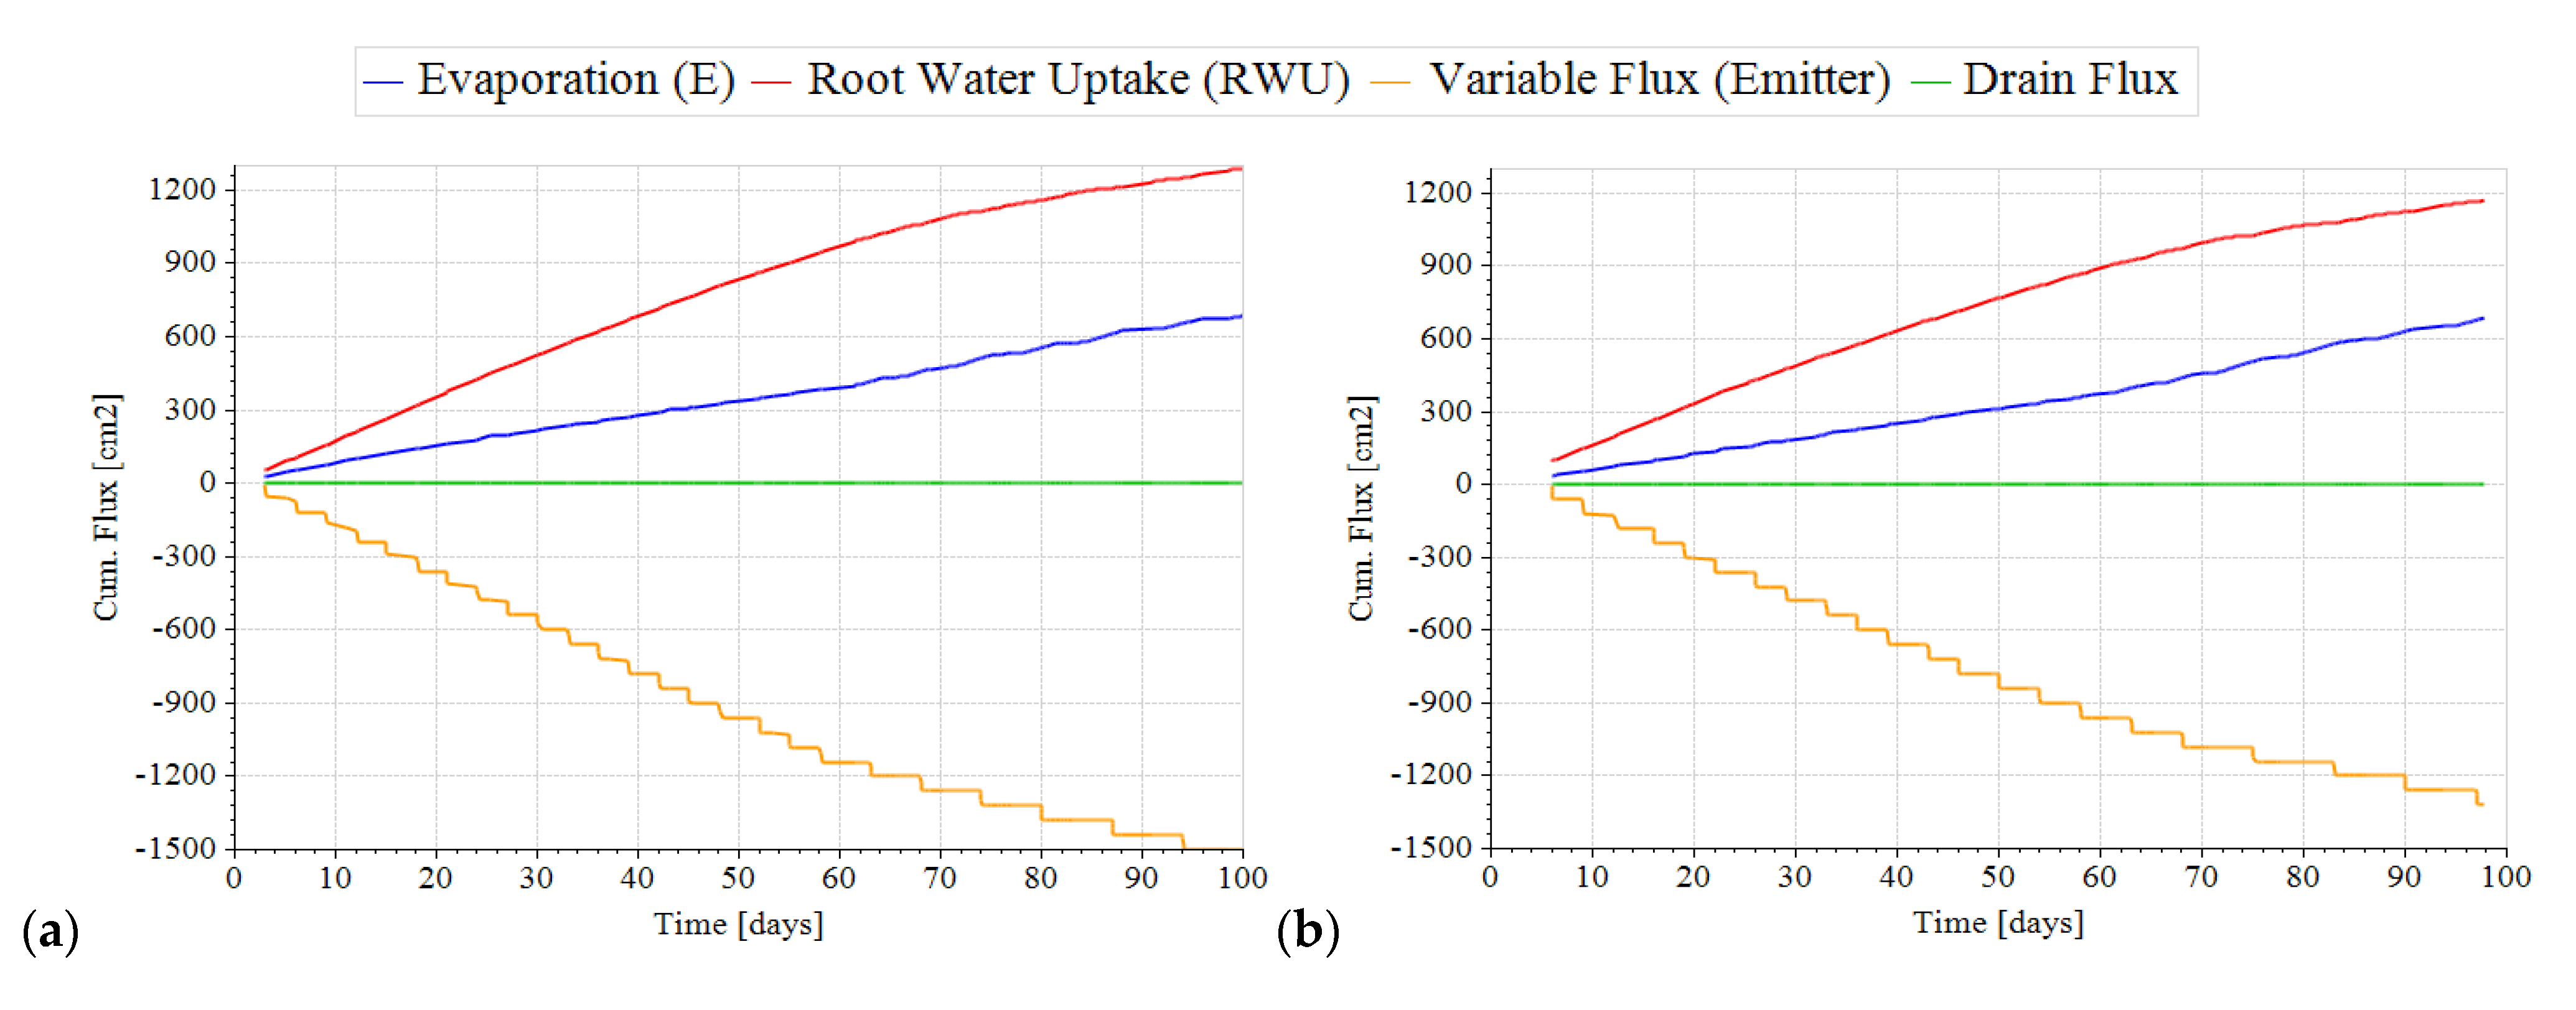
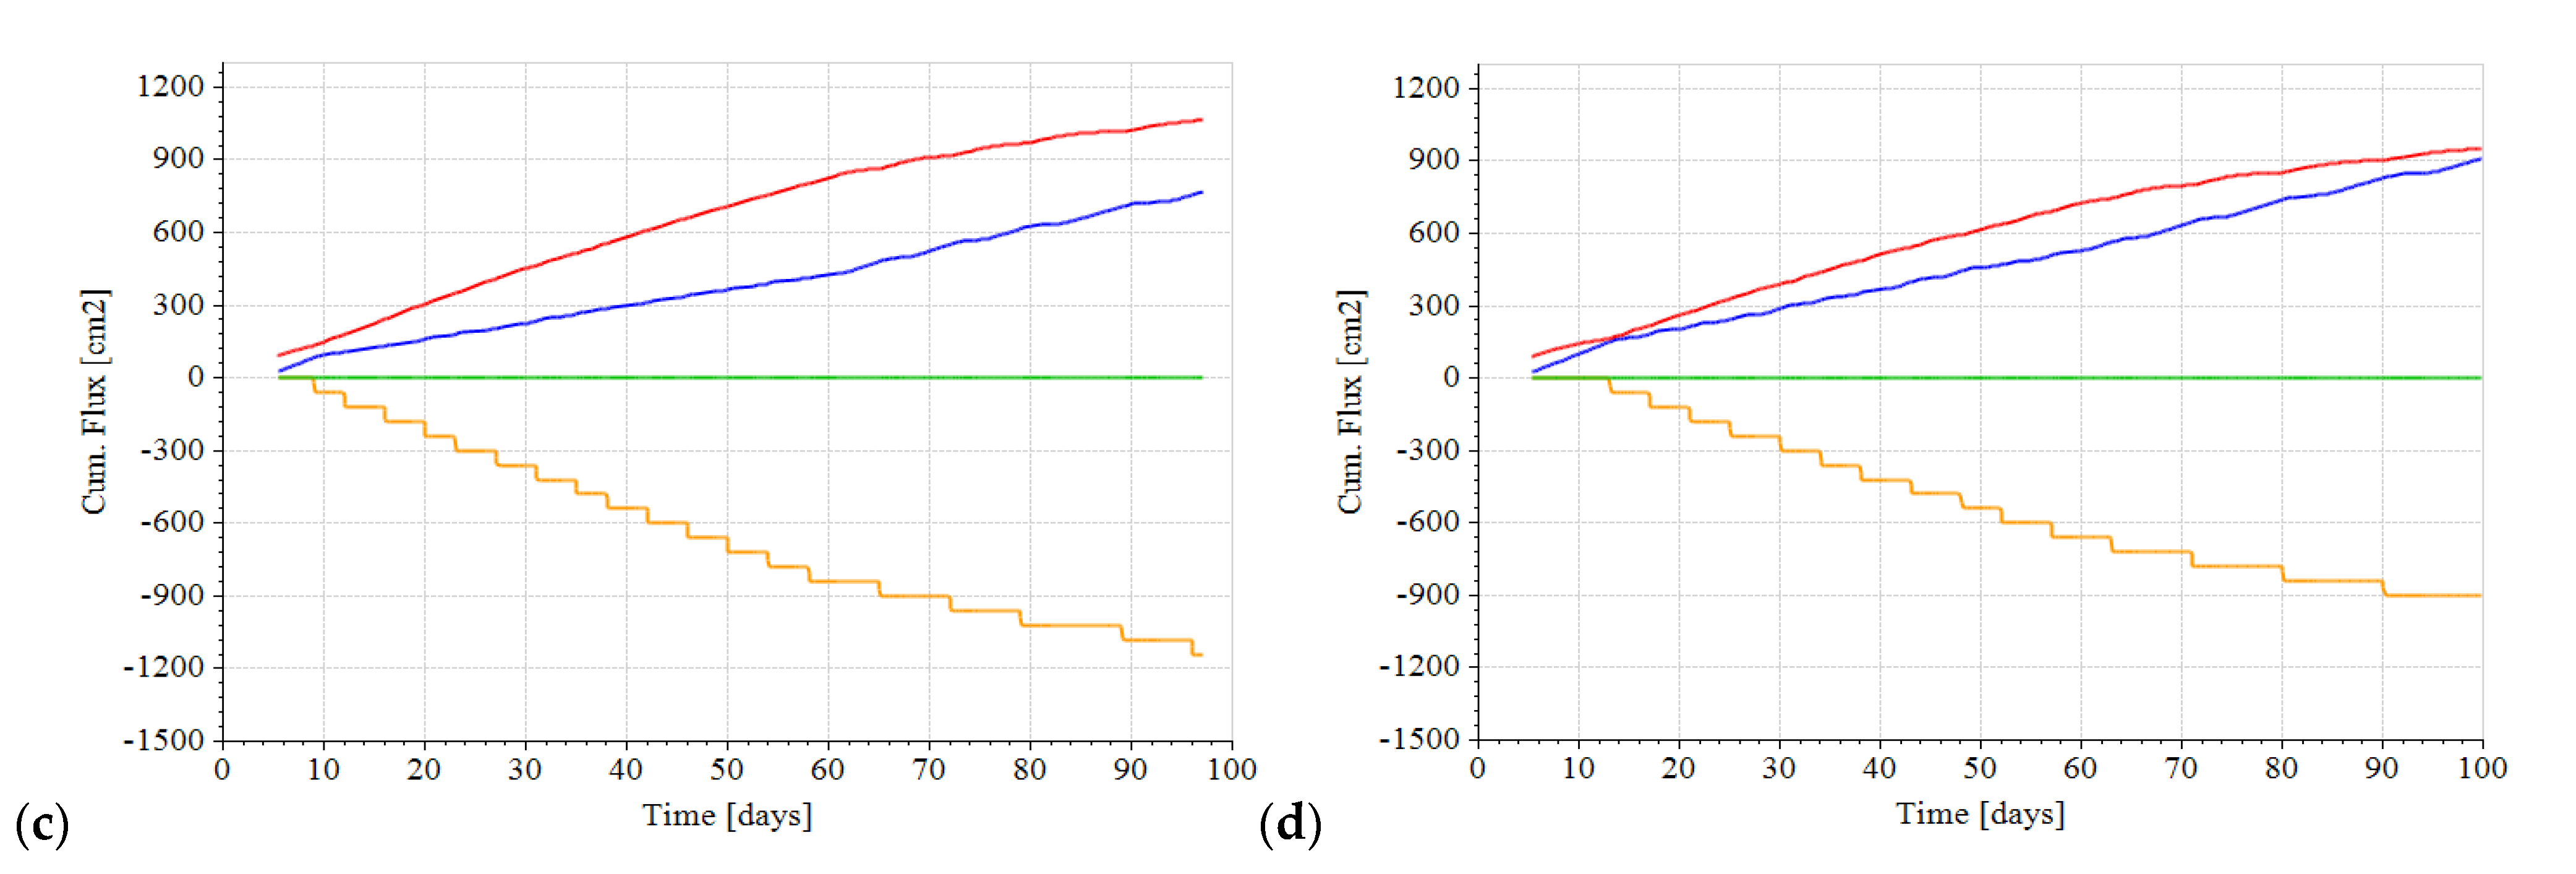
Cumulative RWU, evaporation, free drainage, and variable fluxes for different deficit irrigation treatments are shown in Figure 7 and Figure 8 for the cases of root growth and no growth, respectively. The results show that as irrigation water increased, cumulative RWU increased regardless of root growth [43]. In contrast, cumulative evaporation decreased as irrigation water increased. As the applied water was less than the crop water requirement, no free drainage occurred. Approximately no free drainage occurred during the simulation of the four different irrigation treatments for the two cases of root growth and no growth. The cumulative RWU was slightly higher when applying constant average root depth (no growth) compared with root growth. The cumulative RWU for T90, T80, T70, and T60 when using constant average root depth was 1289.50, 1179.30, 1073.10, and 949.86 cm2, respectively. These values, when applying the root growth module, were 1263.50, 1177.0, 1072.00, and 955.60 cm2. No significant differences in cumulative RWU were obtained when applying different root growth modules, especially in T80 and T70. Therefore, activating the root growth module did not affect the cumulative RWU.
Cumulative evaporation was higher when deactivating the root growth module compared with activating this module. Cumulative evaporation for T90, T80, T70, and T60 when using constant average root depth was 685.18, 693.84, 771.25, and 911.84 cm2, respectively. When applying the root growth module, these values were 599.17, 678.68, 767.34, and 870.71 cm2, respectively. The differences in cumulative evaporation when applying two root growth modules were more pronounced in T90 and T60 compared with T70 and T80. The selected cumulative fluxes: RWU, evaporation, free drainage, and variable flux for the cases of constant average root depth (no growth) and considered root growth are shown in Table 6.
The results of Table 7 show that there are significant differences between grain yields among the four irrigation treatments for 2017 and 2018 where p-values equal 0.011 and 0.010 (<0.05), respectively. Also, there are significant differences in IWUE among irrigation treatments for 2017 and 2018 where p-values equal 0.002 and 0.001, respectively.
3.5. Growth and Yield
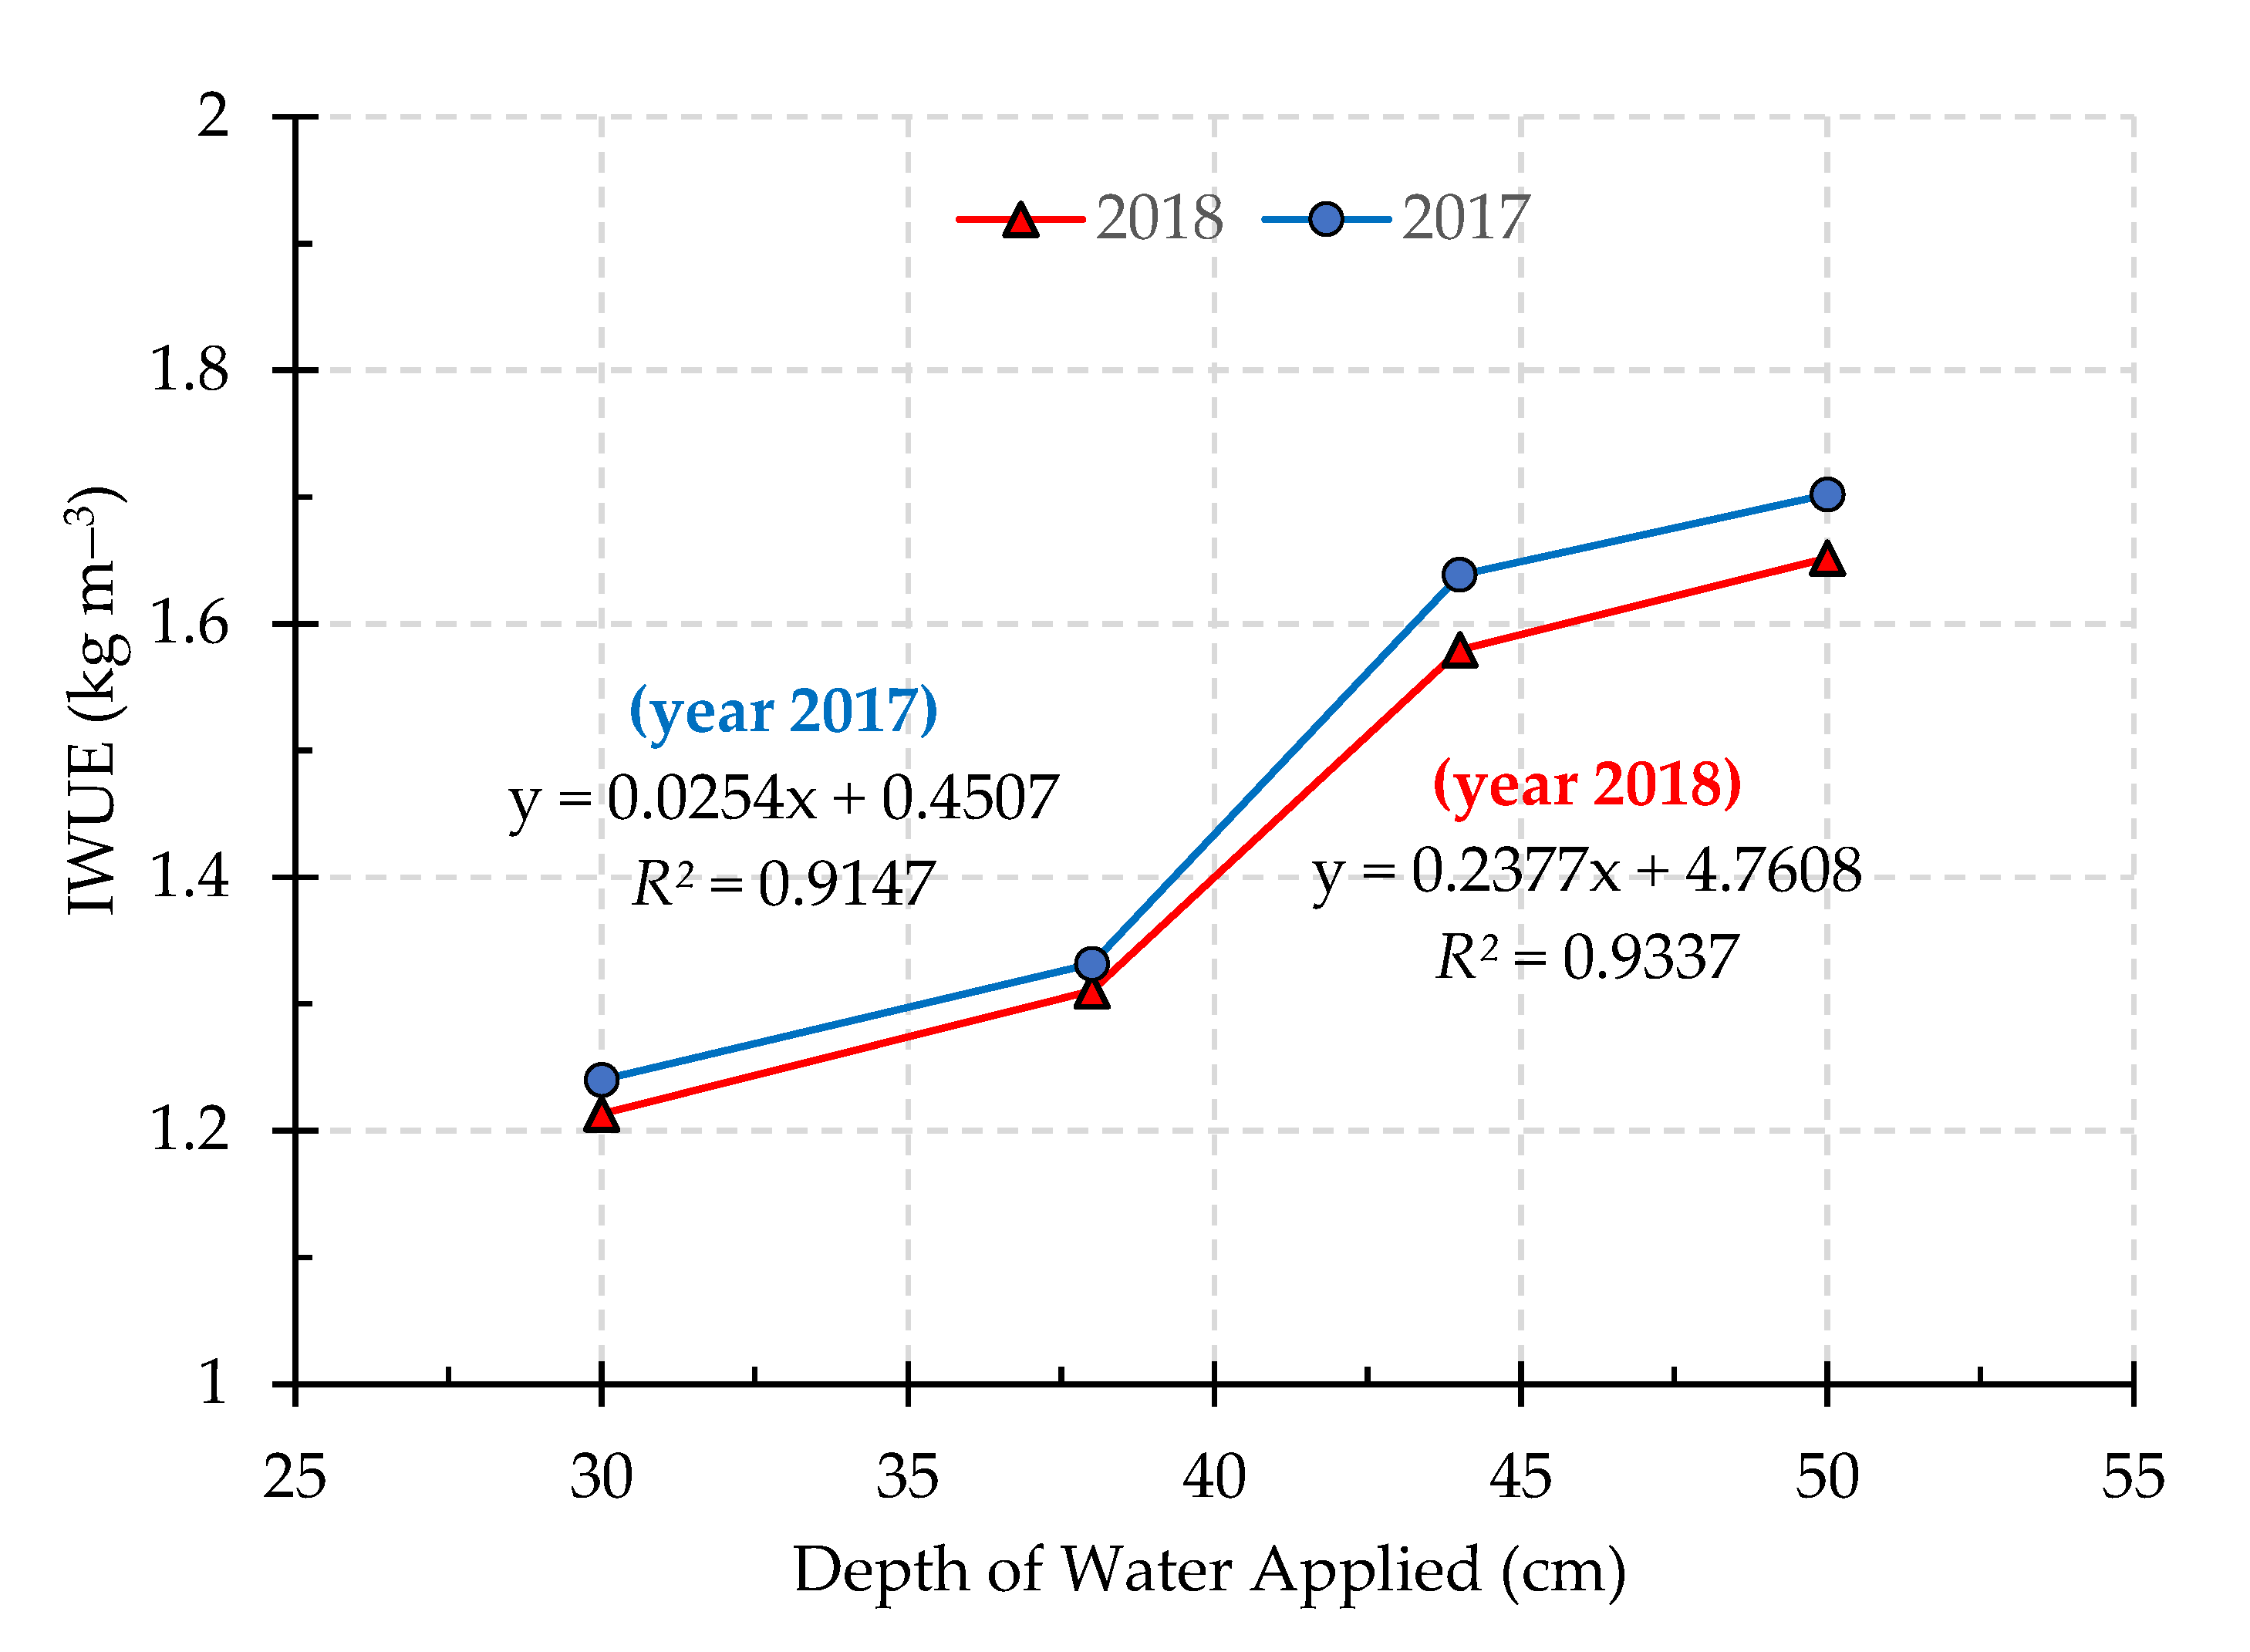
Table 8 shows calculations of IWUE (kg m−3) for the collected yield of each treatment during the two successive agricultural seasons. Figure 9 shows the relationship between IWUE and the applied irrigation water (IR). Experimental results show that yield (kg ha−1) is significantly correlated with IR (m3 ha−1). During 2018, IWUE was 1.65, 1.58, 1.31, and 1.21 kg m−3 corresponding to T90, T80, T70, and T60, respectively and was 1.70, 1.62, 1.27, and 1.09 kg m−3 during 2017. Statistical analysis revealed that yield is correlated to RWU with p-values equal to 0.992 and 0.995 at a 0.01 level of significance (two-tailed).
Table 9 shows the growth and yield of rice plants during the two successive agricultural seasons under different deficit treatments. The table reveals that the growth and yield of rice plants were influenced by the applied deficit irrigation levels. The largest growth traits (i.e., plant height (82.50 cm), tiller number plant−1 (3.40), panicle length (23.25 cm), panicle weight (2.93 gm), grain number panicles−1 (112.50), and grain yield (8.39 ton ha−1)) were obtained under irrigation treatment T90. Growth and yield traits of the paddy were negatively affected and considerably decreased with an increase in the severity of water stress. T60 resulted in a decrease of plant height (24.2%), tiller number plant−1 (29.4%), panicle length (27.5%), panicle weight (24.7%), grain number panicle−1 (36.8%), and grain yield (56.1%) compared with T90. The Pearson correlation between grain yield (ton ha−1) among the four irrigation treatments and other yield parameters for 2017 and 2018 is shown in Table 10.
4. Discussion
The high SWC at the top 20 cm soil depth (near the emitters) one day after applying the middle irrigation event during the growing season (Figure 3) for the case of assigning root growth and considering constant root depth can be attributed to the effect of the root system configuration on RWU rates. When activating the root growth module, the roots evolved with time and did not reach their full configuration (maximum root density) at the middle of the growing season. Thereby, RWU rates did not reach their highest values as compared to the case of constant average root depth. Moreover, due to the application of deficit irrigation treatments, SWC did not exceed the initial SWC, which confirms that the plants were always subjected to water stress. The almost similar distribution of SWC at the end of the growing season (Figure 4) confirmed that root length was the same for the two modules (considering root growth function and no root growth) during the late stage of the growing season. This similarity leads to approximately the same RWU rates as the cumulative RWU (Figure 7 and Figure 8). Similar results were obtained by Bufon et al. [44] with high volumetric moisture content near the emitters. The insignificant differences of SWC along the 55 cm depth between the cases of activating and deactivating the root growth for treatment T60 can be attributed to severe water deficiency during T60 for both cases of root growth and no growth, compared with the other irrigation treatments (T90, T80, and T70). The SWC was approximately the same throughout the uppermost 50 cm of soil layer directly before the irrigation event; these results are similar to Eltarabily et al. [45].
The minimally cumulative free drainage for treatment T60 (Figure 7d and Figure 8d), compared with other treatments, confirms that the plants exploit all applied irrigation water, which proves the existence of plant water stress. Although free drainage fluxes were close to zero, higher values were observed when activating the root growth module. This is due to a higher SWC in the simulation domain when activating the root growth module (Figure 5b) and relatively lower RWU, especially during the initial stage of the growing season. The strong correlation between yield and RWU for the different treatments explains the simulation results of the cumulative evaporation. Cumulative evaporation for T60 and T70 was relatively high compared to other treatments. When a reduction in cumulative RWU occurs, an increase in evaporation loss prevails. This confirms plant exposure to severe water stress when applying the T70 and T60 treatments. In this case of drought stress, the root water uptake of rice is affected by the root response, which is highly dependent on the crop genotype, period, and density of stress [46,47]. The reduction in growth and yield of rice caused by water stress may be attributed to the decrease in SWC, resulting in lower water and nutrient uptake by roots, causing a reduction in cell deviation, a cell enlargement decreases in the leaf area [48], stomatal closure, and a reduction in photosynthetic activity [49,50,51,52].
5. Summary and Conclusions
The HYDRUS-2D/3D model is considered an effective tool for irrigation management. A precise estimation of the model input leads to successful irrigation scheduling. The SWC distribution within the soil profile depends mainly on applied water (amount and duration) and RWU. However, RWU is greatly affected by the imposed root distribution during simulation. In the current study, two root distribution modules (i.e., constant average root depth and root growth) incorporated with the HYDRUS-2D/3D model (version 3.03) were used during a simulation of drip-irrigated rice in sandy loam soil under different deficit irrigation treatments. These treatments corresponded to the situation in which the first irrigation event was applied when the pre-irrigation average of SWC within the upper 60 cm soil depth was equal to 90% (T90), 80% (T80), 70% (T70), and 60% (T60) of plant-available water. The simulated DI system reflects a representative field experiment that was implemented in El-Fayoum Governorate, Egypt, during two successive seasons in 2017 and 2018. The irrigation schedule in the year 2018 was used to run the HYDRUS model. However, the experimental results of the two successive seasons were considered while comparing the effect of different deficit treatments on grain yield, IWUE, and growth traits. Simulation results showed that both SWC and RWU were correlated with water deficiency. Higher SWC and RWU were observed under T90, while lower values occurred under T60. By activating the root growth module, relatively higher average SWC within the root zone, regardless of deficit treatments, was obtained as compared to constant average root depth (no growth).
Cumulative RWU at the end of the simulation period was slightly higher when assigning a constant average root depth. Results of the ANOVA test showed that there was no significant difference for SWC between treatments when activating the root growth module while it was significant while using constant average root depth. For all deficit irrigation treatments, although SWC and RWU results differed at specific dates during the growing season when activating and deactivating the root growth module, the cumulative fluxes (by the end of the simulation period) were approximately the same. Therefore, the root growth module is recommended as it is a powerful tool for accurately investigating changes in SWC. Experimental results showed that the growth and yield of rice plants during the two successive agricultural seasons was greatly affected by the level of water deficiency. As the applied water decreased, the grain yield, IWUE, and growth traits (plant height, tillers number plant−1, panicles length, panicles weight, and grains number panicles−1) of rice decreased. Higher yield, IWUE, and growth traits were obtained under T90, while lower values were obtained under T60. Therefore, severe deficit irrigation treatment is not recommended for drip-irrigated rice. We believe that the findings of our study are important for users of older versions of the HYDRUS software (version 2.05 and earlier). Users should consider the limitations of these versions for predicting different fluxes at specific dates during the growing season when scheduling irrigation events. Results are also important for managers in terms of irrigation scheduling to use irrigation water sustainably.
Author Contributions
Conceptualization, M.G.E. and T.S.; Methodology, M.G.E., M.E.-R. and T.S.; Software, M.G.E. and T.S.; Formal Analysis, M.G.E. and T.S.; Investigation, N.M.A. and M.E.-R.; Resources, M.G.E., R.B. and T.S.; Data Curation, M.G.E., N.M.A. and T.S.; Writing—Original Draft, M.G.E., M.E.-R. and T.S.; Writing—Review & Editing, M.G.E., R.B. and T.S.; Visualization, R.B., N.M.A., M.E.-R. and T.S.; Supervision, M.G.E. and R.B.; Project Administration, M.G.E., R.B. and N.M.A.; Funding Acquisition, T.S. All authors have read and agreed to the published version of the manuscript.
Funding
This research received no specific grant from any funding agency in the public, commercial, or not-for-profit sectors.
Institutional Review Board Statement
Not applicable.
Informed Consent Statement
Not applicable.
Data Availability Statement
The data presented in this study is available on request from the corresponding author.
Acknowledgments
Thank you to the journal editor and the anonymous reviewers for their constructive comments and suggestions for improving the manuscript quality.
Conflicts of Interest
The authors declare that there is no conflict of interest.
References
- FAO. Rice Irrigation in the Near East: Current Situation and Prospects for Improvement; FAO Regional Office for the Near East: Cairo, Egypt, 2003. [Google Scholar]
- Kruzhilin, I.P.; Doubenok, N.N.; Ganiev, M.A.; Rodin, K.A.; Nevezhina, A.B. The impact of anthropogenically-controlled factors on the formation of root mass and rice yield under drip irrigation in the Lower Volga Region. Russ. Agric. Sci. 2019, 45, 561–564. [Google Scholar] [CrossRef]
- El-Shahway, A.S.; Mahmoud, M.M.A.; Udeigwe, T.K. Alterations in soil chemical properties induced by continuous rice cultivation: A study on the arid Nile delta soils of Egypt. Land Degrad. Dev. 2016, 27, 231–238. [Google Scholar] [CrossRef]
- Harby, M.; Naoya, F. Water saving scenarios for effective irrigation management in Egyptian rice cultivation. Ecol. Eng. 2014, 70, 11–15. [Google Scholar]
- CAPMAS. Central Agency for Public Mobilization & Statistics—Arab Republic of Egypt. 2018. Available online: https://egypt.unfpa.org/sites/default/files/pub-pdf/Data%20Ecosystem%20Final%20Web%20English.pdf (accessed on 2 July 2021).
- WWAP, World Water Assessment Programme. The United Nations World Water Development Report 4: Managing Water under Uncertainty and Risk; UNESCO: Paris, France, 2012. [Google Scholar]
- Saxena, R.; Vanga, S.; Wang, J.; Orsat, V.; Raghavan, V. Millets for food security in the context of climate change: A review. Sustainability 2018, 10, 2228. [Google Scholar] [CrossRef] [Green Version]
- USAID. Update to Egypt’s Rice Production, Consumption, and Trade Figures. 2018. Available online: https://www.fas.usda.gov/data/egypt-update-egypt-s-rice-production-consumption-and-trade-figures (accessed on 2 July 2021).
- Chen, S.; Cai, S.G.; Chen, X.; Zhang, G.P. Genotypic differences in growth and physiological responses to transplanting and direct seeding cultivation in rice. Rice Sci. 2009, 16, 143–150. [Google Scholar] [CrossRef]
- Farooq, M.; Siddique, K.H.M.; Rehman, H.; Aziz, T.; Lee, D.; Wahid, A. Rice direct seeding: Experiences, challenges, and opportunities. Soil Tillage Res. 2011, 111, 87–98. [Google Scholar] [CrossRef]
- Elbasiouny, H.; Elbehiry, F. Rice Production in Egypt: The Challenges of Climate Change and Water Deficiency. In Springer Water: Climate Change Impacts on Agriculture and Food Security in Egypt; Ewis Omran, E.S., Negm, A., Eds.; Springer: Cham, Switzerland, 2020. [Google Scholar] [CrossRef]
- El-Marsafawy, S.M.; Swelam, A.; Ghanem, A. Evolution of crop water productivity in the Nile Delta over three decades (1985–2015). Water 2018, 10, 1168. [Google Scholar] [CrossRef] [Green Version]
- Tuong, T.P.; Bouman, B.A.M.; Mortimer, M. More rice, less water—Integrated approaches for increasing water productivity in irrigated rice-based systems in Asia. Plant Prod. Sci. 2005, 8, 231–241. [Google Scholar] [CrossRef]
- Kruzhilin, I.P.; Dubenok, N.N.; Ganiev, M.A.; Ovchinnikov, A.S.; Melikhov, V.V.; Abdou, N.M.; Rodin, K.A.; Fomin, S.D. Mode of rice drip irrigation. ARPN J. Eng. Appl. Sci. 2017, 12, 7118–7123. [Google Scholar]
- Geerts, S.; Raes, D. Deficit irrigation as an on-farm strategy to maximize crop water productivity in dry areas. Agric. Water Manag. 2009, 96, 1275–1284. [Google Scholar] [CrossRef] [Green Version]
- Sharda, R.; Mahajan, G.; Siag, M.; Singh, A.; Chauhan, B.S. Performance of drip-irrigated dry-seeded rice (Oryza sativa L.) in South Asia. Paddy Water Environ. 2017, 15, 93–100. [Google Scholar] [CrossRef]
- He, H.B.; Ma, F.Y.; Yang, R.; Chen, L.; Jia, B.; Cui, J.; Li, L. Rice performance and water use efficiency under plastic mulching with drip irrigation. PLoS ONE 2013, 8, 83103. [Google Scholar] [CrossRef] [Green Version]
- Zhu, Q.; Wei, C.Z.; Li, M.N.; Zhu, J.L.; Wang, J. Nutrient availability in the rhizosphere of rice grown with plastic film mulch and drip irrigation. J. Soil Sci. Plant Nutr. 2013, 13, 943–953. [Google Scholar] [CrossRef] [Green Version]
- Guo, Q.R.; Chen, L. Analysis of advantage and prospects for rice drip irrigation under plastic film cultivation development in China. China Rice 2012, 18, 36–39. [Google Scholar]
- Coltro, L.; Marton, L.F.M.; Pilecco, F.P.; Pilecco, A.C.; Mattei, L.F. Environmental profile of rice production in Southern Brazil: A comparison between irrigated and subsurface drip irrigated cropping systems. J. Clean. Prod. 2017, 153, 491–505. [Google Scholar] [CrossRef]
- Li, Y.; Simunek, J.; Jing, L.; Zhang, Z.; Ni, L. Evaluation of water movement and water losses in a direct-seeded-rice field experiment using Hydrus-1D. Agric. Water Manag. 2014, 142, 38–46. [Google Scholar] [CrossRef] [Green Version]
- Simunek, J.; van Genuchten, M.T.; Sejna, M. Recent developments and applications of the HYDRUS computer software packages. Vadose Zone J. 2016, 15, 1–25. [Google Scholar] [CrossRef] [Green Version]
- Feddes, R.A.; Kowalik, P.J.; Zaradny, H. Simulation of Field Water Use and Crop Yield; John Wiley & Sons: New York, NY, USA, 1978. [Google Scholar]
- Zhang, X.X.; Whalley, P.A.; Ashton, R.W.; Evans, J.; Hawkesford, M.J.; Griffiths, S.; Huang, Z.D.; Zhou, H.; Mooney, S.J.; Whalley, W.R. A comparison between water uptake and root length density in winter wheat: Effects of root density and rhizosphere properties. Plant Soil 2020, 451, 345–356. [Google Scholar] [CrossRef]
- Xu, S.; Ji, X.; Jin, B.; Zhang, J. Root distribution of three dominant desert shrubs and their water uptake dynamics. J. Plant Ecol. 2017, 10, 780–790. [Google Scholar] [CrossRef] [Green Version]
- Simunek, J.; van Genuchten, M.T.; Sejna, M. Development and applications of the HYDRUS and STANMOD software packages and related codes. Vadose Zone J. 2008, 7, 587–600. [Google Scholar] [CrossRef] [Green Version]
- Simunek, J.; Hopmans, J.W. Modeling compensated root water and nutrient uptake. Ecol. Model. 2009, 220, 505–521. [Google Scholar] [CrossRef]
- Hartmann, A.; Simunek, J. HYDRUS Root Growth Module, Version 1. Hydrus Software Series 5; Department of Environmental Sciences, University of California Riverside: Riverside, CA, USA, 2015; p. 32. [Google Scholar]
- Cabangon, R.J.; Tuong, T.P.; Abdullah, N.B. Comparing water input and water productivity of transplanted and direct-seeded rice production systems. Agric. Water Manag. 2002, 57, 11–31. [Google Scholar] [CrossRef]
- Sudhir, Y.; Humphreys, E.; Kukal, S.S.; Gill, G.; Rangarajan, R. Effect of water management on dry seeded and puddled transplanted rice Part 2: Water balance and water productivity. Field Crops Res. 2011, 120, 123–132. [Google Scholar] [CrossRef]
- Available online: https://www.worldweatheronline.com/el-faiyum-weather/al-fayyum/eg.aspx (accessed on 20 March 2021).
- Schaap, M.; Leij, F.; van Genuchten, M. ROSETTA: A computer program for estimating soil hydraulic properties with hierarchical pedotransfer functions. J. Hydrol. 2001, 251, 163–176. [Google Scholar] [CrossRef]
- Van Genuchten, M.T. A closed-form equation for predicting the hydraulic conductivity of unsaturated soils. Soil Sci. Soc. Am. J. 1980, 44, 892–898. [Google Scholar] [CrossRef] [Green Version]
- FAO (Food and Agriculture Organization of the United Nations). FAO—Water, Natural Resources and Environment Department. 2012. Available online: http://www.fao.org/land-water/databases-and-software/cropwat/en/ (accessed on 2 July 2021).
- Allen, R.; Pereira, L.; Raes, D.; Smith, M. Crop Evapotranspiration, Guidelines for Computing Crop Water Requirements; FAO (Food and Agriculture Organization of the United Nations): Rome, Italy, 1998; Irrigation and Drainage Paper No. 56. [Google Scholar]
- He, Z.; Li, S.; Wang, Y.; Dai, L.; Lin, S. Monitoring rice phenology based on backscattering characteristics of multi-temporal RADARSAT-2 datasets. Remote Sens. 2018, 10, 340. [Google Scholar] [CrossRef] [Green Version]
- Salehi, A.A.; Navabian, M.; Varaki, M.E.; Pirmoradian, N. Evaluation of HYDRUS-2D model to simulate the loss of nitrate in subsurface controlled drainage in a physical model scale of paddy fields. Paddy Water Environ. 2017, 15, 433–442. [Google Scholar] [CrossRef]
- Rezayati, S.; Khaledian, M.; Razavipour, T.; Rezaei, M. Water flow and nitrate transfer simulations in rice cultivation under different irrigation and nitrogen fertilizer application managements by HYDRUS-2D model. Irrig. Sci. 2020, 38, 353–363. [Google Scholar] [CrossRef]
- Vrugt, J.A.; van Wijk, M.T.; Hopmans, J.W.; Simunek, J. One-, two-, and three-dimensional root water uptake functions for transient modeling. Water Resour. Res. 2001, 37, 2457–2470. [Google Scholar] [CrossRef] [Green Version]
- Viets, F.G., Jr. Increasing water use efficiency by soil management. In Plant Environment and Efficient Water Use; Pierre, W., Kirkham, D., Pesek, J., Shaw, R., Eds.; American Society of Agronomy: Madison, WI, USA, 1966; Volume 295, pp. 259–274. [Google Scholar]
- Ayers, R.S.; Westcot, D.W. Water Quality for Agriculture. In FAO Irrigation and Drainage; Paper 29 (Rev. 1); FAO: Rome, Italy, 1985. [Google Scholar]
- Kuschel-Otárola, M.; Rivera, D.; Holzapfel, E.; Schütze, N.; Neumann, P.; Godoy-Faúndez, A. Simulation of water-use efficiency of crops under different irrigation strategies. Water 2020, 12, 2930. [Google Scholar] [CrossRef]
- Eltarabily, M.G.; Bali, K.M.; Negm, A.M.; Yoshimura, C. Evaluation of root water uptake and urea fertigation distribution under subsurface drip irrigation. Water 2019, 11, 1487. [Google Scholar] [CrossRef] [Green Version]
- Bufon, V.B.; Lascano, R.J.; Bednarz, C.; Booker, J.D.; Gitz, D.C. Soil water content on drip-irrigated cotton: Comparison of measured and simulated values obtained with the Hydrus2-D model. Irrig. Sci. 2011, 30, 259–273. [Google Scholar] [CrossRef]
- Eltarabily, M.G.; Burke, J.M.; Bali, K.M. Effect of deficit irrigation on nitrogen uptake of sunflower in the low desert region of California. Water 2019, 11, 2340. [Google Scholar] [CrossRef] [Green Version]
- Pandey, V.; Shukla, A. Acclimation and tolerance strategies of rice under drought stress. Rice Sci. 2015, 22, 147–161. [Google Scholar] [CrossRef] [Green Version]
- Kim, Y.; Chung, Y.S.; Lee, E.; Tripathi, P.; Heo, S.; Kim, K.H. Root response to drought stress in rice (Oryza sativa L.). Intern. J. Mol. Sci. 2020, 21, 1513. [Google Scholar] [CrossRef] [PubMed] [Green Version]
- Shekoofa, A.; Sinclair, T.R. Aquaporin activity to improve crop drought tolerance. Cells 2018, 7, 2–10. [Google Scholar] [CrossRef] [Green Version]
- Palanog, A.D.; Swamy, B.P.; Shamsudin, N.A.; Dixit, S.; Hernandez, J.; Boromeo, T.H.; Sta. Cruz, P.C.; Kumar, A. Grain yield QTLs with consistent-effect under reproductive-stage drought stress in rice. Field Crop. Res. 2014, 161, 46–54. [Google Scholar] [CrossRef]
- Kruzhilin, I.P.; Dubenok, N.N.; Ganiev, M.A.; Melichov, V.V.; Abdou, N.M.; Rodin, K.A. Combination of the natural and anthropogenically-controlled conditions for obtaining various rice yield using drip irrigation systems. Russ. Agric. Sci. 2016, 42, 454–457. [Google Scholar] [CrossRef]
- Yang, X.; Wang, B.; Chen, L.; Li, P.; Cao, C. The different influences of drought stress at the flowering stage on rice physiological traits, grain yield, and quality. Sci. Rep. 2019, 9, 3742. [Google Scholar] [CrossRef] [PubMed] [Green Version]
- Eltarabily, M.G.; Burke, J.M.; Bali, K.M. Impact of deficit irrigation on shallow saline groundwater contribution and sunflower productivity in the Imperial Valley, California. Water 2020, 12, 571. [Google Scholar] [CrossRef] [Green Version]
Figure 1.
Domain geometry used in HYDRUS-2D simulations showing boundary conditions, variable finite element mesh generated for simulations, and location of the twenty-eight observation points.
Figure 1.
Domain geometry used in HYDRUS-2D simulations showing boundary conditions, variable finite element mesh generated for simulations, and location of the twenty-eight observation points.

Figure 2.
(a) Crop coefficients for the different growing stages; (b) estimated evapotranspiration (ETC), evaporation, and transpiration in mm during the growing season.
Figure 2.
(a) Crop coefficients for the different growing stages; (b) estimated evapotranspiration (ETC), evaporation, and transpiration in mm during the growing season.

Figure 3.
SWC distribution after 24 h from the middle irrigation event for the four irrigation treatments, (a) considered root growth, and (b) constant average root depth (no growth) during the growing season.
Figure 3.
SWC distribution after 24 h from the middle irrigation event for the four irrigation treatments, (a) considered root growth, and (b) constant average root depth (no growth) during the growing season.

Figure 4.
SWC distribution after the last irrigation event for the four irrigation treatments, (a) considering the root growth and (b) constant average root depth during the growing season.
Figure 4.
SWC distribution after the last irrigation event for the four irrigation treatments, (a) considering the root growth and (b) constant average root depth during the growing season.

Figure 5.
Average SWC (cm3 cm−3) 24 h after the first, middle, and last irrigation events for the four irrigation treatments, (a) constant average root depth, and (b) considered root growth during the growing season.
Figure 5.
Average SWC (cm3 cm−3) 24 h after the first, middle, and last irrigation events for the four irrigation treatments, (a) constant average root depth, and (b) considered root growth during the growing season.

Figure 6.
Relationship for SWC between the constant average root depth and root growth module for (a) T90, (b) T80, (c) T70, and (d) T60.
Figure 6.
Relationship for SWC between the constant average root depth and root growth module for (a) T90, (b) T80, (c) T70, and (d) T60.

Figure 7.
Cumulative root water uptake, evaporation, free drainage, and variable fluxes for (a) T90, (b) T80, (c) T70, and (d) T60 when activating root growth option.
Figure 7.
Cumulative root water uptake, evaporation, free drainage, and variable fluxes for (a) T90, (b) T80, (c) T70, and (d) T60 when activating root growth option.

Figure 8.
Cumulative RWU, evaporation, free drainage, and variable fluxes for (a) T90, (b) T80, (c) T70, and (d) T60 when deactivating root growth option.
Figure 8.
Cumulative RWU, evaporation, free drainage, and variable fluxes for (a) T90, (b) T80, (c) T70, and (d) T60 when deactivating root growth option.


Figure 9.
Relationship between water use efficiencies and applied depth of water (cm).


Table 1.
Day and date of irrigation events in model simulations for different treatments.
| Irrigation Event | Day and Date (in Simulations) of Irrigation Events from the Transplanting Date (17 June 2018) | |||
|---|---|---|---|---|
| T90 | T80 | T70 | T60 | |
| 1st | 3 (19 Jun) | 6 (22 Jun) | 9 (25 Jun) | 13 (29 Jun) |
| 2nd | 6 (22 Jun) | 9 (25 Jun) | 12 (28 Jun) | 17 (3 Jul) |
| 3rd | 9 (25 Jun) | 12 (28 Jun) | 16 (2 Jul) | 21 (7 Jul) |
| 4th | 12 (28 Jun) | 16 (2 Jul) | 20 (6 Jul) | 25 (11 Jul) |
| 5th | 15 (1 Jul) | 19 (5 Jul) | 23 (9 Jul) | 30 (16 Jul) |
| 6th | 18 (4 Jul) | 22 (8 Jul) | 27 (13 Jul) | 34 (20 Jul) |
| 7th | 21 (7 Jul) | 26 (12 Jul) | 31 (17 Jul) | 38 (24 Jul) |
| 8th | 24 (10 Jul) | 29 (15 Jul) | 35 (21 Jul) | 43 (29 Jul) |
| 9th | 27 (13 Jul) | 33 (19 Jul) | 38 (24 Jul) | 48 (3 Aug) |
| 10th | 30 (16 Jul) | 36 (22 Jul) | 42 (28 Jul) | 52 (7 Aug) |
| 11th | 33 (19 Jul) | 39 (25 Jul) | 46 (1 Aug) | 57 (12 Aug) |
| 12th | 36 (22 Jul) | 43 (29 Jul) | 50 (5 Aug) | 63 (18 Aug) |
| 13th | 39 (25 Jul) | 46 (1 Aug) | 54 (9 Aug) | 71 (26 Aug) |
| 14th | 42 (28 Jul) | 50 (5 Aug) | 58 (13 Aug) | 80 (4 Sept) |
| 15th | 45 (31 Jul) | 54 (9 Aug) | 65 (20 Aug) | 90 (14 Sept) |
| 16th | 48 (3 Aug) | 58 (13 Aug) | 72 (27 Aug) | --- |
| 17th | 52 (7 Aug) | 63 (18 Aug) | 79 (3 Sept) | --- |
| 18th | 55 (10 Aug) | 68 (23 Aug) | 89 (13 Sept) | --- |
| 19th | 58 (13 Aug) | 75 (30 Aug) | 96 (20 Sept) | --- |
| 20th | 63 (18 Aug) | 83 (7 Sept) | --- | --- |
| 21st | 68 (23 Aug) | 90 (14 Sept) | --- | --- |
| 22nd | 74 (29 Aug) | 97 (21 Sept) | --- | --- |
| 23rd | 80 (4 Sept) | --- | --- | --- |
| 24th | 87 (11 Sept) | --- | --- | --- |
| 25th | 94 (18 Sept) | --- | --- | --- |
Table 2.
Soil physical properties of the experimental site.
| Depth (cm) | Particle Size Distribution (%) | Bulk Density (g cm−3) | Hydraulic Conductivity (cm h−1) | Soil Water Content (SWC) (m3 m−3) | |||
|---|---|---|---|---|---|---|---|
| Sand | Silt | Clay | Field Capacity (FC) | Permanent Wilting Point (PWP) | |||
| 0–20 | 70.18 | 14.32 | 15.5 | 1.51 | 1.79 | 0.32 | 0.11 |
| 20–40 | 72.35 | 14.51 | 13.12 | 1.53 | 2.01 | 0.31 | 0.11 |
| 40–60 | 75.17 | 13.23 | 11.6 | 1.55 | 2.88 | 0.29 | 0.10 |
Table 3.
Soil water content (%) versus suction pressure (bar).
| Depth (cm) | P (bar) | 0.001 | 0.10 | 0.33 | 0.66 | l | 5 | 15 |
|---|---|---|---|---|---|---|---|---|
| 0–20 | SWC (%) | 43.02 | 34.64 | 31.88 | 24.08 | 23.01 | 19.47 | 11.07 |
| 20–40 | 42.26 | 33.97 | 30.64 | 24.39 | 23.37 | 19.52 | 10.79 | |
| 40–60 | 41.51 | 32.40 | 28.68 | 23.45 | 22.42 | 19.41 | 10.36 |
Table 4.
Hydraulic parameters of simulated soil.
| Soil Depth | θr | θs | n | α | l | Ks (cm d−1) |
|---|---|---|---|---|---|---|
| 0–20 cm | 0.0428 | 0.3918 | 1.6157 | 0.0031 | 0.5 | 10.70 |
| 20–40 cm | 0.0399 | 0.3843 | 1.5731 | 0.0037 | 0.5 | 11.00 |
| 40–100 cm | 0.0365 | 0.3777 | 1.5045 | 0.0049 | 0.5 | 12.45 |
θr: residual water content, θs: saturated water content, Ks: saturated hydraulic conductivity, α: inverse of the air-entry value, n: pore size distribution index, l: pore connectivity parameter.
Table 5.
ANOVA test for SWC between constant average root depth and root growth for different irrigation treatments.
Table 5.
ANOVA test for SWC between constant average root depth and root growth for different irrigation treatments.
| (T90) | ||||
|---|---|---|---|---|
| Source of Variation | Sum of Square, SS | Mean Square, MS | F-Statistic | p-Value |
| Between treatments | 0.0012 | 0.0012 | 2.35 | 0.131 |
| Error (within treatments) | 0.0271 | 0.0005 | ||
| (T80) | ||||
| Between treatments | 0.0021 | 0.0021 | 4.05 | 0.049 |
| Error (within treatments) | 0.0283 | 0.0005 | ||
| (T70) | ||||
| Between treatments | 0.0026 | 0.0026 | 4.75 | 0.034 |
| Error (within treatments) | 0.0299 | 0.0006 | ||
| (T60) | ||||
| Between treatments | 0.0022 | 0.0022 | 3.70 | 0.060 |
| Error (within treatments) | 0.0323 | 0.0006 | ||
F-ratio is 2.346, p is 0.1314. Result is not significant at p < 0.05. F-ratio is 4.048, p is 0.0492. Result is significant at p < 0.05. F-ratio is 4.747, p is 0.0337. Result is significant at p < 0.05. F-ratio is 3.695, p is 0.0599. Result is not significant at p < 0.05.
Table 6.
Selected cumulative fluxes (cm2); RWU, evaporation, free drainage, and variable flux for different irrigation treatments (T90, T80, T70, and T60) considering root growth and constant average root depth.
Table 6.
Selected cumulative fluxes (cm2); RWU, evaporation, free drainage, and variable flux for different irrigation treatments (T90, T80, T70, and T60) considering root growth and constant average root depth.
| T90 | T80 | T70 | T60 | |||||
|---|---|---|---|---|---|---|---|---|
| No Growth | Root Growth | No Growth | Root Growth | No Growth | Root Growth | No Growth | Root Growth | |
| Cumulative root water uptake (RWU) | 1289.50 | 1263.50 | 1179.30 | 1177.0 | 1073.10 | 1072.0 | 949.86 | 955.60 |
| Cumulative evaporation | 685.18 | 599.17 | 693.84 | 678.68 | 771.25 | 767.34 | 911.84 | 870.71 |
| Cumulative free drainage | 6.94 | 10.61 | 6.72 | 10.00 | 6.67 | 9.57 | 6.67 | 9.26 |
| Cumulative variable flux | 1500.00 | 1320.00 | 1140.00 | 900.00 | ||||
Table 7.
Normality test and t-test for difference in grain yield (kg ha−1) and water use efficiency (IWUE) (kg m−3) among the four irrigation treatments for 2017 and 2018.
Table 7.
Normality test and t-test for difference in grain yield (kg ha−1) and water use efficiency (IWUE) (kg m−3) among the four irrigation treatments for 2017 and 2018.
| Yield (kg ha−1) | IWUE (kg m−3) | |||
|---|---|---|---|---|
| 2017 | 2018 | 2017 | 2018 | |
| Skewness | 0.024 | −0.015 | −0.260 | −0.096 |
| Kurtosis | −2.451 | −2.405 | −3.831 | −4.416 |
| t-value | 5.733 | 5.811 | 9.842 | 13.630 |
| Sign. (two-tailed) | 0.011 | 0.010 | 0.002 | 0.001 |
Confidence interval is 95%.
Table 8.
Grain yield and irrigation water use efficiency (IWUE) for different irrigation treatments (T90, T80, T70, and T60).
Table 8.
Grain yield and irrigation water use efficiency (IWUE) for different irrigation treatments (T90, T80, T70, and T60).
| Irrigation Treatments | T90 | T80 | T70 | T60 | ||||
|---|---|---|---|---|---|---|---|---|
| Seasons | 2018 | 2017 | 2018 | 2017 | 2018 | 2017 | 2018 | 2017 |
| Grain yield (Kg ha−1) | 8260 | 8510 | 6950 | 7120 | 4980 | 5060 | 3640 | 3720 |
| Applied irrigation water (m3 ha−1) | 5000 | 5000 | 4400 | 4400 | 3800 | 4000 | 3000 | 3400 |
| Water use efficiency (IWUE) (kg m−3) | 1.65 | 1.70 | 1.58 | 1.62 | 1.31 | 1.27 | 1.21 | 1.09 |
Table 9.
Effect of deficit irrigation treatments on growth and yield of rice crop.
| Irrigation Treatment | Grain Yield (ton ha−1) | Plant Height (cm) | Tiller Number Plant−1 | Panicle Length (cm) | Panicle Weight (g) | Grain Number Panicle−1 |
|---|---|---|---|---|---|---|
| Season | 2018 | |||||
| T90 | 8.26 ± 0.22 | 81.33 ± 1.54 | 3.15 ± 0.32 | 23.11 ± 0.54 | 2.89 ± 0.09 | 110.01 ± 1.87 |
| T80 | 6.95 ± 0.13 | 74.21 ± 1.30 | 2.89 ± 0.21 | 20.12 ± 0.36 | 2.75 ± 0.13 | 96.87 ± 1.64 |
| T70 | 4.89 ± 0.32 | 66.41 ± 1.37 | 2.53 ± 0.41 | 18.14 ± 0.47 | 2.36 ± 0.12 | 82.61 ± 1.83 |
| T60 | 3.64 ± 0.14 | 62.28 ± 1.80 | 2.39 ± 0.11 | 16.81 ± 0.55 | 2.20 ± 0.11 | 69.60 ± 1.55 |
| Season | 2017 | |||||
| T90 | 8.51 ± 0.53 | 84.02 ± 1.94 | 3.46 ± 0.43 | 23.50 ± 0.70 | 2.97 ± 0.14 | 115.04 ± 1.67 |
| T80 | 7.12 ± 0.44 | 76.32 ± 1.34 | 2.88 ± 0.17 | 20.77 ± 0.36 | 2.80 ± 0.10 | 98.54 ± 1.51 |
| T70 | 5.06 ± 0.19 | 70.31 ± 1.66 | 2.66 ± 0.33 | 19.16 ± 0.44 | 2.42 ± 0.11 | 84.79 ± 1.47 |
| T60 | 3.72 ± 0.71 | 63.15 ± 1.47 | 2.38 ± 0.21 | 16.88 ± 0.21 | 2.23 ± 0.12 | 72.55 ± 1.63 |
Table 10.
Pearson correlation between grain yield (ton ha−1) among the four irrigation treatments and other yield parameters for 2017 and 2018.
Table 10.
Pearson correlation between grain yield (ton ha−1) among the four irrigation treatments and other yield parameters for 2017 and 2018.
| Plant Height (cm) | Tiller Number Plant−1 | Panicle Length (cm) | Panicle Weight (g) | Grain Number Panicle−1 | |||
|---|---|---|---|---|---|---|---|
| 2017 | Grain yield (ton ha−1) | Pearson correlation | 0.995 ** | 0.995 ** | 0.980 * | 0.995 ** | 0.997 ** |
| Sign. (two-tailed) | 0.005 | 0.005 | 0.020 | 0.005 | 0.003 | ||
| 2018 | Pearson correlation | 0.992 ** | 0.963 ** | 0.985 * | 0.997 ** | 0.994 ** | |
| Sign. (two-tailed) | 0.008 | 0.037 | 0.015 | 0.003 | 0.006 | ||
* Correlation is significant at the 0.05 level (two-tailed). ** Correlation is significant at the 0.01 level (two-tailed).
Publisher’s Note: MDPI stays neutral with regard to jurisdictional claims in published maps and institutional affiliations. |
© 2021 by the authors. Licensee MDPI, Basel, Switzerland. This article is an open access article distributed under the terms and conditions of the Creative Commons Attribution (CC BY) license (https://creativecommons.org/licenses/by/4.0/).
Share and Cite
MDPI and ACS Style
Eltarabily, M.G.; Berndtsson, R.; Abdou, N.M.; El-Rawy, M.; Selim, T. A Comparative Analysis of Root Growth Modules in HYDRUS for SWC of Rice under Deficit Drip Irrigation. Water 2021, 13, 1892. https://doi.org/10.3390/w13141892
AMA Style
Eltarabily MG, Berndtsson R, Abdou NM, El-Rawy M, Selim T. A Comparative Analysis of Root Growth Modules in HYDRUS for SWC of Rice under Deficit Drip Irrigation. Water. 2021; 13(14):1892. https://doi.org/10.3390/w13141892
Chicago/Turabian StyleEltarabily, Mohamed Galal, Ronny Berndtsson, Nasr M. Abdou, Mustafa El-Rawy, and Tarek Selim. 2021. "A Comparative Analysis of Root Growth Modules in HYDRUS for SWC of Rice under Deficit Drip Irrigation" Water 13, no. 14: 1892. https://doi.org/10.3390/w13141892
Note that from the first issue of 2016, this journal uses article numbers instead of page numbers. See further details here.