
Evidence of Anthropogenic Gadolinium in Triangle Area Waters, North Carolina, USA


1
Department of Geological Sciences, University of North Carolina, Chapel Hill, NC 27599, USA
2
Key Laboratory of Karst Georesources and Environment, Ministry of Education, College of Resources and Environmental Engineering, Guizhou University, Guiyang 550025, China
*
Author to whom correspondence should be addressed.
Water 2021, 13(14), 1895; https://doi.org/10.3390/w13141895
Submission received: 27 May 2021
/
Revised: 27 June 2021
/
Accepted: 2 July 2021
/
Published: 8 July 2021
(This article belongs to the Special Issue Watershed Water Environment and Hydrology under the Influence of Anthropogenic and Natural Processes)
Abstract
:Gadolinium (Gd), a member of the rare earth elements (REE), is becoming an increasingly observed microcontaminant in waters of developed regions. Anthropogenic Gd anomalies were first noted in 1996 and were determined to be sourced from Gd-based contrast agents used in magnetic resonance imaging (MRI). This study investigates Gd anomalies in North Carolina’s Triangle Area, focusing on surrounding wastewater treatment plants (WWTPs). Samples were obtained from upstream and downstream of selected WWTPs as well as a freshwater reservoir that supplies part of the region’s drinking water. The PAAS-normalized samples indicate Gd anomalies in the influent, effluent, and downstream samples. We quantify the anthropogenic Gd in wastewater samples to constitute between 98.1% to 99.8%. Sample comparisons show an average increase of 45.3% estimated anthropogenic Gd between samples upstream and downstream of WWTPs. This research contributes to the existing database demonstrating the presence of anthropogenic Gd in developed regions. Although current Gd concentrations are not near toxic levels, they should be continuously monitored as a micropollutant and serve as a wastewater tracer.
1. Introduction
The rare earth elements (REEs) refer to the lanthanides group including elements Lanthanum (La) to Lutetium (Lu) as well as Scandium (Sc) and Yttrium (Y). These elements are grouped together as they tend to behave similarly in natural systems. However, the absolute concentration of individual REEs can vary by orders of magnitude in the same environment. Usually, the measured concentrations in a sample are normalized to a reference material representing its REE source, such as PAAS (Post-Archean Australian Shale) [1,2,3]. Undistributed REEs should produce a coherent and smooth pattern while any deviation of an element from the group can reflect processes causing the redistribution. Such deviations are defined as anomalies and can be calculated by comparing the elemental concentration to its neighbors. The development of modern technologies has led to a quickly raised demand of these previously “exotic” elements. As a result, REEs of anthropogenic origin have been increasingly found in the environment.
In 1996, the first anthropogenic REE anomaly was observed for the element Gadolinium (Gd) in rivers of developed regions in Germany [4]. Since then, numerous studies have reported similar anomalies in rivers [5,6,7,8,9,10,11,12,13], lakes [14], coastal waters [5,15,16,17,18], groundwater [6,9], wastewater [9,15,19], tap water [20,21], and even tap water-based beverages in fast food franchises [22] in developed regions across the world. The original study suggested magnetic resonance imaging (MRI) contrast agents as the most likely source of anthropogenic Gd in the natural environment. Gd-based compounds are the most commonly used MRI contrast agents. These water-soluble compounds are injected into the body prior to select MRI exams to enhance produced scans and then urinated out of the body within the next 7 days (>90% in 12 hours [23]). As most traditional wastewater treatment processes do not remove anthropogenic Gd, it is released into natural waters.
In 2019, the Organization for Economic Co-operation and Development (OECD) reported that the United States had the second highest amount of hospital MRI and fourth highest number of hospital MRI exams completed in 2017 when compared to other countries. Between 2007 and 2017, the amount of hospital MRI scans completed in the United States increased from 91 to 111 scans per thousand population [24].
While anthropogenic Gd anomalies have been observed and studied in many locations, few studies focus specifically on anthropogenic Gd in North America despite the high number of MRI examinations [7,8,17]. In this study, we collected surface water samples upstream and downstream of select wastewater treatment plants (WWTPs) in North Carolina’s “Triangle Area” as well as influent and effluent samples from two of the WWTPs. Additionally, we sampled a lake downstream of a WWTP that provides water for human use in the region. A previous study on REEs in the Neuse River documented an anthropogenic Gd component in the region [1]. This study aims to understand how WWTP effluent impacts Gd concentrations in surface waters in the area and supplement the existing evidence and analysis of anthropogenic Gd in North America.
2. Materials and Methods
2.1. Location of Study
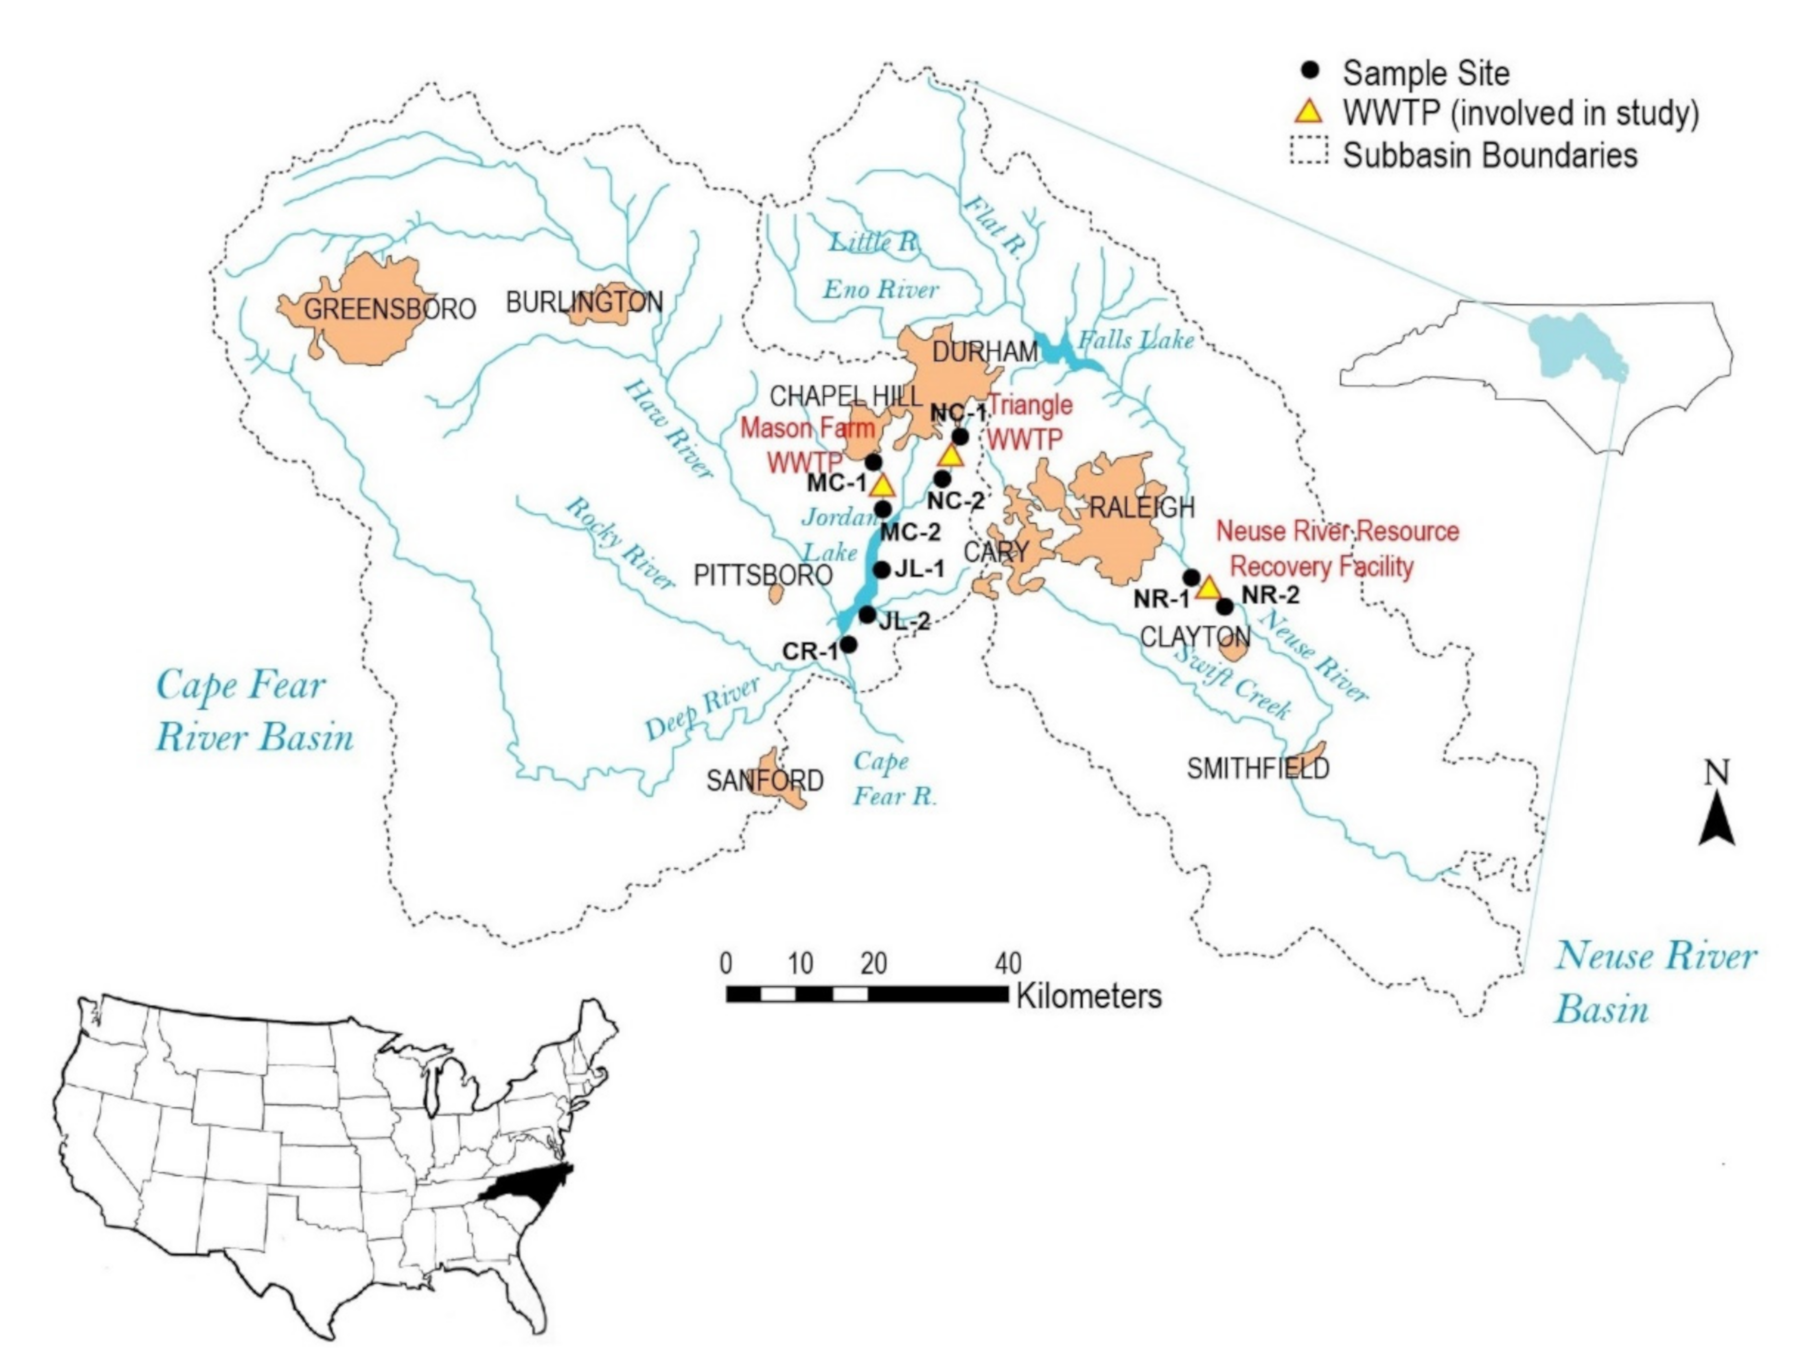
North Carolina’s “Triangle Area” is a term commonly used to refer to the state’s Research Triangle Park, the largest research park in the United States, and its surrounding area that houses much of its workforce. The name refers to the shape obtained by using the three surrounding cities as points: Raleigh, Durham, and Chapel Hill. While not a particularly densely populated region when compared to some other urban areas, it holds extensive healthcare amenities and facilities. The area belongs to two river basins: the Neuse River Basin to the west and the Cape Fear River Basin to the east. It is located in North Carolina’s Piedmont region which is defined primarily by Proterozoic to late Cambrian granite, gneiss, and metamorphosed epiclastic and volcaniclastic rocks [25].
Surface water samples were collected at Morgan Creek in Chapel Hill, Northeast Creek in Durham, and the Neuse River in Raleigh in December 2017 (Figure 1). These streams were sampled both upstream and downstream of the WWTPs. Each of these WWTPs represents an approximate “corner” of the North Carolina Triangle Area. Supplementary data for the same Neuse River sampling locations were also taken from a previous study with samples from December 2015 [1]. Additional surface water samples were taken from Jordan Lake and the Cape Fear River. Jordan Lake is an artificial freshwater reservoir that is supplied water by both Morgan Creek and Northeast Creek. In addition, 44% of Jordan Lake’s water is allocated for human use in the Triangle Area [26]. Wastewater influent and effluent samples were obtained from Mason Farm and Triangle WWTPs located on Morgan and Northeast Creek, respectively. We were unable to obtain influent and effluent samples from the Neuse WWTP (Neuse River Resource Recovery Facility).
2.2. Sampling and Analyses
Samples were collected in 250 ml Nalgene sampling bottles that were precleaned by 10% HCl overnight and milliQ™ water. For each sample, the bottle was rinsed three times using local river water before collecting. All samples were filtered using 0.45 µm cellulose acetate (CA) membrane filters offsite within the same day of sampling. Further, 100 mL of local river water was run through a new CA membrane filter and then discarded to prevent cross contamination from prior samplings. Between each filtering session, the filtering device was rinsed with ~750 mL of milliQ™ water. Filtered samples relocated to another clean Nalgene bottle and acidified by adding 2% concentrated nitric acid. Then, the bottles were wrapped with parafilm to minimize evaporation and then stored in a Fisher Scientific Isotemp™ refrigerator at the University of North Carolina, Chapel Hill, USA until REE analysis.
REE analysis was performed using an Agilent™ 7900 Quadrupole Inductively Coupled Plasma Mass Spectrometer (Q-ICP-MS) at the Plasma Mass Spectrometry (PMS) Laboratory at the University of North Carolina at Chapel Hill, USA. Calibration standards of 1000, 100, 10, and 5 ppt of REE concentrations were prepared from a 1000 ppm REE standard to measure REE concentrations of the dissolved loads in the sampled waters. Then, 100 ppb of Indium was used as the internal standard to correct instrumental drift. To minimize interferences, oxide presence in the plasma stream was controlled to be less than 1% in no-gas mode and 0.3% in Helium collision cell mode. To evaluate accuracy of the analysis, we analyzed a reference material for river water (SLRS-5) from the National Research Council of Canada every five samples. Repeated analysis (n = 3) of the SLRS-5 standard yielded average accuracy of <3% for La, Pr, Nd, Yb, <6% for Y, Ce, Tm, Lu, <10% for most of the rest of REE. Relative standard deviation (RSD) ranged from 1.1–15.6% with a mean RSD of 5.1%.
To characterize REE patterns, measured REE concentrations were normalized to the composition of Post-Archaean Australian Shale (PAAS) [27]. The Gd anomalies were calculated via interpolation of SmSN and TbSN [8]:
GdSN / Gd*SN = GdSN / (0.33 SmSN + 0.67 TbSN)
The subscript SN denotes sample concentration normalized to PAAS and * denotes the natural background value excluding anomalies. Anthropogenic Gd, can be calculated as follows [10]:
Gd* = Gd*SN × [GdPAAS]
Gdanth = Gdmeasured – Gd*
[GdPAAS] refers to the concentration of Gd in PAAS. To account for the naturally occurring Gd anomaly, a factor of 1.1 was multiplied to Gd* in equation 3 [19].
3. Results
3.1. REE + Y Concentrations
REE concentrations obtained from all the prepared samples as well as the supplemental data from [1] are shown in Table 1. Total REE concentrations (∑REE) for surface water samples range from 0.44 to 7.2 ppb with an average of 1.58 ppb. ∑REE concentrations from WWTP samples range from 0.27 to 0.72 ppb with an average of 0.48 ppb. Total rare earth elements and yttrium (∑REY) concentrations for surface water samples range from 0.57 to 8.4 ppb with an average of 2.0 ppb. ∑REY concentrations for WWTP samples range from 0.40 to 0.73 ppb with an average of 0.52 ppb. The supplemental data did not include Y concentrations, so it is not included in ∑REY. However, Y is often included with REEs as it behaves similarly. Overall, WWTP samples have less dissolved ∑REE and ∑REY than surface water samples.
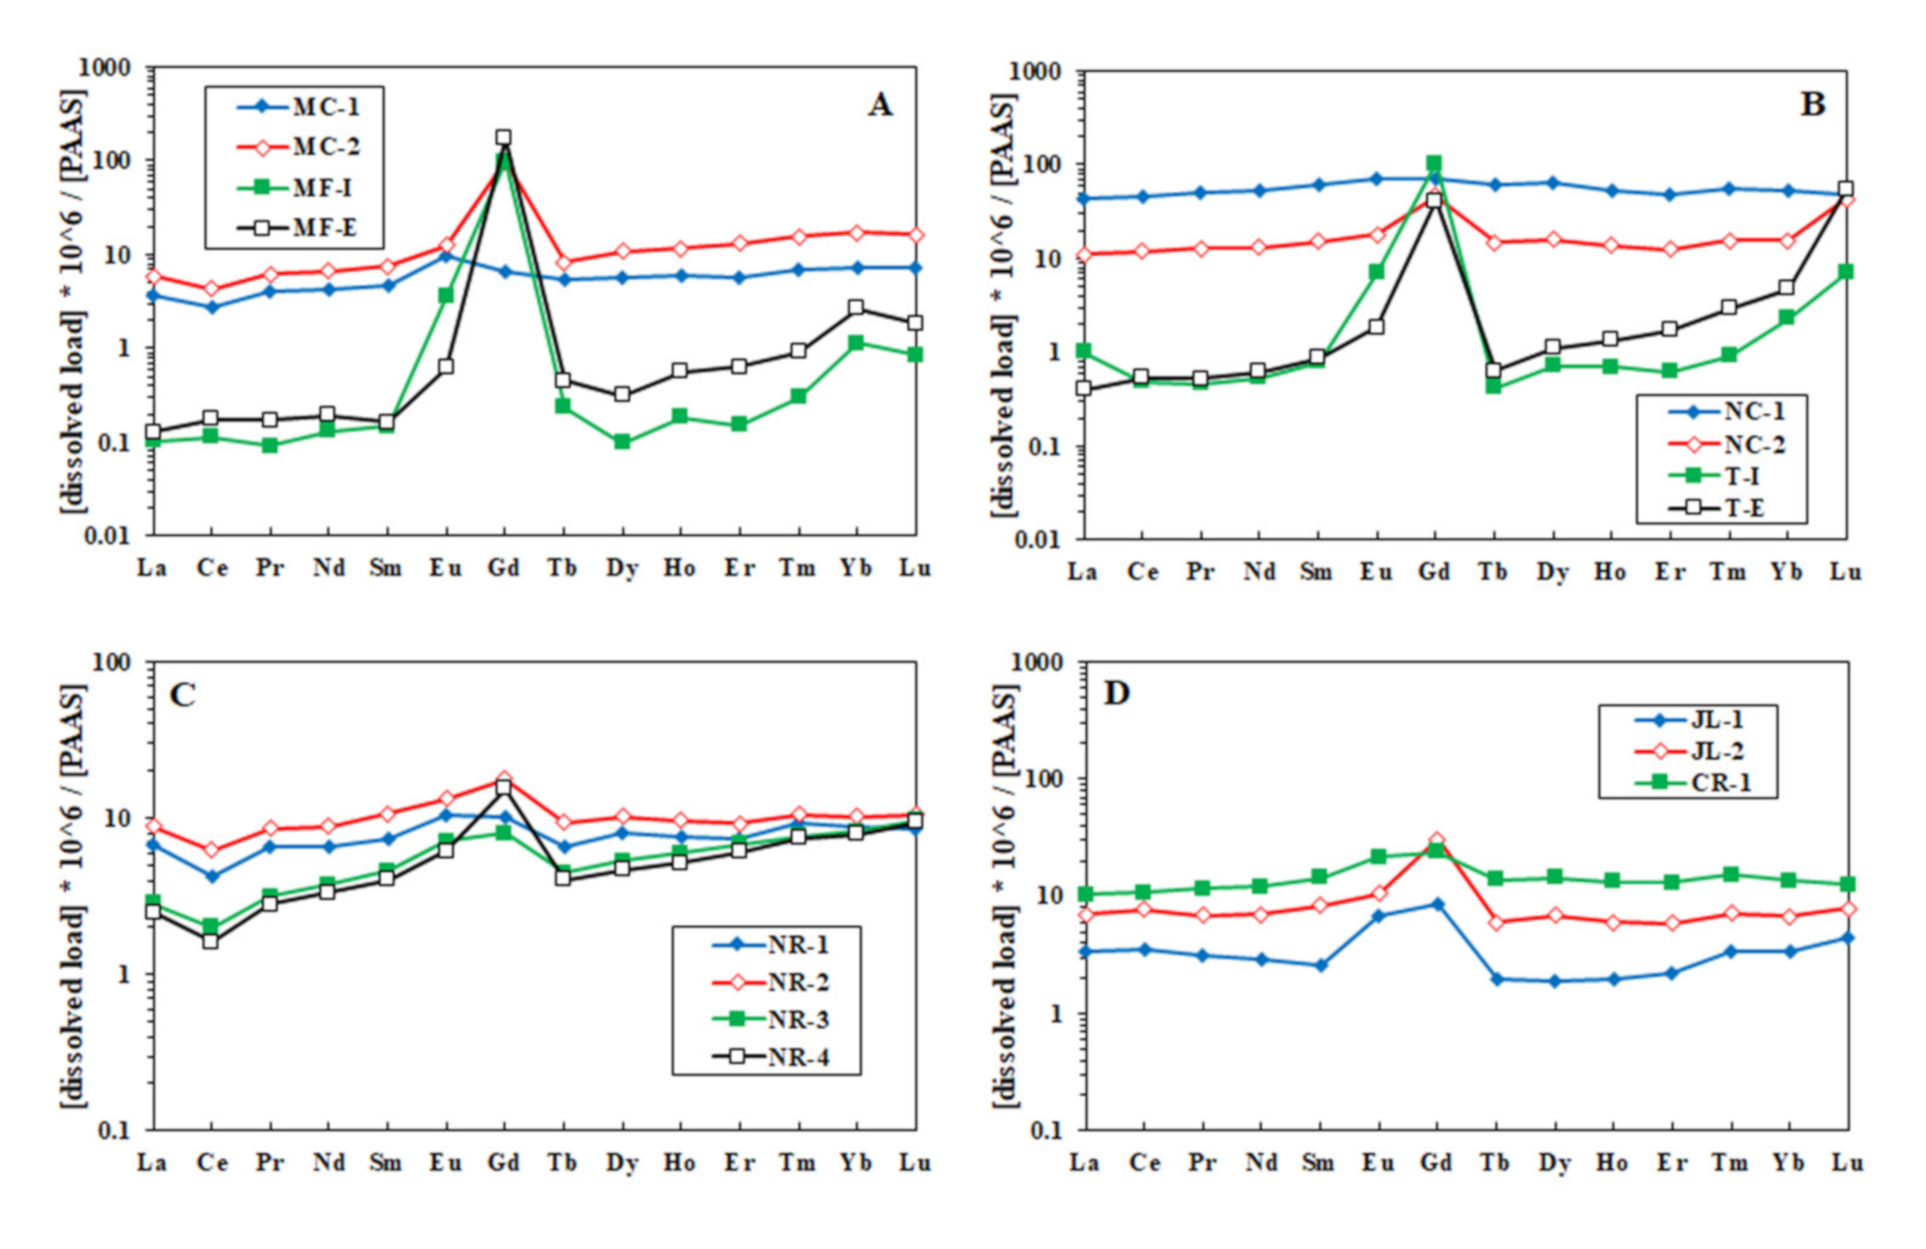
Surface water samples from 2017 show enrichment of heavy REEs (HREE; Gd to Lu) in relation to lighter REEs (LREE; La to Eu) with LaSN/YbSN values ranging from 0.35 to 0.98 except for one sample—MF-E (Table 2). LaSN/YbSN is a ratio used to show relative enrichment in the lanthanides; HREE enrichment is indicated when the ratio is <1. The enrichments from the samples agree with those of the previous study of REEs in the Neuse River and is representative of REE enrichment in the geology underlying the streams of this region [1]. WWTP samples also show HREE enrichment with LaSN/YbSN ranging from 0.048 to 0.44. This enrichment is, on average, smaller than that of the sampled surface waters. There is one surface water sample (JL-2) that shows a slight LREE enrichment with a LaSN/YbSN value of 1.04.
3.2. PAAS-Normalization and Anthropogenic Gd
PAAS-normalized REE distributions of samples show a relatively flat pattern (Figure 2). The main exception to this is the positive Gd anomaly present in WWTP samples, samples downstream of WWTPs, and the Jordan Lake samples. The Neuse River samples show the most nonlinear patterns beyond the Gd anomaly with a small negative Ce anomaly in each sample. Both negative Ce anomalies and occasional positive Eu anomalies are common in pristine waters unaffected by anthropogenic inputs [26,27]. Unlike other studies on REEs as microcontaminants, there does not seem to be any contamination from anthropogenic La or Sm [7].
The Gd anomaly (GdSN / GdSN*), approximated Gd concentration (Gdanth), and percent of total Gd estimated to be from anthropogenic origin (%Gdanth) are also shown in Table 2. The highest Gd anomalies are found in the WWTP samples ranging from 58.0 to 481 with an average of 301. Surface water sample Gd anomalies range from 1.2 to 12.0 with an average of 1.4 in the samples upstream of WWTPs and 5.2 in the downstream samples. Jordan Lake samples have anomalies of 4.0 and 4.5 with the downstream of the lake having a lower anomaly of 1.73. Estimated Gdanth concentrations range from 3.9 to 689 ppt. The highest Gdanth concentrations were all from WWTP samples with a range of 0.39 to 0.69 ppb. The %Gdanth in these samples were estimated to be 98.1% to 99.8%. The upstream samples had the smallest percentages with estimates from 5.9% to 26.9% Jordan Lake samples contained %Gdanth values of 72.5% and 75.5% with a decrease to 36.3% at the downstream.
4. Discussion
4.1. Anthropogenic Gd and Its Sources
The occurrence of a small positive Gd anomaly (no higher than 1.4) is common to natural seawater due to the “tetrad effect” from Gd’s half-filled 4f electron shell and REE scavenging by organic surface ligands which possess a negative Gd anomaly [28,29]. Therefore, to account for a margin of error, anomalies less than 1.4 will be considered to indicate pristine waters. In this study, only two of the Gd anomalies have a Gd anomaly of less than 1.4. These samples are the upstream samples for Northeast Creek and Morgan Creek. The Neuse River upstream shows anomaly values of 1.5 and 1.8, indicating anthropogenic Gd. This is likely because the Neuse River receives wastewater effluent from other WWTPs on streams that feed into it (such as the Smith Creek WWTP) prior to reaching the WWTP location assessed in this study. All other locations had an anomaly of at least 1.7, indicating their anomalies are all due to anthropogenic inputs. The presence of anthropogenic Gd in Jordan Lake (Gd anomalies of 4.0 and 4.5) and its downstream (Gd anomaly of 1.7) at locations roughly 14, 25, and 32 kilometers respectively downstream of the Mason Farm WWTP display the persistence of anthropogenic Gd in the environment and its efficacy as a wastewater tracer.
As surface water samples have the highest ∑REY, WWTP effluent is likely not a major contributor of overall REY concentrations in the studied streams. However, there is a large increase in estimated %Gdanth between upstream and downstream samples (14.7 to 90.9% for Morgan Creek; 5.9 to 64.5% for Northeast Creek, and 26.9 to 39.5% and 37.3 to 70.9% for the Neuse River). This indicates that WWTP effluent is a large contributor of anthropogenic Gd to the downstream of these rivers. Influent and effluent samples all had an estimated %Gdanth of at least 98.1%.
The most likely source of anthropogenic Gd in WWTP samples are Gd-based contrast agents (GBCAs). GBCAs are the most common MRI contrast agent and have been widely used since approval by the FDDA in 1988. Gd3+ as a free ion can compete with Ca2+ making it toxic to biological systems, thus it is chelated to an organic ligand to make it safe for injection [30]. Though recent studies have shown that a portion of the injected Gd can accumulate in the brain, bones, and tissues, the majority is urinated out of the body within 12 hours of exposure [23,31]. Effluent released into surface waters from WWTPs contain all excreted Gd as conventional wastewater treatment processes do not remove the element. Patients are typically injected with low doses of Gd, but with the number of MRI scans conducted each year and the increase in scans per year, longitudinal studies have shown significant increases in the amount of anthropogenic Gd in waters of developed regions over the years [17,32].
4.2. Health and Ecotoxicological Effects
The first evidence of health effects from usage of GBCAs were noticed 18 years after their introduction. While GBCAs are not considered to be harmful, repeated injection can lead to noticeable Gd retention in the body and cause nephrogenic systemic fibrosis (NSF) [31,33,34]. With regards to Gd as a potential anthropogenic contaminant in natural waters, not much is known. Natural Gd in surface water is partially removed from the dissolved pool of water due to its tendency to coagulate into a colloid in low salinity waters [16]. As GBCAs injected into the body must be highly stable, anthropogenic Gd in the environment should likely be nonreactive in comparison and stay in the dissolved pool. For example, mussels in locations downstream of WWTPs have been shown to incorporate anthropogenic Sm and La into their shells, but not anthropogenic Gd, suggesting that it is not bioavailable in comparison to geogenic Gd [35]. This distinction along with GBCAs’ relatively long half-life of several weeks explains how anthropogenic Gd can be used as a tracer for wastewater [36].
There are few studies that investigate the health effects of Gd alone. Most studies focus on other REEs such as Sm or La or investigate REE patterns. Some recent studies reported that REEs can accumulate in humans due to ingestion of food with high REE concentrations in contaminated soil [37,38]. Thus, drinking water with high REE concentrations could also be a potential source of REE accumulation. While anthropogenic Gd has not been bioavailable in streams, LREEs have been found to bioconcentrate in carps and specific REEs have been shown to be toxic in high enough concentrations to various organisms [39,40,41]. However, our sample with the highest ∑REE is magnitudes below one of the lowest REE concentration limits (1.39ppm of La) where ecotoxicological effects were found [40]. While the waters sampled in this study do not approach levels that cause known ecotoxicological effects, at least one other study has noted ∑REY levels above such limits [10]. Thus, especially with Jordan Lake as a crucial source of drinking water, Gd and other REY should be monitored as a future micropollutant in the region.
5. Conclusions
Few studies exist that show the presence of anthropogenic Gd in North American waters. This study analyzed dissolved Gd concentrations in rivers of North Carolina’s Triangle Area with attention to WWTPs. Samples upstream and downstream of WWTPs were obtained as well as samples of effluent and influent of two of the three selected WWTPs. We found Gd anomalies in all samples but two of the upstream samples from pristine streams. A large change in the percentage of anthropogenic Gd (%Gdanth) exists from upstream to downstream, demonstrating WWTP effluents large contribution of anthropogenic Gd to natural waters. The presence of anthropogenic Gd anomaly in samples taken from over 30 kilometers downstream of a WWTP indicates anthropogenic Gd’s persistence in the environment and its utility as a wastewater tracer. Despite that there are no current health hazards or ecotoxicological effects at the measured concentrations in this region, Gd anomaly and total REE concentrations should be monitored because of their ability to have toxic health effects.
Author Contributions
J.M.Z. and C.C. analyzed data and wrote the manuscript with the support and supervision of X.-M.L., Q.W. collected samples and processed them. J.M.Z. wrote the manuscript with inputs from all the authors. All authors have read and agreed to the published version of the manuscript.
Funding
This research was funded by the University of North Carolina at Chapel Hill to X.-M. Liu.
Data Availability Statement
Not Applicable.
Acknowledgments
The authors thank field sampling help from WWTP staff in the Triangle Area, North Carolina. X.-M.L. and C.C. would like to acknowledge funding support from the Department of Geological Sciences, University of North Carolina at Chapel Hill. J.Z. would also like to acknowledge the support from UNC’s Institute for the Environment IDEA undergraduate research program.
Conflicts of Interest
The authors declare no conflict of interest.
References
- Smith, C.; Liu, X.M. Spatial and temporal distribution of rare earth elements in the Neuse River, North Carolina. Chem. Geol. 2018, 488, 34–43. [Google Scholar] [CrossRef]
- Liu, X.; Hardisty, D.S.; Lyons, T.W.; Swart, P.K. Evaluating the fidelity of the cerium paleoredox tracer during variable carbonate diagenesis on the Great Bahamas Bank. Geochim. Cosmochim. Acta 2019, 248, 25–49. [Google Scholar] [CrossRef]
- Cao, C.; Liu, X.; Bataille, C.P.; Liu, C. What do Ce anomalies in marine carbonates really mean? A perspective from leaching experiments. Chem. Geol. 2020, 532, 119413. [Google Scholar] [CrossRef]
- Bau, M.; Dulski, P. Anthropogenic origin of positive gadolinium anomalies in river waters. Earth Planet. Sci. Lett. 1996, 143, 245–255. [Google Scholar] [CrossRef]
- Nozaki, Y.; Lerche, D.; Alibo, D.S.; Tsutsumi, M. Dissolved indium and rare earth elements in three Japanese rivers and Tokyo Bay: Evidence for anthropogenic Gd and In. Geochim. Cosmochim. Acta 2000, 64, 3975–3982. [Google Scholar] [CrossRef]
- Knappe, A.; Möller, P.; Dulski, P.; Pekdeger, A. Positive gadolinium anomaly in surface water and ground water of the urban area Berlin, Germany. Chem. Erde Geochem. 2005, 65, 167–189. [Google Scholar] [CrossRef]
- Verplanck, P.L.; Taylor, H.E.; Nordstrom, D.K.; Barber, L.B. Aqueous stability of gadolinium in surface waters receiving sewage treatment plant effluent Boulder Creek, Colorado. Environ. Sci. Technol. 2005, 39, 6923–6929. [Google Scholar] [CrossRef] [PubMed]
- Bau, M.; Knappe, A.; Dulski, P. Anthropogenic gadolinium as a micropollutant in river waters in Pennsylvania and in Lake Erie, northeastern United States. Chem. Erde Geochem. 2006, 66, 143–152. [Google Scholar] [CrossRef]
- Rabiet, M.; Brissaud, F.; Seidel, J.L.; Pistre, S.; Elbaz-Poulichet, F. Positive gadolinium anomalies in wastewater treatment plant effluents and aquatic environment in the Hérault watershed (South France). Chemosphere 2009, 75, 1057–1064. [Google Scholar] [CrossRef]
- Kulaksiz, S.; Bau, M. Anthropogenic dissolved and colloid/nanoparticle-bound samarium, lanthanum and gadolinium in the Rhine River and the impending destruction of the natural rare earth element distribution in rivers. Earth Planet. Sci. Lett. 2013, 362, 43–50. [Google Scholar] [CrossRef]
- De Campos, F.F.; Enzweiler, J. Anthropogenic gadolinium anomalies and rare earth elements in the water of Atibaia River and Anhumas Creek, Southeast Brazil. Environ. Monit. Assess. 2016, 188, 281. [Google Scholar] [CrossRef] [PubMed]
- Song, H.; Shin, W.J.; Ryu, J.S.; Shin, H.S.; Chung, H.; Lee, K.S. Anthropogenic rare earth elements and their spatial distributions in the Han River, South Korea. Chemosphere 2017, 172, 155–165. [Google Scholar] [CrossRef] [PubMed]
- Zhang, J.; Wang, Z.; Wu, Q.; An, Y.; Jia, H.; Shen, Y. Anthropogenic rare earth elements: Gadolinium in a small catchment in Guizhou Province, Southwest China. Int. J. Environ. Res. Public Health 2019, 16, 4052. [Google Scholar] [CrossRef] [PubMed] [Green Version]
- Merschel, G.; Bau, M.; Baldewein, L.; Dantas, E.L.; Walde, D.; Bühn, B. Tracing and tracking wastewater-derived substances in freshwater lakes and reservoirs: Anthropogenic gadolinium and geogenic REEs in Lake Paranoá, Brasilia. Comptes Rendus Geosci. 2015, 347, 284–293. [Google Scholar] [CrossRef]
- Elbaz-Poulichet, F.; Seidel, J.L.; Othoniel, C. Occurrence of an anthropogenic gadolinium anomaly in river and coastal waters of Southern France. Water Res. 2002, 36, 1102–1105. [Google Scholar] [CrossRef]
- Kulaksiz, S.; Bau, M. Contrasting behaviour of anthropogenic gadolinium and natural rare earth elements in estuaries and the gadolinium input into the North Sea. Earth Planet. Sci. Lett. 2007, 260, 361–371. [Google Scholar] [CrossRef]
- Hatje, V.; Bruland, K.W.; Flegal, A.R. Increases in Anthropogenic Gadolinium Anomalies and Rare Earth Element Concentrations in San Francisco Bay over a 20 Year Record. Environ. Sci. Technol. 2016, 50, 4159–4168. [Google Scholar] [CrossRef] [PubMed]
- Andrade, R.L.B.; Hatje, V.; Pedreira, R.M.A.; Böning, P.; Pahnke, K. REE fractionation and human Gd footprint along the continuum between Paraguaçu River to coastal South Atlantic waters. Chem. Geol. 2020, 532, 119303. [Google Scholar] [CrossRef]
- Lawrence, M.G.; Ort, C.; Keller, J. Detection of anthropogenic gadolinium in treated wastewater in South East Queensland, Australia. Water Res. 2009, 43, 3534–3540. [Google Scholar] [CrossRef]
- Kulaksiz, S.; Bau, M. Anthropogenic gadolinium as a microcontaminant in tap water used as drinking water in urban areas and megacities. Appl. Geochem. 2011, 26, 1877–1885. [Google Scholar] [CrossRef]
- Tepe, N.; Romero, M.; Bau, M. High-technology metals as emerging contaminants: Strong increase of anthropogenic gadolinium levels in tap water of Berlin, Germany, from 2009 to 2012. Appl. Geochem. 2014, 45, 191–197. [Google Scholar] [CrossRef]
- Schmidt, K.; Bau, M.; Merschel, G.; Tepe, N. Anthropogenic gadolinium in tap water and in tap water-based beverages from fast-food franchises in six major cities in Germany. Sci. Total Environ. 2019, 687, 1401–1408. [Google Scholar] [CrossRef]
- Aime, S.; Caravan, P. Biodistribution of gadolinium-based contrast agents, including gadolinium deposition. J. Magn. Reson. Imaging 2009, 30, 1259–1267. [Google Scholar] [CrossRef] [Green Version]
- OECD. Health at a Glance 2019: OECD Indicators; OECD Publishing: Paris, France, 2019. [Google Scholar]
- Stuckey, J. North Carolina: Its Geology and Mineral Resources; Department of Conservation and Development: Raleigh, NC, USA, 1965. [Google Scholar]
- NCDEQ Jordan Lake Water Supply Allocation. Available online: https://deq.nc.gov/about/divisions/water-resources/planning/basin-planning/map-page/cape-fear-river-basin-landing/jordan-lake-water-supply-allocation/jordan-lake-water-supply-allocation-background-info (accessed on April 2020).
- McLennan, S.M. Rare earth elements in sedimentary rocks: Influence of provenance and sedimentary processes. Rev. Mineral. Geochem. 1989, 21, 169–200. [Google Scholar]
- De Baar, H.J.W.; Brewer, P.G.; Bacon, M.P. Anomalies in rare earth distributions in seawater: Gd and Tb. Geochim. Cosmochim. Acta 1985, 49, 1961–1969. [Google Scholar] [CrossRef]
- Lee, J.H.; Byrne, R.H. Complexation of trivalent rare earth elements (Ce, Eu, Gd, Tb, Yb) by carbonate ions. Geochim. Cosmochim. Acta 1993, 57, 295–302. [Google Scholar]
- Sherry, D.; Caravan, P.; Lenkinski, R.E. A primer on gadolinium chemistry. J. Magn. Reson. Imaging 2010, 30, 1240–1248. [Google Scholar] [CrossRef] [PubMed] [Green Version]
- Tedeschi, E.; Caranci, F.; Giordano, F.; Angelini, V.; Cocozza, S.; Brunetti, A. Gadolinium retention in the body: What we know and what we can do. Radiol. Med. 2017, 122, 589–600. [Google Scholar] [CrossRef] [PubMed] [Green Version]
- Inoue, K.; Fukushi, M.; Furukawa, A.; Sahoo, S.K.; Veerasamy, N.; Ichimura, K.; Kasahara, S.; Ichihara, M.; Tsukada, M.; Torii, M.; et al. Impact on gadolinium anomaly in river waters in Tokyo related to the increased number of MRI devices in use. Mar. Pollut. Bull. 2020, 154, 111148. [Google Scholar] [CrossRef]
- Zaichick, S.; Zaichick, V.; Karandashev, V.; Nosenko, S. Accumulation of rare earth elements in human bone within the lifespan. Metallomics 2011, 3, 186–194. [Google Scholar] [CrossRef] [PubMed]
- Sanyal, S.; Marckmann, P.; Scherer, S.; Abraham, J. Multiorgan gadolinium (Gd) deposition and fibrosis in a patient with nephrogenic systemic fibrosis-an autopsy-based review. Nephrol. Dial. Transplant. 2011, 26, 3616–3626. [Google Scholar] [CrossRef] [PubMed] [Green Version]
- Merschel, G.; Bau, M. Rare earth elements in the aragonitic shell of freshwater mussel Corbicula fluminea and the bioavailability of anthropogenic lanthanum, samarium and gadolinium in river water. Sci. Total Environ. 2015, 533, 91–101. [Google Scholar] [CrossRef]
- Holzbecher, E.; Knappe, A.; Pekdeger, A. Identification of degradation characteristics-exemplified by Gd-DTPA in a large experimental column. Environ. Model. Assess. 2005, 10, 1–8. [Google Scholar] [CrossRef]
- Wei, B.; Li, Y.; Li, H.; Yu, J.; Ye, B.; Liang, T. Rare earth elements in human hair from a mining area of China. Ecotoxicol. Environ. Saf. 2013, 96, 118–123. [Google Scholar] [CrossRef] [PubMed]
- Charalampides, G.; Vatalis, K.; Karayannis, V.; Baklavaridis, A. Environmental Defects and Economic Impact on Global Market of Rare Earth Metals. IOP Conf. Ser. Mater. Sci. Eng. 2016, 161, 012069. [Google Scholar] [CrossRef] [Green Version]
- Hao, S.; Xiaorong, W.; Zhaozhe, H.; Chonghua, W.; Liansheng, W. Bioconcentration and elimination of five light rare earth elements in carp (Cyprinus carpio L.). Chemosphere 1996, 33, 1475–1483. [Google Scholar] [CrossRef]
- Zhang, H.; He, X.; Bai, W.; Guo, X.; Zhang, Z.; Chai, Z.; Zhao, Y. Ecotoxicological assessment of lanthanum with Caenorhabditis elegans in liquid medium. Metallomics 2010, 2, 806–810. [Google Scholar] [CrossRef]
- Cui, J.; Zhang, Z.; Bai, W.; Zhang, L.; He, X.; Ma, Y.; Liu, Y.; Chai, Z. Effects of rare earth elements La and Yb on the morphological and functional development of zebrafish embryos. Environ. Health Toxicol. 2012, 24, 209–213. [Google Scholar] [CrossRef]
Figure 1.
Map of North Carolina’s Cape Fear and Neuse River Basins with the sample sites and associated WWTPs. The State of North Carolina is shaded in a base map of the United States.
Figure 1.
Map of North Carolina’s Cape Fear and Neuse River Basins with the sample sites and associated WWTPs. The State of North Carolina is shaded in a base map of the United States.

Figure 2.
PAAS-normalized REE distributions for: (A) Morgan Creek and Mason Farm WWTP samples; (B) Northeast Creek and Durham WWTP sample; (C) Neuse River samples; and (D) Jordan Lake samples.
Figure 2.
PAAS-normalized REE distributions for: (A) Morgan Creek and Mason Farm WWTP samples; (B) Northeast Creek and Durham WWTP sample; (C) Neuse River samples; and (D) Jordan Lake samples.


Table 1.
Concentrations of rare earth elements in the sampled Triangle Area waters and WWTP influents and effluents. For WWTP samples, -I indicates the influent sample and -E indicates the effluent samples from the named WWTP.
Table 1.
Concentrations of rare earth elements in the sampled Triangle Area waters and WWTP influents and effluents. For WWTP samples, -I indicates the influent sample and -E indicates the effluent samples from the named WWTP.
| Sample 1 | La | Ce | Pr | Nd | Sm | Eu | Gd | Tb | Dy | Ho | Er | Tm | Yb | Lu | ∑REE | Y | ∑REY |
|---|---|---|---|---|---|---|---|---|---|---|---|---|---|---|---|---|---|
| ppt | ppt | ppt | ppt | ppt | ppt | ppt | ppt | ppt | ppt | ppt | ppt | ppt | ppt | ppb | ppt | ppb | |
| MC-1 | 115 | 170 | 28.4 | 116 | 22.4 | 9.73 | 26.4 | 3.71 | 21.8 | 4.85 | 13.0 | 2.08 | 14.5 | 2.28 | 0.550 | 143 | 0.693 |
| MC-2 | 184 | 272 | 44.2 | 181 | 35.6 | 12.5 | 390 | 5.86 | 42.6 | 9.70 | 30.1 | 4.69 | 33.6 | 5.03 | 1.25 | 272 | 1.52 |
| NC-1 | 1376 | 2831 | 360 | 1412 | 294 | 72.2 | 289 | 43.0 | 254 | 44.3 | 113 | 16.6 | 106 | 14.8 | 7.23 | 1223 | 8.45 |
| NC-2 | 346 | 746 | 91.1 | 355 | 70.8 | 18.2 | 186 | 10.4 | 61.6 | 11.6 | 28.9 | 4.71 | 30.5 | 13.5 | 1.97 | 387 | 2.36 |
| NR-1 | 212 | 271 | 46.4 | 179 | 34.4 | 10.5 | 41.3 | 4.65 | 31.0 | 6.30 | 17.0 | 2.76 | 17.1 | 2.62 | 0.877 | 212 | 1.09 |
| NR-2 | 276 | 392 | 61.3 | 241 | 50.5 | 13.3 | 71.5 | 6.56 | 40.2 | 7.99 | 21.4 | 3.17 | 20.2 | 3.28 | 1.21 | 249 | 1.46 |
| NR-3 | 88.6 | 126 | 22.5 | 101 | 21.6 | 7.17 | 31.8 | 3.15 | 20.9 | 4.93 | 15.6 | 2.31 | 16.2 | 3.02 | 0.465 | - | - |
| NR-4 | 77.6 | 101 | 20.0 | 90.2 | 19.1 | 6.15 | 61.2 | 2.83 | 18.2 | 4.29 | 13.9 | 2.23 | 15.4 | 2.91 | 0.435 | - | - |
| JL-1 | 105 | 222 | 21.9 | 79.6 | 12.1 | 6.72 | 35.1 | 1.40 | 7.52 | 1.62 | 5.17 | 1.00 | 6.74 | 1.37 | 0.507 | 64.8 | 0.572 |
| JL-2 | 216 | 492 | 49.3 | 188 | 39.6 | 10.6 | 122 | 4.17 | 26.6 | 5.03 | 13.5 | 2.13 | 13.2 | 2.46 | 1.19 | 176 | 1.36 |
| CR-1 | 319 | 677 | 81.9 | 326 | 67.7 | 21.7 | 96.3 | 9.60 | 55.9 | 11.0 | 30.3 | 4.55 | 26.5 | 3.90 | 1.73 | 338 | 2.07 |
| MF-I | 3.16 | 7.20 | 0.647 | 3.51 | 0.704 | 3.59 | 390 | 0.164 | 0.386 | 0.154 | 0.353 | 0.089 | 2.24 | 0.265 | 0.413 | 4.98 | 0.418 |
| MF-E | 4.00 | 11.0 | 1.20 | 5.28 | 0.763 | 0.614 | 690 | 0.319 | 1.24 | 0.469 | 1.47 | 0.273 | 5.26 | 0.567 | 0.723 | 10.4 | 0.733 |
| T-I | 31.1 | 30.4 | 3.29 | 14.6 | 3.74 | 6.93 | 413 | 0.291 | 2.80 | 0.574 | 1.41 | 0.274 | 4.49 | 2.18 | 0.516 | 46.5 | 0.521 |
| T-E | 12.3 | 33.4 | 3.69 | 16.9 | 4.05 | 1.85 | 165 | 0.444 | 4.32 | 1.11 | 3.95 | 0.881 | 9.21 | 16.5 | 0.273 | 129 | 0.402 |
1 MC: Morgan Creek, NC: Northeast Creek, NR: Neuse River (where 3 and 4 refer respectively to the upstream and downstream samples from [1]), JL: Jordan Lake, CR: Cape Fear River, MF: Mason Farm WWTP, T: Triangle WWTP.
Table 2.
Select quantities for samples including LaSN/YbSN used to indicate fractionation between LREE and HREE, Gd anomaly (GdSN/GdSN* as quantified in Equation (1)), ppt of Gd estimated to be of anthropogenic origin (Gdanth), and percent of anthropogenic Gd of total Gd in sample (%Gdanth). For WWTP samples, -I indicates the influent sample and -E indicates the effluent samples from the named WWTP.
| Sample 1 | LaSN/YbSN | GdSN/GdSN* | Gdanth | %Gdanth |
|---|---|---|---|---|
| MC-1 | 0.498 | 1.29 | 3.90 | 14.7 |
| MC-2 | 0.346 | 12.0 | 354 | 90.9 |
| NC-1 | 0.819 | 1.17 | 17.1 | 5.92 |
| NC-2 | 0.717 | 3.10 | 120 | 64.5 |
| NR-1 | 0.785 | 1.50 | 11.1 | 26.9 |
| NR-2 | 0.863 | 1.82 | 28.3 | 39.5 |
| NR-3 | 0.346 | 1.75 | 11.9 | 37.3 |
| NR-4 | 0.319 | 3.78 | 43.4 | 70.9 |
| JL-1 | 0.048 | 4.00 | 25.4 | 72.5 |
| JL-2 | 0.437 | 4.49 | 91.9 | 75.5 |
| CR-1 | 0.085 | 1.73 | 35.0 | 36.3 |
| MF-I | 0.987 | 473 | 389 | 99.8 |
| MF-E | 1.04 | 481 | 689 | 99.8 |
| T-I | 0.759 | 191 | 411 | 99.4 |
| T-E | 0.089 | 58.0 | 161 | 98.1 |
1 MC: Morgan Creek, NC: Northeast Creek, NR: Neuse River (where 3 and 4 refer respectively to the upstream and downstream samples from [1]), JL: Jordan Lake, CR: Cape Fear River, MF: Mason Farm WWTP, T: Triangle WWTP.
Publisher’s Note: MDPI stays neutral with regard to jurisdictional claims in published maps and institutional affiliations. |
© 2021 by the authors. Licensee MDPI, Basel, Switzerland. This article is an open access article distributed under the terms and conditions of the Creative Commons Attribution (CC BY) license (https://creativecommons.org/licenses/by/4.0/).
Share and Cite
MDPI and ACS Style
Zabrecky, J.M.; Liu, X.-M.; Wu, Q.; Cao, C. Evidence of Anthropogenic Gadolinium in Triangle Area Waters, North Carolina, USA. Water 2021, 13, 1895. https://doi.org/10.3390/w13141895
AMA Style
Zabrecky JM, Liu X-M, Wu Q, Cao C. Evidence of Anthropogenic Gadolinium in Triangle Area Waters, North Carolina, USA. Water. 2021; 13(14):1895. https://doi.org/10.3390/w13141895
Chicago/Turabian StyleZabrecky, Jordan M., Xiao-Ming Liu, Qixin Wu, and Cheng Cao. 2021. "Evidence of Anthropogenic Gadolinium in Triangle Area Waters, North Carolina, USA" Water 13, no. 14: 1895. https://doi.org/10.3390/w13141895
Note that from the first issue of 2016, this journal uses article numbers instead of page numbers. See further details here.