
Benthic Foraminiferal Indices and Environmental Quality Assessment of Transitional Waters: A Review of Current Challenges and Future Research Perspectives


Abstract
:1. Introduction
2. Benthic Foraminifera Are Reliable Indicators of Environmental Conditions
3. Foraminiferal Biotic Indices
3.1. Foraminiferal Diversity Indices
3.2. Foraminiferal Sensitivity Indices
3.2.1. Foraminiferal Index of Environmental Impact (FIEI)
3.2.2. Tolerant Species Index (TSI-Med)
3.2.3. Foraminiferal Stress Index (FSI)
3.2.4. Foraminiferal AZTI Marine Biotic Index (Foram-AMBI)
3.2.5. Foraminifera in Reef Assessment and Monitoring (FoRAM-Index)
3.3. Foraminiferal Multi-Metric Index
4. Comparison of EcoQS Indices
4.1. Various Foraminiferal Indices: How Well Do They Perform When Used at the Same Site?
4.2. Palaeoecological Applications: Toward the Definition of Reference Conditions
4.3. Palaeoecological Applications: Defining Correct Threshold Values
4.4. Taphonomical Processes and EcoQS Indices
4.5. Comparison of Foraminifera-Based Ecoqs Indices with Traditional Macrofauna-Based Indices
5. The Genetic Era
5.1. Environmental DNA
5.2. Ancient DNA
6. Foraminiferal Indices: Strengths, Weaknesses and Way Forward
6.1. Issues and Resolutions
6.1.1. Differences in Assessed EcoQS Using Different Foraminiferal Indices
6.1.2. Threshold Values
6.1.3. Intercalibration
6.2. New Techniques
7. Conclusions
Author Contributions
Funding
Data Availability Statement
Acknowledgments
Conflicts of Interest
Abbreviations
| aDNA | Ancient DNA |
| AMBI | AZTI’s Marine Biotic Index |
| BQE | Biological quality element |
| CWA | Clean Water Act |
| DCA | Detrended correspondence analysis |
| eDNA | Environmental DNA |
| e.g., | Exempli gratia |
| EQS | Ecological quality status |
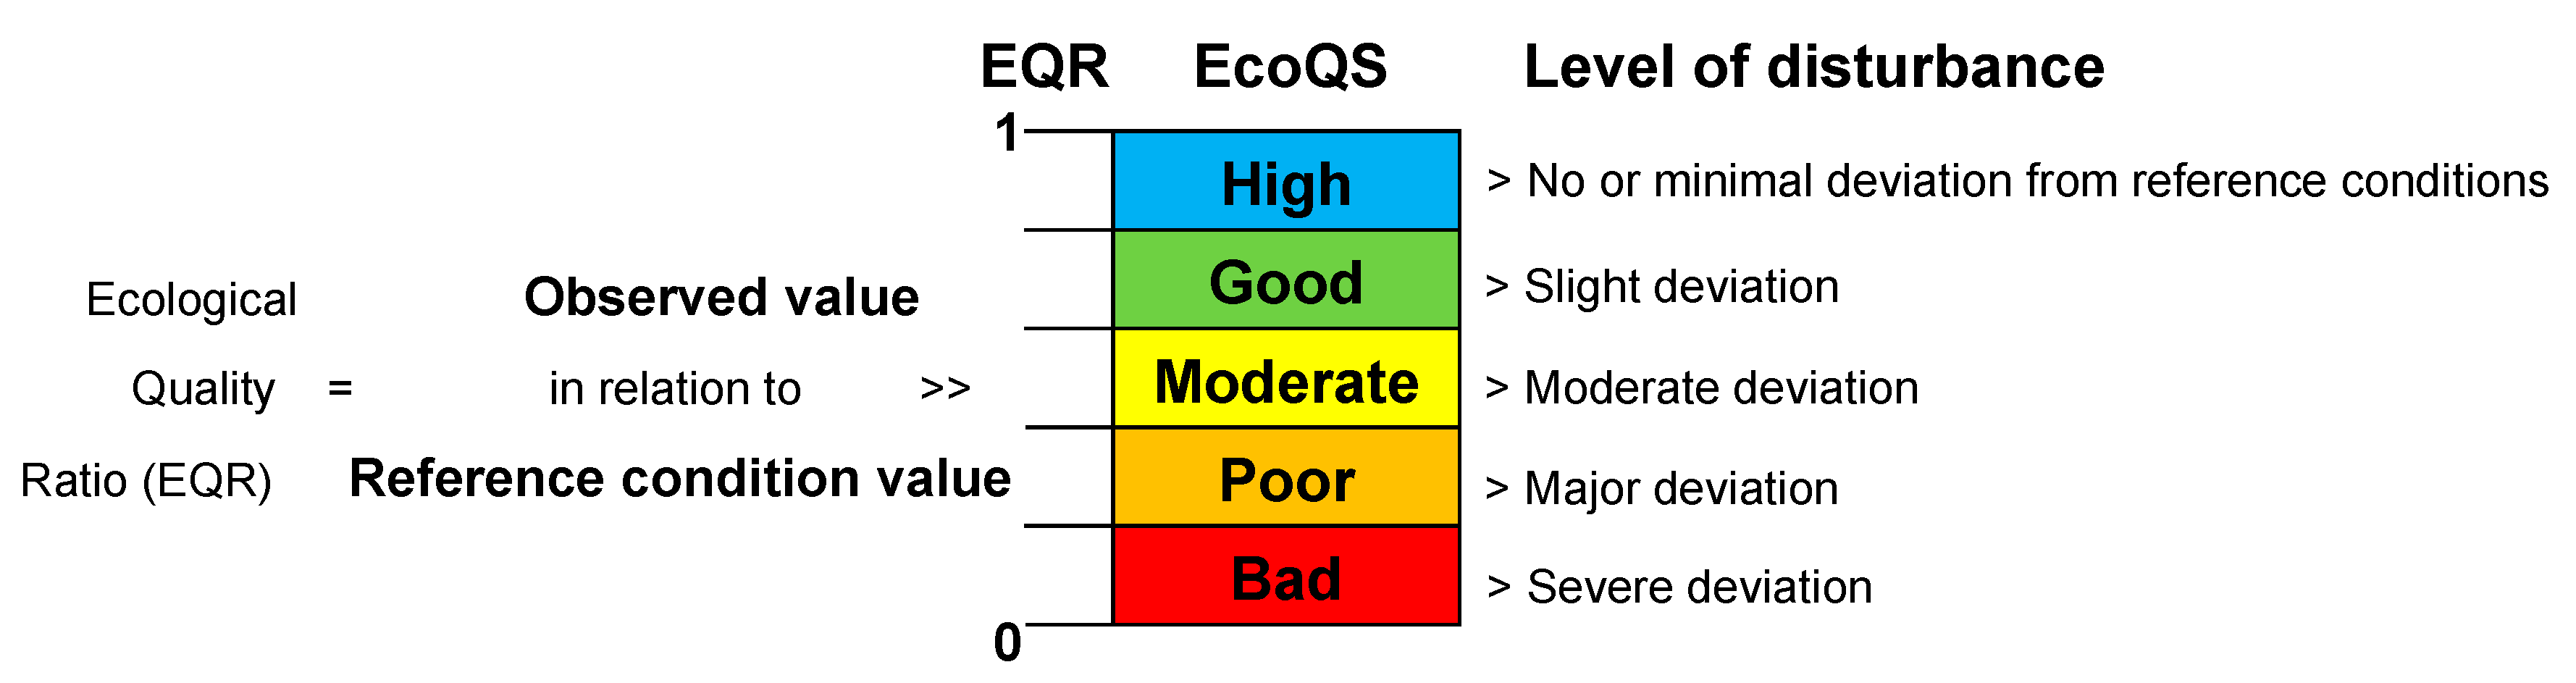
| EQR | Ecological quality ratio |
| FI’ | Modified FoRAM-Index |
| FIE | Foraminiferal Index of Environmental Impact |
| FOBIMO | Foraminiferal Biomonitoring group |
| Foram-AMBI | Foraminiferal AZTI’s Marine Biotic Index |
| FSI | Foram Stress Index |
| gAMBI | Genetic AZTI’s Marine Biotic Index |
| GIG | Geographical Intercalibration Work |
| HARMEX | Harmonisering af Nordiske bundfaunaindeks for økologisk kvalitet i poly- til euhaline områder” (Harmonization of Nordic benthic quality indices in polyhaline and euhaline areas) |
| HTS | High-throughput sequencing |
| ILS | “Long Versus Short Life Span” Index |
| MSFD | Marine Strategic Framework Directive |
| nEQR | Normalized ecological quality ratio |
| NQI | Norwegian Quality Index |
| NQIf | Norwegian Quality Index (using Foraminifera) |
| OM | Organic matter |
| OUT | Operational taxonomic unit |
| PERSE | Procedure to Establish a Reference State for Ecosystems |
| PCA | Principal component analysis |
| PCR | Polymerase chain reaction |
| PRISMA | The Preferred Reporting Items for Systematic reviews and Meta-Analyses |
| sedaDNA | Sedimentary DNA |
| TS | Tolerant species |
| TSI-Med | Tolerant Species Index for the Mediterranean |
| TOC | Total organic carbon |
| VDS | Validation data set |
| WFD | Water Framework Directive |
Appendix A
Appendix A.1. Materials and Methods
Appendix A.2. Results

| Stressor/Environmental Parameters | Source of Stress | Study Site | Assemblage Type | Index Used | Reference |
|---|---|---|---|---|---|
| Salinity, oxygen, turbulence, and organic matter inputs | Natural environmental variation | Po coastal plain, Italy | Fossil | Diversity Index Exp (H’bc) | Barbieri et al. 2020 [145] |
| Organic enrichment | Various sources | Mediterranean Sea Coast, France | Living | Diversity indices, wall structure proportion, and sp. tolerance sensitivity | Barras et al. 2014 [50] |
| Chemical pollution: polychlorobiphenyls (PCBs), polycyclic aromatic hydrocarbons (PAHs), barium (Ba), and mercury (Hg) | industries, petrochemical pole | Augusta Harbor, Eastern Sicily, Italy | Living, dead (1960s) | The Foraminiferal Size Index (FSI) and the Lost Species Index (LSI), Sp. richness, diversity, composition, foraminiferal number (FN), and H’ index | Bergamin and Romano et al. 2016 [146] |
| Oxygen depletion, grain size, C/N, TOC, and total nitrogen | Industries and urbanization | Norwegian Skagerrak coastal waters and Fjords, NE North Sea | Living, dead | Exp (H’bc) Diversity Index | Bouchet et al. 2012 [74] |
| Variety of pollution types | Aquaculture/Sewage | Lagoons and lakes, Italy | Living | Exp (H’bc) Diversity Index | Bouchet et al. 2018b [49] |
| Metal pollution, organic enrichment, pollution load index, sediment pollution index | Industries, urbanization, natural variation | Marambaia Cove of the Sepetiba Bay, SE Brazil | Living, fossil | Foram Stress Index (FSI) and Exp (H’bc) Diversity Endex | Castelo et al. 2021 [76] |
| Palaeo-environmental hydrological regime | Natural regime variation | Po Delta, Italy | Living, fossil | Epifaunal vs. Infaunal, Shannon–Wiener Index (H’log 2) Index, Fisher evenness and dominance, indicative groups | Dasgupta et al. 2020 [146] |
| Organic enrichment, metal pollution | Urbanization, industries, shipping activities, domestic pollution | Santos Estuary, Brazil | Living, fossil | Diversity Index Exp(H’bc) based, abundance, diversity, normalized ecological quality ratio (nEQR) | De Jesus et al. 2020 [25] |
| POP and metal pollution | Industries, shipping activities | Hammerfest harbor, Norway | Living | Exp (H’bc) Diversity Index | Dijkstra et al. 2017 * [61] |
| Organic enrichment, metal pollution | Urbanization, industries | Oslofjord, Norway | Fossil, dead | Shannon–Wiener Index (H’ log 2) and the Hurlbert’s Index (ES100), and cluster analyses | Dolven et al. 2013 * [19] |
| Oxygen depletion, salinity fluctuation, temperature, metal pollution | Various Sources | Høgsfjord and Lysefjord, Norway | Living, fossil | Shannon–Wiener Index (H’ log 2) and the Hurlbert’s Index (ES100) | Duffield et al. 2017 * [147] |
| Organic enrichment, metal pollution, phosphates | Industries, urbanization | Gulf of Gabes, Tunisia | Living | “Long versus short life span” index (ILS) and the modified FoRAM-Index (FI’), benthic foraminiferal assemblage composition and diversity, e.g., the Tolerant Species Index (TSstd), the Foram Stress Index (FSI), the Diversity Index Exp(H’bc) and the Newly Developed Foram-AZTI Marine Biotic Index (Foram-AMBI) | El Kateb et al. 2020 [48] |
| Grain size, metal pollution, organic enrichment | Industries, metallurgic factories, shipping activities, urbanization | Hauts de France, English Channel, France | Living | Diversity Exp (H’bc), foraminiferal density (FD), abundance, and indicative groups | Francescangeli et al. 2020 [78] |
| Oxygen depletion | Urbanization, sewage | Bay of Trieste, Italy | Living | Exp (H’bc) Diversity Index | Melis et al. 2019 [80] |
| organic enrichment, metal pollution | Industries, urbanization | Idefjord, Sweden/Norway | Living, fossil | Fisher Alpha Diversity Index, individual rarefaction ES(100), dominance indices (based on Simpsons Index) | Polovodova Asteman et al. 2015 * [24] |
| Chemical pollutants, Oxygen depletion, eutrophication, acidification | Various sources | Bellingham Bay, Washington State, USA | Contemporary | The Shannon Index (H’), Diversity Index | Nesbitt et al. 2014 [148] |
| Oxygen depletion, pH | Industrial effluents | Uppanar Estuary, Tamil Nadu Coast, India | Living | FoRAMFoRAM-Index (FI) ranging, the Foram Stress Index (FSI), Ammonia-Elphidium Index (AEI), indicative groups, abundance, and diversity, species richness | Nagendra and Reddy et al. 2019 [149] |
| pH, temperature | Urbanization, tourism | Zanzibar Archipelago | Living | The FoRAMFoRAM-Index and species richness patterns, Fisher α, | Thissen and Langer et al. 2017 [150] |
| Organic enrichment | Industries, urbanization | Skagerrak coast, Norway | Living, fossil | Foram-AMBI Sensitivity/Tolerance Index with Shannon’s diversity (H′log2) | Alve et al. 2019 [75] |
| Organic enrichment | Cultural eutrophication (Various anthropogenic sources) | Northeast Atlantic and Arctic fjords | Living, fossil | Foram-AMBI Sensitivity/Tolerance Index with Shannon’s diversity (H′log2) | Alve et al. 2016 [94] |
| Organic enrichment, potentially toxic elements, oil | Industries, urbanization | Guanabara Bay, Brazil | Living | Ammonia-Elphidium Index, Foram Stress Index | Alves Martins et al. 2020 [151] |
| Organic enrichment | Oyster Farming | Transitional Waters, English Channel/European Atlantic coast and the Mediterranean Sea | Living | Foram-AMBI Sensitivity/Tolerance Index | Bouchet et al. 2021 [82] |
| Dissolved oxygen, organic enrichment, grain size, total nitrogen, pigments, and depth below threshold | Various sources | 11 Fjords on the Skagerrak Coast, SE Norway | Living | Cluster/indicative species groups, comparison to macrofaunal changes | Bouchet et al. 2018 [81] |
| Grain size (pollutant proxy) | Industries, urbanization, docks, natural variation | 3 Sardinian Coastal areas | Living | Species’ richness, foraminiferal density, and the Fisher-α Diversity Index | Buosi et al. 2013 [152] |
| Organic enrichment, phosphates | Aquaculture (fish farming) | Monastir Bay, Tunisia | Living | AZTI Marine Biotic Index, Foram-AMBI | Damak et al. 2020 [153] |
| Organic enrichment, metal pollution | Domestic and industrial effluents, aquaculture, tourism | Saronikos Gulf, Greece | Living | Foram Stress Index (FSI), tolerance/sensitivity | Dimiza et al. 2016 [88] |
| Low oxygen, nutrient enrichment (eutrophication), run-off | Various sources | Society Archipelago, French Polynesia | Contemporary | Species composition, species richness, patterns of distribution, abundance, indicative groups, Fisher α, FoRAM-Index (FI) | Fajemila et al. 2015 [154] |
| Organic enrichment, metal pollution | Various sources | The Gulf of Manfredonia, southern Adriatic Sea | Living | Foram-AMBI Sensitivity Index and Foram Stress Index (FSI) | Fossile et al. 2021 [155] |
| Organic enrichment, metal pollution | Industries | Boulogne sur Mer Harbor, France | Fossil | Cluster/indicative species groups | Francescangeli et al. 2016 [22] |
| increased nutrient and sediment inputs | Urbanization, tourism | Great Barrier Reef, Australia | Living, fossil | Functional groups, Foraminifera in Reef Assessment and Monitoring (FoRAM) Index (FI) | Johnson et al. 2019 [156] |
| Organic enrichment, metal pollution | Aquaculture (fish farming) | Øksfjord, Norway | Living, fossil | Norwegian Quality Index (fNQI), AZTI’s Marine Biotic Index (fAMBI), fHlog2, ES100, absolute abundances and relative abundances of ecological groups (EGs) | Klootwijk et al. 2021 [26] |
| Metal pollution, oxygen depletion | Urbanization, industries, shipping activities, domestic pollution | Strait of Malacca, Malaysia | Living | Foraminifera Stress Index (FSI) | Minhat et al. 2020 [157] |
| Organic enrichment, nitrogen, carbonate content, phosphorus, mineralogy, grain size | Urbanization, tourism | Abrolhos, Southwest Atlantic, eastern Brazil | Living | Functional Groups for FoRAMFoRAM-Index (FI) | Oliveira-Silva et al. 2012 [158] |
| Organic enrichment | Urbanization, sewage | Levantine basin, Mediterranean | Living | TSI-Med and Foram-AMBI | Parent et al. 2021 [99] |
| Organic enrichment, metal pollution | Trawling, fishing activities, urbanization | Kosterfjord, Sweden | Living, dead | Foram-AMBI and NQIforam Indices | Polovodova Asteman et al. 2021 [45] |
| Hypoxia, metal pollution | Urbanization, industries | Western Coastal Area of Jakarta Bay | Living, fossil | The Ammonia-Elphidium Index, abnormal morphology | Rositasari et al. 2018 [159] |
| Metal pollution | Thermal sources and agricultural activities in | Gulf of Edremit, northeastern Aegean Sea, Turkey | Living, fossil | Abnormal morphology, species diversity | Yümün and Önce et al. 2017 [160] |
| Metal pollution, Organic enrichment, Oxygen depletion | Shipping activities, industries | Horten Inner Harbor, Norway | Living, fossil | Benthic foraminiferal accumulation rate (BFAR) | Hess et al. 2020 [20] |
| Depth | EcoQs 1 | EcoQs 2 | Year | ||
|---|---|---|---|---|---|
| 0–1 | 7.71 | 7.71 | 2002,0 | ||
| 2–3 | 4.1 | 4.1 | 1998,0 | ||
| 4–5 | 4.58 | 4.58 | 1994,1 | ||
| 6–7 | 5.5 | 5.5 | 1990,1 | ||
| 8–9 | 4.71 | 4.71 | 1986,1 | ||
| 10–11 | 4.72 | 4.72 | 1982,2 | ||
| 12–13 | 4.96 | 4.96 | 1978,2 | ||
| 14–15 | 6.73 | 6.73 | 1974,2 | ||
| 16–17 | 6.27 | 6.27 | 1970,3 | ||
| 18–19 | 5.71 | 5.71 | 1966,3 | ||
| 20–21 | 4.59 | 4.59 | 1962,3 | ||
| 22–23 | 6.37 | 6.37 | 1958,3 | ||
| 24–25 | 6.12 | 6.12 | 1951,2 | ||
| 26–27 | 6.52 | 6.52 | 1944,1 | ||
| 28–29 | 7.52 | 7.52 | 1936,9 | ||
| 30–31 | 7.45 | 7.45 | 1924.4 * | ||
| 32–33 | 9.15 | 9.15 | 1911.9 * | ||
| 34–35 | 9.06 | 9.06 | 1899,4 * | ||
| 36–37 | 9.59 | 9.59 | 1886,9 * | ||
| 38–39 | 6.4 | 6.4 | 1874,4 * | ||
| 40–41 | 8.05 | 8.05 | 1861,9 * | ||
| 42–44 | 8.51 | 8.51 | 1849,4 * | ||
| 44–45 | 5.44 | 5.44 | 1836,9 * | ||
| 46–47.7 | 7.4 | 7.4 | 1824,4 * | ||
| High | Good | Moderate | Bad | Poor | |
| EcoQS 1 | >15 | 11–15 | 7–11 | 3–7 | <3 |
| EcoQS 2 | >10 | 7.5–10 | 5–7.5 | 2.5–5 | <2.5 |
References
- European Commission, Water framework directive 2000/60/EC. Off. J. Eur. Communities 2000, L 269, 1–15.
- Howarth, W. The marine strategy framework directive. J. Water Law 2008, 19, 95–97. [Google Scholar]
- Reizopolou, S.; Penna, M.; Boix, D.; Buchet, R.; Costas, N.; Derolez, V.; Gascon, S.; Gifre, J.; Martinoy, M.; Pardo, I.; et al. Transitional Waters Mediterranean Geographic Intercalibration Group: Benthic Invertebrates Fauna Ecological Assessment Methods, EUR 29561 EN; Publications Office of the European Union: Luxembourg, 2018. [CrossRef]
- Andersen, M.M. An innovation system approach to eco-innovation—Aligning policy rationales. In Proceedings of the Greening of Policies, Interlinkages and Policy Integration Conference, Berlin, Germany, 3–4 December 2004; pp. 1–28. [Google Scholar]
- Borja, A.; Franco, J.; Muxika, I. Classification tools for marine ecological quality assessment: The usefulness of macro-benthic communities in an area affected by a submarine outfall. In Proceedings of the ICES CM 2003/Session J-02, Tallinn, Estonia, 24–28 September 2003; pp. 1–10. [Google Scholar]
- Blanchet, H.; Lavesque, N.; Ruellet, T.; Dauvin, J.; Sauriau, P.-G.; Desroy, N.; Desclaux, C.; Leconte, M.; Bachelet, G.; Janson, A.-L.; et al. Use of biotic indices in semi-enclosed coastal ecosystems and transitional waters habitats—Implications for the implementation of the European Water Framework Directive. Ecol. Indic. 2008, 8, 360–372. [Google Scholar] [CrossRef] [Green Version]
- Bouchet, V.M.; Sauriau, P.-G. Influence of oyster culture practices and environmental conditions on the ecological status of intertidal mudflats in the Pertuis Charentais (SW France): A multi-index approach. Mar. Pollut. Bull. 2008, 56, 1898–1912. [Google Scholar] [CrossRef] [PubMed] [Green Version]
- Salas, F.; Neto, J.; Borja, A.; Marques, J. Evaluation of the applicability of a marine biotic index to characterize the status of estuarine ecosystems: The case of Mondego estuary (Portugal). Ecol. Indic. 2004, 4, 215–225. [Google Scholar] [CrossRef] [Green Version]
- Elliott, M.; Quintino, V. The estuarine quality paradox, environmental homeostasis and the difficulty of detecting anthropogenic stress in naturally stressed areas. Mar. Pollut. Bull. 2007, 54, 640–645. [Google Scholar] [CrossRef]
- Munari, C.; Mistri, M. Biodiversity of soft-sediment benthic communities from Italian transitional waters. J. Biogeogr. 2008, 35, 1622–1637. [Google Scholar] [CrossRef]
- Pusceddu, A.; Dell’Anno, A.; Danovaro, R.; Manini, E.; Sarà, G.; Fabiano, M. Enzymatically hydrolyzable protein and carbohydrate sedimentary pools as indicators of the trophic state of detritus sink systems: A case study in a Mediterranean coastal lagoon. Estuaries 2003, 26, 641–650. [Google Scholar] [CrossRef]
- Dauvin, J.-C. Paradox of estuarine quality: Benthic indicators and indices, consensus or debate for the future. Mar. Pollut. Bull. 2007, 55, 271–281. [Google Scholar] [CrossRef]
- Dauvin, J.-C.; Ruellet, T. The estuarine quality paradox: Is it possible to define an ecological quality status for specific modified and naturally stressed estuarine ecosystems? Mar. Pollut. Bull. 2009, 59, 38–47. [Google Scholar] [CrossRef]
- Muniz, P.; Venturini, N.; Pires-Vanin, A.M.; Tommasi, L.R.; Borja, Á. Testing the applicability of a Marine Biotic Index (AMBI) to assessing the ecological quality of soft-bottom benthic communities, in the South America Atlantic region. Mar. Pollut. Bull. 2005, 50, 624–637. [Google Scholar] [CrossRef] [PubMed]
- Quintino, V.; Elliott, M.; Rodrigues, A.M. The derivation, performance and role of univariate and multivariate indicators of benthic change: Case studies at differing spatial scales. J. Exp. Mar. Biol. Ecol. 2006, 330, 368–382. [Google Scholar] [CrossRef]
- McLusky, D.S.; Elliott, M. Transitional waters: A new approach, semantics or just muddying the waters? Estuar. Coast. Shelf Sci. 2007, 71, 359–363. [Google Scholar] [CrossRef]
- Halpern, B.S.; Walbridge, S.; Selkoe, K.A.; Kappel, C.V.; Micheli, F.; D’Agrosa, C.; Bruno, J.F.; Casey, K.S.; Ebert, C.; Fox, H.E.; et al. A global map of human impact on marine ecosystems. Science 2008, 319, 948–953. [Google Scholar] [CrossRef] [Green Version]
- Van Hoey, G.; Borja, A.; Birchenough, S.; Buhl-Mortensen, L.; Degraer, S.; Fleischer, D.; Kerckhof, F.; Magni, P.; Muxika, I.; Reiss, H.; et al. The use of benthic indicators in Europe: From the water framework directive to the marine strategy framework directive. Mar. Pollut. Bull. 2010, 60, 2187–2196. [Google Scholar] [CrossRef] [Green Version]
- Dolven, J.K.; Alve, E.; Rygg, B.; Magnusson, J. Defining past ecological status and in situ reference conditions using benthic foraminifera: A case study from the Oslofjord, Norway. Ecol. Indic. 2013, 29, 219–233. [Google Scholar] [CrossRef]
- Hess, S.; Alve, E.; Andersen, T.J.; Joranger, T. Defining ecological reference conditions in naturally stressed environments—How difficult is it? Mar. Environ. Res. 2020, 156. [Google Scholar] [CrossRef]
- Alve, E.; Lepland, A.; Magnusson, J.; Backer-Owe, K. Monitoring strategies for re-establishment of ecological reference conditions: Possibilities and limitations. Mar. Pollut. Bull. 2009, 59, 297–310. [Google Scholar] [CrossRef]
- Alve, E. Foraminifera, climatic change, and pollution: A study of late Holocene sediments in Drammensfiord, southeast Norway. Holocene 1991, 1, 243–261. [Google Scholar] [CrossRef]
- Francescangeli, F.; du Chatelet, E.A.; Billon, G.; Trentesaux, A.; Bouchet, V. Palaeo-ecological quality status based on foraminifera of Boulogne-sur-Mer harbour (Pas-de-Calais, Northeastern France) over the last 200 years. Mar. Environ. Res. 2016, 117, 32–43. [Google Scholar] [CrossRef]
- Polovodova Asteman, I.P.; Hanslik, D.; Nordberg, K. An almost completed pollution-recovery cycle reflected by sediment geochemistry and benthic foraminiferal assemblages in a Swedish–Norwegian Skagerrak fjord. Mar. Pollut. Bull. 2015, 95, 126–140. [Google Scholar] [CrossRef]
- De Jesus, M.S.D.; Frontalini, F.; Bouchet, V.M.P.; Yamashita, C.; Sartoretto, J.R.; Figueira, R.C.L.; Sousa, S.H. Reconstruction of the palaeo-ecological quality status in an impacted estuary using benthic foraminifera: The Santos Estuary (Sao Paulo state, SE Brazil). Mar. Environ. Res. 2020, 162. [Google Scholar] [CrossRef]
- Klootwijk, A.T.; Alve, E.; Hess, S.; Renaud, P.E.; Sørlie, C.; Dolven, J.K. Monitoring environmental impacts of fish farms: Comparing reference conditions of sediment geochemistry and benthic foraminifera with the present. Ecol. Indic. 2021, 120, 106818. [Google Scholar] [CrossRef]
- Resig, J.M. Foraminiferal Ecology around Ocean Outfalls off Southern California; Pergamon Press: London, UK, 1960. [Google Scholar]
- Kenigsberg, C.; Abramovich, S.; Hyams-Kaphzan, O. The effect of long-term brine discharge from desalination plants on benthic foraminifera. PLoS ONE 2020, 15, 1–20. [Google Scholar] [CrossRef] [Green Version]
- Aloulou, F.; Elleuch, B.; Kallel, M. Benthic foraminiferal assemblages as pollution proxies in the northern coast of Gabes Gulf, Tunisia. Environ. Monit. Assess. 2012, 184, 777–795. [Google Scholar] [CrossRef]
- Brunner, C.A.; Yeager, K.M.; Hatch, R.; Simpson, S.; Keim, J.; Briggs, K.B.; Louchouarn, P. Effects of oil from the 2010 Macondo well blowout on marsh foraminifera of Mississippi and Louisiana, USA. Environ. Sci. Technol. 2013, 47, 9115–9123. [Google Scholar] [CrossRef]
- Morvan, J.; Le Cadre, V.; Jorissen, F.; Debenay, J.-P. Foraminifera as potential bio-indicators of the “Erika” oil spill in the Bay of Bourgneuf: Field and experimental studies. Aquat. Living Resour. 2004, 17, 317–322. [Google Scholar] [CrossRef]
- Young, C.M.; Schwing, P.T.; Cotton, L.J. Benthic foraminiferal morphological response to the 2010 Deepwater Horizon oil spill. Mar. Micropaleontol. 2021, 101971. [Google Scholar] [CrossRef]
- Bouchet, V.M.; Debenay, J.-P.; Sauriau, P.-G.; Radford-Knoery, J.; Soletchnik, P. Effects of short-term environmental disturbances on living benthic foraminifera during the Pacific oyster summer mortality in the Marennes-Oléron Bay (France). Mar. Environ. Res. 2007, 64, 358–383. [Google Scholar] [CrossRef] [Green Version]
- Oron, S.; Angel, D.; Goodman-Tchernov, B.; Merkado, G.; Kiflawi, M.; Abramovich, S. Benthic foraminiferal response to the removal of aquaculture fish cages in the Gulf of Aqaba-Eilat, Red Sea. Mar. Micropaleontol. 2014, 107, 8–17. [Google Scholar] [CrossRef]
- Burone, L.; Valente, P.; Pires-Vanin, A.M.S.; De Melloe Sousa, S.H.; Mahiques, M.M.; Braga, E. Benthic foraminiferal variability on a monthly scale in a subtropical bay moderately affected by urban sewage. Sci. Mar. 2007, 71, 775–792. [Google Scholar] [CrossRef] [Green Version]
- Hyams-Kaphzan, O.; Almogi-Labin, A.; Benjamini, C.; Herut, B. Natural oligotrophy vs. pollution-induced eutrophy on the SE Mediterranean shallow shelf (Israel): Environmental parameters and benthic foraminifera. Mar. Pollut. Bull. 2009, 58, 1888–1902. [Google Scholar] [CrossRef]
- Debenay, J.-P.; Tsakiridis, E.; Soulard, R.; Grossel, H. Factors determining the distribution of foraminiferal assemblages in Port Joinville Harbor (Ile d’Yeu, France): The influence of pollution. Mar. Micropaleontol. 2001, 43, 75–118. [Google Scholar] [CrossRef] [Green Version]
- Martínez-Colón, M.; Hallock, P.; Green-Ruíz, C.R.; Smoak, J.M. Benthic foraminifera as bioindicators of potentially toxic element (PTE) pollution: Torrecillas lagoon (San Juan Bay Estuary), Puerto Rico. Ecol. Indic. 2018, 89, 516–527. [Google Scholar] [CrossRef]
- Smith, C.W.; Goldstein, S.T. The effects of selected heavy metal elements (arsenic, cadmium, nickel, zinc) on experimentally grown foraminiferal assemblages from Sapelo Island, Georgia and Little Duck Key, Florida, U.S.A. J. Foraminifer. Res. 2019, 49, 303–317. [Google Scholar] [CrossRef]
- Hart, M.B.; Molina, G.S.; Smart, C.W. Estuarine foraminifera from South West England: Impact of metal pollution in a mining heritage area. J. Sediment. Environ. 2020, 5, 1–16. [Google Scholar] [CrossRef]
- Schafer, C.T.; Collins, E.S.; Smith, J.N. Relationship of Foraminifera and thecamoebian distributions to sediments contaminated by pulp mill effluent: Saguenay Fiord, Quebec, Canada. Mar. Micropaleontol. 1991, 17, 255–283. [Google Scholar] [CrossRef]
- Alve, E. Benthic foraminiferal distribution and recolonization of formerly anoxic environments in Drammensfjord, Southern Norway. Mar. Micropaleontol. 1995, 25, 169–186. [Google Scholar] [CrossRef]
- Scott, D.B.; Tobin, R.; Williamson, M.; Medioli, F.S.; Latimer, J.S.; Boothman, W.A.; Asioli, A.; Haury, V. Pollution monitoring in two North American estuaries: Historical reconstructions using benthic foraminifera. J. Foraminifer. Res. 2005, 35, 65–82. [Google Scholar] [CrossRef]
- Hayward, B.W.; Grenfell, H.R.; Nicholson, K.; Parker, R.; Wilmhurst, J.; Horrocks, M.; Swales, A.; Sabaa, A.T. Foraminiferal record of human impact on intertidal estuarine environments in New Zealand’s largest city. Mar. Micropaleontol. 2004, 53, 37–66. [Google Scholar] [CrossRef]
- Polovodova Asteman, I.; Van Nieuwenhove, N.; Andersen, T.J.; Linders, T.; Nordberg, K. Recent environmental change in the Kosterhavet National Park marine protected area as reflected by hydrography and sediment proxy data. Mar. Environ. Res. 2021, 166. [Google Scholar] [CrossRef] [PubMed]
- Alve, E. Benthic foraminiferal evidence of environmental change in the Skagerrak over the past six decades. NGU Bull. 1996, 430, 85–93. [Google Scholar]
- Nordberg, K.; Asteman, I.P.; Gallagher, T.M.; Robijn, A. Recent oxygen depletion and benthic faunal change in shallow areas of Sannäs Fjord, Swedish west coast. J. Sea Res. 2017, 127, 46–62. [Google Scholar] [CrossRef]
- El Kateb, A.; Stalder, C.; Martínez-Colón, M.; Mateu-Vicens, G.; Francescangeli, F.; Coletti, G.; Stainbank, S.; Spezzaferri, S. Foraminiferal-based biotic indices to assess the ecological quality status of the Gulf of Gabes (Tunisia): Present limitations and future perspectives. Ecol. Indic. 2020, 111, 105962. [Google Scholar] [CrossRef]
- Bouchet, V.; Goberville, E.; Frontalini, F. Benthic foraminifera to assess ecological quality statuses in Italian transitional waters. Ecol. Indic. 2018, 84, 130–139. [Google Scholar] [CrossRef]
- Barras, C.; Jorissen, F.; Labrune, C.; Andral, B.; Boissery, P. Live benthic foraminiferal faunas from the French Mediterranean Coast: Towards a new biotic index of environmental quality. Ecol. Indic. 2014, 36, 719–743. [Google Scholar] [CrossRef] [Green Version]
- Linke, P.; Lutze, G. Microhabitat preferences of benthic foraminifera—A static concept or a dynamic adaptation to optimize food acquisition? Mar. Micropaleontol. 1993, 20, 215–234. [Google Scholar] [CrossRef] [Green Version]
- Yanko, V.; Kronfeld, J.; Flexer, A. Response of benthic foraminifera to various pollution sources; implications for pollution monitoring. J. Foraminifer. Res. 1994, 24, 1–17. [Google Scholar] [CrossRef]
- Samir, A.; El-Din, A. Benthic foraminiferal assemblages and morphological abnormalities as pollution proxies in two Egyptian bays. Mar. Micropaleontol. 2001, 41, 193–227. [Google Scholar] [CrossRef]
- Polovodova, I.; Schönfeld, J. Foraminiferal test abnormalities in the western Baltic Sea. J. Foraminifer. Res. 2008, 38, 318–336. [Google Scholar] [CrossRef]
- Arenillas, I.; Arz, J.A.; Gilabert, V. Blooms of aberrant planktic foraminifera across the K/Pg boundary in the Western Tethys: Causes and evolutionary implications. Paleobiology 2018, 44, 460–489. [Google Scholar] [CrossRef] [Green Version]
- Nardelli, M.; Malferrari, D.; Ferretti, A.; Bartolini, A.; Sabbatini, A.; Negri, A. Zinc incorporation in the miliolid foraminifer Pseudotriloculina rotunda under laboratory conditions. Mar. Micropaleontol. 2016, 126, 42–49. [Google Scholar] [CrossRef]
- Boehnert, S.; Birkelund, A.; Schmiedl, G.; Kuhnert, H.; Kuhn, G.; Hass, H.; Hebbeln, D. Test deformation and chemistry of foraminifera as response to anthropogenic heavy metal input. Mar. Pollut. Bull. 2020, 155, 111112. [Google Scholar] [CrossRef]
- Alve, E.; Bernhard, J. Vertical migratory response of benthic foraminifera to controlled oxygen concentrations in an experimental mesocosm. Mar. Ecol. Prog. Ser. 1995, 116, 137–151. [Google Scholar] [CrossRef]
- Asteman, I.P.; Nordberg, K. A short note on a present-day benthic recovery status in the formerly heavily polluted Idefjord (Sweden/Norway). Mar. Pollut. Bull. 2017, 123, 227–231. [Google Scholar] [CrossRef]
- Belart, P.; Clemente, I.; Raposo, D.; Habib, R.; Volino, E.; Villar, A.; Alves, M.; Fontana, L.; Lorini, M.; Panigai, G.; et al. Living and dead foraminifera as bioindicators in Saquarema lagoon system, Brazil. Lat. Am. J. Aquat. Res. 2018, 46, 1055–1072. [Google Scholar] [CrossRef]
- Dijkstra, N.; Junttila, J.; Skirbekk, K.; Carroll, J.; Husum, K.; Hald, M. Benthic foraminifera as bio-indicators of chemical and physical stressors in Hammerfest harbor (Northern Norway). Mar. Pollut. Bull. 2017, 114, 384–396. [Google Scholar] [CrossRef] [Green Version]
- du Châtelet, E.A.; Debenay, J.-P.; Soulard, R. Foraminiferal proxies for pollution monitoring in moderately polluted harbors. Environ. Pollut. 2004, 127, 27–40. [Google Scholar] [CrossRef]
- Nordberg, K. Decreasing oxygen concentrations in the Gullmar Fjord, Sweden, as confirmed by benthic foraminifera, and the possible association with NAO. J. Mar. Syst. 2000, 23, 303–316. [Google Scholar] [CrossRef]
- Polovodova, I.; Nikulina, A.; Schönfeld, J.; Dullo, W.-C. Recent benthic foraminifera in the Flensburg Fjord (Western Baltic Sea). J. Micropalaeontol. 2009, 28, 131–142. [Google Scholar] [CrossRef] [Green Version]
- Nikulina, A.; Polovodova, I.; Schönfeld, J. Foraminiferal response to environmental changes in Kiel Fjord, SW Baltic Sea. eEarth 2008, 3, 37–49. [Google Scholar] [CrossRef] [Green Version]
- Thomas, E.; Gapotchenko, T.; Varekamp, J.C.; Mecray, E.L.; Buchholtz ten Brink, M.R. Benthic foraminifera and environmental changes in Long Island Sound. J. Coast. Res. 2000, 16, 641–655. [Google Scholar]
- Bernhard, J.; Alve, E. Survival, ATP pool, and ultrastructural characterization of benthic foraminifera from Drammensfjord (Norway): Response to anoxia. Mar. Micropaleontol. 1996, 28, 5–17. [Google Scholar] [CrossRef]
- Risgaard-Petersen, N.; Langezaal, A.M.; Ingvardsen, S.; Schmid, M.C.; Jetten, M.S.M.; Camp, H.O.D.; Derksen, J.W.M.; Piña-Ochoa, E.; Eriksson, S.P.; Nielsen, L.P.; et al. Evidence for complete denitrification in a benthic foraminifer. Nature 2006, 443, 93–96. [Google Scholar] [CrossRef]
- Gustafsson, M.; Nordberg, K. Benthic foraminifera and their response to hydrography, periodic hypoxic conditions and primary production in the Koljö fjord on the Swedish west coast. J. Sea Res. 1999, 41, 163–178. [Google Scholar] [CrossRef]
- Bradshaw, J.S. Laboratory studies on the rate of growth of the foraminifer, “Streblus beccarii (Linné) var. tepida (Cushman)”. J. Paleontol. 1957, 31, 1138–1147. [Google Scholar]
- Ross, B.J.; Hallock, P. Survival and recovery of the foraminifer Amphistegina gibbosa and associated diatom endosymbionts following up to 20 months in aphotic conditions. Mar. Micropaleontol. 2019, 149, 35–43. [Google Scholar] [CrossRef]
- Ross, B.J.; Hallock, P. Dormancy in the foraminifera: A review. J. Foraminifer. Res. 2016, 46, 358–368. [Google Scholar] [CrossRef]
- Schönfeld, J.; Alve, E.; Geslin, E.; Jorissen, F.; Korsun, S.; Spezzaferri, S. The FOBIMO (FOraminiferal BIo-MOnitoring) initiative—Towards a standardised protocol for soft-bottom benthic foraminiferal monitoring studies. Mar. Micropaleontol. 2012, 94–95, 1–13. [Google Scholar] [CrossRef]
- Bouchet, V.; Alve, E.; Rygg, B.; Telford, R. Benthic foraminifera provide a promising tool for ecological quality assessment of marine waters. Ecol. Indic. 2012, 23, 66–75. [Google Scholar] [CrossRef]
- Alve, E.; Hess, S.; Bouchet, V.; Dolven, J.K.; Rygg, B. Intercalibration of benthic foraminiferal and macrofaunal biotic indices: An example from the Norwegian Skagerrak coast (NE North Sea). Ecol. Indic. 2019, 96, 107–115. [Google Scholar] [CrossRef]
- Dimiza, M.D.; Triantaphyllou, M.V.; Koukousioura, O.; Hallock, P.; Simboura, N.; Karageorgis, A.P.; Papathanasiou, E. The Foram Stress Index: A new tool for environmental assessment of soft-bottom environments using benthic foraminifera. A case study from the Saronikos Gulf, Greece, Eastern Mediterranean. Ecol. Indic. 2016, 60, 611–621. [Google Scholar] [CrossRef]
- Alve, E.; Korsun, S.; Schönfeld, J.; Dijkstra, N.; Golikova, E.; Hess, S.; Husum, K.; Panieri, G. Foram-AMBI: A sensitivity index based on benthic foraminiferal faunas from North-East Atlantic and Arctic fjords, continental shelves and slopes. Mar. Micropaleontol. 2016, 122, 1–12. [Google Scholar] [CrossRef]
- Castelo, W.F.L.; Martins, M.V.A.; Martinez-Colon, M.; Guerra, J.V.; Dadalto, T.P.; Terroso, D.; Soares, M.F.; Frontalini, F.; Duleba, W.; Socorro, O.A.A.; et al. Disentangling natural vs. anthropogenic induced environmental variability during the Holocene: Marambaia Cove, SW sector of the Sepetiba Bay (SE Brazil). Environ. Sci. Pollut. Res. 2021, 28. [Google Scholar] [CrossRef]
- Punniyamoorthy, R.; Sarathy, P.P.; Mahadevan, G.; Selvaraj, P.; Bharathidasan, V.; Murugesan, P. Benthic foraminifera to assess ecological quality status of Kaduvaiyar and Uppanar estuaries, Southeast coast of India. J. Mar. Biol. Assoc. India 2020, 61, 52–62. [Google Scholar] [CrossRef]
- Francescangeli, F.; Quijada, M.; du Châtelet, E.A.; Frontalini, F.; Trentesaux, A.; Billon, G.; Bouchet, V. Multidisciplinary study to monitor consequences of pollution on intertidal benthic ecosystems (Hauts de France, English Channel, France): Comparison with natural areas. Mar. Environ. Res. 2020, 160. [Google Scholar] [CrossRef]
- Bouchet, V.M.; Deldicq, N.; Baux, N.; Dauvin, J.-C.; Pezy, J.-P.; Seuront, L.; Méar, Y. Benthic foraminifera to assess ecological quality statuses: The case of salmon fish farming. Ecol. Indic. 2020, 117. [Google Scholar] [CrossRef]
- Melis, R.; Celio, M.; Bouchet, V.; Varagona, G.; Bazzaro, M.; Crosera, M.; Pugliese, N. Seasonal response of benthic foraminifera to anthropogenic pressure in two stations of the Gulf of Trieste (northern Adriatic Sea, Italy): The marine protected area of Miramare versus the Servola water sewage outfall. Mediterr. Mar. Sci. 2019, 20, 120–141. [Google Scholar] [CrossRef]
- Bouchet, V.M.P.; Telford, R.J.; Rygg, B.; Oug, E.; Alve, E. Can benthic foraminifera serve as proxies for changes in benthic macrofaunal community structure? Implications for the definition of reference conditions. Mar. Environ. Res. 2018, 137, 24–36. [Google Scholar] [CrossRef] [PubMed] [Green Version]
- Bouchet, V.M.P.; Frontalini, F.; Francescangeli, F.; Sauriau, P.-G.; Geslin, E.; Martins, M.V.A.; Almogi-Labin, A.; Avnaim-Katav, S.; Di Bella, L.; Cearreta, A.; et al. Indicative value of benthic foraminifera for biomonitoring: Assignment to ecological groups of sensitivity to total organic carbon of species from European intertidal areas and transitional waters. Mar. Pollut. Bull. 2021, 164. [Google Scholar] [CrossRef] [PubMed]
- Armynot du Châtelet, E.A.; Bout-Roumazeilles, V.; Riboulleau, A.; Trentesaux, A. Sediment (grain size and clay mineralogy) and organic matter quality control on living benthic foraminifera. Rev. Micropaléontol. 2009, 52, 75–84. [Google Scholar] [CrossRef]
- Leorri, E.; Zimmerman, A.R.; Mitra, S.; Christian, R.R.; Fatela, F.; Mallinson, D.J. Refractory organic matter in coastal salt marshes-effect on C sequestration calculations. Sci. Total Environ. 2018, 633, 391–398. [Google Scholar] [CrossRef]
- Jorissen, F.; Nardelli, M.P.; Almogi-Labin, A.; Barras, C.; Bergamin, L.; Bicchi, E.; El Kateb, A.; Ferraro, L.; McGann, M.; Morigi, C.; et al. Developing Foram-AMBI for biomonitoring in the Mediterranean: Species assignments to ecological categories. Mar. Micropaleontol. 2018, 140, 33–45. [Google Scholar] [CrossRef] [Green Version]
- Mojtahid, M.; Jorissen, F.; Durrieu, J.; Galgani, F.; Howa, H.; Redois, F.; Camps, R. Benthic foraminifera as bio-indicators of drill cutting disposal in tropical east Atlantic outer shelf environments. Mar. Micropaleontol. 2006, 61, 58–75. [Google Scholar] [CrossRef] [Green Version]
- Denoyelle, M.; Jorissen, F.J.; Martin, D.; Galgani, F.; Miné, J. Comparison of benthic foraminifera and macrofaunal indicators of the impact of oil-based drill mud disposal. Mar. Pollut. Bull. 2010, 60, 2007–2021. [Google Scholar] [CrossRef] [PubMed] [Green Version]
- Hallock, P.; Lidz, B.H.; Cockey-Burkhard, E.M.; Donnelly, K.B. Foraminifera as bioindicators in coral reef assessment and monitoring: The FORAM index. Environ. Monit. Assess. 2003, 81, 221–238. [Google Scholar] [CrossRef]
- Prazeres, M.; Martínez-Colón, M.; Hallock, P. Foraminifera as bioindicators of water quality: The FoRAM Index revisited. Environ. Pollut. 2020, 257. [Google Scholar] [CrossRef] [PubMed]
- Roberts, J.M.; Davies, A.J.; Henry, L.A.; Dodds, L.A.; Duineveld, G.C.A.; Lavaleye, M.S.S.; Maier, C.; Van Soest, R.W.M.; Bergman, M.J.N.; Hühnerbach, V.; et al. Mingulay reef complex: An interdisciplinary study of cold-water coral habitat, hydrography and biodiversity. Mar. Ecol. Prog. Ser. 2009, 397, 139–151. [Google Scholar] [CrossRef] [Green Version]
- Parent, B. Développement d’un Indice Biotique Basé sur les Foraminiféres Benthiques: Application sur la Façade Méditerranéenne Française. Ph.D. Thesis, University of Angers, Angers, France, 2019. [Google Scholar]
- Thompson, B.; Weisberg, S.B.; Melwani, A.; Lowe, S.; Ranasinghe, J.A.; Cadien, D.B.; Dauer, D.M.; Diaz, R.J.; Fields, W.; Kellogg, M.; et al. Low levels of agreement among experts using best professional judgment to assess benthic condition in the San Francisco Estuary and Delta. Ecol. Indic. 2012, 12, 167–173. [Google Scholar] [CrossRef]
- Zettler, M.L.; Proffitt, C.E.; Darr, A.; Degraer, S.; Devriese, L.; Greathead, C.; Kotta, J.; Magni, P.; Martin, G.; Reiss, H.; et al. On the myths of indicator species: Issues and further consideration in the use of static concepts for ecological applications. PLoS ONE 2013, 8. [Google Scholar] [CrossRef] [Green Version]
- Simboura, N.; Zenetos, A. Benthic indicators to use in Ecological Quality classification of Mediterranean soft bottom marine ecosystems, including a new Biotic Index. Mediterr. Mar. Sci. 2002, 3, 77–111. [Google Scholar] [CrossRef] [Green Version]
- Grall, J.; Glémarec, M. Using biotic indices to estimate macrobenthic community perturbations in the Bay of Brest. Estuar. Coast. Shelf Sci. 1997, 44, 43–53. [Google Scholar] [CrossRef]
- Borja, A.; Franco, J.; Pérez, V. A marine biotic index to establish the ecological quality of soft-bottom benthos within European estuarine and coastal environments. Mar. Pollut. Bull. 2000, 40, 1100–1114. [Google Scholar] [CrossRef]
- Parent, B.; Hyams-Kaphzan, O.; Barras, C.; Lubinevsky, H.; Jorissen, F. Testing foraminiferal environmental quality indices along a well-defined organic matter gradient in the Eastern Mediterranean. Ecol. Indic. 2021, 125, 107498. [Google Scholar] [CrossRef]
- Bergamin, L.; Di Bella, L.; Ferraro, L.; Frezza, V.; Pierfranceschi, G.; Romano, E. Benthic foraminifera in a coastal marine area of the eastern Ligurian Sea (Italy): Response to environmental stress. Ecol. Indic. 2019, 96, 16–31. [Google Scholar] [CrossRef]
- Martínez-Colón, M.; Bouchet, V. Benthic Foraminifera as Ecological Sentinels of Marine Systems Health. SCOR Working Group Proposal: FORAM-ECO. 2020. Available online: https://scor-int.org/wp-content/uploads/2020/05/FORAM-ECO_SCOR_v7.pdf (accessed on 6 April 2021).
- Sousa, S.H.M.; Members of the BIOFOM Group; Yamashita, C.; Semensatto, D.L.; Santarosa, A.C.A.; Iwai, F.S.; Omachi, C.Y.; Disaró, S.T.; Martins, M.V.A.; Barbosa, C.F.; et al. Opportunities and challenges in incorporating benthic foraminifera in marine and coastal environmental biomonitoring of soft sediments: From science to regulation and practice. J. Sediment. Environ. 2020, 5. [Google Scholar] [CrossRef]
- Zeppilli, D.; Sarrazin, J.; Leduc, D.; Arbizu, P.M.; Fontaneto, D.; Fontanier, C.; Gooday, A.J.; Kristensen, R.M.; Ivanenko, V.; Sørensen, M.; et al. Is the meiofauna a good indicator for climate change and anthropogenic impacts? Mar. Biodivers. 2015, 45, 505–535. [Google Scholar] [CrossRef] [Green Version]
- Mateu-Vicens, G.; Khokhlova, A.; Sebastián-Pastor, T. Epiphytic foraminiferal indices as bioindicators in Mediterranean seagrass meadows. J. Foraminifer. Res. 2014, 44, 325–339. [Google Scholar] [CrossRef]
- Refcond. Guidance on Establishing Reference Conditions and Ecological Status Class Boundaries for Inland Surface Waters; Produced by Working Group 2.31, Reference Conditions for Inland Surface (REFCOND), Common Implementation Strategy; European Commission: Brussels, Belgium, 2003; p. 86. [Google Scholar]
- Rombouts, I.; Beaugrand, G.; Artigas, L.F.; Dauvin, J.-C.; Gevaert, F.; Goberville, E.; Kopp, D.; Lefebvre, S.; Luczak, C.; Spilmont, N.; et al. Evaluating marine ecosystem health: Case studies of indicators using direct observations and modelling methods. Ecol. Indic. 2013, 24, 353–365. [Google Scholar] [CrossRef]
- Ruellet, T.; Dauvin, J.-C. Benthic indicators: Analysis of the threshold values of ecological quality classifications for transitional waters. Mar. Pollut. Bull. 2007, 54, 1707–1714. [Google Scholar] [CrossRef] [PubMed]
- Berkeley, A.; Perry, C.T.; Smithers, S.G.; Horton, B.P.; Taylor, K.G. A review of the ecological and taphonomic controls on foraminiferal assemblage development in intertidal environments. Earth-Sci. Rev. 2007, 83, 205–230. [Google Scholar] [CrossRef]
- Murray, J.W.; Alve, E.; Cundy, A. The origin of modern agglutinated foraminiferal assemblages: Evidence from a stratified fjord. Estuar. Coast. Shelf Sci. 2003, 58, 677–697. [Google Scholar] [CrossRef]
- Murray, J.W.; Alve, E. Natural dissolution of modern shallow water benthic foraminifera: Taphonomic effects on the palaeoecological record. Palaeogeogr. Palaeoclim. Palaeoecol. 1999, 146, 195–209. [Google Scholar] [CrossRef]
- Murray, J.W.; Alve, E. Taphonomic experiments on marginal marine foraminiferal assemblages: How much ecological information is preserved? Palaeogeogr. Palaeoclim. Palaeoecol. 1999, 149, 183–197. [Google Scholar] [CrossRef]
- Francescangeli, F.; Portela, M.; Du Chatelet, E.A.; Billon, G.; Andersen, T.; Bouchet, V.; Trentesaux, A. Infilling of the Canche Estuary (Eastern English Channel, France): Insight from benthic foraminifera and historical pictures. Mar. Micropaleontol. 2018, 142, 1–12. [Google Scholar] [CrossRef]
- Mulik, J.; Sukumaran, S.; Srinivas, T.; Vijapure, T. Comparative efficacy of benthic biotic indices in assessing the Ecological Quality Status (EcoQS) of the stressed Ulhas estuary, India. Mar. Pollut. Bull. 2017, 120, 192–202. [Google Scholar] [CrossRef]
- Josefson, A.B.; Blomqvist, M.; Hansen, J.L.; Rosenberg, R.; Rygg, B. Assessment of marine benthic quality change in gradients of disturbance: Comparison of different Scandinavian multi-metric indices. Mar. Pollut. Bull. 2009, 44, 1689–1699. [Google Scholar] [CrossRef]
- Borja, A.; Josefson, A.B.; Miles, A.; Muxika, I.; Olsgard, F.; Phillips, G.; Rodríguez, J.G.; Rygg, B. An approach to the intercalibration of benthic ecological status assessment in the North Atlantic ecoregion, according to the European Water Framework Directive. Mar. Pollut. Bull. 2007, 55, 42–52. [Google Scholar] [CrossRef]
- Pawlowski, J.; Kelly-Quinn, M.; Altermatt, F.; Apothéloz-Perret-Gentil, L.; Beja, P.; Boggero, A.; Borja, A.; Bouchez, A.; Cordier, T.; Domaizon, I.; et al. The future of biotic indices in the ecogenomic era: Integrating (e)DNA metabarcoding in biological assessment of aquatic ecosystems. Sci. Total. Environ. 2018, 637–638, 1295–1310. [Google Scholar] [CrossRef]
- Baird, D.J.; Hajibabaei, M. Biomonitoring 2.0: A new paradigm in ecosystem assessment made possible by next-generation DNA sequencing. Mol. Ecol. 2012, 21, 2039–2044. [Google Scholar] [CrossRef] [PubMed]
- Cordier, T.; Frontalini, F.; Cermakova, K.; Apothéloz-Perret-Gentil, L.; Treglia, M.; Scantamburlo, E.; Bonamin, V.; Pawlowski, J. Multi-marker eDNA metabarcoding survey to assess the environmental impact of three offshore gas platforms in the North Adriatic Sea (Italy). Mar. Environ. Res. 2019, 146, 24–34. [Google Scholar] [CrossRef] [PubMed]
- Cordier, T.; Alonso-Sáez, L.; Apothéloz-Perret-Gentil, L.; Aylagas, E.; Bohan, D.A.; Bouchez, A.; Chariton, A.; Creer, S.; Frühe, L.; Keck, F.; et al. Ecosystems monitoring powered by environmental genomics: A review of current strategies with an implementation roadmap. Mol. Ecol. 2020, 1–22. [Google Scholar] [CrossRef] [PubMed]
- Pawlowski, J.; Levin, L.; Recio-Blanco, X.; Le, J.; Lejzerowicz, F.; Cordier, T.; Mulsow, S.; Gjerde, K.; Mengerink, K.; Gooday, A.J. Enabling the Use of Environmental DNA for Regulatory Policymaking in the Marine Industrial Revolution; SNIS Project Working Paper; SNIS: Sydney, Australia, 2018; pp. 1–20. [Google Scholar]
- Forster, D.; Dunthorn, M.; Mahé, F.; Dolan, J.; Audic, S.; Bass, D.; Bittner, L.; Boutte, C.; Christen, R.; Claverie, J.-M.; et al. Benthic protists: The under-charted majority. FEMS Microbiol. Ecol. 2016, 92, 1–11. [Google Scholar] [CrossRef] [PubMed]
- Fonseca, V.; Carvalho, G.R.; Sung, W.; Johnson, H.F.; Power, D.; Neill, S.; Packer, M.; Blaxter, M.; Lambshead, P.J.D.; Thomas, W.K.; et al. Second-generation environmental sequencing unmasks marine metazoan biodiversity. Nat. Commun. 2010, 1. [Google Scholar] [CrossRef] [Green Version]
- Keeley, N.; Wood, S.A.; Pochon, X. Development and preliminary validation of a multi-trophic metabarcoding biotic index for monitoring benthic organic enrichment. Ecol. Indic. 2018, 85, 1044–1057. [Google Scholar] [CrossRef]
- Laroche, O.; Wood, S.A.; Tremblay, L.A.; Ellis, J.; Lear, G.; Pochon, X. A cross-taxa study using environmental DNA/RNA metabarcoding to measure biological impacts of offshore oil and gas drilling and production operations. Mar. Pollut. Bull. 2018, 127, 97–107. [Google Scholar] [CrossRef] [PubMed]
- Mauffrey, F.; Cordier, T.; Apothéloz-Perret-Gentil, L.; Cermakova, K.; Merzi, T.; Delefosse, M.; Blanc, P.; Pawlowski, J. Benthic monitoring of oil and gas offshore platforms in the North Sea using environmental DNA metabarcoding. Mol. Ecol. 2020, 1–16. [Google Scholar] [CrossRef]
- Pawlowski, J.; Esling, P.; Lejzerowicz, F.; Cedhagen, T.; Wilding, T.A. Environmental monitoring through protist next-generation sequencing metabarcoding: Assessing the impact of fish farming on benthic foraminifera communities. Mol. Ecol. Resour. 2014, 14, 1129–1140. [Google Scholar] [CrossRef] [PubMed] [Green Version]
- Cavaliere, M.; Angeles, I.B.; Montresor, M.; Bucci, C.; Brocani, L.; Balassi, E.; Margiotta, F.; Francescangeli, F.; Bouchet, V.; Pawlowski, J.; et al. Assessing the ecological quality status of the highly polluted Bagnoli area (Tyrrhenian Sea, Italy) using foraminiferal eDNA metabarcoding. Sci. Total. Environ. 2021, 790, 147871. [Google Scholar] [CrossRef]
- Frontalini, F.; Cordier, T.; Balassi, E.; du Chatelet, E.A.; Cermakova, K.; Apothéloz-Perret-Gentil, L.; Martins, M.V.A.; Bucci, C.; Scantamburlo, E.; Treglia, M.; et al. Benthic foraminiferal metabarcoding and morphology-based assessment around three offshore gas platforms: Congruence and complementarity. Environ. Int. 2020, 144, 106049. [Google Scholar] [CrossRef]
- Apothéloz-Perret-Gentil, L.; Cordonier, A.; Straub, F.; Iseli, J.; Esling, P.; Pawlowski, J. Taxonomy-free molecular diatom index for high-throughput eDNA biomonitoring. Mol. Ecol. Resour. 2017, 17, 1231–1242. [Google Scholar] [CrossRef]
- Boere, A.C.; Rijpstra, W.I.C.; De Lange, G.; Damsté, J.S.S.; Coolen, M.J.L. Preservation potential of ancient plankton DNA in Pleistocene marine sediments. Geobiology 2011, 9, 377–393. [Google Scholar] [CrossRef] [Green Version]
- Lejzerowicz, F.; Esling, P.; Majewski, W.; Szczuciński, W.; Decelle, J.; Obadia, C.; Martinez-Arbizu, P.; Pawlowski, J. Ancient DNA complements microfossil record in deep-sea subsurface sediments. Biol. Lett. 2013, 9. [Google Scholar] [CrossRef] [PubMed] [Green Version]
- Pawłowska, J.; Zajaczkowski, M.; Łącka, M.; Lejzerowicz, F.; Esling, P.; Pawlowski, J. Palaeoceanographic changes in Hornsund Fjord (Spitsbergen, Svalbard) over the last millennium: New insights from ancient DNA. Clim. Past 2016, 12, 1459–1472. [Google Scholar] [CrossRef] [Green Version]
- Vuillemin, A.; Horn, F.; Alawi, M.; Henny, C.; Wagner, D.; Crowe, S.A.; Kallmeyer, J. Preservation and significance of extracellular DNA in ferruginous sediments from Lake Towuti, Indonesia. Front. Microbiol. 2017, 8, 1–15. [Google Scholar] [CrossRef] [Green Version]
- Pawłowska, J.; Wollenburg, J.E.; Zajączkowski, M.; Pawlowski, J. Planktonic foraminifera genomic variations reflect paleoceanographic changes in the Arctic: Evidence from sedimentary ancient DNA. Sci. Rep. 2020, 10, 1–10. [Google Scholar] [CrossRef] [PubMed]
- Turner, C.R.; Uy, K.L.; Everhart, R.C. Fish environmental DNA is more concentrated in aquatic sediments than surface water. Biol. Conserv. 2015, 183, 93–102. [Google Scholar] [CrossRef] [Green Version]
- Sakata, M.K.; Yamamoto, S.; Gotoh, R.O.; Miya, M.; Yamanaka, H.; Minamoto, T. Sedimentary eDNA provides different information on timescale and fish species composition compared with aqueous eDNA. Environ. DNA 2020, 1–14. [Google Scholar] [CrossRef] [Green Version]
- Kirkpatrick, J.B.; Walsh, E.A.; D’Hondt, S. Fossil DNA persistence and decay in marine sediment over hundred-thousand-year to million-year time scales. Geology 2016, 44, 615–618. [Google Scholar] [CrossRef] [Green Version]
- Holman, L.E.; De Bruyn, M.; Creer, S.; Carvalho, G.; Robidart, J.; Rius, M. Detection of introduced and resident marine species using environmental DNA metabarcoding of sediment and water. Sci. Rep. 2019, 9, 1–10. [Google Scholar] [CrossRef] [PubMed] [Green Version]
- Borja, Á.; Elliott, M.; Carstensen, J.; Heiskanen, A.-S.; van de Bund, W. Marine management—Towards an integrated implementation of the European Marine Strategy Framework and the Water Framework Directives. Mar. Pollut. Bull. 2010, 60, 2175–2186. [Google Scholar] [CrossRef] [PubMed]
- Mueller, M.; Geist, J. Conceptual guidelines for the implementation of the ecosystem approach in biodiversity monitoring. Ecosphere 2016, 7, 1–19. [Google Scholar] [CrossRef] [Green Version]
- Armbrecht, L. The potential of sedimentary ancient DNA to reconstruct past ocean ecosystems. Oceanography 2020, 33, 116–123. [Google Scholar] [CrossRef]
- Gibson, J.; Shokralla, S.; Porter, T.M.; King, I.; van Konynenburg, S.; Janzen, D.H.; Hallwachs, W.; Hajibabaei, M. Simultaneous assessment of the macrobiome and microbiome in a bulk sample of tropical arthropods through DNA metasystematics. Proc. Natl. Acad. Sci. USA 2014, 111, 8007–8012. [Google Scholar] [CrossRef] [Green Version]
- Ruppert, K.M.; Kline, R.J.; Rahman, S. Past, present, and future perspectives of environmental DNA (eDNA) metabarcoding: A systematic review in methods, monitoring, and applications of global eDNA. Glob. Ecol. Conserv. 2019, 17, e00547. [Google Scholar] [CrossRef]
- Li, K.; Rollins, J.; Yan, E. Web of Science use in published research and review papers 1997–2017: A selective, dynamic, cross-domain, content-based analysis. Scientometrics 2018, 115, 1–20. [Google Scholar] [CrossRef] [PubMed] [Green Version]
- Barbieri, G.; Rossi, V.; Ghosh, A.; Vaiani, S.C. Conservation paleobiology as a tool to define reference conditions in naturally stressed transitional settings: Micropaleontological insights from the Holocene of the Po coastal plain (Italy). Water 2020, 12, 3420. [Google Scholar] [CrossRef]
- Bergamin, L.; Romano, E. Suitable sediment fraction for paleoenvironmental reconstruction and assessment of contaminated coastal areas based on benthic foraminifera: A case study from Augusta Harbour (Eastern Sicily, Italy). Ecol. Indic. 2016, 71, 66–78. [Google Scholar] [CrossRef]
- Duffield, C.; Alve, E.; Andersen, N.; Andersen, T.; Hess, S.; Strohmeier, T. Spatial and temporal organic carbon burial along a fjord to coast transect: A case study from Western Norway. Holocene 2017, 27, 1325–1339. [Google Scholar] [CrossRef] [Green Version]
- Nesbitt, E.A.; Martin, R.A.; Martin, D.E.; Apple, J. Rapid deterioration of sediment surface habitats in Bellingham Bay, Washington State, as indicated by benthic foraminifera. Mar. Pollut. Bull. 2015, 97, 273–284. [Google Scholar] [CrossRef]
- Nagendra, R.; Reddy, A.N. benthic foraminifera response to ecosystem pollution in the Uppanar estuary, Tamil Nadu coast, India. J. Geol. Soc. India 2019, 93, 555–566. [Google Scholar] [CrossRef]
- Thissen, J.M.; Langer, M.R. Spatial patterns and structural composition of foraminiferal assemblages from the Zanzibar Archipelago (Tanzania). Palaeontogr. Abt. A 2017, 308, 1–67. [Google Scholar] [CrossRef]
- Martins, M.V.A.; Hohenegger, J.; Martínez-Colón, M.; Frontalini, F.; Bergamashi, S.; Laut, L.; Belart, P.; Mahiques, M.; Pereira, E.; Rodrigues, R.; et al. Ecological quality status of the NE sector of the Guanabara Bay (Brazil): A case of living benthic foraminiferal resilience. Mar. Pollut. Bull. 2020, 158. [Google Scholar] [CrossRef] [PubMed]
- Buosi, C.; Cherchi, A.; Ibba, A.; Marras, B.; Marrucci, A.; Schintu, M. Preliminary data on benthic foraminiferal assemblages and sedimentological characterisation from some polluted and unpolluted coastal areas of Sardinia (Italy). Boll. Soc. Paleontol. Ital. 2013, 52, 35–44. [Google Scholar]
- Damak, M.; Fourati, R.; Elleuch, B.; Kallel, M. Environmental quality assessment of the fish farms’ impact in the Monastir Bay (eastern of Tunisia, Central Mediterranean): A benthic foraminiferal perspective. Environ. Sci. Pollut. Res. 2020, 27, 9059–9074. [Google Scholar] [CrossRef]
- Fajemila, O.T.; Langer, M.R.; Lipps, J. Spatial Patterns in the distribution, diversity and abundance of benthic foraminifera around Moorea (Society Archipelago, French Polynesia). PLoS ONE 2015, 10. [Google Scholar] [CrossRef] [PubMed] [Green Version]
- Fossile, E.; Sabbatini, A.; Spagnoli, F.; Caridi, F.; Dell’Anno, A.; De Marco, R.; Dinelli, E.; Droghini, E.; Tramontana, M.; Negri, A. Sensitivity of foraminiferal-based indices to evaluate the ecological quality status of marine coastal benthic systems: A case study of the Gulf of Manfredonia (southern Adriatic Sea). Mar. Pollut. Bull. 2021, 163, 111933. [Google Scholar] [CrossRef] [PubMed]
- Johnson, J.; Perry, C.; Smithers, S.; Morgan, K.; Woodroffe, S. Reef shallowing is a critical control on benthic foraminiferal assemblage composition on nearshore turbid coral reefs. Palaeogeogr. Palaeoclim. Palaeoecol. 2019, 533. [Google Scholar] [CrossRef]
- Minhat, F.I.; Shaari, H.; Razak, N.S.A.; Satyanarayana, B.; Saelan, W.N.W.; Yusoff, N.M.; Husain, M.L. Evaluating performance of foraminifera stress index as tropical-water monitoring tool in Strait of Malacca. Ecol. Indic. 2020, 111. [Google Scholar] [CrossRef]
- Oliveira-Silva, P.; Barbosa, C.; De Almeida, C.M.; Seoane, J.C.S.; Cordeiro, R.; Turcq, B.J.; Soares-Gomes, A. Sedimentary geochemistry and foraminiferal assemblages in coral reef assessment of Abrolhos, Southwest Atlantic. Mar. Micropaleontol. 2012, 94–95, 14–24. [Google Scholar] [CrossRef]
- Rositasari, R.; Puspitasari, R.; Budiyanto, F.; Lestari, L. Ecological changes over a century in the western coastal area of Jakarta Bay: Based on a short core sample. In Proceedings of the 2nd International Conference on Chemistry, Chemical Process and Engineering, Yogyakarta, Indonesia, 14–15 August 2018; Fatimah, I., Kawasaki, H., Kamari, A., Chuenchom, L., Kurniawan, S.M.A., Sahroni, I., Musawwa, M., Eds.; AIP Publishing: Melville, NY, USA, 2018; Volume 2026. [Google Scholar]
- Yümün, Z.Ü.; Önce, M. Monitoring heavy metal pollution in foraminifera from the Gulf of Edremit (northeastern Aegean Sea) between Izmir, Balıkesir and Çanakkale (Turkey). J. Afr. Earth Sci. 2017, 130, 110–124. [Google Scholar] [CrossRef]


| Water Body Types | Natural Features |
|---|---|
| Classical estuary | Tidally dominated at the seaward part; salinity notably reduced by freshwater river inputs; riverine dominance landward |
| Lentic non-tidal lagoon | Limited exchange with the coastal area through a restricted mouth; separated from the sea by sand or shingle banks, bars, coral, etc., shallow area, tidal range < 50 cm |
| Lentic micro-tidal lagoon | As above but with tidal range > 50 cm |
| Fjord | Semi-enclosed marine basin, entrance sills separating deeper inner waters from adjacent coastal waters, restricted water circulation/oxygen renewal, sediment sequences removed by glacial erosion |
| Ria | Drowned river valley, some freshwater inputs; limited exchanges with coastal waters |
| Delta | Low energy, characteristically shaped, sediment dominated, river mouth area; estuary outflow |
| Coastal freshwater/brackish water plume | Outflow of estuary or lagoon, notably diluted salinity, and hence differing biota than surrounding coast |
| Semi-enclosed bay/lagoon | Low energy, notably limited exchange with the open sea waters |
| Artificial water body | Harbors and docks, constructed dredging pools, and coastal water bodies connected to the sea, created by human activities |
| EcoQS and Associated Color Code | Bad | Poor | Moderate | Good | High |
|---|---|---|---|---|---|
| TSI-med | <1 | 1–2 | 2–3 | 3–4 | >4 |
| FSI | >5.5 | 4.3–5.5 | 3.3–4.3 | 1.2–3.3 | <1.2 |
| Foram-AMBI | >5 | 3.2–5 | 1.8–3.2 | 0.9–1.8 | <0.9 |
| NQIf | <0.13 | 0.13–0.31 | 0.31–0.45 | 0.45–0.54 | >0.54 |
| EcoQS and Associated Color Code | Bad | Poor | Moderate | Good | High |
|---|---|---|---|---|---|
| H’log2 | <1.2 | 1.2–1.8 | 1.8–2.4 | 2.4–3.4 | >3.4 |
| ES100 | <9 | 9–11 | 11–13 | 13–18 | >18 |
| Exp(H’bc) (>125, living, Norwegian fjords) | <2.5 | 2.5–5 | 5–7.5 | 7.5–10 | >10 |
| Exp(H’bc) (>63, living, Norwegian fjords) | <5 | 5–10 | 10–15 | 15–20 | >20 |
| Exp(H’bc) (>63, living, Italian transitional waters) | <3 | 3–7 | 7–11 | 11–15 | >15 |
Publisher’s Note: MDPI stays neutral with regard to jurisdictional claims in published maps and institutional affiliations. |
© 2021 by the authors. Licensee MDPI, Basel, Switzerland. This article is an open access article distributed under the terms and conditions of the Creative Commons Attribution (CC BY) license (https://creativecommons.org/licenses/by/4.0/).
Share and Cite
O’Brien, P.A.J.; Polovodova Asteman, I.; Bouchet, V.M.P. Benthic Foraminiferal Indices and Environmental Quality Assessment of Transitional Waters: A Review of Current Challenges and Future Research Perspectives. Water 2021, 13, 1898. https://doi.org/10.3390/w13141898
O’Brien PAJ, Polovodova Asteman I, Bouchet VMP. Benthic Foraminiferal Indices and Environmental Quality Assessment of Transitional Waters: A Review of Current Challenges and Future Research Perspectives. Water. 2021; 13(14):1898. https://doi.org/10.3390/w13141898
Chicago/Turabian StyleO’Brien, Phoebe A. J., Irina Polovodova Asteman, and Vincent M. P. Bouchet. 2021. "Benthic Foraminiferal Indices and Environmental Quality Assessment of Transitional Waters: A Review of Current Challenges and Future Research Perspectives" Water 13, no. 14: 1898. https://doi.org/10.3390/w13141898