Article

Metabarcoding under Brine: Microbial Ecology of Five Hypersaline Lakes at Rottnest Island (WA, Australia)

1
Trace and Environmental DNA (TrEnD) Laboratory, School of Molecular and Life Sciences, Curtin University, Perth, WA 6102, Australia
2
Curtin Water Quality Research Centre, Curtin University, GPO Box U1987, Perth, WA 6845, Australia
3
Collections and Research Centre, Western Australian Museum, Welshpool, WA 6986, Australia
4
School of Biological Sciences, University of Western Australia, Crawley, WA 6009, Australia
5
Department of Life Sciences and Systems Biology, University of Torino, 10124 Torino, Italy
6
Lundbeck Foundation GeoGenetics Centre, GLOBE Institute, University of Copenhagen, Øster Voldgade 5-7, 1350 Copenhagen, Denmark
*
Author to whom correspondence should be addressed.
Water 2021, 13(14), 1899; https://doi.org/10.3390/w13141899
Submission received: 29 May 2021 / Revised: 5 July 2021 / Accepted: 6 July 2021 / Published: 9 July 2021
(This article belongs to the Special Issue Ecosystems of Inland Saline Waters)

Abstract

:
Hypersaline ecosystems—aquatic environments where concentration of salt exceeds 35 g L−1—host microbial communities that are highly specialised to cope with these extreme conditions. However, our knowledge on the taxonomic diversity and functional metabolisms characterising microbial communities in the water columns of hypersaline ecosystems is still limited, and this may compromise the future preservation of these unique environments. DNA metabarcoding provides a reliable and affordable tool to investigate environmental dynamics of aquatic ecosystems, and its use in brine can be highly informative. Here, we make use of bacterial 16S metabarcoding techniques combined with hydrochemical analyses to investigate the microbial patterns (diversity and functions) from five hypersaline lakes located at Rottnest Island (WA). Our results indicate lake-driven microbial aquatic assemblages that are characterised by taxonomically and functionally moderately to extremely halophilic groups, with TDS (total dissolved solids) and alkalinity amongst the most influential parameters driving the community patterns. Overall, our findings suggest that DNA metabarcoding allows rapid but reliable ecological assessment of the hypersaline aquatic microbial communities at Rottnest Island. Further studies involving different hypersaline lakes across multiple seasons will help elucidate the full extent of the potential of this tool in brine.

1. Introduction

Saline and hypersaline water bodies, environments where concentration of salt exceeds 35 g L−1, are global biodiversity hotspots of microbial organisms which play a crucial role in regulating the energy flows and the biogeochemical cycles of these lakes [1,2]. Given their ‘Mars-like’ conditions, hypersaline ecosystems are also used as models for astrobiological studies [3]. Investigations of these systems are breaking boundaries between disciplines (i.e., biogeochemistry, genetics, hydrology) but yet public awareness of their key role to humankind is lacking and this deficiency needs to be addressed [4]. DNA metabarcoding is widely employed as an ecological tool in many contexts and ecosystems (i.e., groundwater [5,6], marine [7,8], terrestrial [9,10] and freshwater [11,12]), and it is gaining prominence as an effective, robust and reliable biomonitoring technique [13]. However, despite its potential for gaining scientific insights into complex systems such as saline and hypersaline environments, its use in brine has been very limited.
Salinity is one of the key drivers of biodiversity patterns (i.e., adaptations, community assemblages, trophic interactions) in aquatic environments worldwide and this influence is expressed on hugely different spatial and temporal scales [14,15] due to saline lakes accounting for almost half (~44%) of the volume of inland waters on the planet [16]. Consequently, saline lakes are very important aquatic ecosystems [17] despite which they remain sparsely studied, especially relative to their freshwater counterparts [18]. This disparity is particularly unfortunate when considering that saline lakes host both valuable resources (i.e., minerals) and diverse and increasingly pressured ecosystems [4].
Persistent saline (salt) lakes are typically endorheic and will thus fill with sediment over geological time [19]. They exhibit vertical stratification of physicochemical parameters, similar to permanent bodies of standing freshwater, but differ primarily in the ionic composition of the water, having much higher salinities, typically greater than 3 g/L to hypersaline [20]. Variation in salinity also influences dissolved oxygen (DO) availability because the oxygen saturation level is inversely related to salinity—so the concentration of DO in seawater is only ~80% compared to that found in freshwater systems [21,22]. While the salinities of deep saline lakes show only slight variation over time, the shallower a saline lake is, the greater the spatial and temporal variation in salinity will be, as observed through seasonal and annual trends [23,24,25].
Saline lakes can be very large but, despite the great size, their area can fluctuate markedly owing to their general shallowness [26]. These oscillations regulate the ecological balances sustaining energy flows and biodiversity patterns in hypersaline lakes, which are particularly vulnerable to anthropogenic changes to inflow, as was most graphically realised by a decline of 90% in the area of the Aral Sea in Kazakhstan and Uzbekistan in the late 20th century over a period of barely 50 years [27,28].
Rottnest Island offshore from the city of Perth in Western Australia is a natural reserve providing habitat for the marsupials Setonix brachyurus (Lesson, 1842)—commonly known as quokka—and migratory wading birds, and it provides key touristic attraction for the area. More importantly, the island hosts several inland wetlands such as swamps and lakes, including several hypersaline lakes, six of them being permanent (Rottnest Island Authority). Here, groundwater lenses—generated by the high permeability of the widespread Tamala Limestone—are recharged via rainfall and discharge into some of the hypersaline lakes [29]. Recent molecular and biogeochemical investigations have indicated that the permanent hypersaline lakes at Rottnest Island host heterogeneous and delicate microbial communities including lithifying and non-lithifying microbial mats [30], together with spherulitic microbialites [31].
Nonetheless, our understanding of the broader taxonomic and functional spectrum of hypersaline microbiota inhabiting the water of these lakes at Rottnest Island remains incomplete. This study aims to expand the current limited knowledge of such unique systems by incorporating environmental DNA (eDNA) extracted from hypersaline water samples and analysed with bacterial 16S metabarcoding to characterise the ecological dynamics of the microbial communities hosted by the hypersaline lakes at Rottnest Island. The specific objectives of this study are: (1) To test the use of metabarcoding techniques as a biomonitoring tool in high salt-water conditions; (2) to investigate the diversity of the resident microbial communities in five hypersaline lakes and assess the ecological key drivers determining the taxonomic composition; (3) to study the ecological and metabolic functioning of the microbial communities identified across the lakes.
Our findings indicate that the hypersaline lakes provide different environmental matrices hosting (both taxonomically and functionally) diverse aquatic microbial communities. Our results also show that DNA metabarcoding can provide a useful tool to investigate the ecological dynamics shaping microbial community assemblages and energy flows across the five hypersaline lakes studied at Rottnest Island.

2. Materials and Methods

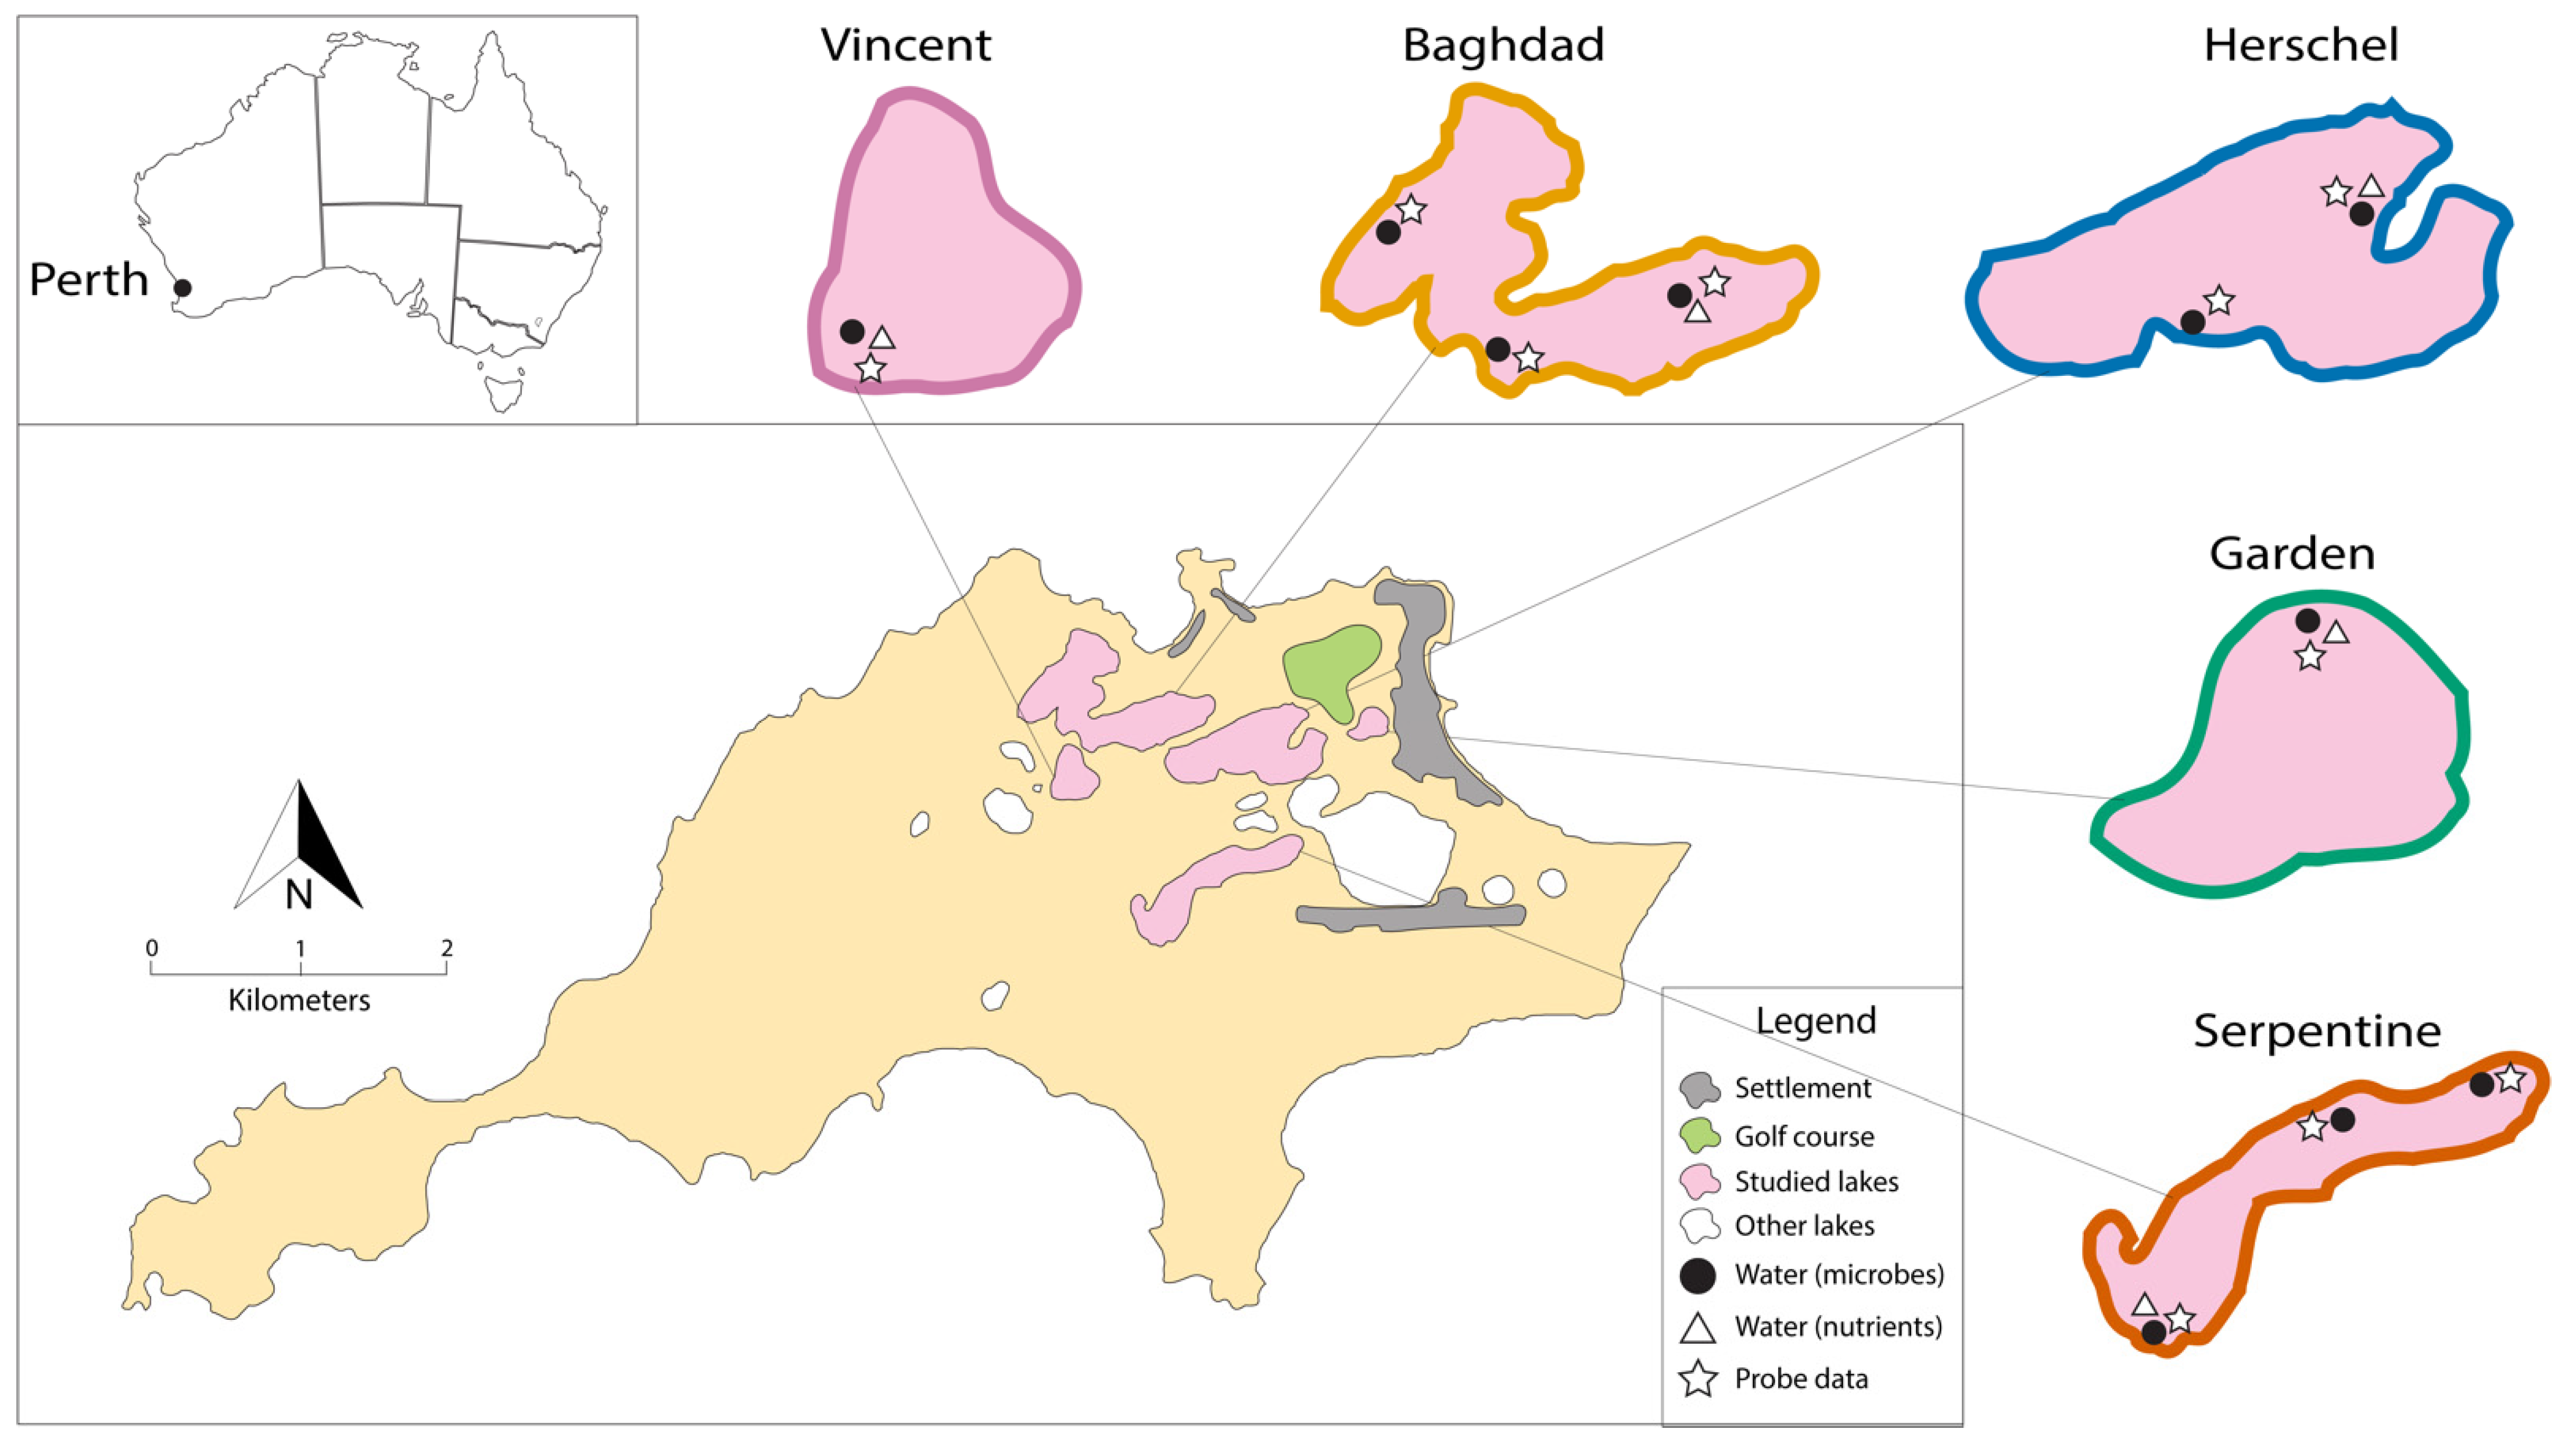
2.1. Study Area and Fieldwork

The fieldwork was carried out at Rottnest Island, located 18 km off the coast of Perth (Western Australia; 32°00′7.20″ S, 115°31′1.20″ E) (Figure 1). The island is protected under the highest level for public land in Western Australia (A-class reserve) under the Land Administration Act 1997, and hosts six permanent hypersaline lakes covering approximately 10% of the island’s surface area [32]. Believed to be partially filled remnants of ‘blue holes’, these systems are a result of the influence of quaternary sea level fluctuations on repeated carbonate deposition and dissolution cycles [33], resembling the conformation of the Houtman Abrolhos reefs located 450 km north of Rottnest Island [29,34].
Hydrochemical and biological samples were collected from five hypersaline lakes (Garden Lake, Herschel Lake, Lake Baghdad, Lake Vincent and Serpentine Lake) in November 2020, applying a sampling effort proportional to the size of the lakes and with a maximum of 500 m between sampling sites [35]. In situ measurements were taken for conductivity (μS/cm), salinity (PSU), temperature (°C), dissolved oxygen (mg L−1) and pH using a Hanna multiple parameter meter in each lake. Water samples for nutrients, alkalinity, total solids and fluorescence analyses were collected in 1 L HDPE bottles (three 1 L samples per each lake; n = 15), frozen immediately after collection and stored in darkness. Five additional 1 L samples (n = 50) were also collected within multiple sampling points (SP) across the five lakes (Garden: 1 SP; Herschel: 2 SP; Baghdad: 3 SP; Vincent: 1 SP; Serpentine: 3 SP) (Figure 1) for bacterial 16S DNA metabarcoding. All samples were frozen until further processing in the Trace and Environmental DNA laboratory (TrEnD) at Curtin university in Perth, Western Australia.

2.2. Laboratory Work, Data Analysis and Statistical Tests

2.2.1. Hydrochemical Analysis

Samples for hydrochemical tests were filtered through a Thermo choice 25 mm, 0.45 μm PES syringe filter prior to analysis. Excitation–emission matrices (EEMs) were generated for each sample over excitation wavelengths between 200 and 400 nm in 5 nm intervals and emission wavelengths between 300 and 550 nm in 1 nm intervals, with 5 nm bandwidths on excitation and emission modes using a Varian Cary Eclipse spectrofluorometer. EEMs were corrected for instrumental differences with Milli-Q water blank subtraction. Non-purgeable organic carbon (NPOC) was analysed using high temperature catalytic combustion with non-dispersive infrared detection on a Shimadzu total organic carbon analyser (TOC-L). Sample preparation for the NOPC involved acidifying and purging with purified air to remove inorganic carbon. Sample acidification was performed with sulfuric acid (9N), which was used to modify the sample matrix. The concentration of ions (SO42−, Br and Cl) was measured using a Dionex ICS 3000 IC system (Conductivity and UV detectors) (Thermo Fisher Scientific, Sunnyvale, CA, USA). Separation of ions was conducted using an IonPac AS9-HC ion chromatography column (4 × 250 mm) with an IonPac AG9-HC (4 × 50 mm) guard column (Dionex). The mobile phase (9 mM) was generated using a sodium carbonate and sodium hydroxide eluent at a flow rate of 1.0 mL min−1. Concentrations were determined from analytical standards, with linearisation > R2 = 0.99. Total alkalinity (Alk) was determined through titration of 25 mL of filtered sample with standardised hydrochloric acid (0.05 M) to the endpoint with bromocresol green indicator. Ammonia (NH3) concentrations were determined with the phenol colorimetric method. Evaporative analysis was used to determine the total dissolved solids (TDS) values. Precise volumes were measured by using a 5 mL pipette, dried at 150 °C for a minimum of 6 h and weighed using an electronic scale, calibrated to 0.1 and 50 mg respectively.

2.2.2. Genetic Investigations

Water samples were used for bacterial 16S metabarcoding and microbial functional analysis. Five 1-litre water sample replicates (n = 50) from the five lakes (Garden, Vincent, Serpentine, Herschel and Baghdad; Figure 1) were investigated. Water samples were filtered using two Sentino peristaltic microbiology pumps (Pall Life 126 Sciences, New York, NY, USA), through 0.45 μm sterile membrane filters (Pall Life Sciences, New York, NY, USA). All water-filtering equipment were soaked for a minimum of 10 min in 10% sodium hypochlorite solution and treated with UV light prior to use and between sample replicates (n = 5) for each SP. Immediately post-filtering, half of the filter membrane was used for DNA extraction, while the remaining half was frozen at −20 °C. Water membranes, inclusive of laboratory controls, were extracted using DNeasy Blood and Tissue Kit (Qiagen; Venlo, The Netherlands), with the following modifications to the manufacturer’s protocol.
For the DNA digest from water samples, both the ATL buffer (360 μL) and Proteinase K (40 μL) solutions were doubled to ensure that the samples were adequately exposed to the lysis solution to optimise DNA yield. The DNA digests were incubated (56 °C) overnight in a rotating hybridisation oven. The digest was transferred into a clean tube and loaded into a QIAcube (Qiagen; Venlo, The Netherlands) automated DNA extraction system for the remainder of the extraction process. The DNA was eluted off the silica column in 100 μL AE buffer.
The quality and quantity of DNA extracted from each sample was measured using quantitative PCR (qPCR), targeting the bacterial 16S gene. The PCR master mixes used to assess the quality and quantity of the DNA target of interest via qPCR (Applied Biosystems [ABI], Foster City, CA, USA) were carried out in 25 μL reaction volumes consisting of 2 mM MgCl2 (Fisher Biotec, Perth, WA, Australia), 1 × PCR Gold Buffer (Fisher Biotec, Perth, WA, Australia), 0.4 μM dNTPs (Astral Scientific, Taren Point, NSW, Australia), 0.1 mg bovine serum albumin (Fisher Biotec, Perth, WA, Australia), 0.4 μM of each primer (Bact16S_515F and Bact16S_806R; [36,37]), 0.2 μL of AmpliTaq Gold (AmpliTaq Gold, ABI, Brisbane, Qld, Australia) and 2 μL of template DNA (Neat, 1/10, 1/100 dilutions). The cycling conditions were as follows: initial denaturation at 95 °C for 5 min, followed by 40 cycles of 95 °C for 30 s, 52 °C for 30 s, 72 °C for 30 s and a final extension at 72 °C for 10 min.
Extracts that successfully yielded DNA of sufficient quality, free of inhibition, as determined by the initial qPCR screen (detailed above), were assigned a unique 6–8 bp multiplex identifier tag (MID-tag) with the bacterial 16S primer set. Independent MID-tag qPCRs for each sample were carried out in 25 μL reactions containing 1 × PCR Gold Buffer, 2.5 mM MgCl2, 0.4 mg mL−1 BSA, 0.25 mM of each dNTP, 0.4 μM of each primer, 0.2 μL AmpliTaq Gold and 2–4 μL of DNA as determined by the initial qPCR screen. The cycling conditions for qPCR using the MID-tag primer sets were as described above. MID-tag PCR amplicons were generated in duplicate for each sample and the bacterial 16S library was pooled in equimolar ratio post-PCR for DNA sequencing. The final library was size selected (160–600 bp) using Pippin Prep (Sage Sciences, Beverly, MA, USA) to remove any MID-tag primer-dimer products that may have formed during amplification. The final library concentration was determined using a QuBitTM 4 Fluorometer (Thermo Fischer, Melbourne, Australia) and sequenced using a 500 cycle V2 kit on an Illumina MiSeq platform (Illumina, San Diego, CA, USA).
MID-tag bacterial 16S sequence reads obtained from the MiSeq were sorted (filtered) back to the water sample based on the MID-tags assigned to each DNA extract using Geneious v10.2.5 [38]. MID-tag and primer sequences were trimmed from the sequence reads allowing for no mismatch in length or base composition.
Filtered reads were input into the automated workflow ‘eDNAFlow’ [39] which comprises USEARCH [40] and BLASTN [41]. The fastx-uniques, unoise3 (with minimum abundance of 4) and otutab commands of USEARCH were applied to generate unique sequences, ZOTUs (zero-radius OTUs) and abundance table, respectively. The ZOTUs were compared against the nucleotide database using the following parameters in BLASTN: perc_identity > = 94, evalue < = 1 × 10⁻³, best_hit_score edge 0.05, best_hit_overhang 0.25, qcov_hsp_perc 100, max_target_seqs = 5. An inhouse Python script was used to assign the ZOTUs to their lowest common ancestor (LCA). The threshold for dropping a taxonomic assignment to LCA was set to perc_identity > = 96 and the difference between % identity of the two hits when their query coverage is equal was set to 1. To generate predicted metagenome profiles, 16S metabarcoding data were processed through the Phylogenetic Investigation of Communities by Reconstruction of Unobserved States 2 (PICRUSt2) pipeline [42]. These profiles were clustered into Kyoto Encyclopedia of Genes and Genomes (KEGG) Orthologs (KOs) [43] for downstream analysis.

2.2.3. Statistical Analysis

All statistical analyses were performed with R 4.0.5 [44] if not further specified. The values of the hydrochemical parameters (pH, DO, temperature, alkalinity, NH3, TDS, Cl, Br, SO42−, DOC and TN) (collected in duplicates or triplicates) were compared across lakes through ANOVAs and Tukey’s HSD tests (R package ‘stats’ [44])). OTU level diversity indices α-diversity, Shannon diversity index (H) and Pielou’s evenness index (J) per each lake were calculated with the R package ‘vegan’ [45]. Comparison of the values of the diversity indices across lakes was carried out through ANOVAs and Tukey’s HSD tests. Principal coordinate analysis (PCoA) was used to visualise patterns in community composition of microbial communities in water (R package ‘stats’ [44]). PCoA was performed on distances calculated from a phylogenetic tree using the ‘Unifrac’ metric [46]. Permutational multivariate analysis of variance (PERMANOVA, R package ‘vegan’ [45]) was performed to investigate the potential clustering trends across lakes and pairwise post hoc pairwise multilevel comparisons were carried out [47]. The phylogenetic tree was generated with the q2-fragment-insertion [48] plugin implemented in QIIME2 [49]. This plugin performs the phylogenetic placement of operational taxonomic units on an existing reference tree. This method provides better results when compared to reconstructing de novo phylogenies [48]. Greengenes 13_8 was used as the reference database [50]. Phylogenetic diversity, mean pairwise phylogenetic distances and mean nearest phylogenetic taxon distances [51] were calculated with the R package ‘picante’ [52] starting from the phylogenetic tree generated with the phylogenetic placement. These metrics aid to explore the ecological and evolutionary patterns generating biological communities and, unlike taxonomic-based measures of diversity, take into account the phylogenetic relationship among species [53,54]. ANOVAs and Tuckey’s HSD tests (R package ‘stats’ [44]) were performed to compare the values of the generated phylogenetic metrics across lakes.
A Monte Carlo approach was used to relate environmental variables to the PCoA because the number of water samples did not match the number of biological samples. For each lake, random values were generated with the function rnorm using mean and standard deviation of environmental variables as input. The function envfit from the R package ‘vegan’ [45] was then used to fit the randomly generated numbers to the PCoA ordination. This process was repeated 1000 times and the result of each iteration stored. Results are summarised as the 0.025, 0.5 and 0.975 quantiles of the squared correlation coefficient (r2).
Differential abundance analysis was performed by using DESeq2 [55] and Phyloseq [56] with a significance level set to 0.05. Metagenomic profiles bioinformatics software package STAMP [57] was used to visualise PCA (principal component analysis) and determine statistically significant results from the PICRUSt2 output [58]. For comparison of potential microbial metabolic shifts across lakes, ANOVAs with post hoc Tukey-Kramer tests (confidence intervals of 95%) were performed.

3. Results

3.1. Biogeochemical Conditions

Biogeochemical conditions of the lakes are given in Table 1. The pH values ranged from 6.16 in Lake Vincent to 6.70 in Garden Lake, with the exception of Lake Baghdad being more alkaline at 9.34. The DO values ranged from 1.84 mg L−1 in Herschel Lake to 3.57 mg L−1 in Lake Baghdad. Total alkalinity of the lake water ranged from 183.49 mg L−1 in Garden Lake to 224.20 mg L−1 in Serpentine Lake. Ammonia concentrations ranged from 0.21 mg L−1 in Garden Lake to 0.35 mg L−1 Herschel Lake. Total dissolved solids ranged from 118 mg L−1 in Garden Lake to 186.67 mg L−1 in Serpentine Lake. Chloride ion concentrations ranged from 81.22 g L−1 in Garden Lake to 147.01 g L−1 in Herschel Lake. Bromide ion centration ranges from 0.2 g L−1 in Garden Lake to 0.36 g L−1 in Herschel Lake. Sulphate ion concentrations ranged from 40.3 g L−1 Herschel Lake to 12.17 g L−1 in Serpentine Lake. Interestingly, Herschel Lake recorded the lowest sulphate concentration, while possessing the highest abundance of chloride, bromide and DOC. DOC ranged from 30.2 mg L−1 in Garden Lake to 63.6 mg L−1 in Herschel Lake.
Total nitrogen concentration trends partially mirrored that of DOC, with the lowest recorded quantity present in Garden Lake, 3.3 mg L−1, and the highest in Lake Vincent with 8.3 mg L−1. Excitation-emission matrix plots (EEMs) indicated that Herschel Lake had a slight development of aromatic protein-like organic material (emission 315–350, excitation 220–240), with no other distinctive formation (Figure S1). Lake Vincent showed the greatest development in distinctive fluorescent organic material. It developed aromatic protein-like and humic/fulvic acid-like organic material (emission 425–475, excitation 230–260), as well as slight formation of soluble microbial product-like material (emission 300–330, excitation 260–280). Both Garden Lake and Serpentine Lake showed no distinctive organic material development. Lake Baghdad indicated a slight formation of aromatic protein-like and humic/fulvic acid-like organic material. Overall, each lake displayed similar trends towards aromatic and humic/fulvic acid-like organic material formation, with Garden Lake the least developed and Lake Vincent indicating the strongest development.

3.2. Microbial Community in Water

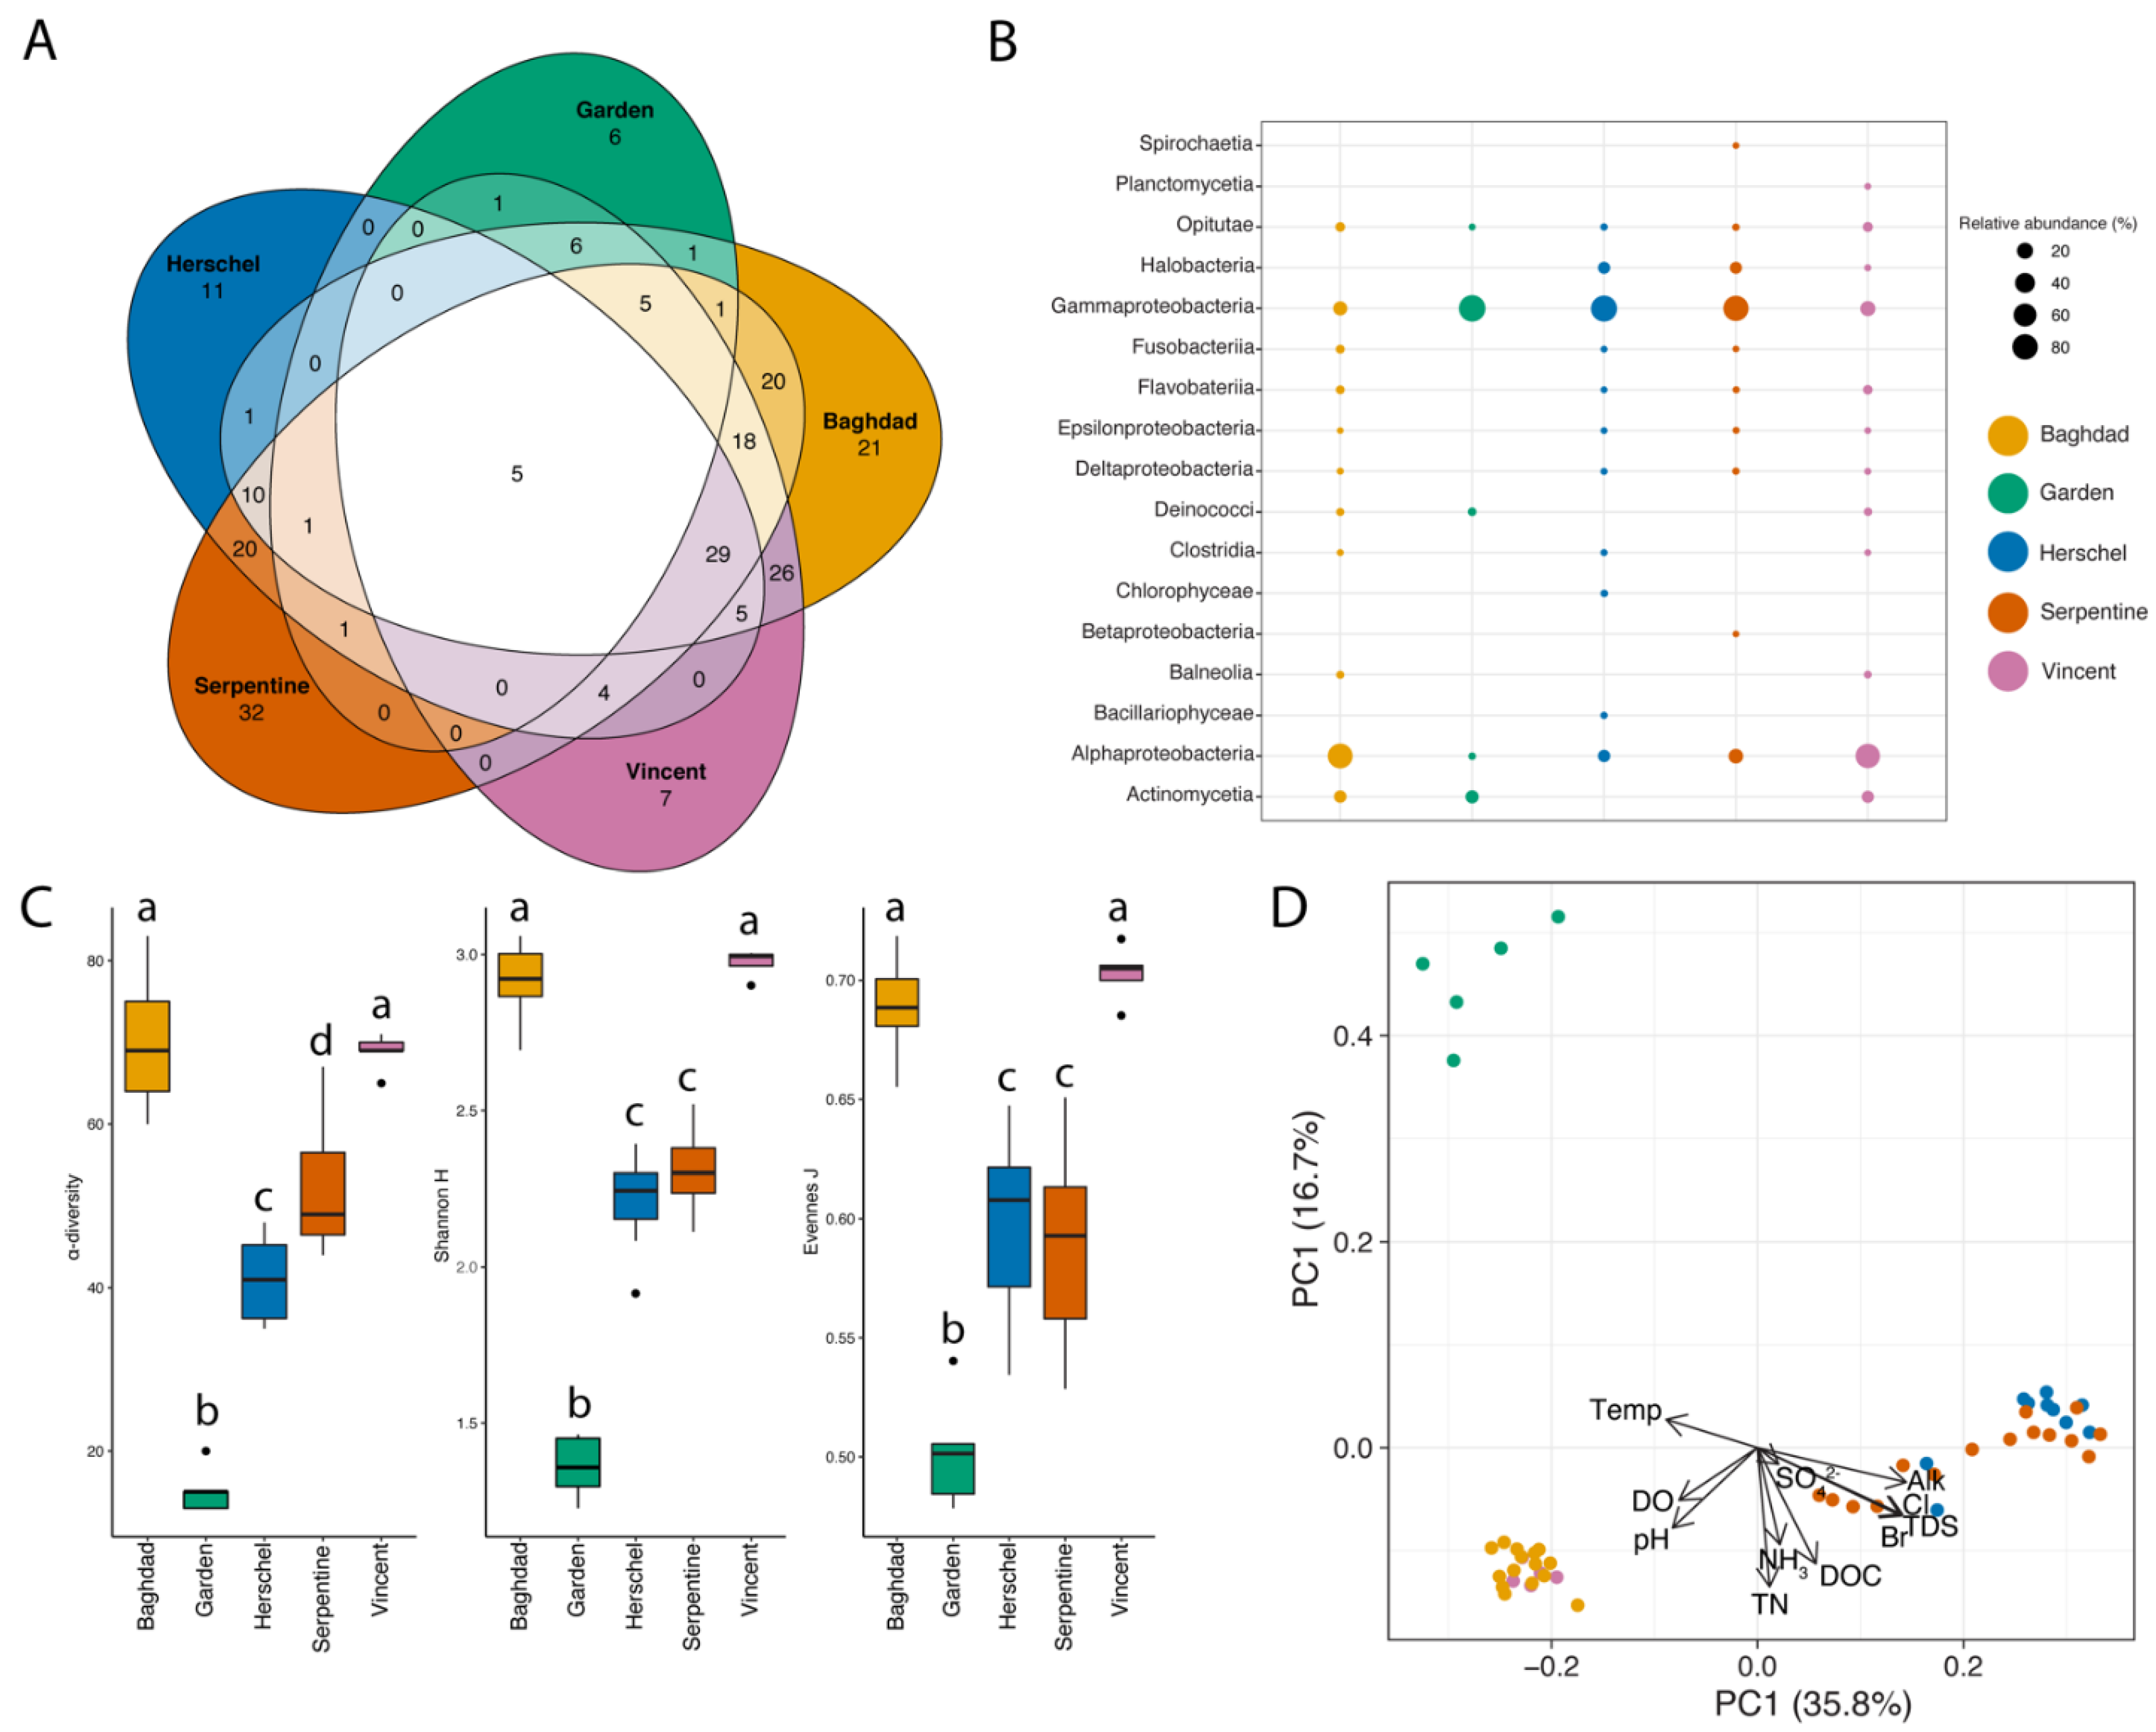
3.2.1. Community Assemblages and Environmental Drivers

The 16S rRNA sequencing on the water samples identified 1050 ZOTUs. After the removal of the ZOTUs associated with the lab controls (n = 2) and ZOTUs which belonged to uncultured bacteria or without available reference, 21 ZOTUs were unique to Lake Baghdad, 6 ZOTUs to Garden Lake, 11 ZOTUs to Herschel Lake, 32 ZOTUs to Serpentine Lake and 7 ZOTUs were unique to Lake Vincent (Figure 2A). The aquatic microbial communities from the five hypersaline lakes at Rottnest Island were predominantly composed of Bacteria (55.56%) and Archaea (44.44%). At class level, Gammaproteobacteria (51.63%), Alphaproteobacteria (37.53%) and Actinomycetia (6.22%) accounted for the 95% of the abundances detected. At family level, the most abundant taxa across the five lakes were Rhodobacteraceae (45.6%), followed by Ectothiorhodospiraceae (35.06%) and Halomonadaceae (4.24%).
At Lake Baghdad, the dominant ZOTUs belonged to the class Alphaproteobacteria (74.58%, composed at 98.65% by Rhodobacteraceae), followed by Gammaproteobacteria (12.57%, dominant families Ectothiorhodospiraceae, Alteromonadaceae, Halomonadaceae) and Actinomycetia (7.7%), with the rest of classes (8 in total) accounting for less than 6% of the total; a similar trend was observed at Vicent Lake (12 classes and same dominant families as per Lake Baghdad). Garden Lake revealed the least diverse aquatic microbial community (5 classes in total) with Gammaproteobacteria (89.18%, dominant families Francisellaceae, Vibrionaceae and Halomonadaceae) and Actinomycetia (9.7%) dominating the aquatic microbial community. At Herschel Lake, Gammaproteobacteria (84.91%, composed at 97.57% by Ectothiorhodospiraceae), Alphaproteobacteria (7.38%, families Rhodobacteraceae and Rhodospirillaceae) and Halobacteria (6.97%, family Halorubraceae) accounted for the 99% of the abundances (11 classes in total), same pattern observed at Serpentine Lake (10 classes in total: Gammaproteobacteria, 78.26%; Alphaproteobacteria, 14.5%; Halobacteria, 6.75%, same dominant families) (Figure 2B). The distribution of the relative abundances across the wetlands at family and genus levels can be found in Figure S2, and the log2fold comparisons at the same taxonomic depths are displayed in Figure S3A–I. Genus Francisella was the only taxa consistently more abundant (p < 0.05) at Garden Lake when compared to the other wetlands, where the conventional halophilic genera (i.e., families Rhodobacteraceceae and Ectothiorhodospiraceae) were significantly more abundant instead (p < 0.05). Compared to Lake Baghdad and Lake Vincent, Serpentine and Herschel lakes were more abundant (p < 0.05) in genera Spiribacter, Rhodovibrio and Halobrorum. Serpentine Lake was more abundant (p < 0.05) in Proteobacteria genera Roseiviviax, Roseibaca and Halomonas than Herschel Lake.
Garden Lake showed the lowest diversity indices (a-diversity, H and J, Figure 2C), with their values significantly lower than the other four lakes (Tukey’s HSD test, p < 0.05). Diversity indices at Herschel and Serpentine lakes had similar values, which were statistically lower than those of Vincent and Baghdad lakes. The ZOTU-based assessments aligned with our phylogenetic tests (PD, MTD and MNTD, Figure S4 and Table S5), depicting three groups: Garden, Baghdad together with Vincent and Herschel with Serpentine. Overall, microbial taxa at Garden Lake displayed the lowest values of phylogenetic diversity (PD), mean pairwise distance (MTD) and mean nearest taxon distance (MNTD), indicating that here the aquatic microbial community is both the least phylogenetically diverse and the one hosting microbial taxa differing the most amongst each other from an evolutionary perspective. The phylogenetically based ordination depicted microbial communities clustering differently across lakes (PERMANOVA, p < 0.005; Figure 2D), but pairwise comparisons indicated that only Baghdad and Vincent lakes were grouped together (p = 0.142), with the rest of systems clustering separately (p < 0.05).
TDS, alkalinity and anions Br and Cl were the primary and more reliable factors driving the clustering of the aquatic microbial assemblages between Garden, and Herschel and Serpentine lakes (see Table S4 for the r2 values of the environmental parameters within the three conventional quantiles), while the high pH and DO aligned with the community clustering of Baghdad and Vincent lakes.

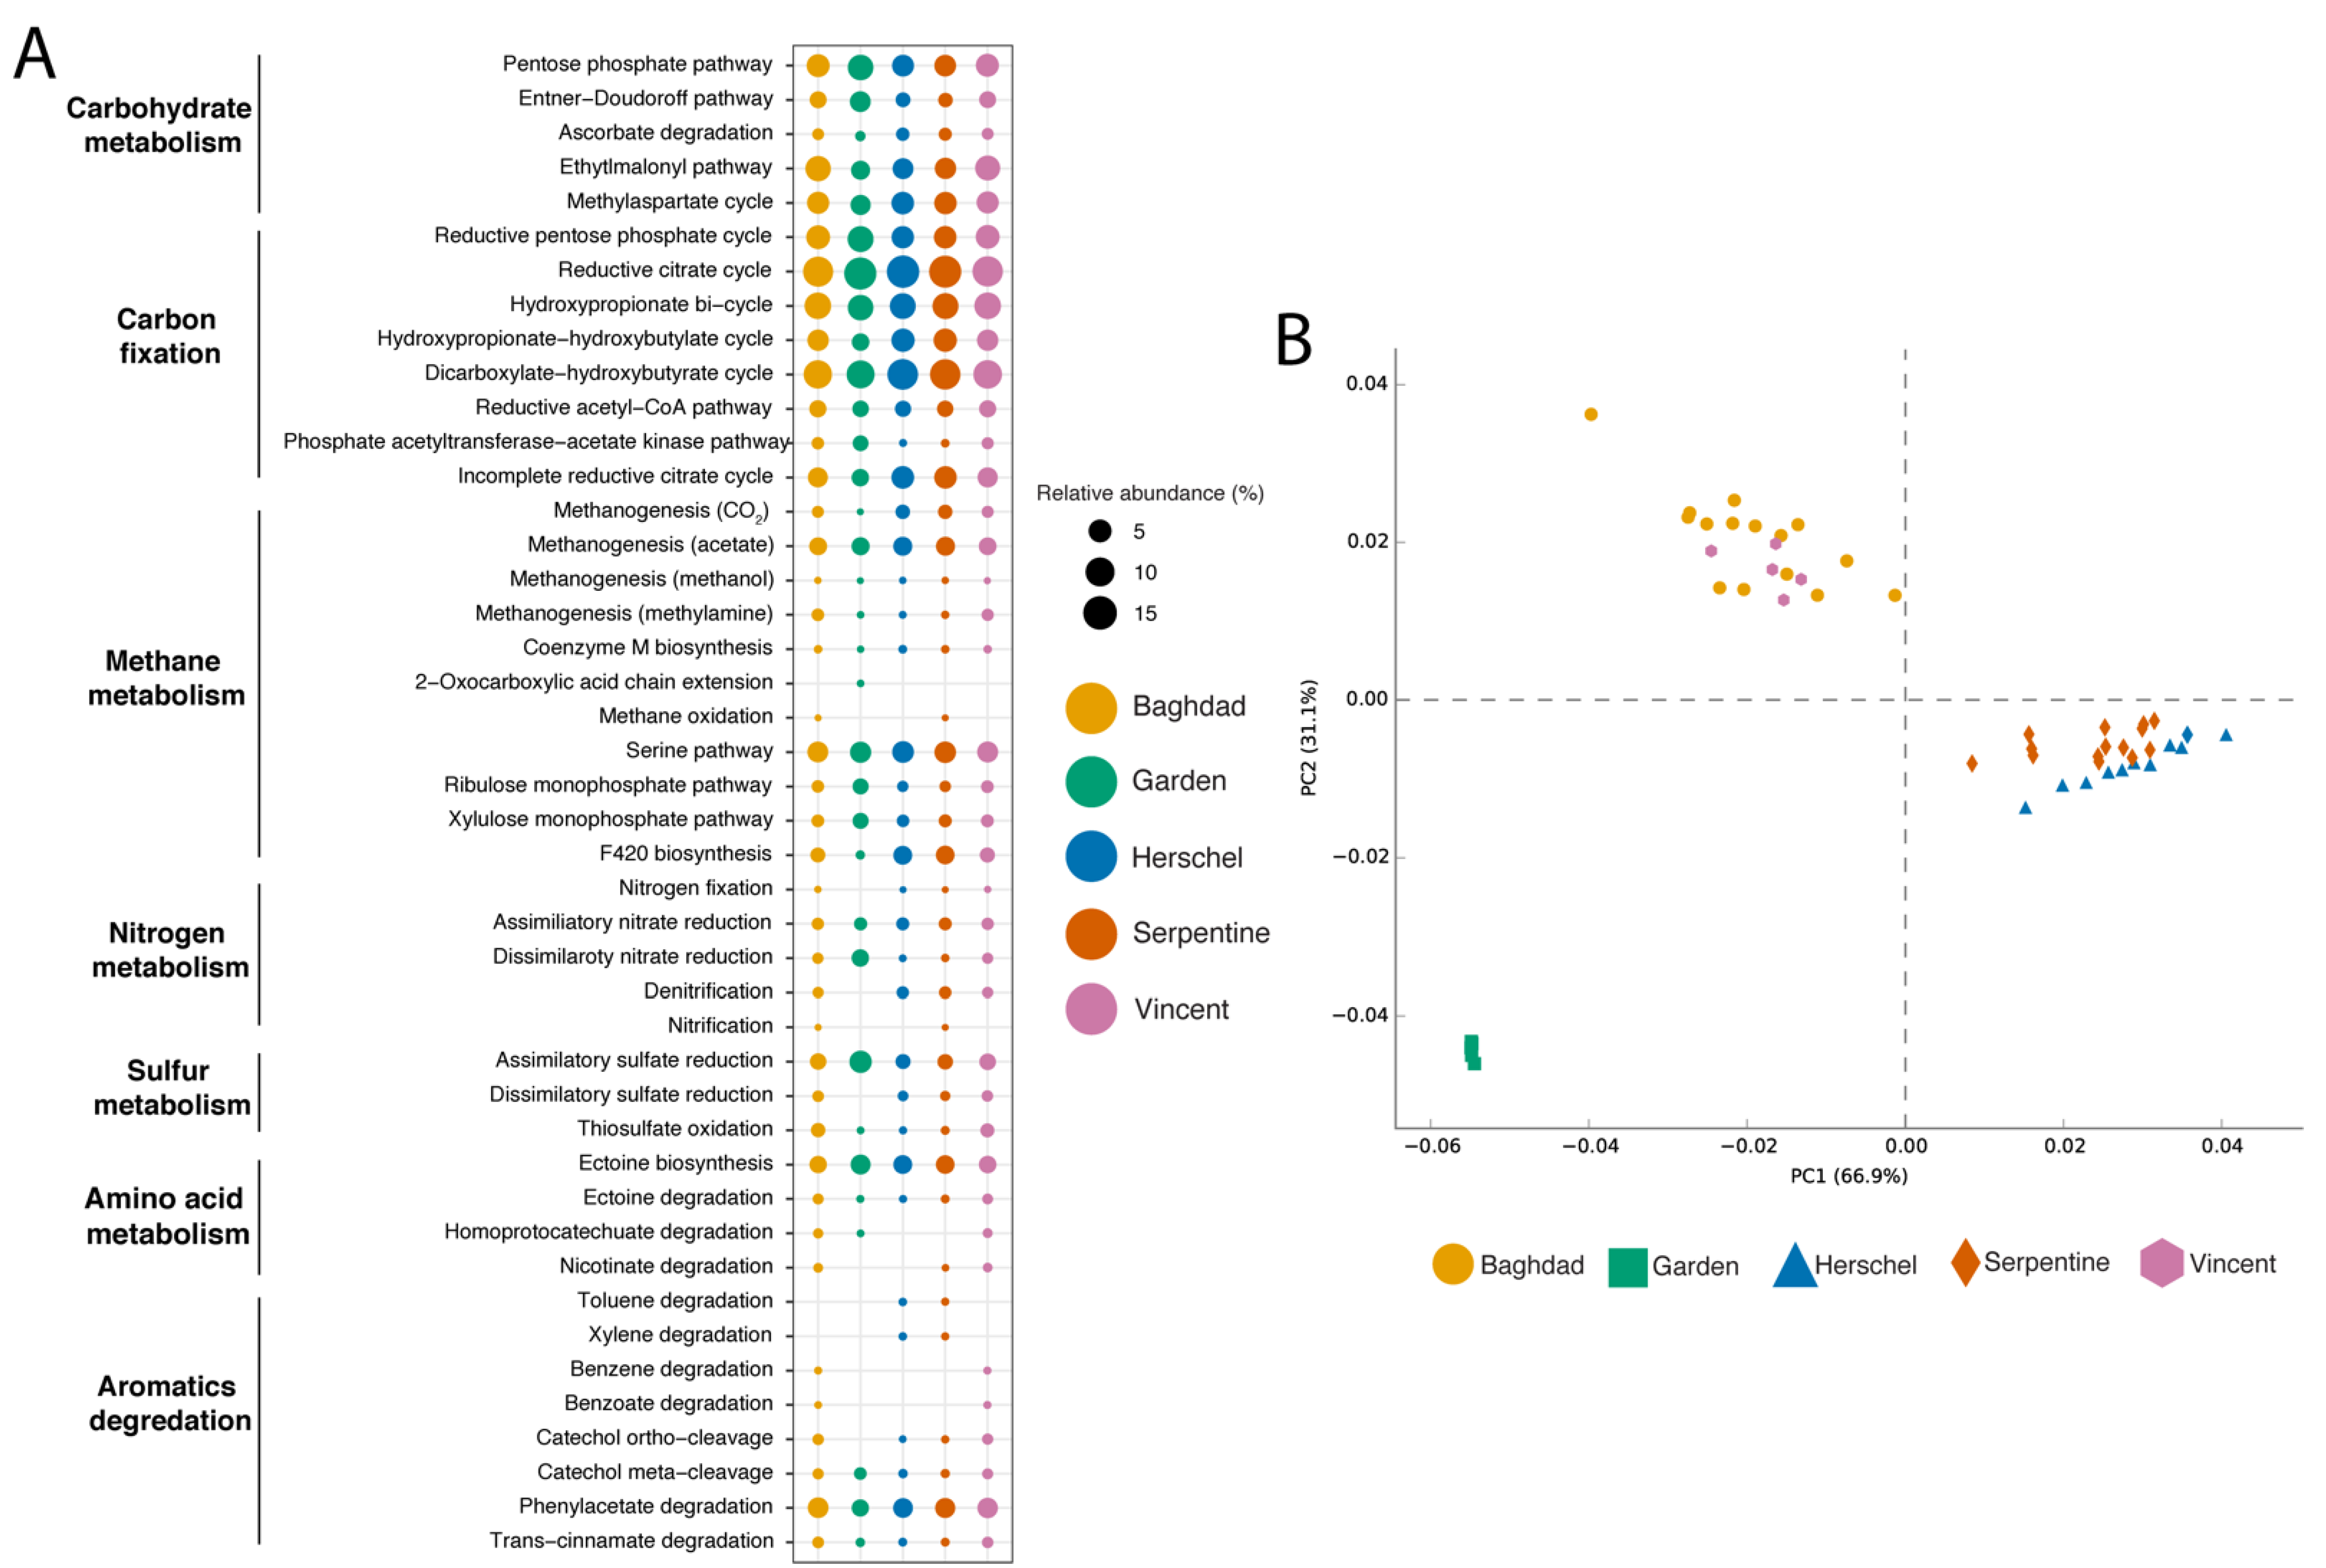
3.2.2. Predicted Functional Metabolisms

Relative abundances of potential functional metabolisms varied between lakes, but similarities were observed between Baghdad and Vincent lakes, as well as between Herschel and Serpentine lakes (Figure 3B). Carbohydrate metabolisms varied between lake communities, with the pentose phosphate pathway (6.13 ± 1.09%) being overall the most abundant and highest in Garden Lake at 8.16%. However, the ethylmalonyl pathway (5.71 ± 1.82%) was significantly abundant in the Baghdad and Vincent lakes, 8.01% and 7.68% (p < 0.001), respectively. Similarly, the methylaspartate cycle (5.27 ± 0.59%) was significantly more abundant in the Herschel and Serpentine lakes, 5.73% and 5.67% (p < 0.001), respectively. Carbon fixation pathways showed similar distributions between lake communities with the reductive citrate cycle (14.13 ± 1.11%) being the most abundant; the dicarboxylate-hydroxybutyrate cycle (11.66 ± 1.11%) and hydroxypropionate bi-cycle (8.64 ± 1.17%) were also abundantly observed. Pathways associated with methane metabolism indicated that the serine pathway (4.81 ± 0.23%), as well as methanogenesis of acetate (3.07 ± 0.31%), were most prominent. F420 biosynthesis (1.95 ± 1.2%) was found to be significantly predicted in the Herschel and Serpentine lakes, 3.31% and 3.24% (p < 0.001), respectively (Figure 3A).
Furthermore, the methanogenesis of carbon dioxide was also abundant in Herschel and Serpentine lakes, 1.33% and 1.3%, respectively. Methanogenesis of methylamines was abundant in Baghdad and Vincent lakes, 0.76% and 0.65%, respectively. Nitrogen metabolisms were not prominent across lake communities, however dissimilatory nitrate reduction was significantly predicted in Garden Lake at 2.58% (p < 0.001). Assimilatory sulphate reduction was the most frequently predicted sulphur metabolism (2.62 ± 1.5%) found across the lake communities, being highest in Garden Lake at 5.59%. Additionally, thiosulfate oxidation was significantly higher in Baghdad and Vincent lakes, 1.3% and 1.16% (p < 0.001), respectively. Ectoine biosynthesis (3.13 ± 0.52%) was an abundant amino acid metabolism predicted in all the lake communities. Phenylacetate degradation (3.83 ± 0.7%) was the most abundant aromatic degradation pathway predicted in all the lake communities (Figure 3A). Many aromatic degradation pathways were not predicted for Garden Lake. Interestingly, toluene and xylene degradation were only predicted in Herschel and Serpentine lakes, whereas benzene and benzoate degradation were only predicted in Baghdad and Vincent lakes.

4. Discussion

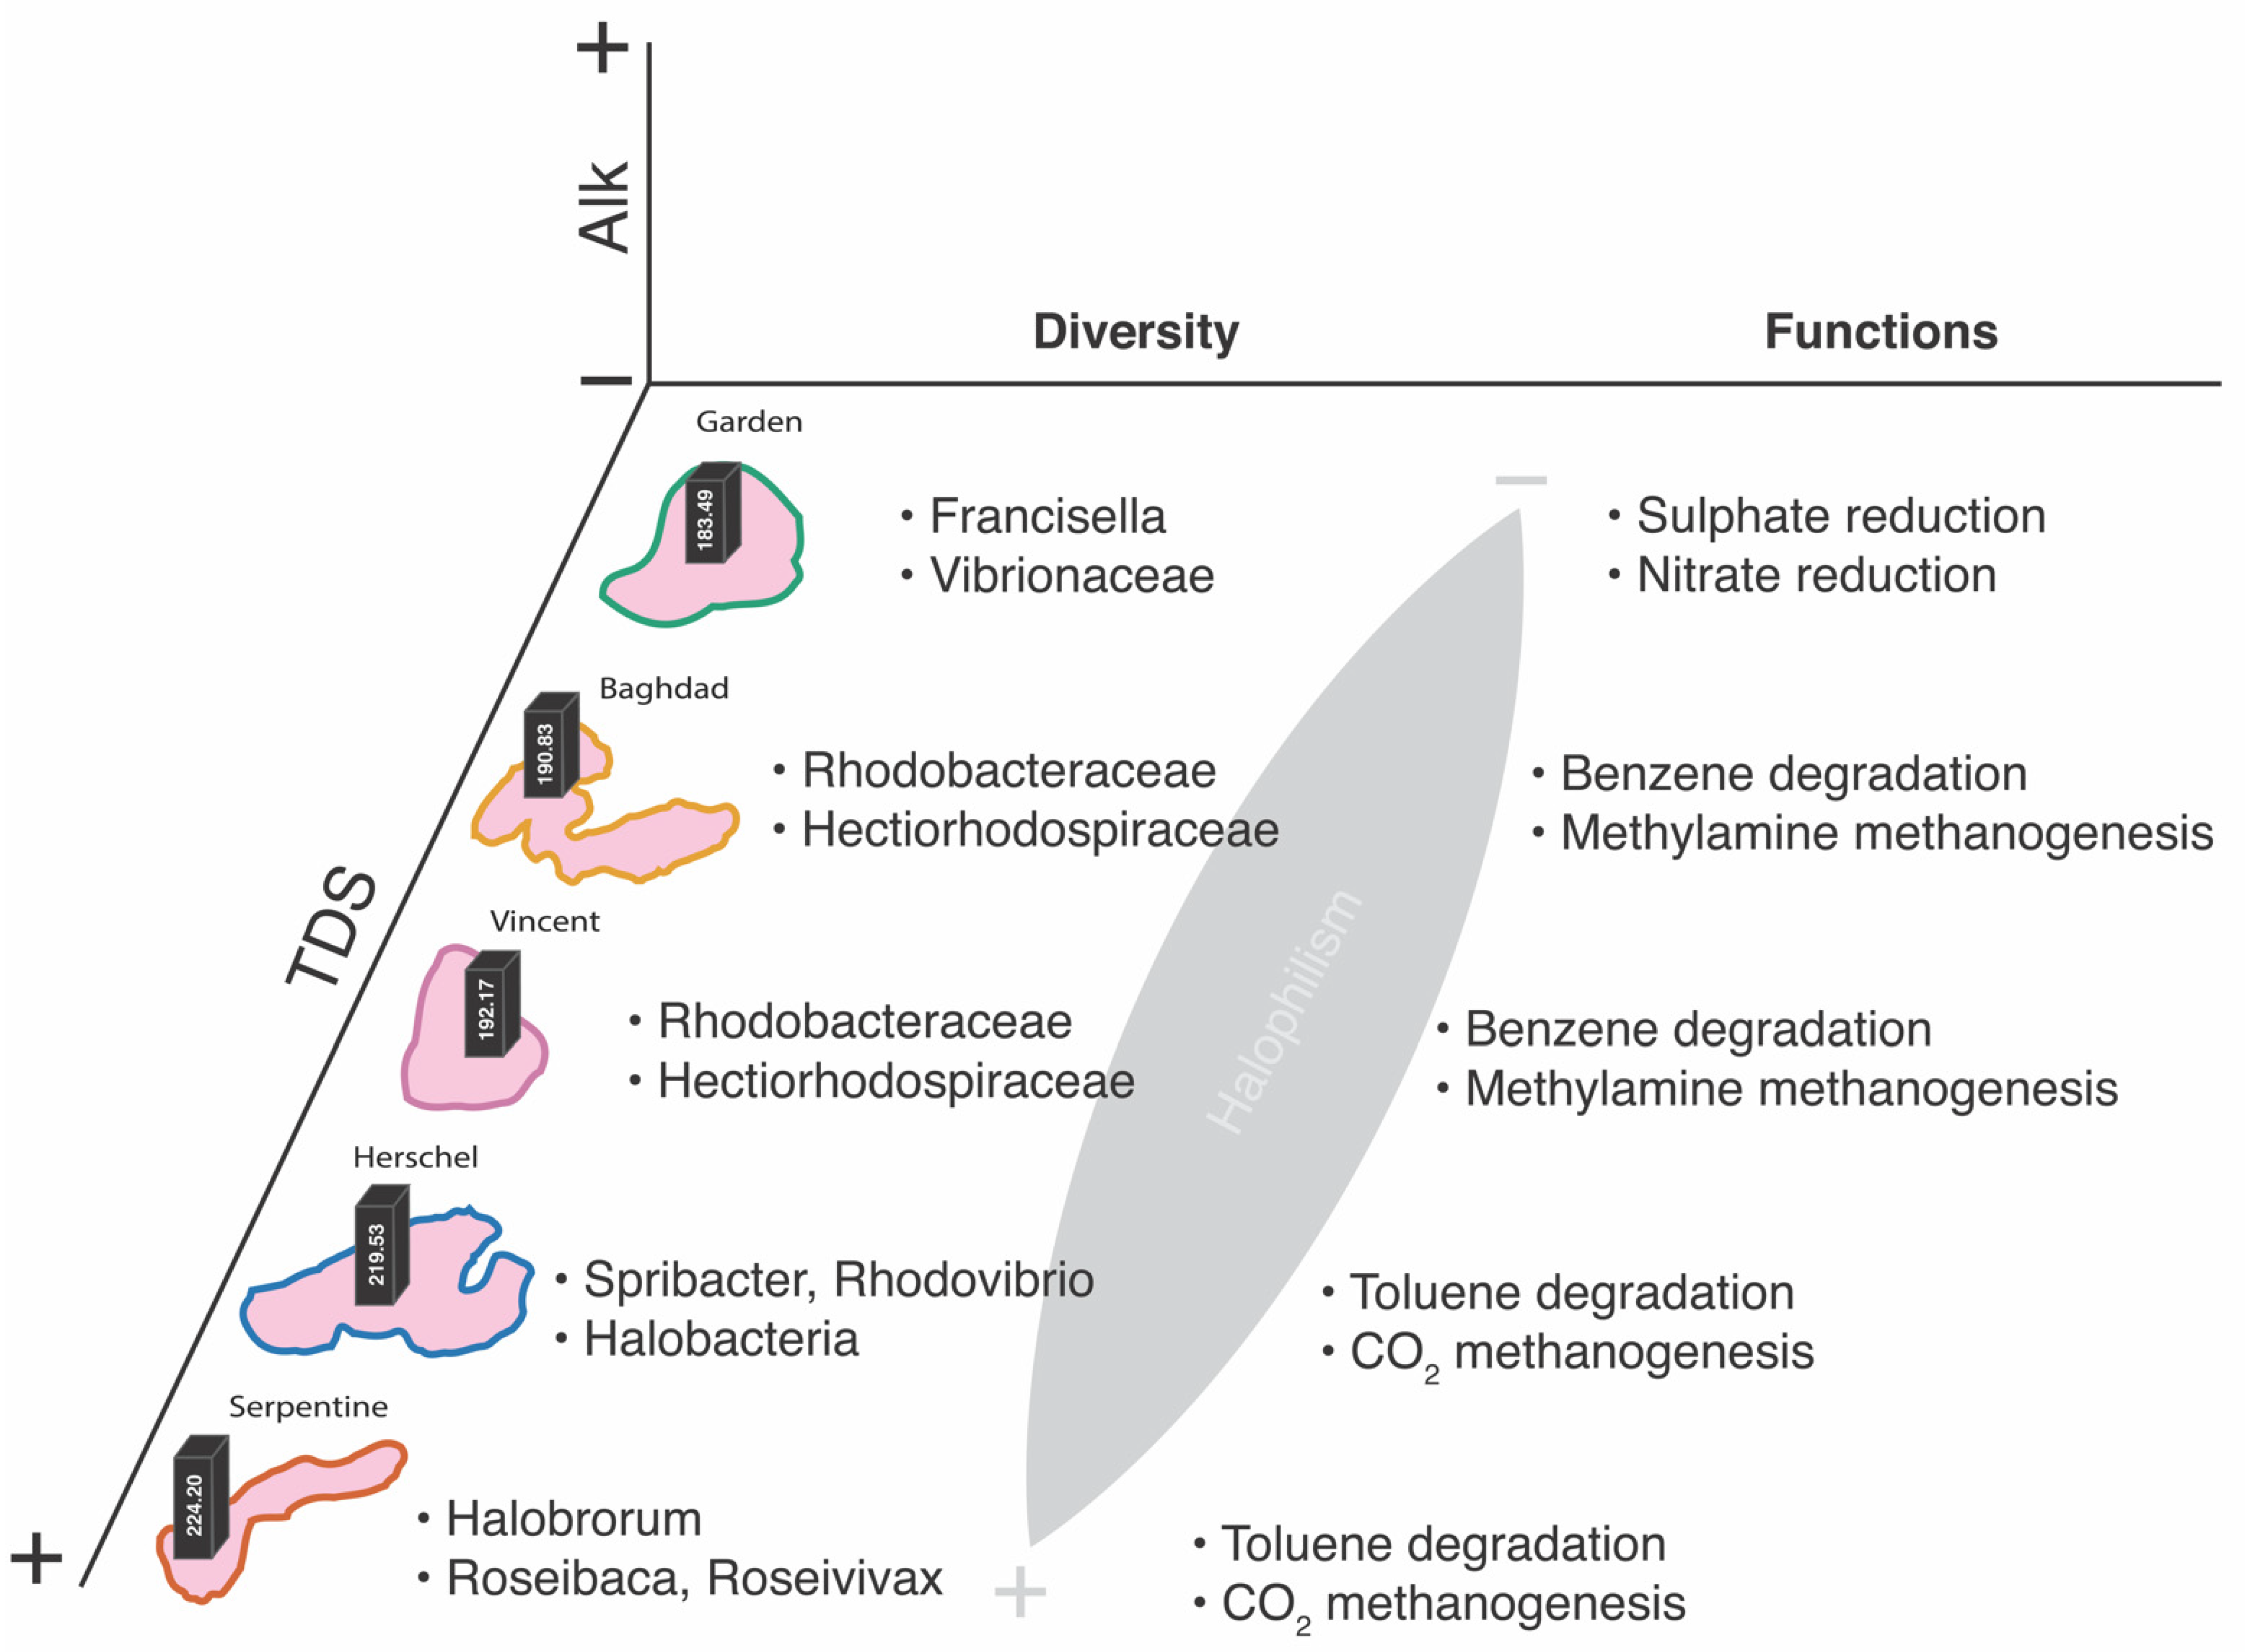
4.1. Biogeochemical Trends under High Salt

Our findings show that the five lakes, located within a range of 1.5 squared kilometres, host different environmental conditions, likely due to a combination of geo-hydrological and geographical factors. Overall, water at Garden Lake was the least saline (lowest values of TDS, Alk, Cl, Br) and the poorest in nutrients (DOC, NH3, TN) (Table 1). In line with these findings, fluorescence data on Garden Lake showed no distinctive organic material development (Figure S1). Our results agree with those of John et al. [59], who suggested that eutrophication processes have a direct impact on the ecological integrity of the lake. Garden Lake characterises the smallest water lens of the five wetlands, and it is located in close proximity to the island settlement and the golf course (Figure 1), factors which are frequently reported as negatively affecting the hydro-ecological health of hypersaline lakes [4]. Conversely, at Herschel Lake and Serpentine Lake the highest TDS concentration correlated inversely with lowest DO across the five lakes, a conventional linkage that has been frequently reported in saline and hypersaline wetlands [22]. In these two wetlands, this pattern coupled with the highest values of alkalinity and anions, indicating that not only they provide the most hypersaline framework across the five lakes, but also confirming a shallow groundwater intrusion suggested by Bryan et al. [29]. Lake Baghdad and Lake Vincent are located in closest proximity, and apart from their pH values, they displayed very similar hydrochemical conditions (Table 1). Fluorescence signatures from both systems indicated development of proprotein-like and humic/fulvic acid-like organic material, particularly pronounced for Lake Vincent (Figure S1). Major compounds of natural waters [60], these components also indicate ongoing input of organic matter, potentially influenced by the particularly high abundance of wading birds in these two systems during the austral summer (Mather’s unpublished data). However, further data on the specific carbon flows characterising these hypersaline systems will be necessary to unveil the energy fluxes shaping their resident biota.
Overall, our environmental data reflect a highly heterogeneous assembly of hypersaline matrices at Rottnest Island. These findings indicate that conservational management strategies should take this into account, perhaps focusing on a lake-by-lake basis—with Garden Lake the wetland under more urgent need of ecological restoration—rather than grouping the hypersaline systems under one uniform category.

4.2. DNA Metabarcoding for Studying Hypersaline Microbial Communities

4.2.1. Taxonomic Patterns

Microbial communities across the five lakes were dominated by Proteobacteria, particularly Gammaproteobacteria and Alphaproteobacteria. These classes of Proteobacteria contain haloalkaliphilic taxa that have been frequently reported in high-salt conditions [61,62]. The third most abundant class was Actinomicetia, a group frequently found in soils in salt lakes [63] but still underexplored [64]. The Archeae domain was entirely composed by the extremely halophilic Halobruraceae (genus Halorubrum) [65], a family which is found in high salt environments (100–150 g L−1) such as marine solar salterns and the Dead Sea [1,2,66], amongst other saline habitats.
Overall, microbial diversity patterns aligned with the tendency that arose from the analysis of the environmental conditions, with Garden Lake hosting the poorest community (5 families, lowest diversity indexes and poorest phylogenetic patterns). Here, the least saline environment did not provide suitable conditions for extreme halophiles such as Halobacteria and was dominated by moderately halophilic families such as Francisellaceae [67], Vibrionaceae [68] and Halomonadaceae [69]. In this lake, a particularly interesting finding concerns the presence of the genus Francisella in higher abundances than in other systems. This is a pathogenic Gram-negative bacterium responsible for a vast range of potential diseases (i.e., tularemia) transmitted by wildlife, including marsupials [70]. At Rottnest Island, several carcasses and skeletons of quokkas were identified along the shore of Garden Lake (Sacco’s unpublish data), constituting a potential source of the infectious bacteria. However, viable Francisella populations can exist outside carcasses and have been reported in the region of the Great Salt Lake (UT, USA) [71], and further high-resolution molecular methods will be necessary to unravel its original source at Garden Lake.
Conversely, in the most saline systems (Herschel and Serpentine) Halobacteria (family Halobruraceae) was almost exclusively (apart from two hits at Lake Vincent) the most abundant taxon (Figure 2B). Serpentine Lake, characterising by far the most sulphate-rich waters of the five wetlands (Table 1), hosted significantly higher abundances of sulphur oxidising genera, such as Roseibaca, Roseivivax and Halomonas, compared to Herschel Lake. These two wetlands, together with Lake Baghdad and Lake Vincent hosted the vast majority of Rhodobacteaceae, one of the most widely distributed bacterial lineages in marine habitats [72] and highly abundant at Great Salt Lake [73], together with all the haloalkaliphilic purple sulphur bacteria Ectothiorhodospiraceae detected in this study. This latter family plays a key role in organic flows under hypersaline conditions [74], and it has been suggested as highly significant for nutrient supply to aerobic bacterioplankton in meromictic lakes [75], including the five lakes at Rottnest Island [76]. Additional functional research (e.g., isotopic analysis, trait-based investigations, gut content analysis) involving micro and macroinvertebrates from the lakes will be crucial to unveil the linkages between the different trophic levels within the aquatic framework.

4.2.2. Putative Metabolic Pathways

The possibility of making functional genomic predictions based on OTU data has recently emerged through platforms such as PicrusT2 and Tax4Fun2, [77,78]. Despite a number of caveats when compared to metagenomes approaches [79], they still provide valuable tools for estimating the main metabolic pathways in a given ecosystem [58]. In this study, abundances of potential metabolic pathways utilised by halotolerant genera became more abundant with increasing salinity conditions, these mainly included methanogenic (i.e., methanogenesis of carbon dioxide and methylamines) and aromatic degradation (i.e., toluene and benzene degradation) pathways. In hypersaline environments, methanogenesis is controlled by the concentration of terminal electron acceptors, such as sulphate [80]. Methanogens can be outcompeted by other microorganisms (i.e., sulphate-reducing microbes) due to their ability to have a greater affinity for, and energy yield from, competitive substrates like hydrogen and acetate [81]. However, in hypersaline environments some methanogens have overcome this obstacle by utilising non-competitive substrates like methylamines [82]. This suggests that the increased salinity levels in the Herschel and Serpentine lakes are favourable for a diverse range of methanogenic pathways to occur and that the lower salinity of Garden Lake is likely promoting the activity of other microorganisms (i.e., sulphate-reducing microbes) that outcompete methanogens. The presence of certain aromatic degradation pathways also appeared to be influenced by salinity. Apart from the phenylacetate degradation, the degradation of methylated aromatics (i.e., toluene and xylene) were only predicted in Herschel and Serpentine lakes, whereas benzene and benzoate degradation pathways were only predicted in Lake Baghdad and Lake Vincent. Phenylacetate is a major intermediate in bacterial degradation of many aromatic compounds and can be oxidised under both aerobic and anaerobic conditions [83]. The prevalence of this degradation pathway in all the lake communities may contribute to the low number of observable aromatics compounds in the water. Previously, the metabolic capacity to degrade aliphatic and aromatic hydrocarbons has been shown to be influenced by varying salinities and aerobic/anaerobic conditions [84]. The high salinities and lower levels of dissolved oxygen detected in the Herschel and Serpentine lakes could be favourable for microorganisms that degrade methylated aromatic compounds. In contrast, the more oxygenated and comparably lower salinities in Baghdad and Vincent lakes may favour the degradation of benzene and benzoate-like compounds.
Overall, our results reveal a complex matrix of environmentally driven (i.e., salinity) metabolic strategies [85], and suggest that the hypersaline lakes at Rottnest Island provide interesting natural laboratories to test evolutionary (e.g., adaptations to the poly-extreme conditions) and ecological (e.g., use of habitats, niche occupations) patterns (Figure 4).
Hypersaline aquatic microbial assemblages at Rottnest Island are of great importance for the broad environmental functioning of the island, as they regulate the energy flows [59,86] and also provide the baseline food source of Artemia populations [87,88], a key food source for migratory endangered wading birds [89,90]. Our metabarcoding findings shed new light into the intra and inter-lake variations of microbial aquatic assemblages and functions, and provide information that can assist the great efforts implemented by the Rottnest Island Authority in preserving the inland aquatic lenses and their biotic communities. Indeed, the conservation of these too-often-undervalued systems will depend on how quickly we widen our baseline knowledge on the ecological dynamics (i.e., seasonality) shaping this diversified hypersaline world at Rottnest Island.

5. Conclusions

Our results indicate lake-driven microbial aquatic assemblages, both taxonomically and functionally, and confirm the potential of metabarcoding tests for obtaining detailed information on hypersaline microbial ecology. Further research exploring spatial (i.e., multiple and heterogeneous sites) and temporal (i.e., seasonality) dynamics will help expand the prospects of DNA metabarcoding approaches in brine. Given the increasing anthropic pressures (climate change, contamination, etc.) the hypersaline wetlands are being exposed to, their long-term preservation will depend on how quickly we will be able to implement affordable, effective and robust biomonitoring tools.

Supplementary Materials

The following are available online at https://www.mdpi.com/article/10.3390/w13141899/s1. Figure S1: Comparison of the EEM spectra of the five lakes. Plots were performed with Origin 9.1 64 bit software. Figure S2: Distribution of the relative abundances at (A) family and (B) genus level across the five lakes. Figure S3A: Differentially abundant OTUs (agglomerated by species level) (p < 0.05) between Garden Lake and Lake Baghdad at family and genus level. Negative log2-fold-change indicates taxa that were more abundant at Garden Lake, whereas a positive log2-fold-change indicates taxa that were more abundant at Lake Baghdad. Each circle represents one taxon that was enriched in one of the two lakes; different colours represent different phyla. Figure S3B: Differentially abundant OTUs (agglomerated by species level) (p < 0.05) between Garden Lake and Herschel Lake at family and genus level. Negative log2-fold-change indicates taxa that were more abundant at Garden Lake, whereas a positive log2-fold-change indicates taxa that were more abundant at Herschel Lake. Each circle represents one taxon that was enriched in one of the two lakes; different colours represent different phyla. Figure S3C: Differentially abundant OTUs (agglomerated by species level) (p < 0.05) between Garden Lake and Serpentine Lake at family and genus level. Negative log2-fold-change indicates taxa that were more abundant at Garden Lake, whereas a positive log2-fold-change indicates taxa that were more abundant at Serpentine Lake. Each circle represents one taxon that was enriched in one of the two lakes; different colours represent different phyla. Figure S3D: Differentially abundant OTUs (agglomerated by species level) (p < 0.05) between Garden Lake and Lake Vincent at family and genus level. Negative log2-fold-change indicates taxa that were more abundant at Garden Lake, whereas a positive log2-fold-change indicates taxa that were more abundant at Lake Vincent. Each circle represents one taxon that was enriched in one of the two lakes; different colours represent different phyla. Figure S3E: Differentially abundant OTUs (agglomerated by species level) (p < 0.05) between Lake Baghdad and Herschel Lake at family and genus level. Negative log2-fold-change indicates taxa that were more abundant at Lake Baghdad, whereas a positive log2-fold-change indicates taxa that were more abundant at Herschel Lake. Each circle represents one taxon that was enriched in one of the two lakes; different colours represent different phyla. Figure S3F: Differentially abundant OTUs (agglomerated by species level) (p < 0.05) between Lake Baghdad and Serpentine Lake at family and genus level. Negative log2-fold-change indicates taxa that were more abundant at Lake Baghdad, whereas a positive log2-fold-change indicates taxa that were more abundant at Serpentine Lake. Each circle represents one taxon that was enriched in one of the two lakes; different colours represent different phyla. Figure S3G: Differentially abundant OTUs (agglomerated by species level) (p < 0.05) between Herschel Lake and Serpentine Lake at family and genus level. Negative log2-fold-change indicates taxa that were more abundant at Herschel Lake, whereas a positive log2-fold-change indicates phyla that were more abundant at Serpentine Lake. Each circle represents one taxon that was enriched in one of the two lakes; different colours represent different phyla. Figure S3H: Differentially abundant OTUs (agglomerated by species level) (p < 0.05) between Herschel Lake and Lake Vincent at family and genus level. Negative log2-fold-change indicates taxa that were more abundant at Herschel Lake, whereas a positive log2-fold-change indicates taxa that were more abundant at Lake Vincent. Each circle represents one taxon that was enriched in one of the two lakes; different colours represent different phyla. Figure S3I: Differentially abundant OTUs (agglomerated by species level) (p < 0.05) between Serpentine Lake and Lake Vincent at family and genus level. Negative log2-fold-change indicates taxa that were more abundant at Serpentine Lake, whereas a positive log2-fold-change indicates phyla that were more abundant at Lake Vincent. Each circle represents one taxon that was enriched in one of the two lakes; Different colours represent different phyla. Figure S4: (A) Phylogenetic diversity (PD) between the microbial communities of the five lakes; (B) mean pairwise distance (MTD) and (C) mean nearest taxon distance (MNTD). Different letters indicate statistically significant results (see Table S5 for the significances of the pairwise comparisons). Table S1: Labels, ID, GPS coordinates (latitude and longitude) per each sampling point considered in the study. Table S2: Results of the Tukey’s HSD tests (pairwise comparisons) on the hydrochemical data across the lakes. *, p < 0.05; **, p < 0.005; ***, p < 0.0005. DO, dissolved oxygen; NH3, ammonia; TDS, total dissolved solids; Cl, chloride; Br, bromide; SO42−, sulphates; DOC, dissolved organic carbon; TN, total nitrogen. Table S3: Results of the Tukey’s HSD tests (pairwise comparisons) on the values of the diversity indices across the lakes. *, p < 0.05; **, p < 0.005; ***, p < 0.0005. H, Shannon diversity index; J, Pielou’s evenness index. Table S4: Lower, medium and upper quantiles (2.5%, 50% and 97.5%) and median of the r2 values obtained from 1000 random replicates. Table S5: Results of the Tukey’s HSD tests (pairwise comparisons) on the phylogenetic indices across the lakes. *, p < 0.05; **, p < 0.005; ***, p < 0.0005. PD, phylogenetic diversity; MTD, mean pairwise distance; MNTD, mean nearest taxon distance.

Author Contributions

Conceptualisation, M.S.; methodology, M.S., N.E.W., M.C., S.A. and A.L.; software, N.E.W., M.C., A.L., P.P., F.S. and S.A.; validation, A.L., S.A., M.E.A. and N.E.W.; formal analysis, M.S., M.C., A.L., F.S., P.P.; investigation, M.S., A.L., N.E.W. and M.C.; resources, S.A., N.E.W. and M.E.A.; data curation, A.L., M.S., M.C., P.P., F.S. and N.E.W.; writing—original draft preparation, M.S. and M.C.; writing—review and editing, N.E.W., M.C., S.A., W.F.H., P.P., F.S., A.L. and M.E.A.; visualisation, M.S., M.C., A.L., P.P. and F.S.; supervision, N.E.W. and M.E.A.; project administration, M.S.; funding acquisition, M.S., M.E.A. and N.E.W. All authors have read and agreed to the published version of the manuscript.

Funding

This research was funded by BHP Social Investment Fund, eDNA for Global Biodiversity (eDGES) programme.

Institutional Review Board Statement

Not Applicable.

Informed Consent Statement

Not Applicable.

Data Availability Statement

Sequenced reads have been deposited on Dryad (doi:10.5061/dryad.xd2547dh6). All codes and scripts for eDNAFlow and Picrust2 can be found at https://github.com/mahsa-mousavi/eDNAFlow (accessed on 21 March 2021) and https://github.com/picrust/picrust2 (accessed on 15 April 2021), respectively.

Acknowledgments

We acknowledge the Western Australia Department of Biodiversity, Conservation and Attractions for sampling permits and the Rottnest Island Authority for logistical support. M. Saccò, N. White and M. Allentoft are supported by the BHP Social Investment Fund, eDNA for Global Biodiversity (eDGES) programme. This work was supported by resources provided by the Pawsey Supercomputing Centre with funding from the Australian Government and the Government of Western Australia. The authors thank Elizabeth Ooi and Rae Young for their marvellous support and crucial assistance with fieldwork logistics.

Conflicts of Interest

The authors declare no conflict of interest.

References

  1. Oren, A. Microbial life at high salt concentrations: Phylogenetic and metabolic diversity. Saline Syst. 2008, 1, 1–13. [Google Scholar] [CrossRef] [Green Version]
  2. Oren, A. Life in hypersaline environments. In Their World: A Diversity of Microbial Environments; Hurst, C.J., Ed.; Springer: Cham, Switzerland, 2016; Volume 1, pp. 301–339. [Google Scholar]
  3. Davila, A.F.; Duport, L.G.; Melchiorri, R.; Jaenchen, J.; Valea, S.; de Los Rios, A.; Fairen, A.G.; Moehlmann, D.; McKay, C.P.; Ascaso, C.; et al. Hygroscopic salts and the potential for life on Mars. Astrobiology 2010, 10, 617–628. [Google Scholar] [CrossRef] [Green Version]
  4. Saccò, M.; White, N.E.; Harrod, C.; Salazar, G.; Aguilar, P.; Cubillos, C.F.; Meredith, K.; Baxter, B.K.; Oren, A.; Anufriieva, E.; et al. Salt to conserve: A review on the ecology and preservation of hypersaline ecosystems. Biol. Rev. 2021, in press. [Google Scholar]
  5. Saccò, M.; Blyth, A.J.; Humphreys, W.F.; Middleton, J.A.; White, N.E.; Campbell, M.; Mousavi-Derazmahalleh, M.; Laini, A.; Hua, Q.; Meredith, K.; et al. Tracking down carbon inputs underground from an arid zone Australian calcrete. PLoS ONE 2020, 15, e0237730. [Google Scholar] [CrossRef]
  6. Saccò, M.; Blyth, A.J.; Humphreys, W.F.; Cooper, S.J.; White, N.E.; Campbell, M.; Mousavi-Derazmahalleh, M.; Hua, Q.; Mazumder, D.; Smith, C.; et al. Rainfall as a trigger of ecological cascade effects in an Australian groundwater ecosystem. Sci. Rep. 2021, 11, 1–15. [Google Scholar] [CrossRef] [PubMed]
  7. Deiner, K.; Lopez, J.; Bourne, S.; Holman, L.E.; Seymour, M.; Grey, E.K.; Lacoursière-Roussel, A.; Li, Y.; Renshaw, M.A.; Pfrender, M.E.; et al. Optimising the detection of marine taxonomic richness using environmental DNA metabarcoding: The effects of filter material, pore size and extraction method. Metabarcoding Metagenomics 2018, 2, e28963. [Google Scholar] [CrossRef]
  8. Holman, L.E.; de Bruyn, M.; Creer, S.; Carvalho, G.; Robidart, J.; Rius, M. Detection of introduced and resident marine species using environmental DNA metabarcoding of sediment and water. Sci. Rep. 2019, 9, 1–10. [Google Scholar] [CrossRef] [Green Version]
  9. Evans, D.M.; Kitson, J.J.; Lunt, D.H.; Straw, N.A.; Pocock, M.J. Merging DNA metabarcoding and ecological network analysis to understand and build resilient terrestrial ecosystems. Funct. Ecol. 2016, 30, 1904–1916. [Google Scholar] [CrossRef] [Green Version]
  10. Van der Heyde, M.; Bunce, M.; Dixon, K.; Wardell-Johnson, G.; White, N.E.; Nevill, P. Changes in soil microbial communities in post mine ecological restoration: Implications for monitoring using high throughput DNA sequencing. Sci. Total Environ. 2020, 749, 142262. [Google Scholar] [CrossRef] [PubMed]
  11. Elbrecht, V.; Steinke, D. Scaling up DNA metabarcoding for freshwater macrozoobenthos monitoring. Freshw. Biol. 2019, 64, 380–387. [Google Scholar]
  12. Yang, J.; Zhang, X.; Xie, Y.; Song, C.; Zhang, Y.; Yu, H.; Burton, G.A. Zooplankton community profiling in a eutrophic freshwater ecosystem-lake tai basin by DNA metabarcoding. Sci. Rep. 2017, 7, 1–11. [Google Scholar] [CrossRef]
  13. Keck, F.; Vasselon, V.; Rimet, F.; Bouchez, A.; Kahlert, M. Boosting DNA metabarcoding for biomonitoring with phylogenetic estimation of operational taxonomic units’ ecological profiles. Mol. Ecol. Resour. 2018, 18, 1299–1309. [Google Scholar] [CrossRef] [PubMed]
  14. Williams, W.D. Salinity as a determinant of the structure of biological communities in salt lakes. Hydrobiologia 1998, 381, 191–201. [Google Scholar] [CrossRef]
  15. Telesh, I.; Schubert, H.; Skarlato, S. Life in the salinity gradient: Discovering mechanisms behind a new biodiversity pattern. Estuar. Coast. Shelf Sci. 2013, 135, 317–327. [Google Scholar] [CrossRef]
  16. Messager, M.L.; Lehner, B.; Grill, G.; Nedeva, I.; Schmitt, O. Estimating the volume and age of water stored in global lakes using a geo-statistical approach. Nat. Commun. 2016, 7, 1–11. [Google Scholar] [CrossRef] [PubMed]
  17. Kerkar, S. Ecology of Hypersaline Microorganisms; National Institute of Oceanography: Goa, India, 2004. [Google Scholar]
  18. Finlayson, C.; Milton, G.R.; Prentice, R.C. Wetland types and distribution. In The Wetland Book II: Distribution, Description and Conservation; Springer: Berlin/Heidelberg, Germany, 2018; pp. 19–35. [Google Scholar]
  19. Nichols, G.; Williams, E.; Paola, C. (Eds.) Sedimentary Processes, Environments and Basins: A Tribute to Peter Friend; John Wiley & Sons: Hoboken, NJ, USA, 2009; Volume 22. [Google Scholar]
  20. Mann, K.H. Retrieved 25/2/2021. Saline Lakes. Encyclopedia Britannica. Available online: https://www.britannica.com/science/inland-water-ecosystem/Saline-lakes (accessed on 15 January 2021).
  21. Trick, J.K.; Stuart, M.; Reeder, S. Contaminated groundwater sampling and quality control of water analyses. In Environmental Geochemistry; Elsevier: Amsterdam, The Netherlands, 2008; pp. 29–57. [Google Scholar]
  22. Prasad, B.S.R.V.; Srinivasu, P.D.N.; Varma, P.S.; Raman, A.V.; Ray, S. Dynamics of dissolved oxygen in relation to saturation and health of an aquatic body: A case for Chilka Lagoon, India. J. Ecosyst. 2014. [Google Scholar] [CrossRef] [Green Version]
  23. Hamdani, I.; Assouline, S.; Tanny, J.; Lensky, I.M.; Gertman, I.; Mor, Z.; Lensky, N.G. Seasonal and diurnal evaporation from a deep hypersaline lake: The Dead Sea as a case study. J. Hydrol. 2018, 562, 155–167. [Google Scholar] [CrossRef]
  24. Didari, M.; Bagheri, M.; Amoozegar, M.A.; Bouzari, S.; Babavalian, H.; Tebyanian, H.; Hassanshahian, M.; Ventosa, A. Diversity of halophilic and halotolerant bacteria in the largest seasonal hypersaline lake (Aran-Bidgol-Iran). J. Environ. Health Sci. Eng. 2020, 18, 961–971. [Google Scholar] [CrossRef]
  25. López-González, P.J.; Guerrero, F.; Castro, M.C. Seasonal fluctuations in the plankton community in a hypersaline temporary lake (Honda, Southern Spain). Int. J. Salt Lake Res. 1997, 6, 353–371. [Google Scholar] [CrossRef]
  26. Podell, S.; Emerson, J.B.; Jones, C.M.; Ugalde, J.A.; Welch, S.; Heidelberg, K.B.; Banfield, J.F.; Allen, E.E. Seasonal fluctuations in ionic concentrations drive microbial succession in a hypersaline lake community. ISME J. 2014, 8, 979–990. [Google Scholar] [CrossRef]
  27. Micklin, P.P. Desiccation of the Aral Sea: A water management disaster in the Soviet Union. Science 1988, 241, 1170–1176. [Google Scholar] [CrossRef] [PubMed] [Green Version]
  28. Micklin, P. The past, present, and future Aral Sea. Lakes Reserv. Res. Manag. 2010, 15, 193–213. [Google Scholar] [CrossRef]
  29. Bryan, E.; Meredith, K.T.; Baker, A.; Post, V.E.; Andersen, M.S. Island groundwater resources, impacts of abstraction and a drying climate: Rottnest Island, Western Australia. J. Hydrol. 2016, 542, 704–718. [Google Scholar] [CrossRef]
  30. Mendes Monteiro, J.; Vogwill, R.; Bischoff, K.; Gleeson, D.B. Comparative metagenomics of microbial mats from hypersaline lakes at Rottnest Island (WA, Australia), advancing our understanding of the effect of mat community and functional genes on microbialite accretion. Limnol. Oceanogr. 2020, 65, 293–309. [Google Scholar] [CrossRef]
  31. Bischoff, K.; Sirantoine, E.; Wilson, M.E.; George, A.D.; Mendes Monteiro, J.; Saunders, M. Spherulitic microbialites from modern hypersaline lakes, Rottnest Island, Western Australia. Geobiology 2020, 18, 725–741. [Google Scholar] [CrossRef] [PubMed]
  32. Playford, P.E.; Leech, R.E.J.; Kendrick, G.W. Geology and Hydrology of Rottnest Island; Geological Survey of Western Australia: Perth, Australia, 1977; p. 113. [Google Scholar]
  33. Mylroie, J.E.; Carew, J.L.; Moore, A.I. Blue holes: Definition and genesis. Carbonates Evaporites 1995, 10, 225–233. [Google Scholar] [CrossRef]
  34. Collins, L.B.; Zhu, Z.R.; Wyrwoll, K.H.; Hatcher, B.G.; Playford, P.E.; Chen, J.H.; Eisenhauer, A.; Wasserburg, G.J. Late Quaternary evolution of coral reefs on a cool-water carbonate margin: The Abrolhos Carbonate Platforms, southwest Australia. Mar. Geol. 1993, 110, 203–212. [Google Scholar] [CrossRef]
  35. Kis-Papo, T.; Grishkan, I.; Oren, A.; Wasser, S.P.; Nevo, E. Spatiotemporal diversity of filamentous fungi in the hypersaline Dead Sea. Mycol. Res. 2001, 105, 749–756. [Google Scholar] [CrossRef]
  36. Caporaso, J.G.; Lauber, C.L.; Walters, W.A.; Berg-Lyons, D.; Lozupone, C.A.; Turnbaugh, P.J.; Fierer, N.; Knight, R. Global patterns of 16S rRNA diversity at a depth of millions of sequences per sample. Proc. Natl. Acad. Sci. USA 2011, 108, 4516–4522. [Google Scholar] [CrossRef] [Green Version]
  37. Turner, S.; Pryer, K.M.; Miao, V.P.; Palmer, J.D. Investigating deep phylogenetic relationships among cyanobacteria and plastids by small subunit rRNA sequence analysis. J. Eukaryot. Microbiol. 1999, 46, 327–338. [Google Scholar] [CrossRef]
  38. Drummond, A.J.; Ashton, B.; Buxton, S.; Cheung, M.; Cooper, A.; Duran, C.; Field, M.; Heled, J.; Kearse, M.; Markowitz, S.; et al. Geneious v5.4. 2011. Available online: http://www.geneious.com/ (accessed on 18 April 2021).
  39. Mousavi-Derazmahalleh, M.; Stott, A.; Lines, R.; Peverley, G.; Nester, G.; Simpson, T.; Zawierta, M.; De La Pierre, M.; Bunce, M.; Christophersen, C.T. eDNAFlow, an automated, reproducible and scalable workflow for analysis of environmental DNA sequences exploiting Nextflow and Singularity. Mol. Ecol. Resour. 2021, 21, 1697–1704. [Google Scholar] [CrossRef] [PubMed]
  40. Edgar, R.C. UNOISE2: Improved error-correction for Illumina 16S and ITS amplicon sequencing. bioRxiv 2016. [Google Scholar] [CrossRef] [Green Version]
  41. Altschul, S.F.; Gish, W.; Miller, W.; Myers, E.W.; Lipman, D.J. Basic local alignment search tool. J. Mol. Biol. 1990, 215, 403–410. [Google Scholar] [CrossRef]
  42. Langille, M.G.; Zaneveld, J.; Caporaso, J.G.; McDonald, D.; Knights, D.; Reyes, J.A.; Clemente, J.C.; Burkepile, D.E.; Thurber, R.L.V.; Knight, R.; et al. Predictive functional profiling of microbial communities using 16S rRNA marker gene sequences. Nat. Biotechnol. 2013, 31, 814–821. [Google Scholar] [CrossRef]
  43. Yi, Y.; Fang, Y.; Wu, K.; Liu, Y.; Zhang, W. Comprehensive gene and pathway analysis of cervical cancer progression. Oncol. Lett. 2020, 19, 3316–3332. [Google Scholar] [CrossRef] [Green Version]
  44. R Core Team. R: A Language and Environment for Statistical Computing; R Core Team: Vienna, Austria, 2013; Volume 201. [Google Scholar]
  45. Oksanen, J.; Blanchet, F.G.; Friendly, M.; Kindt, R.; Legendre, P.; McGlinn, D.; Minchin, P.R.; O’Hara, R.B.; Simpson, G.L.; Solymos, P.; et al. Vegan: Community Ecology Package; R Package Version 2.4-0; R Core Team: Vienna, Austria, 2016. [Google Scholar]
  46. Lozupone, C.; Knight, R. UniFrac: A new phylogenetic method for comparing microbial communities. Appl. Environ. Microbiol. 2005, 71, 8228–8235. [Google Scholar] [CrossRef] [Green Version]
  47. Martinez Arbizu, P. pairwiseAdonis: Pairwise Multilevel Comparison Using Adonis; R Package Version 0.0.1; R Core Team: Vienna, Austria, 2017. [Google Scholar]
  48. Janssen, S.; McDonald, D.; Gonzalez, A.; Navas-Molina, J.A.; Jiang, L.; Xu, Z.Z.; Winker, K.; Kado, D.M.; Orwoll, E.; Manary, M.; et al. Phylogenetic placement of exact amplicon sequences improves associations with clinical information. mSystems 2018, 3, e00021-18. [Google Scholar] [CrossRef] [Green Version]
  49. Bolyen, E.; Rideout, J.R.; Dillon, M.R.; Bokulich, N.A.; Abnet, C.C.; Al-Ghalith, G.A.; Alexander, H.; Alm, E.J.; Arumugam, M.; Asnicar, F.; et al. Reproducible, interactive, scalable and extensible microbiome data science using QIIME 2. Nat. Biotechnol. 2019, 37, 852–857. [Google Scholar] [CrossRef]
  50. McDonald, D.; Price, M.N.; Goodrich, J.; Nawrocki, E.P.; DeSantis, T.Z.; Probst, A.; Andersen, G.L.; Knight, R.; Hugenholtz, P. An improved Greengenes taxonomy with explicit ranks for ecological and evolutionary analyses of bacteria and archaea. ISME J. 2012, 6, 610–618. [Google Scholar] [CrossRef]
  51. Cadotte, M.W.; Davies, T.J. Phylogenies in Ecology: A Guide to Concepts and Methods; Princeton University Press: Princeton, NJ, USA, 2016. [Google Scholar]
  52. Kembel, S.W.; Cowan, P.D.; Helmus, M.R.; Cornwell, W.K.; Morlon, H.; Ackerly, D.D.; Blomberg, S.P.; Webb, C.O. Picante: R tools for integrating phylogenies and ecology. Bioinformatics 2010, 26, 1463–1464. [Google Scholar] [CrossRef] [Green Version]
  53. Pearse, W.D.; Purvis, A.; Cavender-Bares, J.; Helmus, M.R. Metrics and models of community phylogenetics. In Modern Phylogenetic Comparative Methods and Their Application in Evolutionary Biology; Springer: Berlin/Heidelberg, Germany, 2014; pp. 451–464. [Google Scholar]
  54. Chao, A.; Chiu, C.-H.; Jost, L. Phylogenetic diversity measures and their decomposition: A framework based on Hill numbers. In Biodiversity Conservation and Phylogenetic Systematics; Topics in Biodiversity and Conservation; Pellens, R., Grandcolas, P., Eds.; Springer: Cham, Switzerland, 2016; Volume 14. [Google Scholar]
  55. McMurdie, P.J.; Holmes, S. Waste not, want not: Why rarefying microbiome data is inadmissible. PLoS Comput. Biol. 2014, 10, e1003531. [Google Scholar] [CrossRef] [PubMed] [Green Version]
  56. Karthik, L.; Kumar, G.; Keswani, T.; Bhattacharyya, A.; Chandar, S.S.; Rao, K.B. Protease inhibitors from marine actinobacteria as a potential source for antimalarial compound. PLoS ONE 2014, 3, e90972. [Google Scholar] [CrossRef] [PubMed] [Green Version]
  57. Parks, D.H.; Tyson, G.W.; Hugenholtz, P.; Beiko, R.G. STAMP: Statistical analysis of taxonomic and functional profiles. Bioinformatics 2014, 30, 3123–3124. [Google Scholar] [CrossRef] [Green Version]
  58. Douglas, G.M.; Maffei, V.J.; Zaneveld, J.R.; Yurgel, S.N.; Brown, J.R.; Taylor, C.M.; Huttenhower, C.; Langille, M.G. PICRUSt2 for prediction of metagenome functions. Nat. Biotechnol. 2020, 38, 685–688. [Google Scholar] [CrossRef] [PubMed]
  59. John, J.; Hay, M.; Paton, J. Cyanobacteria in benthic microbial communities in coastal salt lakes in Western Australia. Algol. Stud. 2009, 130, 125. [Google Scholar] [CrossRef]
  60. Mostofa, K.M.; Liu, C.Q.; Mottaleb, M.A.; Wan, G.; Ogawa, H.; Vione, D.; Yoshioka, T.; Wu, F. Dissolved organic matter in natural waters. In Photobiogeochemistry of Organic Matter; Springer: Berlin/Heidelberg, Germany, 2013; pp. 1–137. [Google Scholar]
  61. Shapovalova, A.A.; Khijniak, T.V.; Tourova, T.P.; Muyzer, G.; Sorokin, D.Y. Heterotrophic denitrification at extremely high salt and pH by haloalkaliphilic Gammaproteobacteria from hypersaline soda lakes. Extremophiles 2008, 12, 619–625. [Google Scholar] [CrossRef] [PubMed] [Green Version]
  62. Sorokin, D.Y.; Kuenen, J.G. Chemolithotrophic haloalkaliphiles from soda lakes. FEMS Microbiol. Ecol. 2005, 52, 287–295. [Google Scholar] [CrossRef]
  63. Yadav, A.K.; Vardhan, S.; Kashyap, S.; Yandigeri, M.; Arora, D.K. Actinomycetes diversity among rRNA gene clones and cellular isolates from Sambhar salt lake, India. Sci. World J. 2013. [Google Scholar] [CrossRef] [Green Version]
  64. Jose, P.A.; Jebakumar, S.R.D. Unexplored hypersaline habitats are sources of novel actinomycetes. Front. Microbiol. 2014, 5, 242. [Google Scholar] [CrossRef]
  65. Gupta, R.S.; Naushad, S.; Baker, S. Phylogenomic analyses and molecular signatures for the class Halobacteria and its two major clades: A proposal for division of the class Halobacteria into an emended order Halobacteriales and two new orders, Haloferacales ord. nov. and Natrialbales ord. nov., containing the novel families Haloferacaceae fam. nov. and Natrialbaceae fam. nov. Int. J. Syst. Evol. Microbiol. 2015, 65, 1050–1069. [Google Scholar]
  66. Gupta, R.S.; Naushad, S.; Fabros, R.; Adeolu, M. A phylogenomic reappraisal of family-level divisions within the class Halobacteria: Proposal to divide the order Halobacteriales into the families Halobacteriaceae, Haloarculaceae fam. nov., and Halococcaceae fam. nov., and the order Haloferacales into the families, Haloferacaceae and Halorubraceae fam nov. Antonie Van Leeuwenhoek 2016, 109, 565–587. [Google Scholar]
  67. Newton, K.; Jeffries, T.C.; Smith, R.J.; Seymour, J.R.; Seuront, L.; Mitchell, J.G. Taxonomic and metabolic shifts in the Coorong bacterial metagenome driven by salinity and external inputs. J. Oceanol. Limnol. 2018, 36, 2033–2049. [Google Scholar] [CrossRef]
  68. López-Hermoso, C.; Rafael, R.; Sánchez-Porro, C.; Ventosa, A. Salinivibrio kushneri sp. nov., a moderately halophilic bacterium isolated from salterns. Syst. Appl. Microbiol. 2018, 41, 159–166. [Google Scholar] [CrossRef] [PubMed]
  69. Wohlfarth, A.; Severin, J.; Galinski, E.A. The spectrum of compatible solutes in heterotrophic halophilic eubacteria of the family Halomonadaceae. Microbiology 1990, 136, 705–712. [Google Scholar] [CrossRef] [Green Version]
  70. Pechous, R.D.; McCarthy, T.R.; Zahrt, T.C. Working toward the future: Insights into Francisella tularensis pathogenesis and vaccine development. Microbiol. Mol. Biol. Rev. 2009, 73, 684–711. [Google Scholar] [CrossRef] [Green Version]
  71. Whitehouse, C.A.; Kesterson, K.E.; Duncan, D.D.; Eshoo, M.W.; Wolcott, M. Identification and characterization of Francisella species from natural warm springs in Utah, USA. Lett. Appl. Microbiol. 2012, 54, 313–324. [Google Scholar] [CrossRef] [PubMed]
  72. Garrity, G.M.; Bell, J.A.; Lilburn, T.; Family, I. Rhodobacteraceae fam. nov. In Bergey’s Manual of Systematic Bacteriology; Springer: Berlin/Heidelberg, Germany, 2005; Volume 2, p. 161. [Google Scholar]
  73. Almeida-Dalmet, S.; Sikaroodi, M.; Gillevet, P.M.; Litchfield, C.D.; Baxter, B.K. Temporal study of the microbial diversity of the North Arm of Great Salt Lake, Utah, US. Microorganisms 2015, 3, 310–326. [Google Scholar] [CrossRef] [Green Version]
  74. Peterson, B.J.; Howarth, R.W.; Garritt, R.H. Sulfur and carbon isotopes as tracers of salt-marsh organic matter flow. Ecology 1986, 67, 865–874. [Google Scholar] [CrossRef]
  75. Overmann, J.; Beatty, J.T.; Hall, K.J. Purple sulfur bacteria control the growth of aerobic heterotrophic bacterioplankton in a meromictic salt lake. Appl. Environ. Microbiol. 1996, 62, 3251–3258. [Google Scholar] [CrossRef] [Green Version]
  76. Bunn, S.E.; Edward, D.H.D. Seasonal meromixis in three hypersaline lakes on Rottnest Island, Western Australia. Mar. Freshw. Res. 1984, 35, 261–265. [Google Scholar] [CrossRef]
  77. Cayetano, R.D.A.; Park, J.; Kim, G.B.; Jung, J.H.; Kim, S.H. Enhanced anaerobic digestion of waste-activated sludge via bioaugmentation strategy-Phylogenetic investigation of communities by reconstruction of unobserved states (PICRUSt2) analysis through hydrolytic enzymes and possible linkage to system performance. Bioresour. Technol. 2021, 332, 125014. [Google Scholar] [CrossRef]
  78. Wemheuer, F.; Taylor, J.A.; Daniel, R.; Johnston, E.; Meinicke, P.; Thomas, T.; Wemheuer, B. Tax4Fun2: Prediction of habitat-specific functional profiles and functional redundancy based on 16S rRNA gene sequences. Environ. Microbiome 2020, 15, 1–12. [Google Scholar] [CrossRef]
  79. Iwai, S.; Weinmaier, T.; Schmidt, B.L.; Albertson, D.G.; Poloso, N.J.; Dabbagh, K.; DeSantis, T.Z. Piphillin: Improved prediction of metagenomic content by direct inference from human microbiomes. PLoS ONE 2016, 11, e0166104. [Google Scholar] [CrossRef] [Green Version]
  80. McGenity, T.J. Methanogens and methanogenesis in hypersaline environments. In Handbook of Hydrocarbon and Lipid Microbiology; Springer: Berlin/Heidelberg, Germany, 2010; pp. 665–680. [Google Scholar]
  81. Sela-Adler, M.; Ronen, Z.; Herut, B.; Antler, G.; Vigderovich, H.; Eckert, W.; Sivan, O. Co-existence of methanogenesis and sulfate reduction with common substrates in sulfate-rich estuarine sediments. Front. Microbiol. 2017, 8, 766. [Google Scholar] [CrossRef] [Green Version]
  82. Kelley, C.A.; Poole, J.A.; Tazaz, A.M.; Chanton, J.P.; Bebout, B.M. Substrate limitation for methanogenesis in hypersaline environments. Astrobiology 2012, 12, 89–97. [Google Scholar] [CrossRef]
  83. Teufel, R.; Mascaraque, V.; Ismail, W.; Voss, M.; Perera, J.; Eisenreich, W.; Haehnel, W.; Fuchs, G. Bacterial phenylalanine and phenylacetate catabolic pathway revealed. Proc. Natl. Acad. Sci. USA 2010, 107, 14390–14395. [Google Scholar] [CrossRef] [Green Version]
  84. Fathepure, B.Z. Recent studies in microbial degradation of petroleum hydrocarbons in hypersaline environments. Front. Microbiol. 2014, 5, 173. [Google Scholar] [CrossRef] [PubMed] [Green Version]
  85. Oren, A. The bioenergetic basis for the decrease in metabolic diversity at increasing salt concentrations: Implications for the functioning of salt lake ecosystems. In Saline Lakes; Springer: Dordrecht, The Netherlands, 2001; pp. 61–72. [Google Scholar]
  86. Bauld, J. Benthic microbial communities of Australian saline lakes. In Limnology in Australia; Springer: Dordrecht, The Netherlands, 1986; pp. 95–111. [Google Scholar]
  87. McMaster, K.; Savage, A.; Finston, T.; Johnson, M.S.; Knott, B. The recent spread of Artemia parthenogenetica in Western Australia. Hydrobiologia 2007, 576, 39–48. [Google Scholar] [CrossRef]
  88. Geddes, M.C. Occurrence of the brine shrimp Artemia (Anostraca) in Australia. Crustaceana 1979, 36, 225–228. [Google Scholar] [CrossRef] [Green Version]
  89. Edwards, D.H.D. Inland water of Rottnest Island. J. R. Soc. West. Aust. 1983, 66, 41–47. [Google Scholar]
  90. Mather, S. Summer migrants—The importance of Rottnest Island for trans-equatorial bird species. J. East Asian Australas. Flyway 2020, 73–74, 29–36. [Google Scholar]
Figure 1. Location of the sampling points within the five lakes (Garden Lake, Herschel Lake, Lake Baghdad, Lake Vincent and Serpentine Lake) at Rottnest Island. Please refer to Table S1 for the GPS coordinates of each sampling point.
Water 13 01899 g001
Figure 2. Composition of microbial communities in water across the five lakes (Baghdad, Garden, Herschel, Serpentine and Vincent) based on Bact16S (GenBank Database), and main environmental parameters driving the community assemblages. (A) Venn diagram showing the number of reads corresponding to ZOTUs both unique to each system and shared among the five lakes; (B) dot plot displaying the composition and abundance of the classes identified through metabarcoding analyses; (C) boxplots of the average α-diversity, Shannon diversity index (H) and Pielou’s evenness index (J) per each lake (different letters (a, b, c, d) indicate statistically significant (Tukey’s HSD test, p < 0.05) results, see Table S3 for the significances of the pairwise comparisons); (D) principal coordinates analysis (PCoA) based on the phylogenetic distances of the microbial communities across the five lakes; arrows indicate the magnitude and direction of the most significant environmental variables associated with bacterial community structure (see Table S4 for the r2 values associated to each parameter).
Water 13 01899 g002
Figure 3. Comparison between the metabolic potential of microbial communities occurring in Rottnest lakes. (A) Dot plot displaying the relative abundance of predicted potential microbial metabolisms (Reference KEGG pathway: map01120). Replicates were averaged to show one representative value per lake. (B) PCA-based ordination analysis illustrating the clustering of the lakes according to the KOs from individual samples.
Water 13 01899 g003
Figure 4. Schematic summary of the main taxonomic and functional patterns detected at each lake. TDS, total dissolved solids; Alk, alkalinity.
Water 13 01899 g004
Table 1. Mean values (±SD) of the hydrochemical parameters within the lakes Baghdad, Garden, Herschel, Serpentine and Vincent. Different letter (a, b, c, d, e) combinations indicate significantly different values (Tukey’s HSD test, p < 0.05) across the lakes. DO, dissolved oxygen; NH3, ammonia; TDS, total dissolved solids; Cl, chloride; Br, bromide; SO42−, sulphates; DOC, dissolved organic carbon; TN, total nitrogen. Refer to Table S2 and for the significances of the pairwise comparisons.
LakepHDOTemperatureAlkalinityNH3TDSClBrSO42−DOCTN
(mg L−1)(°C)(mg CaCO3 L−1)(mg L−1)(mg L−1)(g L−1)(g L−1)(g L−1)(mg L−1)(mg L−1)
Baghdad9.34 ± 0.26 a3.57 ± 0.85 a25.85 ± 0.57 a190.83 ± 4.45 a0.31 ± 0.01 a146.66 ± 4.32 a105.27 ± 0.16 a0.26 a7.62 ± 0.01 a50.95 ± 0.49 a7.85 ± 0.07 a
Garden 6.70 ± 0.01 b2.93 ± 0.20 ab25.82 ± 0.04 a183.49 ± 7.56 a0.21 ± 0.01 bc118 ± 1.63 b81.22 ± 0.08 b0.2 c7.47 ± 0.01 b30.25 ± 0.35 b3.3 ± 0.14 b
Herschel 6.49 ± 0.10 bd1.84 ± 0.03 b24.62 ± 0.14 a219.53 ± 7.12 b0.35 ± 0.04 a185.33 ± 3.40 c147.01 ± 0.24 c0.36 b4.03 ± 0.01 c63.6 ± 0.28 c8.25 ± 0.21 a
Serpentine6.41 ± 0.17 bd2.61 ± 0.92 ab21.08 ± 1.22 b224.20 ± 4.00 b0.27 ± 0.02 ac186.67 ± 0.94 c138.27 ± 0.26 d0.34 ± 0.01 b 12.17 ± 0.02 d48.8 ± 0.28 d6.4 c
Vincent6.16 ± 0.05 cd3.06 ± 0.19 ab22.34 ± 0.10 b192.17 ± 4.00 a0.30 ± 0.02 a144 ± 1.63 a109.94 ± 2.29 a0.26 ± 0.01 a7.74 ± 0.01 e54.9 ± 0.71 e8.3 ± 0.14 a
Publisher’s Note: MDPI stays neutral with regard to jurisdictional claims in published maps and institutional affiliations.

