
Recent Changes in Temperature and Precipitation of the Summer and Autumn Seasons over Fujian Province, China
by
Zhiguo Ma
1,*, 
Qinyu Guo
2,
Feiyue Yang
1,
Huiling Chen
1,
Wenqing Li
3,
Lili Lin
4 and
Chaoyuan Zheng
2,* 1
Meteorological Science Institute in Fujian Province, Fuzhou 350001, China
2
College of Resources and Environment, Fujian Agriculture and Forestry University, Fuzhou 350002, China
3
Fujian Institute of Tobacco Agricultural Sciences, Fuzhou 350003, China
4
College of Computer and Information Sciences, Fujian Agriculture and Forestry University, Fuzhou 350002, China
*
Authors to whom correspondence should be addressed.
Water 2021, 13(14), 1900; https://doi.org/10.3390/w13141900
Submission received: 24 May 2021
/
Revised: 29 June 2021
/
Accepted: 5 July 2021
/
Published: 9 July 2021
(This article belongs to the Special Issue Modelling Precipitation in Space and Time)
Abstract
:Based on the observation data of daily temperature and precipitation in summer and autumn of 68 representative meteorological stations in Fujian Province from 1971 to 2018, using the climate Tendency Rate, Mann-Kendall trend test, Morlet wavelet analysis and other methods, this paper analyzes the variation trends of air temperature and annual precipitation and the wavelet periodic variation characteristics of annual precipitation time series in summer and autumn of Fujian Province over a period of approximately 48 years. The results show that over the approximately 48 years, the temperature and precipitation in summer and autumn in Fujian showed an obvious upward trend, which had a mutation around 2000, but the mutation time was different, and the precipitation was slightly earlier. The annual temperature and precipitation in summer and autumn experienced three oscillations on the 28a scale. In the 28a time scale of summer autumn seasonal oscillation, there are three negative centers and two positive centers. According to the characteristics of annual average temperature and annual precipitation in the first major cycle, the annual precipitation in summer and autumn will continue to increase in the future.
1. Introduction
Under the background of global warming mainly due to climate change, the presentation of temperature warming trends, resulting in the heat resources of agricultural climates increasing, has a major impact on agricultural production [1,2,3]. According to some studies, global warming in the last 100 years has been more obvious, especially over the last approximately 48 years. This warming is obvious on the millennium scale, and the warming in the last 100 years has been as high as 0.85~0.89 °C, given in the Fifth Assessment Report of the Intergovernmental Panel on Climate Change (IPCC; 2013) [4,5]. The measurement of the amount of heat resources mainly includes the temperature, the accumulated temperature, the limit temperature, and the length of the frost-free period. Domestic scholars have done a lot of research on the characteristics and trends of changes in temperature, heat, etc., but the rate of change in different regions is different, and the impact on different crops is also different [6,7,8,9,10].
According to the Fifth Assessment Report of the Intergovernmental Panel on Climate Change (IPCC), the decreasing trend of precipitation and the increasing trend of evapotranspiration leads to drought [5]. Therefore, detecting the trend change of precipitation and temperature around the world is very important [11,12,13,14,15]. The planning and utilization of water resources is largely dependent on monsoon rainfall, but the unpredictable and uneven distribution of rainfall over time and space can lead to flooding in some parts of the region and drought in others. For hydrologists, agriculturalists, and meteorologists, the analysis of spatial and temporal variations of rainfall and temperature is of great significance in the sustainable utilization of water resources, flood control, and drought resistance [16,17,18].
Fujian Province is located in the southeast coastal region and belongs to the subtropical climate. The heat conditions and abundant rainfall in the second half of the year are good, which is beneficial to the development of agricultural production. Understanding the climate change laws of thermal resources in Fujian during the summer and autumn seasons will help to rationally lay out the agricultural planting structure, reduce the impact of natural disasters, and improve the utilization efficiency of climate resources. To our knowledge, there are few studies on the coordination of water and heat in summer and autumn in Fujian. Therefore, in this work we analyzed the trend and periodic characteristics of water and heat changes in summer and autumn based on the daily meteorological data of 68 meteorological stations in Fujian Province from 1971 to 2018, with a view to high yield and quality of agriculture providing a scientific basis.
2. Materials and Methods
2.1. Study Area
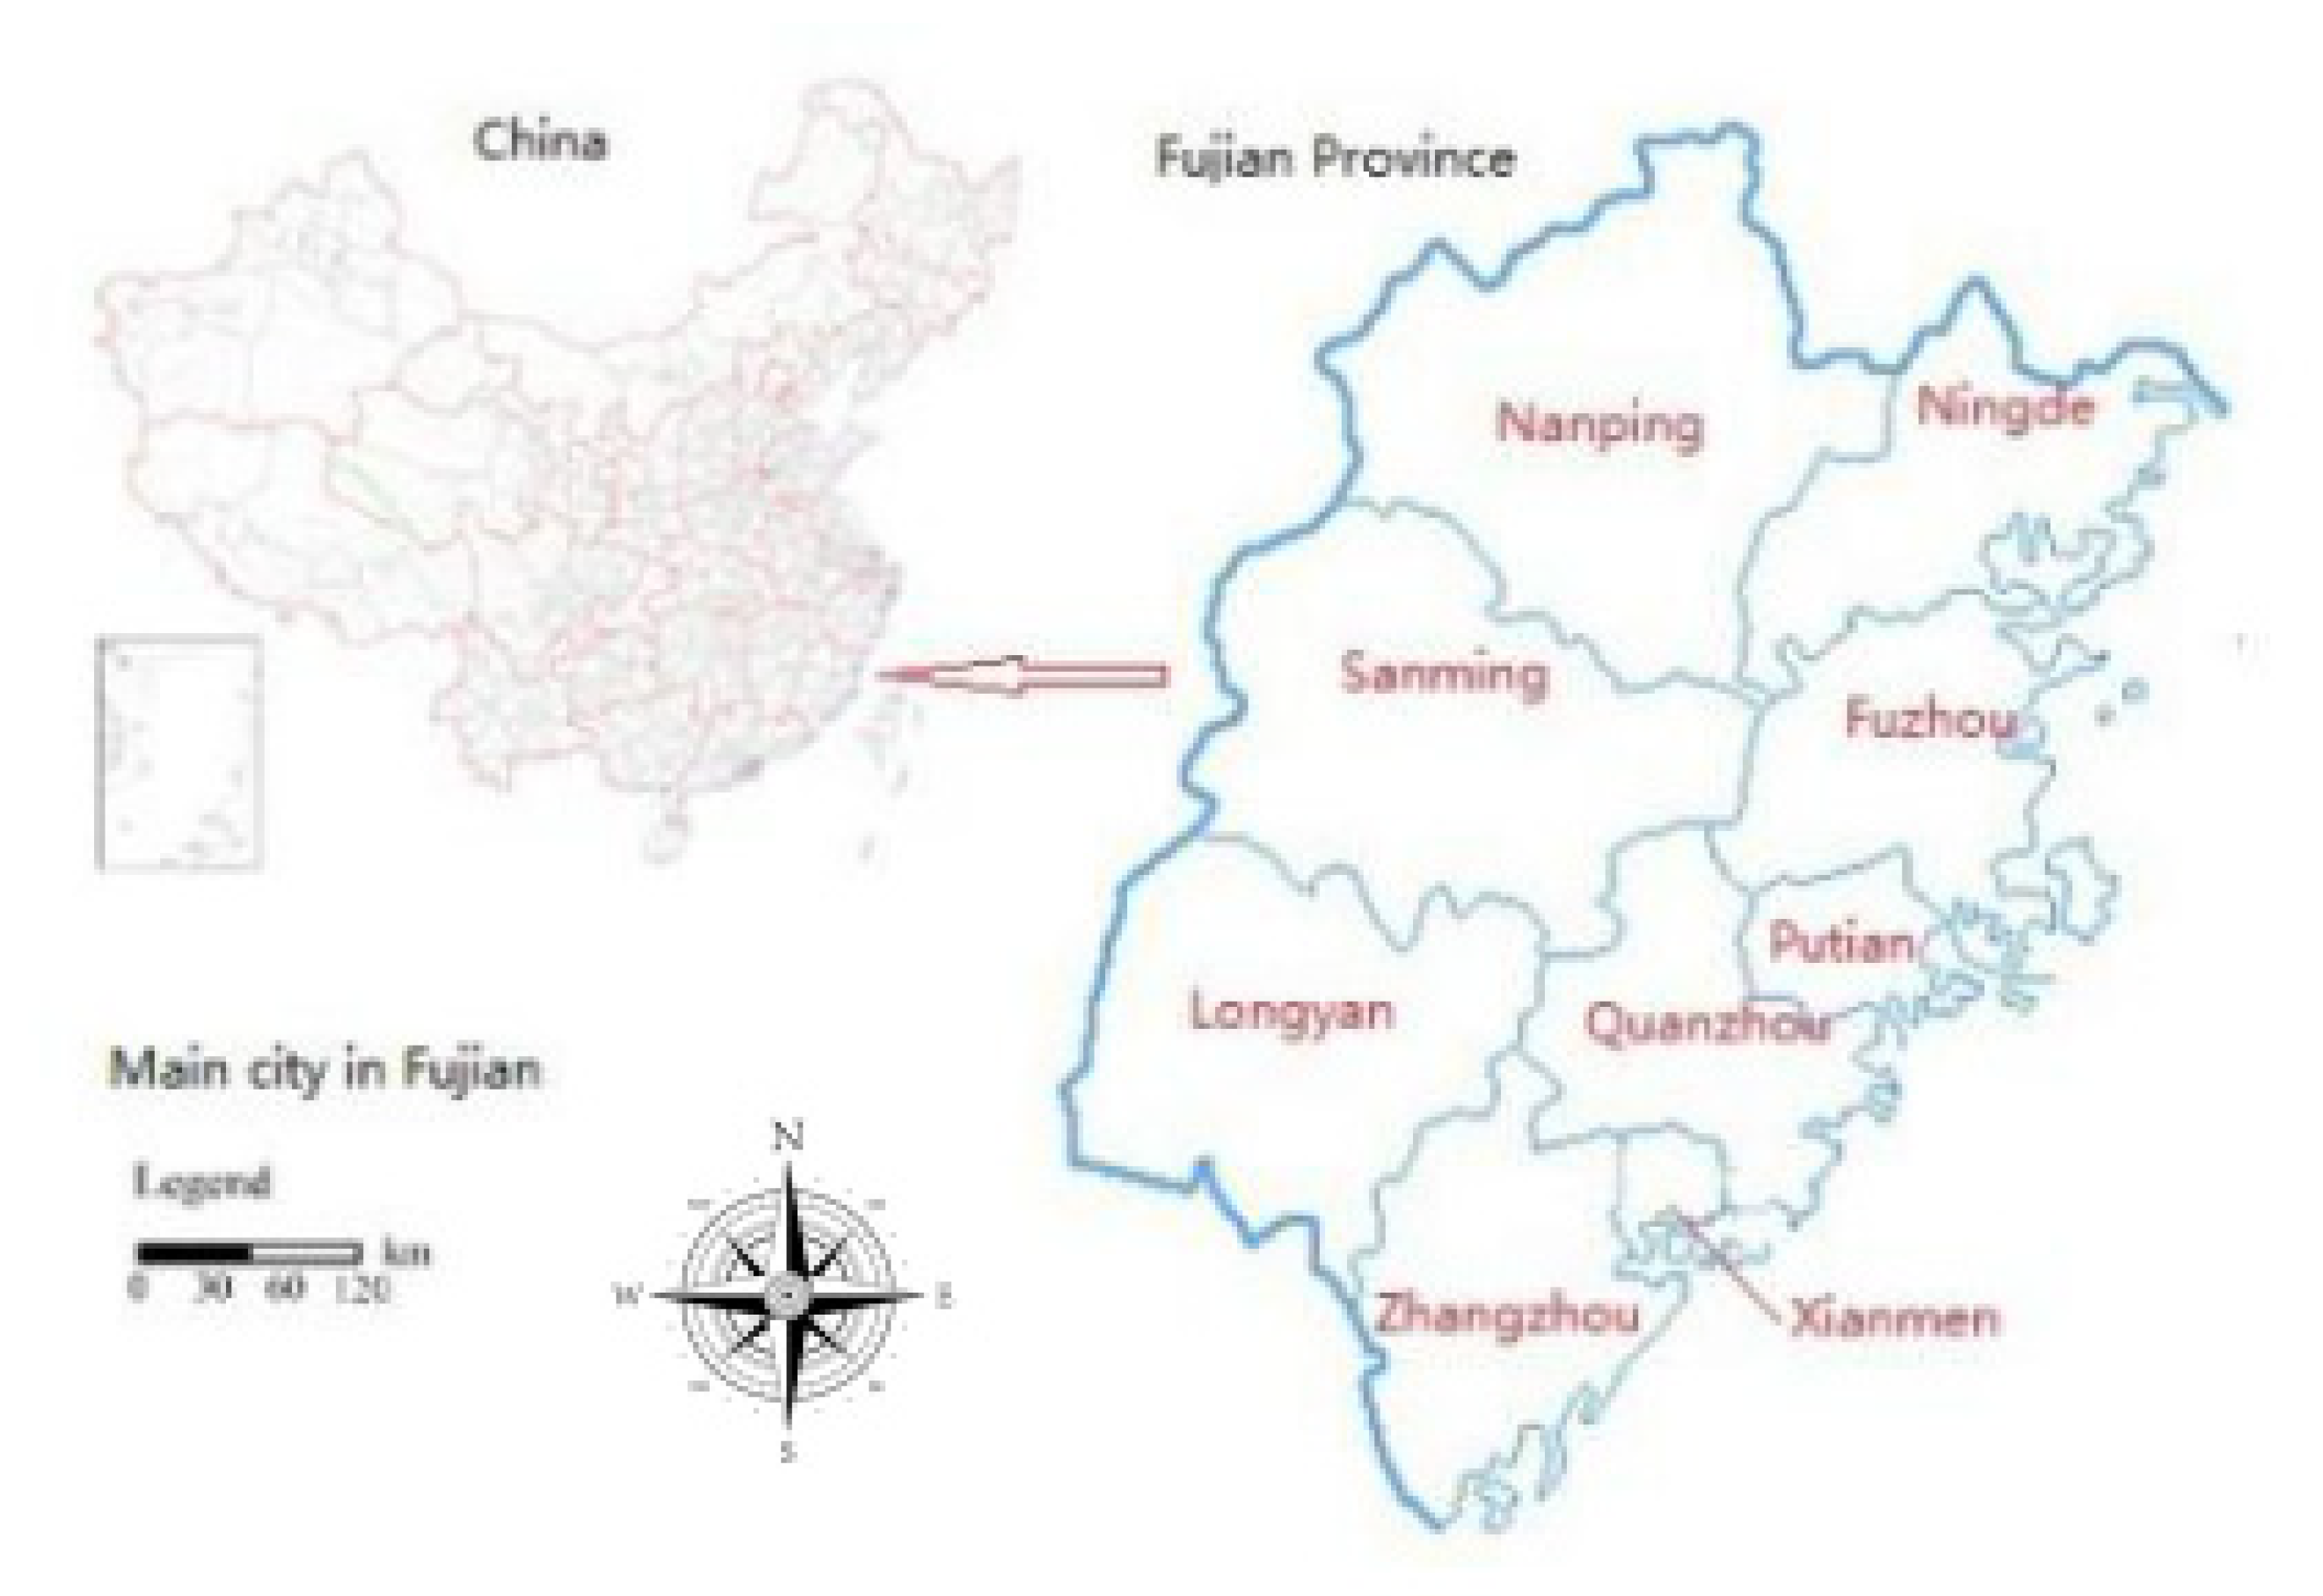
Fujian is located in the southeast of China and near the East China Sea (Figure 1). Its land area is between 23°33′ and 28°20′ north latitude, 115°50′ and 120°40′ east longitude. The terrain is dominated by mountains and hills, which account for about eighty-five percent of the province’s total area and are mainly concentrated in the west and central regions. The province has a land area of 121,400 square kilometers and more than 3300 km of coastline, with a resident population of nearly 37 million people. The climate is subtropical and monsoon, with plenty of rain and light. The climatic region difference is large; the southeast Fujian coastal area belongs to the south subtropical climate, the northeast, the north and the west of Fujian belong to the middle subtropical climate.
2.2. Data Sources and Processing
The meteorological data used in this paper is from the Fujian Meteorological Bureau, and the daily meteorological data (temperature and precipitation) of 1971–2018 (June–November) from 68 meteorological stations in the research area of Fujian province were selected. Where part of the meteorological station daily value data was missing or abnormal, linear interpolation of mean or median value methods were used to supplement the missing data, according to the situation [19,20]. After filling in the missing values, the correlative tests were carried out with adjacent stations [21,22].
2.3. Data Processing Method
2.3.1. Climate Tendency Rate
The climate tendency rate reflects the changing trend of climate elements, which can be calculated using linear regression. The calculation formula of linear regression coefficient (a) sample (Yi) and time is as follows:
where t, b, and 10 × a are time series, empirical coefficient, and climate tendency rate, respectively. Coefficients a and b are estimated by the least square method. Regression coefficient b can reflect the change trend of meteorological factors. a > 0 indicates an increasing trend, while a < 0 suggests a decreasing trend.
Yi = at + b
2.3.2. Pearson Correlation
Pearson correlation coefficients are often used to detect whether independent and dependent variables are correlated. Their values range between −1 and 1. The formula is as follows:
where Px,y is correlation coefficient between variable x and variable y, x, and y is respectively the average value. The standard deviation, root mean square error, and Pearson coefficient of the meteorological factors were calculated [23].
When r > 0, it indicates that two variables are positively correlated, that is, the greater the value of one variable is, the greater the value of the other variable will be.
When r < 0, it indicates that the two variables are negatively correlated, that is, the larger the value of one variable is, the smaller the value of the other variable will be.
When r = 0, it indicates that the two variables are not linearly correlated (note that the correlation is only nonlinear), but may be correlated in other ways (such as in a curvilinear manner).
When r is equal to 1 and negative 1, that means that the two variables X and Y can be well described by the equation of the line, and all of the sample points fall nicely on a line.
2.3.3. Sen’s Slope Estimator
The Theil-Sen Median method, also known as Sen’s slope estimation, is a robust non-parametric statistical trend calculation method [24]. This method can significantly reduce the influence of outliers and has a high computational efficiency. It is often used for trend analysis of long-term series data. Sen’s slope method is often used in combination with the Mann-Kendall trend test to determine the significance of a sequence trend [25,26,27,28]. Sen’s slope (Tx) of all data pairs is calculated using the following equation:
where xj and xk are data values at time j and k (j > k) separately. The median of these n values of Tx is represented by Sen’s slope of estimation (true slope) which is calculated using the following equation:
Sen’s estimator (Si) is calculated using the above equation depending upon the value of n either odd or even and then Si is computed using 100 (1 − a) % confidence interval using the nonparametric test depending upon normal distribution. A positive value of Si indicates increasing (upward) trend while a negative value of Si represents downward or decreasing trend of time series data [29].
2.3.4. Mann-Kendall Trend Testing
The Mann-Kendall trend test is another non-parametric method for detecting the significance of the trends of climate variables [30,31]. Compared with parameter tests, the advantage of the M-K trend test is that its sample does not need to follow certain distribution requirements nor is it affected by a few outliers, so it is more suitable for type variables and sequential variables. The trend analysis method has been used widely in hydrology and meteorology in recent years [32,33].
The M-K test statistic S is calculated as:
where xj and xk are time series value of the jth and kth years (k > j) and n is the length of time series. The sgn(xk − xj) is sign function.
The standard normal test statistic ZS is computed as:
In this paper, we used a confidence level of α = 0.05 to test the data and find out the change points through the M-K test and to analyze the trend of meteorological factors. When the Sen’s trend degree is β > 0, the time series exhibits an upward trend; and when β < 0, the time series exhibits a downward trend. Moreover, when the statistical quantity |Zs| > 1.96 in the M-K trend test, the trend passes the 0.05 significant level; otherwise, the trend does not pass the 0.05 significance level. A sequential Mann-Kendall test that estimates progressive (UF) and backward (UB) series was used to detect abrupt variation years in the study series [34,35,36].
2.3.5. Morlet Wavelet Analysis
Continuous wavelet transform (CWT) was developed based on Fourier transform. It adopted variable size and movable change window for spectrum analysis, which can obtain time-frequency coupling characteristics of data series, and became an effective tool for analyzing time series.
Morlet wavelet analysis [37] was used to characterize the periodic variations. Wavelet transformation can reflect the periodic changes in the temperature and precipitation on different time scales and their distribution in the time domain. The wavelet variance reflects the distribution of the temperature and precipitation with the time scale. It can be used to determine the main oscillation period in the evolution process.
Morlet wavelet was selected as the basic wavelet, and was calculated as follows:
where a is a constant. When a is ≥ 5, the Morlet wavelet satisfies the permissible condition. It is the time variable.
y(t) = eiate − t2/2
3. Results
3.1. Temporal Variations
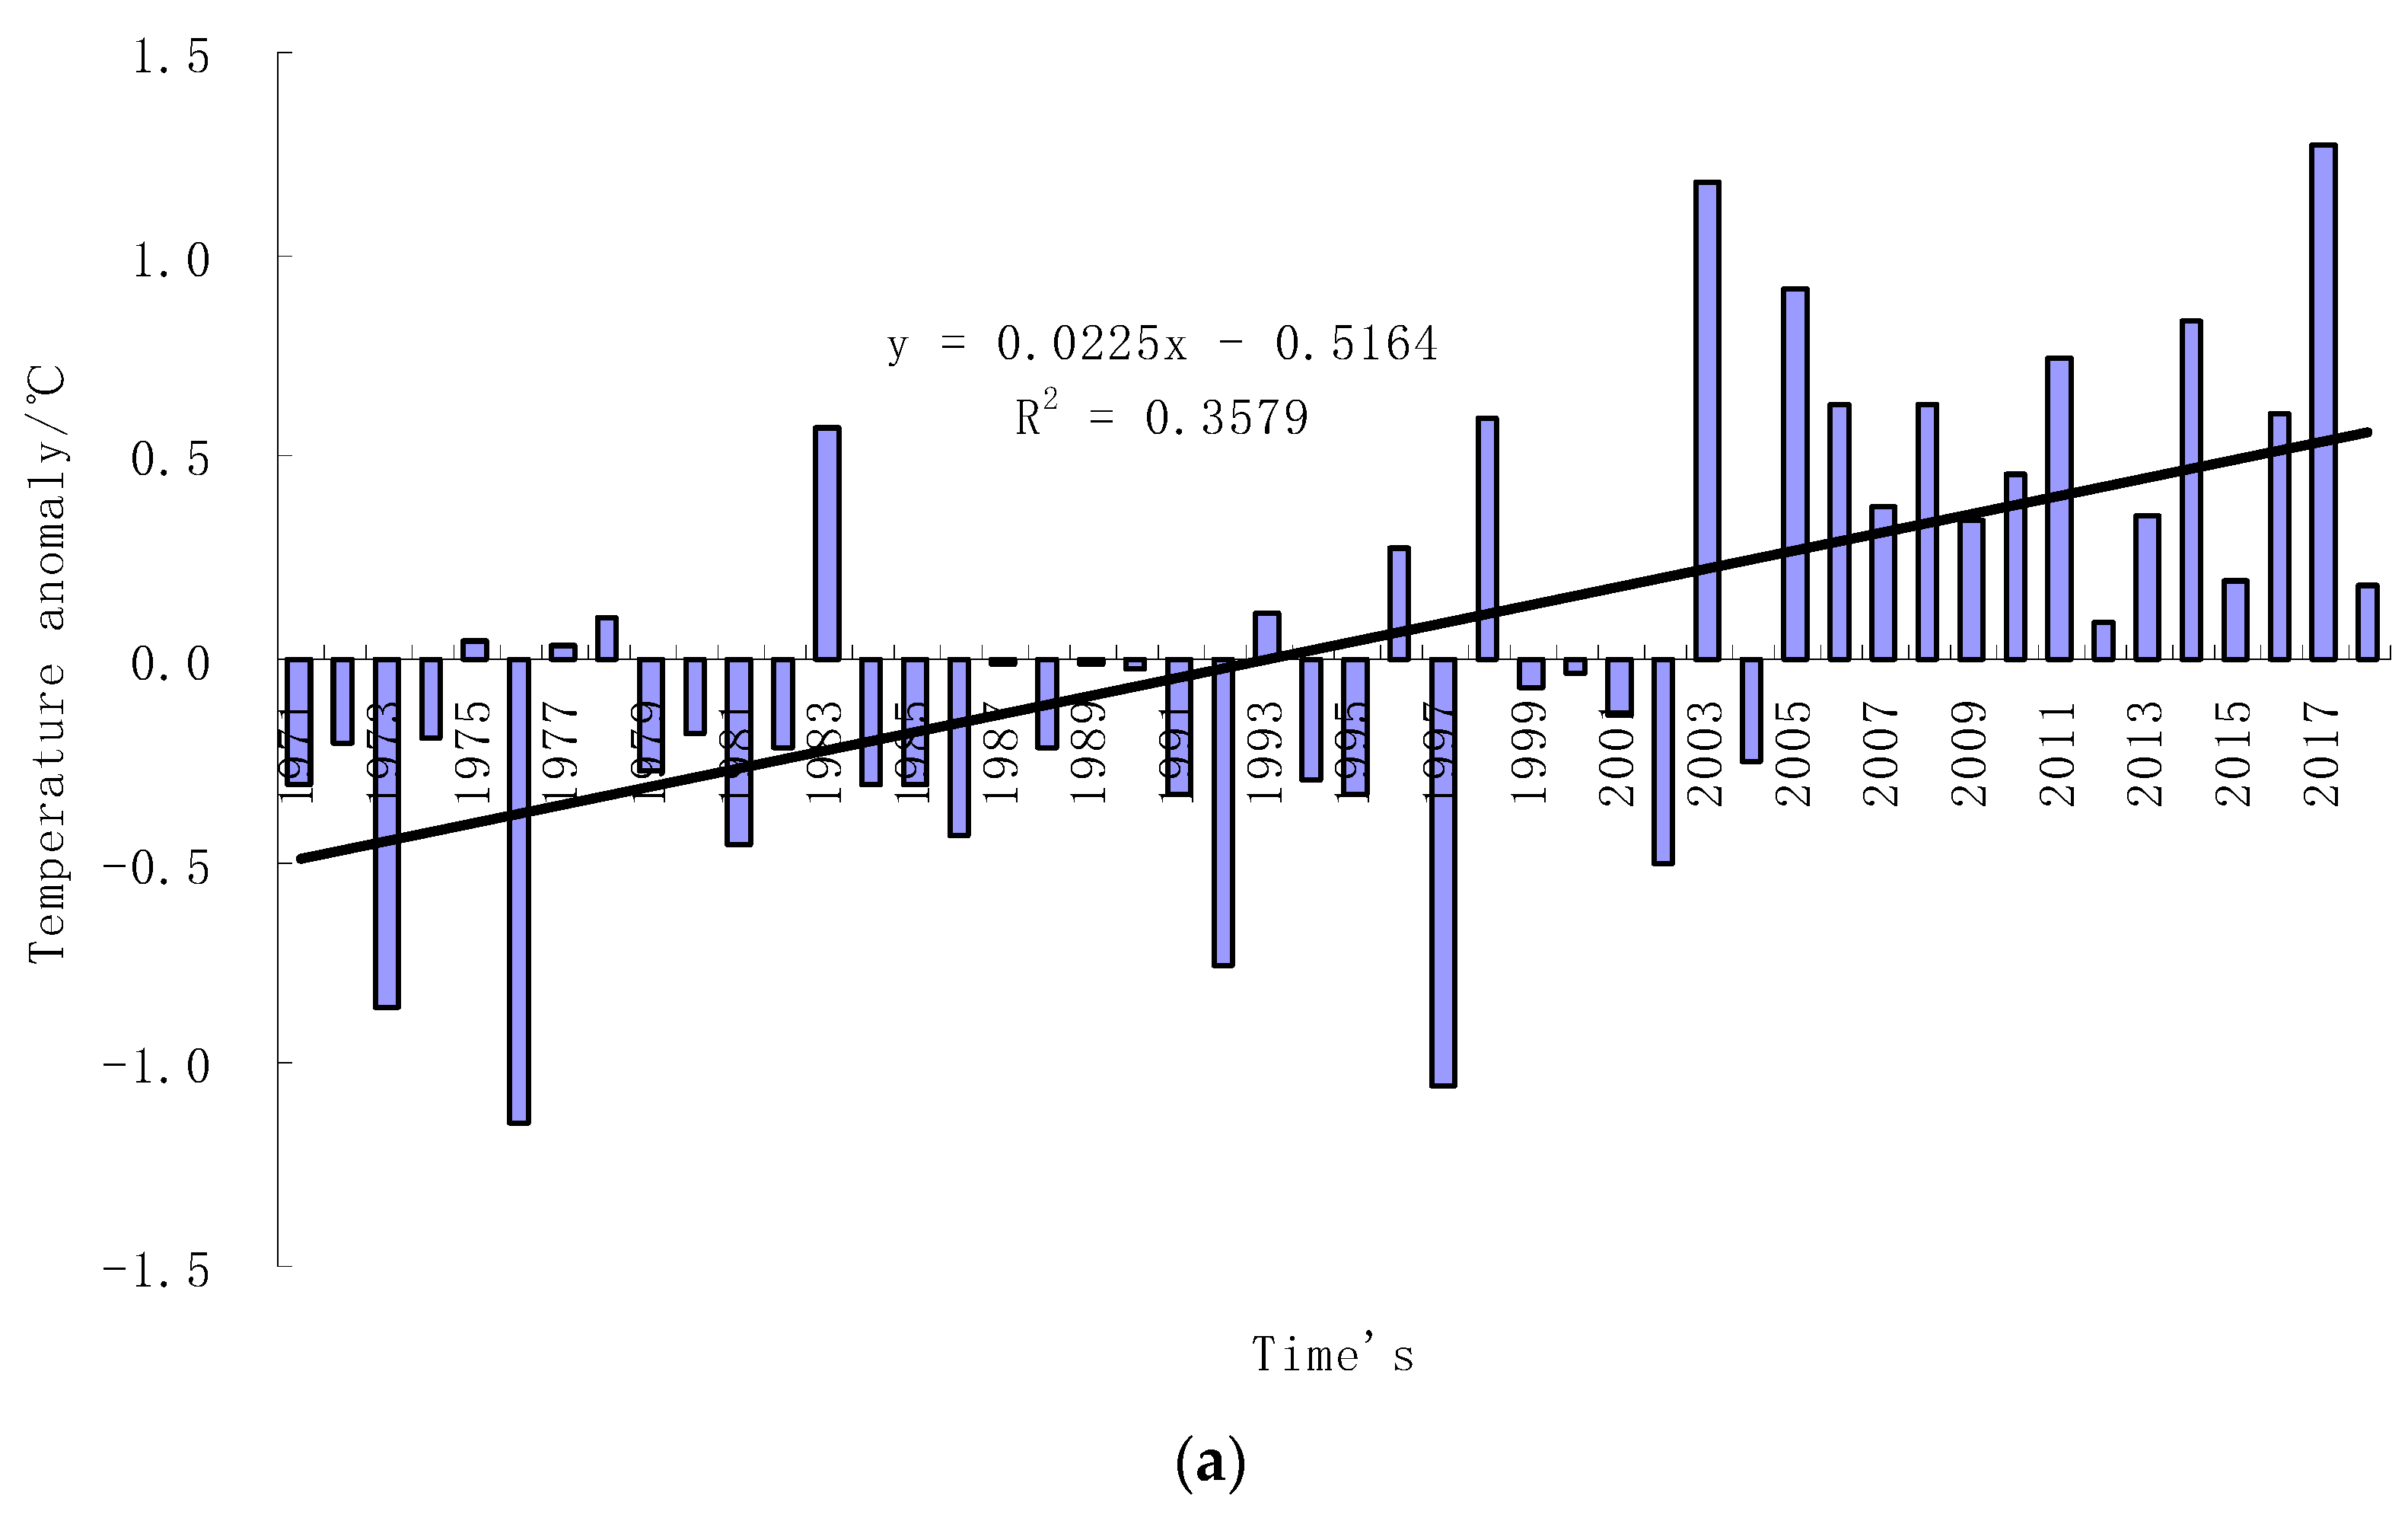
Table 1 presents a summary of the results of the analysis of the of temperature and precipitation in summer and autumn in Fujian from 1971 to 2018. Thus, it can be seen that the average annual temperature was 24.7 °C, the standard deviation was 0.5 °C, and the coefficient of variation was 2.1. The highest value of annual temperature was 26.0 °C in 2017, the lowest value was 23.6 °C in 1997, and the difference was 2.4 °C. In terms of the decadal coefficient of variation, the phase characteristics of temperature changes are obvious. The fluctuations were large in the 1990s and 2000s, declined in the 1980s, and then continued to rise with a clear upward trend (Figure 2). The Z-value of the Mann-Kendall trend test is 3.92, and the reliability value of 99% is 2.32, showing an extremely significant upward trend (p < 0.01), and the Sen’s slope is 0.21 °C/decade. The unary linear fitting equation of the annual average temperature is y = 0.0225x + 24.184, and the climate tendency rate is 0.225 °C/decade, which is close to the Sen’s slope result; the variance is 0.6, which also passes the test of the significance level of 0.01.
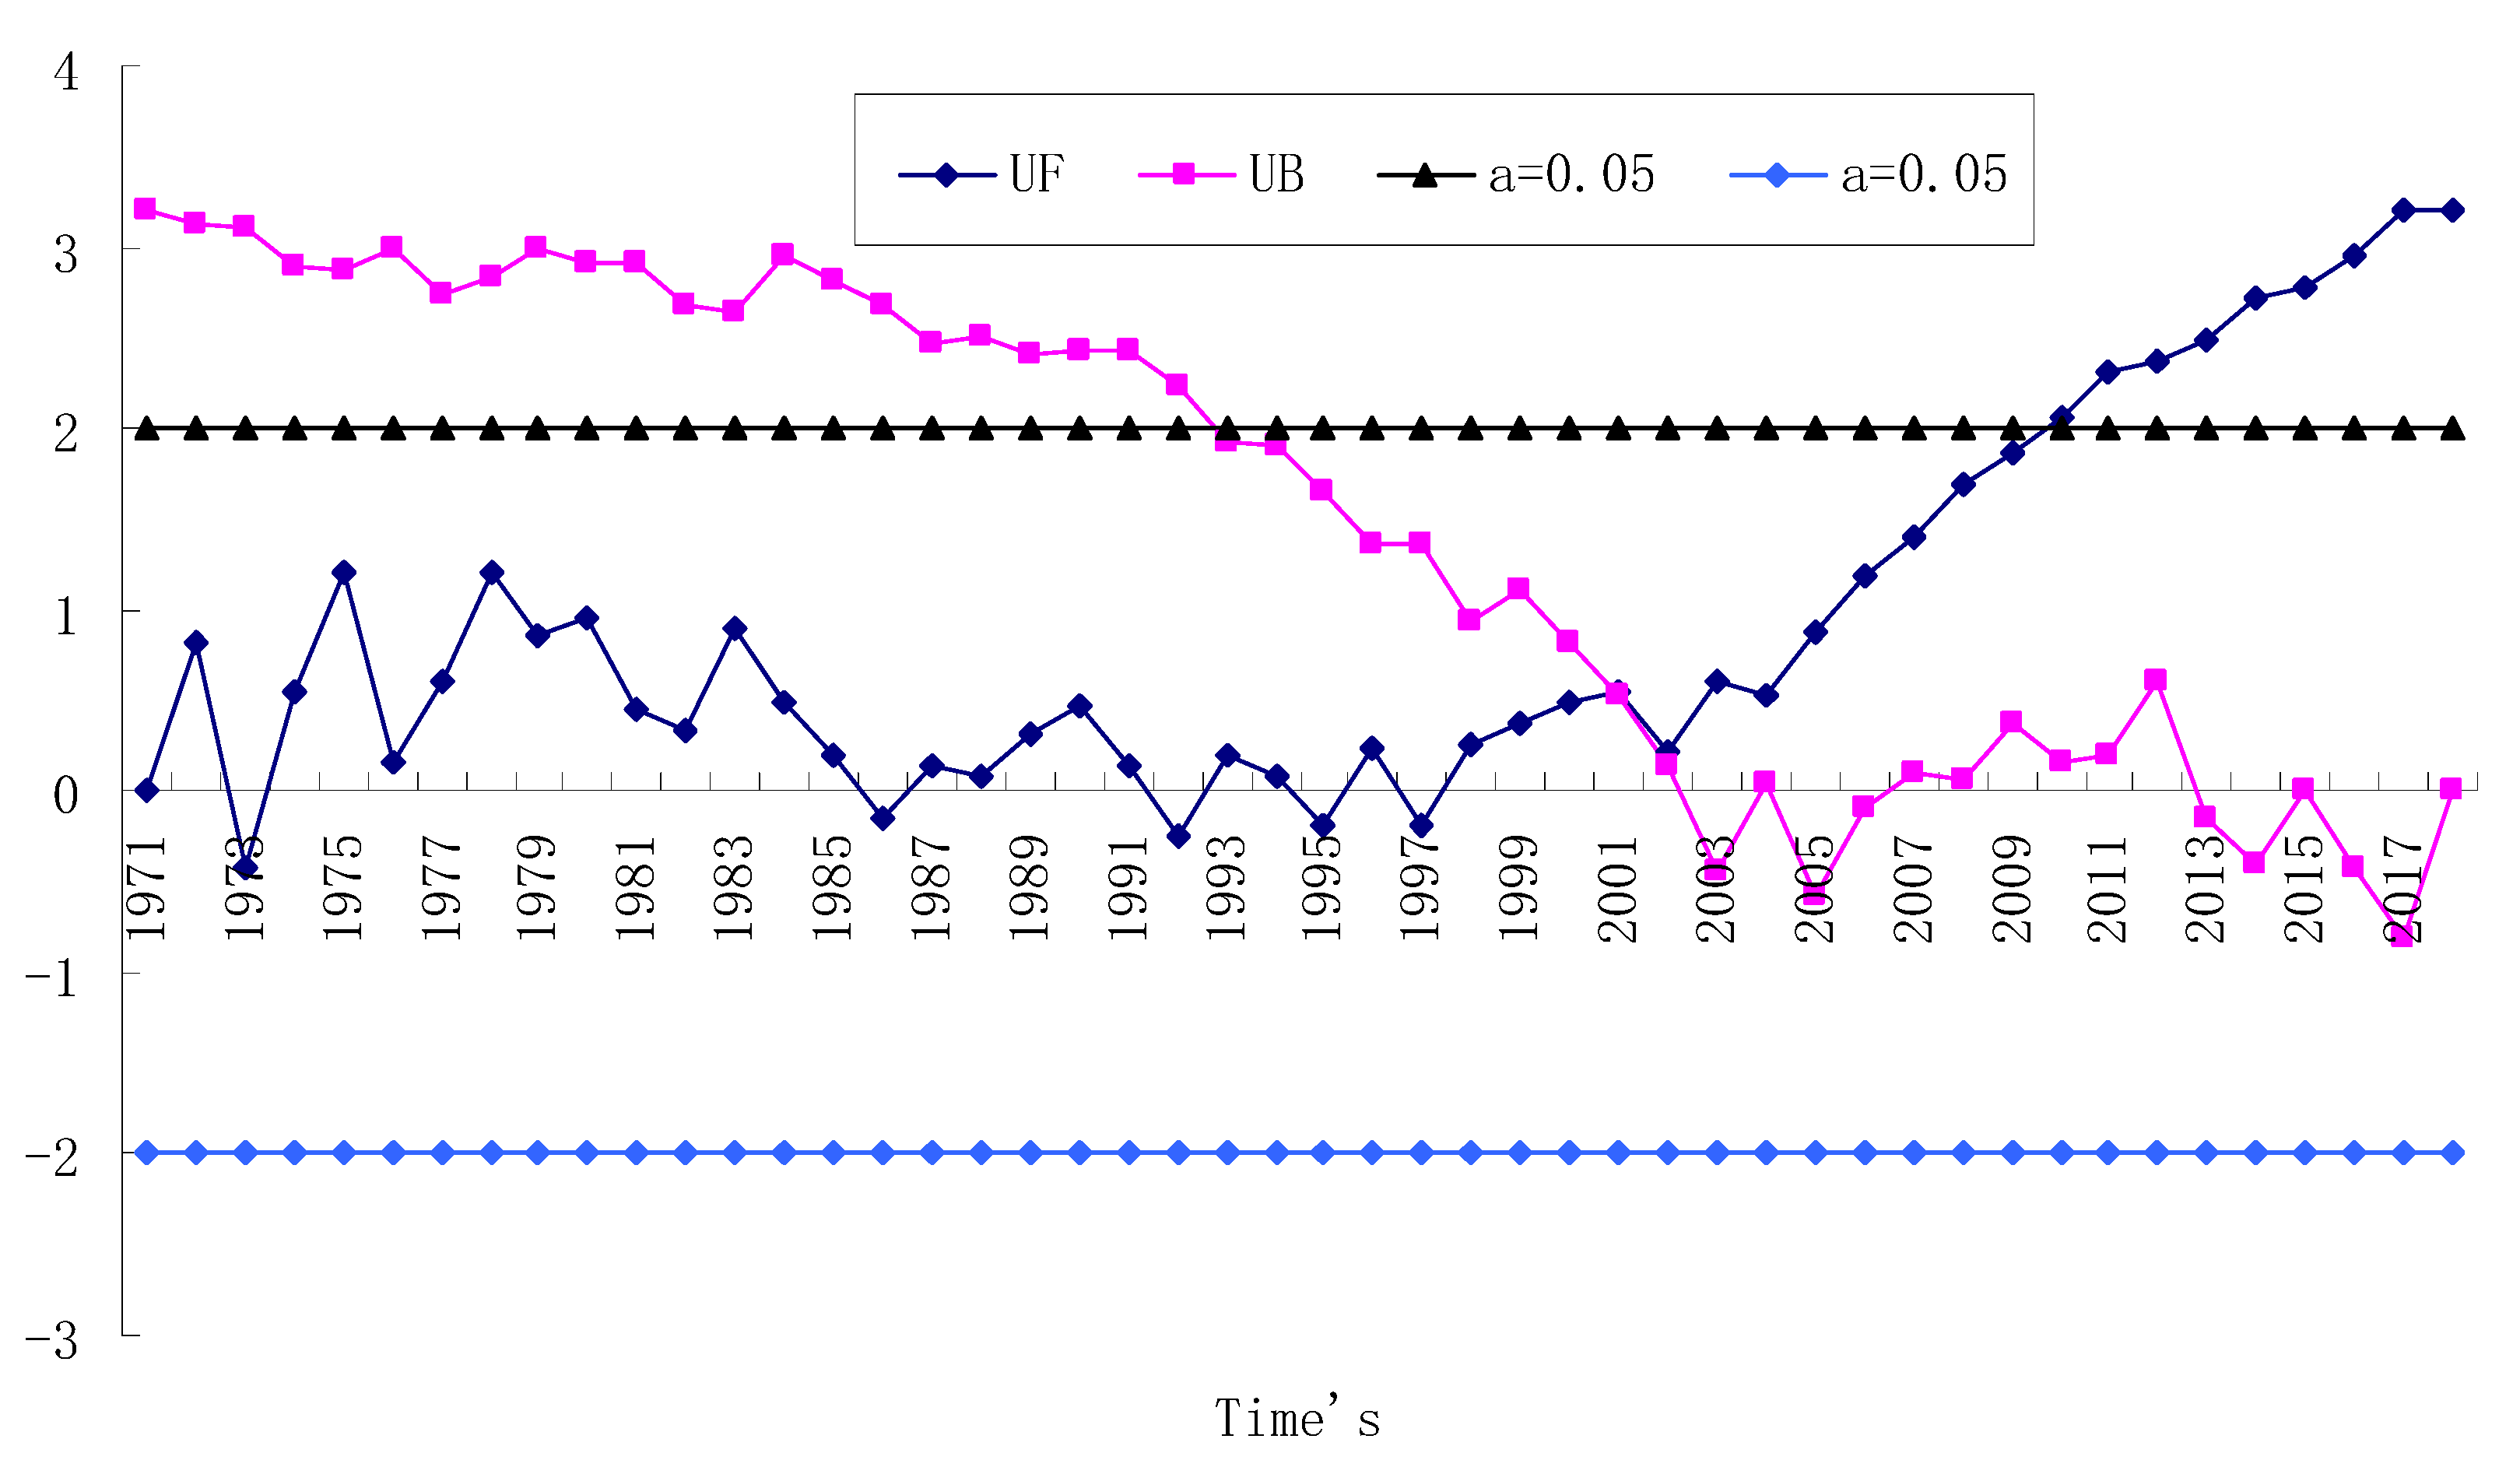
In order to further analyze the inter-decadal variation of the annual average temperature characteristics, the Mann-Kendall mutation test was performed on each sequence, and the results are shown in Figure 3. It can be seen from the Mann-Kendall mutation test result UF (Figure 3) that the average annual temperature in summer and autumn showed a minimum value in the early 1970s and the early 1990s, and fluctuated between 0 and 2. After 2000, it entered a relatively stable growth trend. The UF and UB curves intersect at a point in 2001; the intersection point is between the 5% significant level critical line, and the UF curve exceeds the 0.05 significant level critical line after 2010, indicating that the annual average temperature in the summer and autumn in Fujian has changed from lower significant mutations to high, and the mutations occurred in 2001. In the 21st century, the temperature began to increase and remained at a level representing a positive anomaly for many years. This is very consistent with the above-mentioned analysis of inter-decadal changes in the time domain of annual average temperature.
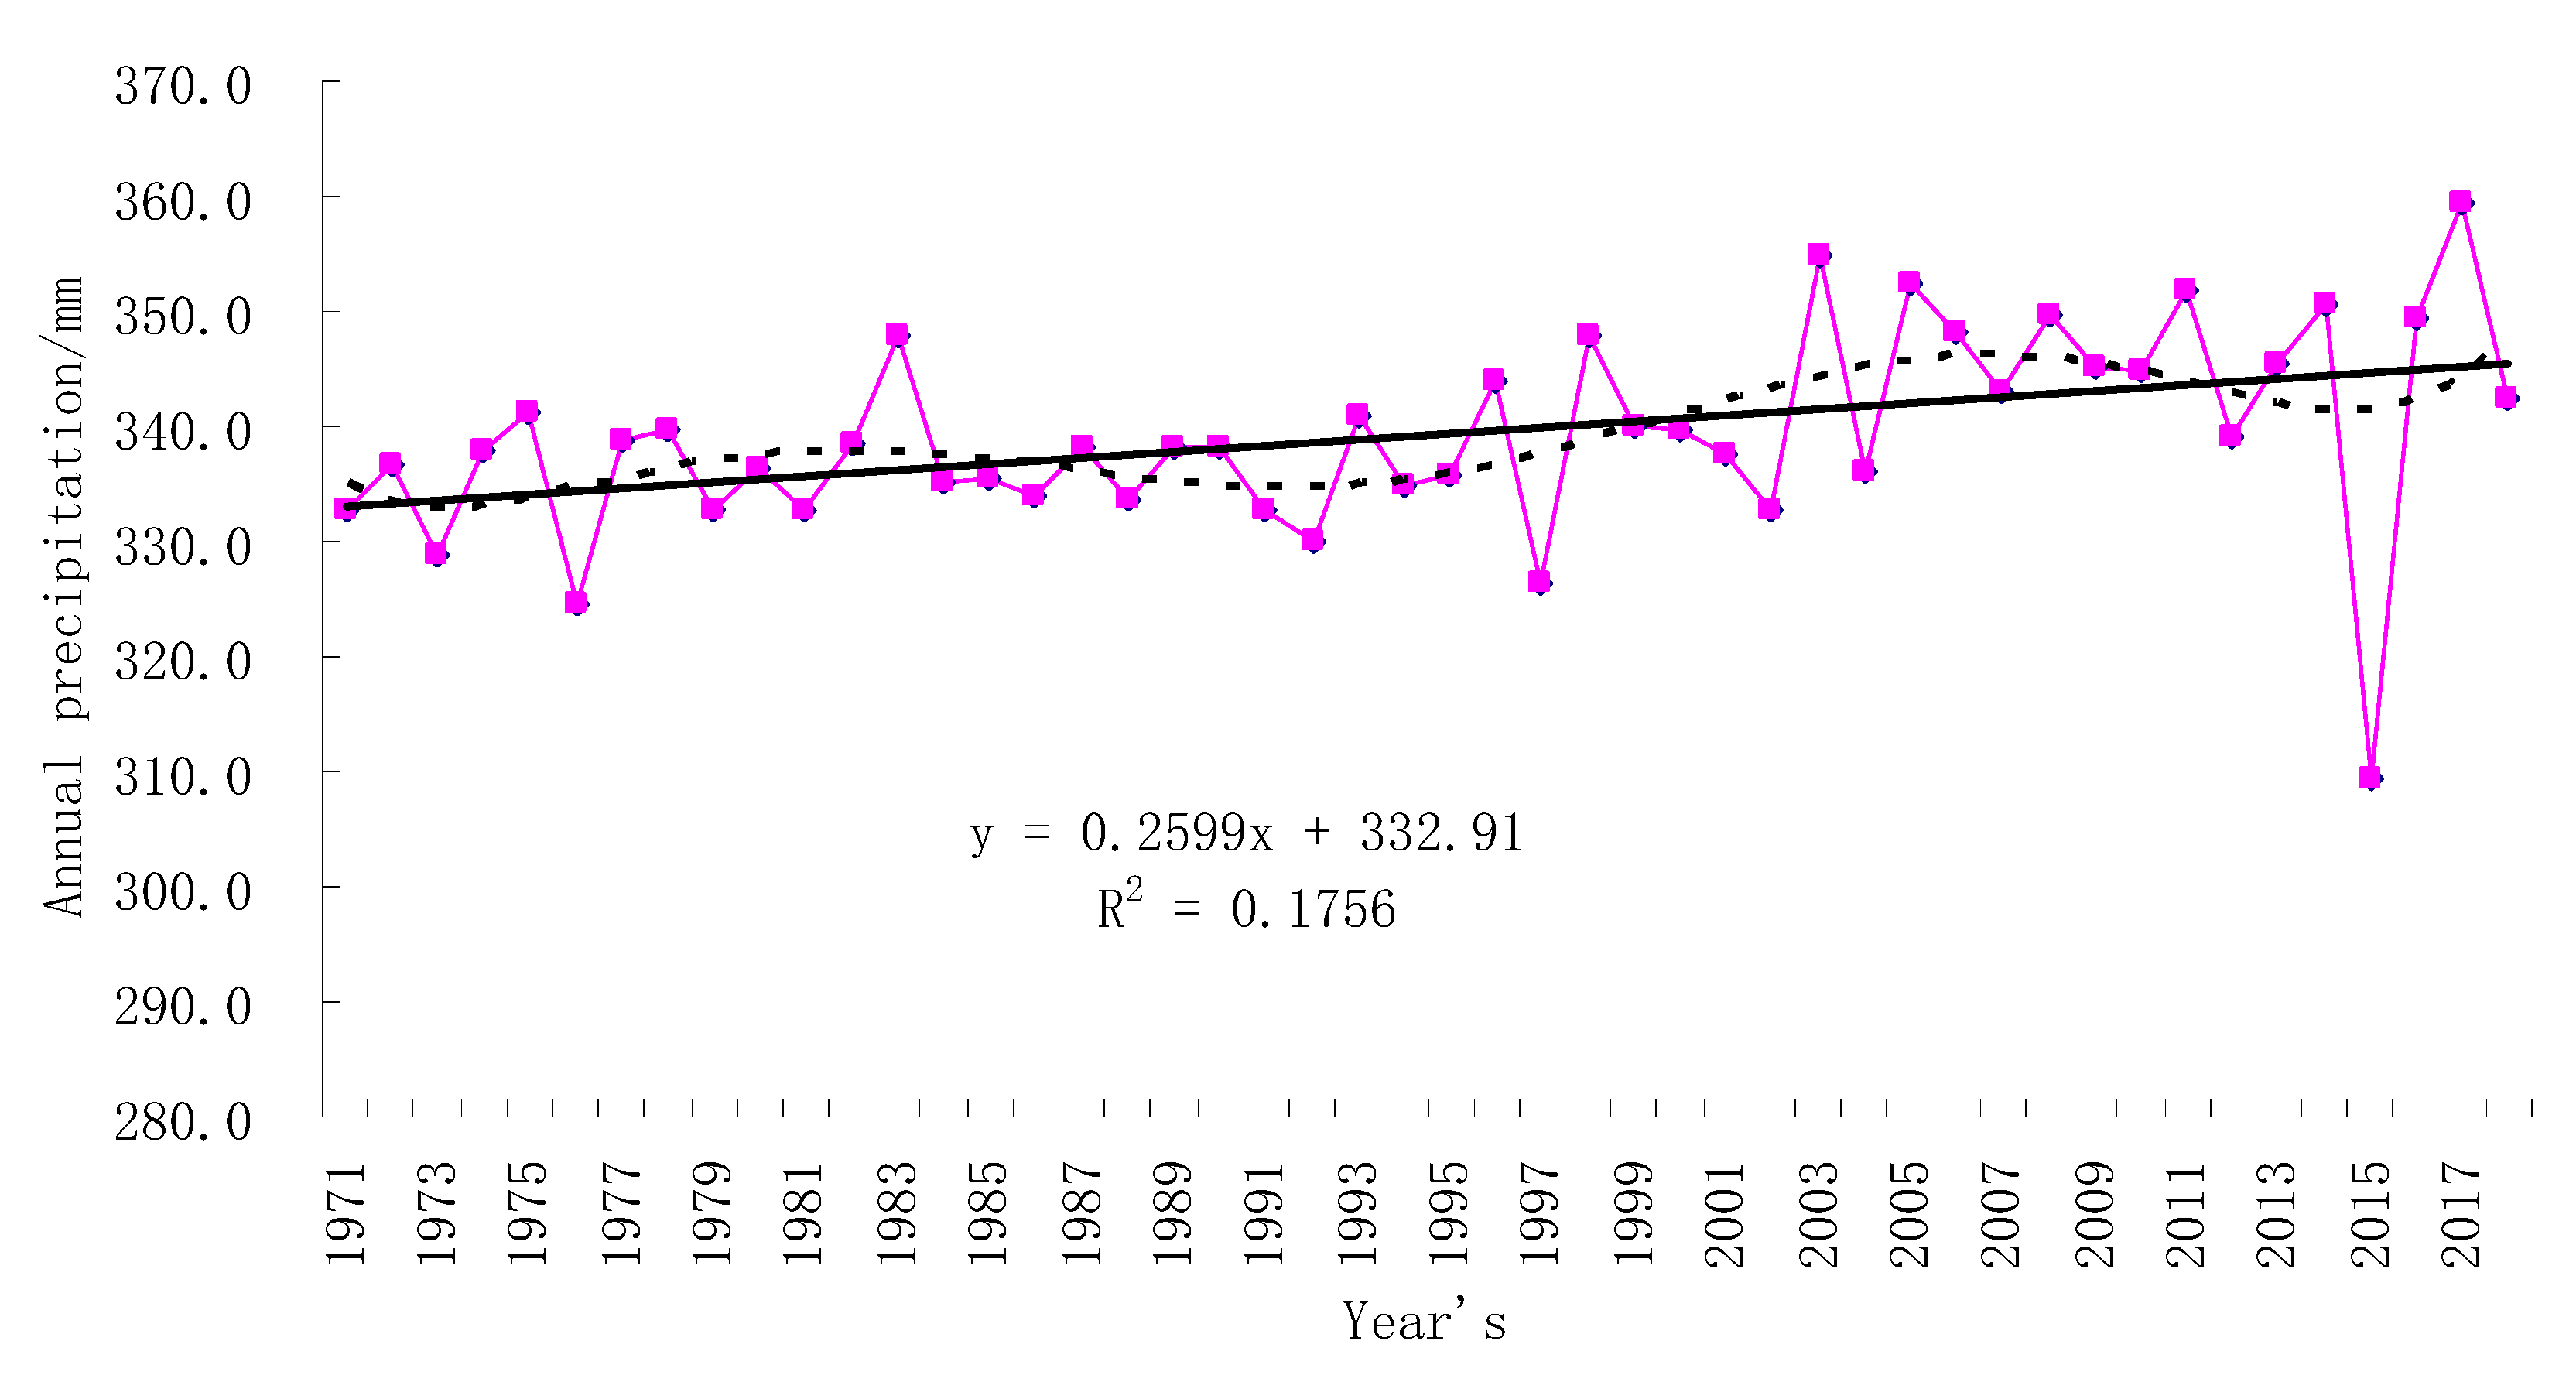
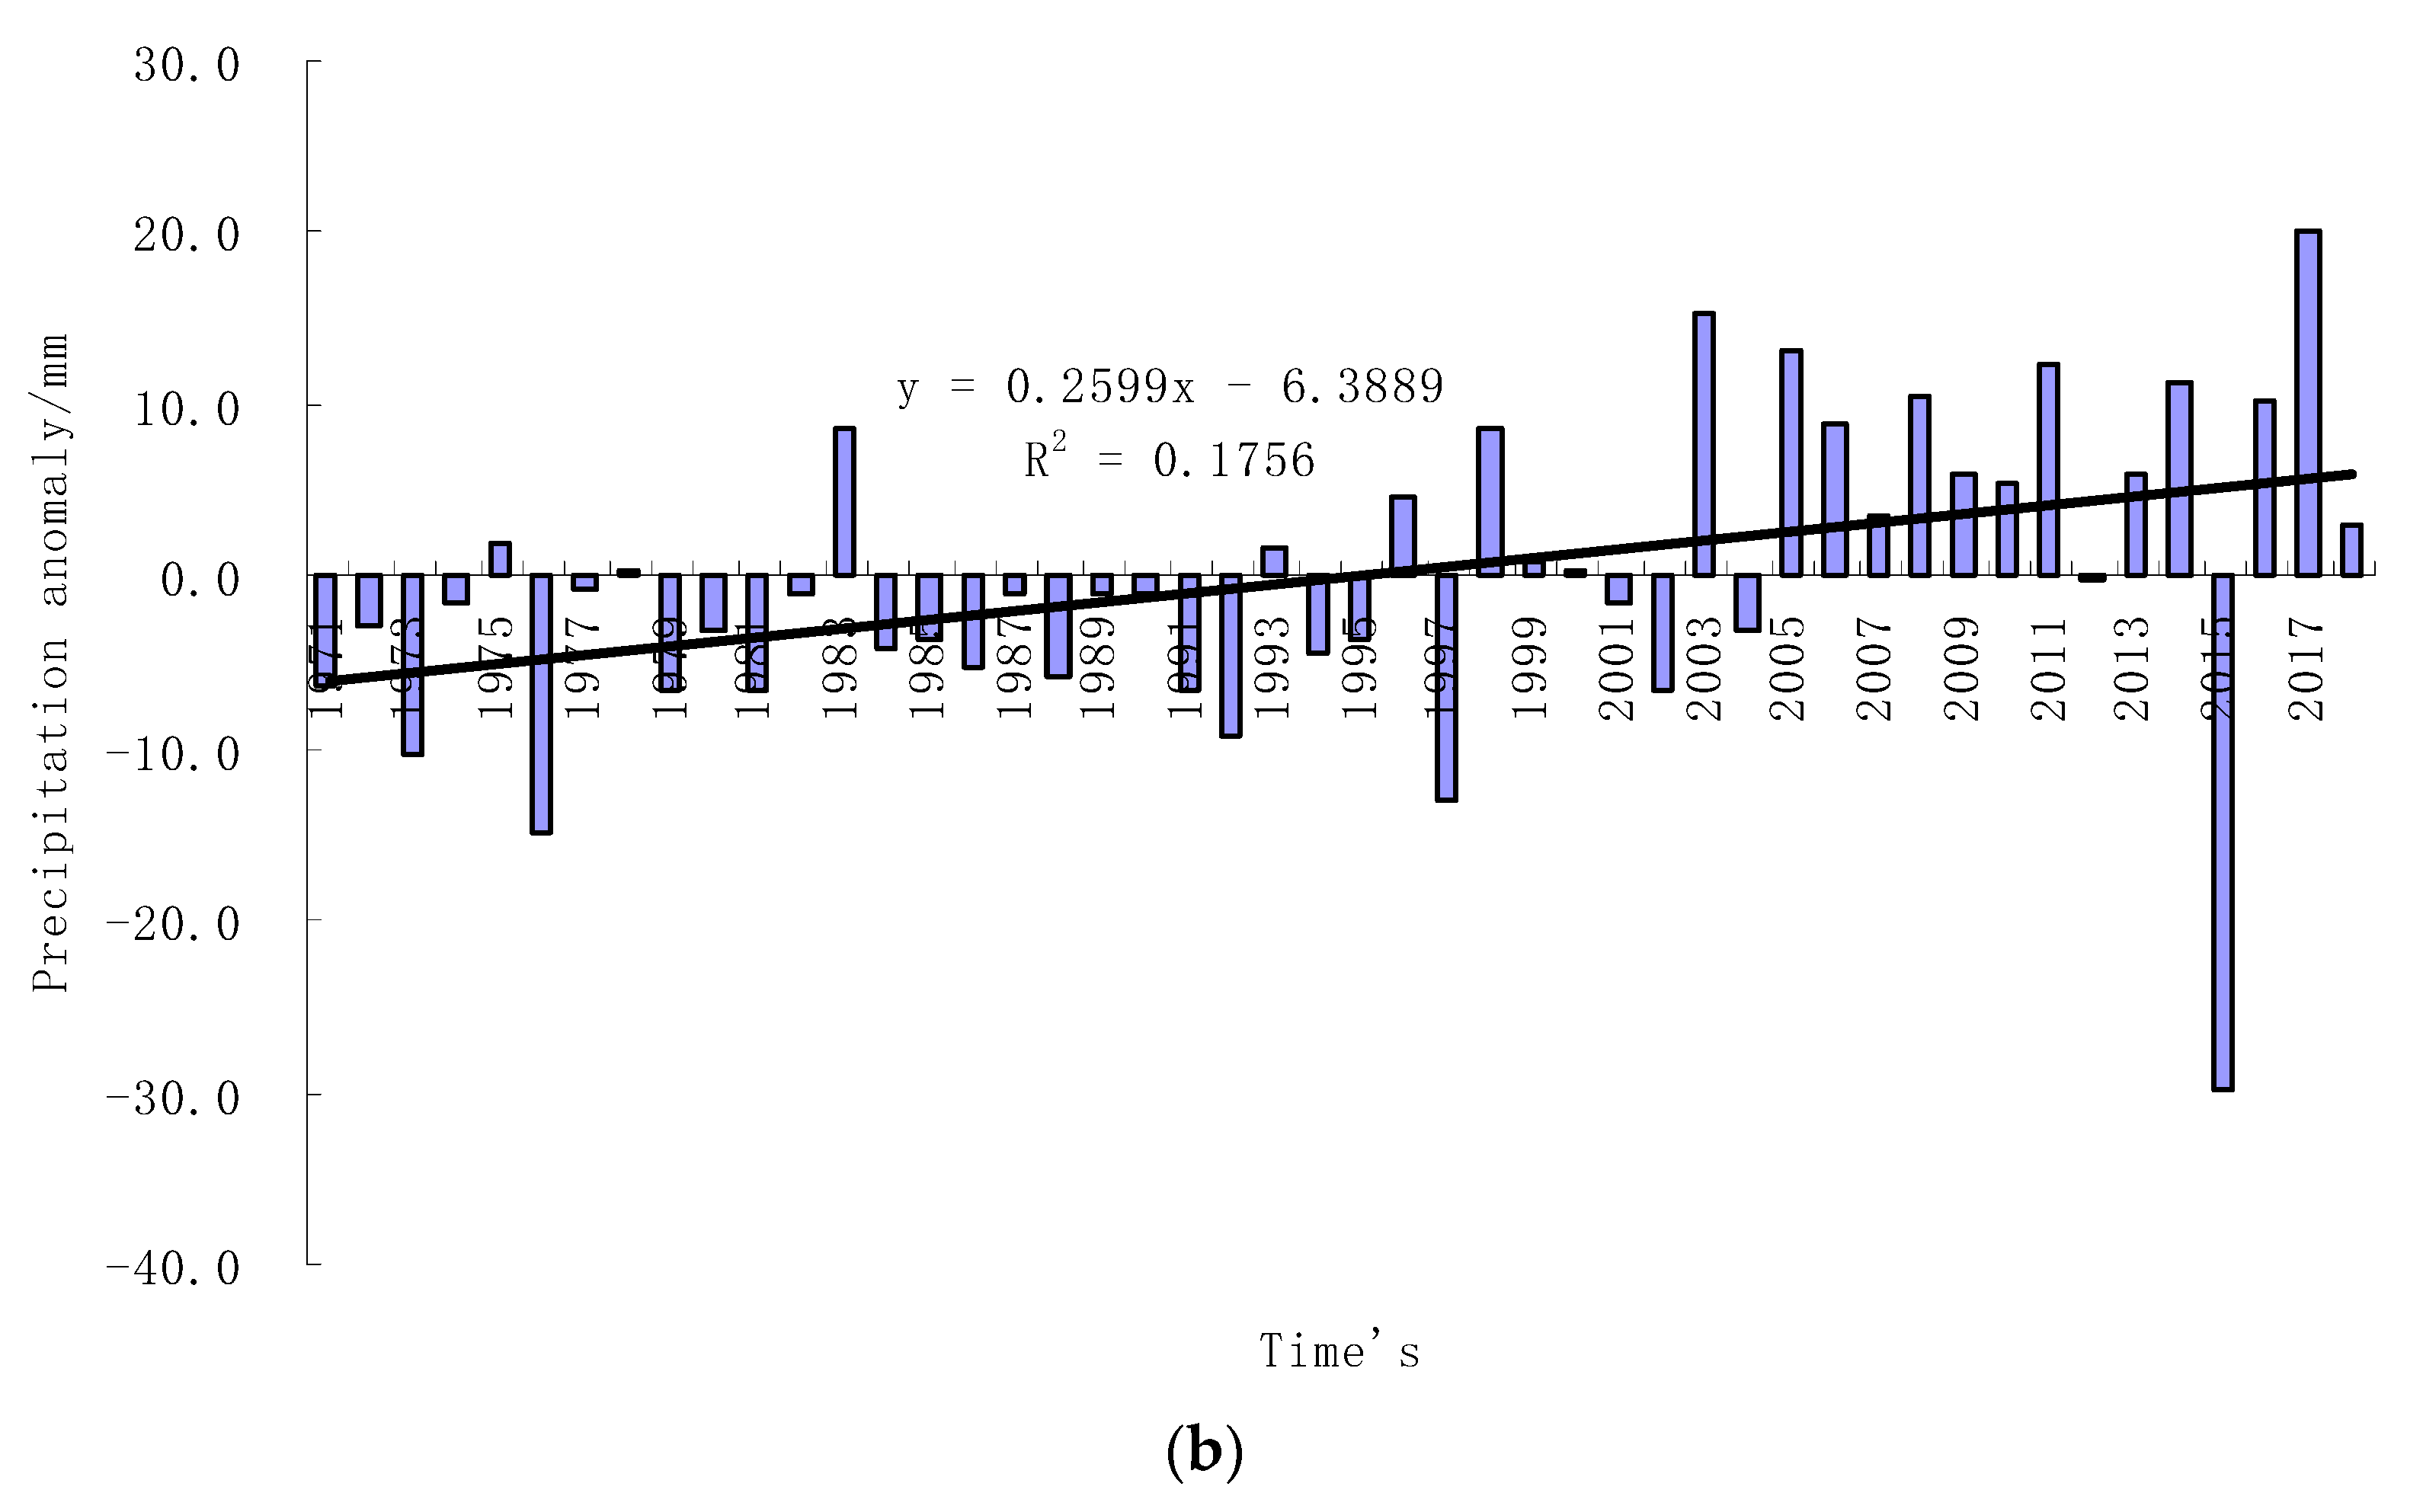
The annual precipitation in summer and autumn in Fujian from 1971 to 2018 was 339.3mm, the standard deviation was 8.6mm, and the coefficient of variation was 2.5. The highest value of annual precipitation was 359.3mm in 2017, and the lowest value was 309.4mm in 2015, with a difference of 49.9mm. In terms of the decadal coefficient of variation, the phase characteristics of t precipitation changes are obvious, with large fluctuations in the 1990s and 2000s, decreased in the 1980s, and then continued to rise with an obvious upward trend (Figure 4). The Z-value of Mann-Kendall trend test is 3.6, the reliability value of 99% is 2.32, showing an extremely significant upward trend (p < 0.01), and the Sen’s slope is 3.0mm/decade. The equation of the one-variable linear fitting is: y = 0.2599x + 332.91, and the climate tendency rate is 2.6mm/decade, which is close to the Sen’s slope result; the variance is 0.42, which only passes the significance level 0.1 test, and it is different to the Mann-Kendall trend test.
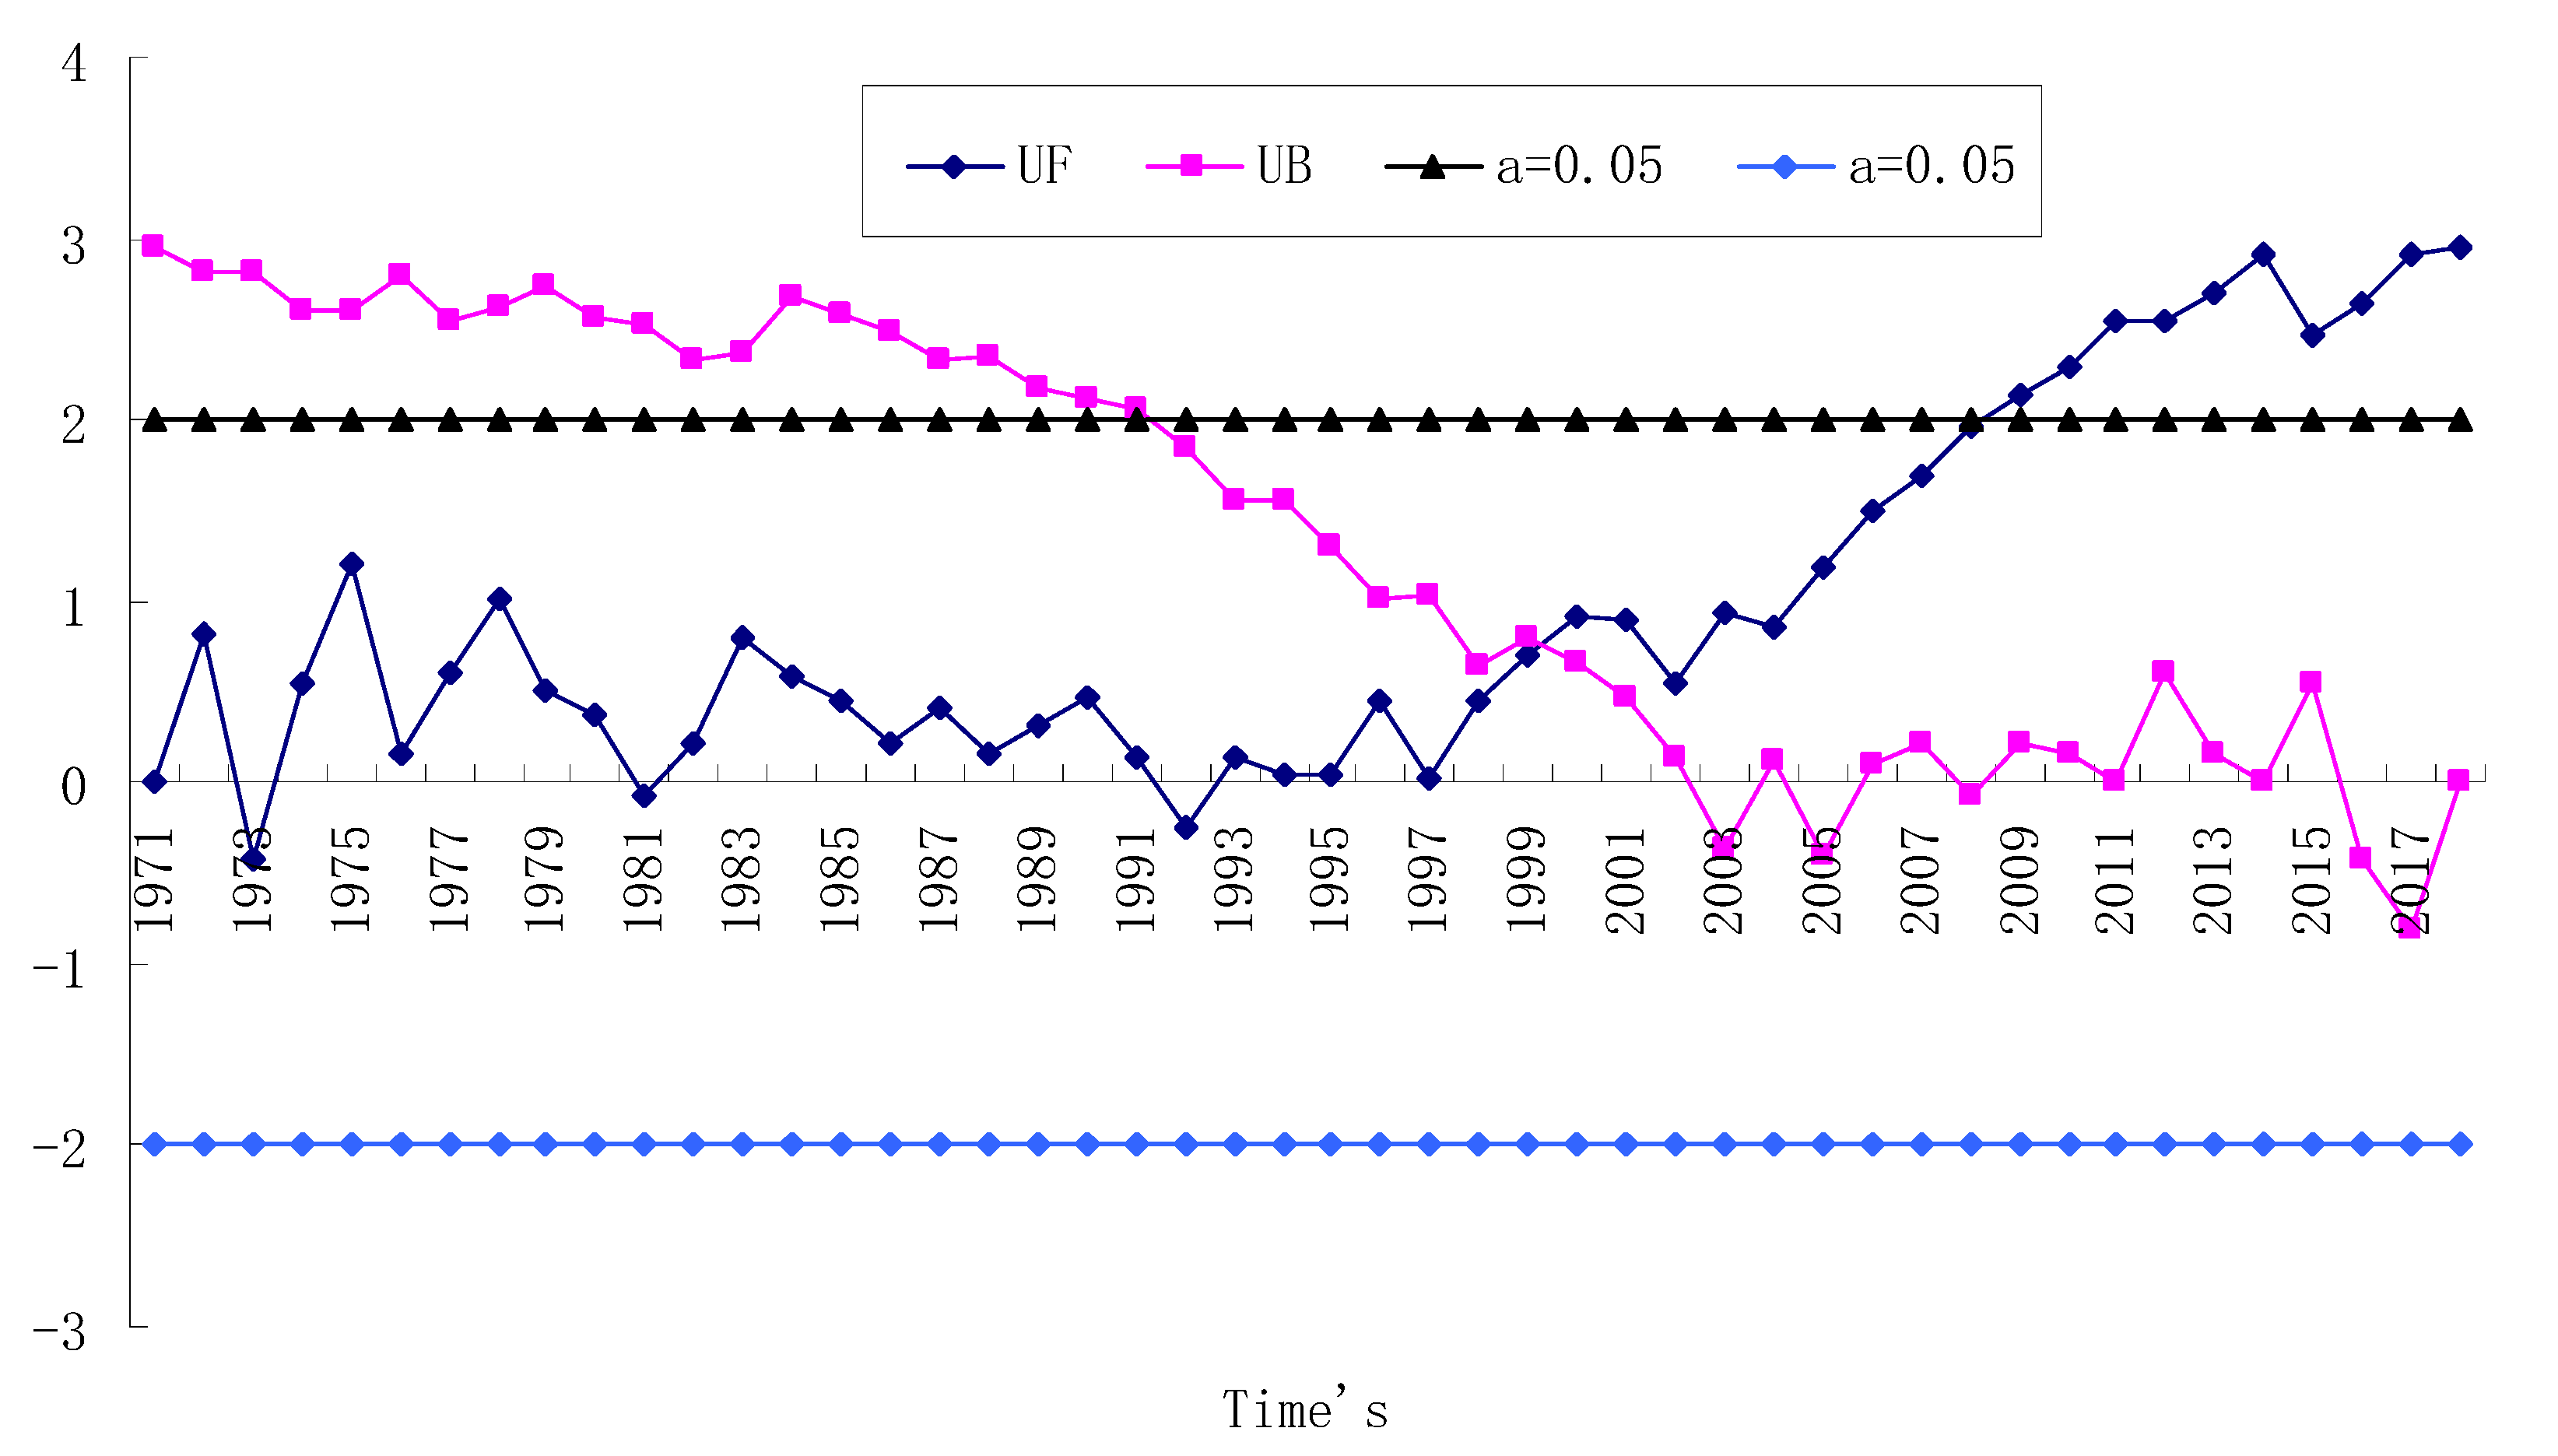
It can be seen in the Mann-Kendall mutation test results (Figure 5) that the UF and UB curves intersect at one point in 1999, and the UF curve exceeds the 0.05 significant level critical line after 2008, indicating that the annual precipitation in summer and autumn of Fujian has undergone a significant mutation from low to high, and the mutation occurred in 1999. It can be seen in UF curve that the variation trend of annual precipitation in the whole of summer and autumn is basically the same as that of temperature, and it shows a relatively stable growth trend after 2000, but the abrupt change point is different. However, in the 21st century, the amount of rainfall began to increase and remained at a level representing a positive anomaly for many years. This is very consistent with the above analysis of the decadal variation of annual precipitation in the time domain (Figure 6a,b).
3.2. Temporal Scales Variations
Figure 7 presents the real part of the Morlet wavelet analysis of temperature and precipitation in summer and autumn in Fujian from 1971 to 2018. Positive areas indicate high (excessive) average annual temperature (precipitation), while negative areas indicate the contrary. It shows that in summer and autumn in Fujian the annual air temperature and precipitation series of wavelet coefficients in the time–frequency domain characteristics, for a particular climate signal, a time scale of positive (negative) wavelet coefficient area on time scales should be warm (cold) change warm (cold) phase, the greater the absolute value of wavelet coefficient, show that the time scale of warm (cold) changes more significant.
As can be seen in Figure 7a, the average annual temperature changed sharply during 1971–1981 and 2008–2018, while the other periods were relatively gentle. The average annual temperature in summer and autumn displays obvious periodic fluctuations on two scales. On the inter annual scale below 10a, there is a small-scale signal with a period of 5a, and the signal has a whole region. The oscillation center gradually shifted from the initial 5a to 15a, and then returned to about 5a, presenting a parabola shape. At the large scale, there are 28a periodic changes, which are region wide. There are alternately positive and negative centers, and there are 3 negative centers and 2 positive centers.
As can be seen in Figure 7b, the contour lines are relatively dense during 1971−1981 and 2008–2018, indicating that precipitation changes sharply and fluctuates in a large range. On the time scale below 10a, there is a 5a cycle change, which covers the whole region. Before 2000, there were obvious mesoscale signals with a 20a period. On the scale of 10a periodic fluctuation, the oscillation center gradually shifted from 10a to 15a in 2000, and the signal covers a whole region, forming a tail − upward shape. On a large timescale, there are 28a cycle changes, which are regional and stable. Similar to the average annual temperature, there are alternating positive and negative centers with the same number.
3.3. Time Period Determination
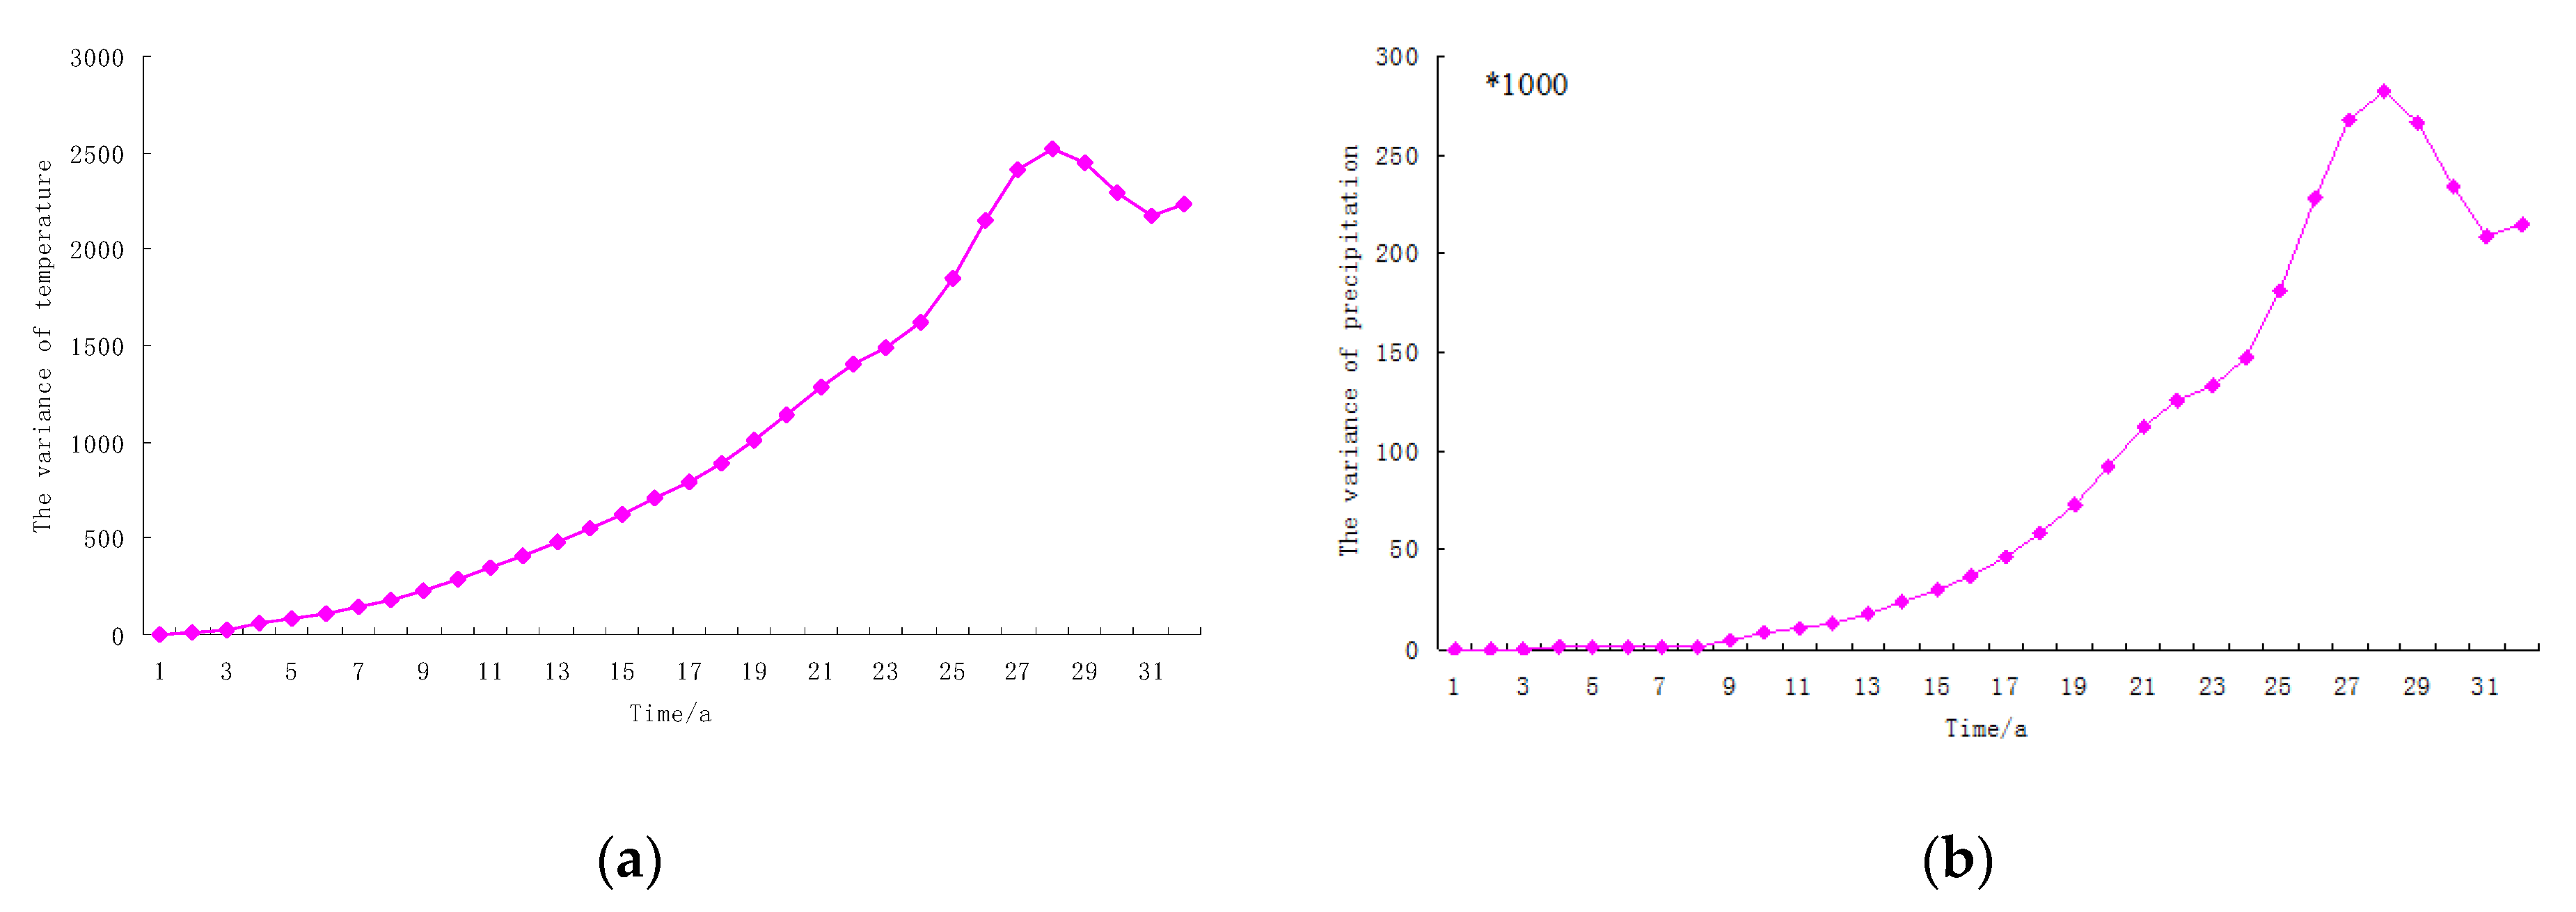
Figure 8 shows the characteristics of the wavelet variances of the annual temperature and annual precipitation in the summer and autumn seasons in Fujian from 1971 to 2018. It can be seen that the variance of the wavelet coefficients of temperature and precipitation gradually increased, with basically the same trend, reaching the peak in 28a and then falling back. There are several small platforms in the middle, representing different periods of oscillation. The oscillation period mainly includes quasi-oscillation period of 5, 11, 21, and 28a, and the wavelet coefficient value of 28a has the largest variance (Figure 7). Because the maximum value of wavelet coefficient variance determines the maximum period of periodic oscillation of climate factors, that is, the main period or the first period, the main period of air temperature and precipitation in summer and autumn in Fujian is the same, both of which are 28a.
According to the contour map of the real part of the Morlet wavelet coefficients of annual temperature (a) and annual precipitation (b) in Fujian from 1971 to 2018 (Figure 7), the oscillation period with the most dense and the most significant contour value center is about 28a. Combining the results of the wavelet variance test of the two, it can be determined that the 28a time scale is the first major period. Therefore, a wavelet coefficient variation characteristic map of the main period of annual average temperature and annual precipitation in Fujian was createdto analyze the period variation characteristics of different time scales in summer and autumn.
3.4. Correlation Analysis
Here we examine the relationship between temperature and precipitation in a given region, and how that relationship can be determined. According to the main oscillation period of annual temperature and precipitation in summer and autumn, the relationship between them is analyzed using the Pearson correlation coefficient. The Pearson correlation coefficient is 0.99 that of the first major cycle variation of the annual temperature and annual precipitation in the summer and autumn seasons in Fujian from 1971 to 2018, which passes the significance level 0.01 test. Therefore, on a large scale, the trend of temperature and precipitation in Fujian is consistent.
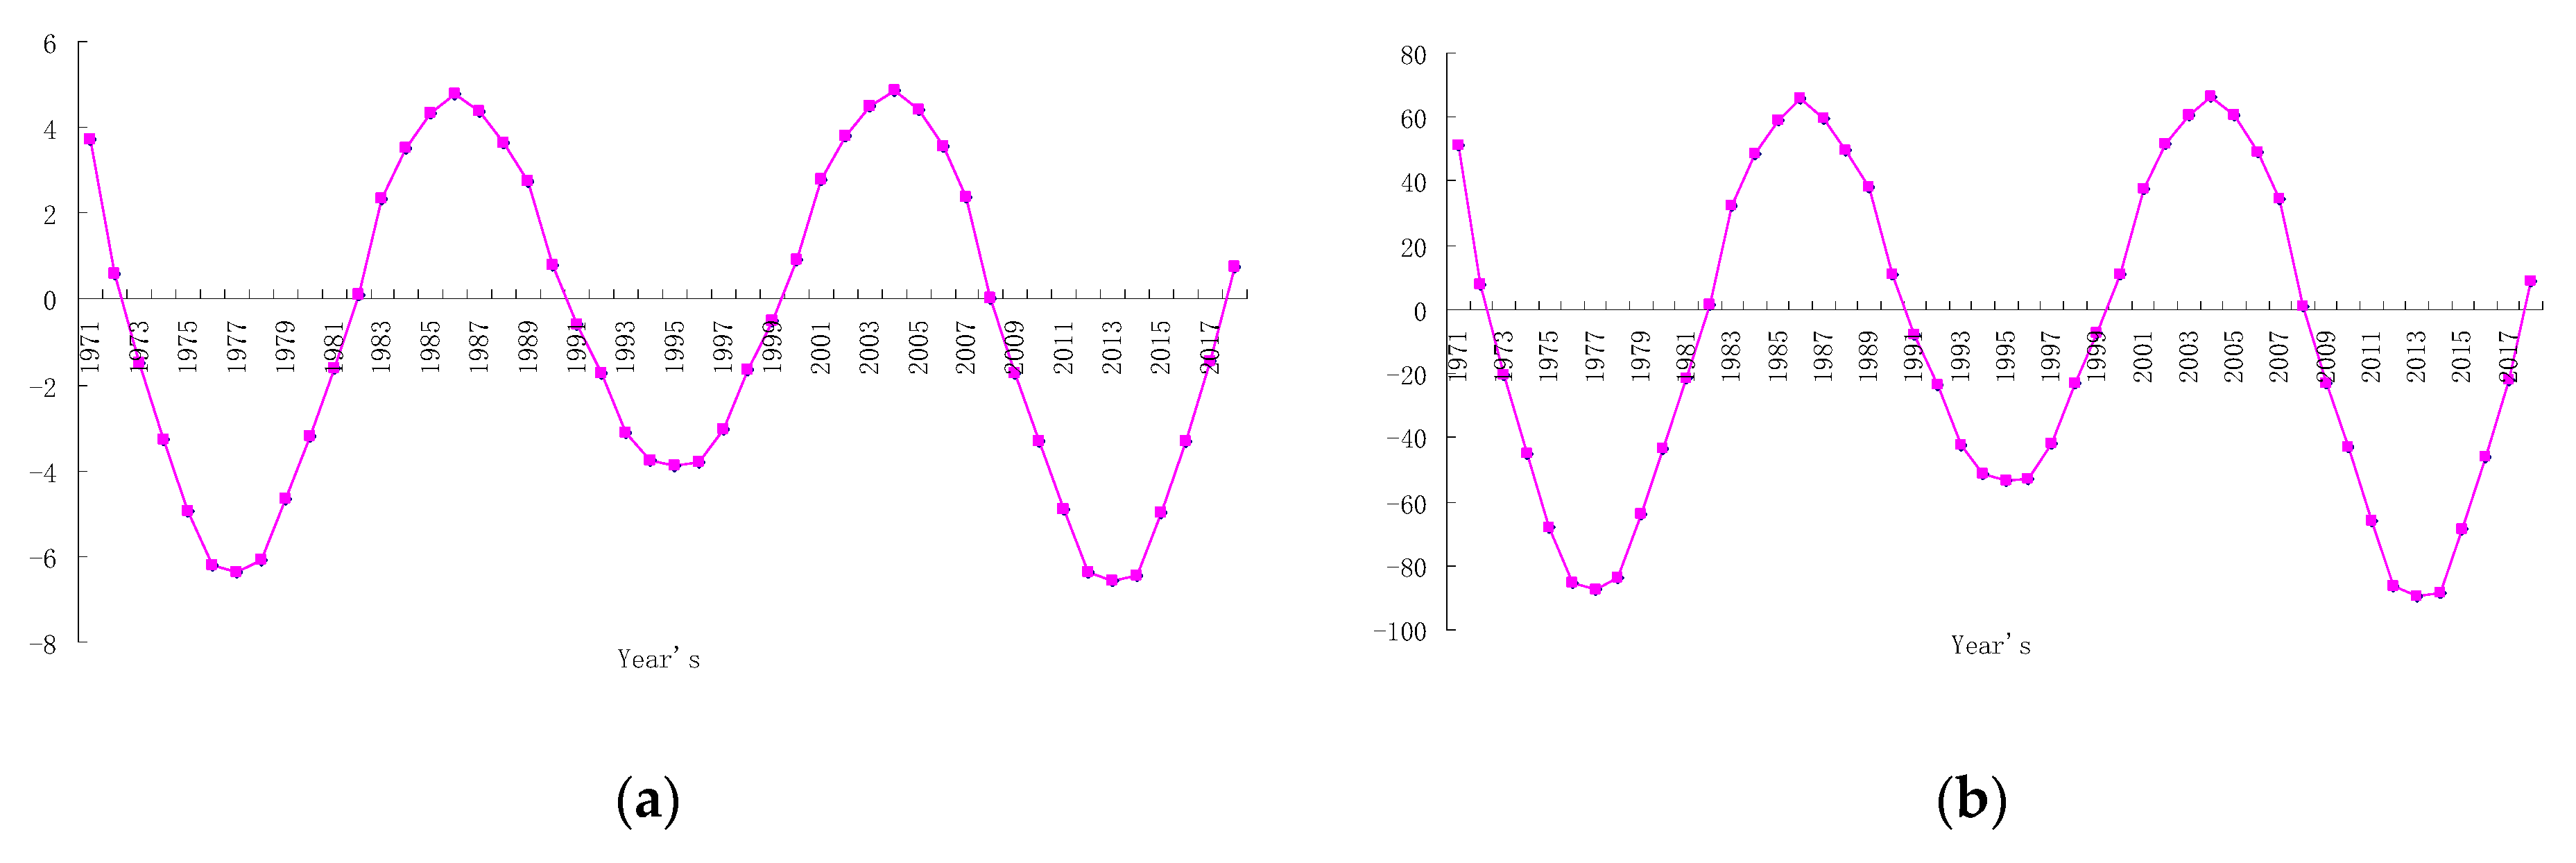
As can be seen in Figure 9, the annual temperature and precipitation in summer and autumn from 1971 to 2018 experienced three quasi-oscillations with alternating rises and falls on the 28a scale of the main period. The three top climate abrupt changes in the average temperature and annual precipitation during the summer and autumn seasons in Fujian were in 1971, 1987, and 2005, respectively, and the three low-climate abrupt changes were in 1977, 1996, and 2014.
It can be seen that the periods of low temperature and low precipitation in the long summer and autumn seasons in the past 48 years were in 1971–1977, 1987–1996, and 2005–2014. The periods of high temperature and more rain in summer and autumn were in 1977–1987, 1996–2005, and 2014–2018.
According to the characteristics of the first main cycle change of annual temperature in summer and autumn in Fujian from 1971 to 2018, the annual temperature in summer and autumn will continue to increase in the future, and the annual precipitation will also be in the process of increasing. The high temperature and rainy period are predicted to continue.
4. Discussion
The changing trend of temperature and precipitation is restricted by the length of historical data, the regional characteristics, and the time period of selected historical data, so the results are varied; some are obvious and some are not. But periodicity is a common feature. Both seasonal precipitation and annual precipitation have multi-time scale characteristics. The trend of temperature warming is basically the same all over the country, and the climate tendency rate is slightly different in different regions [40].
Through the analysis of China’s meteorological data from the 1950s to the 2010s, we found an overall warming trend of China’s climate [41]. In the past approximately 48 years, the annual average temperature in China has increased significantly [42]. Climate change has a significant impact on agricultural production [43]. For example, in northeast China, the annual mean minimum temperature, mean temperature, and maximum temperature increased by about 2.11 °C, 1.59 °C, and 1.13 °C respectively [44]. Since the 1960s, the average annual precipitation in the Wei River basin had been decreasing, with an average decrease of about 2 mm in 10 years. The frequency and intensity in the lower reaches of Songhua River River, Mudanjiang River Basin, and upper reaches of Xiliao River increased or strengthened [45,46]. Sulikowska’s study underlines that the trend towards extreme temperatures is accelerating and that the rate of change over the past 40 years has been more than three times that of the entire study period. Summer has changed most in central and eastern Europe in the last 40 years [47].
There is no clear or convincing scientific conclusion to explain the precipitation changes in the eastern part of China. In general, the formation of Fujian’s climate (e.g., temperature, precipitation, and tropical cyclones) is influenced by many factors, among which are the Asia-Pacific Oscillation (APO), sea surface temperature (SST) [48,49,50,51], the Pacific Decadal Oscillation (PDO), and the El Nino-Southern Oscillation (ENSO) [52,53,54,55,56,57]. Some oscillation modes can play a crucial role in the modulation of autumn precipitation at the regional scale in China, and their anomalies can influence atmospheric circulation and thus drought in southern China.
In addition, the intensity and frequency of extreme precipitation in different stages of urbanization have different distribution patterns, and urbanization has different effects on extreme precipitation in different regions of the city; the intensity and frequency of the extreme precipitation in the downwind direction of the city and its suburbs are increasing [58]. The annual precipitation, the intensity of precipitation, the number of moderate rain events, and the number of rainstorm days all increased in the core metropolitan area of Chongqing, showing the obvious characteristic of “urban rain island” [59].
From the relationship between temperature and precipitation, there are studies which show that the top 10% bin of precipitation intensity increases by about 95% for each degree Kelvin (K) increase in global mean temperature, while 30%–60% bins decrease by about 20% K-1. The global average precipitation intensity increases by about 23% K−1, substantially greater than the increase of about 7% K−1 in atmospheric water-holding capacity estimated by the Clausius-Clapeyron equation [60].
Ocurtsov concluded that there is a link between solar activity in South Fenos Candia and changes in climate over a decade and two years [61]. The impact of global warming can be seen on rainfall in Madagascar, with annual rainfall increasing as temperatures and altitudes rise, according to the TANTELLINIAINA study. However, if the annual temperature increases by more than 0.03 °C, the annual rainfall will increase regardless of the altitude [62]. The combination of drought and extreme heat in Europe has been investigated, and the trend is mainly driven by the decreasing trend of total precipitation and is not directly affected by the rising trend of temperature [63]. Drought disasters are significantly affected by rising temperatures and have a significant impact on the availability and consumption of water resources and agricultural production.
The increase in precipitation is beneficial to both rain-fed and irrigated agriculture, but may be harmful to the humid areas in southeast China [64]. Climate change is having a significant negative impact on agricultural output in low-latitude areas of China [65,66,67,68]. Rising temperature will shorten the growing period of crops and decrease the yield per unit area [69], while high temperature is not conducive to the growth and development of crops, increasing soil evaporation, reducing the relative humidity in the environment, and increasing drought.
The climate in Fujian will be warm and humid in the future, which accords with the finding of [70]. According to the authors of [70], significant warming and humidification began in the late 1990s and is expected to continue until the end of the 21st century. The dry-to-wet climate transition in eastern Northwest China could be related to a synergistic enhancement of the East Asian summer monsoon and the westerly circulation.
Our study provides a scientific understanding of the changing patterns of temperature and precipitation in Fujian Province by using data from historical stations, and the results provide preliminary and important information on the changing trends and time scales of temperature and precipitation. We found that evidence of periodic changes in temperature and precipitation may affect water resources and agricultural sectors throughout the study region, and this information could improve agricultural management. Based on our analysis, we strongly recommend that further studies be conducted to identify the causes of temperature and precipitation variations in Fujian, and to explore the reliability of the predictors to provide accurate data for disaster reduction and prevention.
5. Conclusions
This study used the M-K and Morlet wavelet analysis to analyze the periodic changes of the time series of annual average temperature and annual precipitation in summer and autumn seasons in Fujian from 1971 to 2018, and the main results of this study are as follows:
- (1)
- In the summer and autumn of Fujian from 1971 to 2018, the average annual temperature and precipitation showed an obvious upward trend, but the climate tendency rate was different.
- (2)
- There are three negative centers and two positive centers in the 28a time scale of summer autumn oscillation.
- (3)
- In the 28a scale of the first major cycle, there are three top abrupt climate change points of Fujian summer and autumn average annual temperature and annual precipitation, which are in 1971, 1987, and 2005, and three valley abrupt climate change points are in 1977, 1996, and 2014. There are three quasi oscillations of fluctuation alternation.
- (4)
- From the change characteristics of the first major cycle of annual average temperature and annual precipitation in summer and autumn in Fujian from 1971 to 2018, the annual average temperature and precipitation in summer and autumn will continue to increase in the future.
Author Contributions
Conceptualization, C.Z. and W.L.; methodology, Z.M.; software, L.L.; validation, Z.M., and C.Z.; formal analysis, Z.M.; investigation, Z.M.; data curation, F.Y.; writing—original draft preparation, Z.M.; writing—review and editing, Q.G. and H.C.; supervision, Z.M.; project administration, C.Z.; funding acquisition, Z.M. All authors have read and agreed to the published version of the manuscript.
Funding
This research was funded by Fujian Meteorological Bureau open Fund (2020k06), Science and technology project of Fujian Branch of China National Tobacco Corporation (2021350000240014), Natural Science Foundation of Fujian Province of China (2019J05048) and Open Research Foundation of International Magnesium Institute (IMI2018-09).
Institutional Review Board Statement
The study does not require ethical approval.
Informed Consent Statement
Not applicable.
Data Availability Statement
Not applicable.
Acknowledgments
Thanks to Fujian Meteorological Bureau for providing meteorological data.
Conflicts of Interest
The authors declare no conflict of interest. The funders had no role in the design of the study; in the collection, analyses, or interpretation of data; in the writing of the manuscript, or in the decision to publish the results References.
References
- Wang, S.W.; Luo, Y.; Zhao, Z.Z. The Sciences of Gloal Warming; Meteorological Press: Beijing, China, 2013; p. 203. [Google Scholar]
- Liu, Y.J.; Lin, E.D. Effects of climate change on agriculture in different regions of China. Clim. Change Res. 2007, 3, 229–233. [Google Scholar]
- Xu, Y.L.; Zhao, Y.C.; Zhai, P.M. Advances in scientific understanding on climate change and food security from IPCC special report SRCCL. Clim. Change Res. 2020, 16, 37–49. [Google Scholar]
- Zhao, Z.Z.; Luo, Y.; Huang, J.B. Review IPCC 30 years (1988–2018). Clim. Change Res. 2018, 14, 540–546. [Google Scholar]
- IPCC. Climate Change 2013: The Physical Science Basis by IPCC WG I; Cambridge University Press: Cambridge, UK, 2013; p. 1535. [Google Scholar]
- Liu, D.X.; Dong, A.X.; Deng, Z.Y. Impact of climate warming on agriculture in northwest China. J. Nat. Resour. 2005, 20, 119–125. [Google Scholar]
- Guo, J.P. Advances in impacts of climate change on agricultural production in China. J. Appl. Meteor. Sci. 2015, 26, 1–11. [Google Scholar]
- Yun, Y.R.; Fang, X.Q.; Wang, L.Y. Adaptation of China’s crop planting boundaries to climate warming. Crops 2007, 3, 20–23. [Google Scholar]
- Li, Z.G.; Tang, H.J.; Yang, P.; Zhou, Q.; Wu, W.; Zou, J.; Zhang, L.; Chang, H. Responses of cropland phenophases to agricultural thermal resources change in northeast China. Acta Geogr. Sin. 2011, 66, 928–936. [Google Scholar]
- Liu, X.R.; Li, G.P.; Fan, G.Z.; Gheng, B.-Y.; Li, H.-Q. Spatial and temporal characteristics of temperature changes in southwest China during 1961–2000. Sci. Meteor. Sin. 2008, 21, 30–36. [Google Scholar]
- Luo, Y.; Gao, P.; Mu, X. Influence of Meteorological Factors on the Potential Evapotranspiration in Yanhe River Basin, China. Water 2021, 13, 1222. [Google Scholar] [CrossRef]
- Kumar, V.; Jain, S.K. Rainfall trend in Ganga-Brahmputra-Meghna river basins of India (1951–2004). J. Hydrol. 2010, 33, 59–66. [Google Scholar]
- Cui, L.; Wang, L.; Lai, Z.; Tian, Q.; Liu, W.; Li, J. Innovative trend analysis of annual and seasonal air temperature and rainfall in the Yangtze river basin, China during 1960–2015. J. Atmos. Sol. Terr. Phys. 2017, 164, 48–59. [Google Scholar] [CrossRef]
- Chang, X.; Xu, Z.; Zhao, G.; Cheng, T.; Song, S. Spatial and temporal variations of precipitation during 1979–2015 in Jinan City, China. J. Water Clim. Change 2018, 9, 540–554. [Google Scholar] [CrossRef]
- Wang, S.; Jiao, S.; Xin, H. Spatio-temporal characteristics of temperature and precipitation in Sichuan province, southwestern China, 1960–2009. Quat. Int. 2013, 286, 103–115. [Google Scholar] [CrossRef]
- Malik, A.; Kumar, A.; Guhathakurta, P.; Kisi, O. Spatial-temporal trend analysis of seasonal and annual rainfall (1966–2015) using innovative trend analysis method with significance test. Arab. J. Geosci. 2019, 12, 10. [Google Scholar] [CrossRef]
- Terêncio, D.P.S.; Sanches Fernandes, L.F.; Cortes, R.M.V.; Moura, J.P.; Pacheco, F.A.L. Rainwater harvesting in catchments for agroforestry uses: A study focused on the balance between sustainability values and storage capacity. Sci. Total Environ. 2015, 613, 1079–1092. [Google Scholar]
- Myronidis, D.; Theofanous, N. Changes in climatic patterns and tourism and their concomitant effect on drinking water transfers into the Region of South Aegean, Greece. Stoch. Environ. Res. Risk Assess. 2021, 1–15. [Google Scholar] [CrossRef]
- Huagn, R.; Hu, Z.Y.; Guan, T. Interpolation of Temperature Data in Northern Qinghai-Xizang Plateau and Preliminary Analysis on Its Recent Variation. Plateau Meteorol. 2014, 3, 637–646. [Google Scholar]
- Li, G.D.; Tian, H.F.; Chen, C.; Liu, Y.R.; Zhang, J.H. Multi-time Scales analysis of climate variation in the period of winter wheat growing in eastern He’nan farming region. Chin. Agric. Sci. Bull. 2013, 23, 180–193. [Google Scholar]
- Si, P.; Hao, L.H.; Luo, C.J.; Cao, X.C.; Liang, D.P. The interpolation and homogenization of long-term temperature time series at baoding observation station in Hebei Province. Adv. Clim. Change Res. 2017, 13, 41–51. [Google Scholar] [CrossRef]
- Qiu, H.J.; Cao, M.M.; Zeng, B. Wavelet analysis on the temporal series of precipitation in Xi’an. Chin. J. Agrometeorol. 2011, 1, 23–27. [Google Scholar]
- Lu, X.H.; Zhang, H.N.; Hu, Y.Y. Spatiotemporal variation characteristics of precipitation at multi-scale in Ganjiang River basin from 1966 to 2015. Res. Soil Water Conserv. 2021, 2, 168–175. [Google Scholar]
- Ti, J.; Yang, Y.; Yin, X.; Liang, J.; Pu, L.; Jiang, Y.; Wen, X.Y.; Chen, F. Spatio-Temporal Analysis of Meteorological Elements in the North China District of China during 1960–2015. Water 2018, 10, 789. [Google Scholar] [CrossRef] [Green Version]
- Silva, R.M.D.; Santos, C.A.G.; Moreira, M.; Corte-Real, J.; Medeiros, I.C. Rainfall and river flow trends using Mann-Kendall and Sen’s slope estimator statistical tests in the Cobres River basin. Nat. Hazards 2015, 77, 1205–1221. [Google Scholar] [CrossRef]
- Rahman, A.U.; Dawood, M. Spatio-statistical analysis of temperature fluctuation using Mann–Kendall and Sen’s slope approach. Clim. Dyn. 2017, 48, 783–797. [Google Scholar] [CrossRef]
- Sonali, P.; Nagesh-Kumar, D. Review of trend detection methods and their application to detect temperature changes in India. J. Hydrol. 2013, 476, 212–227. [Google Scholar] [CrossRef]
- Yang, P.; Xia, J.; Zhang, Y.; Hong, S. Temporal and spatial variations of precipitation in Northwest China during 1960–2013. Atmos. Res. 2017, 183, 283–295. [Google Scholar] [CrossRef]
- Yao, N.; Li, Y.; Lei, T.; Peng, L. Drought evolution, severity and trends in mainland China over 1961–2013. Sci. Total Environ. 2018, 616–617, 73–89. [Google Scholar] [CrossRef]
- Liu, H.; Wang, Z.; Ji, G.; Yue, Y. Quantifying the Impacts of Climate Change and Human Activities on Runoff in the Lancang River Basin Based on the Budyko Hypothesis. Water 2020, 12, 3501. [Google Scholar] [CrossRef]
- Gocic, M.; Trajkovic, S. Analysis of changes in meteorological variables using Mann-Kendall and Sen’s slope estimator statistical tests in Serbia. Glob. Planet. Change 2013, 100, 172–182. [Google Scholar] [CrossRef]
- Mashagbah, A.; Farajat, M. Assessment of spatial and temporal variability of rainfall data using kriging, Mann kendall test and the Sen’s slope estimates in Jordan from 1980 to 2007. Res. J. Environ. Earth Sci. 2013, 5, 611–618. [Google Scholar]
- Kumar, S.P. Estimates of the regression coefficient based on kendall’s tau. J. Am. Stat. Assoc. 1968, 63, 1379–1389. [Google Scholar]
- Myronidis, D.; Fotakis, D.; Ioannou, K.; Sgouropoulou, K. Comparison of ten notable meteorological drought indices on tracking the effect of drought on streamflow. Hydrolog. Sci. J. 2018, 63, 2005–2019. [Google Scholar] [CrossRef]
- Sayemuzzaman, M.; Jha, M.K. Seasonal and annual precipitation time series trend analysis in North Carolina, United States. Atmos. Res. 2014, 137, 183–194. [Google Scholar] [CrossRef]
- Mann, H.B. Nonparametric test against trend. Econometrica 1945, 13, 245–259. [Google Scholar] [CrossRef]
- Alifujiang, Y.; Abuduwaili, J.; Ge, Y. Trend Analysis of Annualand Seasonal River Runoff by Using Innovative Trend Analysis with Significant Test. Water 2021, 13, 95. [Google Scholar] [CrossRef]
- Partal, T. Wavelet transform-based analysis of periodicities and trends of Sakarya basin (Turkey) streamflow data. River Res. Appl. 2010, 26, 695–711. [Google Scholar] [CrossRef]
- Shi, J.L.; Wang, X.R.; Li, S.F.; Li, N. Variation characteristics of air temperature and precipitation in He’nan province in Recent 50 years. Res. Soil Water Conserv. 2017, 24, 151–156. [Google Scholar]
- Talaee, P.H.; Tabari, H. Temporal variability of precipitation over Iran: 1966–2005. J. Hydrol. 2011, 396, 313–320. [Google Scholar]
- Huang, W.J.; Yang, J.J.; Liu, Y.; Yu, E.T. Spatiotemporal Variations of Drought in the Arid Region of Northwestern China during 1950–2012. Adv. Meteorol. 2021, 2021, 6680067. [Google Scholar] [CrossRef]
- Liu, K.; Nie, G.G.; Zhang, S.S. Spatiotemporal evolution of temperature and precipitation in China from 1951 to 2018. Adv. Earth Sci. 2020, 35, 1113–1126. (In Chinese) [Google Scholar]
- Hu, Z.Z. Long-term climate variations in China and global warming signals. J. Geophys. Res. 2003, 108, 4614. [Google Scholar] [CrossRef]
- Zhang, H.L.; Chen, Y.; Ren, G.X.; Yang, G.H. The characteristics of precipitation variation of Weihe River Basin in Shaanxi Province during recent 50 years. Agric. Res. Arid Areas 2008, 26, 236–241. [Google Scholar]
- Yang, S.Y.; Sun, F.H.; Ma, J.Z. Evolvement of Precipitation Extremes in Northeast China on the Background of Climate Warming. Sci. Geogr. Sin. 2008, 28, 224–228. [Google Scholar] [CrossRef]
- Liu, S.C.; Fu, C.B.; Chen, J.P. Temperature dependence of global precipitation extremes. Geophys. Res. Lett. 2009, 17, 380–390. [Google Scholar] [CrossRef] [Green Version]
- Sulikowska, A.; Wypych, A. Seasonal Variability of Trends in Regional Hot and Warm Temperature Extremes in Europe. Atmosphere 2021, 12, 612. [Google Scholar] [CrossRef]
- Saddique, Q.; Cai, H.J.; Xu, J.T.; Ajaz, A.; He, J.Q.; Yu, Q.; Wang, Y.F.; Chen, H.; Khan, M.I.; Liu, D.L.; et al. Analyzing adaptation strategies for maize production under future climate change in Guanzhong Plain, China. Mitig. Adapt. Strateg. Glob. Chang. 2020, 25, 1523–1543. [Google Scholar] [CrossRef]
- Yang, J.; Zhang, Q.; Lu, G.; Liu, X.; Wang, Y.; Wang, D.; Liu, W.; Yue, P.; Zhu, B.; Duan, X. Climate Transition from Warm-Dry to Warm-Wet in Eastern Northwest China. Atmosphere 2021, 12, 548. [Google Scholar] [CrossRef]
- Lin, Z.X.; Zhu, J.J.; Hua, W.; Fan, G.Z. Influence of Asian-Pacific Oscillation on Precipitation in Central Eastern China during Autumn (1960–2016). Adv. Meteorol. 2019, 3, 10. [Google Scholar] [CrossRef] [Green Version]
- Niu, N.; Li, J. Interannual variability of autumn precipitation over South China and its relation to atmospheric circulation and SST anomalies. Adv. Atmos. Sci. 2008, 25, 117–125. [Google Scholar] [CrossRef]
- Wang, L.; Chen, W.; Zhou, W.; Huang, G. Teleconnected influence of tropical Northwest Pacific sea surface temperature on interannual variability of autumn precipitation in Southwest China. Clim. Dyn. 2015, 45, 2527–2539. [Google Scholar] [CrossRef]
- Liu, B.; Li, Y.; Chen, J.; Chen, X. Long-term change in precipitation structure over the karst area of Southwest China. Int. J. Climatol. 2016, 36, 2417–2434. [Google Scholar] [CrossRef] [Green Version]
- Chen, S.; Huang, J.; Qian, Y. Effects of aerosols on autumn precipitation over mid-Eastern China. J. Trop. Meteorol. 2014, 20, 242–250. [Google Scholar]
- Qin, M.; Li, D.; Dai, A.; Hua, W.; Ma, H.D. The influence of the pacific decadal oscillation on North Central China precipitation during boreal autumn. Int. J. Climatol. 2018, 38, 821–831. [Google Scholar] [CrossRef]
- Zhang, W.; Jin, F.F.; Turner, A. Increasing autumn drought over southern China associated with ENSO regime shift. Geophys. Res. Lett. 2014, 41, 4020–4026. [Google Scholar] [CrossRef] [Green Version]
- Xiao, M.; Zhang, Q.; Singh, V.P. Influences of ENSO, NAO, IOD and PDO on seasonal precipitation regimes in the Yangtze River basin, China. Int. J. Climatol. 2015, 35, 3556–3567. [Google Scholar] [CrossRef]
- Sun, J.S.; Shu, W.-J. The Effect of Urban Heat Island on Winter and Summer Precipitation in Beijing Region. Chin. J. Atmos. Sci. 2007, 31, 311–320. [Google Scholar]
- Zheng, Z.F.; Wang, Z.W.; Gao, H. Characteristics of Extreme Precipitation Events in Summer and Its Effect on Urbanization in Beijing Area. Meteorol. Mon. 2013, 39, 1635–1641. [Google Scholar]
- Manton, M.J.; Della-Marta, P.M.; Haylock, M.R.; Hennessy, H.J.; Nicholls, N.; Chambers, L.E.; Collins, D.A.; Daw, G.; Finet, A.; Gunawan, D.; et al. Trends in extreme daily rainfall and temperature in Southeast Asia and the South Pacific: 1961–1998. Int. J. Climatol. 2001, 21, 269–284. [Google Scholar] [CrossRef]
- Tanteliniaina, M.F.R.; Chen, J.; Adyel, T.M.; Zhai, J. Elevation Dependence of the Impact of Global Warming on Rainfall Variations in a Tropical Island. Water 2020, 12, 3582. [Google Scholar] [CrossRef]
- Ogurtsov, M. Decadal and Bi-Decadal Periodicities in Temperature of Southern Scandinavia: Manifestations of Natural Variability or Climatic Response to Solar Cycles? Atmosphere 2021, 12, 676. [Google Scholar] [CrossRef]
- Bezak, N.; Mikoš, M. Changes in the Compound Drought and Extreme Heat Occurrence in the 1961–2018 Period at the European Scale. Water 2020, 12, 3543. [Google Scholar] [CrossRef]
- Liu, Y.; Fan, K. A new statistical downscaling model for autumn precipitation in China. Int. J. Climatol. 2013, 33, 1321–1336. [Google Scholar] [CrossRef]
- Li, F.; Zhou, M.J.; Shao, J.Q.; Chen, Z.H.; Wei, X.L.; Yang, J.C. Maize, wheat and rice production potential changes in China under the background of climate change. Agric. Syst. 2020, 182, 102853. [Google Scholar]
- Wang, J.X.; Mendelsohn, R.; Dinar, A.; Huang, J.K.; Rozelle, S.; Zhang, L.J. The impact of climate change on China’s agriculture. Agric. Econ. 2009, 40, 323–337. [Google Scholar] [CrossRef]
- Wang, X.; Zhang, X.; Yang, M.; Gou, X.; Liu, B.; Hao, Y.; Xu, S.; Xue, J.; Qin, X.; Siddique, K.H.M. Multi-Site Evaluation of Accumulated Temperature and Rainfall for Maize Yield and Disease in Loess Plateau. Agriculture 2021, 11, 373. [Google Scholar] [CrossRef]
- Wu, J.Z.; Zhang, J.; Ge, Z.M.; Xing, L.W.; Han, S.Q.; Shen, C.; Kong, F.T. Impact of climate change on maize yield in China from 1979 to 2016. J. Integr. Agric. 2021, 20, 289–299. [Google Scholar] [CrossRef]
- Xiao, D.P.; Liu, D.L.; Wang, B.; Feng, P.Y.; Tang, J.Z. Climate change impact on yields and water use of wheat and maize in the north China plain under future climate change scenarios. Agric. Water Manag. 2020, 238, 1–15. [Google Scholar] [CrossRef]
- Zhan, F.Y.; Li, H.; Zhang, J.H. Analysis of maize yield under climate change, adaptations in varieties and planting date in northeast China in recent thirty years. Int. J. Environ. Ecol. Eng. 2015, 9, 1106–1111. [Google Scholar]
Figure 1.
Location of study area and distribution of main cities.

Figure 2.
Trends of annual average temperature changes during the summer and autumn seasons in Fujian from 1971 to 2018.
Figure 2.
Trends of annual average temperature changes during the summer and autumn seasons in Fujian from 1971 to 2018.

Figure 3.
M-K test of the trends of annual average temperature changes during the summer and autumn seasons in Fujian from 1971 to 2018.
Figure 3.
M-K test of the trends of annual average temperature changes during the summer and autumn seasons in Fujian from 1971 to 2018.

Figure 4.
Trends of annual precipitation changes during the summer and autumn seasons in Fujian from 1971 to 2018.
Figure 4.
Trends of annual precipitation changes during the summer and autumn seasons in Fujian from 1971 to 2018.

Figure 5.
M-K test of the trends of annual precipitation changes during the summer and autumn seasons in Fujian from 1971 to 2018.
Figure 5.
M-K test of the trends of annual precipitation changes during the summer and autumn seasons in Fujian from 1971 to 2018.

Figure 6.
Anomaly changes of annual average temperature (a) and precipitation (b) during the summer and autumn seasons in Fujian from 1971 to 2018.
Figure 6.
Anomaly changes of annual average temperature (a) and precipitation (b) during the summer and autumn seasons in Fujian from 1971 to 2018.


Figure 7.
Contour characteristics of the real part of Morlet wavelet coefficients of annual temperature (a) and precipitation (b) in Fujian from 1971 to 2018.
Figure 7.
Contour characteristics of the real part of Morlet wavelet coefficients of annual temperature (a) and precipitation (b) in Fujian from 1971 to 2018.

Figure 8.
The characteristics of the wavelet variances of the annual temperature (a) and annual precipitation (b) in the summer and autumn seasons in Fujian from 1971 to 2018.
Figure 8.
The characteristics of the wavelet variances of the annual temperature (a) and annual precipitation (b) in the summer and autumn seasons in Fujian from 1971 to 2018.

Figure 9.
The characteristics of the first major cycle variations of the annual temperature (a) and annual precipitation (b) in the summer and autumn seasons in Fujian from 1971 to 2018.
Figure 9.
The characteristics of the first major cycle variations of the annual temperature (a) and annual precipitation (b) in the summer and autumn seasons in Fujian from 1971 to 2018.


Table 1.
Summary of the results of the analysis of the of temperature and precipitation (Ave: average of values for the 48years, Std: standard deviation of the values, CV: coefficient of variation, Hv: highest value, Lv: lowest value).
Table 1.
Summary of the results of the analysis of the of temperature and precipitation (Ave: average of values for the 48years, Std: standard deviation of the values, CV: coefficient of variation, Hv: highest value, Lv: lowest value).
| Factors | Std | Ave | CV/% | Hv | Lv |
|---|---|---|---|---|---|
| Temperature/°C | 0.5 | 24.7 | 2.1 | 26.0 | 23.6 |
| Precipitation/mm | 8.6 | 339.3 | 2.5 | 359.3 | 309.4 |
Publisher’s Note: MDPI stays neutral with regard to jurisdictional claims in published maps and institutional affiliations. |
© 2021 by the authors. Licensee MDPI, Basel, Switzerland. This article is an open access article distributed under the terms and conditions of the Creative Commons Attribution (CC BY) license (https://creativecommons.org/licenses/by/4.0/).
Share and Cite
MDPI and ACS Style
Ma, Z.; Guo, Q.; Yang, F.; Chen, H.; Li, W.; Lin, L.; Zheng, C. Recent Changes in Temperature and Precipitation of the Summer and Autumn Seasons over Fujian Province, China. Water 2021, 13, 1900. https://doi.org/10.3390/w13141900
AMA Style
Ma Z, Guo Q, Yang F, Chen H, Li W, Lin L, Zheng C. Recent Changes in Temperature and Precipitation of the Summer and Autumn Seasons over Fujian Province, China. Water. 2021; 13(14):1900. https://doi.org/10.3390/w13141900
Chicago/Turabian StyleMa, Zhiguo, Qinyu Guo, Feiyue Yang, Huiling Chen, Wenqing Li, Lili Lin, and Chaoyuan Zheng. 2021. "Recent Changes in Temperature and Precipitation of the Summer and Autumn Seasons over Fujian Province, China" Water 13, no. 14: 1900. https://doi.org/10.3390/w13141900
Note that from the first issue of 2016, this journal uses article numbers instead of page numbers. See further details here.