Article

Revealing the Challenges of Smart Rainwater Harvesting for Integrated and Digital Resilience of Urban Water Infrastructure

1
Unit of Environmental Engineering, Department of Infrastructure Engineering, Faculty of Engineering Sciences, University of Innsbruck, Technikerstrasse 13, 6020 Innsbruck, Austria
2
Department of Civil and Environmental Engineering, University of Utah, 201 Presidents’ Cir, Salt Lake City, UT 84112, USA
*
Author to whom correspondence should be addressed.
Water 2021, 13(14), 1902; https://doi.org/10.3390/w13141902
Submission received: 18 May 2021 / Revised: 5 July 2021 / Accepted: 5 July 2021 / Published: 9 July 2021
(This article belongs to the Special Issue Resilience of Interdependent Urban Water Systems)

Abstract

:
Smart rainwater harvesting (RWH) systems can automatically release stormwater prior to rainfall events to increase detention capacity on a household level. However, impacts and benefits of a widespread implementation of these systems are often unknown. This works aims to investigate the effect of a large-scale implementation of smart RWH systems on urban resilience by hypothetically retrofitting an Alpine municipality with smart rain barrels. Smart RWH systems represent dynamic systems, and therefore, the interaction between the coupled systems RWH units, an urban drainage network (UDN) and digital infrastructure is critical for evaluating resilience against system failures. In particular, digital parameters (e.g., accuracy of weather forecasts, or reliability of data communication) can differ from an ideal performance. Therefore, different digital parameters are varied to determine the range of uncertainties associated with smart RWH systems. As the results demonstrate, smart RWH systems can further increase integrated system resilience but require a coordinated integration into the overall system. Additionally, sufficient consideration of digital uncertainties is of great importance for smart water systems, as uncertainties can reduce/eliminate gained performance improvements. Moreover, a long-term simulation should be applied to investigate resilience with digital applications to reduce dependence on boundary conditions and rainfall patterns.

1. Introduction

A way to evaluate the performance and functionality of urban water infrastructure including different extension strategies is by measuring the term resilience. In the literature, resilience can be considered as a form of robustness against system failures and is determined by evaluating the loss of system functionality [1,2,3]. For example, failure magnitude and duration are used to calculate the severity and to evaluate the resilience of urban drainage networks (UDNs) against structural failures [3]. For UDN, urban flooding, combined sewer overflows (CSOs) and inflow quantity to wastewater treatment plants are commonly used metrics to measure degree of resilience in UDNs [3,4]. Furthermore, Dong et al. (2017) applied this method to evaluate the impacts of a sustainable expansion of an UDN with green infrastructure (e.g., green roof, permeable pavement and storage tanks) to cope with future uncertainties (e.g., climate change, and urbanization) [4].
In contrast to other elements of green infrastructure, the main aim of rainwater harvesting (RWH) systems is to retain and store rainwater during precipitation events for usage in non-potable drinking water applications such as irrigation or toilet flushing during dry weather periods [5]. Additionally, RWH systems represent a temporary storage volume for rainwater, thereby influencing runoff behavior into UDN. Therefore, ‘water supply efficiency’ and ‘detention/stormwater capture efficiency’ are commonly applied as metrics for evaluation at the household scale [6,7,8]. In case of a large-scale implementation, RWH systems can improve water resource recovery due to the substitution of drinking water [9] and performance of UDN (e.g., reducing flood volume) due to the detention of rainwater [10]. However, detention efficiency is strongly dependent on user behavior and withdrawal quantities in relation to the detention volume. This can be a limitation especially for traditional systems, which are therefore referred to as uncontrolled RWH systems [6,11]. For example, higher withdrawal volumes empty RWH systems faster, therefore additional storage volumes can be provided for stormwater detention.
In this context, the Internet of Things (IoT) concept as part of smart cities assists the development of communicating ‘items’ integrated into the overall system [12]. Additionally, low-cost sensors combined with innovative communication technologies (e.g., NB-IoT, LoRaWAN, Sigfox) support a large-scale implementation too. Consequently, this development enables new possibilities for the management of urban water infrastructure in a smart city framework [13]. For example, this concept is being widely applied in the development of smart RWH systems [14,15,16,17]. In contrast to uncontrolled RWH systems, smart RWH systems are equipped with a remotely controllable discharge valve, which enables an automatic release of stored stormwater prior to rain events to provide additional detention volumes. Therefore, weather forecasts are commonly integrated into control strategy, and predicted amounts and patterns of rainfall are used to determine discharge volume and closing time, respectively. However, performance is strongly dependent on the quality of the weather forecast and the predicted amount of precipitation to ensure a fully filled RWH system is available at the end of the precipitation event. Therefore, applying smart RWH systems leads to a conflict between the two contrary objectives: (1) store as much rainwater as possible for irrigation purposes and (2) provide as much detention volume as possible for UDN performance.
While the potential for smart RWH systems has been well established at the household level, impacts of a widespread implementation are to a large extent unknown. In contrast to existing infrastructure, smart RWH systems represent dynamic systems, and urban resilience is influenced by the interaction of the coupled systems, RWH units and UDN, including performance of digital system components. In particular, digital parameters may differ from the perfect performance, whereas the performance is influenced by the accuracy of weather forecasts or reliability of data communications in the case of smart RWH. Consequently, digitized systems require new definitions of resilience [18], while the effects of deviations in digital parameters are largely unknown and hardly addressed in literature.
To fill this research gap, this work aims to investigate the impact of a large-scale implementation of smart RWH systems on the resilience of urban water infrastructure and to determine influences of deviations on digital parameters associated with smart RWH systems. First, an integrated resilience parameter is presented, in which digital parameters are considered as uncertainties for classic and quantifiable metrics from urban water infrastructure. In the second step, digital parameters are determined for smart RWH systems, which can also significantly influence the results in the case of deviations. Afterwards, an Alpine municipality is hypothetically retrofitted with smart rain barrels (SRBs) as representative of smart RWH systems, and finally the influence of different digital system configurations on resilience is compared.

2. Materials and Methods

2.1. Integrated Resilience Index for the Interlinked Systems Smart Rainwater Harvesting and UDN

For this work, a two-step approach was used to determine influences of digital uncertainties associated with smart RWH on resilience. First, classic and quantifiable metrics from urban water infrastructure were combined to calculate resilience for the interlinked systems RWH and UDN. For this work, combined sewer overflows (CSO) and empty RWH system were investigated as system failures for UDN and RWH systems, respectively. Therefore, CSOs with discharged pollution load (mCSO) divided by total quantity of tracer mass introduced into the system (mtotal) was used as a severity measurement for CSO (SevCSO). Furthermore, the amount of water demand that cannot be covered by the RWH system, expressed by the difference between the delivered rainwater (VRWH) and total water demand for irrigation (VIRR), divided by VIRR, was used as the severity measurement for RWH (SevRWH). Subsequently, the resilience index (Res) was defined by:
Res =   k CSO × ( 1 m CSO m total ) + k RWH × ( 1 V IRR   V RWH V IRR ) ,
m CSO = i = 1 N rain t 1 t 2 m tracer , CSO , i × dt ,
m total = i = 1 N rain 1 t 2 m tracer , i × dt ,
V RWH = t 0 t m Q irr , need × dt t 0 t m Q irr , , RWH × dt ,
V IRR = t 0 m Q irr , need × d t ,
w CSO + w RWH = 1 ,
in which wCSO and wRWH are the weights for respective severities; Nrain is number of rain events; t1 and t2 are start and end time of rain events; mtracer,CSO,i and mtracer,i are tracer mass in CSO and total induced tracer mass; t0 and tm are start and end time of the irrigation period; Qirr,need and Qirr,RWH are the daily irrigation demand (based on daily evapotranspiration, for more information, refer to Section 2.2) and daily irrigation demand covered by RWH systems.
In the second step, possible deviations of perfect performance for digital system components were considered as uncertainties. For this purpose, the performance of different digital parameters was varied and applied to the system to determine the range of uncertainties associated with smart RWH systems.
As described above, smart RWH systems are characterized by their ability to automatically release stored rainwater prior to rain events based on weather forecasts. There-fore, with reference to smart RWH approaches [8,9,10,11], the following digital uncertainties could be identified:
  • Accuracy of weather forecast: predicted rainfall and accuracy of weather forecasts in-fluence the (automatic) emptying of the smart RWH units and therefore the effectiveness of RWH and sewer performance,
  • Reliability of data communication: communication technologies transmit measurement data and control commands, whereas transmission quality (e.g., number of successful transmissions) is dependent on chosen communication technology.
These uncertainties can show the ideal forms of behavior but may also differ from the ideal value or perfect performance and thus have an impact on the entire system. For example, data communication can be without packet losses, but may also imply major packet losses depending on the chosen communication technology. Therefore, the degree of these factors was varied and applied to the system in this work to determine the range of uncertainties associated with smart RWH systems.

2.2. Integrated Modeling of Urban Water Infrastructure
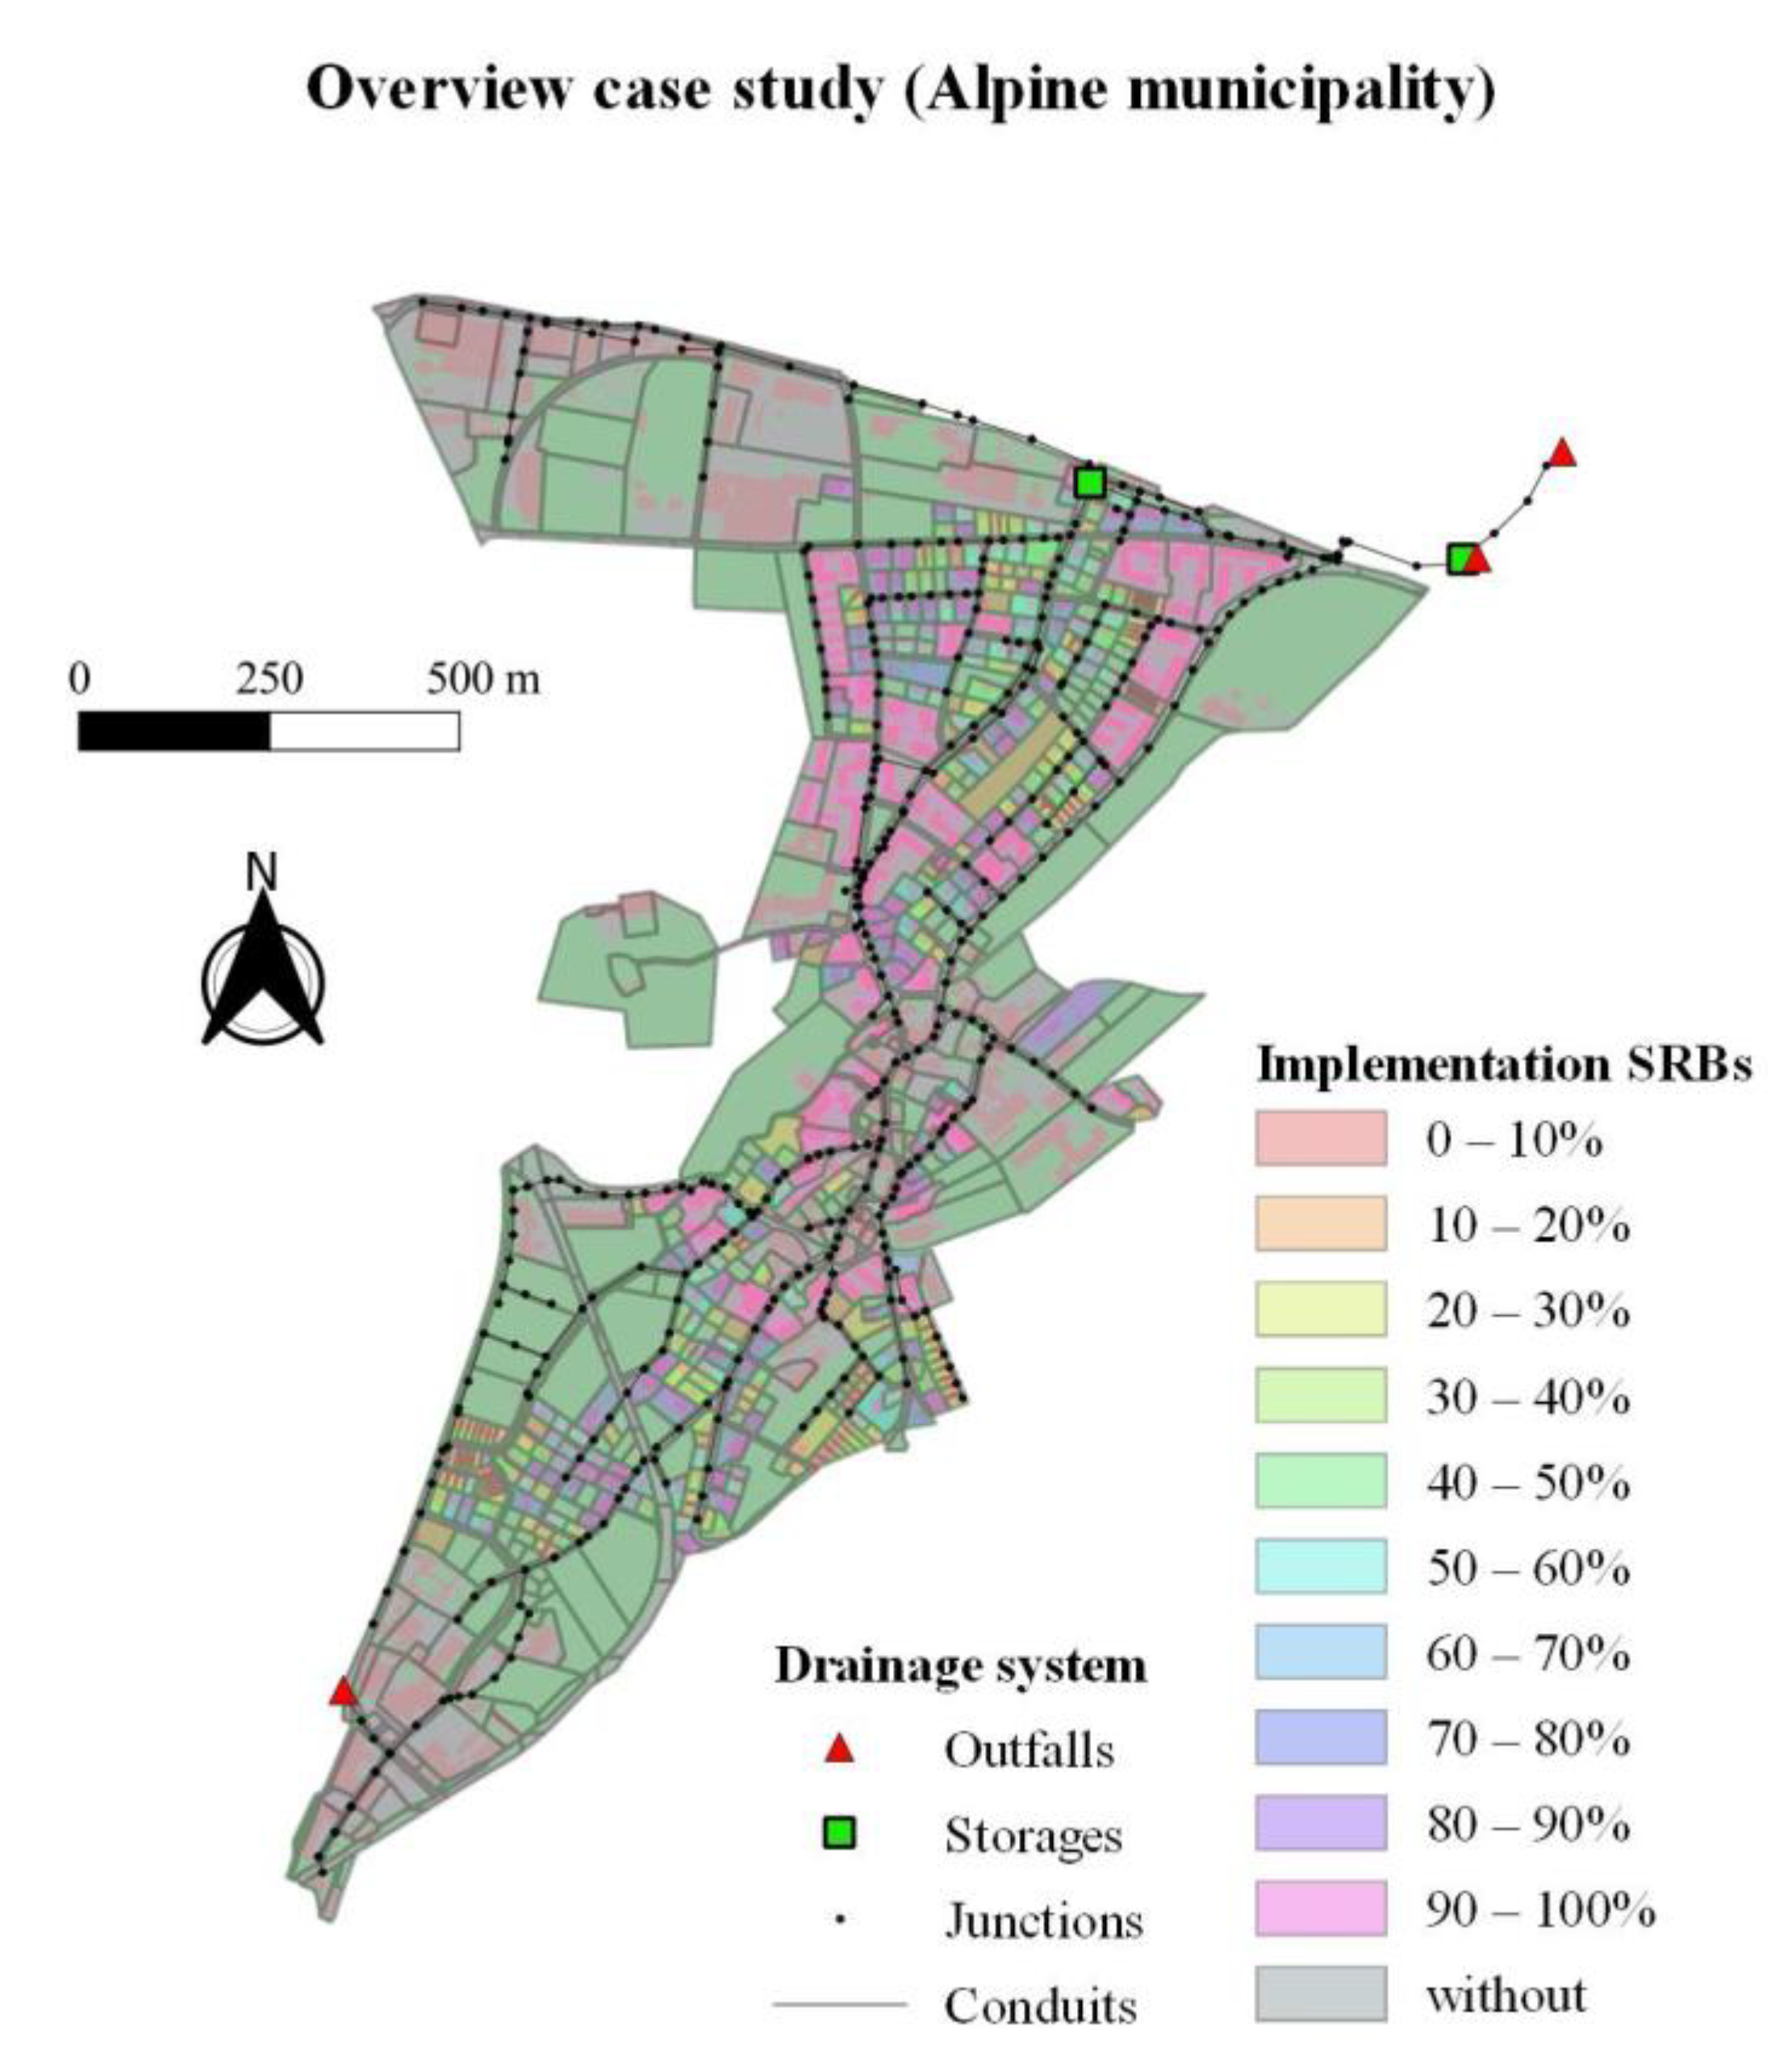
The open-source software “Smartin” [15] (available online https://github.com/iut-ibk/Smartin-Toolbox/tree/master/smartin, accessed on 22 February 2021) was utilized for simulations. “Smartin” is capable of modeling and simulating IoT-based RWH systems in a coupled model of a UDN and water distribution network (WDN) in real-time. The two main components of “Smartin” are the following Python packages: (1) PySWMM [19] as a Phyton wrapper for the hydrodynamic Storm Water Management Model (SWMM5) [20] to simulate run-off processes in UDN; and (2) Python Epanet Toolkit provided from Open Water Analytics (https://github.com/OpenWaterAnalytics/epanet-python/tree/dev/epanet_python/epanet_python, (accessed on 14 August 2019) for Epanet 2.2 [21] to analyze pressure and water quality in WDNs. Additionally, “Smartin” provides a very high spatial (property level) and temporal data resolution (seconds in UDN; hours in WDN) and supports individual control of each implemented RWH unit based on actual system states.
For UDN, the RWH systems were implemented as a low impact development (LID) type rain barrel. Each rain barrel implemented can be controlled individually by changing the drain coefficient. Based on high-resolution weather forecasts, future inflow to each implemented RWH unit was estimated, and discharge valve was opened in case the available detention volume was lower than the estimated inflow volume. Afterwards, the discharge valve was closed if either available detention volume was equal to the estimated inflow (if the rain barrel volume was greater than the estimated inflow) or before a period with a predicted peak intensity (if the rain barrel volume was lower than the estimated inflow). For dry weather, crop evapotranspiration was used as a reference value to determine irrigation demand, requiring temperature data as an input variable for an applied Hargreaves equation [22]. Afterwards, rainwater was extracted from the RWH system to satisfy irrigation demand, supplemented with drinking water in case stored rainwater could not meet irrigation demand.
When introducing “Smartin” [15], a simplified control strategy for wet weather was implemented and all discharge valves were opened simultaneously. However, in later work, “Smartin” was extended by more advanced control strategies based on sewer conditions [23]. These strategies were used for this work, and supplementary to these, “Smartin” was further extended by including uncertainties from data transmission losses for different communication technologies in the control strategy. Therefore, a random generator was implemented, which evaluates the successful digital transmission of each control command (e.g., opening discharge valve) depending on characteristics of chosen communication technology. Additionally, uncertainty in real weather forecasts was included in the control strategy.

2.3. Case Study

As a case study, an existing UDN of an Alpine municipality located in Austria was used. The UDN was designed as a combined sewer system with a general flow direction to north-east (Figure 1) and included an overdesigned CSO structure. According to Austrian standards, these structures should have a volume of 15 m3 per hectare of immediate runoff area [24], requiring a total volume of 154 m3 to fulfil current state of the art. However, CSO performance can only be improved slightly beyond this point, resulting in the influence of CSO metric on resilience index decreasing significantly beyond this point, whereas the impact of RWH performance increases substantially. Subsequently, uncontrolled RWH systems (with frequent use) represent the optimal extension solution, as most rainwater can be provided. Additionally, smart rain barrels are used to showcase smart RWH systems, which support an easy large-scale implementation of additional storage to improve the performance of existing and systems with an insufficient performance (e.g., under-designed due to increasing urbanization or climate change).
Therefore, the CSO structure was re-dimensioned to 60% of the required size (new storage volume of 91.5 m3) to investigate the effects of different extension strategies for detention volumes (e.g., central enlargement of CSO structures or decentralized implementation of SRBs). Furthermore, the calibrated SWMM5 input file of Oberascher et al. [15] was used for simulations, which has a good level of detail at the property level. In total, 630 properties were connected to the drainage network, which were further subdivided into green, roof and traffic areas.
For simplicity, CSO performance was evaluated by using a tracer for pollution loads. It was assumed that wastewater and rainwater have a concentration of 1 mg/L and 0 mg/L, respectively, for evaluations. Consequently, the concentration and quantity of discharged pollution loads depended on the dilution of wastewater with rainwater, which allowed a different assessment of small CSO events with low discharge volumes from large events with high dilution rates.
For simulations, precipitation and temperature data were extracted from a nearby weather station (distance of 6 km) for 2018. Precipitation data is available in a temporal resolution of 1 min, whereas temperature is measured in 10 min steps. Additionally, real high-resolution weather forecasts were extracted from the integrated nowcasting through a comprehensive analysis (INCA) system [25] for the weather station described above. The weather forecasts are available in 15 min time steps for the next 24 h every 15 min, whereas a weather forecast period (or accumulation period) and update time steps of 4 h and 2 h were assumed for simulations.
The presented approach was first tested under a single rain event with a rain sum of 12.9 mm (Table 1) and the severity of CSO events was illustrated for different digital parameters. In contrast, irrigation processes mainly take place in Austria during summer-half years (21 March—23 September) [26], therefore the summer-half year 2018 was chosen as an investigation period to determine the integrated resilience parameter. During this period, daily precipitation was between 0 and 32 mm/day with a total precipitation amount of 424 mm, whereas daily mean air temperature varied between −3 and +25 °C.
The smart rain barrel (SRB) concept presented in [15] was chosen as a representative of smart RWH systems. The SRB is an IoT-based micro storage with a storage volume between 200 and 500 L (for more details on dimensions, refer to [15]). Therefore, a conventional rain barrel available in hardware stores was extended by a remotely (and centrally) controllable discharge valve, whereas control commands (e.g., opening discharge valve) and measurement data (e.g., actual filling depth) were exchanged via LoRaWAN. The SRB was under operation during the summer months, whereas they are removed during the winter months due to frost in Austria. Additionally, precipitation volume was low in form of snow during the winter period. Therefore, usually no CSO or flooding events occurred in the winter period. The SRBs are intended for smart city developments including a multi-actor partnership between network operators (material costs) and property owners (e.g., installation and maintenance work).

2.4. Description of the Investigated Scenarios

For an overview of all investigated scenarios, refer to Table 2.

2.4.1. Scenarios and Uncertainties of Examination Parameters

The following parameters were used as boundary conditions for the analysis:
  • For the SRBs, 384 properties could be identified as possible installation locations, as these properties were indicated as residential areas which have place for installation and green area for irrigation. To consider different degrees of implementations as uncertainty factors for the distribution, the properties were ordered by roof area size and varied in 10% steps between 0 and 100% beginning with the smallest roof areas. It was assumed that each property has a green area of 25 m2 for irrigation.
  • For control strategies of the SRBs, we distinguished between coordinated and uncoordinated strategies. Therefore, the control strategies ‘RTC all’, with a simultaneous opening of all discharge valves and ‘RTC CSO depth’ with an opening based on sewer states were investigated in more detail. For the control strategy ‘RTC CSO depth’, a CSO filling depth of 1.0 m was set as a threshold (with a discharge water level at 1.4 m). Consequently, all discharge valves were only opened if the filling depth in the CSO structure was below 1.0 m at the update time step, while they remained closed if the filling depth was greater than 1.0 m.

2.4.2. Scenarios and Uncertainties of Digital Parameters

As described above, influences of the digital uncertainties, namely weather forecast and data communication, were considered in this work:
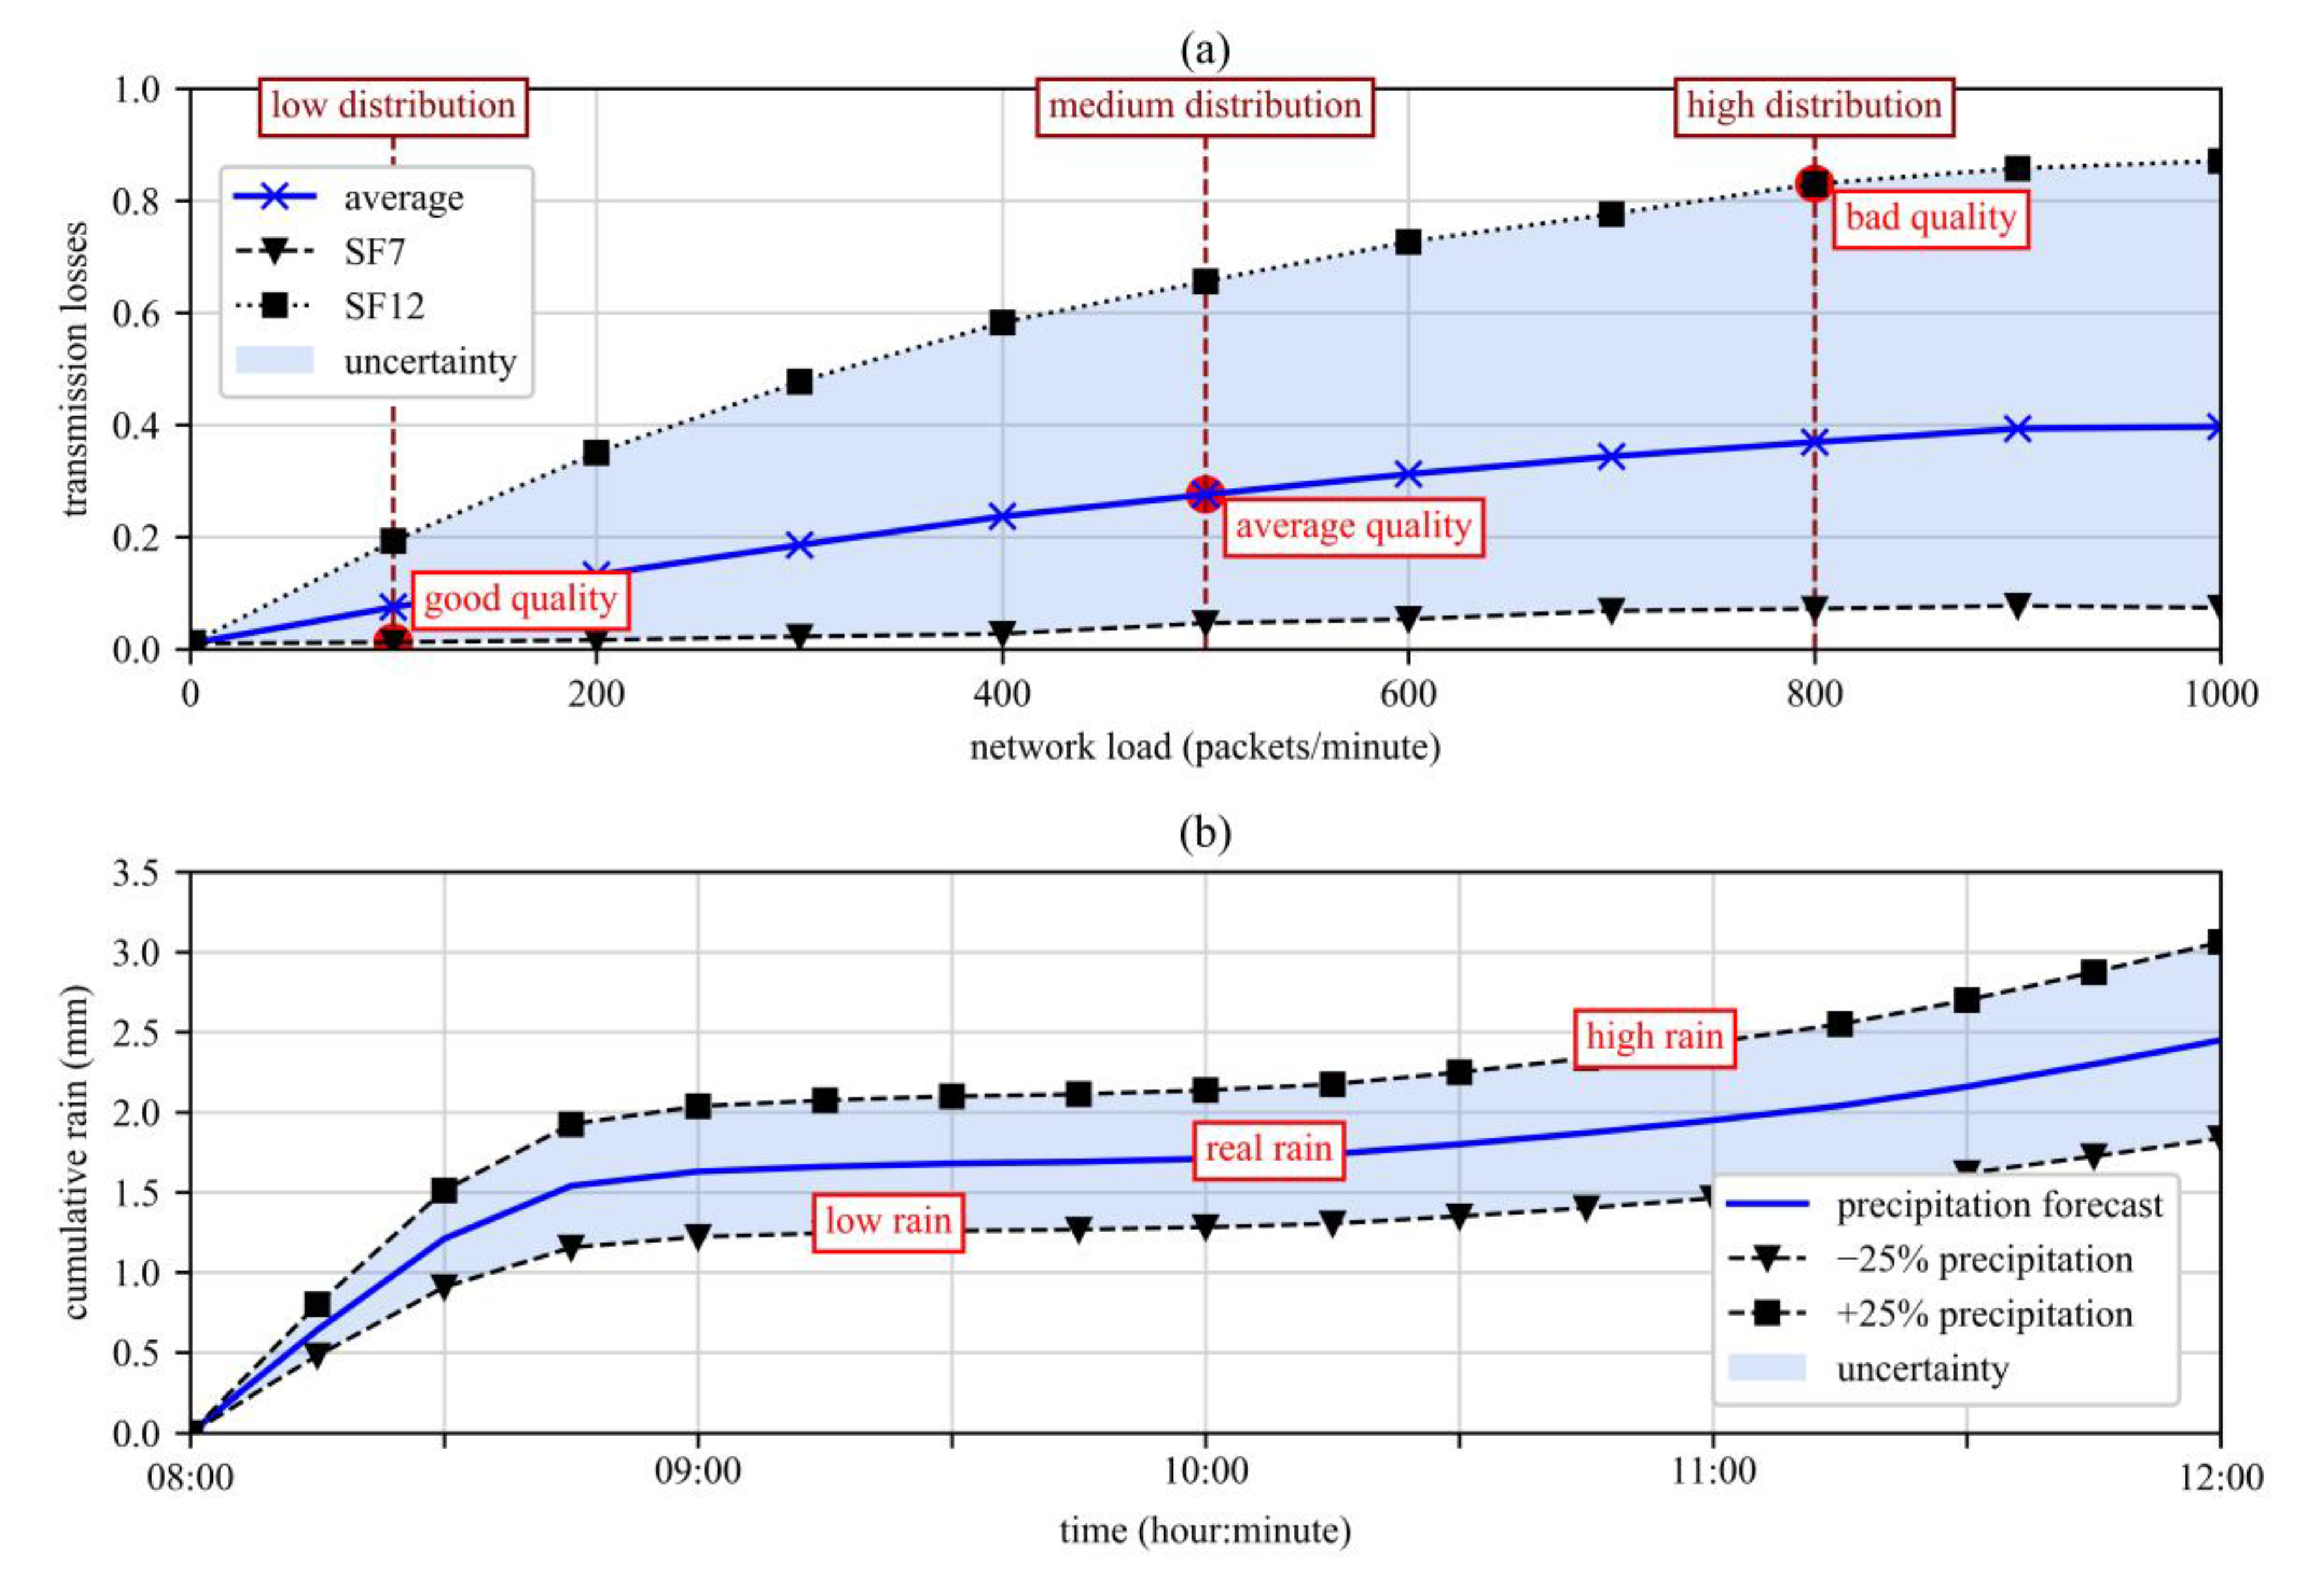
  • For weather forecasts, a deviation of ±25% was assumed, therefore the predicted amount of rainfall was either reduced or increased by 25%, as illustrated in Figure 2b.
  • The communication technology LoRaWAN operates in public frequency bands and can be used by anyone, therefore the amount of packet losses in LoRaWAN is strongly depending on network loads. Furthermore, LoRaWAN uses spreading factors (SF7 to SF12) to spread signals over channel bandwidths, whereas a higher spreading factor increases transmission distance and packet losses [27,28]. Consequently, three different scenarios were defined, namely good network quality (low packet losses with SF7 and low distribution with 1000 IoT-devices), average network quality (average packet losses and medium distribution with 5000 IoT-devices) and bad network quality (high packet losses with SF12 and high distribution with 8000 IoT-devices). Packet losses were calculated based on the findings of Blenn and Kuipers [27] and are highlighted in Figure 2a.

2.4.3. Scenario Combinations

For resilience analysis, each defined scenario was combined with each other, resulting in 180 scenario combinations. This simplified approach was chosen because simulation times for the summer-half year are up to three days (depending on the degree of penetration). The investigated scenario combinations were compared with uncontrolled RWH systems and an expansion of the existing CSO structure to the state of the art. As performance of uncontrolled RWH systems is strongly dependent on acceptance probability and user behavior, it was assumed that rainwater is extracted for irrigation purposes from the RWH system every second time. Additionally, the existing UDN (without any RWH systems) was utilized as a reference state. In total, 192 simulations were carried out.

3. Results and Discussion

3.1. Influences of Digital Uncertainties on Performance

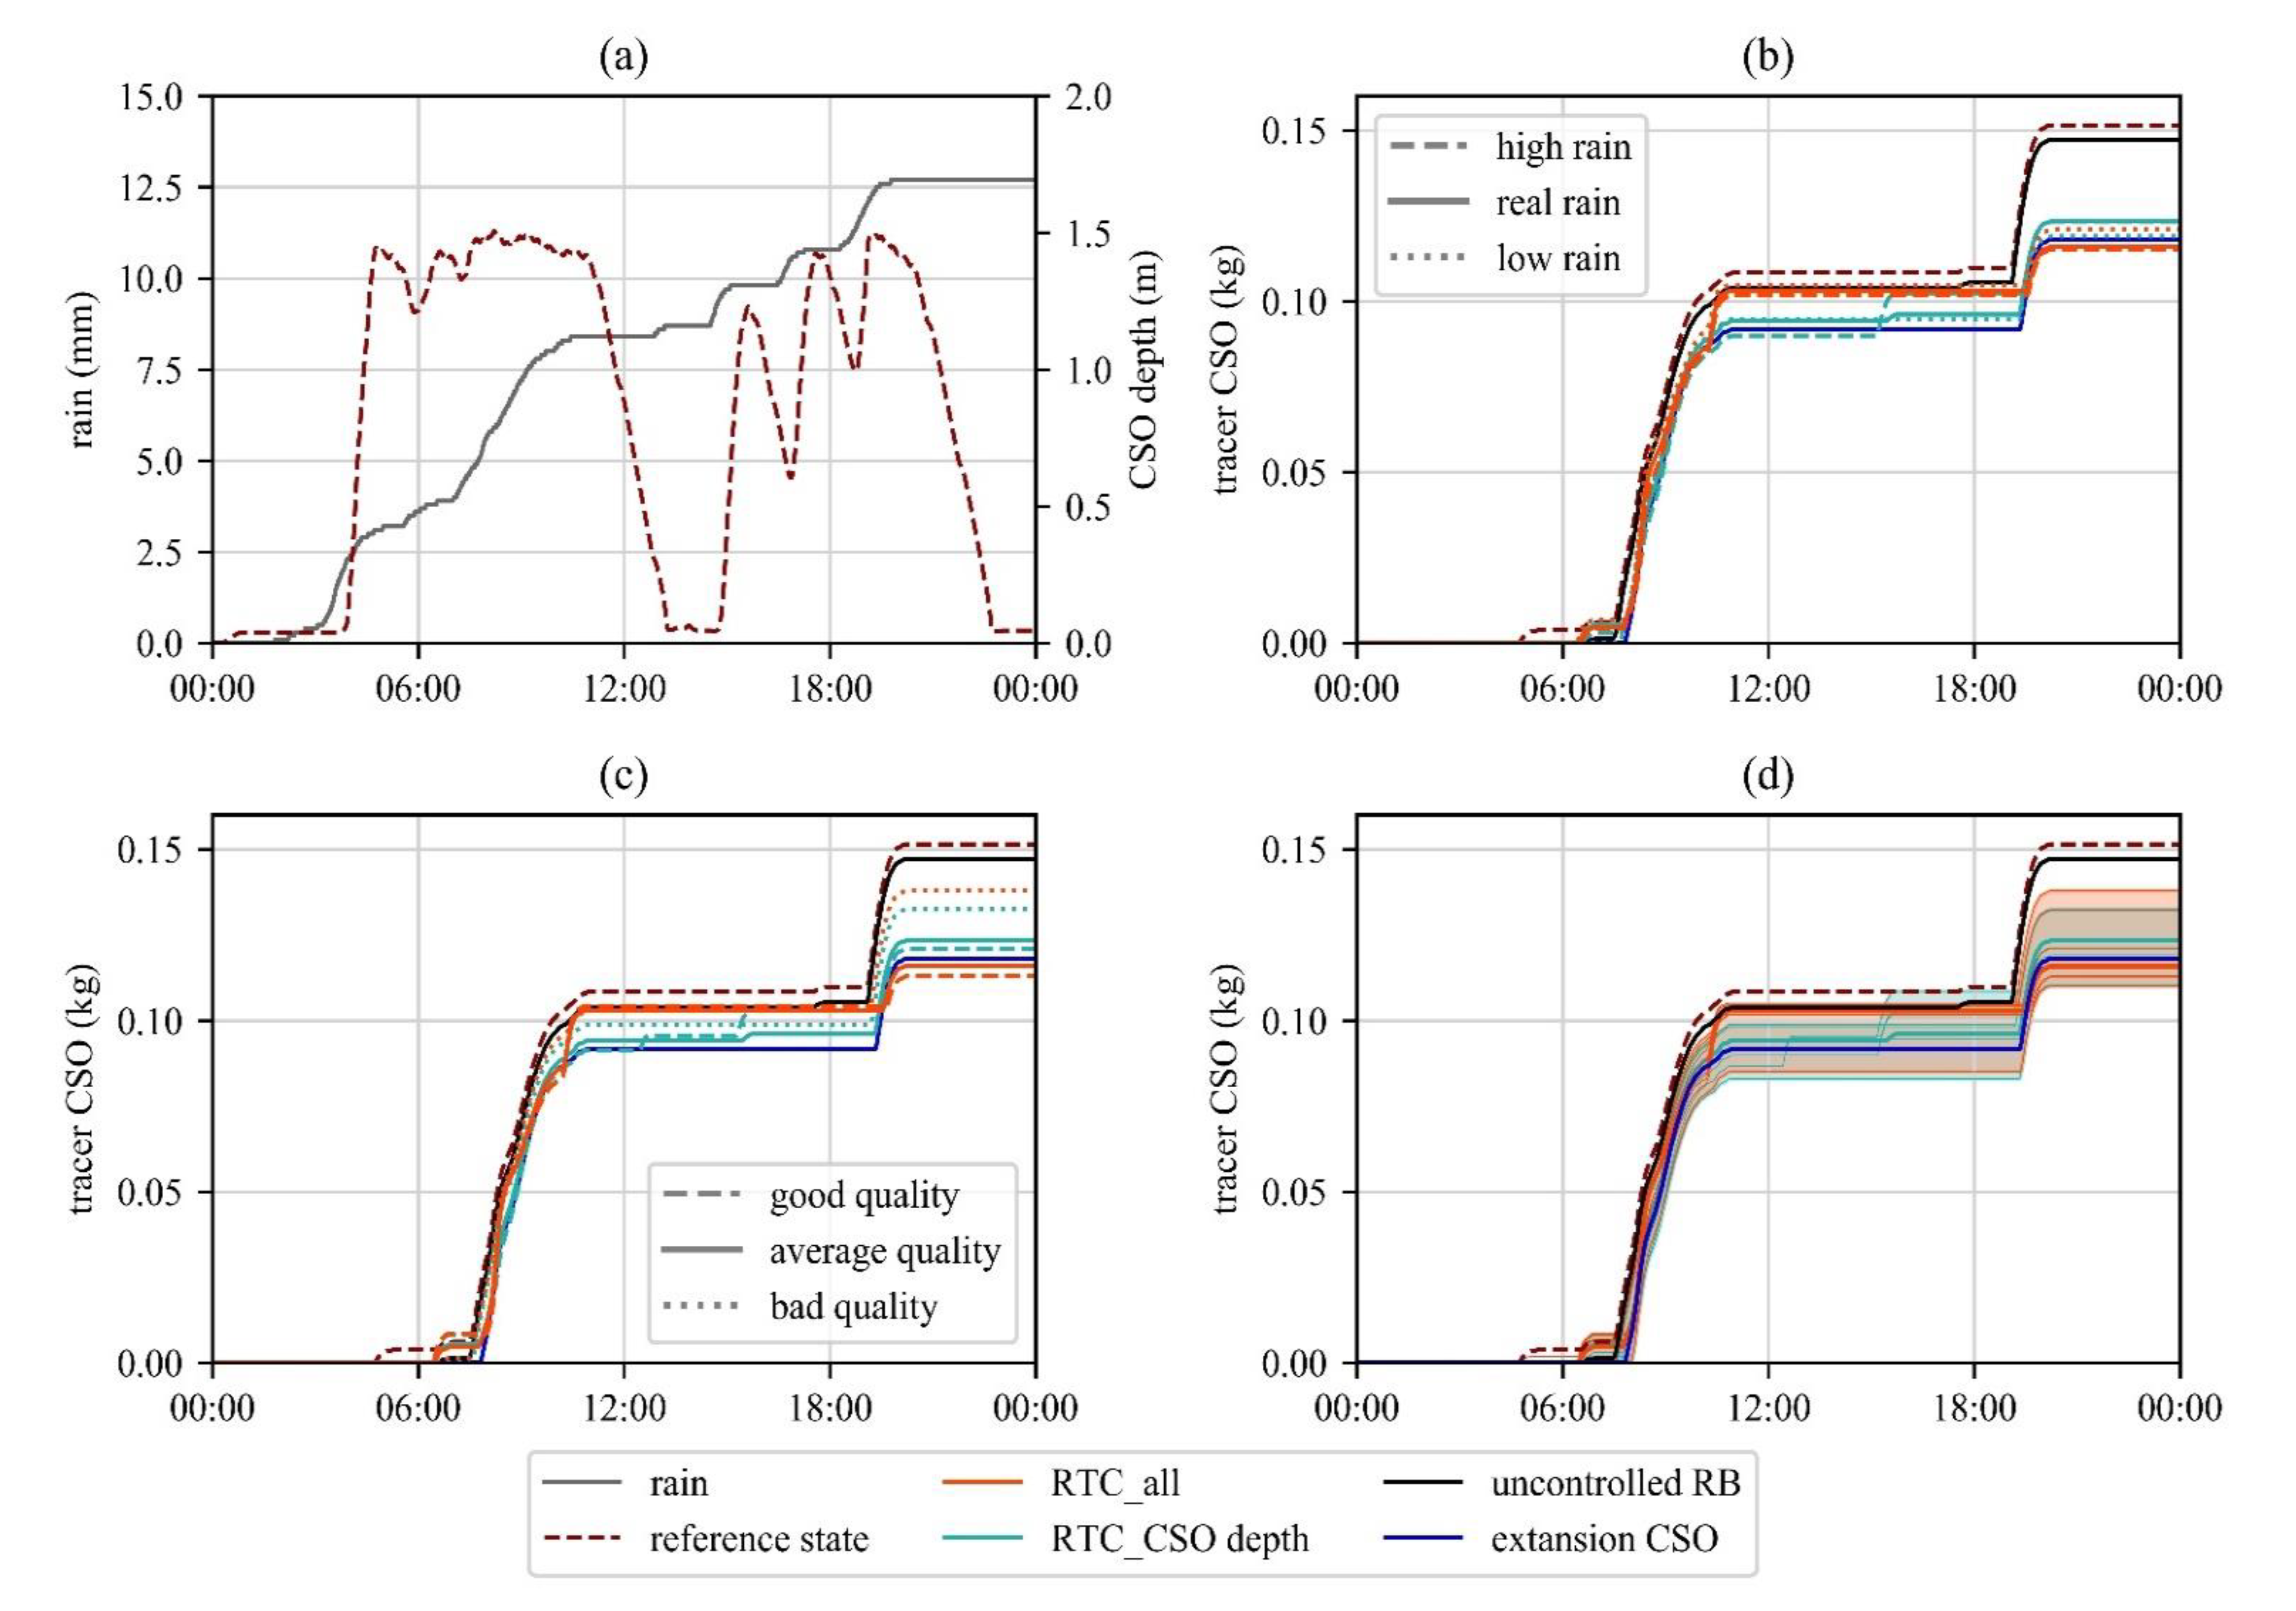
3.1.1. Single Rain Event

The single rain event was used to show the impact of smart RWH systems and assigned uncertainties on tracer load in CSO events over time, while also allowing a comprehensive discussion about associated challenges and difficulties in detail. Therefore, a penetration rate of 100% (corresponding to 384 smart rain barrels with a total storage volume of 181 m3) was assumed.
The single rain event showed a total amount of precipitation of 12.9 mm but was characterized through frequent rain breaks during the event (Figure 3a). Furthermore, two CSO events were apparent for the reference state without any RWH systems, causing a total tracer load in CSO overflow of 0.151 kg. At the beginning of the event, a partial filling of each RWH system implemented was assumed. Therefore, the start of a CSO event was slightly delayed for uncontrolled RWH systems as additional detention volumes were provided, which then followed the pattern of the reference state. In contrast, smart RWH systems could be emptied prior to rain events. Consequently, more additional detention volume was available and the start of the CSO event could be further postponed. However, afterwards each investigated scenario had a different pattern.
Figure 3b shows influences of deviations assigned with weather forecast, whereas for simulations, an average network quality for data communication was assumed (i.e., packet losses 28.3%). For the first CSO event, two behaviors were particularly noticeable: (1) an increase of the predicted amount of precipitation can provide more detention volume and thus reduce CSO volumes and subsequently tracer mass; and (2) a simultaneous opening of all discharge valves (as applied in the control strategy ‘RTC all’) sharply increases mCSO at the end of the first CSO event. This can be explained by the fact that the smart RWH system is fully filled at the update time step at 10:00, and all discharge valves are opened as further precipitation is forecasted for the next 4 h. Consequently, this process creates an artificial CSO event. In contrast, the control strategy ‘RTC CSO depths’ considers system states, and as CSO depth is higher than 1.0 m at 10:00, this discharge process is avoided/postponed. The intermediate results at 12:00 show that a coordinated strategy (‘RTC CSO depths’) clearly results in a more significant improvement compared to an uncoordinated strategy (‘RTC all’). Additionally, an overestimation of forecasted precipitation amount has a positive effect on stormwater performance.
However, afterwards, this exemplary evaluation also shows the complexity of rain events with longer durations and frequent rain breaks. At 14:00, CSO depth is below 1.0 m and discharge valves of smart RWH systems are opened in the control strategy ‘SRB CSO depth’, as further precipitation is forecasted. Therefore, the filling depth of CSO structure is higher for this control strategy from that time onwards. Consequently, this situation causes a significant increase in mCSO in the second CSO event and therefore, decreases efficiency compared to the control strategy ‘RTC CSO depth’ (although better adapted to the overall system).
This pattern is also noticeable in Figure 3c, which shows different scenarios for data communication with real weather forecasts (no deviation of predicted amount of precipitation). The communication network with higher quality has lower packet losses, resulting in more control commands (e.g., open discharge valves) that can be successfully transmitted. Consequently, a higher number of discharge valves were opened, and thus additional detention volumes could be provided. As before, two different trends could be distinguished. For the control strategy ‘RTC CSO depth’, a higher quality of communication network clearly reduces mCSO for the first CSO event. However, due to the high number of smart RWH systems discharged, it subsequently causes a higher degree of filling in the CSO structure and has therefore a negative effect on the second CSO event. In contrast, the opposite case is noticeable for the control strategy ‘RTC all’. First, a good quality communication network leads to a higher increase of mCSO at the end of the first CSO event. Second, through this additional CSO discharge, system capacity used is lower and thereby causes the smallest increase in mCSO in the second CSO event.
Finally, Figure 3d summarizes all investigated scenario combinations and highlights the range of uncertainties associated with smart RWH scenarios.
As a central conclusion, it can be summarized that the effectiveness of smart RWH systems is highly dependent on boundary conditions and precipitation patterns for single rain events. For example, scenario-combinations, which show the best improvements for the first CSO event (e.g., a control strategy based on actual sewer performance, an overestimation of amount of precipitation and a good network quality) lead to a noticeable worsening of system performance for the second CSO event compared to other smart RWHs scenario combinations.

3.1.2. Long-Term Simulation (Summer-Half Year 2018)

For scenario combinations with any kind of RWH system, the number of RWH systems varies between 38 and 384 units, corresponding to a degree of penetration of 10% and 100%, respectively. Therefore, additional storage volume is in the range of 10.3 and 181.0 m3. The results for investigated scenario combinations vary between 2.514 and 2.843 kg for mCSO and 121 and 308 m3 for VRWH. In contrast to the presented single rain event above, dependence on selected boundary conditions at the beginning of simulation decreases through considering a longer time period. Therefore, results of the complete summer half-year 2018 allow a clear distinction in effectiveness of different control strategies. As the results show, each investigated scenario combination achieves an improvement compared to the reference state, whereby the effectiveness is influenced by the three following factors.
First, there is a strong dependence between effectiveness and degree of penetration for all investigated scenarios. As expected, a higher number of any kind of RWH systems implemented improves system improvements more. Additionally, the spreading of associated uncertainties is increasing with degree of penetration, as highlighted for mCSO and VRWH in Figure 4. This can be explained by the fact that a higher number of RWH systems has more potential for improvements and consequently, uncertainties also have a higher impact. In this context, a coordinated control strategy based on sewer conditions (‘RTC CSO depth’) shows lower variation in results than an uncoordinated control strategy (‘RTC all’).
Second, the effectiveness of smart RWH systems depends on applied control strategy. As can be seen in Figure 4, there is a clear distinction between a coordinated control strategy and an uncoordinated control strategy for stormwater performance. For example, each scenario combination of the control strategy ‘RTC CSO depth’ provides better results for mCSO than ‘RTC all’. In contrast, there are only small differences in VRWH that are noticeable. Interestingly, uncontrolled RWH shows only marginal differences in terms of mCSO compared to the control strategy ‘RTC all’, although a reduced abstraction of rainwater was assumed. In contrast, uncontrolled RWH systems still represent an optimum scenario for VRWH, suggesting that the RWH systems were implemented to provide a volume which is too small to satisfy all irrigation requirements. Additionally, an overestimation of precipitation in weather forecasts results in not fully filled smart RWH systems at the end of the rain event and therefore reduces the amount of usable rainwater for irrigation.
Third, the efficiency of smart RWH systems implemented is dependent on investigated uncertainty and differ between the applied control strategy and considered subsystem (e.g., RWH and UDN). For example, uncertainties, providing more additional detention volume (e.g., increasing amount of precipitation, low packet losses) cause an increase of mCSO, but decrease VRWH for control strategy ‘RTC CSO depth’. Conversely, uncertainties providing less additional detention volume (e.g., a decreasing amount of precipitation forecasted, high packet losses) achieve the opposite result, namely a worsening of mCSO and an increasing of VRWH. Therefore, a scenario combination of ‘high rain’ and ‘good network quality’ illustrates this effect in Figure 4. Interestingly, a decreasing amount of precipitation forecasted and/or high packet losses improve both mCSO and VRWH for the control strategy ‘RTC all’. If less rainwater is simultaneously discharged from the smart RWH systems, the probability of artificial CSO events is reduced. As a result, less tracer mass is discharged and subsequently, mCSO is improved. Furthermore, this approach also causes an improvement of VRWH, as the discharge volume of the SRBs is lower, and therefore, more rainwater can be provided for irrigation. To display this effect, the scenario combination ‘low rain’ with ‘bad quality’ has been marked in Figure 4.
In summary, effectiveness is strongly dependent on the additional volume implemented (e.g., increases occur with the degree of penetration), whereby the control strategy applied has a significant influence on efficiency (e.g., coordinated strategy performs better than uncoordinated strategy). Subsequently, effectiveness is also influenced by digital parameters (e.g., deviations in weather forecasts, packet losses in data communication), whereby these influences differ for the control strategy applied and the considered subsystem (e.g., RWH or UDN).

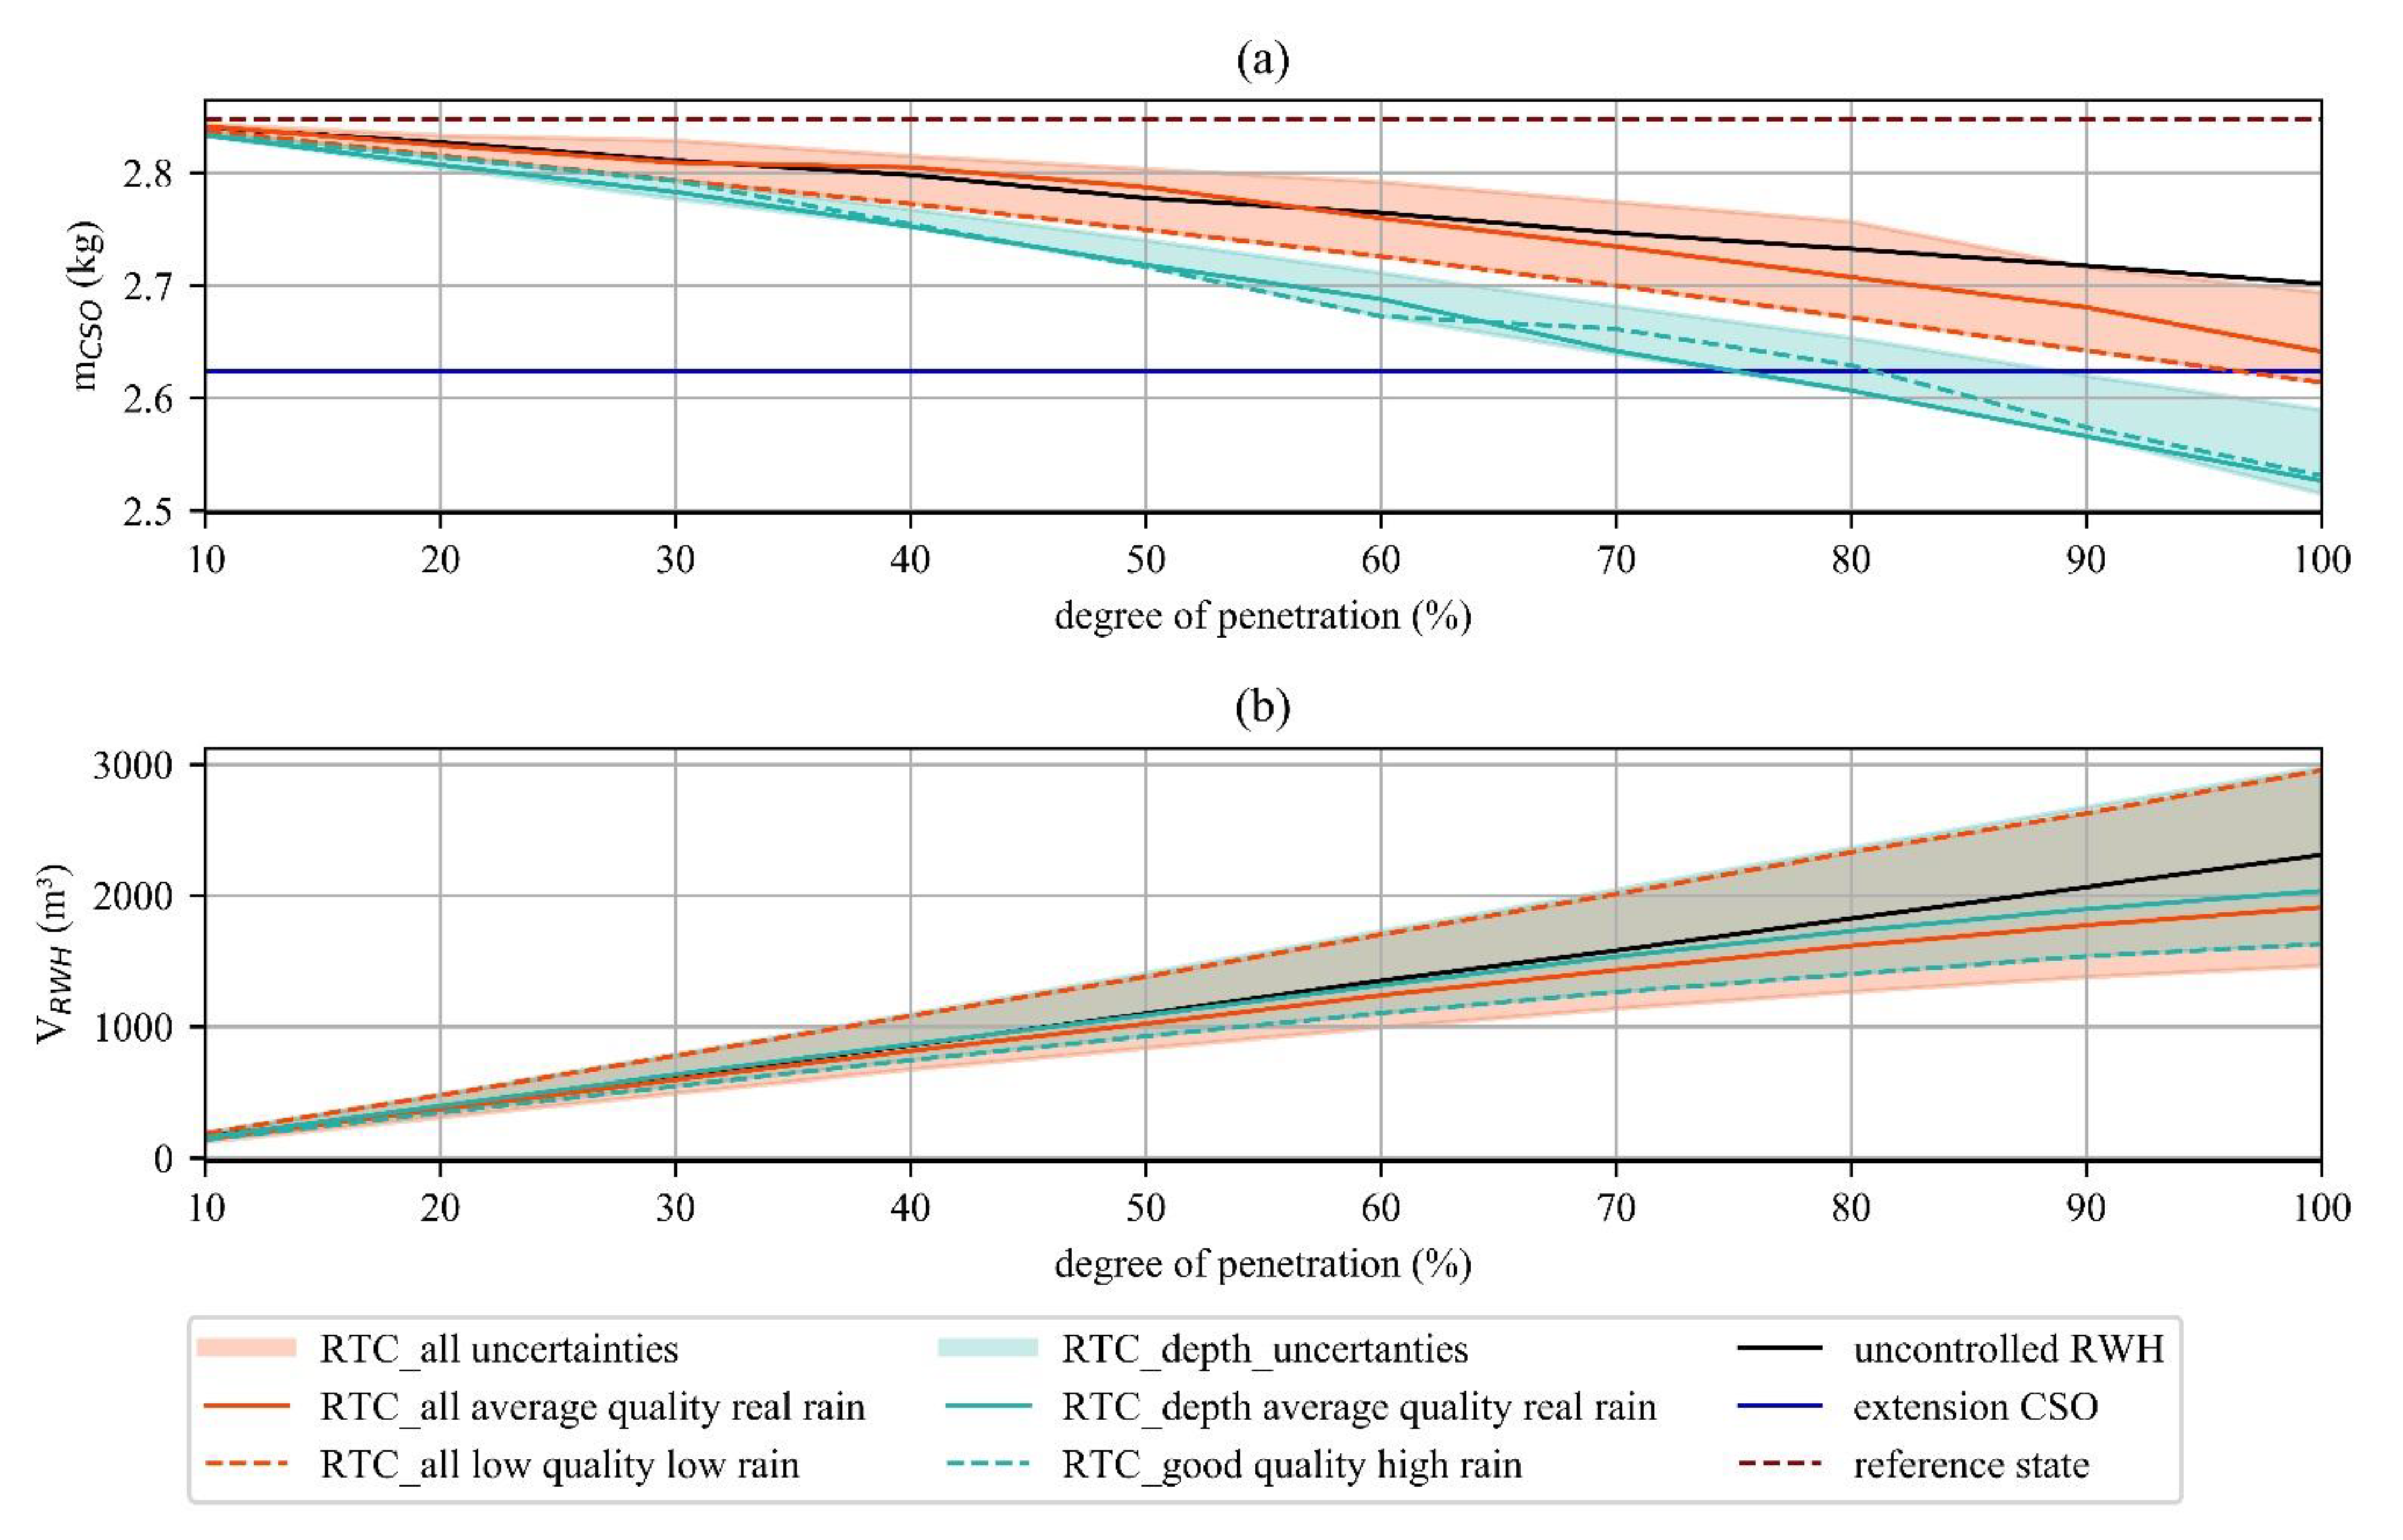
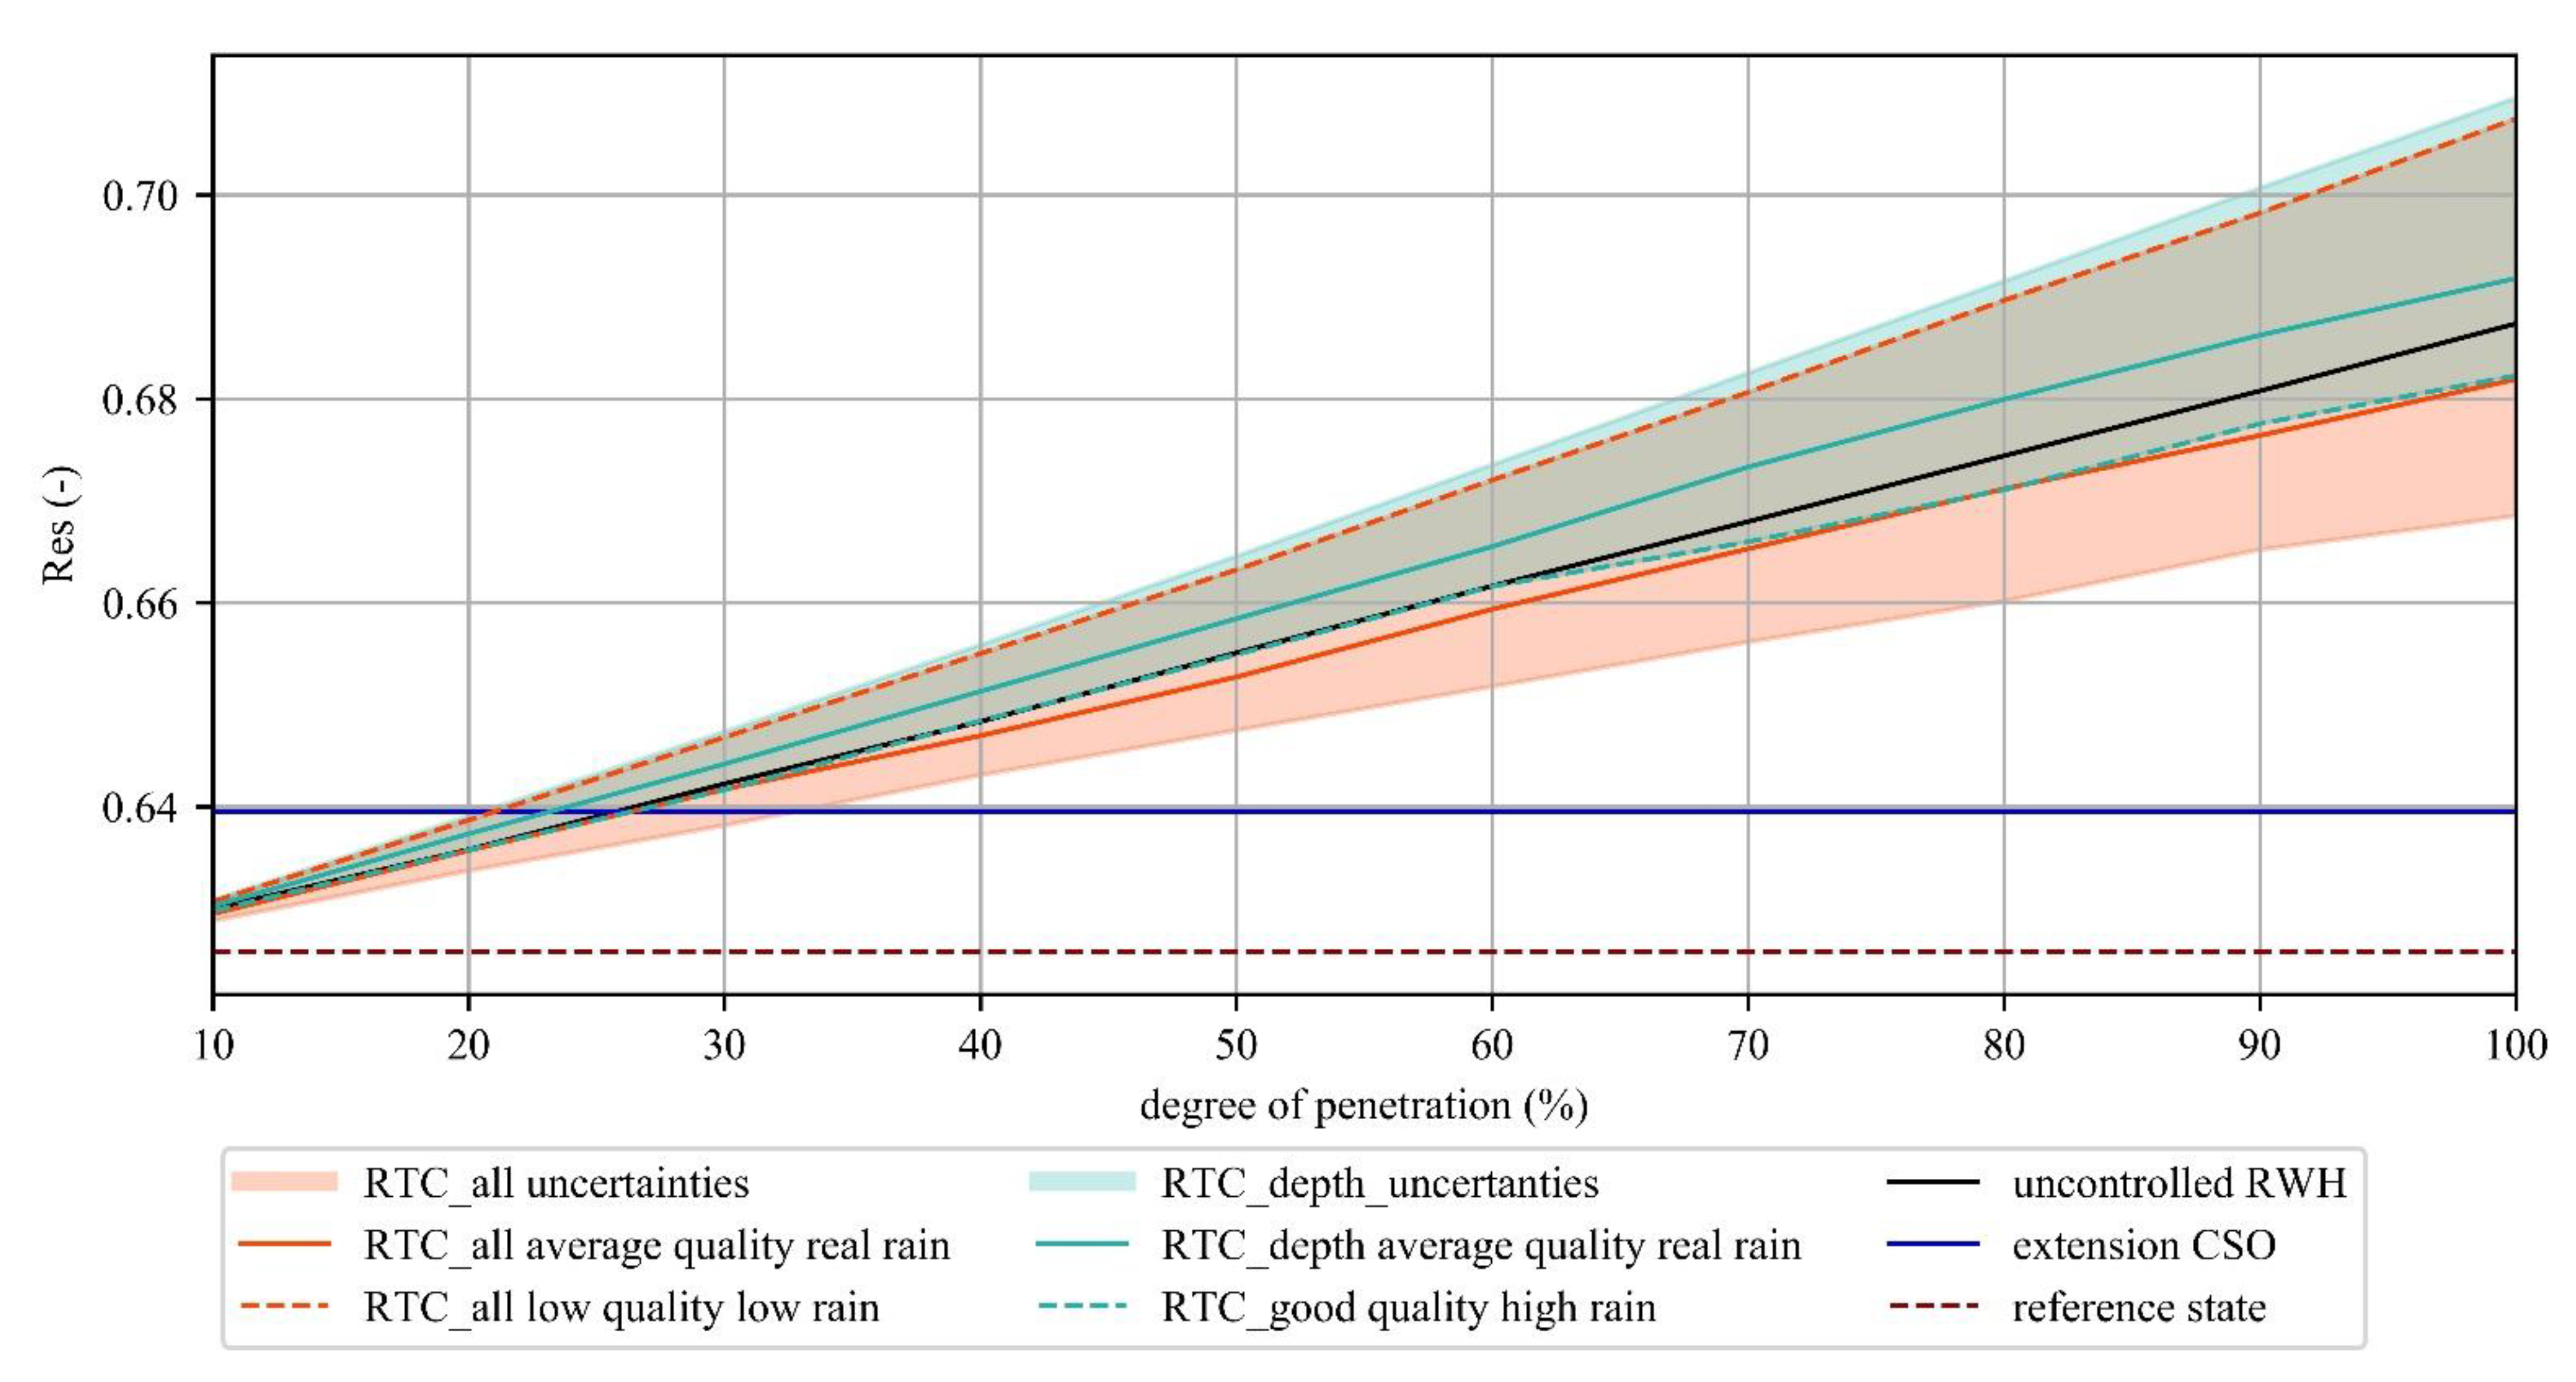
3.2. Integrated Resilience Analysis

The Resilience index (Res) was calculated for the summer half-year 2018. Total irrigation demand was estimated based on the model of Oberascher et al. (2021) [15] and was 8800 m3 in total (VIRR), which corresponds to approximately 10 days of average water consumption for the case study. Furthermore, induction of tracer mass into the system was only considered for wet weather and was found to be 13.078 kg (mtotal). The weighting were are chosen to be 0.8 and 0.2 for wCSO and wRWH, respectively, considering local preferences to improve CSO performance. Then, these values were used to calculate the integrated resilience index (Res) for all investigated scenarios, as shown in Figure 5.
The reference state (CSO volume of 91.5 m3) and the extension of the CSO structure to fulfil current regulations (new CSO volume of 154 m3) are only influenced by CSO performance, and Res was calculated to be 0.626 and 0.640, respectively. In contrast, Res is based on CSO and RWH performances for all scenario combinations with any kind of RWH and depends on the degree of penetration. Therefore, Res ranges between 0.630 and 0.687 for uncontrolled RWH systems, whereas it varies between 0.629 and 0.701 for smart RWH systems.
The extension of the CSO structure by 62.5 m3 corresponds to an additional storage volume of approximately 135 rain barrels and thus a penetration rate of 35%. As can be seen in Figure 5, all scenario combinations with RWH systems show an improvement in Res at this degree of penetration, which is mainly due to drinking water savings. Therefore, RWH systems represent a good alternative for necessary extensions of existing urban water infrastructure. With a higher degree of penetration, the influence of CSO performance on Res increases.
Additionally, smart RWH systems have the ability to further improve Res, but the range of uncertainties associated with a smart RWH system increases with a higher degree of penetration. Interestingly, however, an unfavorable scenario combination for digital parameters can also significantly reduce system resilience compared to uncontrolled RWH systems.
Furthermore, achievable results are strongly influenced by current conditions (e.g., existing infrastructure) and desired requirements for optimization (in this work improving RWH and/or UDN) and can therefore not be predicted easily. For example, an increase in precipitation does not always improve CSO performance, as shown by the control strategy ‘RTC all’. Consequently, considering uncertainties of digital parameters is of the greatest importance for successfully realizing smart water systems.
Finally, the recommended extension strategy is strongly related on preferred performance improvements. In this context, the achievable results are between the two extreme cases: (1) CSO extension shows a clearly better improvement if the focus is only on CSO performance (e.g., a degree of penetration of 80% (approximately 150 m3) and advanced RTC has the same impact on CSO performance as an CSO extension (65 m3)); and (2) smart RWH systems use rainwater for irrigation processes reducing drinking water demand, which is not the case with CSO extension. Therefore, the resilience index is strongly influenced by the weighting factors chosen, which subsequently influences the best extension strategy.

3.3. Further Discussion and Outlook

In the chosen approach, resilience is determined based on classic definitions of resilience, and additionally, deviations of digital parameters from perfect performance are considered as uncertainties in the inputs. Although this approach highlights the importance of considering digital resilience, it poses a challenge for interpretating the results. For example, it is not easy to determine which digital uncertainty causes the decrease in resilience. Therefore, a more straightforward method is required in future work to facilitate the interpretation of the impact of individual digital uncertainties associated with smart RWH systems. For example, these requirements can be met by defining a new (digital) resilience metric, which includes the performance curves of digital components.
Additionally, the performance of UDN was evaluated based on tracer mass in CSO events, assuming that the tracer is only induced in wastewater. This resulted in a certain dilution effect, and therefore, lower CSO events had a higher impact. However, as the results demonstrated, improvements are strongly dependent on the current situation (e.g., in this case existing infrastructure). Therefore, further work should use real pollution loads instead of tracer mass. Additionally, the method used herein did not consider wash-off processes of different surfaces, meaning that the ‘first flush’ effect was mimicked inadequately. For the hydraulic-dynamic simulation, a high-resolution model at the subcatchment level subdivided by different surface types was used to investigate the effects of IoT-based micro reservoirs on UDN. Consequently, future work should also include time and area-dependent pollution models for adequate simulation of pollution loads.

4. Conclusions

In this work, the impact of a large-scale implementation of smart rainwater harvesting (RWH) systems on resilience of urban water infrastructure was analyzed. Smart RWH systems are characterized by automatically releasing stored rainwater based on weather forecasts prior to rain events to increase detention capacity, therefore influencing both the RWH unit and urban drainage network (UDN). Additionally, digital parameters (e.g., weather forecasts, data communication and applied control strategies) may differ from the perfect performance and thus influence overall system performance. To evaluate these impacts, classic and quantifiable metrics of UDN and RWH systems for resilience were combined by using uncertainty assessments caused through digital parameters (e.g., source of uncertainties are deviations in predicted amount of precipitation and packet losses of control commands). Afterwards, an Alpine municipality was hypothetically retrofitted with smart rain barrels as an IoT-based solution for smart RWH.
Based on the obtained results, the following main conclusions can be drawn for large-scale implementation of smart RWH systems:
  • To evaluate the resilience of digital systems, a longer period should be considered, as the performance during single events is very dependent on boundary conditions and rainfall patterns.
  • Smart RWH systems provide the opportunity to automatically release stormwater prior to rain events and can thereby further increase integrated system resilience (e.g., reducing combined sewer overflow events while providing a sufficient amount of rainwater for non-potable usages). Therefore, a large-scale decentralized retrofitting of existing infrastructure with smart RWH systems represents a good alternative for required extensions of existing and under-designed urban water infrastructure.
  • However, results of the integrated resilience index are influenced by weighting factors chosen. Therefore, recommended extension strategies were strongly related on preferred performance improvements (e.g., CSO and/or RHW optimization).
  • Additionally, the importance of a coordinated integration and real-time control increases with number of smart RWH units implemented, as the potential for improvements (or degradation) of system performance largely depends on the storage volume added.
  • Furthermore, a sufficient consideration of digital uncertainties (e.g., reliability of data transmission, accuracy of weather forecasts) is of the greatest importance for smart water systems, as associated uncertainties can reduce/eliminate otherwise obtained performance improvements.

Author Contributions

Conceptualization and methodology, M.O. and R.S.; software, M.O.; writing—original draft preparation, A.D. and M.O.; writing—review and editing, J.L., M.H., R.S., S.H. and W.R. All authors have read and agreed to the published version of the manuscript.

Funding

This publication was produced as part of the “Smart Water City” project. This project is funded by the Austrian Climate and Energy Fund and is part of the program “Smart Cities Demo—Living Urban Innovation 2018” (project 872123).

Data Availability Statement

The code used for the simulations is publicly available in the GitHub repository (https://github.com/iut-ibk/Smartin-Toolbox/tree/master/smartin, accessed on 22 February 2021), whereas case study data is not publicity available because it contains existing infrastructure data of water distribution and urban drainage network including personalized water consumption data.

Conflicts of Interest

The authors declare no conflict of interest. The funders had no role in the design of the study; in the collection, analyses, or interpretation of data; in the writing of the manuscript, or in the decision to publish the results.

References

  1. Juan-Garcia, P.; Butler, D.; Comas, J.; Darch, G.; Sweetapple, C.; Thornton, A.; Corominas, L. Resilience theory incorporated into urban wastewater systems management. State of the art. Water Res. 2017, 115, 149–161. [Google Scholar] [CrossRef] [Green Version]
  2. Liu, W.; Song, Z. Review of studies on the resilience of urban critical infrastructure networks. Reliab. Eng. Syst. Saf. 2020, 193, 106617. [Google Scholar] [CrossRef]
  3. Mugume, S.N.; Gomez, D.E.; Fu, G.; Farmani, R.; Butler, D. A global analysis approach for investigating structural resilience in urban drainage systems. Water Res. 2015, 81, 15–26. [Google Scholar] [CrossRef] [Green Version]
  4. Dong, X.; Guo, H.; Zeng, S. Enhancing future resilience in urban drainage system: Green versus grey infrastructure. Water Res. 2017, 124, 280–289. [Google Scholar] [CrossRef] [PubMed]
  5. Campisano, A.; Butler, D.; Ward, S.; Burns, M.J.; Friedler, E.; DeBusk, K.; Fisher-Jeffes, L.N.; Ghisi, E.; Rahman, A.; Furumai, H.; et al. Urban rainwater harvesting systems: Research, implementation and future perspectives. Water Res. 2017, 115, 195–209. [Google Scholar] [CrossRef] [PubMed]
  6. Sample, D.J.; Liu, J. Optimizing rainwater harvesting systems for the dual purposes of water supply and runoff capture. J. Clean. Prod. 2014, 75, 174–194. [Google Scholar] [CrossRef]
  7. Quinn, R.; Rouge, C.; Stovin, V. Quantifying the performance of dual-use rainwater harvesting systems. Water Res. X 2021, 10, 100081. [Google Scholar] [CrossRef] [PubMed]
  8. Zhang, S.; Jing, X.; Yue, T.; Wang, J. Performance assessment of rainwater harvesting systems: Influence of operating algorithm, length and temporal scale of rainfall time series. J. Clean. Prod. 2020, 253, 120044. [Google Scholar] [CrossRef]
  9. An, K.J.; Lam, Y.F.; Hao, S.; Morakinyo, T.E.; Furumai, H. Multi-purpose rainwater harvesting for water resource recovery and the cooling effect. Water Res. 2015, 86, 116–121. [Google Scholar] [CrossRef]
  10. Jamali, B.; Bach, P.M.; Deletic, A. Rainwater harvesting for urban flood management—An integrated modelling framework. Water Res. 2020, 171, 115372. [Google Scholar] [CrossRef]
  11. Quinn, R.; Melville-Shreeve, P.; Butler, D.; Stovin, V. A Critical Evaluation of the Water Supply and Stormwater Management Performance of Retrofittable Domestic Rainwater Harvesting Systems. Water 2020, 12, 1184. [Google Scholar] [CrossRef] [Green Version]
  12. Li, S.; Xu, L.D.; Zhao, S. The internet of things: A survey. Inf. Syst. Front. 2014, 17, 243–259. [Google Scholar] [CrossRef]
  13. Kerkez, B.; Gruden, C.; Lewis, M.; Montestruque, L.; Quigley, M.; Wong, B.; Bedig, A.; Kertesz, R.; Braun, T.; Cadwalader, O.; et al. Smarter Stormwater Systems. Environ. Sci. Technol. 2016, 50, 7267–7273. [Google Scholar] [CrossRef] [PubMed]
  14. Liang, R.; Di Matteo, M.; Maier, H.R.; Thyer, M.A. Real-Time, Smart Rainwater Storage Systems: Potential Solution to Mitigate Urban Flooding. Water 2019, 11, 2428. [Google Scholar] [CrossRef] [Green Version]
  15. Oberascher, M.; Kinzel, C.; Kastlunger, U.; Kleidorfer, M.; Zingerle, C.; Rauch, W.; Sitzenfrei, R. Integrated urban water management with micro storages developed as an IoT-based solution—The smart rain barrel. Environ. Model. Softw. 2021, 139, 105028. [Google Scholar] [CrossRef]
  16. Roman, D.; Braga, A.; Shetty, N.; Culligan, P. Design and Modeling of an Adaptively Controlled Rainwater Harvesting System. Water 2017, 9, 974. [Google Scholar] [CrossRef] [Green Version]
  17. Xu, W.D.; Fletcher, T.D.; Burns, M.J.; Cherqui, F. Real-Time Control of Rainwater Harvesting Systems: The Benefits of Increasing Rainfall Forecast Window. Water Resour. Res. 2020, 56, e2020WR027856. [Google Scholar] [CrossRef]
  18. Li, J.; Yang, X.; Sitzenfrei, R. Rethinking the Framework of Smart Water System: A Review. Water 2020, 12, 412. [Google Scholar] [CrossRef] [Green Version]
  19. McDonnell, B.; Ratliff, K.; Tryby, M.; Wu, J.; Mullapudi, A. PySWMM: The Python Interface to Stormwater Management Model (SWMM). J. Open Source Softw. 2020, 5, 2292. [Google Scholar] [CrossRef]
  20. Rossman, L.A. Storm Water Management Model. User’s Manual Version 5.1; Environmental Protection Agency (EPA): Washington, DC, USA, 2015. [Google Scholar]
  21. Rossman, L.A.; Woo, H.; Tryby, M.; Shang, F.; Janke, R.; Haxton, T. EPANET 2.2 User Manual; Environmental Protection Agency (EPA): Cincinnati, OH, USA, 2020. [Google Scholar]
  22. Hargreaves, G.; Samani, Z. Reference Crop Evapotranspiration From Temperature. Appl. Eng. Agric. 1985, 1, 96–99. [Google Scholar] [CrossRef]
  23. Oberascher, M.; Rauch, W.; Sitzenfrei, R. Efficient integration of IoT-based micro storages to improve urban drainage performance through advanced control strategies. Water Sc. Technol. 2021, 83, 2678–2690. [Google Scholar] [CrossRef]
  24. ÖWAV. RB 19. Richtlinien für die Bemessung von Mischwasserentlastungen. In Guidelines for the Design of Combined Sewer Overflows; Only Available in German; ÖWAV: Vienna, Austria, 2007. [Google Scholar]
  25. Haiden, T.; Kann, A.; Wittmann, C.; Pistotnik, G.; Bica, B.; Gruber, C. The Integrated Nowcasting through Comprehensive Analysis (INCA) System and Its Validation over the Eastern Alpine Region. Weather Forecast 2011, 26, 166–183. [Google Scholar] [CrossRef]
  26. Neunteufel, R.; Richard, L.; Perfler, R. Water demand: The Austrian end-use study and conclusions for the future. Water Sci. Technol. 2014, 14, 205–211. [Google Scholar] [CrossRef]
  27. Blenn, N.; Kuipers, F. LoRaWAN in the Wild: Measurements from The Things Network. arXiv 2017, arXiv:1706.03086. [Google Scholar]
  28. Adelantado, F.; Vilajosana, X.; Tuset-Peiro, P.; Martinez, B.; Melia-Segui, J.; Watteyne, T. Understanding the Limits of LoRaWAN. IEEE Commun. Mag. 2017, 55, 34–40. [Google Scholar] [CrossRef] [Green Version]
Figure 1. Overview of the Alpine municipality used as the case study with UDN and its associated implementation of SRBs based on roof sizes, starting with the smallest roof area.
Water 13 01902 g001
Figure 2. Illustration of considered digital uncertainty scenarios for smart RWH systems (a) for different connection quality and network loads for the communication technology LoRaWAN based on the results of [27]; and (b) real rainfall forecasts including a deviation of ±25% illustrated for a real rain event.
Water 13 01902 g002
Figure 3. Performance evaluation for a real rain event on 29 March 2018 subdivided into the control strategies ‘RTC all’ and ‘RTC CSO depth’ compared with the reference state without any RBs and uncontrolled RBs; (a) temporal pattern of precipitation and CSO depth for the reference state; (b) effects of uncertainties in weather forecasts with the scenario ‘average quality’ of data communication on tracer load in CSO; (c) effects of uncertainties at data communication with the scenario ‘rail rain’ on tracer load in CSO; and (d) illustration of all investigated scenarios highlighting the range of uncertainties associated with smart RWH systems.
Water 13 01902 g003
Figure 4. Performance evaluation based on (a) mCSO and (b) VRWH resulting from control strategies ‘RTC all’ and ‘RTC CSO depth’ and compared with uncontrolled RWH systems for different degrees of penetration. Additionally, the range of digital uncertainties associated with any kind of RWH systems is highlighted.
Water 13 01902 g004
Figure 5. Resilience index (Res) subdivided into control strategies ‘RTC all’ and ‘RTC CSO depth’ and compared with uncontrolled RWH systems for different degrees of penetration. Additionally, a range of digital uncertainties associated with smart RWH systems is highlighted.
Water 13 01902 g005
Table 1. Characteristics of the investigated rain events with caused tracer mass in CSO in the reference state without any rain barrels, including required irrigation demand for green areas during the summer-half year (21 March—23 September) 2018.
RainObservation PeriodPrecipitation Sum
(mm)
Tracer CSO
(kg)
Irrigation Demand
(m3)
Event 129 March 2018.12.91.12-
Summer half-year 201821 March—23 September 2018.424208.338800
Table 2. Summary of considered scenarios and uncertainties for smart RWH systems.
Uncertainty SourcesMetricConsidered FactorsDefined Scenario (Name)
DistributionNumberDegree of penetrationDegree of penetration between 10 and 100% in 10% steps
Weather forecastAccuracyDeviation amount of predicted rain+25% rain quantity (high rain)
real weather forecast (real rain)
−25% rain quantity (low rain)
Data communicationReliabilityConnection quality
Network load
1.5% packet losses (good quality—SF7)
28.3% packet losses (average quality)
81.9% packet losses (bad quality—SF12)
Control strategyEffectivenesscontrolled
coordinated
Simultaneously opening discharge valves (RTC all)
Based on sewer states (RTC CSO depth)
Publisher’s Note: MDPI stays neutral with regard to jurisdictional claims in published maps and institutional affiliations.

