
Treatment of Purified Terephthalic Acid Wastewater by Ozone Catalytic Oxidation Method


1
School of Environmental Sciences and Engineering, Nanjing Tech University, Nanjing 211816, China
2
College of Urban Construction, Nanjing Tech University, Nanjing 211800, China
*
Authors to whom correspondence should be addressed.
Water 2021, 13(14), 1906; https://doi.org/10.3390/w13141906
Submission received: 2 June 2021
/
Revised: 19 June 2021
/
Accepted: 27 June 2021
/
Published: 9 July 2021
(This article belongs to the Special Issue Innovative Technology and Integrated Management for Wastewater Treatment and Reuse)
Abstract
:In this study, a Cu–Ce@Az ozone catalyst with multiple active components was prepared through the impregnation method to treat purified terephthalic acid (PTA) wastewater, and characterized by X-ray diffraction, X-ray fluorescence spectroscopy, scanning electron microscopy, specific surface area analysis, X-ray energy spectroscopy, X-ray photoelectron spectroscopy, and other methods. The Cu–Ce@Az ozone catalyst had a developed pore structure with a large specific surface area and crystal structure. After calcination, the metallic elements Cu and Ce existed in the state of oxides CuO and CeO2. The effects of reaction time, solution pH, catalyst dosage, and ozone dosage on the catalytic oxidation performance of the Cu–Ce@Az ozone catalyst were studied. Adding tert-butanol reduced the removal rate of COD from the PTA wastewater through the catalytic oxidation system, which proves that a Cu–Ce@Az ozone catalyst treatment process of PTA wastewater follows the free-radical reaction mechanism. The results of 3D fluorescence spectroscopy analysis show that the organic matter in the PTA wastewater was converted into tryptophan organic matter and aromatic organic matter after the reaction of the catalytic oxidation system. Ultraviolet absorption spectroscopy analysis indicated that in unsaturated chemical bonds, some conjugated structures and benzene ring structures of organic matter in the PTA wastewater were destroyed.
1. Introduction
Purified terephthalic acid (PTA) is mainly used to synthesize polyethylene terephthalate (PET), which in turn is used to make carbonic acid, soft drink bottles, water bottles, flip caps, plastics, and other products [1]. PTA wastewater mainly comes from the recovery of tower-bottom drainage in the oxidation process of xylene and the mother liquor recovery stage in the hydrorefining reaction process [2]. The composition of pollutants in PTA wastewater is complex and its properties fluctuate greatly, although the pollutants are mainly aromatic compounds. PTA wastewater has a higher organic load, which leads to an increased toxicity and chemical oxygen demand (COD). If the wastewater is directly discharged, it causes great harm to aquatic environments. Therefore, PTA wastewater must be treated [3].
At present, the commonly used treatment methods include biochemical, physical, and chemical treatment. The biochemical treatment methods include biological–aerobic, biological–anaerobic, and anaerobic–aerobic secondary biological treatment [4]. The biochemical treatment method for PTA wastewater has disadvantages, such as an inconvenient experimental operation, large resource consumption, long reaction-cycle span, strict environmental requirements, and susceptibility to interference from other substances. The physical and chemical treatment methods include adsorption, flocculation, and advanced oxidation processes [5]. General physical and chemical treatment methods have a higher cost and lower treatment efficiency than others, but are often used to treat organic wastewater with poor biodegradability. The advanced oxidation process that uses free radical reactions to degrade compounds has proven effective in the degradation of high-concentration organic wastewater [6]. Among them, the electrochemical oxidation method is widely used. In this process, the pollutants can be oxidized by the electron transfer reaction between the organic matter and the electrode surface or the action of hydroxyl radicals [7]. Anodizing is a relatively common electrochemical advanced oxidation method, which has certain prospects for the treatment of non-biodegradable pollutants. The nature of the anode has an important influence on the oxidability of the anodizing method. In the process of treating wastewater, the anode material is required not only to have a high oxygen evolution overpotential, but also to have high stability and corrosion resistance when treating wastewater. Early electrode materials such as graphite, activated carbon, and other conventional materials had a high overpotential for oxygen evolution, but these electrodes were easily corroded and easily passivated [8]. Therefore, various electrode materials, such as thin-film oxide anodes, noble metals, and carbon-based anodes have been studied [9]. However, these electrodes have some defects in the electrochemical oxidation of pollutants. The efficiency of anodization also depends on some key operating conditions, such as the initial concentration of organic pollutants, current density, and the presence or absence of metal cations. On the other hand, anodization is expensive and consumes a lot of energy, which has become an important factor in the large-scale application of this technology [10]. In advanced oxidation processes, ozone catalytic oxidation technology has attracted attention due to its high efficiency and absence of secondary pollution [11]. This process can efficiently treat organic pollutants in PTA wastewater. In the presence of a catalyst, ozone molecules can generate hydroxyl radicals (•OH), and organic compounds can be quickly and indiscriminately mineralized into small molecular substances without introducing other pollutants. Therefore, this process has a certain application value in treating PTA wastewater [12].
In the ozone catalytic oxidation system, selecting active components for catalytic ozonation is important. A cerium (Ce)-based metal oxidation catalyst has good redox performance and high oxygen storage capacity, which can increase the hydroxyl yield. However, applying Ce in wastewater treatment can cause a significant loss of Ce ions, which may cause serious secondary pollution [13]. Manganese can decompose ozone by generating active oxidants, making it one of the most active species that degrade organic compounds in the presence of ozone. The catalytic activity of the supported metal typically depends on the characteristics of the support material, such as surface area, pore volume, and morphology [14]. As a porous aluminosilicate with a framework structure, a zeolite has the advantages of a large specific surface area, developed pores, good reusability, and good stability, and can selectively adsorb organic molecules in wastewater [15]. At the same time, a zeolite can provide a huge surface for the dispersion of Ce, which can stabilize the Ce in the catalyst and prevent it from leaching into the solution [16]. Therefore, to reduce the leaching of metal ions and obtain a low-cost active oxygen treatment process, an artificial zeolite loaded with Ce and Cu could be synthesized as a heterogeneous catalyst for ozone oxidation [17].
In this study, an artificial zeolite loaded with Ce and Cu was prepared through the impregnation roasting method as a high-efficiency heterogeneous catalyst, Cu–Ce@Az, for catalytic ozonation, and used to treat PTA wastewater. X-ray diffraction, X-ray fluorescence spectroscopy, scanning electron microscopy, specific surface area analysis (BET), X-ray energy spectroscopy, X-ray photoelectron spectroscopy, and other technologies were applied to analyze the structure of the supported Cu–Ce@Az ozone catalyst. To comprehensively investigate the performance of the catalytic ozonation system, the effects of reaction time, catalyst dosage, pH, ozone dosage, and other factors on the catalytic oxidation performance of the Cu–Ce@Az catalyst were studied. Finally, the catalytic oxidation mechanism of the Cu–Ce@Az catalyst was examined.
2. Materials and Methods
2.1. Materials
Copper nitrate, cerium nitrate, and potassium bromate (all of analytical grade) were purchased from Sinopharm Chemical Reagent Co. Ltd. (Shanghai, China). Potassium bromide, sodium thiosulfate, starch, potassium iodide, potassium dichromate, silver sulfate, mercury sulfate, ethanol, and tert-butanol (all analytically pure) were purchased from Nanjing Chemical Reagent Co. Ltd. (Nanjing, China). The artificial zeolite is of high-quality grade. All reagents are analytically pure and used directly without further purification. The PTA wastewater used in the experiment mainly comes from the biochemical effluent of the secondary sedimentation tank of a sewage treatment station of a petrochemical enterprise in Jiangsu (the main product is PTA). The water-quality test results of the biochemical effluent are presented in Table 1.
2.2. Catalyst Preparation and Characterization
First, the cleaned artificial zeolite was added to 0.1 mol/L of hydrochloric acid solution and soaked for 24 h. After soaking in hydrochloric acid, the material was rinsed with pure water repeatedly until the eluate was neutral. Subsequently, pure water was added, and the mixture was boiled on an electric stove for 30 min. After repeated rinsing, the catalyst was placed in an oven to dry for later use. A certain mass of Cu(NO3)2·6H2O and Ce(NO3)3·6H2O was weighed, and a certain concentration of metal element precursor solution was configured and placed in a conical flask. A certain amount of pretreated artificial zeolite was transferred into an Erlenmeyer flask and placed in a water-bath shaker for 12 h, and the temperature of the water bath was set to 35 °C. The impregnated carrier was taken out, the excess impregnating liquid was filtered out, and the catalyst was placed in an oven to dry for 12 h. The dried catalyst was transferred into a crucible and placed in a muffle furnace, baked at a certain temperature for a certain period, and then taken out and packaged for use after cooling.
The surface micromorphology of the Cu–Ce@Az ozone catalyst was characterized by scanning electron microscope (Crossbeam 340/550, Zeiss, Germany). X-ray diffraction (D8 Advance, Bruker, Germany) was used to characterize the crystal structure of the transition metals in the Cu–Ce@Az ozone catalyst. BET (ASAP2460, Micromeritics, United States) was used to characterize the pore volume, pore size, and adsorption performance of the catalyst. X-ray fluorescence spectrometry (Axios Pw4400, Panaco, the Netherlands) was used to characterize the content of metal elements and metal oxides in the Cu–Ce@Az ozone catalyst. The distribution of each element in the catalyst was measured by X-ray energy spectroscopy (Kratos AXIS Ultra DLD, Shimadzu Corporation, Kyoto, Japan).
2.3. Ozone Catalytic Oxidation Experiment
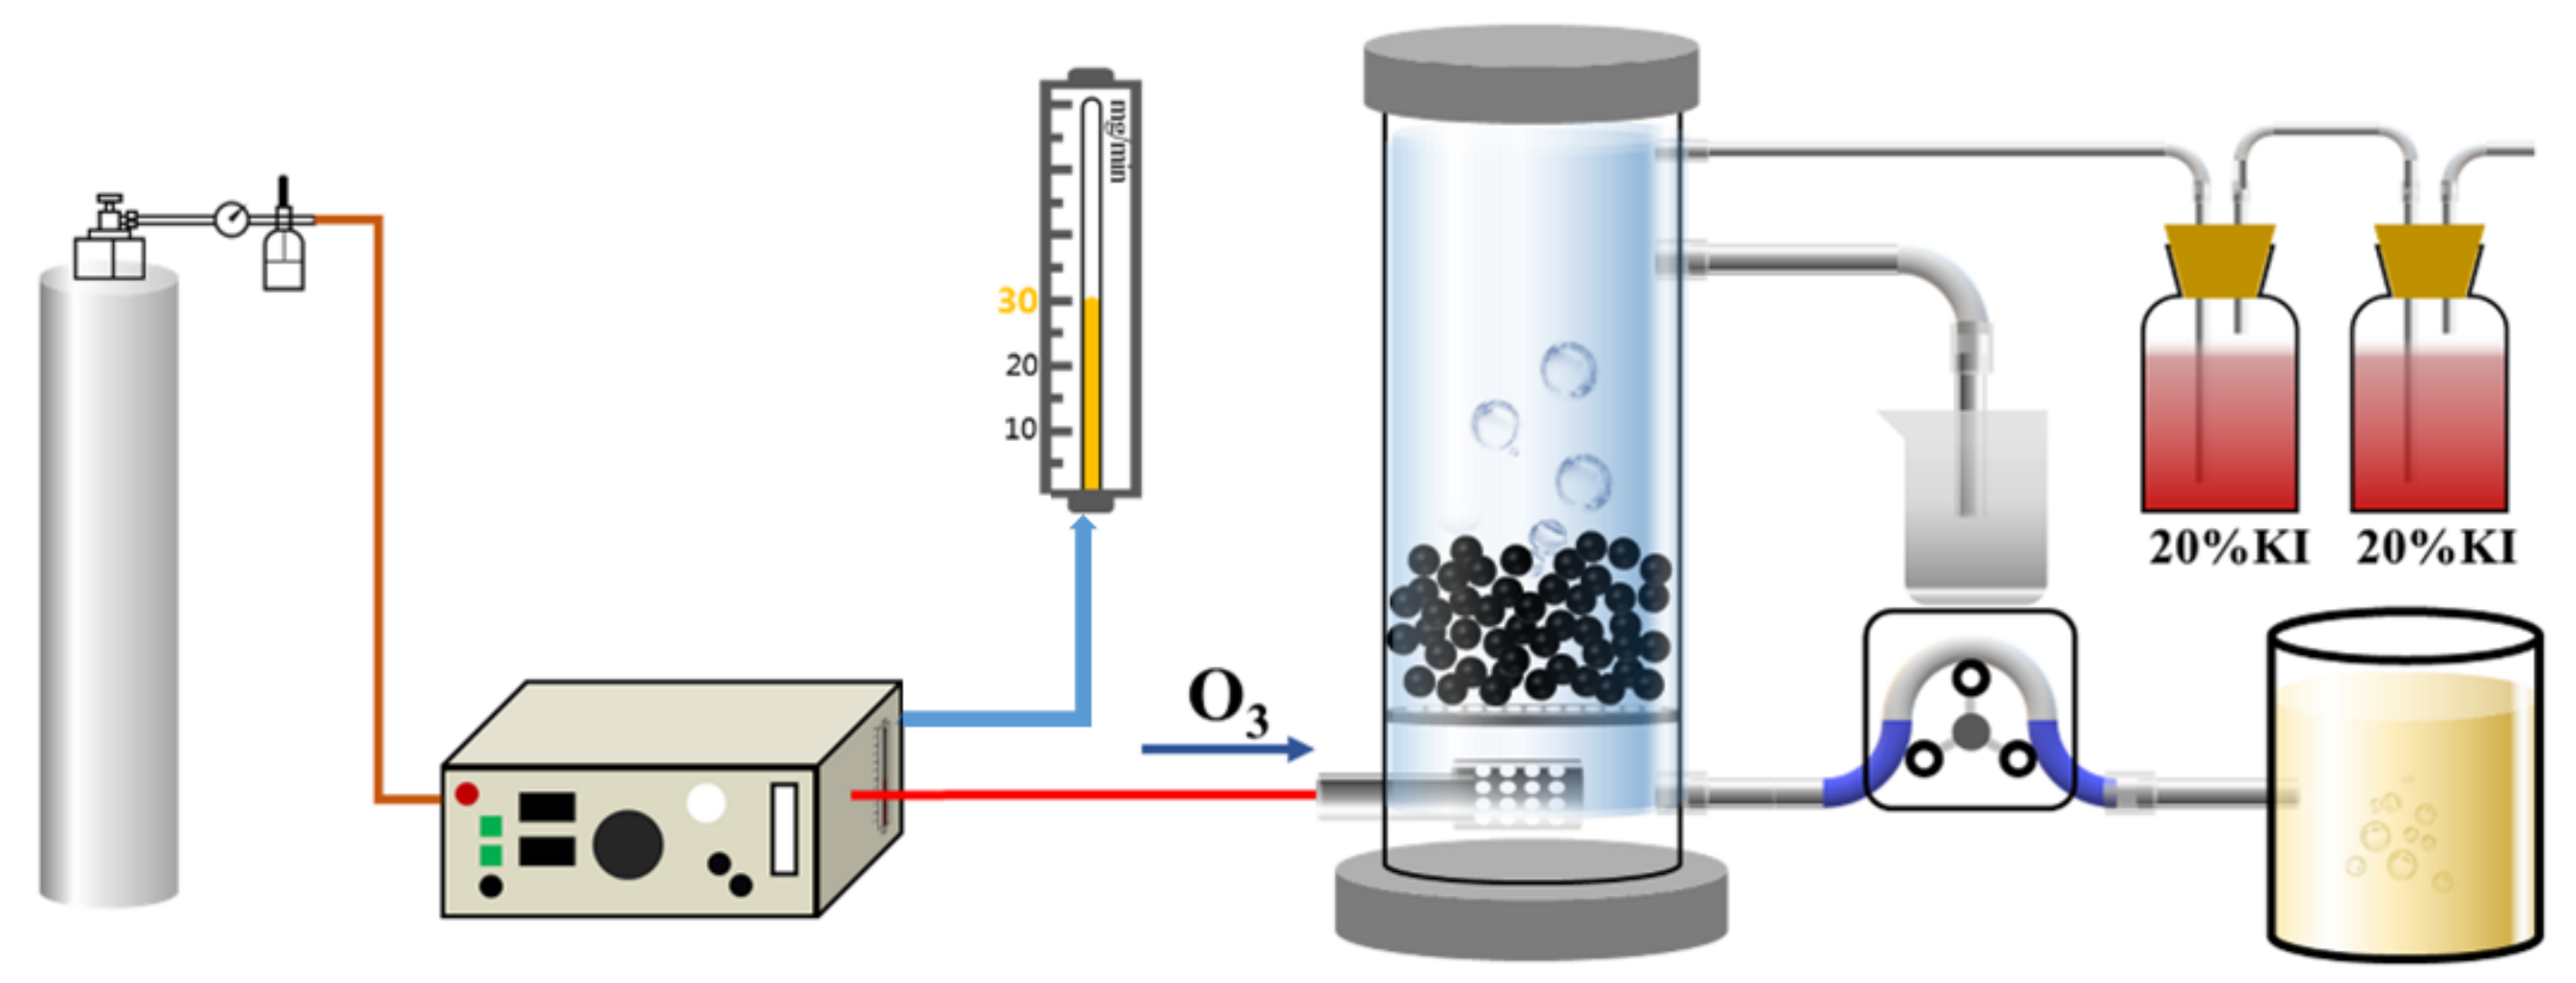
As shown in Figure 1, the catalytic reaction device included an ozone generator (CF-G-3-10g, Qingdao Guolin, Qingdao, China), a wastewater treatment device, and an exhaust gas absorption treatment device. At the beginning of the experiment, the oxygen cylinder provided high-purity oxygen in the ozone generator for pre-blowing for 15 min. After the pre-blowing, a quantitative catalyst was placed in the reactor and a quantitative amount of wastewater was injected. The ozone generator was switched on again to adjust the inlet pressure and ozone flow. The oxygen generated ozone through high-voltage discharge inside the ozone generator, and the ozone fully contacted the catalyst through the sand-core aeration head and the microporous aeration plate to conduct the catalytic oxidation reaction. The ozone output could be controlled by adjusting the gas flowmeter of the ozone generator, and the incompletely reacted ozone tail gas was discharged outdoors after passing through the two-stage tail-gas absorption treatment device. A water outlet was reserved on the side wall of the reactor, and samples were obtained regularly during the catalytic oxidation reaction to determine COD. COD in the wastewater was determined by the potassium dichromate method. The exhaust gas generated in the experiment was discharged after treatment using an exhaust gas absorption device (20% KI solution).
3. Results and Discussion
3.1. Preparation of Cu–Ce@Az Catalyst
Figure S1 shows that the Cu–Ce@Az ozone catalyst had a higher adsorption rate of pollutants in wastewater within 60 min. When the adsorption time exceeded 120 min, the removal rate of COD stabilized at 5.3%. As shown in Figure S2, when the ratio of the metal element Cu was increased, the effect of the Cu–Ce@Az ozone catalyst on the treatment of PTA biochemical tailwater worsened. When the impregnation ratio of Cu to Ce was 1:3 in the Cu–Ce@Az ozone, the catalyst had the best treatment effect on the PTA biochemical tailwater. Under the optimum condition of the element impregnation ratio, the COD removal rate of the PTA biochemical tailwater was 72.4%. Figure S3 shows that the optimal calcination temperature of the Cu–Ce@Az ozone catalyst was also 400 ℃. The Cu–Ce@Az ozone catalyst prepared under the optimal calcination temperature condition treated PTA biochemical tailwater for 70 min, and the removal rate of COD in wastewater was 77.5%. As shown in Figure S4, when the calcination time was 2.5–3.5 h, the catalytic performance of the Cu–Ce@Az ozone catalyst increased with the increase of the calcination time. When the calcination time exceeded 3.5 h, the catalytic performance of the catalyst gradually decreased. From the perspective of the COD removal rate of the PTA biochemical tailwater, when the roasting time was 3.5 h, the reaction was 70 min and the COD removal rate reached 79.5%.
3.2. Physical and Chemical Properties of Cu–Ce@Az Ozone Catalyst
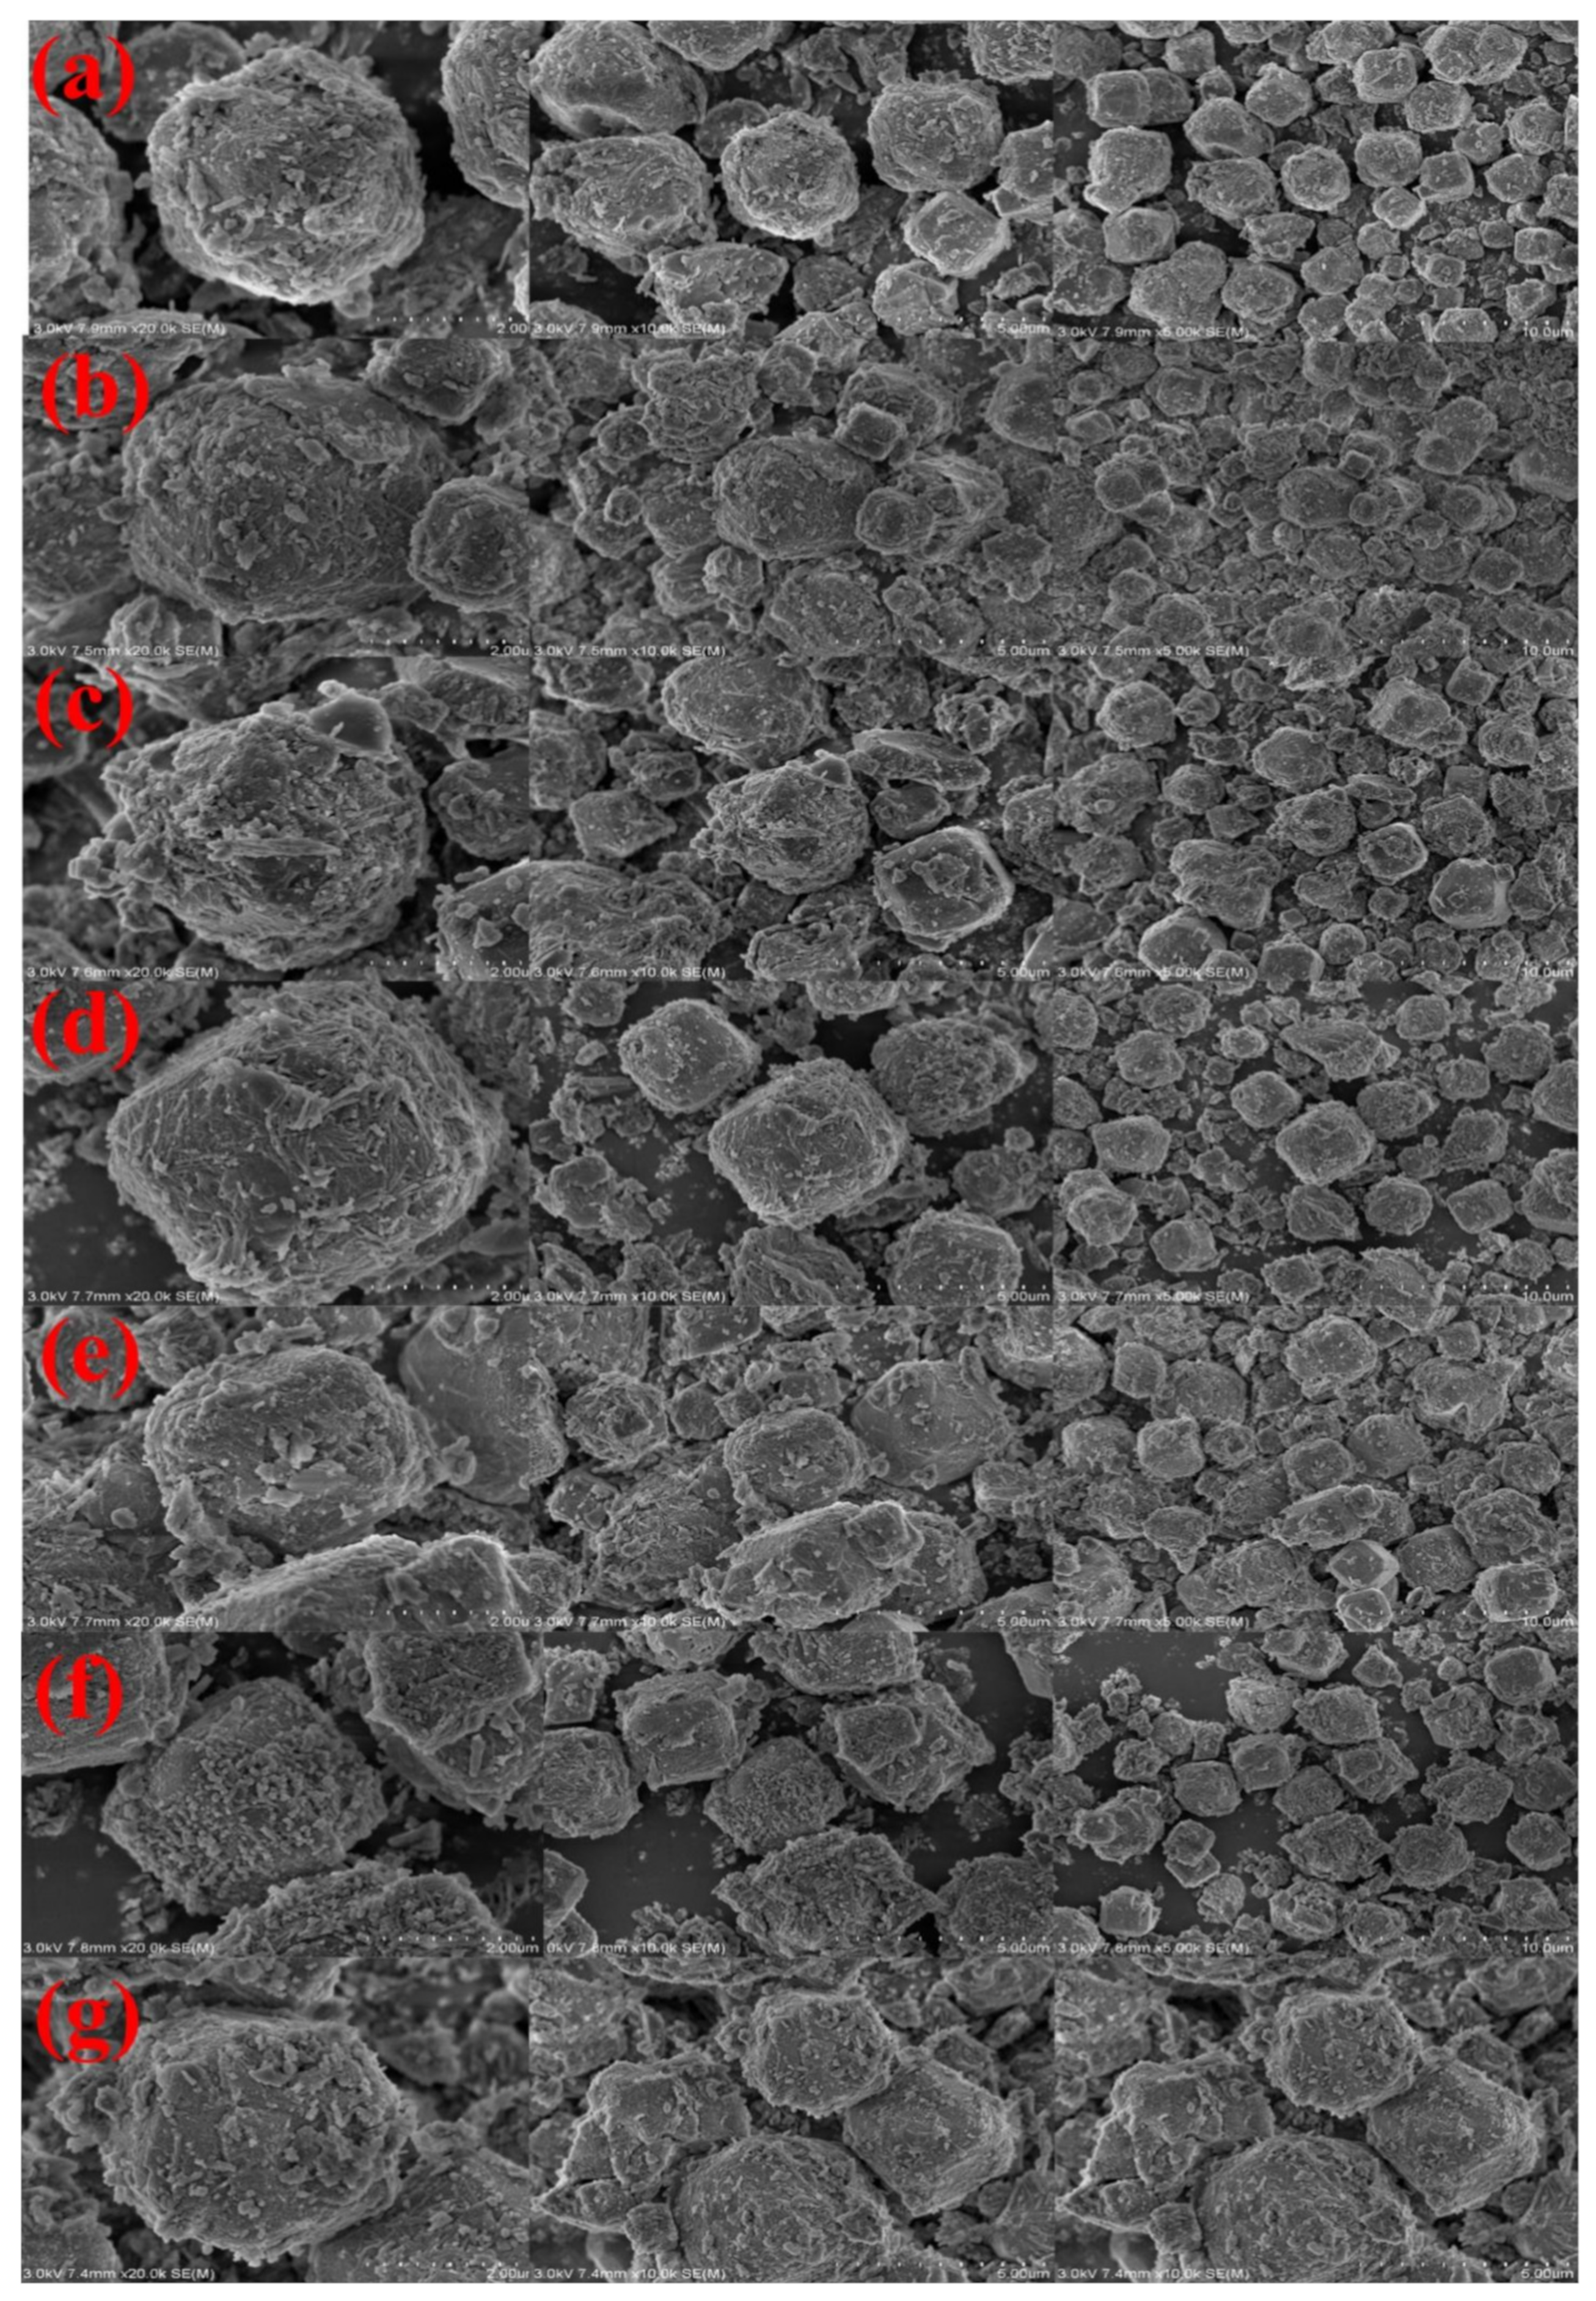
As presented in Figure 2, the Cu–Ce@Az ozone catalyst had many crystal particles on the surface at 400 °C, and the catalytic activity of the catalyst was improved compared with those at 300 °C and 350 °C. At 450 °C and 500 °C, the crystal particles grew too large to wrap on the surface of the catalyst, which blocked the pore structure of the catalyst and reduced its catalytic activity. After repeated use, the pore structure of the catalyst was filled with substances in the PTA wastewater, causing serious blockage of the pore structure. As shown in Figure S5, the samples had obvious characteristic peaks at 2θ = 27.4°, 33.1°, and 37.1°, which coincide with Fe2O3 (JCPDS Card No.89-0596), SiO2 (JCPDS Card No.71-0650), and Al2O3 (JCPDS Card No.13-0373), respectively, indicating that the artificial zeolite contained Fe, Si, Al, and other metal elements. Compared with the blank sample, the catalyst sample had obvious characteristic peaks of CeO2 (JCPDS Card No.34-0394) at 2θ = 29°, 33°, 48°, and 57°, corresponding to the (111), (200), (220), and (311) planes, respectively [18]. The two characteristic peaks at 2θ = 36° and 39° correspond to the (111) and (200) planes of the CuO crystal [19]. Under conditions of 300, 350, and 400 °C, with the temperature increase, the intensity of the diffraction peaks of CeO2 at 2θ = 29°, 33°, 48°, and 57° continued to increase, and the intensity of the diffraction peaks of CuO (JCPDS Card No.48-1548) at 2θ = 36° and 39° also continued to rise. This phenomenon shows that in this temperature range, the increase in temperature is conducive to the formation of CuO and CeO2 crystal forms. As the temperature increased to 450 °C and 500 °C, the diffraction peaks of CeO2 at 2θ = 29°, 33°, 48°, and 57° and the diffraction peaks of CuO at 2θ = 36° and 39° showed a decrease in intensity, which shows that the CuO and CeO2 crystal forms gradually disappeared with the increase of the calcination temperature. The reason for this may be that the temperature was too high to destroy the structure of the Cu–Ce@Az ozone catalyst, thereby affecting the formation of CuO and CeO2 crystal forms [20]. In addition, repeated use reduced the crystal forms of CuO and CeO2, which may have been due to the loss of metal components caused by repeated use, thereby affecting the diffraction peaks of CuO and CeO2 [21].
Table S1 shows that the specific surface area of the Cu–Ce@Az ozone catalyst was larger than that of the blank artificial zeolite, which indicates that the supported metal elements Cu and Ce were converted into the corresponding metal oxides CuO and CeO2. The pore volume of the Cu–Ce@Az ozone catalyst was also improved, but the pore diameter was slightly reduced. At the same time, the results show that after repeated use the BET specific surface area, pore volume, and pore diameter of the Cu–Ce@Az ozone catalyst decreased [22]. As presented in Figure S6 and Table S2, compared with the blank carrier, the metallic elements Cu and Ce were successfully loaded inside and on the surface of the carrier, and then converted into CuO and CeO2 after calcination. The content of CuO and CeO2 was 1.8941% and 6.6818%, respectively. After the Cu–Ce@Az ozone catalyst was reused 30 times, the content of CuO and CeO2 accounted for 1.7673% and 6.5275%, respectively. As shown in Table S3, the main components of the artificial zeolite blank carrier were Al2O3 and SiO2, and Cu and Ce were found in the Cu–Ce@Az ozone catalyst. The weight percentages were 2.52% and 2.68%, respectively. The existence of Cu and Ce indicates that the Cu–Ce@Az ozone catalyst was successfully prepared using the impregnation method. After 30 uses, the weight percentages of Cu and Ce in the Cu–Ce@Az ozone catalyst were 2.39% and 2.33%, respectively. Compared with the unused Cu–Ce@Az ozone catalyst, the content of the supported metal elements Cu and Ce were slightly reduced. As shown in Figure S7, in the blank carrier Al, Si, Na, Mg, and other metal elements existed in the form of Al2O3, SiO2, Na2O, and MgO. The electron binding energies of Cu2p and Ce3d are 883.7 eV and 897.97 eV, respectively, which indicate that the atomic valence of Cu was +2 and the valence of Ce was +4 in the Cu–Ce@Az ozone catalyst. Repeated use caused the loss of the loaded metal and affected the size of the peaks of the Cu2p and Ce3d energy spectra [23].
3.3. Degradation of PTA Wastewater by Cu–Ce@Az Ozone Catalyst
3.3.1. Effect of Reaction Time on Catalytic Performance
As shown in Figure 3, the COD content in the PTA wastewater gradually decreased as the catalytic reaction time increased. When the reaction time was 10–50 min, the COD removal rate in the PTA wastewater was the fastest; when the reaction time was 50 min, the COD removal rate in the PTA wastewater reached 74.28%. The removal rate of COD in the PTA wastewater increased slowly during the reaction time of 50–70 min. Thereafter, the reaction time continued to increase to 100 min, but the removal rate of COD and TOC in PTA wastewater did not increase significantly. That is, the effluent water quality was not significantly improved. Although the treatment effect was good at a reaction time of 100 min, in practical applications a longer reaction time indicates a high-cost operation. Therefore, the catalytic reaction time in this experiment was 70 min.
3.3.2. Effect of pH on Catalytic Performance
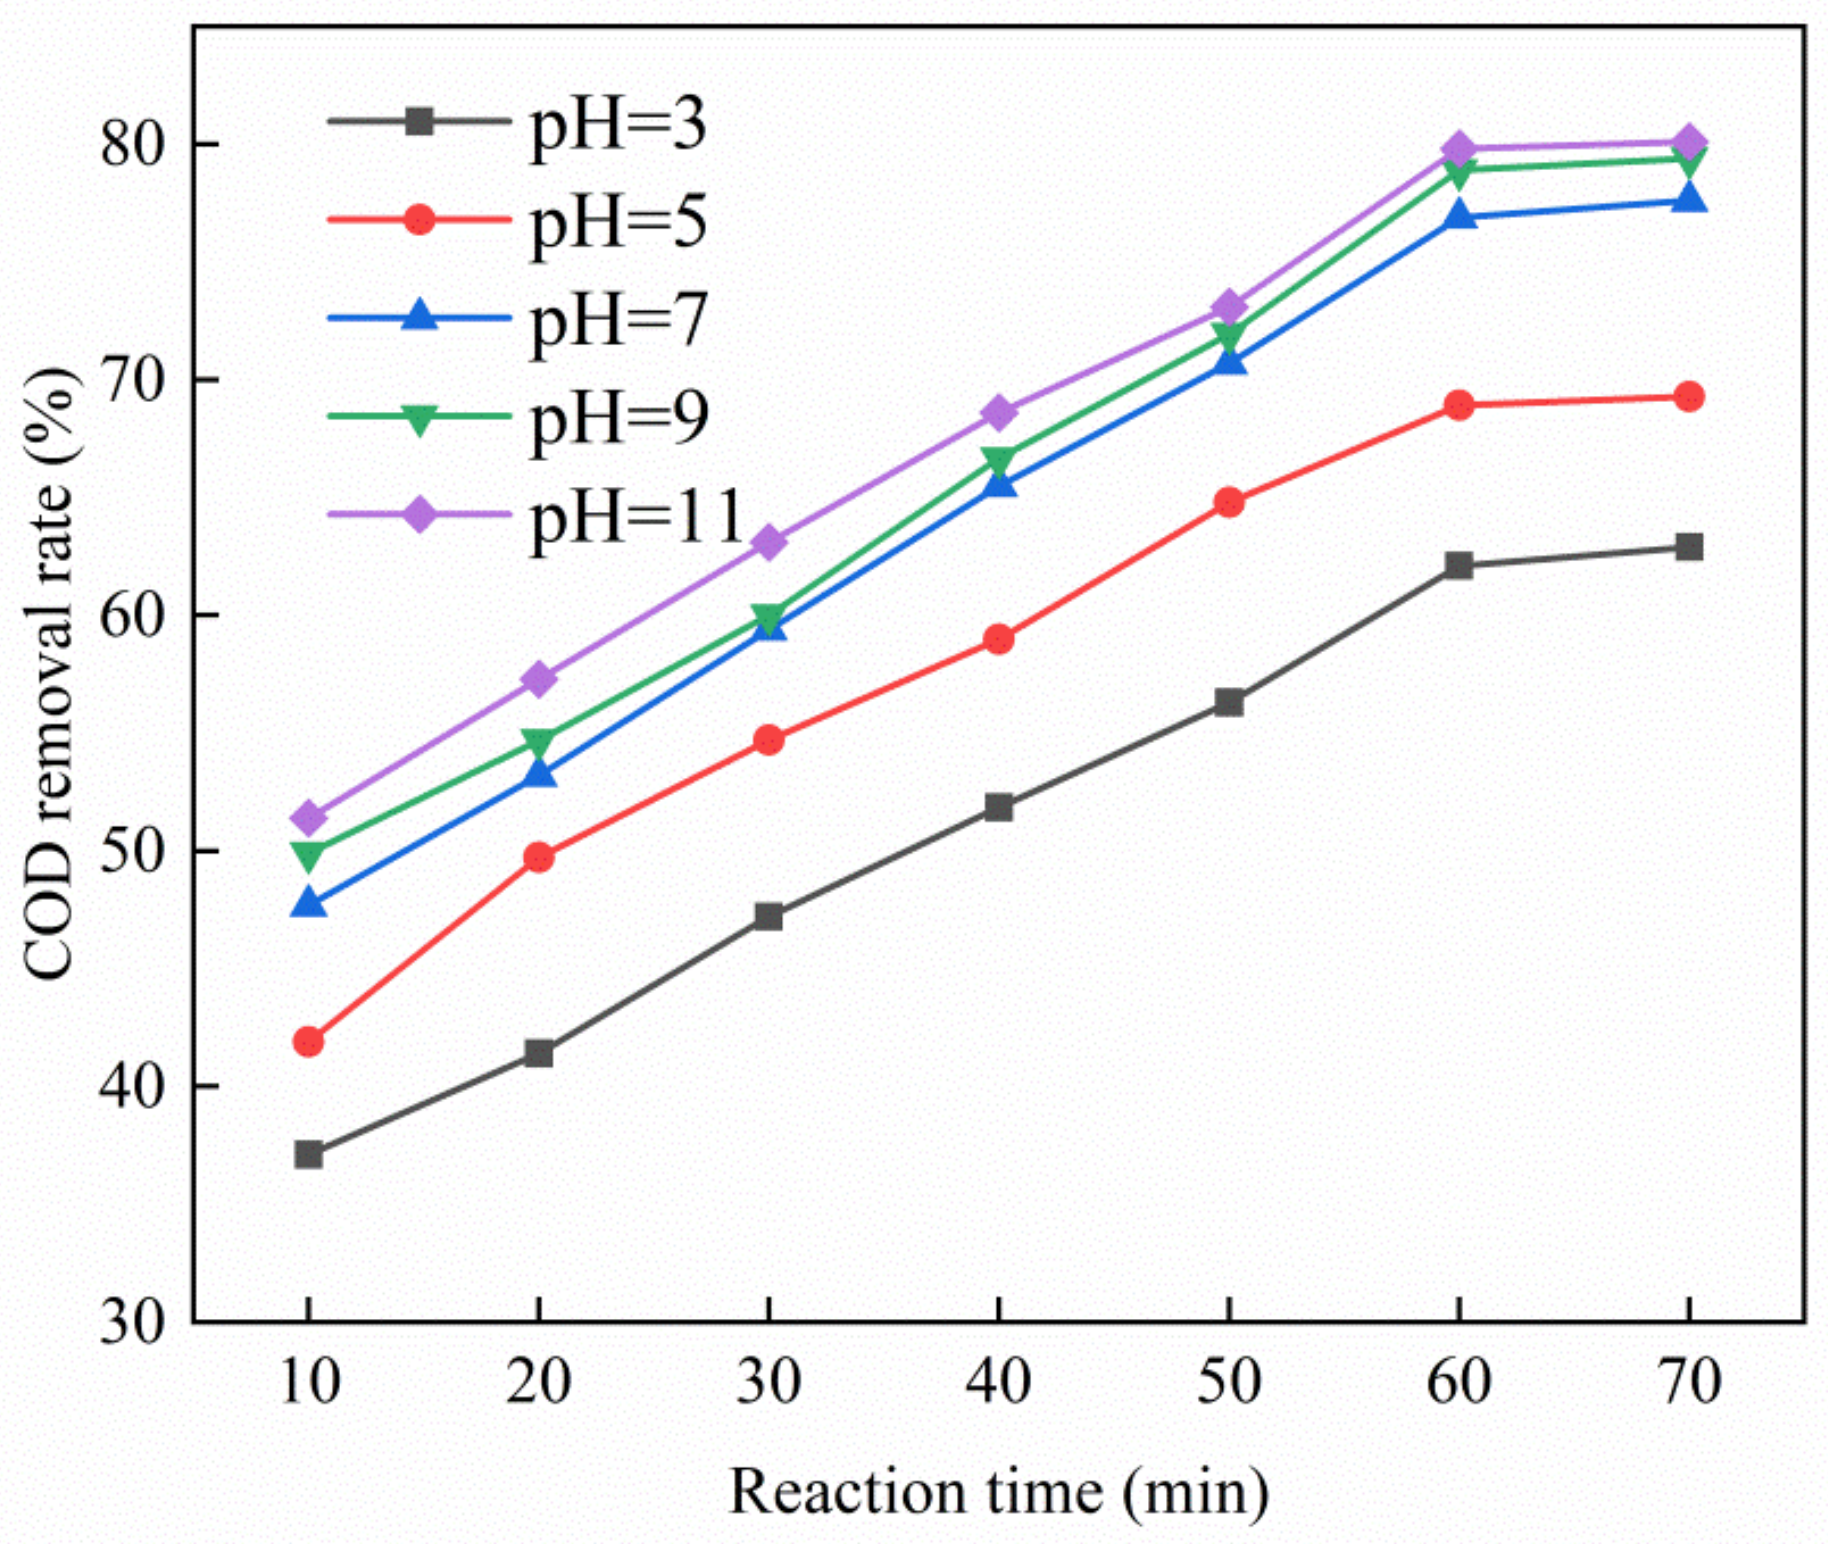
Figure 4 shows that as the pH of PTA wastewater increased, the COD removal rate of wastewater also increased. Experiments indicated that under alkaline conditions, the removal rate of COD and total phenols of PTA wastewater was higher than under acidic conditions. When pH = 11, the removal rate of the COD of experimental wastewater reached the maximum value of 80.1%. Under alkaline conditions, the Cu–Ce@Az ozone catalyst could better degrade the PTA wastewater. By adjusting the pH to different levels, we found that, although increasing the pH helped improve the removal rate of wastewater COD, the increase of the removal rate in the interval of pH = 3–7 is greater than that in the interval of pH = 7–11. When pH = 9, the COD removal rate of PTA wastewater by the Cu–Ce@Az ozone catalyst was 79.4% and continued to increase to pH = 11. The COD removal rate of PTA wastewater was only increased by 0.7%. The degradation effect of the ozone catalytic oxidation system could be improved under alkaline conditions, probably due to the existence of more OH– under alkaline conditions, which can combine with ozone to produce more hydroxyl radicals [24], thereby improving the degradation effect. On the other hand, it is also possible that alkaline conditions destroy the structure of the organic matter in the wastewater, causing it to dissociate so that it can be oxidized better and faster [25].
3.3.3. Effect of Ozone Dosage on Catalytic Performance
Figure 5 shows that the greater the amount of ozone added, the higher the removal rate of COD from the PTA wastewater by the Cu–Ce@Az ozone catalyst. When the amount of ozone added reached the maximum value of 2.5 g/h, the removal rate of COD reached 83.9%. When the ozone dosage was 0.5–2.0 g/h, the Cu–Ce@Az ozone catalyst had a significant increase in the degradation efficiency of the PTA wastewater. At 2.0–2.5 g/h, the COD removal rate of the PTA wastewater increased slowly. This condition may be due to the increase in the dosage and interaction of ozone causing the Cu–Ce@Az ozone catalyst to produce more hydroxyl radicals [26]. When it reaches a certain level, the ozone concentration in a reaction system reaches a saturated state. At this time, increasing the amount of ozone generated cannot significantly improve the efficiency of wastewater degradation [27]. In this experiment, the optimal ozone generation amount was 2.0 g/h, and the removal rate of COD in the PTA wastewater under this condition was 82.4%.
3.3.4. Effect of Catalyst Dosage on Catalytic Performance
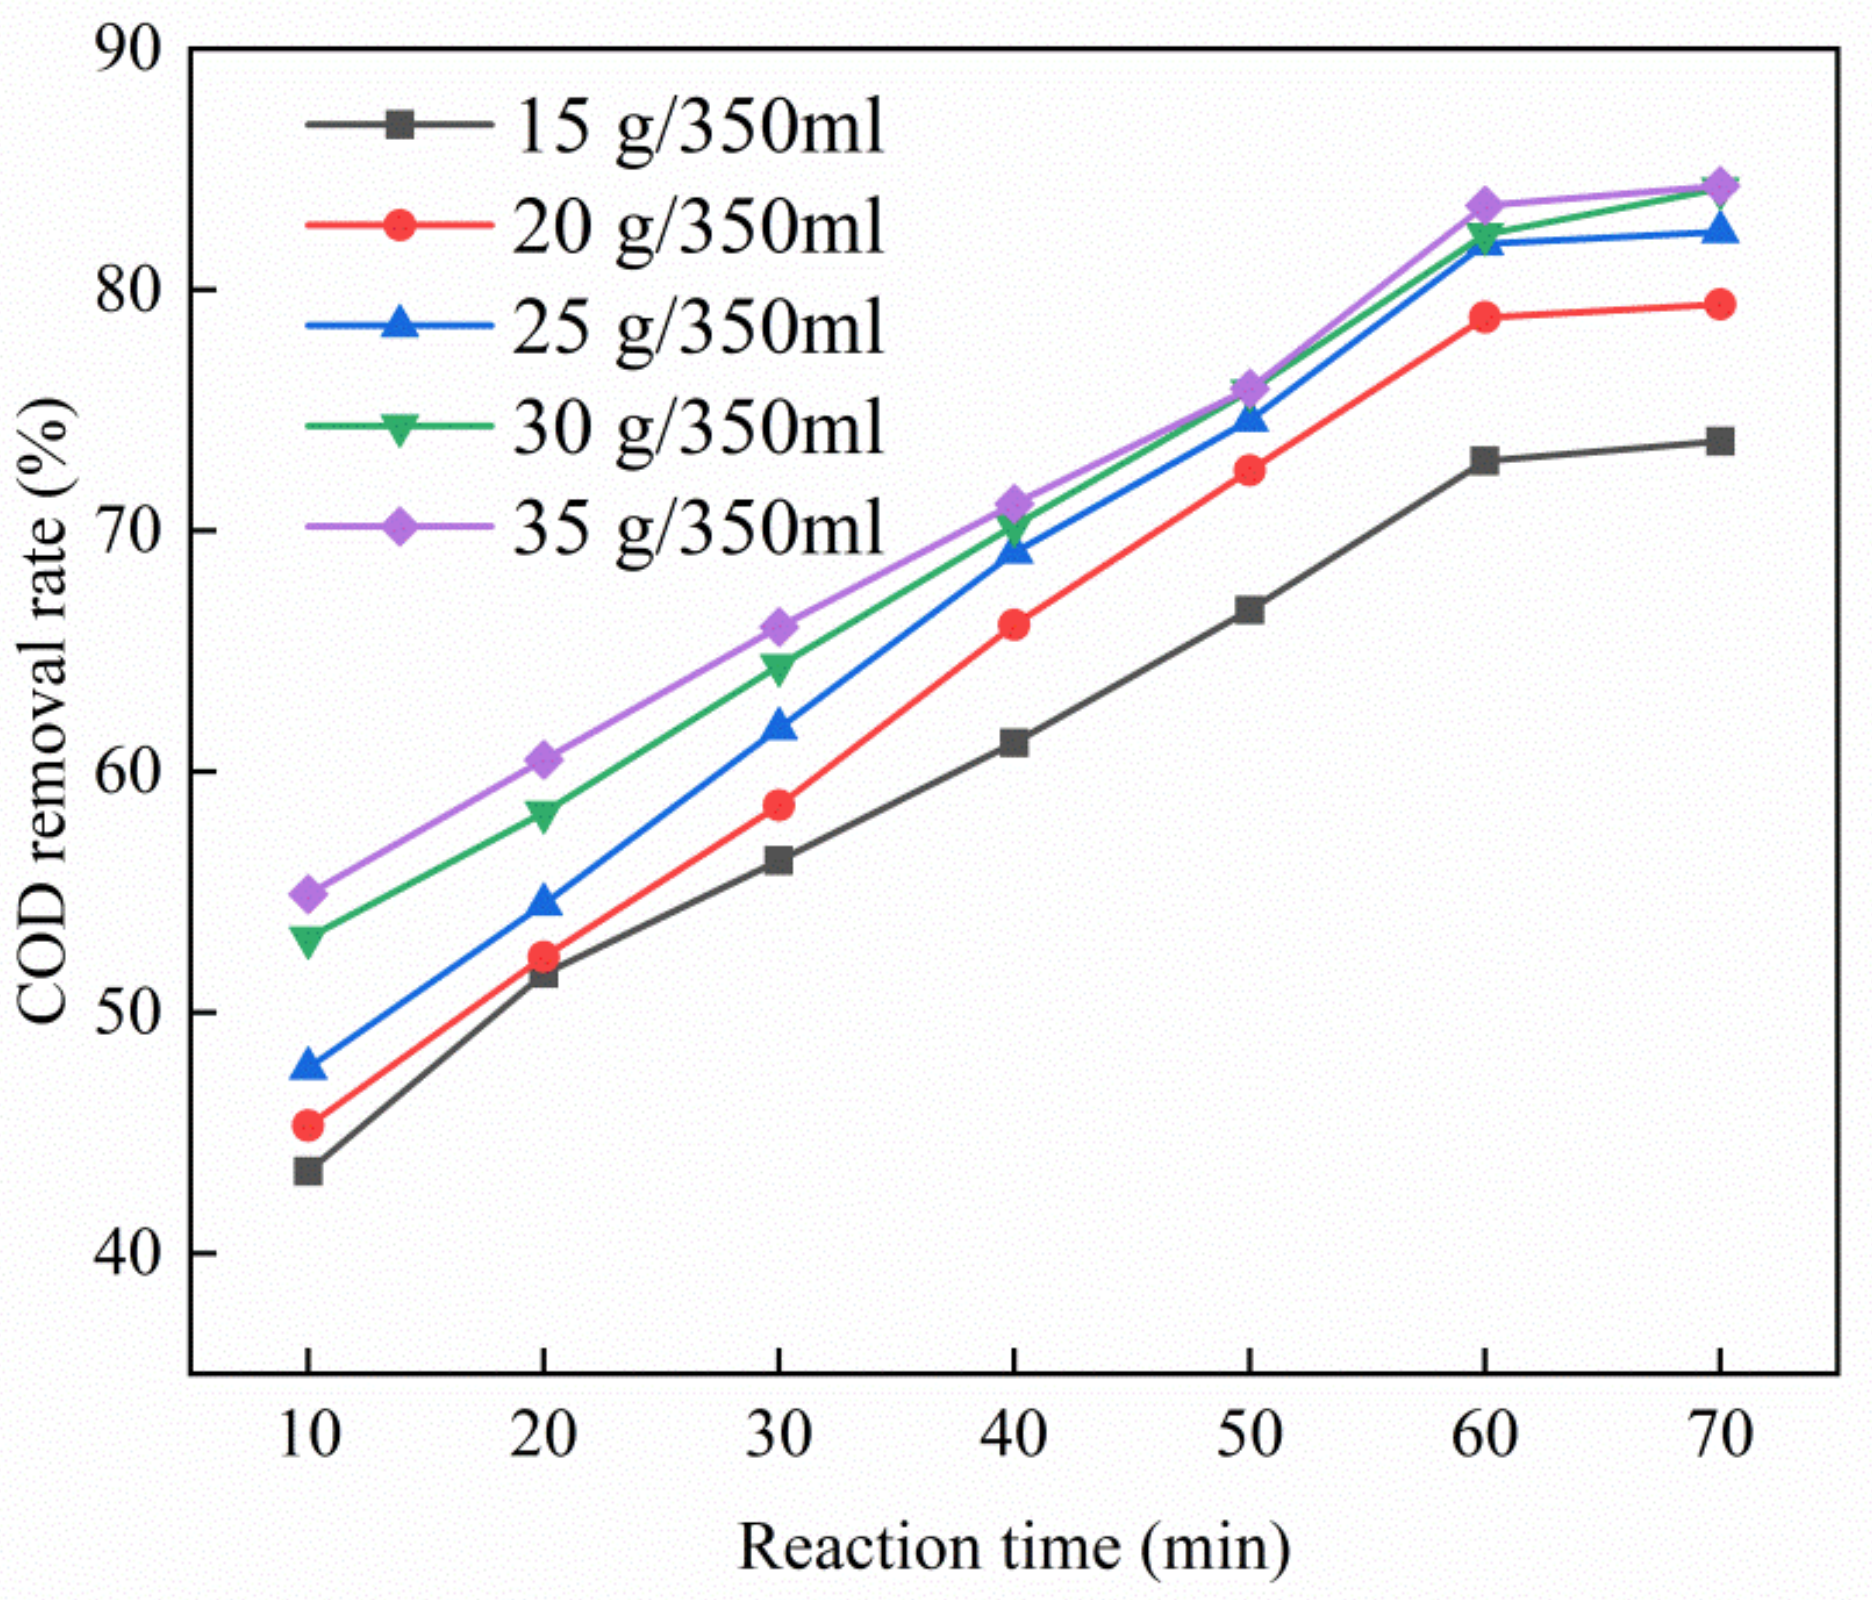
As shown in Figure 6, increasing the dosage of the Cu–Ce@Az ozone catalyst increased the removal rate of COD. When the catalyst dosage was 15–30 g/350 mL, the removal rate of COD of PTA wastewater by the Cu–Ce@Az ozone catalyst also increased, eventually reaching 84.2%. When the dosage of the catalyst was increased to 35 g/350 mL, the Cu–Ce@Az ozone catalyst had a slower increase in the COD removal rate of the PTA wastewater. However, compared with the previous stage, the COD removal rate was only increased by 0.1%. The reason why the Cu–Ce@Az ozone catalyst could combine with ozone to treat the PTA wastewater is the existence of active sites in the Cu–Ce@Az ozone catalyst that could combine with ozone. The increase in the dosage of Cu–Ce@Az ozone catalyst provided more active sites for combination with ozone [28]. At the same time, the more active the sites, the faster the ozone decomposition, and the more hydroxyl radicals are produced, thereby improving the oxidation efficiency of the PTA wastewater. When the concentration of ozone in the wastewater was constant, we continued to increase the dosage of the Cu–Ce@Az ozone catalyst. As the ozone and internal active sites of the catalyst reached saturation, the newly added active sites could not be effectively used [29], and increasing the dosage of large Cu–Ce@Az ozone catalyst affected the contact area of the active group and wastewater [30]. Thus, 30 g/350 mL was selected as the best dosage.
3.4. Stability Analysis of Cu–Ce@Az Ozone Catalyst
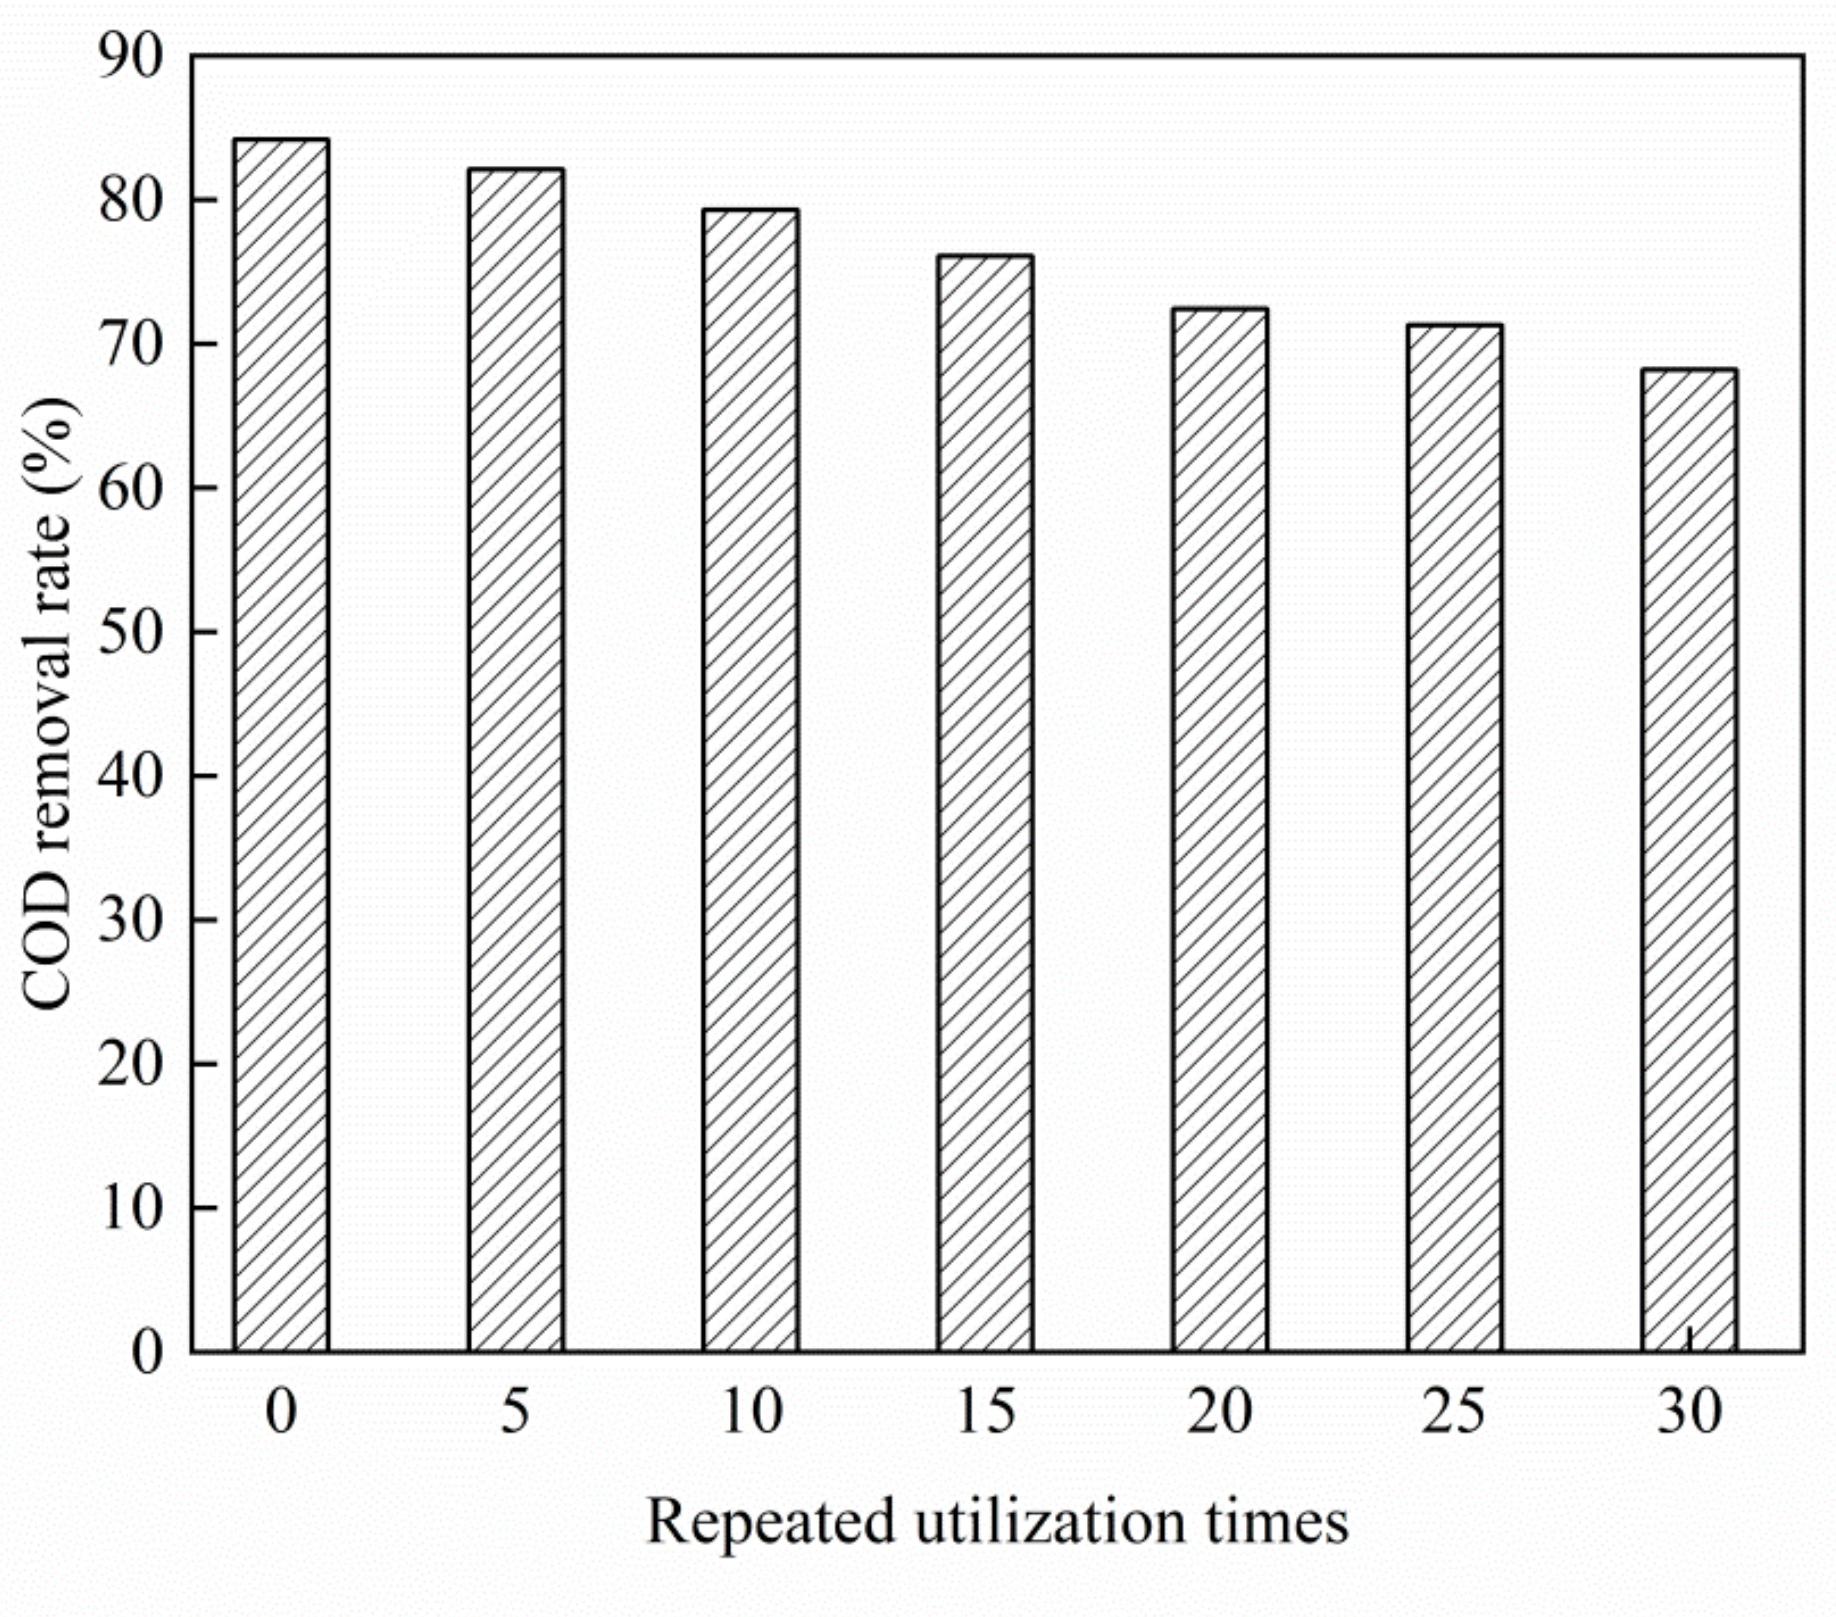
As shown in Figure 7, as the number of repeated uses of the Cu–Ce@Az ozone catalyst increased, the removal rate of COD from the PTA wastewater continued to decrease. The new Cu–Ce@Az ozone catalyst treated the PTA wastewater for 70 min. The COD removal rate of the PTA wastewater was 84.2%. The Cu–Ce@Az ozone catalyst was reused five times. The COD removal rate of the PTA wastewater was 82.1% and the COD removal rate was 82.1%. The rate dropped by only 2.1%. The Cu–Ce@Az ozone catalyst was reused 30 times, and the COD removal rate of the PTA wastewater was 68.2%. In general, the Cu–Ce@Az ozone catalyst was stable and could meet the requirements of practical application.
3.5. Effect of Tert-Butanol Dosage on Catalytic Oxidation Performance
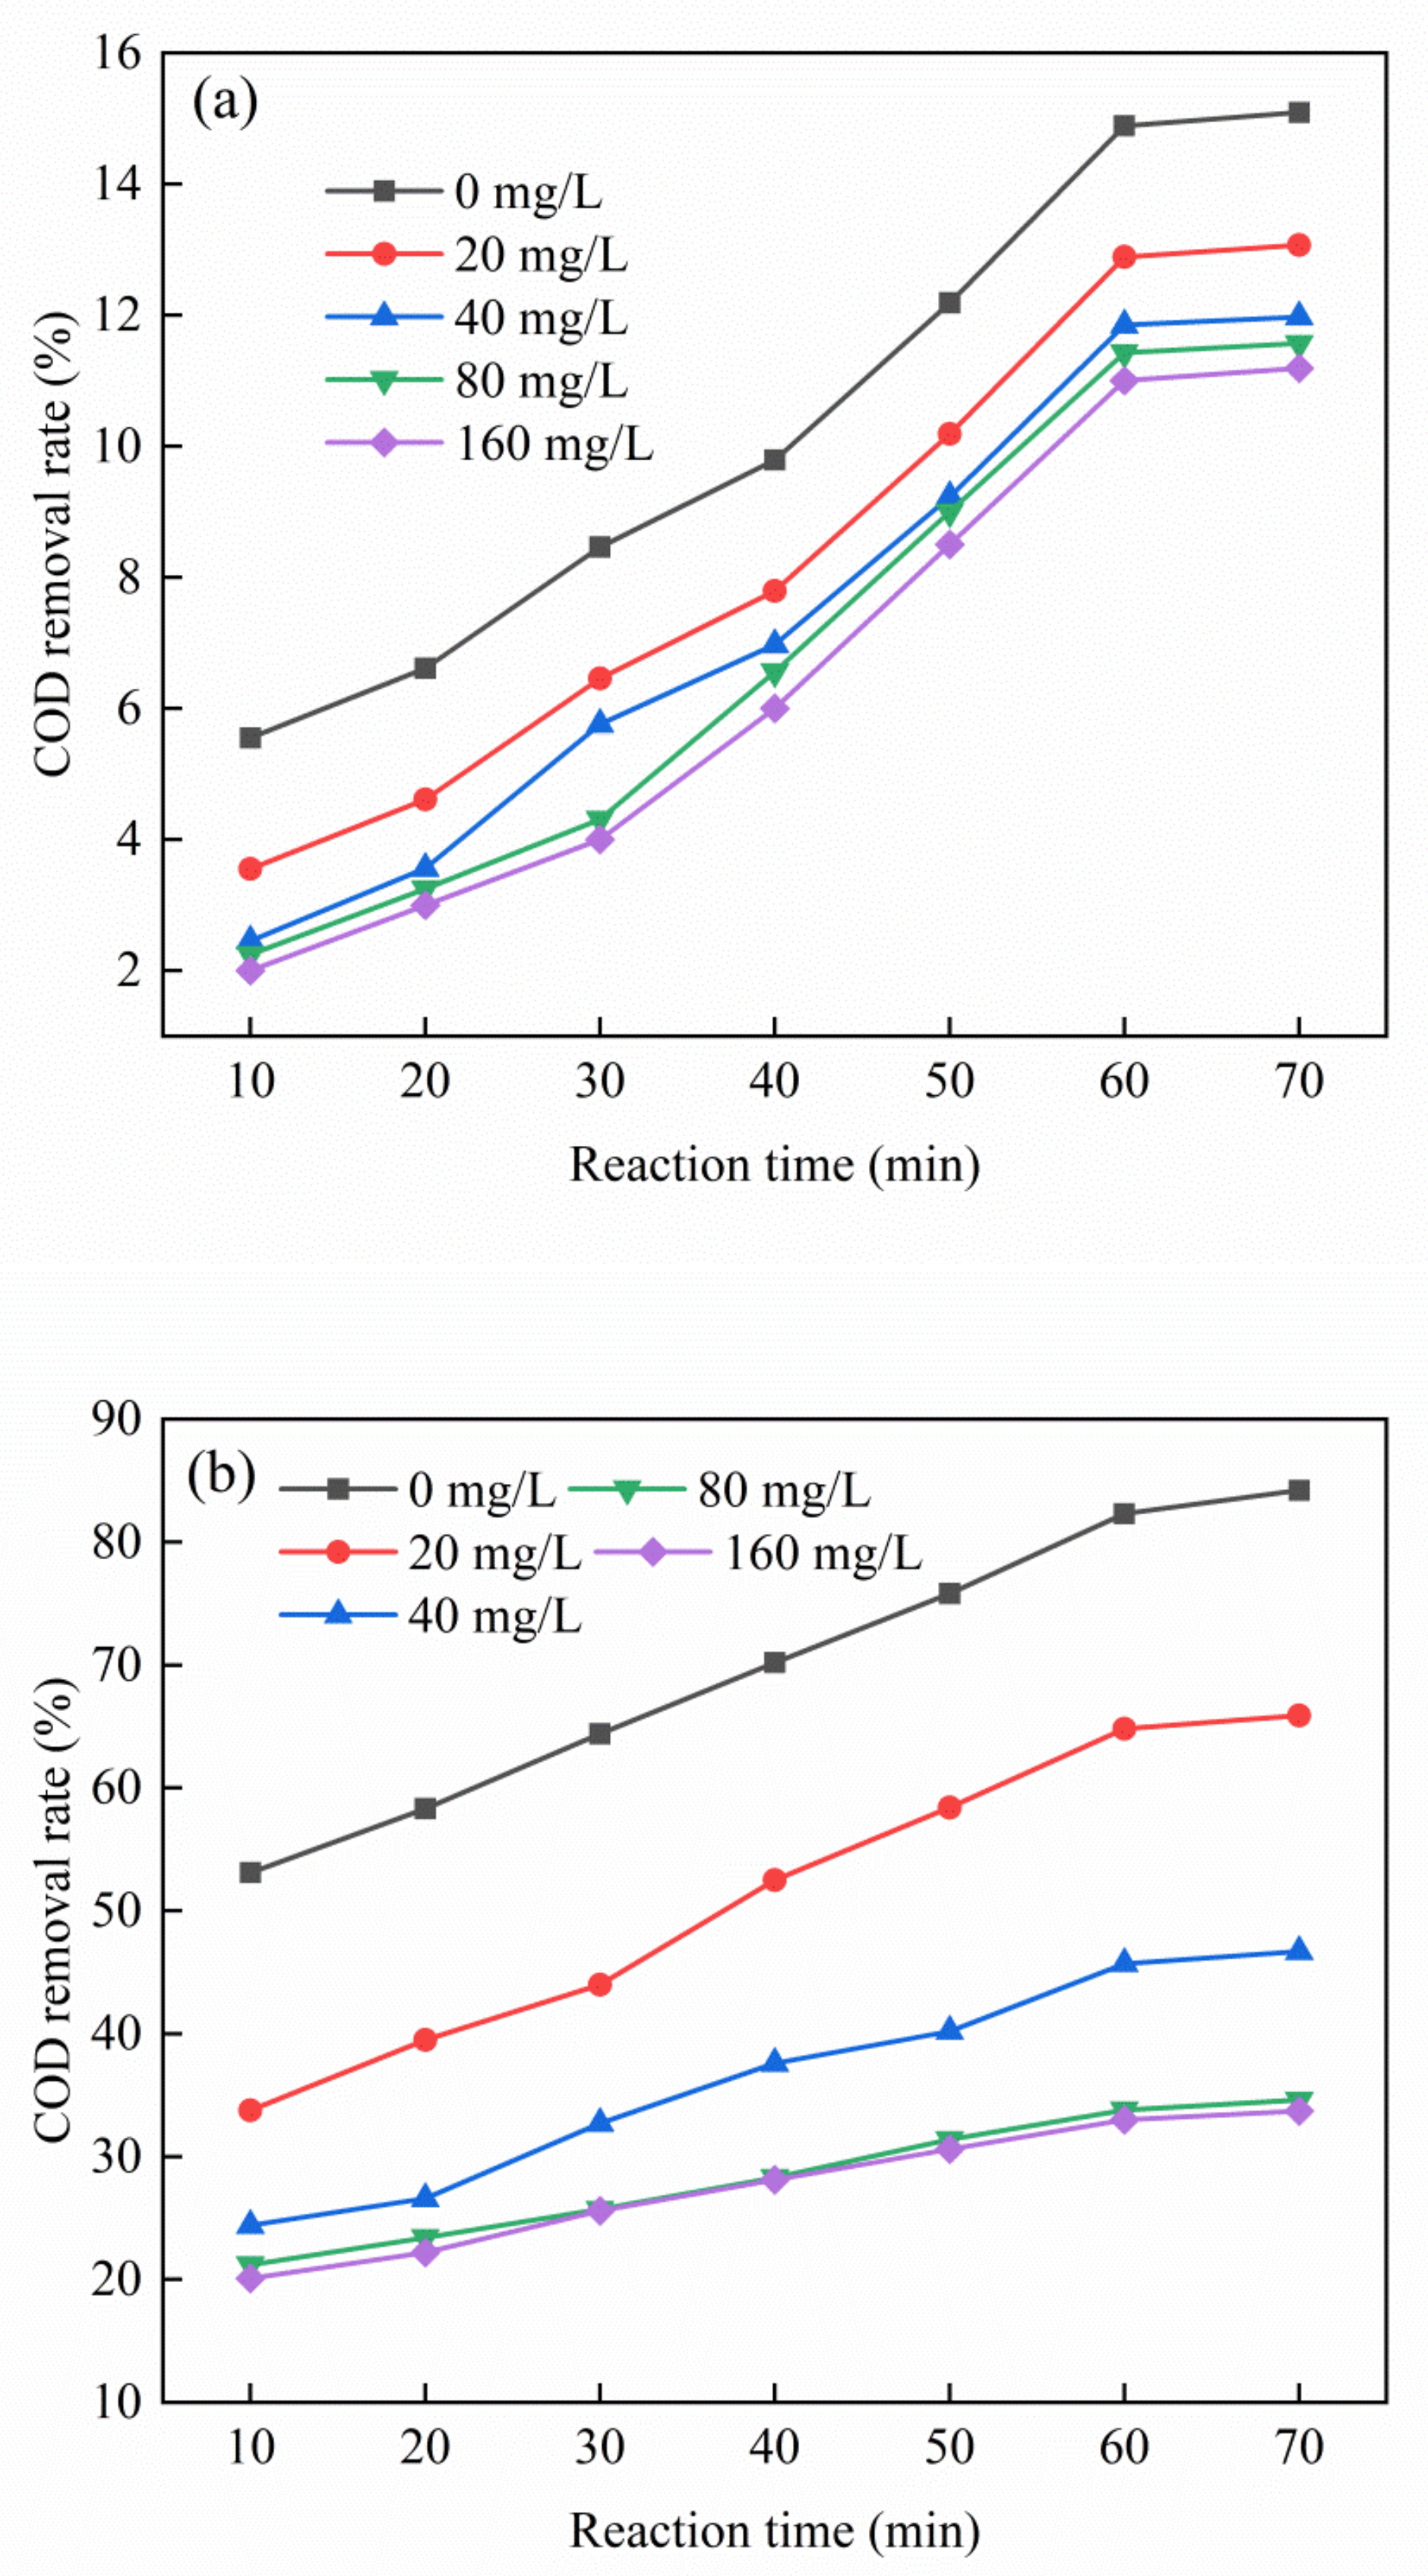
As shown in Figure 8, the addition of tert-butanol can significantly reduce the removal rate of total organic carbon in an ozone catalytic system. However, the reduction of the COD removal rate of the PTA wastewater in a single ozone reaction system was not significant. By contrast, the reduction of the COD removal rate of the PTA wastewater in the ozone + Cu–Ce@Az ozone catalyst reaction system was more obvious. When the concentration of tert-butanol was the maximum, 160 mg/L, in the ozone reaction system alone the COD removal rate of the PTA wastewater decreased by 3.9%, while the COD removal rate of the PTA wastewater in the ozone + Cu–Ce@Az ozone catalyst reaction system decreased by 50.7%. This result means that hydroxyl radicals dominate the Cu–Ce@Az ozone catalyst reaction system. When the concentration of tert-butanol is 20, 40, and 80 mg/L, the removal rate of COD in the PTA wastewater decreased significantly, and excessive tert-butanol may have occupied a large number of active sites on the catalyst and inhibited free radicals [31]. Furthermore, the remaining tert-butanol did not have enough active sites to bind and could not be fully utilized, and the removal rate was slowed down. The inhibition of tributyltin compounds did not prevent the ozone from oxidizing organic pollutants in the tailwater [32]. Therefore, tert-butanol can only inhibit but not prevent the catalytic oxidation of ozone.
3.6. 3D Fluorescence Spectrum Analysis
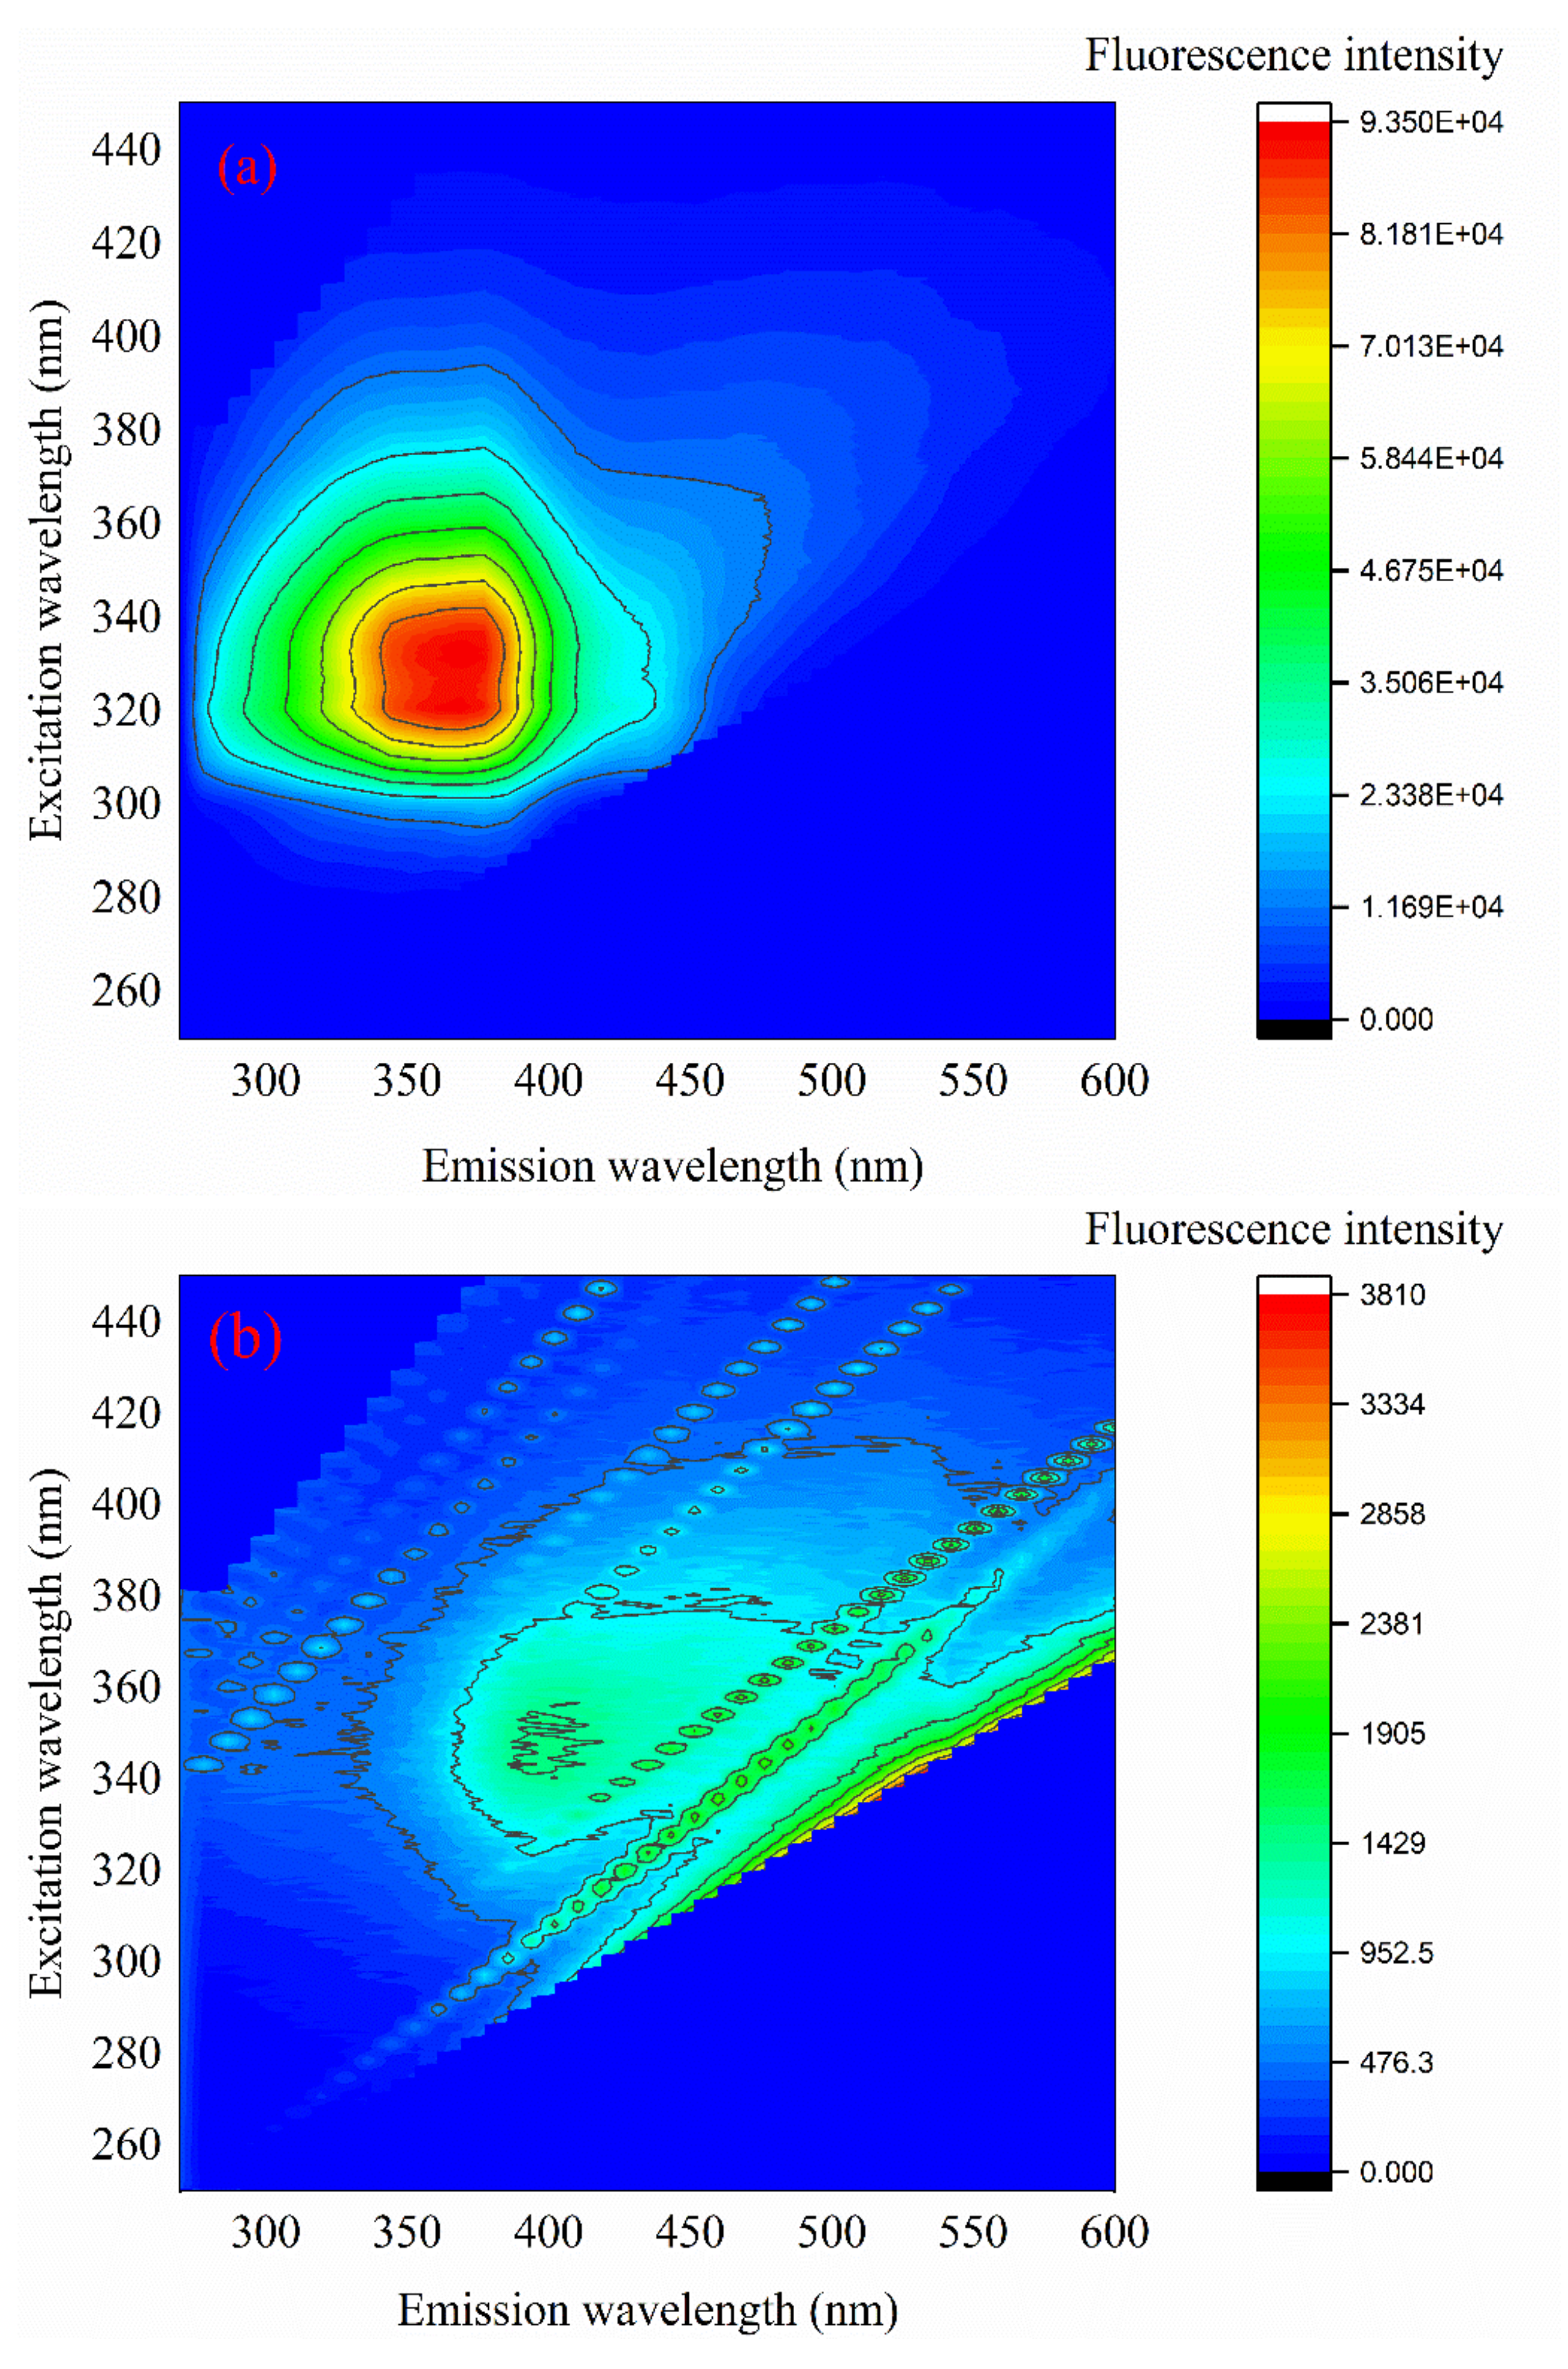
As shown in Figure 9, the raw water of the PTA wastewater that had not been treated with the Cu–Ce@Az ozone catalyst had a relatively high 3D fluorescence intensity, and the fluorescence intensity value could reach 93,500 between the emission wavelengths of 350–500 nm. After ozone-catalyzed oxidation, the fluorescence intensity of the water sample could be detected in the range of 300–600 nm. However, compared with the raw water, the fluorescence intensity value at that time was only 3810, and the 3D fluorescence intensity of the water sample was reduced 24.54 times. By comparing the changes in the 3D fluorescence spectrum intensity of the PTA wastewater before and after treatment, we can observe that the Cu–Ce@Az ozone catalyst could effectively remove the organic matter in the PTA wastewater. The fluorescence intensity of the water sample detected between the emission wavelengths (EM) 300–500 nm and the excitation wavelengths (EX) 280–420 nm of the PTA wastewater indicates that it contains humic organic matter, fulvic acid organic matter, and soluble microorganism-produced organic matter [33]. After treatment, the fluorescence intensity of the PTA wastewater weakened at EM = 350–500 nm and EX = 280–400 nm, indicating that humic organic matter, fulvic acid organic matter, and organic matter produced by soluble microorganisms had been removed [34]. The fluorescence intensity of water samples could be detected at EM = 350–500 nm and EX = 270–400 nm, which shows that the organic matter in the PTA wastewater was converted into new substances such as tryptophan organic matter.
3.7. Ultraviolet Absorption Peak of PTA Wastewater
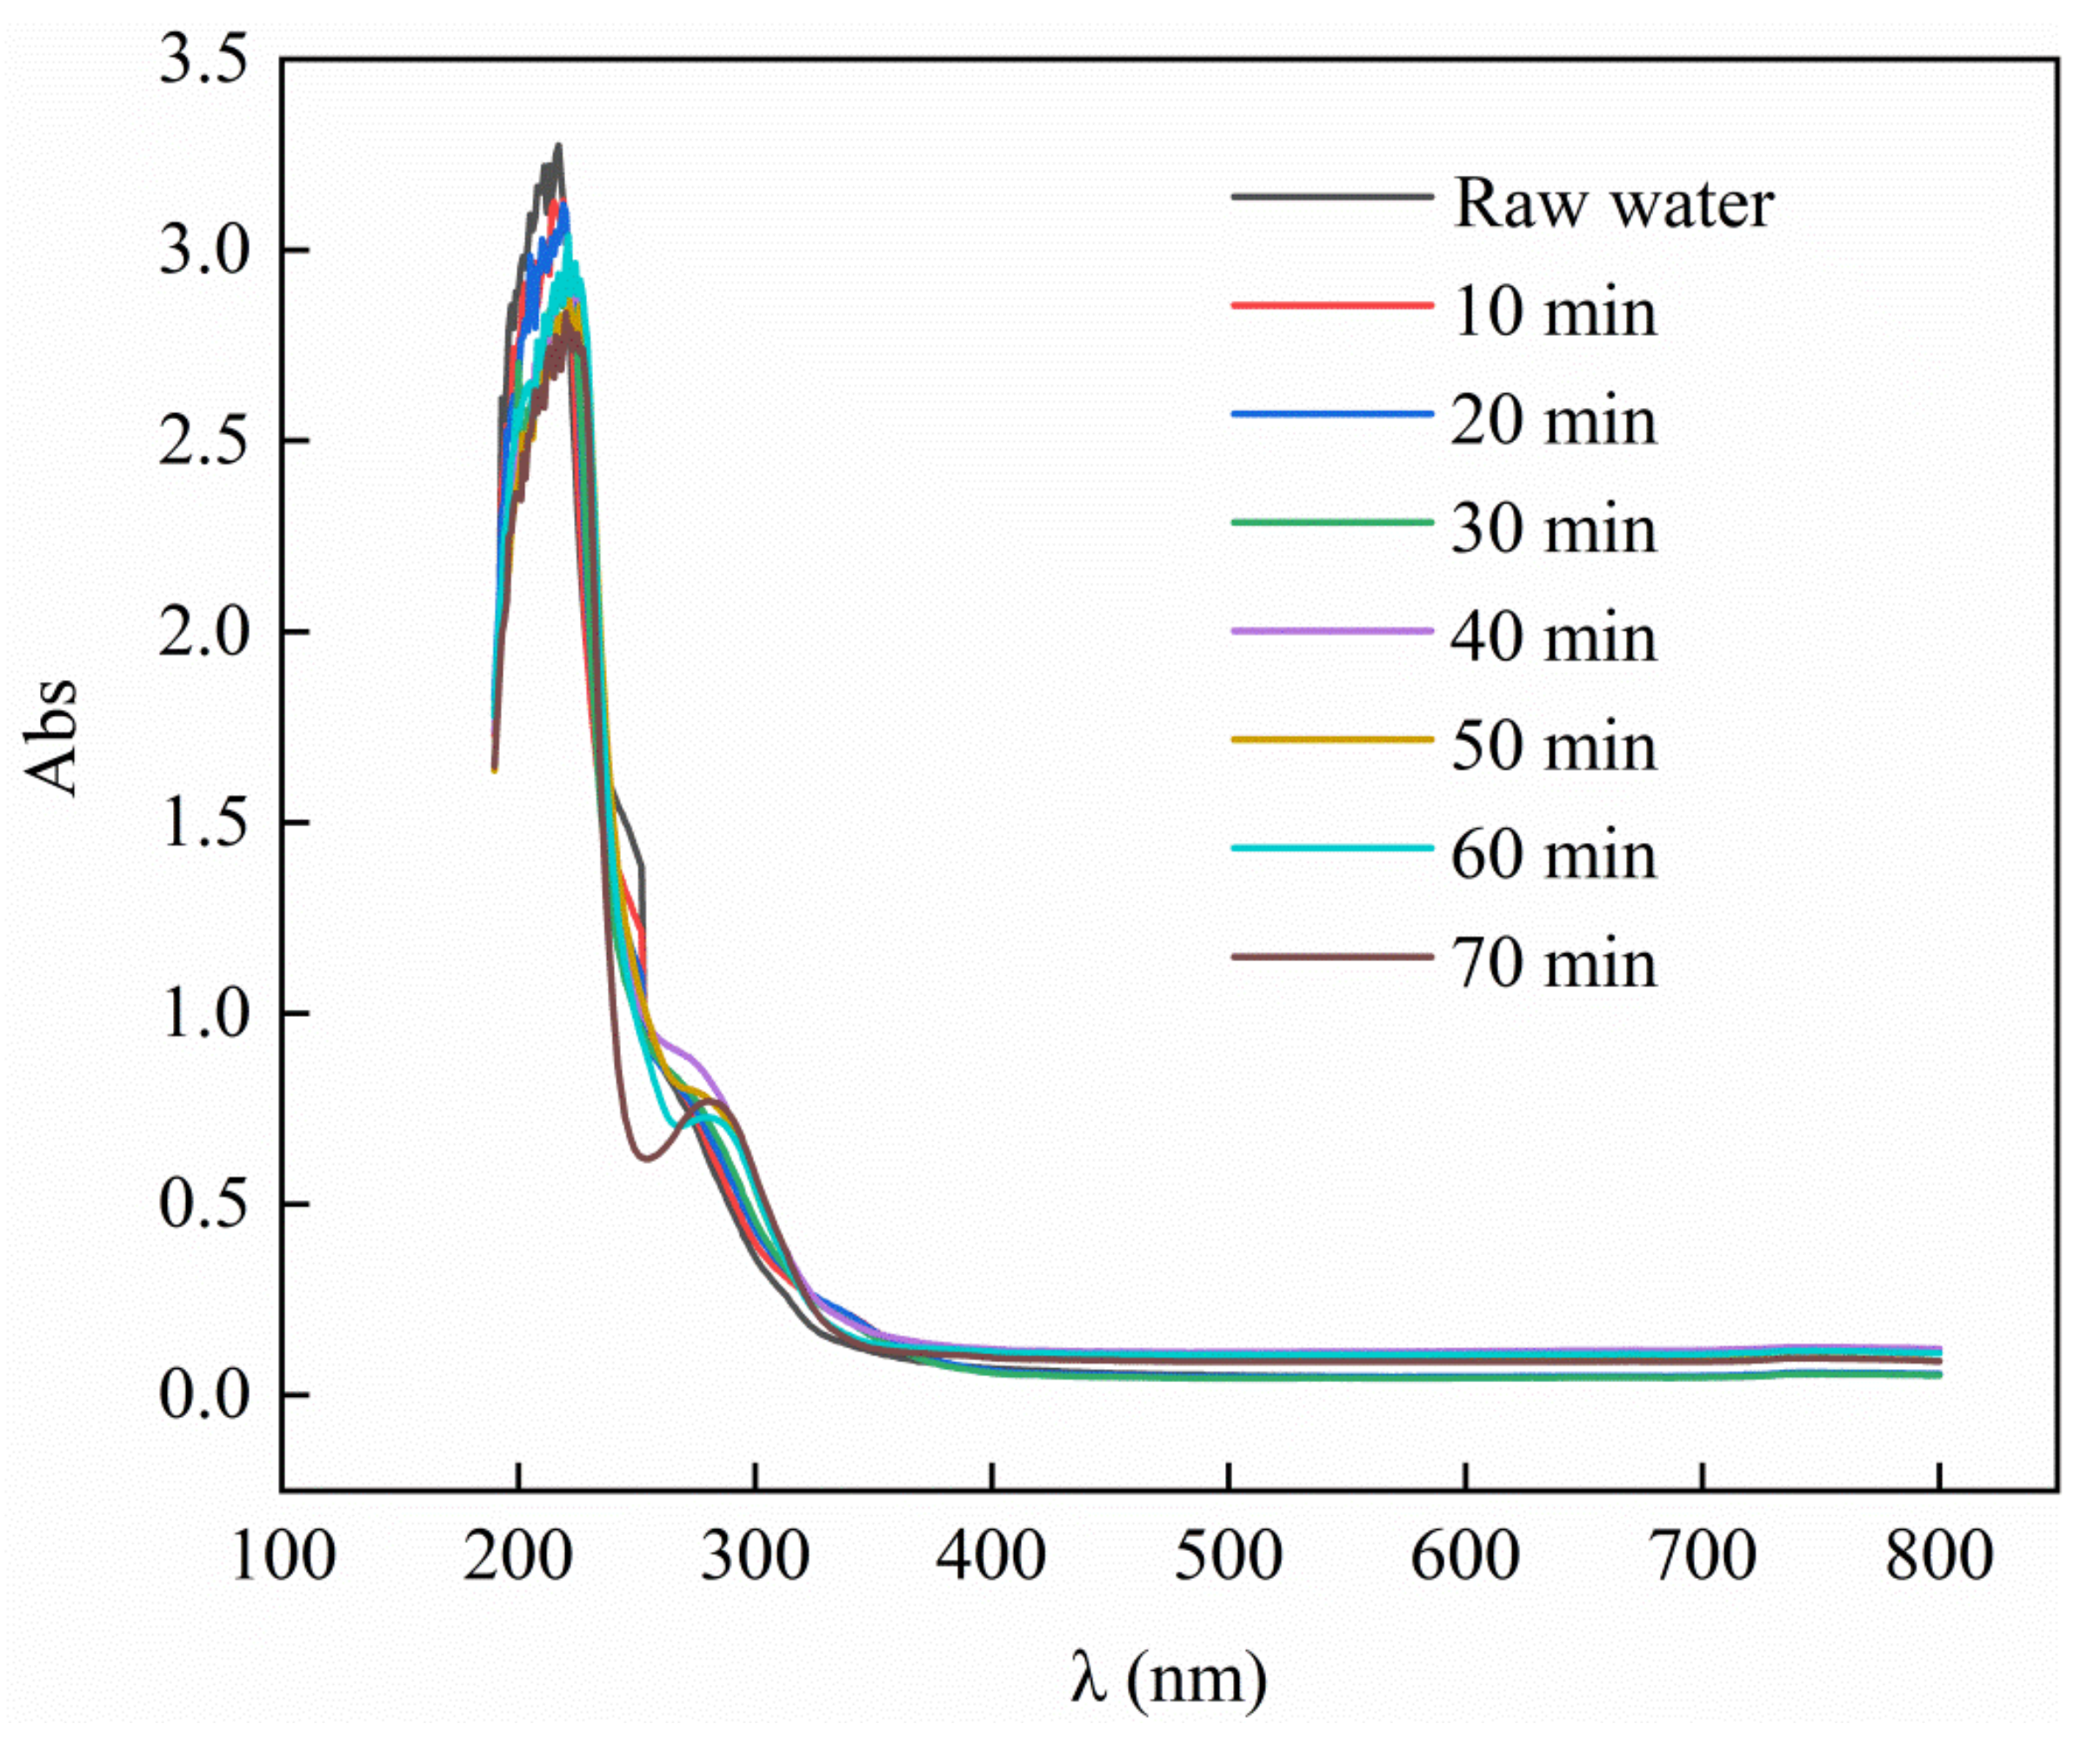
As shown in Figure 10, the ultraviolet absorption peak of the water sample at λ = 190–220 nm decreased significantly, which indicates that the unsaturated organic matter, some conjugated structures, and the benzene ring system in the PTA wastewater had been removed. Over time, a new UV absorption peak appeared at λ = 220–350 nm, indicating that new substances were produced in the PTA wastewater. After λ = 350 nm, no significant change occurred in the UV absorption peak of the water sample, indicating that most of the pollutants in the PTA wastewater had been degraded. Furthermore, the continued reaction effect was not good, which shows that the organic pollutants in the PTA wastewater had been removed.
4. Conclusions
In this study, a Cu–Ce@Az ozone catalyst was prepared by loading the metallic elements Cu and Ce on an artificial zeolite through the impregnation method. A systematic experimental study was conducted. The characterization results showed that the metallic elements Cu and Ce were successfully loaded inside and on the surface of the carrier. After calcination, the metallic elements Cu and Ce existed in the state of oxides CuO and CeO2. The optimal reaction conditions for the Cu–Ce@Az ozone catalyst to treat PTA wastewater were as follows: 70 min reaction time, pH = 8.5, 2 g/h ozone dosage, and 30 g/350 mL catalyst dosage. Under these conditions, the removal rate of COD from the PTA wastewater by the Cu–Ce@Az ozone catalyst reached 84.2%. The Cu–Ce@Az ozone catalyst was reused 30 times and the COD removal rate of the PTA wastewater was 68.2%, which was still a high removal rate. Water quality characterization showed that after catalytic oxidation reaction, organic matter in the PTA wastewater had been converted into tryptophan organic matter and aromatic organic matter. Furthermore, unsaturated organic matter, certain conjugated structures, and the benzene ring system in the wastewater were destroyed.
Supplementary Materials
The following are available online at https://www.mdpi.com/article/10.3390/w13141906/s1, Figure S1: Adsorption experiment of PTA biochemical tailwater by artificial zeolite, Figure S2: The effect of element impregnation ratio on the oxidation efficiency of PTA biochemical tailwater (roasting temperature 300 ℃, roasting time 3 h, pH = 8.5, reaction time 70 min, catalyst dosage 75 g/L, ozone generation 1.5 g/h, aeration 0.05 L/min), Figure S3: The effect of roasting temperature on the oxidation efficiency of PTA biochemical tailwater (impregnation ratio of Cu: Ce = 1:3, calcination time 3.0 h, pH = 8.5, reaction time 70 min, catalyst dosage 75 g/L, ozone generation 1.5 g/h, aeration 0.05 L/min), Figure S4: The effect of roasting time on the oxidation efficiency of PTA biochemical tailwater (impregnation ratio of Cu: Ce = 1:3, calcination temperature 400 °C, pH = 8.5, reaction time 70 min, catalyst dosage 75 g/L, ozone generation 1.5 g/h, aeration 0.05 L/min), Figure S5: XRD characterization of Cu–Ce@Az catalysts, Figure S6: Adsorption and desorption isotherms: (a) synthetic zeolite, (b) Cu–Ce@Az catalyst, (c) Cu–Ce@Az after utilization 30 times, Figure S7: XPS characterization: (a) synthetic zeolite, (b) Cu–Ce@Az catalyst, (c) Cu–Ce@Az after utilization 30 times, Table S1: BET characterization analysis of Cu–Ce@Az catalyst, Table S2: XRF characterization of Cu–Ce@Az catalyst, Table S3: EDS characterization of Cu–Ce@Az catalyst.
Author Contributions
Conceptualization, X.L., S.X., S.L., J.Z.; methodology, S.L., J.Z., W.S., Y.X., Y.S.; software, Y.S.; validation, J.Z., W.S., Y.S.; formal analysis, X.L., S.L., J.Z., W.S., Y.S.; investigation, S.L., J.Z., W.S., Y.S.; data curation, S.L., W.S., Y.S.; writing—original draft preparation, S.L., W.S., Y.S.; writing—review and editing, W.S., Y.S.; supervision, W.S., Y.S.; project administration, W.S., Y.S.; funding acquisition, Y.S. All authors have read and agreed to the published version of the manuscript.
Funding
This research was supported by the National Natural Science Foundation of China (No. 51508268), Natural Science Foundation of Jiangsu Province in China (No. BK20201362), and 2018 Six Talent Peaks Project of Jiangsu Province (JNHB-038).
Institutional Review Board Statement
Not applicable.
Informed Consent Statement
Not applicable.
Data Availability Statement
The data presented in this study are available on request from the corresponding author.
Conflicts of Interest
The authors declare no conflict of interest.
References
- Sun, W.; Zhou, S.; Sun, Y.; Xu, Y.; Zheng, H. W-Ag-Ti@γ-Al2O3 particle electrodes for enhanced electrocatalytic pretreatment of coal chemical wastewater. J. Environ. Chem. Eng. 2021, 9, 104681. [Google Scholar] [CrossRef]
- Sun, W.; Sun, Y.; Zhu, H.; Zheng, H. Catalytic activity and evaluation of Fe-Mn@Bt for ozonizing coal chemical biochemical tail water. Sep. Purif. Technol. 2020, 239, 116524. [Google Scholar] [CrossRef]
- Krishan, K.G.; Basheshwar, P. Treatment of toxic pollutants of purified terephthalic acid waste water: A review. Environ. Technol. Innov. 2017, 8, 191–217. [Google Scholar]
- Wang, D.; Ma, W.; Han, H.; Li, K.; Xu, H.; Fang, F.; Hou, B.; Jia, S. Enhanced anaerobic degradation of Fischer–Tropsch wastewater by integrated UASB system with Fe-C micro-electrolysis assisted. Chemosphere 2016, 164, 14–24. [Google Scholar] [CrossRef] [PubMed]
- Yu, J.; Qiu, W.; Xu, H.; Lu, X.; Ma, J.; Lu, D. Highly-efficient and stable MgCo2O4 spinel for bisphenol a removal by activating peroxymonosulfate via radical and non-radical pathways. Chem. Eng. J. 2021, 421, 129498. [Google Scholar] [CrossRef]
- Sheikhi, S.; Dehghanzadeh, R.; Maryamabadi, A.; Aslani, H. Chlorpyrifos removal from aqueous solution through sequential use of coagulation and advanced oxidation processes: By-products, degradation pathways, and toxicity assessment. Environ. Technol. Innov. 2021, 23, 101564. [Google Scholar] [CrossRef]
- Jiang, Y.; Zhao, H.; Liang, J.; Yue, L.; Li, T.; Luo, Y.; Liu, Q.; Lu, S.; Asiri, A.M.; Gong, Z.; et al. Anodic oxidation for the degradation of organic pollutants: Anode materials, operating conditions and mechanisms. A mini review. Electrochem. Commun. 2021, 123, 106912. [Google Scholar] [CrossRef]
- Zhang, J.; Zhou, Y.; Yao, B.; Yang, J.; Zhi, D. Current progress in electrochemical anodic-oxidation of pharmaceuticals: Mechanisms, influencing factors, and new technique. J. Hazard. Mater. 2021, 418, 126313. [Google Scholar] [CrossRef]
- Saad, M.E.K.; Rabaaoui, N.; Elaloui, E.; Moussaoui, Y. Mineralization of p-methylphenol in aqueous medium by anodic oxidation with a boron-doped diamond electrode. Sep. Purif. Technol. 2016, 171, 157–163. [Google Scholar] [CrossRef]
- Ridruejo, C.; Salazar, C.; Cabot, P.L.; Centellas, F.; Brillas, E.; Sirés, I. Electrochemical oxidation of anesthetic tetracaine in aqueous medium. Influence of the anode and matrix composition. Chem. Eng. J. 2017, 326, 811–819. [Google Scholar] [CrossRef] [Green Version]
- Wu, M.; Kwok, Y.H.; Zhang, Y.; Szeto, W.; Huang, H.; Leung, D.Y. Synergetic effect of vacuum ultraviolet photolysis and ozone catalytic oxidation for toluene degradation over MnO2-rGO composite catalyst. Chem. Eng. Sci. 2021, 231, 116288. [Google Scholar] [CrossRef]
- Gopi, T.; Swetha, G.; Shekar, S.C.; Krishna, R.; Ramakrishna, C.; Saini, B.; Rao, P. Ozone catalytic oxidation of toluene over 13X zeolite supported metal oxides and the effect of moisture on the catalytic process. Arab. J. Chem. 2019, 12, 4502–4513. [Google Scholar] [CrossRef] [Green Version]
- Pang, L.; Fan, C.; Shao, L.; Song, K.; Yi, J.; Cai, X.; Wang, J.; Kang, M.; Li, T. The Ce doping Cu/ZSM-5 as a new superior catalyst to remove NO from diesel engine exhaust. Chem. Eng. J. 2014, 253, 394–401. [Google Scholar] [CrossRef]
- Shao, Q.; Dong, H.; Zhang, J.; Xu, B.; Wu, Y.; Long, C. Manganese supported on controlled dealumination Y-zeolite for ozone catalytic oxidation of low concentration toluene at low temperature. Chemosphere 2021, 271, 129604. [Google Scholar] [CrossRef]
- Sun, W.; Zhou, S.; Sun, Y.; Tang, J.; Zheng, H. Ozone catalytic oxidation capacity of Ti-Co@Al 2 O 3 for the treatment of biochemical tail water from the coal chemical industry. Water Environ. Res. 2020, 92, 1283–1292. [Google Scholar] [CrossRef]
- Kim, J.; Kwon, E.E.; Lee, J.E.; Jang, S.-H.; Jeon, J.-K.; Song, J.; Park, Y.-K. Effect of zeolite acidity and structure on ozone oxidation of toluene using Ru-Mn loaded zeolites at ambient temperature. J. Hazard. Mater. 2021, 403, 123934. [Google Scholar] [CrossRef]
- Sun, W.; Sun, Y.; Shah, K.; Zheng, H.; Ma, B. Electrochemical degradation of oxytetracycline by Ti-Sn-Sb/γ-Al2O3 three-dimensional electrodes. J. Environ. Manag. 2019, 241, 22–31. [Google Scholar] [CrossRef] [PubMed]
- He, S.; Luan, P.; Mo, L.; Xu, J.; Li, J.; Zhu, L.; Zeng, J. Mineralization of Recalcitrant Organic Pollutants in Pulp and Paper Mill Wastewaters through Ozonation Catalyzed by Cu-Ce Supported on Al2O3. Bioresources 2018, 13, 3686–3703. [Google Scholar] [CrossRef] [Green Version]
- Sun, Y.; Chen, A.; Zhu, S.; Sun, W.; Shah, K.; Zheng, H. Degradation of chloramphenicol using Ti-Sb/attapulgite ceramsite particle electrodes. Water Environ. Res. 2019, 91, 756–769. [Google Scholar] [CrossRef]
- Dou, B.; Liu, D.; Zhang, Q.; Zhao, R.; Hao, Q.; Bin, F.; Cao, J. Enhanced removal of toluene by dielectric barrier discharge coupling with Cu-Ce-Zr supported ZSM-5/TiO2/Al2O3. Catal. Commun. 2017, 92, 15–18. [Google Scholar] [CrossRef] [Green Version]
- Águila, G.; Gracia, F.; Araya, P. CuO and CeO2 catalysts supported on Al2O3, ZrO2, and SiO2 in the oxidation of CO at low temperature. Appl. Catal. A Gen. 2008, 343, 16–24. [Google Scholar] [CrossRef]
- Park, J.W.; Jeong, J.H.; Yoon, W.L.; Rhee, Y.W. Selective oxidation of carbon monoxide in hydrogen-rich stream over Cu-Ce/γ-Al2O3 catalysts promoted with cobalt in a fuel processor for proton exchange membrane fuel cells. J. Power Sources 2004, 132, 18–28. [Google Scholar] [CrossRef]
- Francisco, M.S.P.; Mastelaro, V.; Nascente, P.A.P.; Florentino, A.O. Activity and Characterization by XPS, HR-TEM, Raman Spectroscopy, and BET Surface Area of CuO/CeO2-TiO2 Catalysts. J. Phys. Chem. B 2001, 105, 10515–10522. [Google Scholar] [CrossRef]
- Chen, L.; Zhu, Y.; Zheng, H.; Zhang, C.; Zhang, B.; Li, Y. Catalytic degradation of oxygenates in Fischer-Tropsch aqueous phase effluents to fuel gas via hydrodeoxygenation over Ru/AC catalyst. J. Chem. Technol. Biotechnol. 2011, 87, 112–122. [Google Scholar] [CrossRef]
- Bae, S.; Jung, J.; Lee, W. The effect of pH and zwitterionic buffers on catalytic nitrate reduction by TiO2-supported bimetallic catalyst. Chem. Eng. J. 2013, 232, 327–337. [Google Scholar] [CrossRef]
- Qi, F.; Chen, Z.; Xu, B.; Shen, J.; Ma, J.; Joll, C.; Heitz, A. Influence of surface texture and acid–base properties on ozone decomposition catalyzed by aluminum (hydroxyl) oxides. Appl. Catal. B Environ. 2008, 84, 684–690. [Google Scholar] [CrossRef]
- Lan, Q.; Cao, M.; Ye, Z.; Zhu, J.; Chen, M.; Chen, X.; Liu, C. Effect of oxalate and pH on photodegradation of pentachlorophenol in heterogeneous irradiated maghemite System. J. Photochem. Photobiol. A Chem. 2016, 328, 198–206. [Google Scholar] [CrossRef]
- Zhang, L.-C.; Jia, Z.; Lyu, F.; Liang, S.-X.; Lu, J. A review of catalytic performance of metallic glasses in wastewater treatment: Recent progress and prospects. Prog. Mater. Sci. 2019, 105, 100576. [Google Scholar] [CrossRef]
- Xia, F.; Xu, X.; Li, X.; Zhang, L.; Qiu, H.; Wang, W.; Liu, Y.; Gao, J. Preparation of Bismuth Nanoparticles in Aqueous Solution and Its Catalytic Performance for the Reduction of 4-Nitrophenol. Ind. Eng. Chem. Res. 2014, 53, 10576–10582. [Google Scholar] [CrossRef]
- Chen, H.-S.; Zhang, Q.-M.; Yang, Z.-J.; Liu, Y.-S. Research on Treatment of Oily Sludge from the Tank Bottom by Ball Milling Combined with Ozone-Catalyzed Oxidation. ACS Omega 2020, 5, 12259–12269. [Google Scholar] [CrossRef]
- Sun, Y.; Zhu, S.; Sun, W.; Zheng, H. Degradation of high-chemical oxygen demand concentration pesticide wastewater by 3D electrocatalytic oxidation. J. Environ. Chem. Eng. 2019, 7, 103276. [Google Scholar] [CrossRef]
- Sun, Y.; Chen, A.; Sun, W.; Zhou, J.; Shah, K.J.; Zheng, H.; Shen, H. Degradation of chloramphenicol by Ti-Ag/gamma-Al2O3 particle electrode using three-dimensional reactor. Desalin. Water. Treat. 2019, 163, 96–108. [Google Scholar] [CrossRef]
- Zhu, G.; Wang, C.; Dong, X. Fluorescence excitation–emission matrix spectroscopy analysis of landfill leachate DOM in coagulation–flocculation process. Environ. Technol. 2016, 38, 1489–1497. [Google Scholar] [CrossRef] [PubMed]
- Tang, X.; Huang, T.; Zhang, S.; Zheng, J.; Zheng, H. Synthesis of an amphoteric chitosan-based flocculant and its flocculation performance in the treatment of dissolved organic matter from drinking water. Desalination Water Treat. 2020, 174, 171–177. [Google Scholar] [CrossRef]
Figure 1.
Ozone catalytic reaction flowchart.

Figure 2.
SEM characterization: (a) synthetic zeolite, (b) 300 °C, (c) 350 °C, (d) 400 °C, (e) 450 °C, (f) 500 °C, and (g) Cu–Ce@Az after utilization 30 times.
Figure 2.
SEM characterization: (a) synthetic zeolite, (b) 300 °C, (c) 350 °C, (d) 400 °C, (e) 450 °C, (f) 500 °C, and (g) Cu–Ce@Az after utilization 30 times.

Figure 3.
Effect of reaction time on catalytic performance of Cu–Ce@Az catalysts.

Figure 4.
Effect of pH on catalytic performance of Cu–Ce@Az catalysts.

Figure 5.
Effect of ozone dosage on catalytic performance of Cu–Ce@Az catalysts.

Figure 6.
Effect of catalyst dosage on catalytic performance of Cu–Ce@Az catalysts.

Figure 7.
Effect of repeated utilization times on catalytic performance of Cu–Ce@Az catalysts.

Figure 8.
Effect of tert-butanol dosage on ozone catalytic oxidation system: (a) ozone alone and (b) ozone + Cu–Ce@Az catalysts.
Figure 8.
Effect of tert-butanol dosage on ozone catalytic oxidation system: (a) ozone alone and (b) ozone + Cu–Ce@Az catalysts.

Figure 9.
3D fluorescence spectra of PTA wastewater under different conditions: (a) before treatment and (b) after treatment.
Figure 9.
3D fluorescence spectra of PTA wastewater under different conditions: (a) before treatment and (b) after treatment.

Figure 10.
UV–Vis diagram of PTA wastewater at different ozone catalytic oxidation times.


Table 1.
Water quality of PTA wastewater obtained from a petrochemical company.
| Test Index | Unit | Detection Value |
|---|---|---|
| COD | mg/L | 178.6 |
| NH4+-N | mg/L | 0.24 |
| pH | / | 8.50 |
| Turbidity | NTU | 7.63 |
| Conductivity | μS/cm | 11.76 |
| Total phosphorus | mg/L | 0.93 |
| Total nitrogen | mg/L | 0.65 |
| TOC | mg/L | 59.94 |
Publisher’s Note: MDPI stays neutral with regard to jurisdictional claims in published maps and institutional affiliations. |
© 2021 by the authors. Licensee MDPI, Basel, Switzerland. This article is an open access article distributed under the terms and conditions of the Creative Commons Attribution (CC BY) license (https://creativecommons.org/licenses/by/4.0/).
Share and Cite
MDPI and ACS Style
Lu, X.; Xie, S.; Li, S.; Zhou, J.; Sun, W.; Xu, Y.; Sun, Y. Treatment of Purified Terephthalic Acid Wastewater by Ozone Catalytic Oxidation Method. Water 2021, 13, 1906. https://doi.org/10.3390/w13141906
AMA Style
Lu X, Xie S, Li S, Zhou J, Sun W, Xu Y, Sun Y. Treatment of Purified Terephthalic Acid Wastewater by Ozone Catalytic Oxidation Method. Water. 2021; 13(14):1906. https://doi.org/10.3390/w13141906
Chicago/Turabian StyleLu, Xi, Shuqian Xie, Shuai Li, Jun Zhou, Wenquan Sun, Yanhua Xu, and Yongjun Sun. 2021. "Treatment of Purified Terephthalic Acid Wastewater by Ozone Catalytic Oxidation Method" Water 13, no. 14: 1906. https://doi.org/10.3390/w13141906
Note that from the first issue of 2016, this journal uses article numbers instead of page numbers. See further details here.