Article

Ecological Status as the Basis for the Holistic Environmental Flow Assessment of a Tropical Highland River in Ethiopia

1
Amhara Design and Supervision Works Enterprise, Bahir Dar University, Bahir Dar P.O. Box 26, Ethiopia
2
Bahir Dar Institute of Technology, Bahir Dar University, Bahir Dar P.O. Box 26, Ethiopia
3
Department of Fishery and Aquatic Ecosystems, Bahir Dar University, Bahir Dar P.O. Box 26, Ethiopia
4
Department of Biology, Blue Nile Water Institute, Bahir Dar University, Bahir Dar P.O. Box 26, Ethiopia
5
Department of Natural Resource Management, College of Agriculture and Environmental Sciences, Bahir Dar University, Bahir Dar P.O. Box 26, Ethiopia
6
International Center for Tropical Agriculture (CIAT), Addis Ababa 1000, Ethiopia
7
Department of Biological and Environmental Engineering, Cornell University, Ithaca, NY 14850, USA
8
Department of Water Science and Engineering, IHE Delft Institute for Water Education, 2700 Delft, The Netherlands
*
Authors to whom correspondence should be addressed.
Water 2021, 13(14), 1913; https://doi.org/10.3390/w13141913
Submission received: 25 May 2021 / Revised: 6 July 2021 / Accepted: 7 July 2021 / Published: 10 July 2021
(This article belongs to the Special Issue Large Rivers: Ecology and Management in a Changing World)

Abstract

:
There is an increasing need globally to establish relationships among flow, ecology, and livelihoods to make informed decisions about environmental flows. This paper aimed to establish the ecological foundation for a holistic environmental flow assessment method in the Gumara River that flows into Lake Tana in Ethiopia and the Blue Nile River. First, the ecological conditions (fish, macro-invertebrate, riparian vegetation, and physicochemical) of the river system were characterized, followed by determining the hydrological condition and finally linking the ecological and hydrological components. The ecological data were collected at 30 sites along the Gumara River on March 2016 and 2020. River hydrology was estimated using the SWAT model and showed that the low flow decreased over time. Both physico-chemical and macroinvertebrate scores showed that water quality was moderate in most locations. The highest fish diversity index was in the lower reach at Wanzaye. Macroinvertebrate diversity was observed to decrease downstream. Both the fish and macroinvertebrate diversity indices were less than the expected maximum, being 3.29 and 4.5, respectively. The normalized difference vegetation index (NDVI) for 30 m and 60 m buffer distances from the river decreased during the dry season (March–May). Hence, flow conditions, water quality, and land-use change substantially influenced the abundance and diversity of fish, vegetation, and macroinvertebrate species. The pressure on the ecology is expected to increase because the construction of the proposed dam is expected to alter the flow regime. Thus, as demand for human water consumption grows, measures are needed, including quantification of environmental flow requirements and regulating river water uses to conserve the ecological status of the Gumara River and Lake Tana sub-basin.

1. Introduction

Knowledge about environmental flows is essential in conserving vigorous, prolific, and resilient aquatic ecosystems that benefit flora, fauna, and human beings [1]. For determining environmental flows in rivers, there is a need to establish relationships among flow, ecology, and livelihoods. The concept of environmental flows is broad and includes the quantity, quality, and timing of freshwater flows in rivers and levels necessary to sustain aquatic ecosystems supporting human cultures, economies, sustainable livelihoods, and well-being [2].
The knowledge and skill of establishing relationships between ecological processes and hydrological characteristics in rivers and floodplains are important in estimating environmental water requirements of water bodies to maintain ecological health impacting human livelihoods [3]. For example, relationships between ecological responses to flow alterations in regulated rivers in the Upper Tennessee River Basin were developed by McManamay et al. [4]. In addition, McClain et al. [5] inferred flow–ecology relationships by examining the ecology and annual flow regime of the Mara river in Kenya and Tanzania. Other studies on environmental flow assessment in Africa include the Great Ruaha River basin environmental flow assessment in Tanzania [6], application of the Downstream Response to Imposed Flow Transformations (DRIFT) in Lesotho rivers [7], and the PROBFLO approach, as applied to the Senqu River catchment in Lesotho and the Mara River catchment in Kenya and Tanzania [8].
The fauna and flora of rivers and wetlands in the Ethiopian highlands were highly diverse in the 1930s, as shown in a study by Cheesman in the Lake Tana sub-basin [9]. Some of this diversity still exists. For example, 15 unique cyprinid family migratory fishes in the genus Labeobarbus were found in the Gumara River [10]. In addition, twelve globally threatened waterfowl species were present in the Welala and Shesher wetlands [11]. Finally, the Shesher and Welala wetlands have been named a Biosphere reserve area hot spot [12].
The degrading quality of lake Tana affected aquatic macroinvertebrates where Oligochaeta were negatively correlated with phosphate and positively with oxygen [13]. Increasing turbidity has increased Hirudinea and decreased Coleoptera and Bivalvia. In the central highlands of Ethiopia, macroinvertebrate compositions were related to Average Score Per Taxon (ASPT) values, water quality, and percentage of urban area [14].
Lake Tana has been targeted for rapid development by the Ethiopian Federal government. Projects are funded to divert river water and construct dams on the major rivers and drain wetlands [13,15,16]. As a consequence, livelihoods dependent on ecosystem services are endangered [15,17]. Moreover, the abstraction of water and degradation of fish spawning and nursery habitats are poorly understood [18,19]. Therefore, establishing environmental flow requirements is essential to protect downstream aquatic ecosystems and maintain a broad spectrum of environmental ecosystem services.
Reliable hydrological, ecological, and related monitoring data in the Lake Tana basin are lacking to effectively investigate trends, relationships, and outline mitigation measures effectively. Therefore, this research aims to establish the ecological status information to develop a holistic environmental flow assessment method for the tropical highland rivers. The specific objectives are to (1) characterize the ecological condition (fish, macroinvertebrate, riparian vegetation, and physicochemical) across the reaches, (2) characterize the hydrological condition of the area, and (3) assess flow condition, ecology, and livelihood relationships that are dependent on ecosystem services. The Gumara River in the Lake Tana basin was selected for this study. The results of this study can be applied to other rivers in the Ethiopian highlands and similar ecosystems worldwide.

2. Methodology

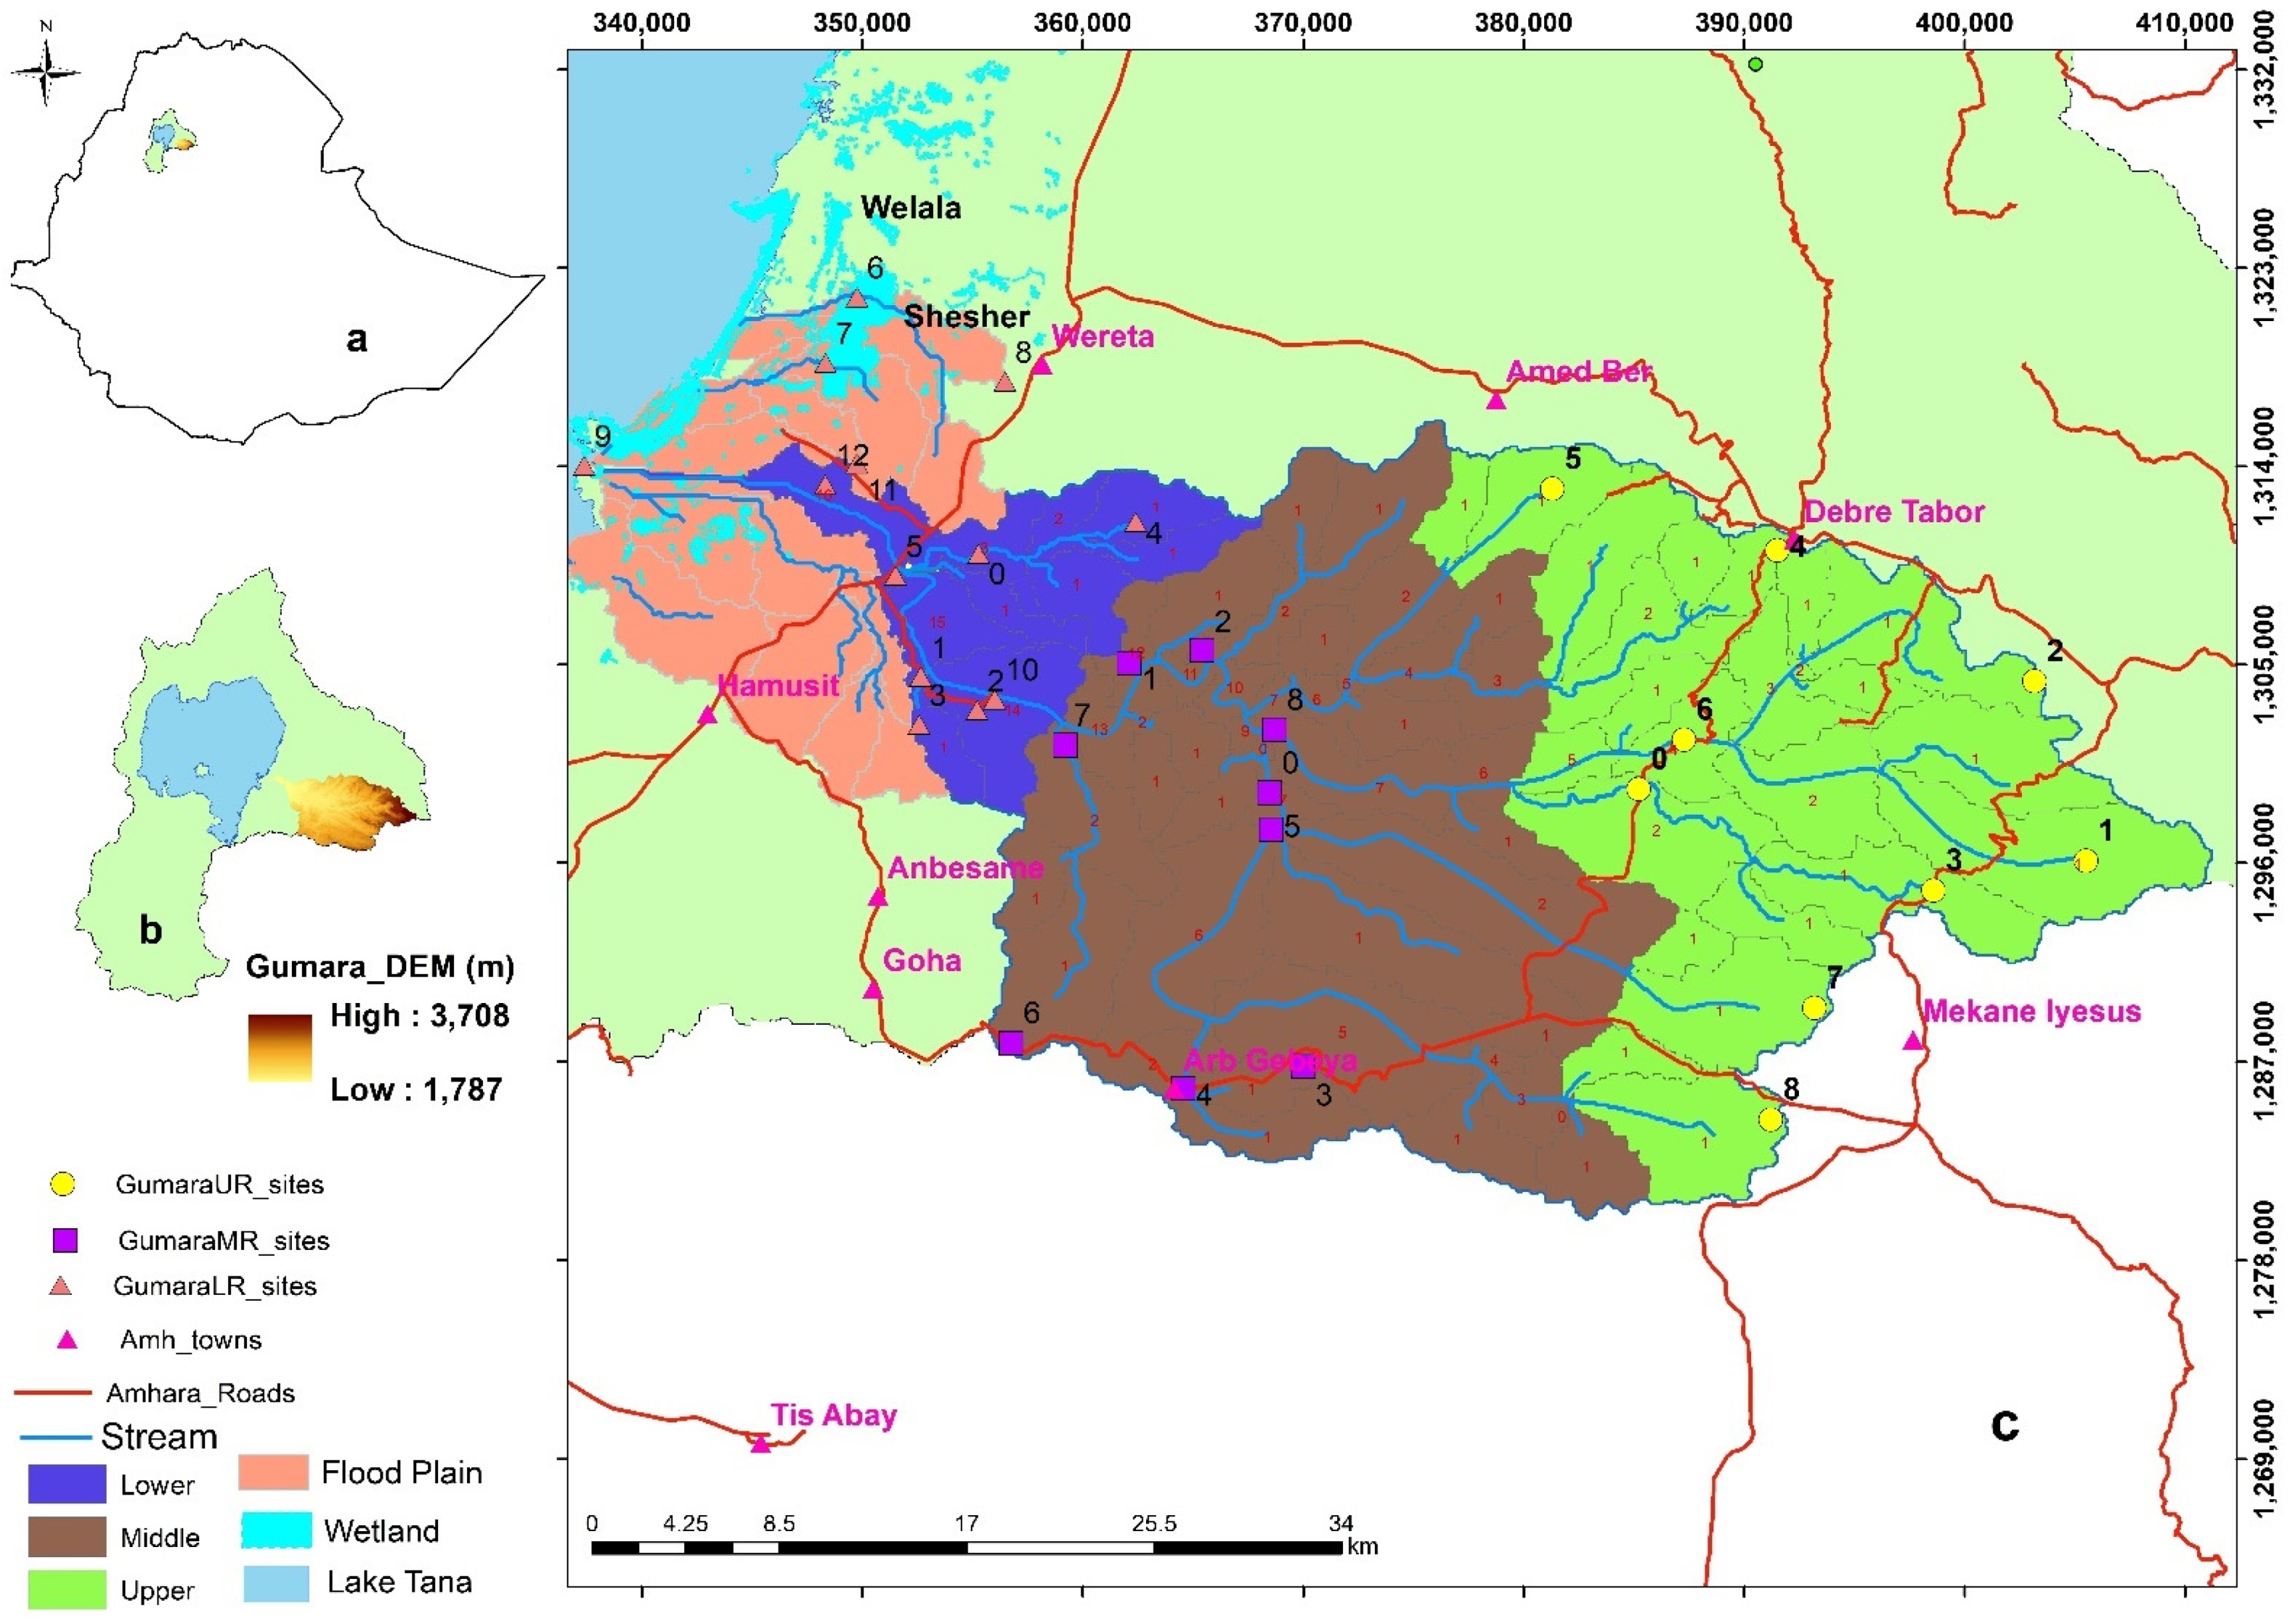
2.1. Description of the Study Area

The Gumara River drains a basin of 1376 km2. The river starts at the 4000 m.a.s.l. in the Guna mountains covered by afro-alpine vegetation and ends in Lake Tana. Two permanent wetlands, Walala and Shesher, cover about 8 km2 altogether [17], and many seasonal wetlands are found along the river (Figure 1). These wetlands are encroached by cultivation. Sixty-seven percent of the basin is cultivated agricultural land. The afro-alpine grass and giant lobelia have shrunken to only 3.7%, and dense natural forest covers 2.4% [17]. The average annual precipitation is 1326 mm. Eighty percent of the rain falls from the end of May to the middle of September.

2.2. Sampling Sites of the Study Area

The Gumara River basin was divided into three reaches: the upper (headwater), middle, and lower (Figure 1). The classification is based on landform, land use, and ecological indicators consisting of fish, vegetation, and macroinvertebrates. Thirty sampling sites were selected: 9 in the upper reach, 9 in the middle reach, and 12 in the lower reach, including 5 in the wetland areas and river mouths. River order classification was based on Shreve [20]. Sampling points were selected by the “Create Random Selection” sampling tool in Hawth’s tools in ArcGIS (Figure 1 and Table S1).

2.3. Data Collection and Processing

Flow data: Flow data for all the sampling sites were generated using the SWAT model (version 2012.10.4.21). Calibration, validation, and uncertainties were obtained using SWAT-CUP version 5.2.1.1 for the entire Gumara catchment considering the observed flow data of the lower gaging station—No. 111006, sampling site LR05 (Figure 1) [16]. Temperature (ERA5) and rainfall (CHIRPS) were collected from the KNMI climate explorer website as input in SWAT, which were validated using observed data (1994 to 2009) of the Debretabor station (Supplemental Materials in Excel). We used the land use land cover data of 2019 generated using the Google earth engine with the random forest classification algorithm (see Supplemental Materials for details, Section S2), soil data from MoWIE [21], and 30 m DEM SRTM data from USGS. The observed flow data from 1985 to 2010 were used for sensitivity and calibration analysis, while the data from 2011 to 2018 were used for validation. Flow Duration Curves (FDC) were determined using IHA software [22]. Environmental flow components were classified as moderate/high flows (exceedance probability < 80%), low flows (80–99%), and extremely low flows (>99%) [18]. Historically, March had the lowest discharge [16]. Ecological data were collected in March 2016 and 2020. According to the information in Abebe et al. [16], the pump irrigation of 15.5 km2 area (3.0 m3 s−1) above the bridge site (LR05) was deducted for the modelled flows of March since 1997 to account for flow alterations and checked with the observed March flow at station LR05.
Macroinvertebrate data: Macroinvertebrates were sampled following the multi-habitat sampling approach [23]. A D-frame net with a mesh size of 500 μm was used for the sampling. Pooled macro-invertebrate samples were identified to the lowest possible taxa (family in this case) using identification keys with the help of a dissecting microscope [24]. The ecological status of the Gumara river was evaluated using the macroinvertebrate-based ETHBios scoring methodology developed by Aschalew and Moog [14] and supplemented using the South African Sensitivity Score (SASS) and Average BMWP Score Per Taxon (ASPT) methods [5]. Moreover, the abundance, evenness, and Shannon Weiner diversity index were calculated to assess species diversity. The formula for the Shannon diversity index is:
Shannon   Index   ( H ) = i = 1 s P i   l n P i ,
where Pi is the proportion of individuals in the ith species, and s is the number of individuals on the site.
Water physico-chemical data: All 30 sites were sampled for physico-chemical parameters. In situ measurement of dissolved oxygen (DO) and temperature was done using a HORIBA multi-meter. Total phosphorus (TP), NO3-N, PO4-P, TN, and NH4-N were measured following standard methodologies [25] at the Bureau of Water, Irrigation, and Electric (BoWIE) laboratory. XLstat 2019 was used to create box plots and tabulate means across reaches. Water quality status classification was done by physico-chemical characteristics based on chemical water quality requirements of the fishery [26,27,28]. The oxygen saturation percentage, ammonia nitrogen, and phosphate phosphorus rating were used to interpret the ecosystem health status of the Gumara River.
Fish data: Eleven sites were selected for fish sampling based on prior fishing practices and expected potential (Figure 1). A cast net with a mesh size of 8 cm with 25 m perimeter and 7.5 m length was used for the fishing. A trial of 25 times was applied in each 100 m stretch. In addition, smaller fishes or fingerlings caught during macroinvertebrate sampling with a D-frame net in unselected sites were also considered and identified. In situ identification of fish was conducted with an experienced technician from the Bahir Dar fishery research center using identification keys [29,30]. Fish abundance and the Shannon diversity index (H′) were used to estimate the diversity of fish.
Land use and land cover data: Ground truth information was collected for 7 major cover types in the Gumara basin including floodplain wetlands during the dry season in 2019. In general, a total of 2598 signatures (260 on wetland cover, 363 on vegetation (natural and plantation forest land), 909 on cultivated lands, 110 on grass land, 791 on towns and farm villages, and 165 on water bodies) were collected. Water bodies and towns were selected directly on the image displayed on the google earth engine platform. Land use and land cover between 1986 and 2020 were classified in the Google Earth engine. The random forest classification technique, which is preferable for multi-class classification [31], was used to identify land use and land cover types based on the ground truth dataset. Riparian vegetation changes were also investigated using the Normalized Difference Vegetation Index (NDVI) of different years of the study area. Based on field observation and key informant knowledge of the historical flooding extent of the river, NDVI changes at 30, 60, and 90 m in the river buffer were chosen as indicative of riparian vegetation.
Livelihoods dependent on ecosystem services: Direct observation, a survey of 40 household heads, and key informant interviews were conducted. A structured interview questionnaire was prepared to collect information on ecosystem-services-dependent livelihoods. During the direct observation, key informants were used to record local names of indigenous vegetation. The data generated from household interviews and key informants were used to identify livelihoods dependent on ecosystem services. In addition, tree species and medicinal plants were identified.

2.4. Data Analysis

Potential shifts in macroinvertebrate community composition among reaches and the relationship among ecological metrics and flow were examined using nonmetric multidimensional scaling (NMDS) with the Bray-Curtis distance to obtain the dissimilarity matrix from the matrix of macroinvertebrate family abundance [18]. NMDS was carried out using the VEGAN package in RStudio software (version 4.0.1) to find the differences across the reaches. A two-way ANOVA test, PERMANOVA, in R using the Adonis package was also carried out. Finally, the most sensitive taxa, Ephemeroptera, Plecoptera, and Trichoptera (EPT) were used to relate abundance vis a vis the water quality, hydromorphology, and flow rate in March 2016 (data extracted from Gezie [32]) and March 2020.
Establish relationships: Graphs in Excel and non-metric multi-dimensional scaling in R were used to find the relationships of the cause and response. The flow condition, hydromorphology and water quality were considered as causes. Ecological conditions of vegetation, macroinvertebrates, and fish indicator metrics were selected as responses. A conceptual framework was constructed based on cause-response relationships of flow alterations to aquatic and riparian ecology; then, to livelihoods dependent on ecosystem services identified in the Gumara river basin.

3. Results and Discussion

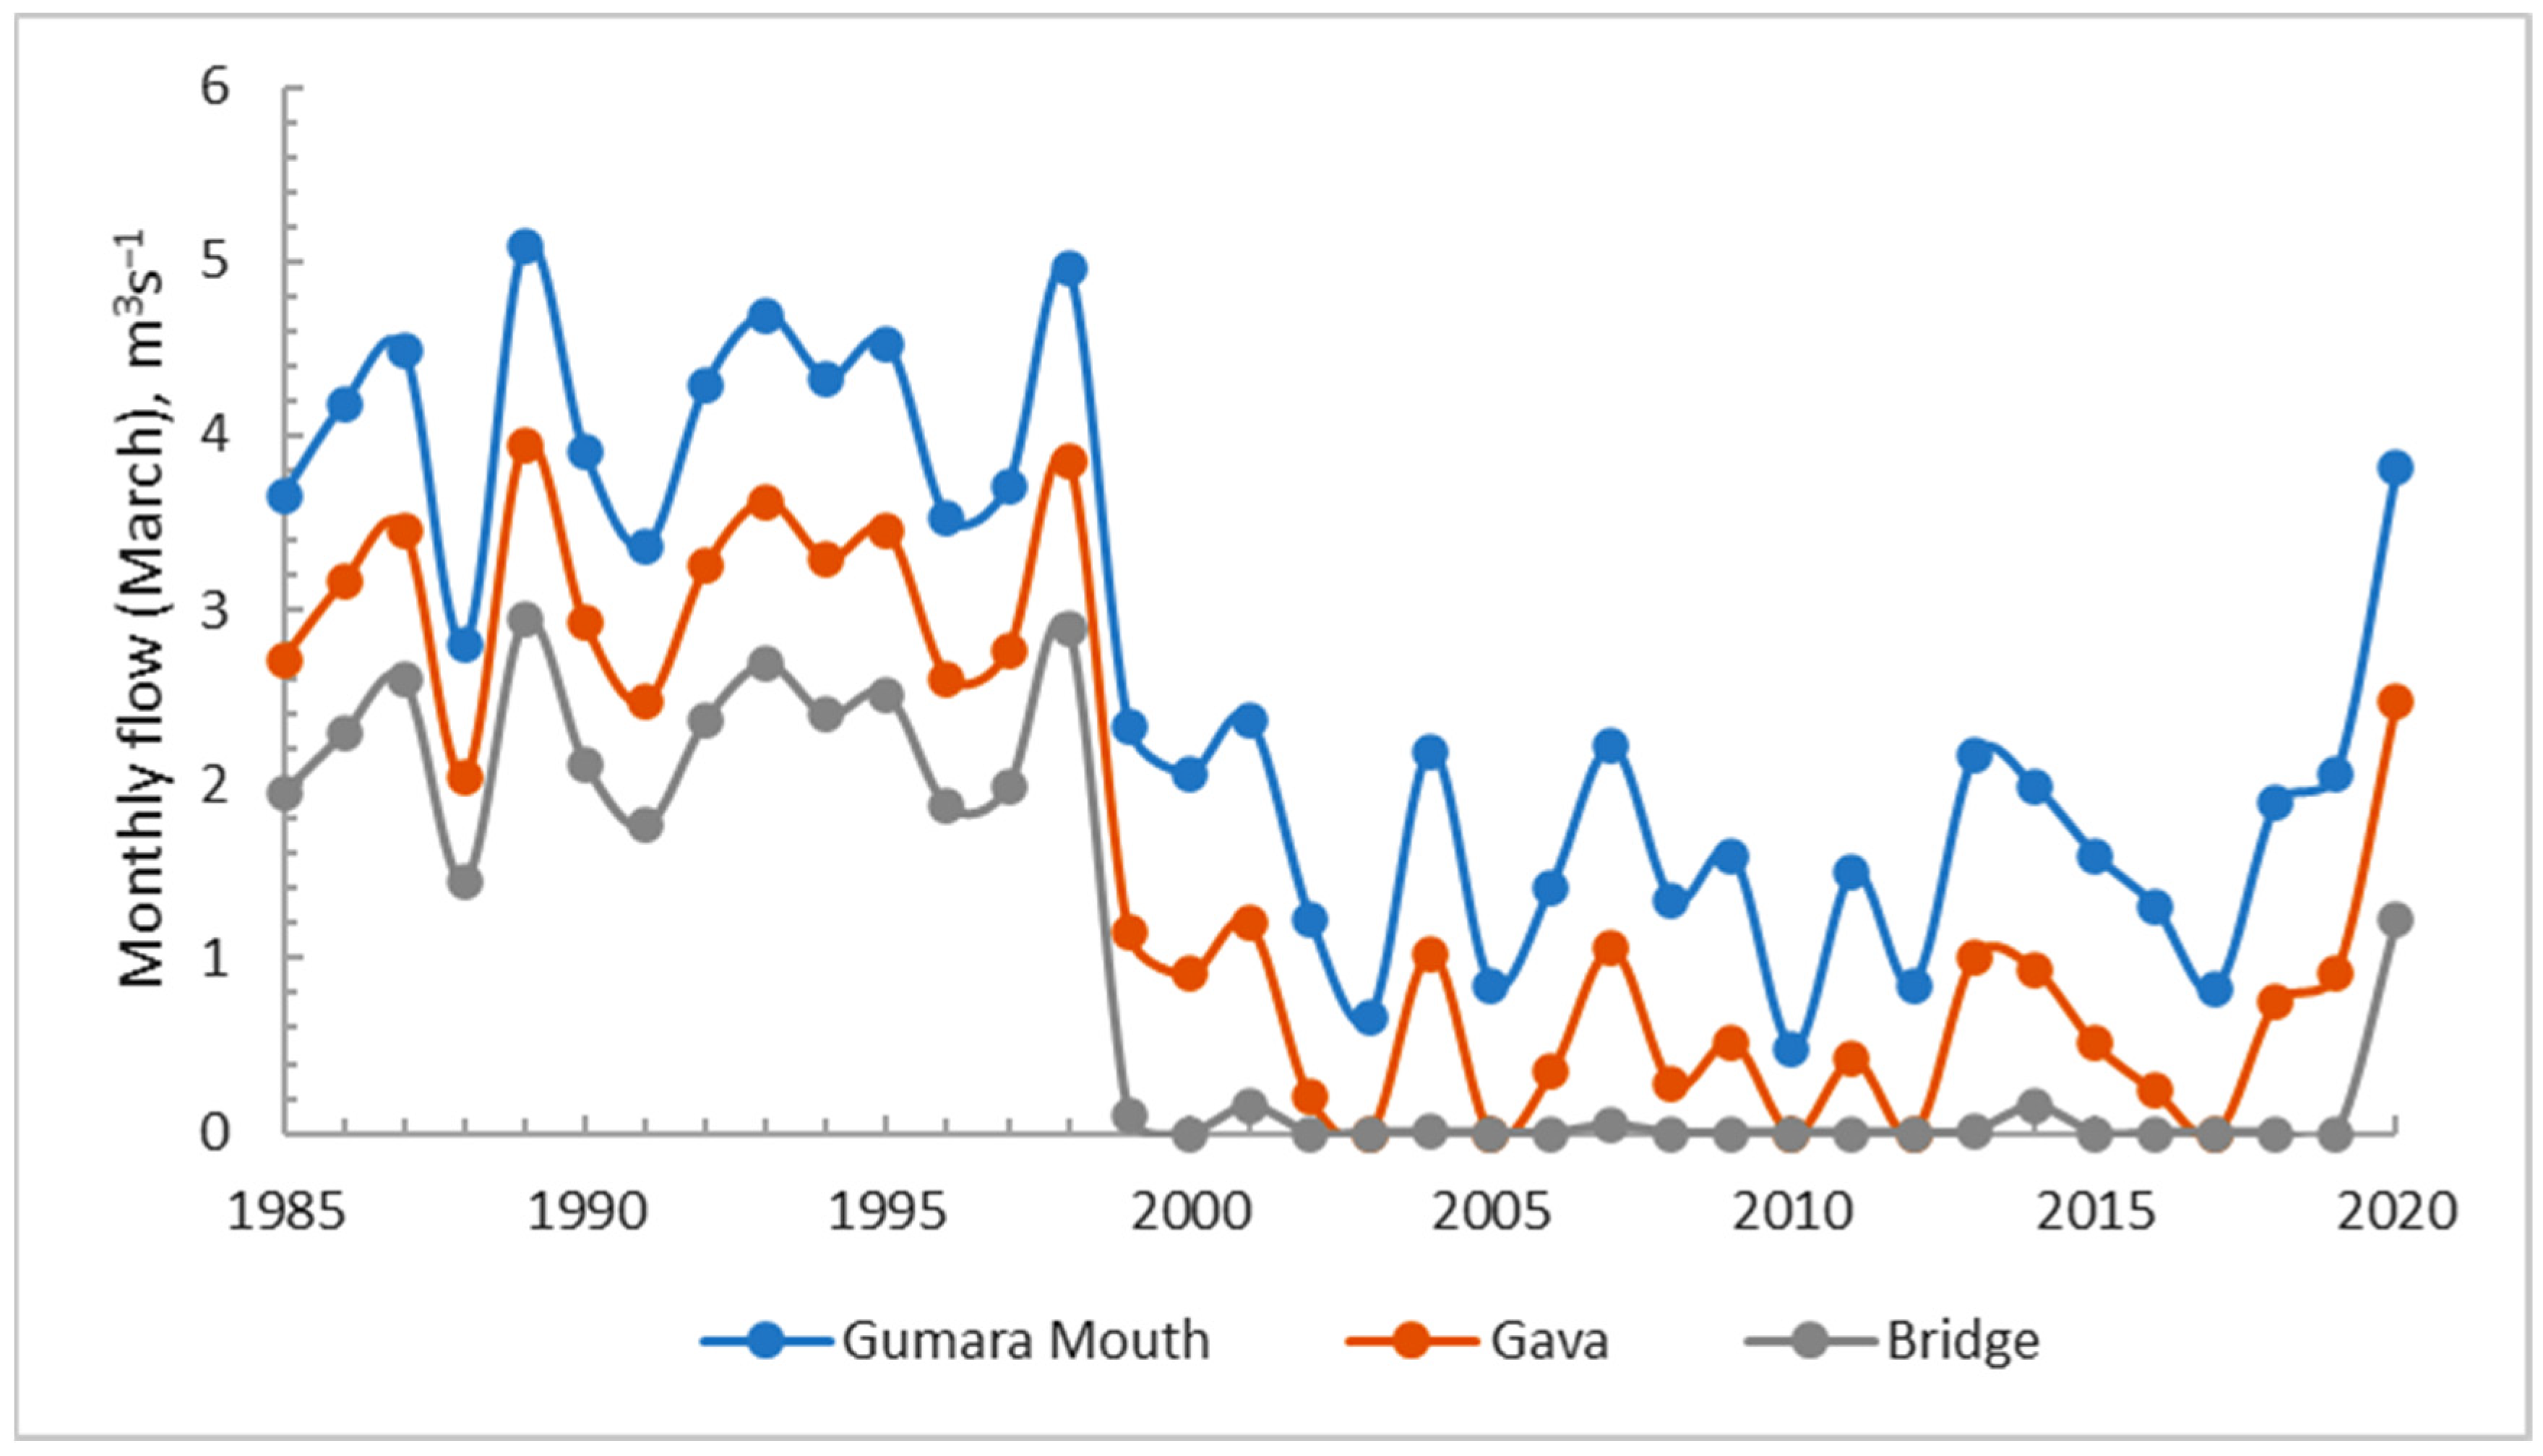
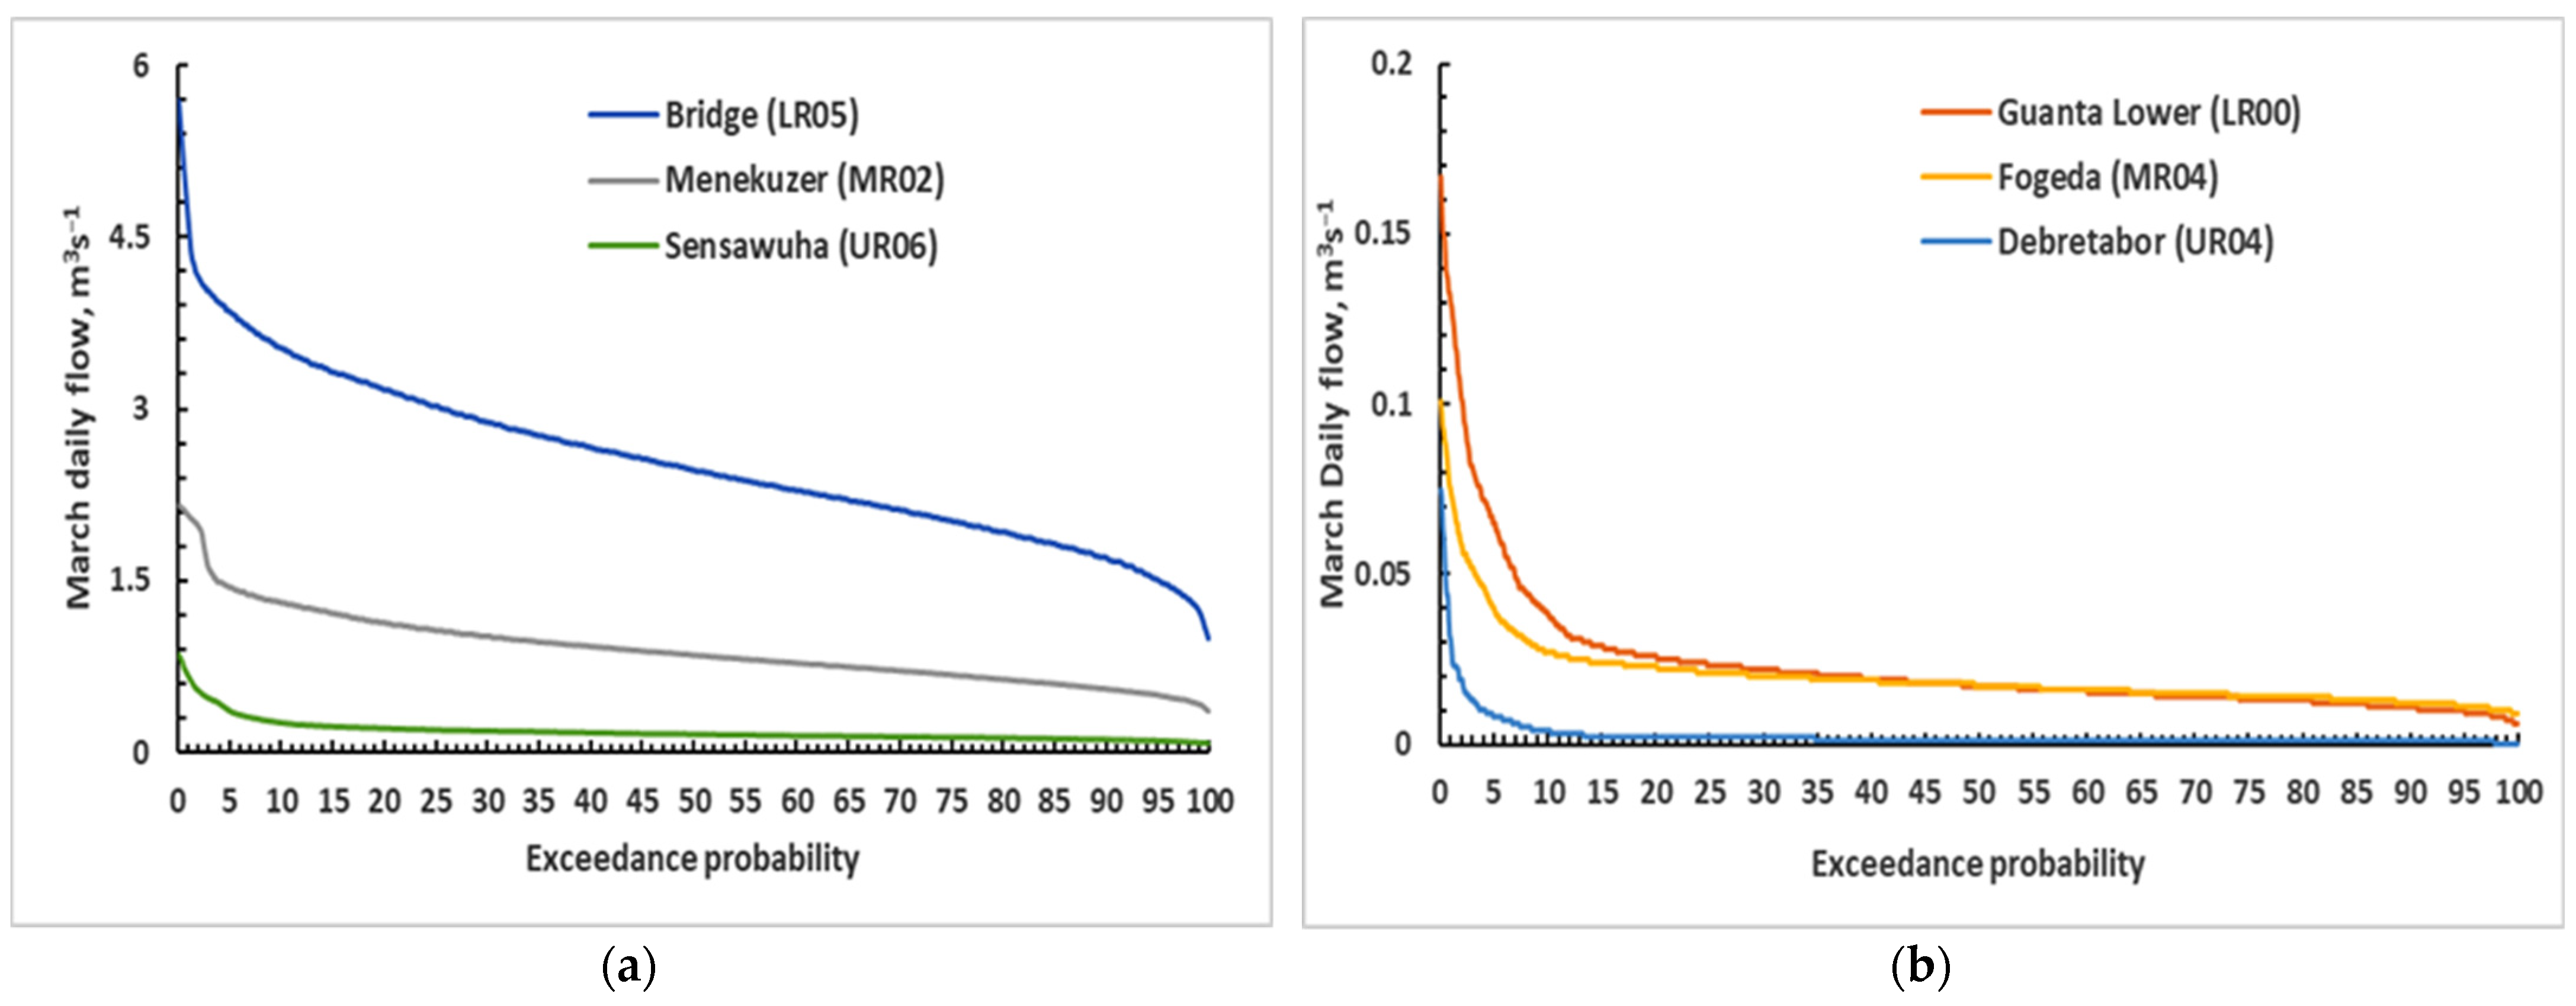
3.1. Monthly Flow and Flow Duration Curves

To understand flow alteration and consequent impacts on ecological conditions, the natural river discharge was estimated and the flow duration curve developed using the SWAT model. The model showed a calibration performance of R2 0.69 and NSE 0.54 and validation performance of R2 0.71 and NSE 0.64, which is rated as “satisfactory” performance according to Moriasi [33]. The historical flow of the month of March between 1985 and 2020 was analyzed where the ecological data were sampled. The monthly flow of March showed a decreasing trend, where there is an abrupt decrease after 1998. The modelled flow at the Gumara mouth (LR09) decreased at a rate of 0.09 m3 s−1 with R2 0.50, the modelled flow at Gava (LR12) decreased at a rate of 0.09 m3 s−1 with R2 0.53, and the simulated flow at the Bridge (LR05) decreased at a rate of 0.08 m3 s−1 with R2 0.59 (Figure 2).
Flow duration curves for sampling sites in the lower, middle, and upper reaches showed that most of the lower-order sites in all reaches have little or no flow above 80% exceedance probability in March during all years (Figure 3). In March 2016, when the first sampling was performed, flow in 93% of the reaches was extremely low when compared to the 80% exceedance probability flow (Q80), whereas in 2020, all sites were at moderate/high flow conditions compared to Q80. Hence, the two sampling periods were in a bad/dry year in 2016 and good/wet year in 2020 in terms of the flow inter-annual behavior (Table S3).

3.2. Ecosystem Health Status

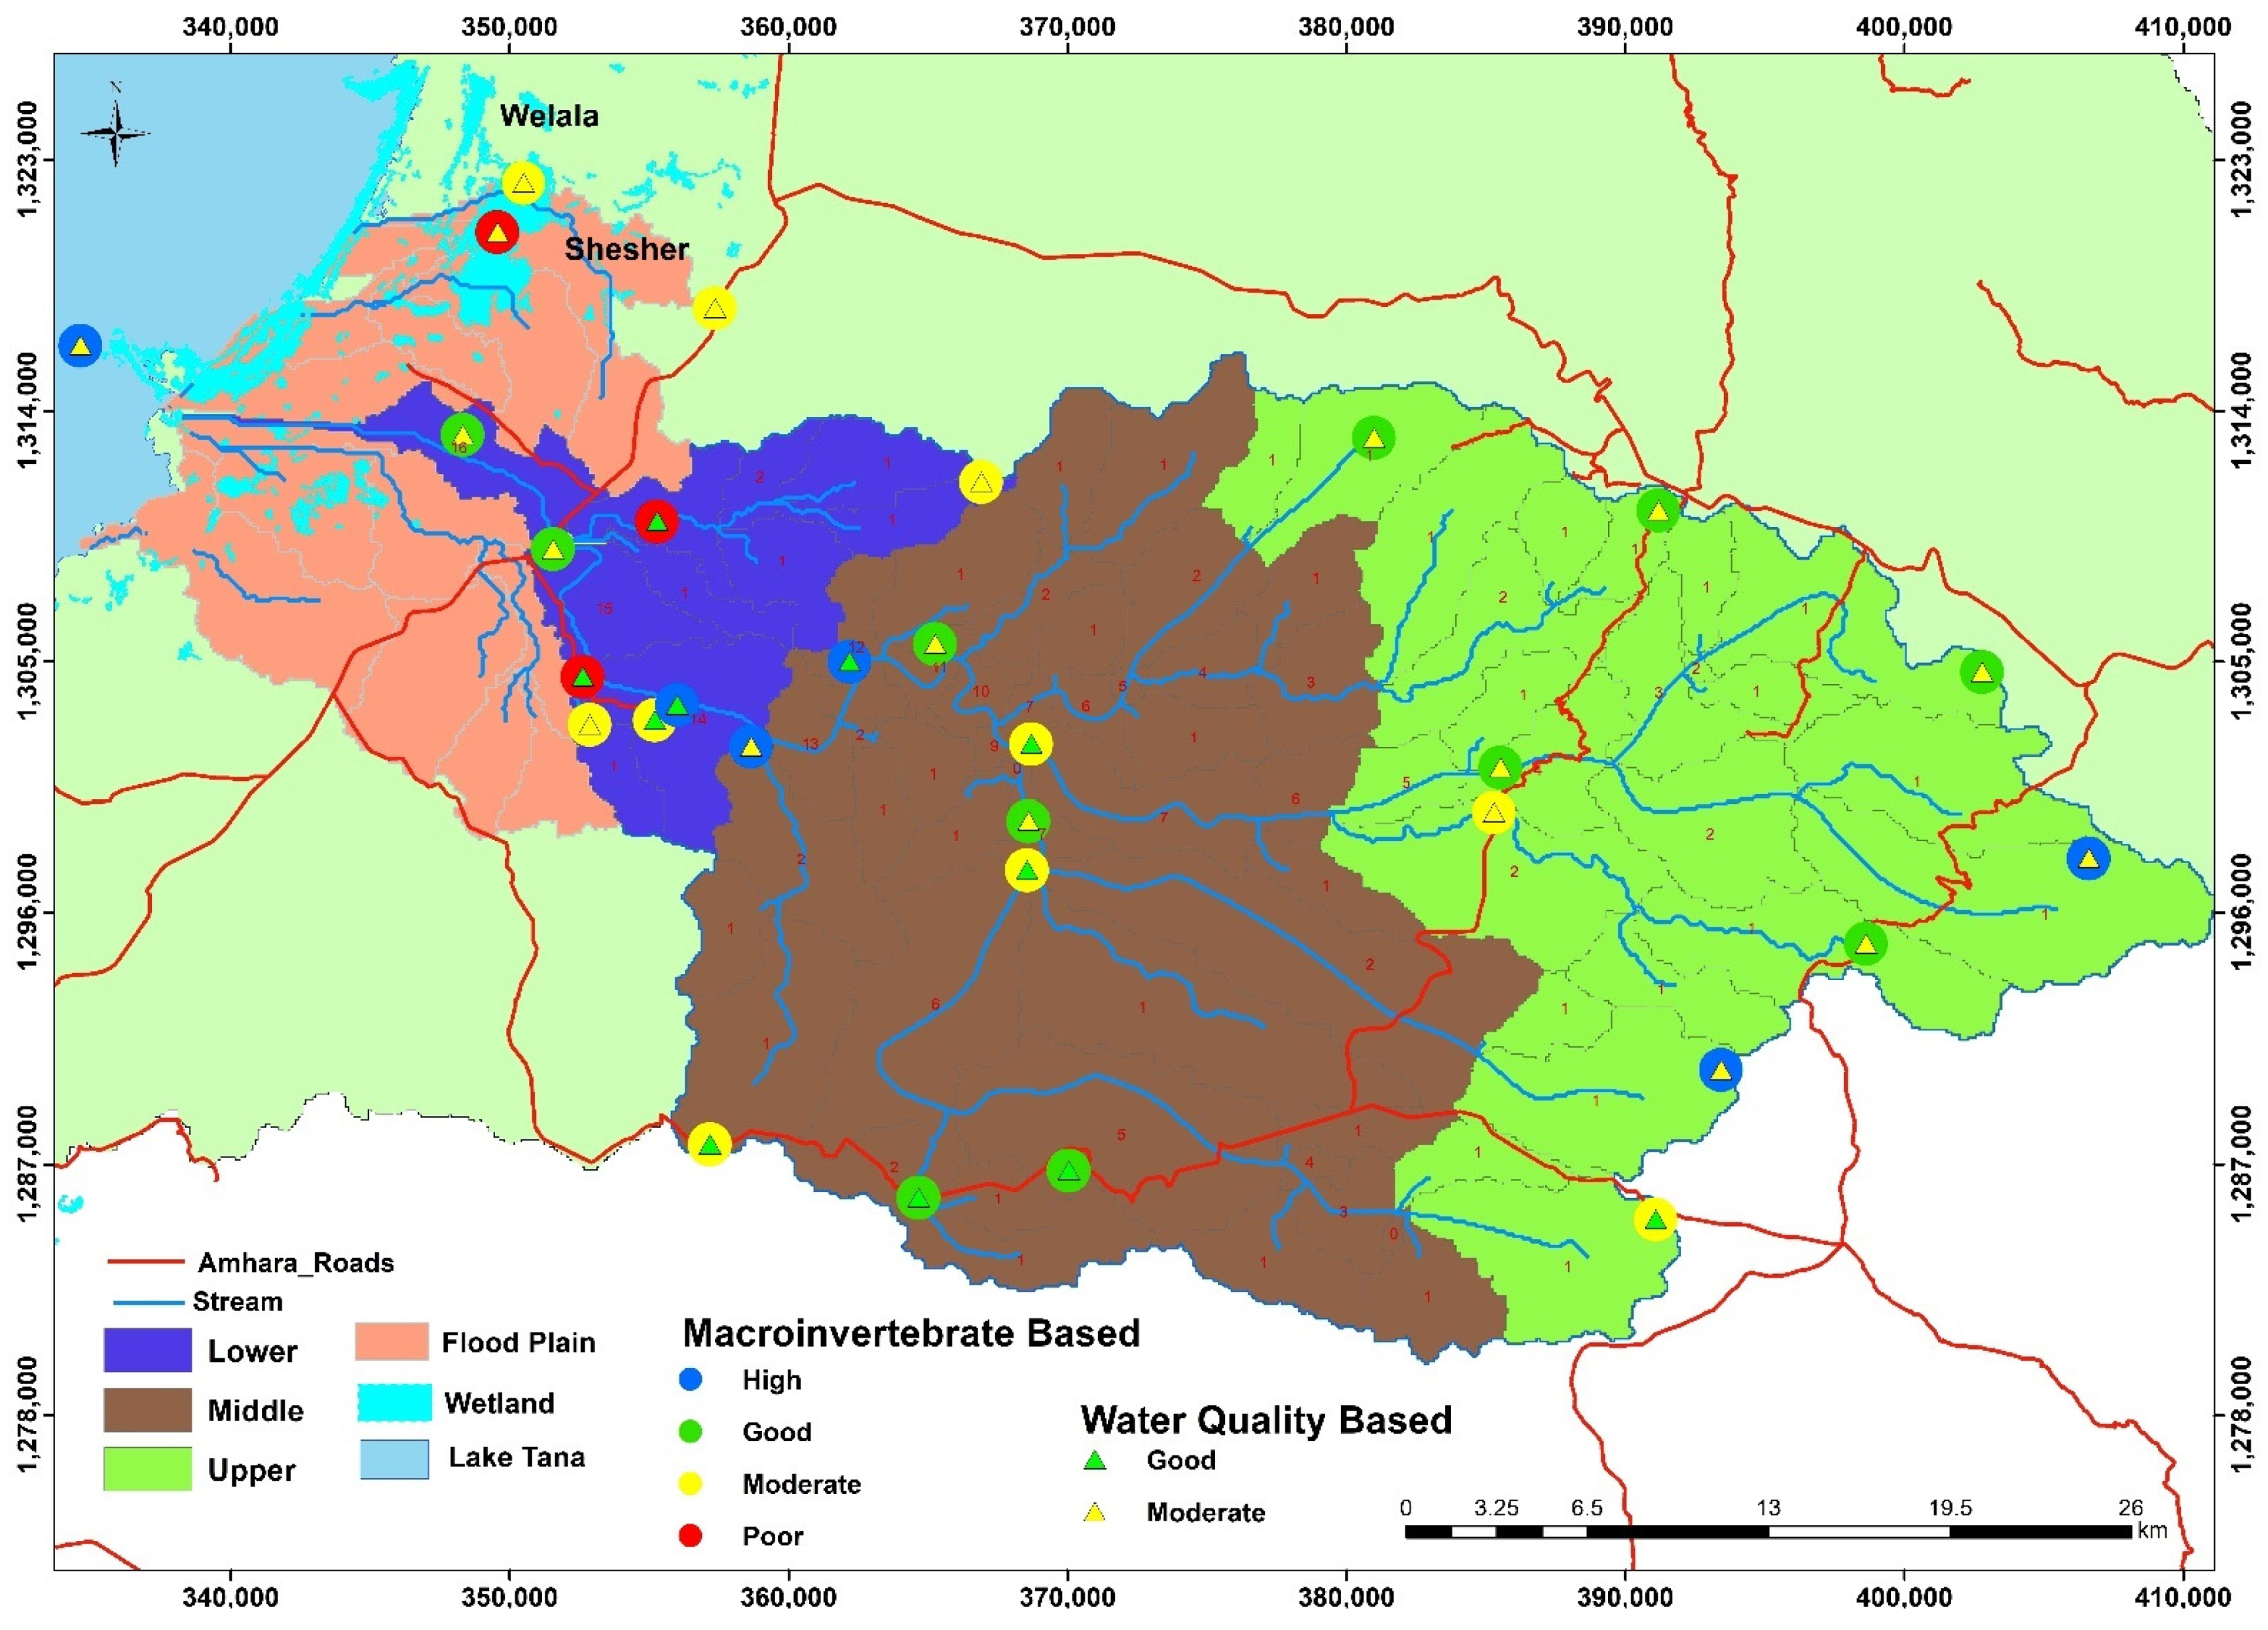
3.2.1. Water Quality-Based Ecosystem Health Status

The dissolved oxygen (DO) concentrations showed a downward trend from upstream to downstream (Table 1 and Table S4). DO was very high in almost all sites, indicating lower water quality because of higher water temperature and abundant macrophytes (producing oxygen). Ammonium-nitrogen was high in the lower reach and phosphate-phosphorus was high in the upper reach, with mean values of 0.35 mg/L and 0.65 mg/L, respectively (Table 1 and Table S4). Water quality evaluation based on the combined effect of DO, PO4-P, and NH4-N classified most of the sites in Gumara River in moderate water quality status with doubtful pollution status (Figure 4 and Table S5).

3.2.2. Macroinvertebrate-Based Ecosystem Health Status

Analysis of ecosystem health based on ETHBios macro-invertebrate scoring revealed that most of the middle and lower reaches were in a moderate water quality state with significant ecological disturbance, whereas the upper reach was of good water quality with slight ecological degradation (mean score of 5.6) during March 2020 (Table S7). Three sites, LR00, LR01, and LR07, in the lower reach were in a poor water quality state including the Shesher wetland with average ETHBios scores of 3.7, 3.7, and 3.0, respectively. Most of the sites in the upper reach were in a moderate to high water quality state, ranging from 4.1 at UR08 (Shimagle Giorgis) to 7 at UR07 (Kosterwuha). Water quality was compromised in all the reaches because the site is either close to the road, there was cattle interference (cow dung), it is downstream of towns with poor sanitation and vegetation cover (e.g., Woreta town, LR08) and/or close to clothes-washing sites (Figure 4 and Table S5).

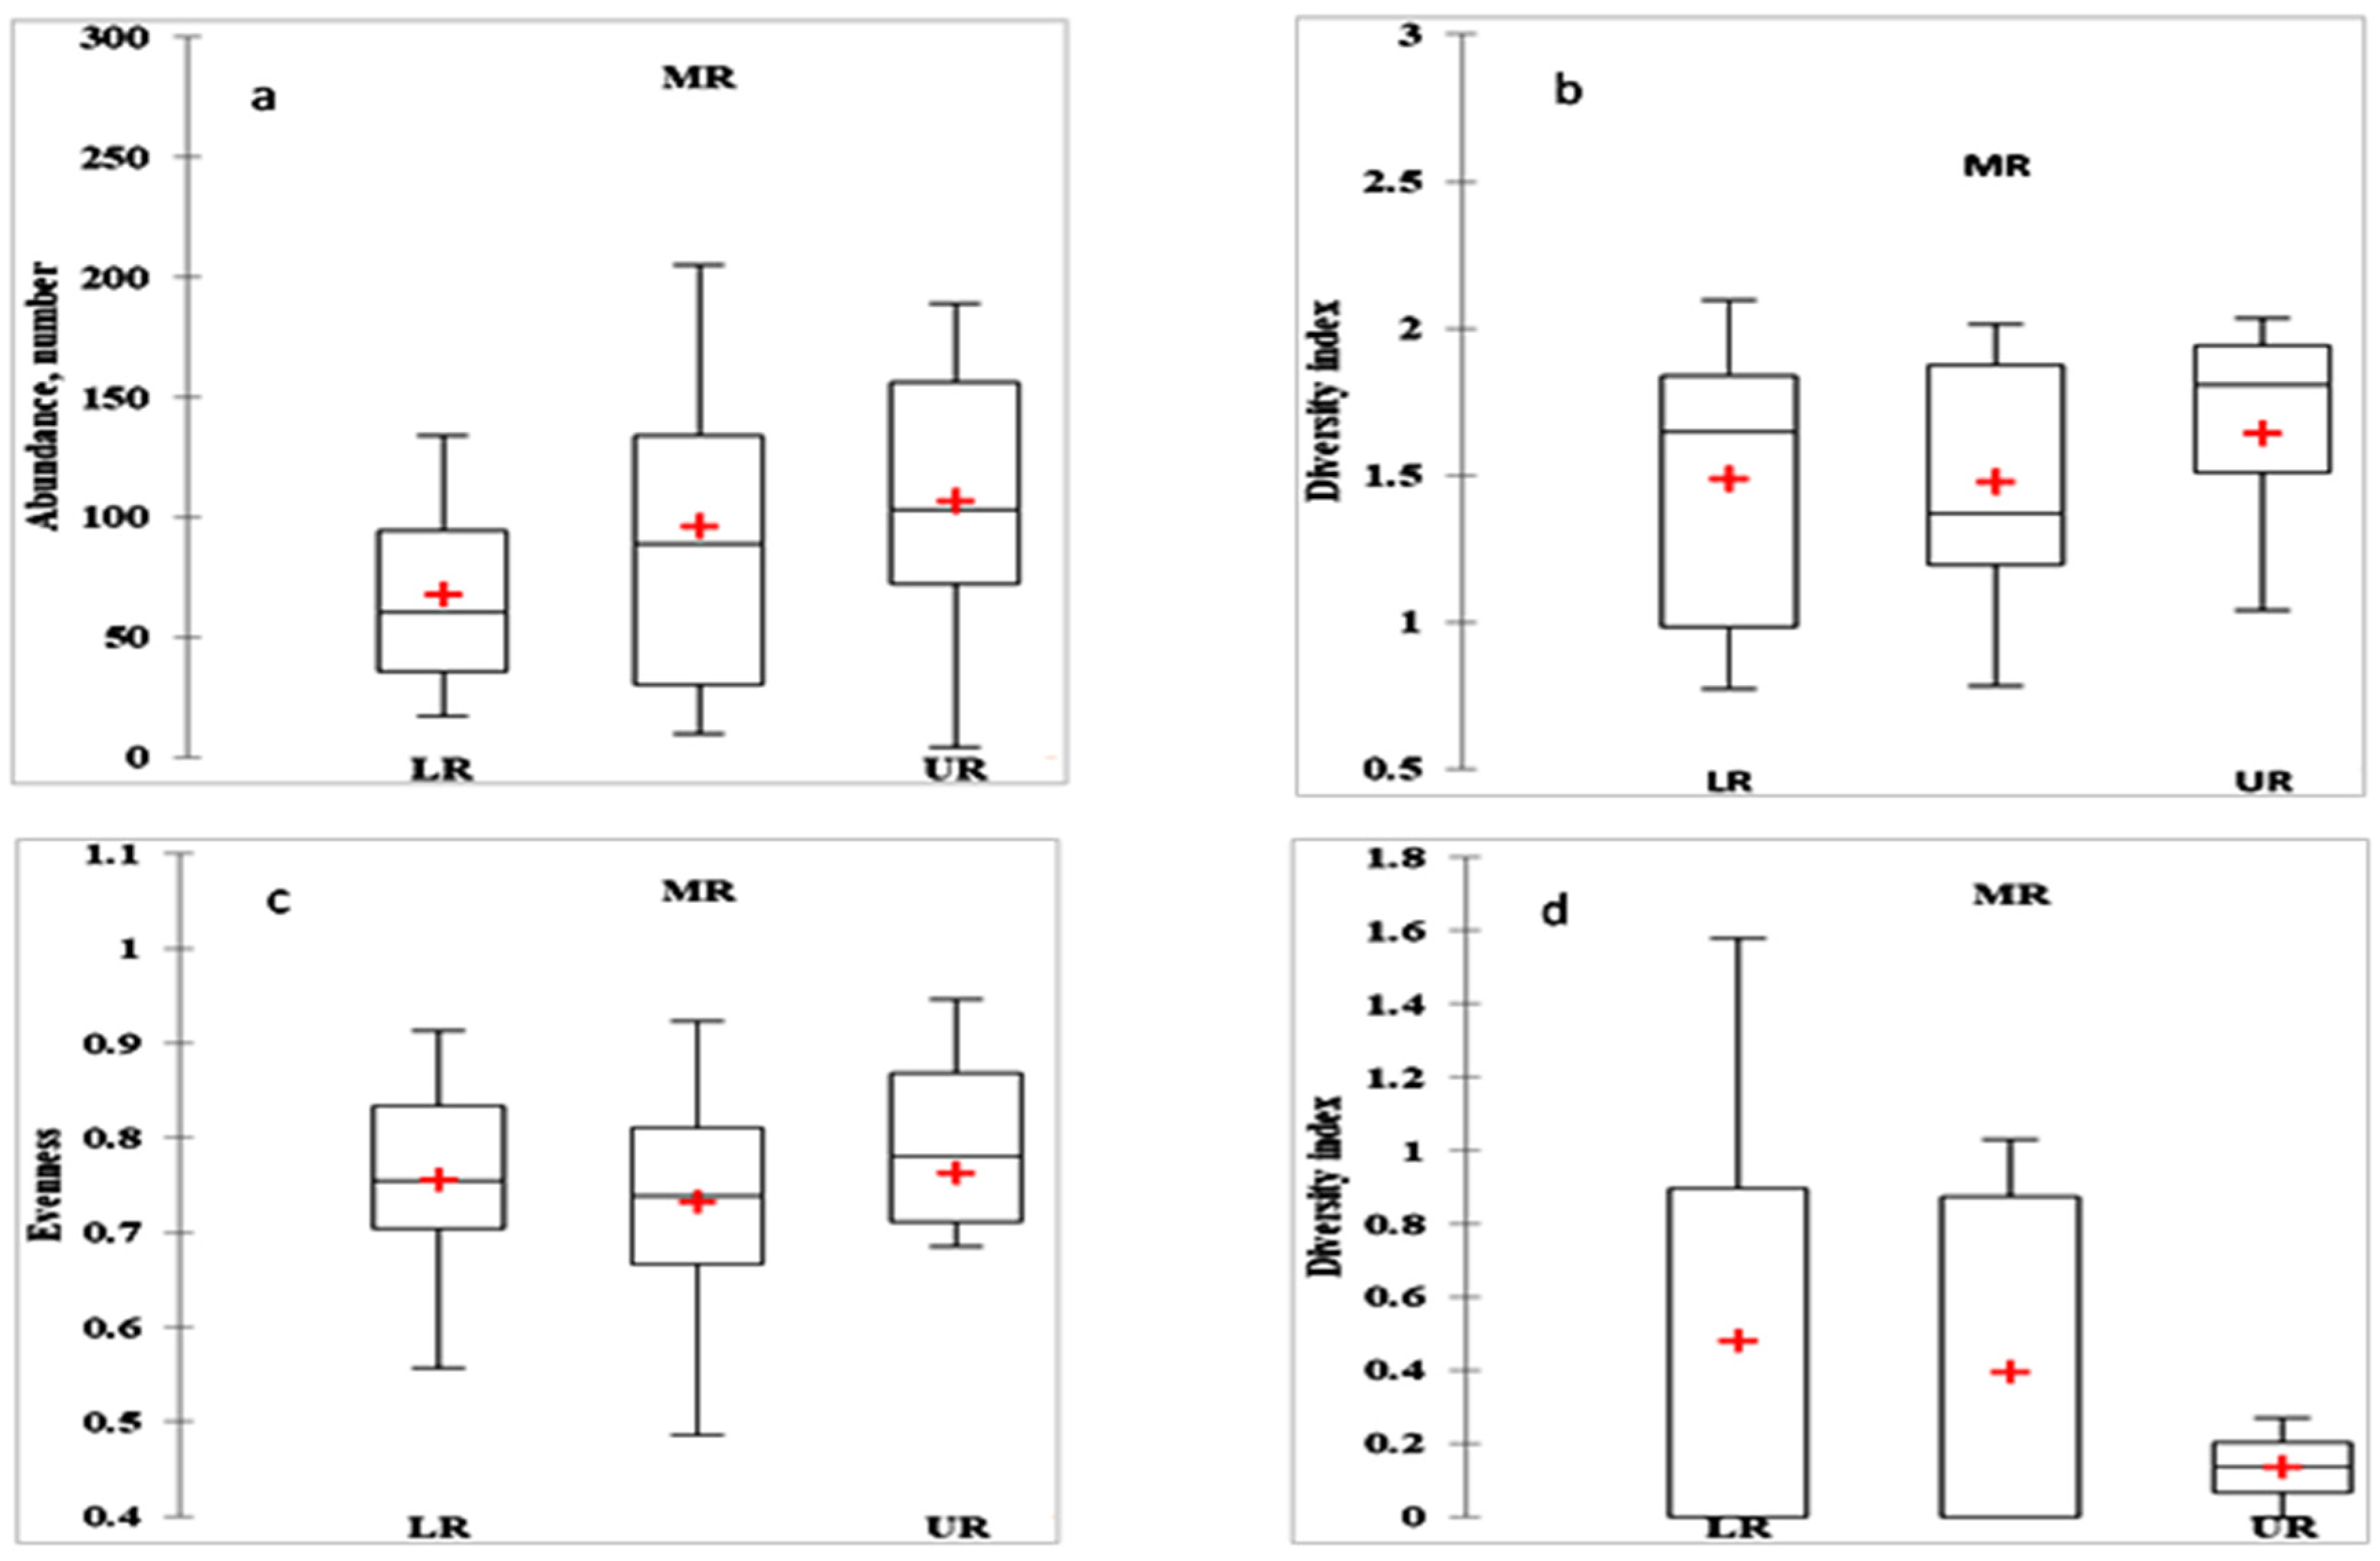
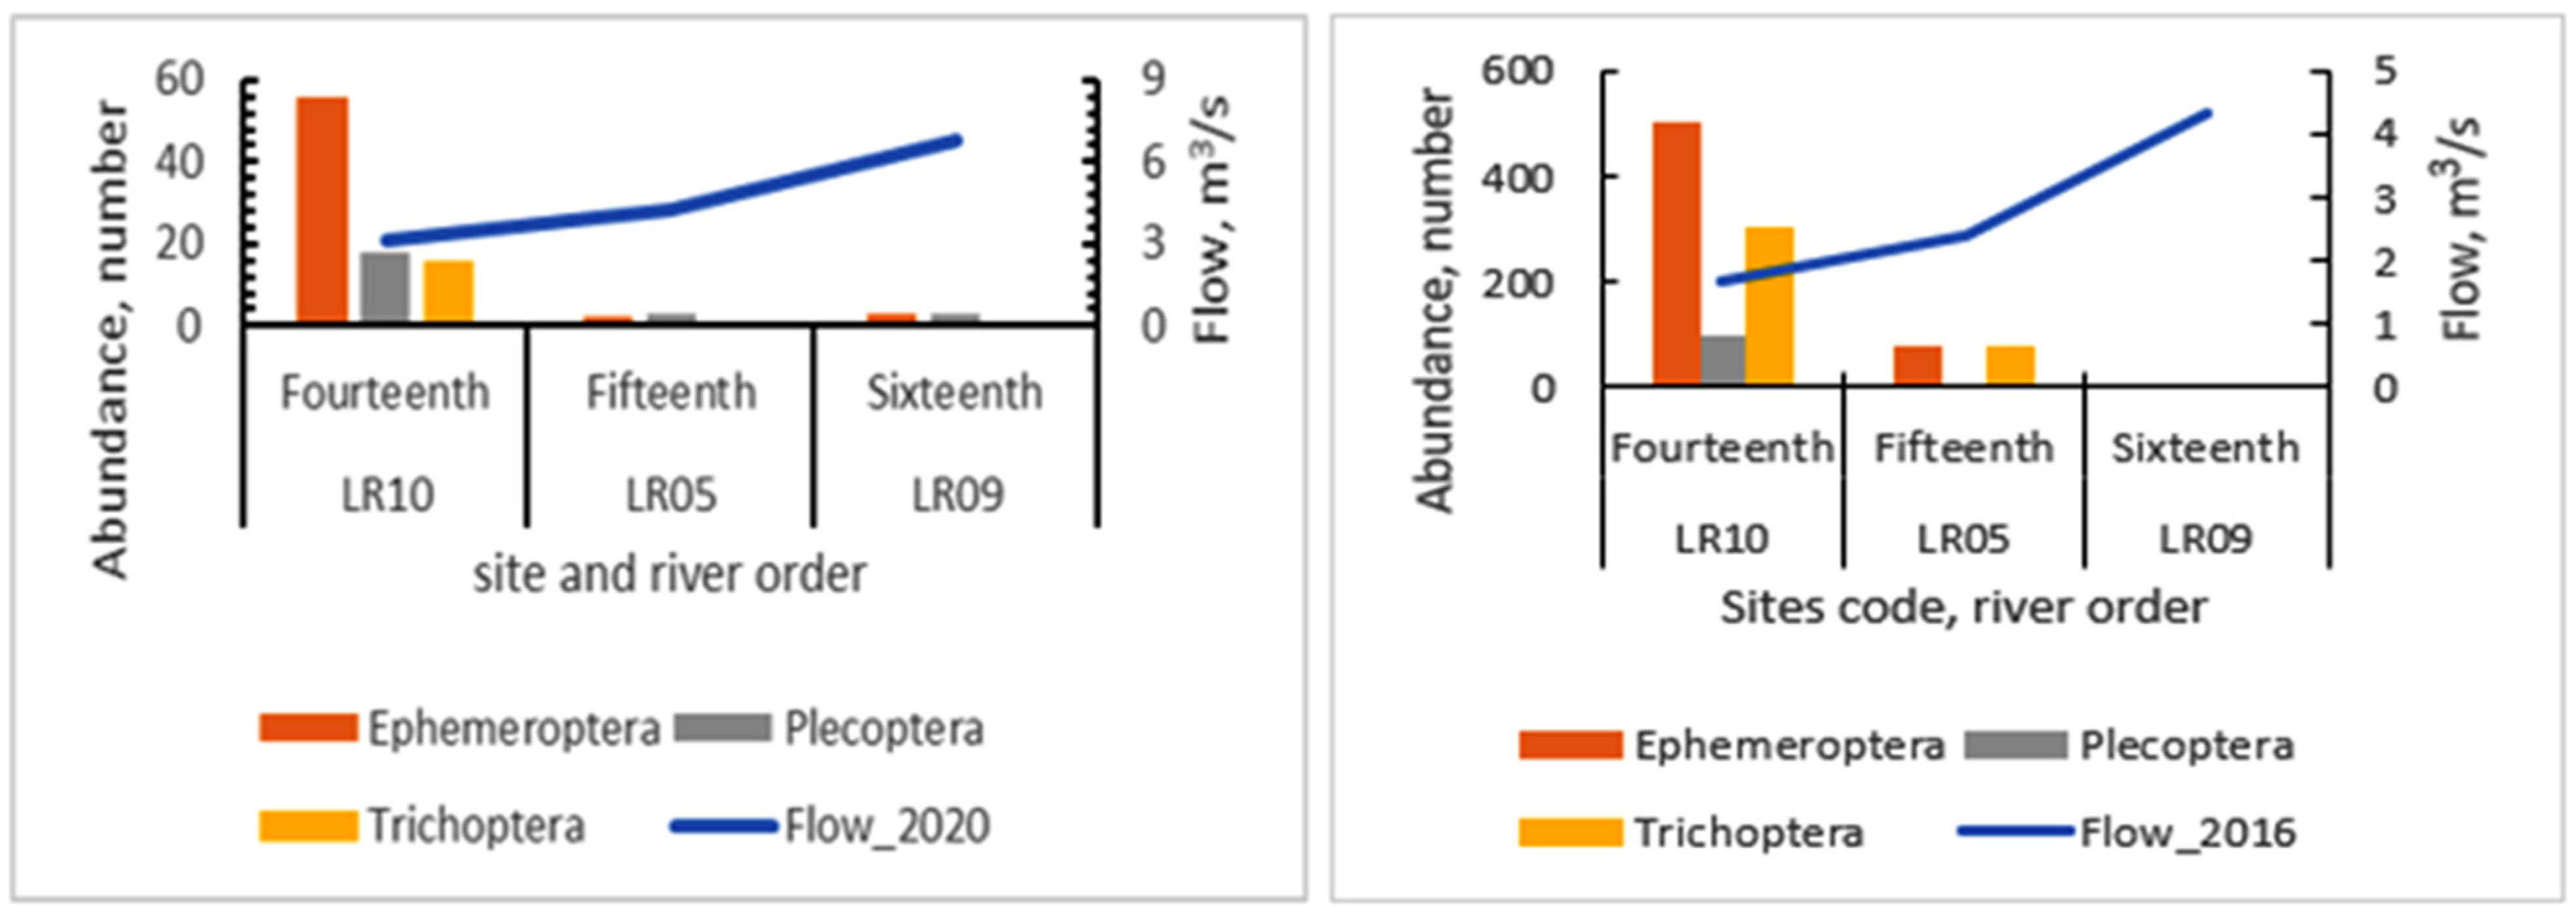
3.3. Macroinvertebrate and Fish Abundance and Biodiversity

Macroinvertebrate abundance and biodiversity: A total of 2643 individual aquatic macroinvertebrates belonging to 43 families and 13 orders were sampled and identified from 30 sampling sites during the study period (Table S4 and Figures S1–S3). The highest abundance was observed in the upper reach and lowest in the lower reach with mean values of 107 and 68, respectively (Figure 5a). Similarly, the diversity index was a bit higher in the upper reach and lower in the middle reach, with values of 1.6, 1.5, and 1.5, respectively. Diversity values ranged from a minimum of 0.77 at Shesher 01 wetland to a maximum of 2.1 at Gava. By comparison, the maximum diversity index for the Lake Tana is 2.64 (Figure S4). Generally, the index varies between 1.5 and 3.5 and rarely exceeds 4.5 [34], where the Gumara showed lesser diversity indicating riparian ecosystem degradation. The evenness was almost equal across the reaches with 0.8 value for the lower and upper reaches and 0.7 for the middle reach, which showed a similar population size in all the sites (Figure 5c).
Fish abundance and biodiversity: Nine fish species from five genera within three families were found (Figures S5 and S6). Fish diversity in the lower reach was found to be higher, the middle reach moderate, and the upper lowest, with 0.5, 0.4, and 0 mean values, respectively (Figure 5d). The highest fish diversity index (1.58) was recorded at Wanzaye LR10 (Table S8), which covered 48% of the maximum diversity index (3.29) for 27 fish species available in the Lake Tana sub-basin. The upper reach sites had no or only one species, such as the smaller barbs of L. Pleurogramma, L. humilis, and Garra, which are prey for larger barbs (Table S8). The fish diversity was lower or decreasing as a whole as compared to previous years’ studies [19,35,36]. Shesher wetland, the largest wetland in the flood plain, was found to be nil in fish catches. This was mainly attributed to drainage and extensive agricultural encroachment. A similar study on Lake Tana wetlands revealed the same result, especially in Shesher wetland, having higher human disturbance as compared to other wetlands [17] and internationally [37].

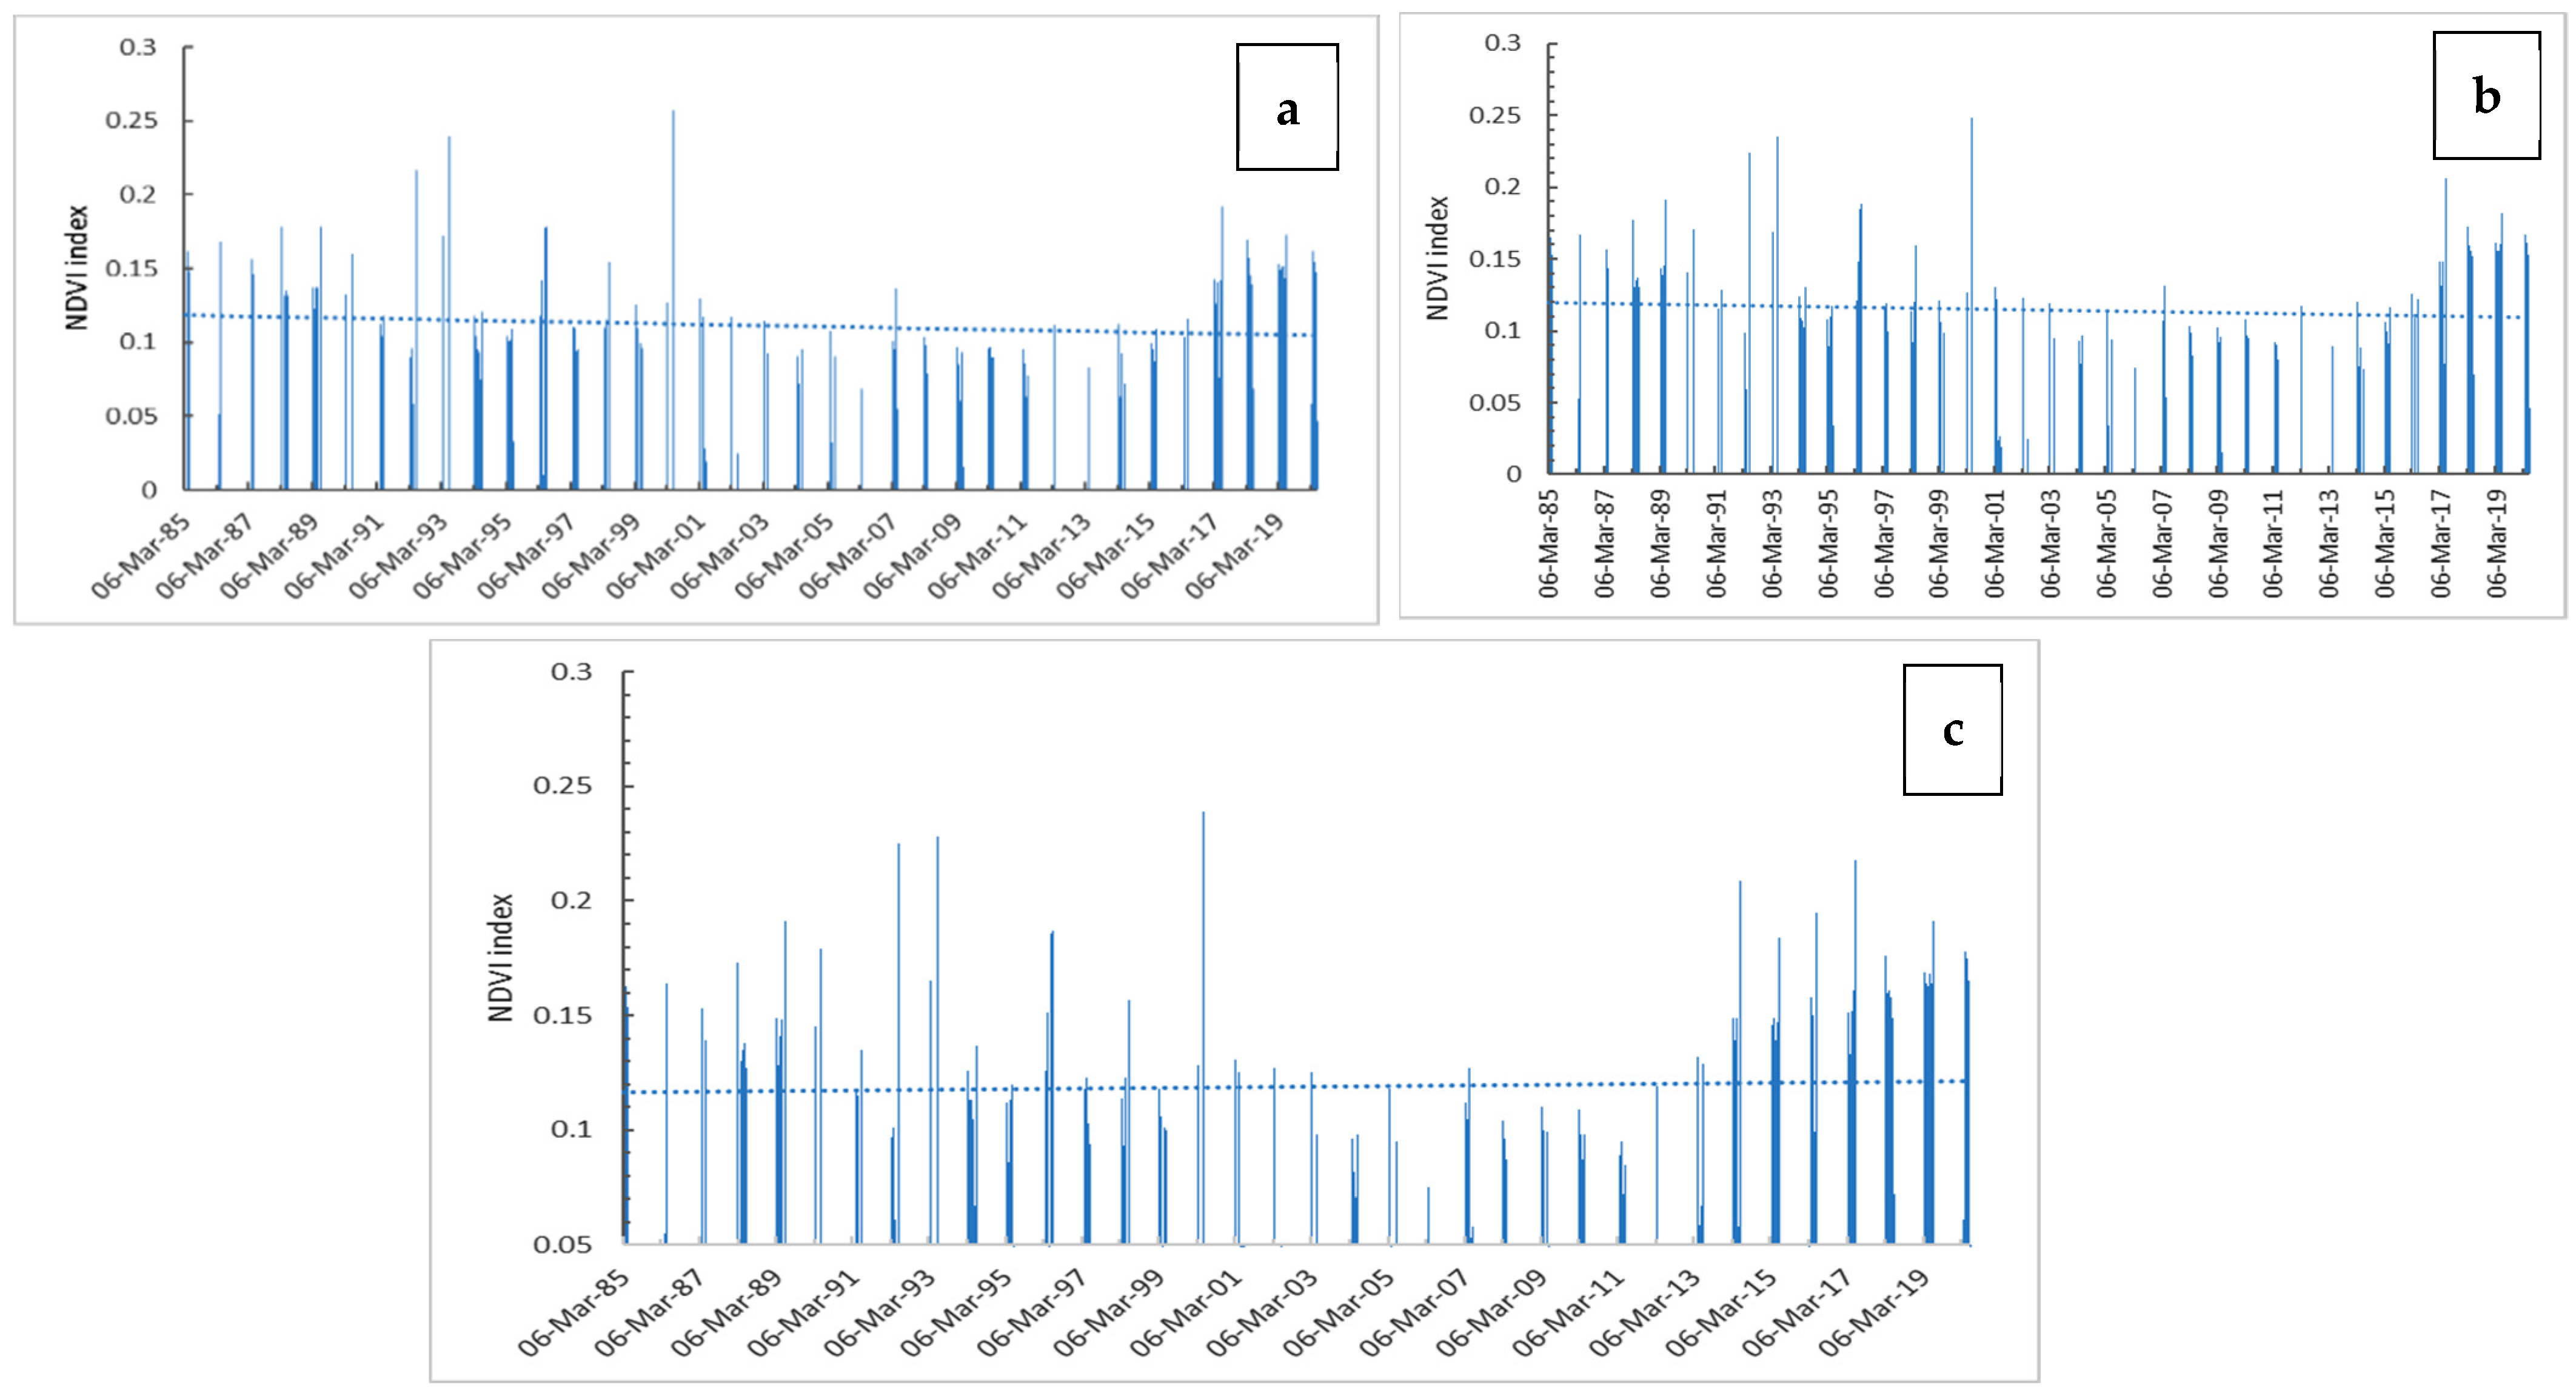
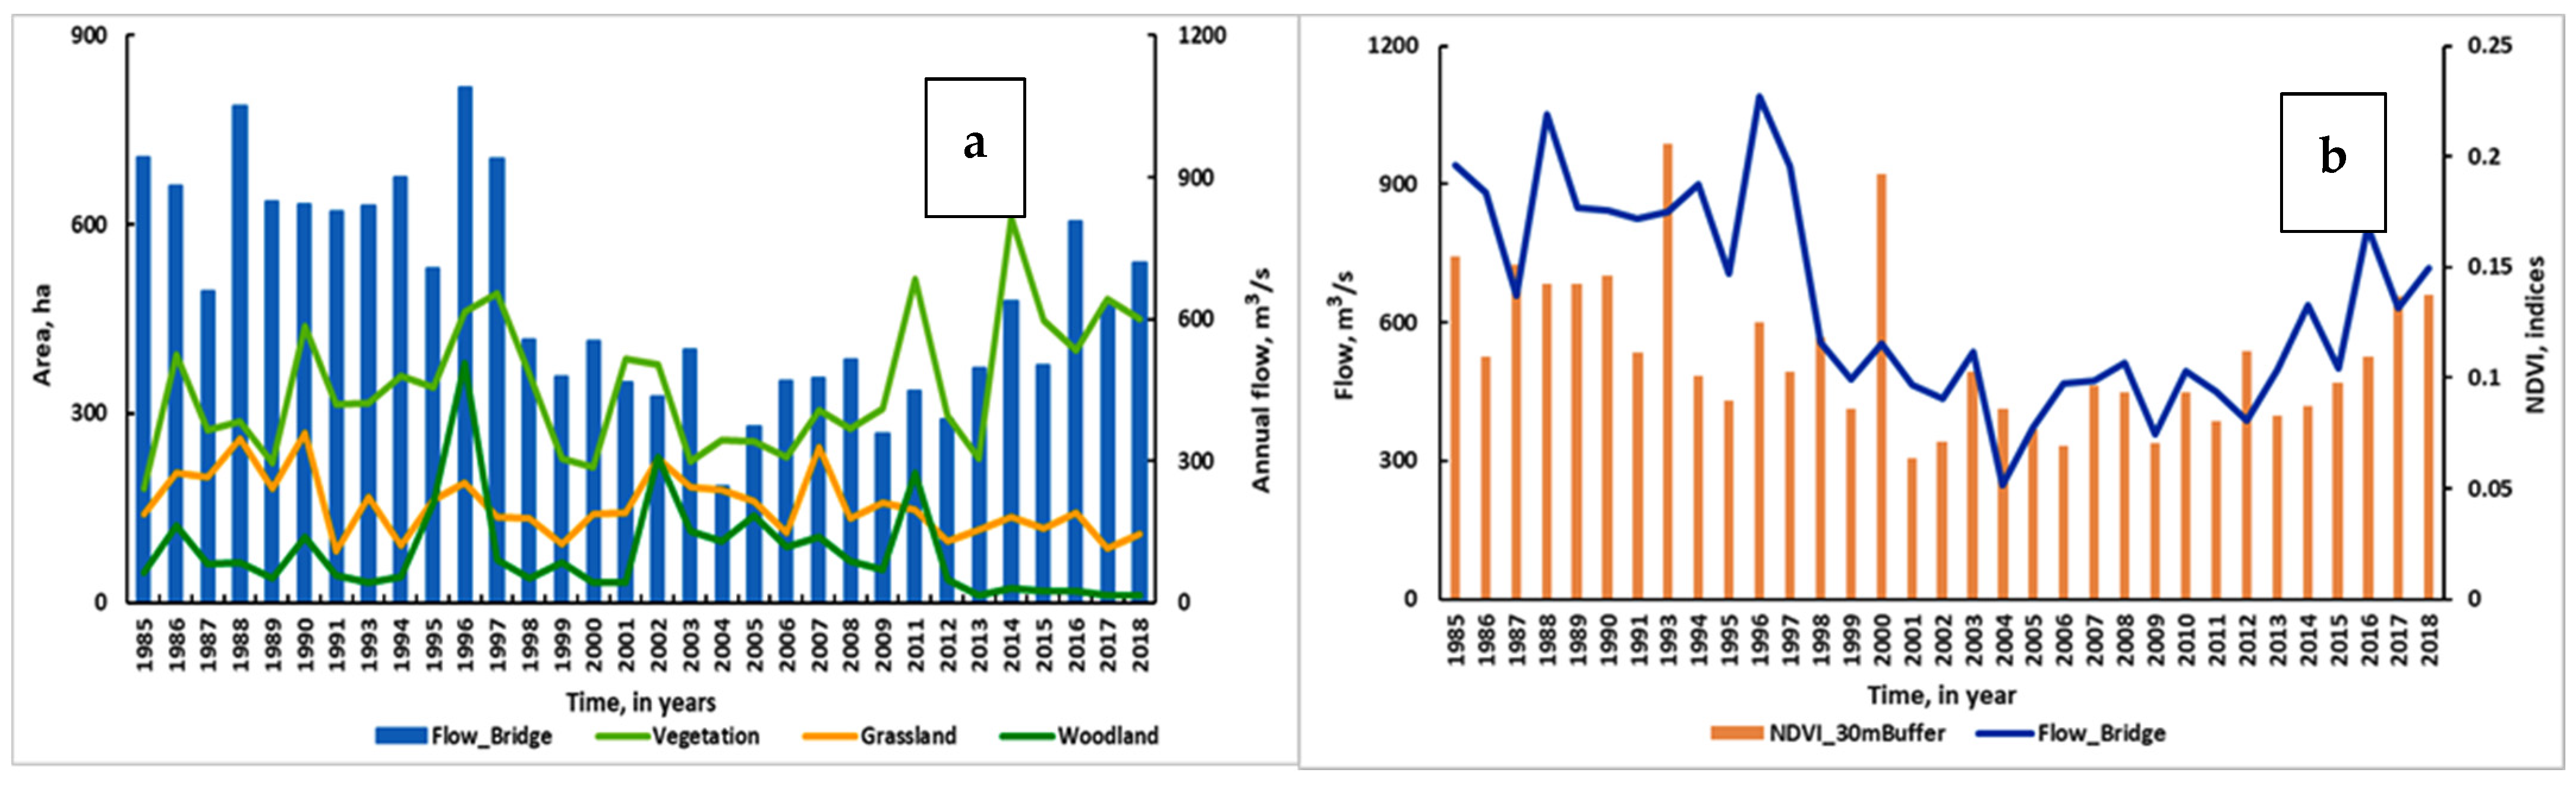
3.4. Vegetation Change

The normalized difference vegetation index for the dry season (March to May) depicted an overall decrease between 1985–2020 for a buffer distance of 30 m and 60 m from the river, but not 90 m (Figure 6). The decline in NDVI values close to zero for the 30 m and 60 m buffer distance showed degradation of riparian vegetation and its transformation to bare land and degraded grassland. Riparian vegetation is crucial for fish because it influences light, water temperature, shelter, and availability of food for macroinvertebrates [38,39,40]. Thus, it can be deduced that the decline in riparian vegetation in the Gumara basin has led to the decline of macroinvertebrate and fish diversity. This is confirmed by recent studies in the Lake Tana sub-basin [13,15,41], whereas increasing the 90 m buffer distance of NDVI showed an increase in eucalyptus plantations in the Gumara watershed, especially in recent years [16]. Because of its biological behavior, eucalyptus consumes a lot of water per annum and causes higher groundwater suction during the dry season, tending to decrease the baseflow in the river apart from water pumping for irrigation in the lower reaches [42,43,44,45,46]. Hence, it showed that there is a delay in a high flow pulse during the rainy season until the saturation zones get filled upstream where the major fish migration period occurred from Lake Tana to floodplain wetlands [16]. This severely impairs reproduction and growth of juveniles of the unique Labeobarbus species inhabiting Lake Tana [15,16,37].

3.5. Ecosystem-Services-Dependent Livelihoods

The Gumara River and associated wetlands of Lake Tana render several ecosystem services for the riparian communities, as well as for the region as a whole. Household interview results indicate that the key ecosystem services include drinking water for humans and livestock, forage for livestock, fishing, papyrus cutting for household utensils, souvenir- and canoe-making, fuel wood, medicinal plants, beekeeping, water for irrigation, water for nurseries, tourism like bird- and hippo-watching, clothes-washing, and swimming, sand mining, hot springs for holy-water medication, and research and education. In this study, fish and vegetation were chosen as endpoints for our livelihood and ecological study, where fish are a source of food and income and vegetation are a source of fuelwood and medicinal plants (Tables S9 and S10).

3.5.1. Riparian Indigenous Tree Species

Based on direct field observation and household surveys of the local community, we found 39 large tree species along the Gumara river, of which three are exotic, that is, Eucalyptus camaldulensis, and E. globulus, and Acacia decurrens (Table S9). Four of the tree species are unknown in the literature for their scientific names. The natural forest inventoried in this survey are remnants, but the exotic tree species are being expanded through planting by the government’s agricultural/forestry extension system. As informed from the household survey, these tree species are used by the local community for fuelwood, construction, furniture, and ploughing tools. Hence, the riparian vegetation cover is taken as one objective for ecosystem-services-dependent livelihoods.

3.5.2. Riparian Herbaceous Medicinal Plants

Twenty-five medicinal (herbaceous/grass/sedge) plants were identified in the Gumara riparian area and associated wetlands (Tables S7 and S8). These plants are being used for medication of both humans and animals. These medicinal plants are disappearing, and can be found in fewer places nowadays, as informed by the interviewed riparian community. This is in line with previous studies in the Gumara-connected wetlands [17]. The degradation is potentially due to less flooding and drying out of the river during the rainy season and dry season, respectively [16].

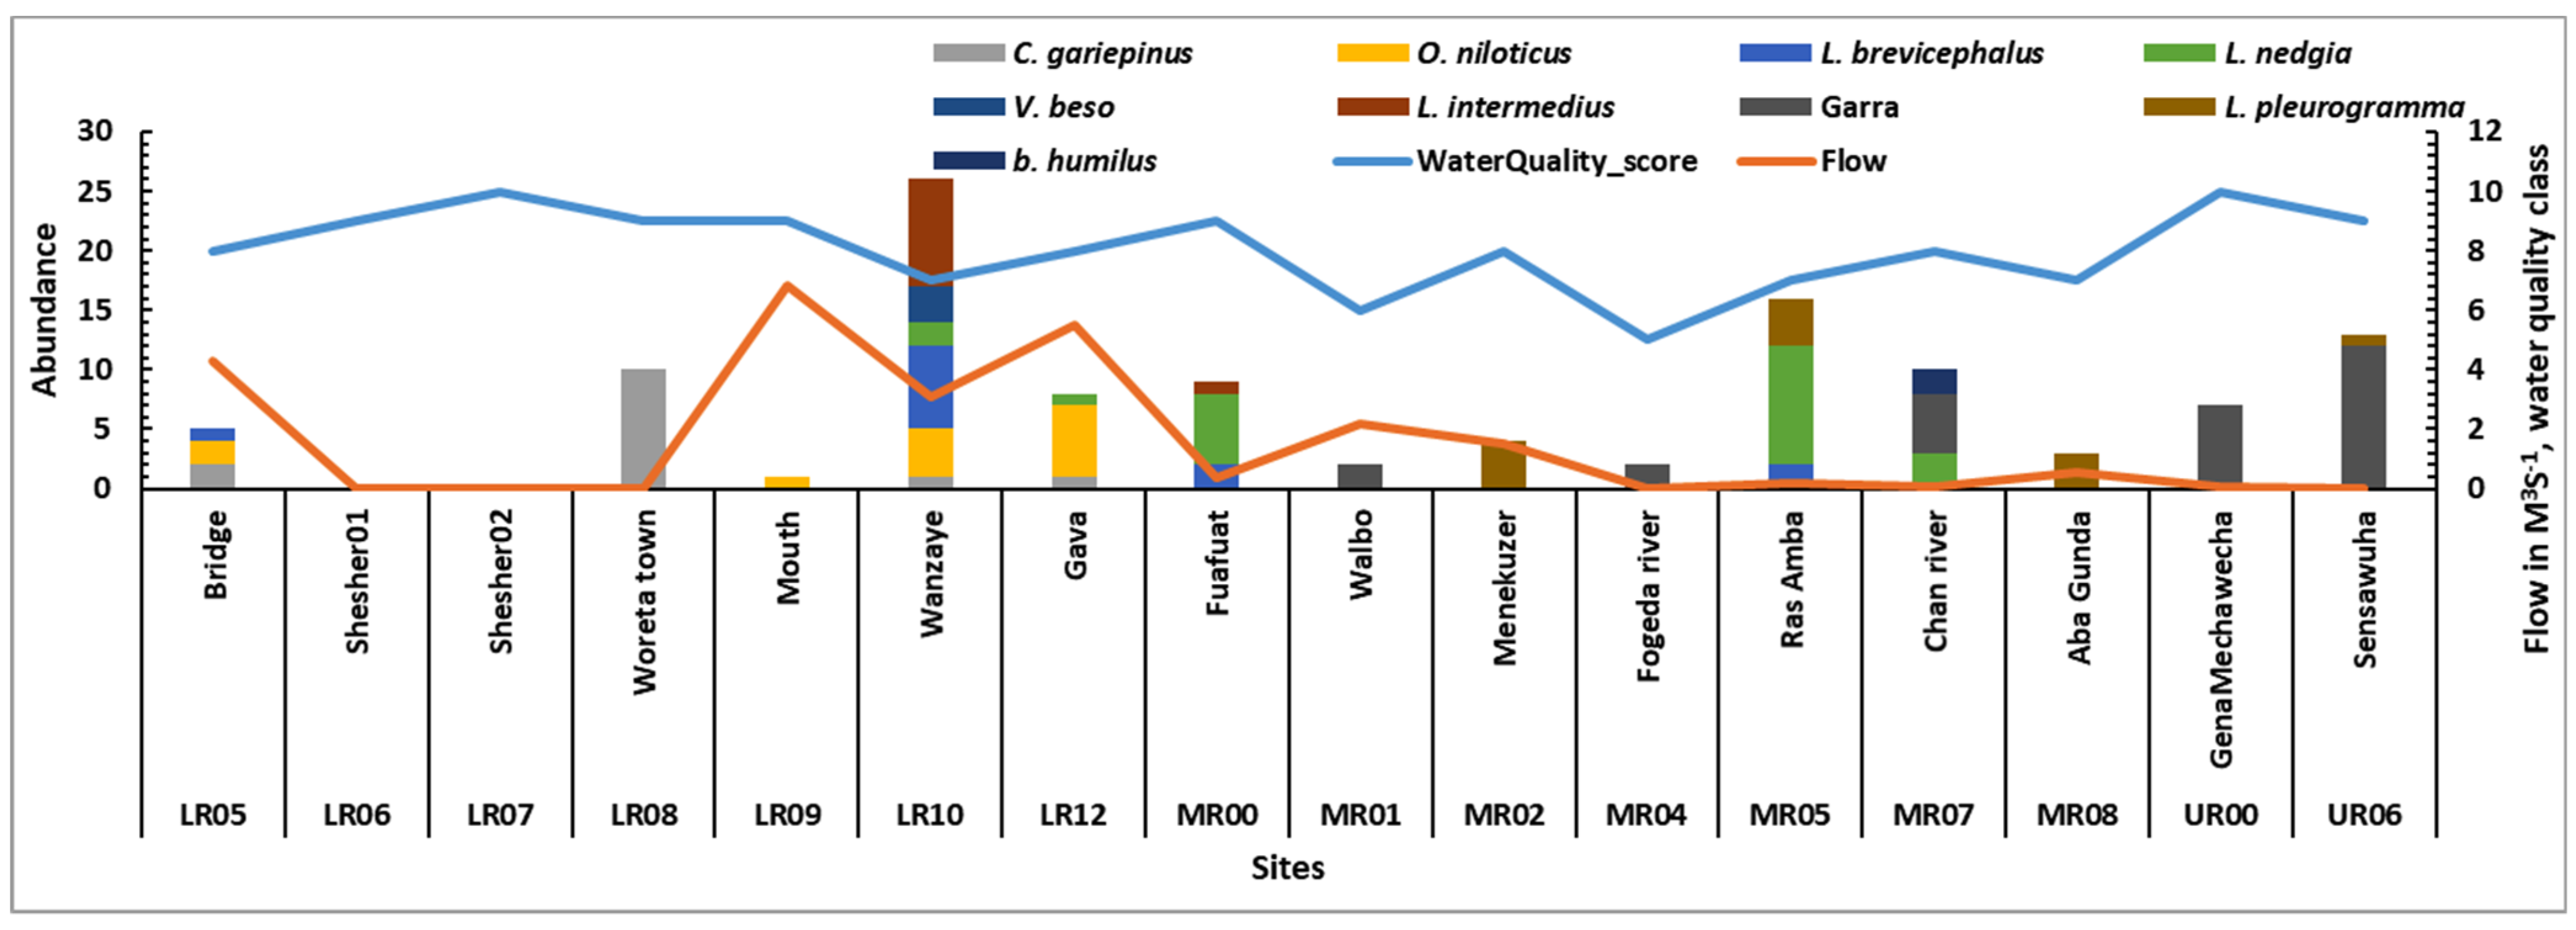
3.6. Relationships of Fish Abundance with Water Quality, Hydromorphology, and Flow

The Wanzaye site had the highest catches (26), followed by Ras amba (16), Sensawuha (13), Chan and Woreta town (10 each), Fuafuat (9), Gava (8), and GenaMechawecha (7) (Figure 7). In the present investigation, higher fish catches were identified at higher flow rates and less disturbance or better water quality. However, some sites (i.e., Sensawuha, Chan, and Gena-Mechawecha) have shown higher catches at low flow, which could be attributed to possessing a larger pool and receiving little human and livestock disturbances (Figure 7, Table S2 and Figure S8). Catfish (Clarias gariepinus) catch at the Woreta town site was high, relative to other species. This is attributed to the site’s poor water quality (Figure S8) and the higher tolerance of catfish to poor water quality [47].

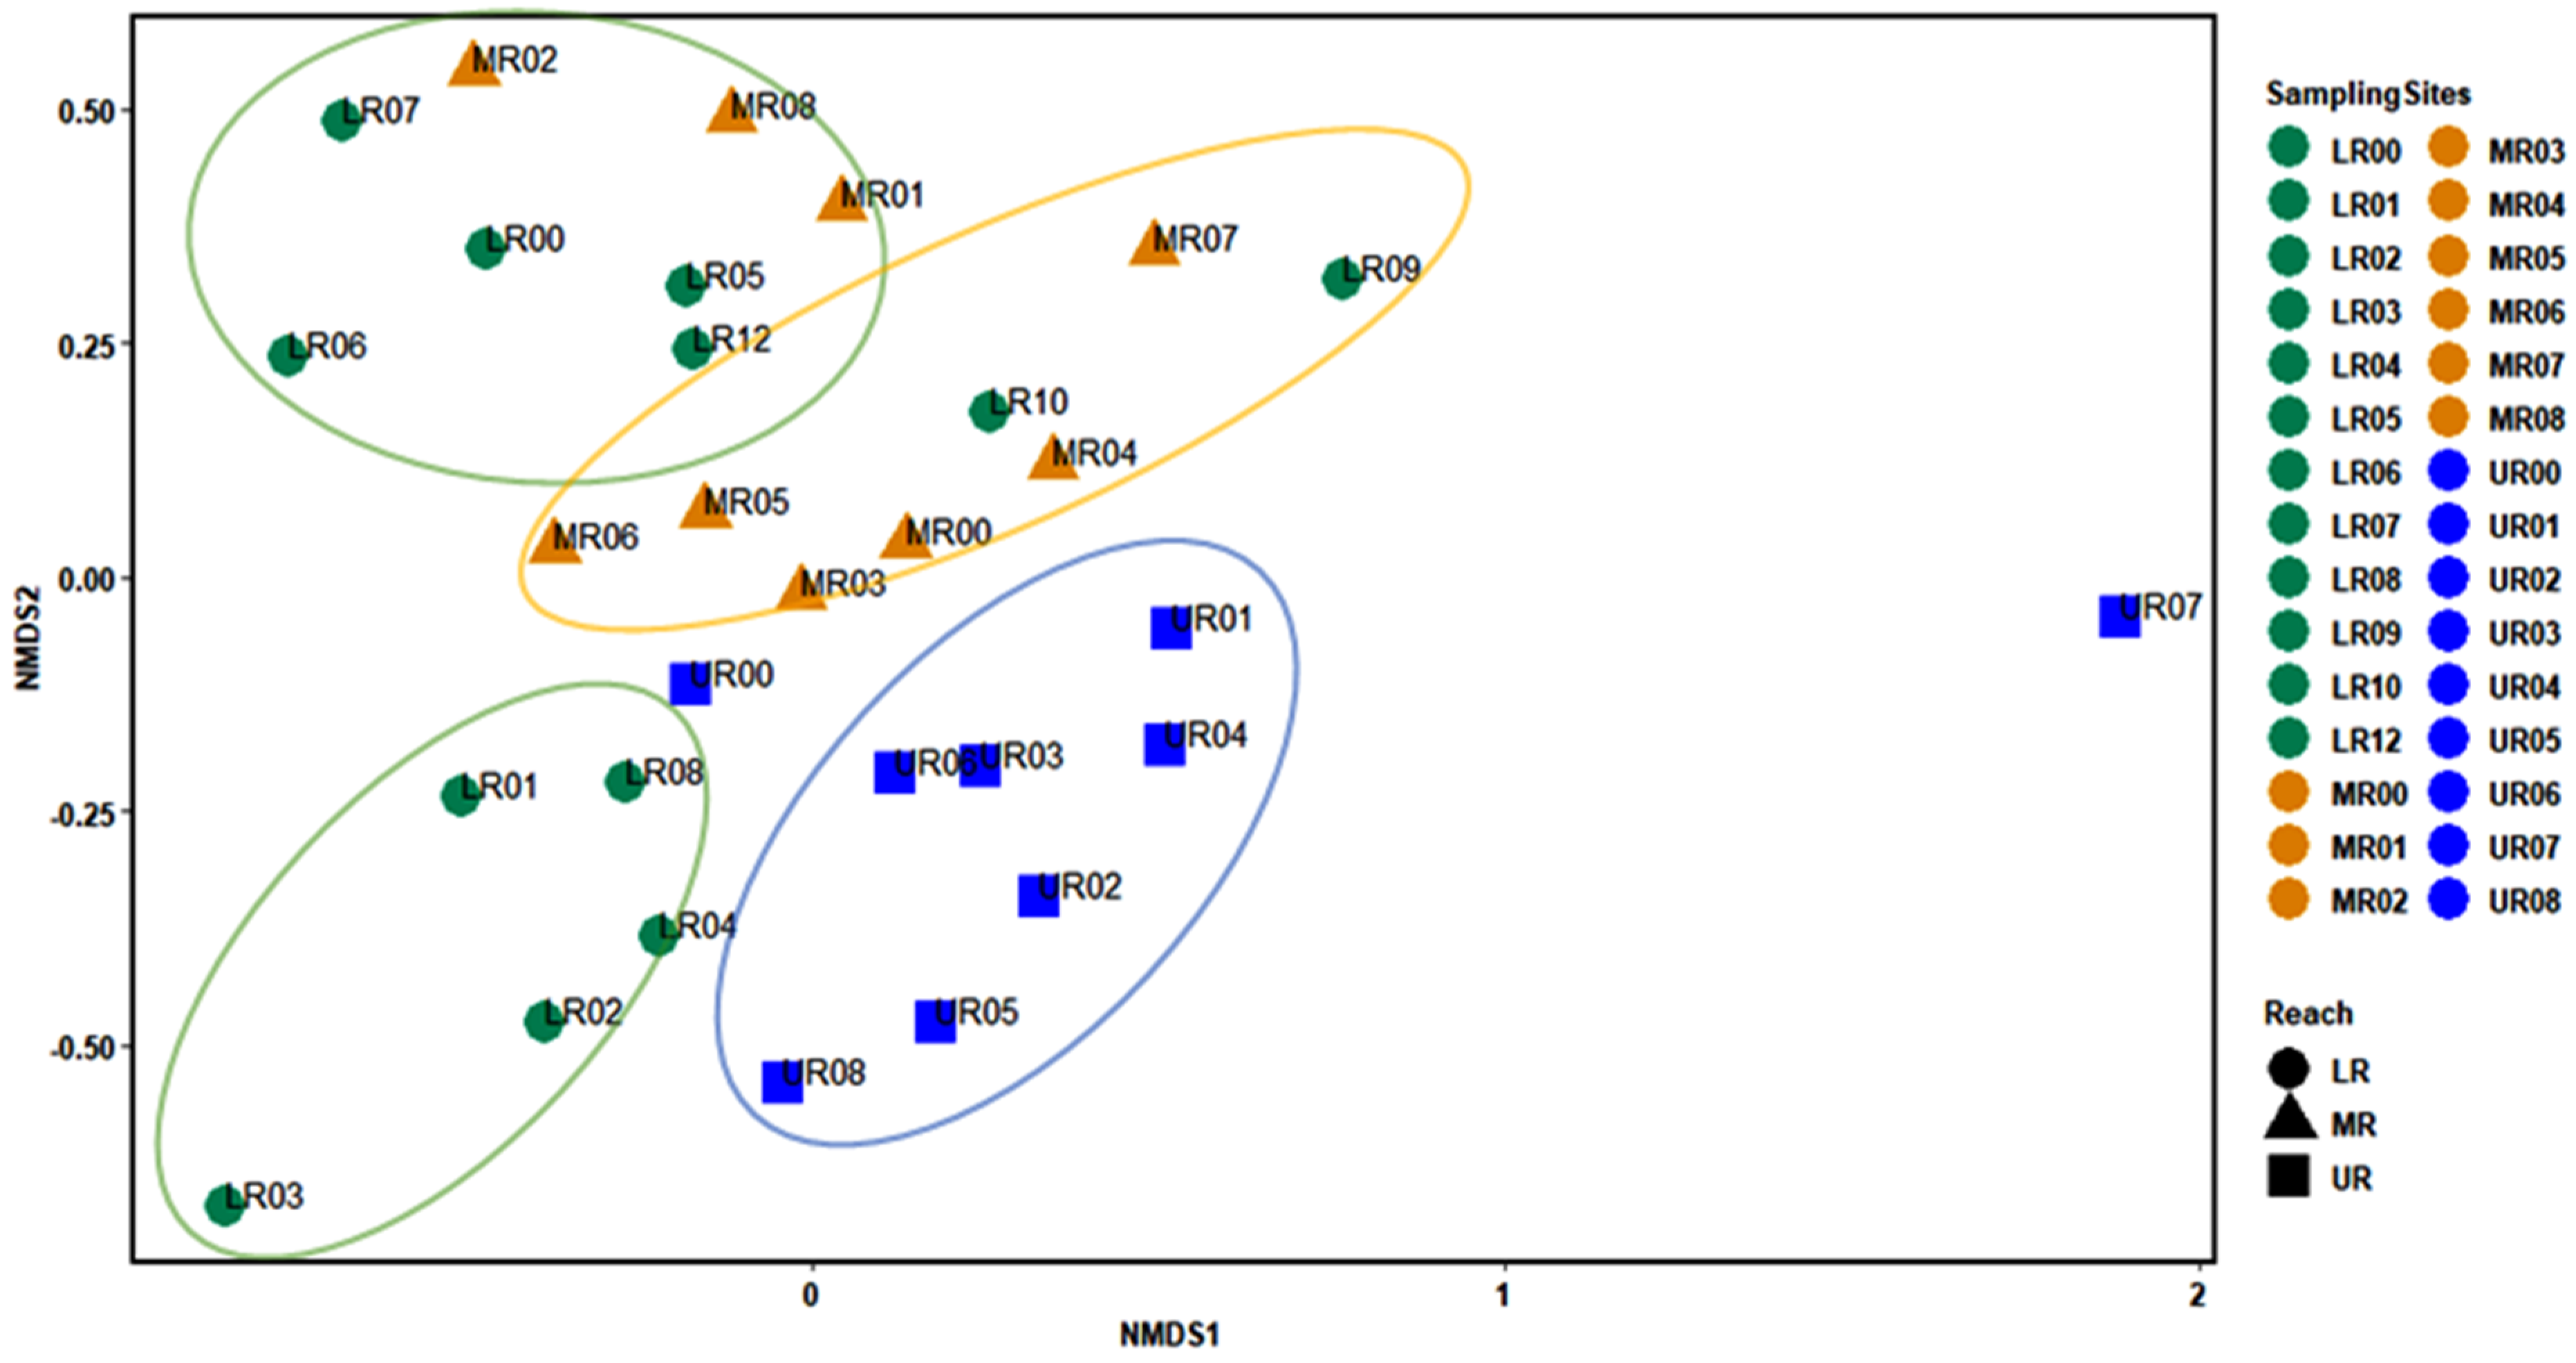
3.7. Distribution and Relationships of Macroinvertebrates Abundance with Flow, Water Quality, and Hydromorphology

The similarities test in macroinvertebrate abundance within a major reach was more similar and showed significant differences across the major reaches with stress values of a Bray Curtis distance of 0.199 (alpha 0.01, p = 0.003) (Figure 8).
This shows a reasonable and good representation indicating that reaches have a similar habitat, flow rate extent/depth, riparian vegetation, and pollution status determining the abundance and diversity of macroinvertebrates. Overlaps between some of the middle and lower reaches showed that the river order has its own influence on the relative abundance of macroinvertebrates across reaches; that is, source and first-order reach sampling sites are closer to each other, indicating similarities in abundance (Figure 8).
Relationships of EPT with water quality, hydromorphology, and flow: Abundance of the most sensitive macroinvertebrates, Ephemeroptera, Plecoptera, and Trichoptera (EPT) taxa was related to water quantity and quality. Their abundance increased with lower order, a moderate to low flow rate, and moderate to good water quality (Figure 9). The head waters and some lower reaches (such as Wanzaye (LR10), Bridge (LR05), and Guanta upper (LR04)) showed higher abundance and diversity of EPT, while the other sites in the lower reach with higher order (like Gava and Gumara mouth) showed lower abundance. Studies abroad showed similar outcomes in relating macroinvertebrate abundance with flow, water quality, and hydro-morphology, where there are inter-relationships [48]. This result is similar to fish abundance, for example, at Wanzaye, which might be explained in terms of the food web. Most of the larger Labeobarbus and C. gariepinus are predators of aquatic macroinvertebrates either in larval or adult stages [49]. A similar trend was reported in 2016 that EPT diversity decreased as flows increased or river order increased (Figure 9), which could be linked to water quality and hydro-morphological degradation in the three sites downstream [32]. Concomitantly, as mentioned in Section 3.1, the year 2020 was a wetter year than 2016. The abundance in EPT was higher in 2016, implying that EPT decreased as flow levels increased (Figure 9).
Hydromorphic: Hydromorphic differences among sites showed differences in EPT abundance. Most of the sites with a higher proportion of riffles and lotic segments with better water quality showed higher abundance. Lotic and riffles with low flow and less water quality status showed no or less abundance. Pools, which are not sensitive to flow extent and water quality status, showed less abundance (Figure S8), in line with Worrall [50].

3.8. Relationship of Riparian Vegetation and Flow Change

Land cover, grass/sedge, and woodland of the 30 m buffer distance were extracted from the results of Section 3.5.1 to show the condition of the riparian vegetation with the historical annual flow of Gumara River. The result showed that there is a decrease in grass/sedge and woodland and a slight increase in vegetation cover in line with a historical decrease in flow. Change in annual flow is positively correlated with the change in riparian vegetation, grass/sedge, and woodland cover; Pearson correlation r = 0.21, r = 0.20, and r = 0.11, respectively (Figure 10a). The weak relation can be attributed to other factors, like anthropogenic effects. The decrease in grass and sedge is related to the decrease in flow, especially during the dry season, which informed the deterioration of the herbaceous medicinal plants along the Gumara river. The decrease in woodland depicts the denudation of natural riparian forest in the Gumara River, and the recent—after 2011—increase in vegetation cover is attributed to the eucalyptus plantation along water courses. Recent research findings indicated that eucalyptus has a hydrologic alteration impact [42,45,46].
NDVI of a 30 m buffer distance from the Gumara River resulted in a Pearson correlation of 0.54 with flow at the bridge. It showed that the decrease in riparian vegetation cover of the Gumara River is in line with flow decrease (Figure 10b).

3.9. Conceptual Framework of Flow–Ecology–Livelihood Linkages

Based on this study and Abebe et al. [16], the low flows and large floods have decreased, and floods occur later in the season in the Gumara River. It directly affects the ecosystems and related human livelihoods dependent on ecosystem services.
Because of the decrease in low flows and the resulting increase in zero-flow days, the resident fish species in the river are threatened. Historically, fish used the pools along the river to survive in the dry season. However, these pools have dried up due to pump irrigation. Additionally, the delay in floods by about 30 days [16], which delays the migration of Clarias gariepinus (Catfish) and the Labeobarbus species to the Shesher and Welala flood plain wetlands for spawning. Finally, submerged and emerged herbaceous plants and grasses in the Gumara river are disappearing, and water supply for livestock and humans is becoming problematic.
The decrease in large floods makes it easier for the local population to cut the large riparian trees, such as Ficus vasta species for fuelwood and farm tools, and causes the trees to disappear. Sand mining has also become more prominent, significantly affecting the ecology of the Gumara River.
Generally, the relationship between flow alteration, the main ecological components, and related human livelihoods helps to understand the impacts of anthropogenic interference on aquatic and riverine ecology. Hence, a flow–ecology–livelihoods conceptual relationship was developed (Table 2) that can help in establishing a quantified relationship by building sufficient historical and spatial data in the river–wetland–lake system to inform science and policy.

4. Conclusions and Management Recommendation

The Gumara River and Lake Tana sub-basin are composed of important biological communities and freshwater ecosystems, which have conservation value and uniqueness. The people in the Gumara watershed are dependent on these resources for food and income sources, traditional medicines, evergreen trees as habitat for birds and wildlife, fuelwood, lumber sources, agriculture, and roosting sites for migratory birds from Europe and hot springs for recreation and holy water.
The dependency on the riparian resources is changing over time because of anthropogenic pressures. The Gumara River has experienced hydrological alteration for the last 20 years because of unregulated pump irrigation and unwise catchment management, including planting eucalyptus trees close to water sources. In addition, the water quality of the river has become seriously degraded with increased phosphorus and nitrogen concentrations. Anthropogenic sources are responsible for water quality deterioration, especially wastes from towns and the runoff of fertilizers from agricultural lands. As a result, fish diversity (including spawning grounds) and riparian vegetation cover have decreased considerably over the last 35 years. Hence, fishing has declined, people tend to use commercial medicines to a higher extent than using medicinal plants, and spend long hours collecting drinking water during the dry monsoon season.
The anthropogenic pressures are expected to continue, increasing in years to come. New dams are proposed in all major rivers of Lake Tana which will alter the flow significantly. As human water abstractions grow, measures are needed, including quantification of environmental flow requirements and regulating and managing river, wetland, and lake water use in order to conserve the precious resources in the Gumara River and Lake Tana sub-basin as a whole.

Supplementary Materials

The following are available online at https://www.mdpi.com/article/10.3390/w13141913/s1, Supplement 1; Section S1: Macroinvertebrate data collection and processing, Section S2: Land use and land cover classification and analysis, Section S3: Tables and figures, i.e., Table S1: Sampling Sites in the Gumara river and Shesher wetland. LR—lower reach, MR—middle reach, UR—upper reach. * fish sampling sites, Table S2: Hydromorphological condition of sampling sites in Gumara river and Shesher wetland, Table S3: Average Daily Flow (m3 s−1) of the 30 sampling sites in March 2016 and 2020 with their category in flow exceedance from the highest historical minimum value, Q80. Q80—the 80th percentile flow; FDC—flow duration curve, LR—lower reach, MR—middle reach, UR—upper reach, Rch—reach, Lo—lower, Up—upper, Lf—low flow; Mhf—Moderate/high flow, Table S4: Water quality data for 30 locations in 3 major reaches of the Gumara river in March 2020, Table S5: Water quality status at each sampling site, Table S6: Abundance and community composition of macroinvertebrates sampled in Gumara river in March 2020, Table S7: Analysis of Ecological health based on ETHBios macroinvertebrate scoring at each sampling station in Gumara river, Table S8: Fish species diversity status in Gumara river and wetlands; taking Wanzaye (LR10) as reference site, Table S9: Riparian tree species in the Gumara river, Table S10: Medicinal plants identified in the Gumara and associated rivers of lake tana Sub-basin, Figure S1: Abundance/number of macroinvertebrate families in the lower, middle and upper reaches of Gumara river, Figure S2: Distribution of macroinvertebrate families sampled in the lower, middle and upper reaches of Gumara river, Figure S3: Number of macroinvertebrate orders identified in the Gumara river in March 2020, Figure S4: Number Macroinvertebrates of family, diversity (H) and evenness in the Gumara river, March 2020, Figure S5: Fish species in the Gumara river and Flood plain wetland in March 2020, Figure S6: Fish species composition in different reaches of Gumara river and the Flood plain wetland in March 2020, Figure S7: Time series of land use and land cover of Gumara river watershed between 1985–2020, Figure S8: EPT abundance and water quality status (score) in different Hydromorphic proportion of sampling site.

Author Contributions

Conceptualization, W.B.A., S.A.T., M.M.M., A.W. and M.E.M.; data curation, W.B.A.; formal analysis, W.B.A.; funding acquisition, W.B.A., S.A.T., A.W., M.G.D., W.A. and T.S.S.; investigation, W.B.A.; methodology, W.B.A., S.A.T., M.M.M., A.W., A.A.A. and M.E.M.; project administration, S.A.T.; resources, S.A.T., A.W., M.G.D., W.A., T.S.S. and M.E.M.; supervision, S.A.T., M.M.M., A.W. and M.E.M.; validation, S.A.T., M.M.M., T.S.S. and M.E.M.; writing—original draft, W.B.A.; writing—review & editing, W.B.A., S.A.T., M.G.D., W.W.A., D.A.M., A.A.A., F.A.Z., W.A., T.S.S. and M.E.M. All authors have read and agreed to the published version of the manuscript.

Funding

This research was funded by Amhara Design and Supervision Works Enterprise; BDU-BiT supported research project: Use of integrated technologies for controlling and utilization of water hyacinth (Eichhornia crassipes) in Lake Tana; CIAT-(Africa RISING and WLE) project; PIRE project: “Taming Water in Ethiopia—An Interdisciplinary Approach to Improve Human Security in a Water-Dependent Emerging Region” supported by the National Science Foundation (NSF) under Grant No. 154587.4.

Institutional Review Board Statement

The study was conducted according to the guidelines of the Declaration of Helsinki, and approved by the Institutional Review Board of BAHIR DAR INSTITUTE OF TECHNOLOGY, SCHOOL OF RESEARCH AND GRADUATE STUDIES (protocol code BIT/FCWRE/1178/2011 and Date of approval 17 July 2019).

Informed Consent Statement

This study did not involve humans or patients.

Data Availability Statement

The climate data, precipitation and temperature was taken from publicly available website of: https://climexp.knmi.nl/start.cgi (accessed on 9 July 2021); and NDVI of Gumara was downloaded from NOAA CDR AVHRR NDVI: Normalized Difference Vegetation Index, Version 5 with a written script link: https://code.earthengine.google.com/7489568b1708ca9524089ce087219190 (accessed on 9 July 2021).

Acknowledgments

The flow data were obtained from Ministry of Water, Irrigation and Electric. Abbay basin Authority provided stage and discharge data. Macroinvertebrate data was also taken from the study of Gezie et al., 2018. The authors acknowledged the two anonymous reviewers who have provided comments on the manuscript.

Conflicts of Interest

The authors declare that there is no conflict of interest.

References

  1. NSW Government. Water for the Environment: Why Do We Need It? Environment, Energy and Science; Department of Planning, Industry and Environment: Parramatta, NSW, Australia, 2020.
  2. Arthington, A.H.; Bhaduri, A.; Bunn, S.E.; Jackson, S.E.; Tharme, R.E.; Tickner, D.; Young, B.; Acreman, M.; Baker, N.; Capon, S.; et al. The Brisbane Declaration and Global Action Agenda on Environmental Flows (2018). Front. Environ. Sci. 2018, 6, 45. [Google Scholar] [CrossRef] [Green Version]
  3. Arthington, A.H.; Naiman, R.J.; McClain, M.E.; Nilsson, C. Preserving the biodiversity and ecological services of rivers: New challenges and research opportunities. Freshw. Biol. 2010, 55, 1–16. [Google Scholar] [CrossRef] [Green Version]
  4. McManamay, R.A.; Orth, D.; Dolloff, C.A.; Mathews, D.C. Application of the ELOHA Framework to Regulated Rivers in the Upper Tennessee River Basin: A Case Study. Environ. Manag. 2013, 51, 1210–1235. [Google Scholar] [CrossRef] [Green Version]
  5. McClain, M.E.; Subalusky, A.L.; Anderson, E.P.; Dessu, S.; Melesse, A.; Ndomba, P.M.; Mtamba, J.O.; Tamatamah, R.A.; Mligo, C. Comparing flow regime, channel hydraulics, and biological communities to infer flow–ecology relationships in the Mara River of Kenya and Tanzania. Hydrol. Sci. J. 2014, 59, 801–819. [Google Scholar] [CrossRef]
  6. McClain, M.E.; Kashaigili, J.J.; Ndomba, P. Environmental flow assessment as a tool for achieving environmental objectives of African water policy, with examples from East Africa. Int. J. Water Resour. Dev. 2013, 29, 650–665. [Google Scholar] [CrossRef]
  7. Arthington, A.H.; Rall, J.L.; Kennard, M.J.; Pusey, B.J. Environmental flow requirements of fish in Lesotho rivers using the DRIFT methodology. River Res. Appl. 2003, 19, 641–666. [Google Scholar] [CrossRef] [Green Version]
  8. O’Brien, G.C.; Dickens, C.; Hines, E.; Wepener, V.; Stassen, R.; Quayle, L.; Fouchy, K.; MacKenzie, J.; Graham, P.M.; Landis, W. A regional-scale ecological risk framework for environmental flow evaluations. Hydrol. Earth Syst. Sci. 2018, 22, 957–975. [Google Scholar] [CrossRef] [Green Version]
  9. Cheesman, R.E. Lake Tana and Its Islands. Geogr. J. 1935, 85, 489. [Google Scholar] [CrossRef]
  10. Shitaw, T.; Medehin, S.G.; Anteneh, W. Spatio-temporal distribution of Labeobarbus species in Lake Tana. Int. J. Fish. Aquat. Stud. 2018, 10, 231–240. [Google Scholar]
  11. Aynalem, S.; Bekele, A. Species composition, relative abundance and distribution of bird fauna of riverine and wetland habitats of Infranz and Yiganda at southern tip of Lake Tana, Ethiopia. Trop. Ecol. 2008, 49, 199. [Google Scholar]
  12. Zur Heide, F. Feasibility Study for a Lake Tana Biosphere Reserve, Ethiopia; Bundesamt für Naturschutz, BfN: Bonn, Germany, 2012. [Google Scholar]
  13. Atnafu, N.; Dejen, E.; Vijverberg, J. Assessment of the Ecological Status and Threats of Welala and Shesher Wetlands, Lake Tana Sub-Basin (Ethiopia). J. Water Resour. Prot. 2011, 3, 540–547. [Google Scholar] [CrossRef] [Green Version]
  14. Aschalew, L.; Moog, O. Benthic macroinvertebrates based new biotic score “ETHbios” for assessing ecological conditions of highland streams and rivers in Ethiopia. Limnologica 2015, 52, 11–19. [Google Scholar]
  15. Anteneh, W.; Dejen, E.; Getahun, A. Shesher and Welala floodplain wetlands (Lake Tana, Ethiopia): Are they important breeding habitats for Clarias gariepinus and the migratory Labeobarbus fish species? Sci. World J. 2012, 2012, 298742. [Google Scholar] [CrossRef] [Green Version]
  16. Abebe, W.B.; Tilahun, S.A.; Moges, M.M.; Wondie, A.; Derseh, M.G.; Nigatu, T.A.; Mhiret, D.A.; Steenhuis, T.S.; Van Camp, M.; Walraevens, K.; et al. Hydrological Foundation as a Basis for a Holistic Environmental Flow Assessment of Tropical Highland Rivers in Ethiopia. Water 2020, 12, 547. [Google Scholar] [CrossRef] [Green Version]
  17. Wondie, A. Ecological conditions and ecosystem services of wetlands in Lake Tana basin. Ecohydrol. Hydrobiol. 2018, 18, 231–244. [Google Scholar] [CrossRef]
  18. Walters, A.W.; Post, D.M. How low can you go? Impacts of a low flow disturbance on aquatic insect communities. Ecol. Appl. 2010, 21, 163–174. [Google Scholar] [CrossRef] [PubMed]
  19. Tewabe, D. Status of Lake Tana Commercial Fishery, Ethiopia. Int. J. Aquac. Fish. Sci. 2015, 1. [Google Scholar] [CrossRef] [Green Version]
  20. Shreve, R.L. Statistical Law of Stream Numbers. J. Geol. 1966, 74, 17–37. [Google Scholar] [CrossRef]
  21. BCEOM. Abay River Basin Integrated Development Master Plan–Phase 2–Land Resources Development–Reconnaissance Soils Survey; Ministry of Water Resources: Addis Ababa, Ethiopia, 1998. [Google Scholar]
  22. TNC, The Nature Conservancy. Indicators of Hydrologic Alteration Version 7.1: User’s Manual; The Nature Conservancy: Arlington, VI, USA, 2009. [Google Scholar]
  23. Calderon, M.S.; An, K.-G. An influence of mesohabitat structures (pool, riffle, and run) and land-use pattern on the index of biological integrity in the Geum River watershed. J. Ecol. Environ. 2016, 40, 13. [Google Scholar] [CrossRef] [Green Version]
  24. Gilson, H.C.; Edmondson, W.T. Freshwater Biology; John Wiley and Sons: New York, NY, USA, 1959; Freshwater Ecology Volume 18, pp. 383–393. [Google Scholar]
  25. APHA. Standard Methods for the Examination of Water and Wastewater, 9th ed.; American Public Health Association: Washington, DC, USA, 1997. [Google Scholar]
  26. UNECE. Standard Statistical Classification of Surface Freshwater Quality for the Maintenance of Aquatic Life. In Readings in International Environment Statistics; United Nations Economic Commission for Europe: New York, NY, USA; Geneva, Switzerland, 1994; pp. 53–64. [Google Scholar]
  27. Chapman, D.V. (Ed.) Water Quality Assessments: A Guide to the Use of Biota, Sediments and Water in Environmental Monitoring; CRC Press: Boca Raton, FL, USA, 1996. [Google Scholar]
  28. De Ruyter van Stevenick, V.G.; Minns, A.W.; Vermeat, J.; Hootsmans, M. Chemical water quality evaluation system. In Aquatic Ecosystems: Processes and Applications; Course; UNESCO-IHE: Delft, The Nethelands, 2006. [Google Scholar]
  29. Nagelkerke, L.; Sibbing, F.A. The Barbs of Lake Tana, Ethiopia: Morphological Diversity and Its Implications for Taxonomy, Trophic Resource Partitioning, and Fisheries; Wageningen Agricultural University: Wageningen, The Nethelands, 1997. [Google Scholar]
  30. Snoeks, J. The Non-Cichlid Fishes of the Lake Malawi/Nyasa/Niassa System. 2004. Available online: https://lirias.kuleuven.be/1705175?limo=0 (accessed on 9 July 2021).
  31. Noi, P.T.; Kappas, M. Comparison of Random Forest, k-Nearest Neighbor, and Support Vector Machine Classifiers for Land Cover Classification Using Sentinel-2 Imagery. Sensors 2017, 18, 18. [Google Scholar] [CrossRef] [Green Version]
  32. Gezie, A.; Assefa, W.W.; Getnet, B.; Anteneh, W.; Dejen, E.; Mereta, S.T. Potential impacts of water hyacinth invasion and management on water quality and human health in Lake Tana watershed, Northwest Ethiopia. Biol. Invasions 2018, 20, 2517–2534. [Google Scholar] [CrossRef]
  33. Moriasi, D.N.A.; Van Liew, J.G.; Michael, W.; Bingner, R.L.; Harmel, R.D.; Veith, T.L. Model evaluation guidelines for systematic quantification of accuracy in watershed simulations. Trans. ASABE 2007, 50, 885–900. [Google Scholar] [CrossRef]
  34. Magurran, A.E. Ecological Diversity and Its Measurement; Chapman and Hall: London, UK, 1988. [Google Scholar]
  35. Dejen, E.; Anteneh, W.; Vijverberg, J. The Decline of the Lake Tana (Ethiopia) Fisheries: Causes and Possible Solutions. Land Degrad. Dev. 2015, 28, 1842–1851. [Google Scholar] [CrossRef] [Green Version]
  36. Anteneh, W.; Getahun, A.; Dejen, E.; Sibbing, F.A.; Nagelkerke, L.A.J.; De Graaf, M.; Wudneh, T.; Vijverberg, J.; Palstra, A.P. Spawning migrations of the endemic Labeobarbus (Cyprinidae, Teleostei) species of Lake Tana, Ethiopia: Status and threats. J. Fish Biol. 2012, 81, 750–765. [Google Scholar] [CrossRef]
  37. Welcomme, R.; Halls, A. Dependence of tropical river fisheries on flow. In Proceedings of the Second International Symposium on the Management of Large Rivers for Fisheries, Phnom Penh, Cambodia, 11–14 February 2003; RAP Publication 2004/16. Food and Agriculture Organization of the United Nations: Bangkok, Thailand, 2004. [Google Scholar]
  38. Zalewski, M.; Thorpe, J.E.; Naiman, R.J. Fish and riparian ecotones—A hypothesis. Int. J. Ecohydrol. Hydrobiol. 2001, 1, 11–24. [Google Scholar]
  39. Leite, G.F.M.; Silva, F.; Gonçalves, J.F.J.; Salles, P. Effects of conservation status of the riparian vegetation on fish assemblage structure in neotropical headwater streams. Hydrobiology 2015, 762, 223–238. [Google Scholar] [CrossRef]
  40. Vieira, T.; Dias-Silva, K.; Pacífico, E.S. Effects of riparian vegetation integrity on fish and heteroptera communities. Appl. Ecol. Environ. Res. 2015, 13, 53–65. [Google Scholar]
  41. Ameha, A.; Assefa, A. The Fate of The barbus of Gumara River, Ethiopia. SINET Ethiop. J. Sci. 2002, 25. [Google Scholar] [CrossRef] [Green Version]
  42. Chanie, T.; Collick, A.S.; Adgo, E.; Lehmann, C.J.; Steenhuis, T.S. Eco-hydrological impacts of Eucalyptus in the semi humid Ethiopian Highlands: The Lake Tana Plain. J. Hydrol. Hydromech. 2013, 61, 21–29. [Google Scholar] [CrossRef] [Green Version]
  43. Enku, T.; Tadesse, A.; Yilak, D.L.; Gessesse, A.A.; Addisie, M.B.; Abate, M.; Zimale, F.A.; Moges, M.A.; Tilahun, S.A.; Steenhuis, T.S. Biohydrology of low flows in the humid Ethiopian highlands: The Gilgel Abay catchment. Biolologia 2014, 69, 1502–1509. [Google Scholar] [CrossRef]
  44. Tefera, B.; Kassa, H. Trends and Driving Forces of Eucalyptus Plantation by Smallholders in the Lake Tana Watershed of Ethiopia. In Social and Ecological System Dynamics; Springer: Cham, Switzerland, 2017; pp. 563–580. [Google Scholar]
  45. Mhiret, D.A.; Dagnew, D.C.; Alemie, T.C.; Guzman, C.D.; Tilahun, S.A.; Zaitchik, B.F.; Steenhuis, T.S. Impact of Soil Conservation and Eucalyptus on Hydrology and Soil Loss in the Ethiopian Highlands. Water 2019, 11, 2299. [Google Scholar] [CrossRef] [Green Version]
  46. Enku, T.M.; Ayana, A.M.; Tilahun, E.K.; Mengiste Abate, S.A.M.; Steenhuis, T.S. Groundwater use of a small eucalyptus patch during the dry monsoon phase. Biologia 2020, 1–12. [Google Scholar]
  47. Setiadi, E.; Taufik, I.; Widyastuti, Y.R.; Ardi, I.; Puspaningsih, D. Improving productivity and water quality of catfish, Clarias sp. cultured in an aquaponic ebb-tide system using different filtration. IOP Conf. Ser. Earth Environ. Sci. 2019, 236, 012026. [Google Scholar] [CrossRef]
  48. Arimoro, F.O.; Keke, U.N. The intensity of human-induced impacts on the distribution and diversity of macroinvertebrates and water quality of Gbako River, North Central, Nigeria. Energy Ecol. Environ. 2016, 2, 143–154. [Google Scholar] [CrossRef] [Green Version]
  49. De Graaf, M.; Dejen, E.; Osse, J.W.M.; Sibbing, F.A. Adaptive radiation of Lake Tana’s (Ethiopia) Labeobarbus species flock (Pisces, Cyprinidae). Mar. Freshw. Res. 2008, 59, 391–407. [Google Scholar] [CrossRef]
  50. Worrall, T.; Dunbar, M.; Extence, C.; Laize, C.; Monk, W.; Wood, P. The identification of hydrological indices for the characterization of macroinvertebrate community response to flow regime variability. Hydrol. Sci. J. 2014, 59, 645–658. [Google Scholar] [CrossRef]
Figure 1. Location and sampling sites in the three reaches of Gumara River. (a) Ethiopia, (b) Lake Tana sub-basin, (c) Gumara watershed divided into three reaches (lower in blue, middle in brown, and upper in light green), associated flood plain wetlands (Welala and Shesher), and the Lake [16]. The numbers indicate the different sampling sites and are described in the Supplemental Materials (Table S1).
Water 13 01913 g001
Figure 2. Monthly flow of March for the three sites of Gumara River between 1985 and 2020. The Gumara mouth (blue) and Gava (orange) are modelled flows where irrigation water of 2.987 m3 s−1 was subtracted, and Bridge (grey) is observed flow.
Water 13 01913 g002
Figure 3. Flow duration curve for the month of March. (a) Higher river orders of the Gumara bridge site (LR05) in the lower reach, Menekuzer site (MR02) and Sensawuha site (UR06) in the upper reach; (b) lower river orders of Guanta lower site (LR00) in the lower reach, Fogeda site (MR04) in the middle reach and Debretabor site (UR04) in the upper reach. The flow duration for other sites is generated likewise to extract the 80th-percentile flow (Q80) as the threshold for low flow and moderate to high flow separation. LR—lower reach, MR—middle reach, and UR—upper reach.
Water 13 01913 g003
Figure 4. Water quality status in Gumara river in March 2020 based on chemical water quality requirements of fishery [26,27,28] and macroinvertebrate ETHBios, SASS, and BMWP scoring.
Water 13 01913 g004
Figure 5. Macroinvertebrate abundance (a), diversity (b), evenness (c), and fish diversity (d) across the three reaches of the Gumara river. LR—lower reach, MR—middle reach, and UR—upper reach.
Water 13 01913 g005
Figure 6. Riparian vegetation cover change analysis using NDVI for (a) 30 m buffer distance of the river Channel Gumara, (b) 60 m buffer distance, and (c) 90 m buffer distance.
Water 13 01913 g006
Figure 7. Relationship of fish abundance with water quality class and flow in the Gumara River. LR—lower reach, MR—middle reach and UR—upper reach.
Water 13 01913 g007
Figure 8. Macroinvertebrate abundance across reaches and flow extent in March 2020.
Water 13 01913 g008
Figure 9. Ephemeroptera, Plecoptera, and Trichoptera (EPT) and flow of different river orders in the lower reach of Gumara in March 2016 and March 2020. LR—lower reach, MR—middle reach, and UR—upper reach.
Water 13 01913 g009
Figure 10. Flow versus vegetation change relationships in the Gumara River; (a) flow of Gumara river and riparian vegetation cover between 1985 to 2018, and (b) flow of Gumara river and NDVI of 30 m buffer distance from the river between 1985 to 2018.
Water 13 01913 g010
Table 1. Water quality indices across reaches in the Gumara River. LR—lower reach, MR—middle reach, UR—upper reach.
ReachNH4-NPO4-PDO_sat%
LRMean0.350.38147
Std. Error of Mean0.150.1111
MRMean0.220.13150
Std. Error of Mean0.060.047
URMean0.240.65212
Std. Error of Mean0.030.3421
TotalMean0.280.38168
Std. Error of Mean0.060.129
Table 2. Conceptual framework for flow–ecology–livelihood linkages * in the Gumara River and connected wetlands of the Lake Tana sub-basin. This is based on the findings of this study and Abebe et al. [16].
Flow AlterationsImpacts on Aquatic and Riparian EcosystemImpacts on Livelihoods Dependent on Ecosystem Services
Decreased quantity of low flow
Decreased quantity of large flood
Increased zero-flow days
Delayed timing of high flow pulse
Decreased river and wetland habitat for fish
Delayed in fish spawning migration
Decreased feed for fish in rivers and wetlands
Decreased water available in rivers and wetlands
Decrease in riparian and instream vegetation cover
Decrease in fishery production
Lack of water for drinking
Deterioration of human health
Lack of water for agriculture
Lack of forage for livestock feed
Impact on ecotourism
Deterioration of hot-springs for traditional medication
Disappearance of medicinal plants
quality of the river and connected wetlands
Change in morphology of the river
decreased aquatic habitat for fish and macroinvertebrates
Decreased abundance and diversity of fish
Decreased abundance and diversity of aquatic macroinvertebrates
Decreased vegetation
Lack of feed for fish for fishery production
Decrease in the population of fish for food and marketing
Lack of habitat for riparian birds and wildlife
Impact on ecotourism
Lack of fuel wood
Decreased groundwater storage
Decreased dry season river flow quantity and quality
Deterioration of water quality
Changed land use /cover
Decreased riparian and instream vegetation diversity
Decreased abundance and diversity of macroinvertebrates
Lack of feed for livestock
Lack of feed for fish
Deterioration/extinction of medicinal plants
Lack of fuel wood
Impact on apiary
Lack of water supply
* Note: Blue text represents alterations/impacts because of activities of water pumping for irrigation. Purple text represents the alterations/impacts because of the activities of agriculture, sand-mining, and in situ clothes-washing. Green text represents the impacts because of the activities of over-grazing, grass/papyrus harvest, tree cutting, and eucalyptus plantation. Besides, the table depicts that the first column issues are impacting the second column with the same text color, and then the second column issues are impacting the third column’s issues. One row in the first column has a relation with one or more rows of the same color in the second column.
Publisher’s Note: MDPI stays neutral with regard to jurisdictional claims in published maps and institutional affiliations.

