
Mechanism and Purification Effect of Photocatalytic Wastewater Treatment Using Graphene Oxide-Doped Titanium Dioxide Composite Nanomaterials


Abstract
:1. Introduction
2. Methodology
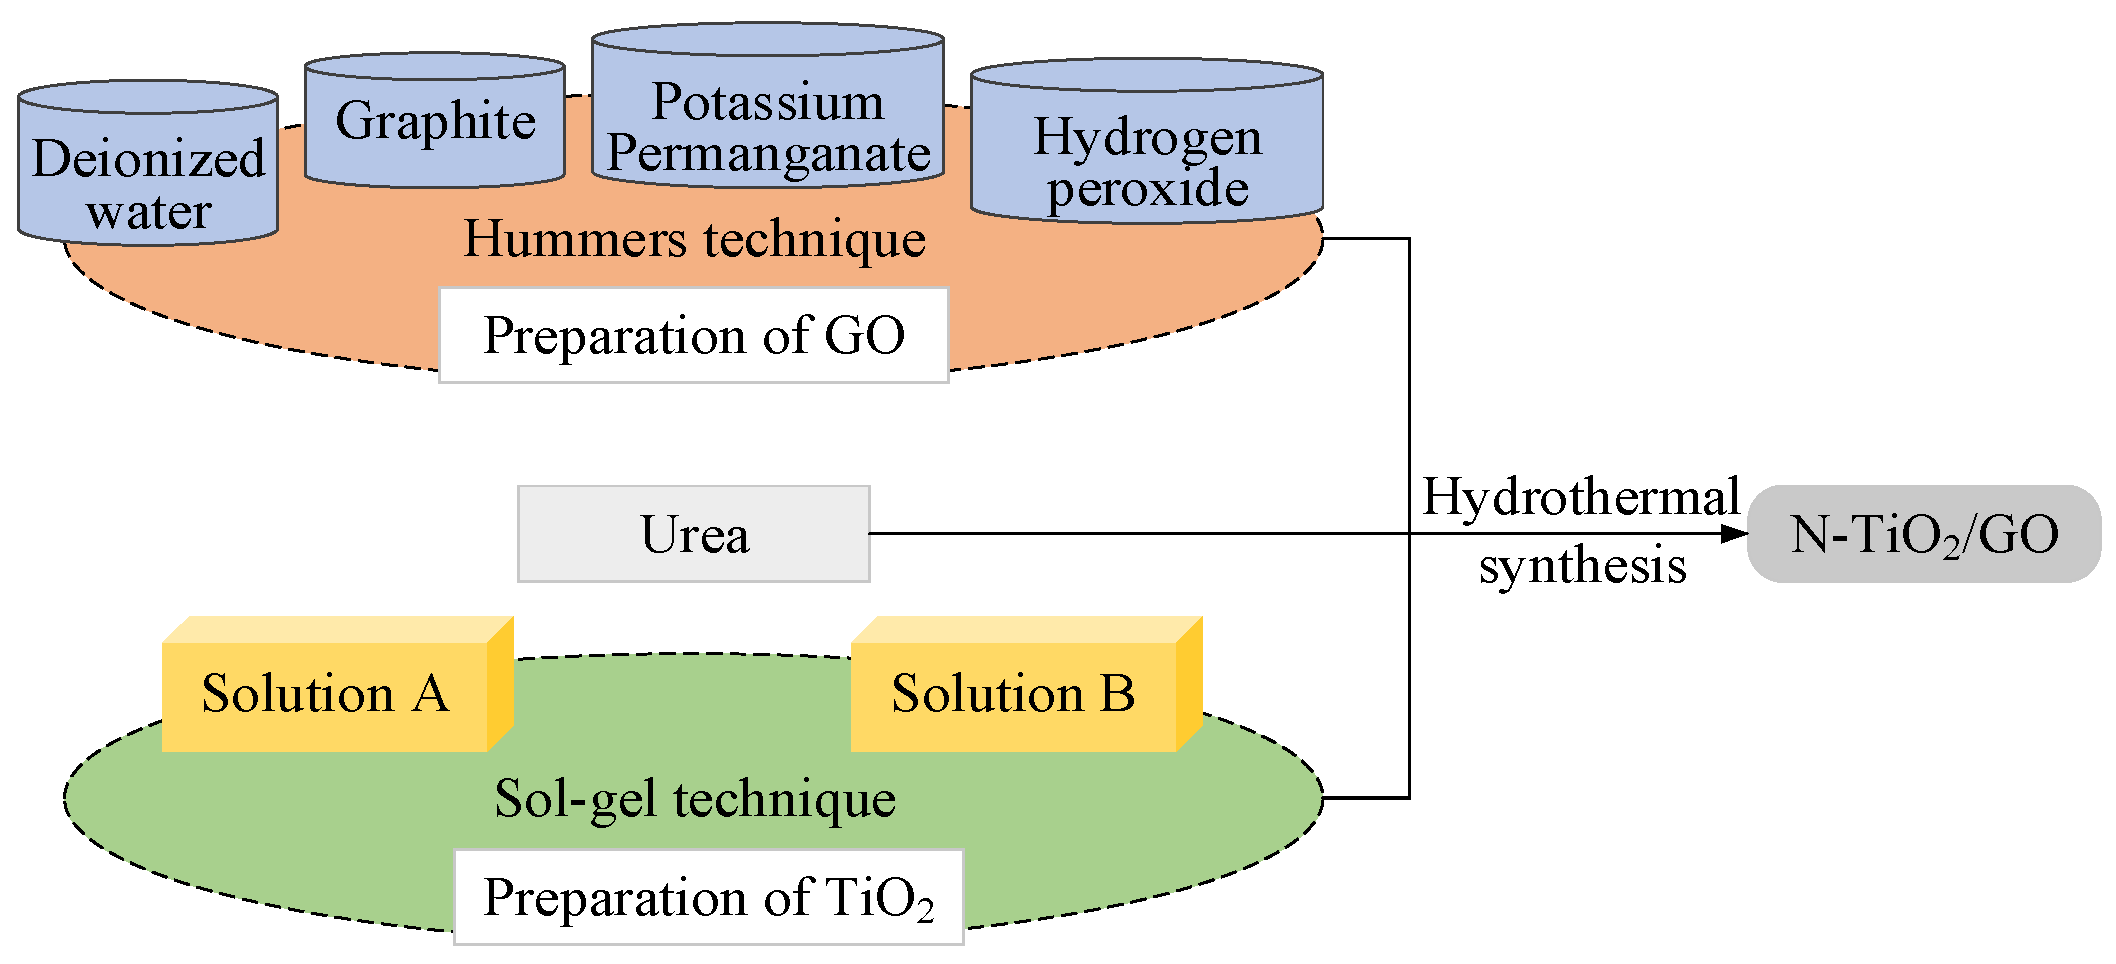
2.1. GO Preparation
2.2. TiO2 Preparation
2.3. Preparation of N-TiO2, TiO2/GO, and N-TiO2/GO
2.4. Characterization of GO Composite Materials
2.5. Adsorption Experiment
2.6. Photocatalysis Degradation Experiment
3. Results and Discussions
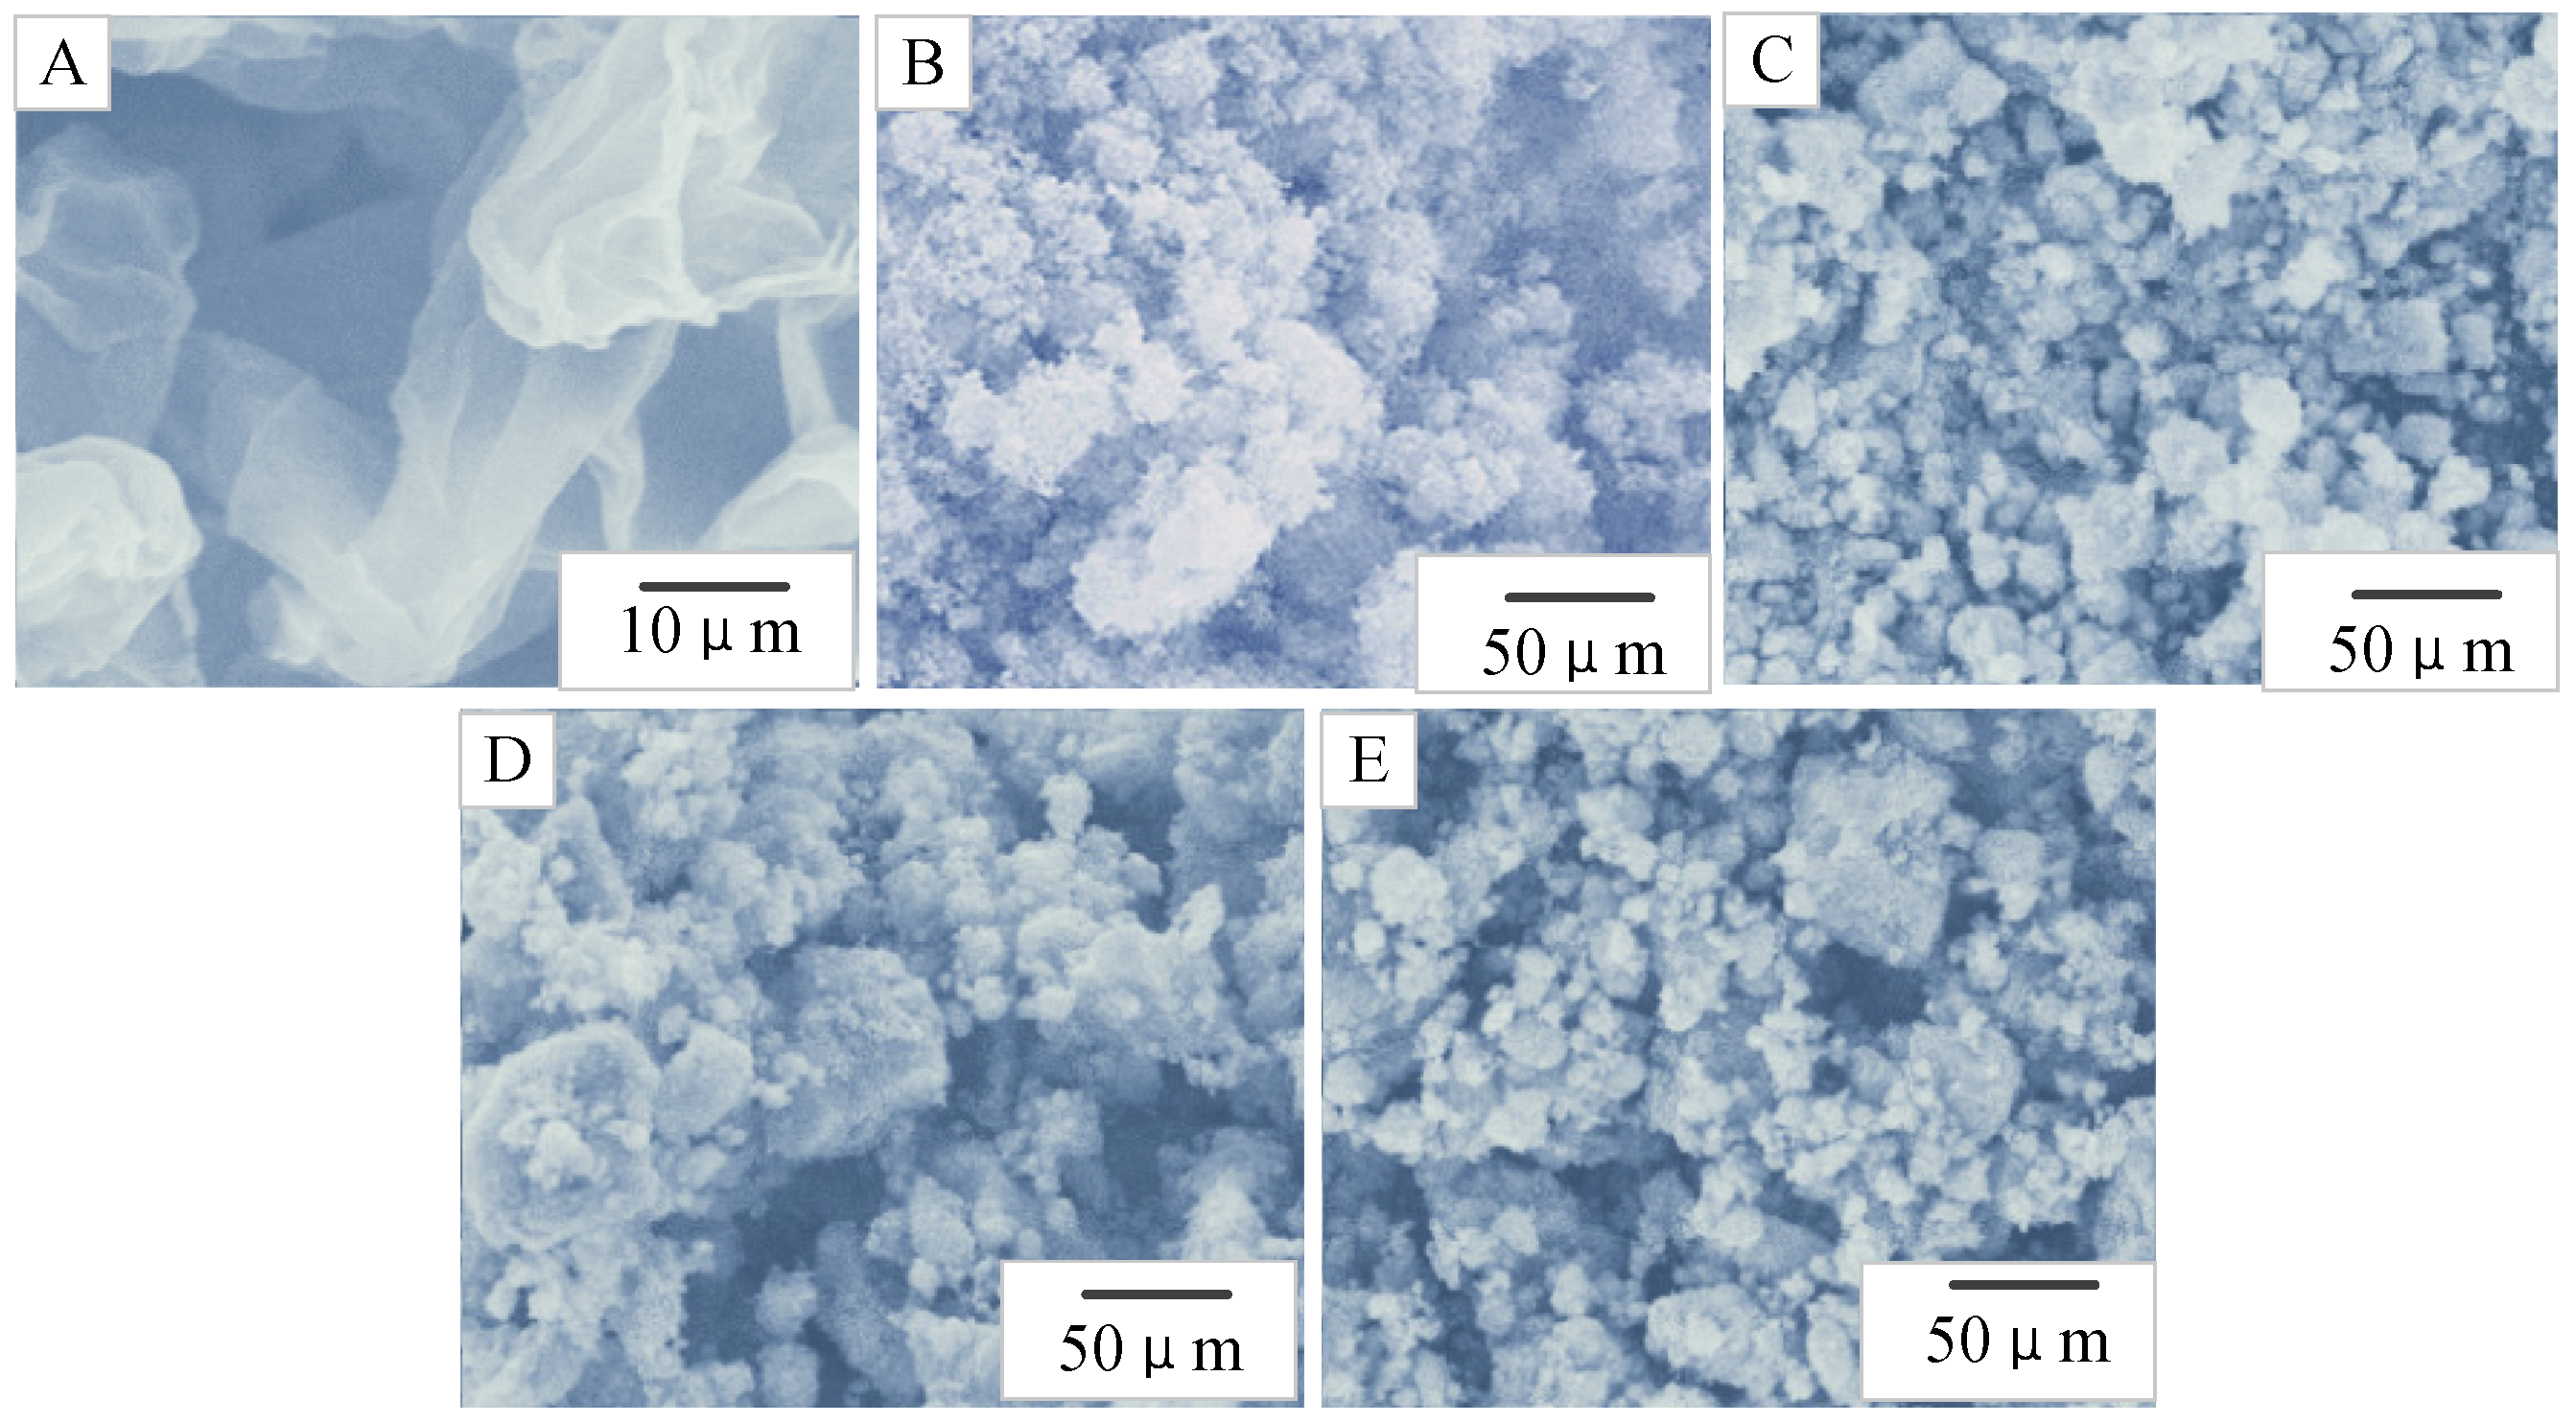
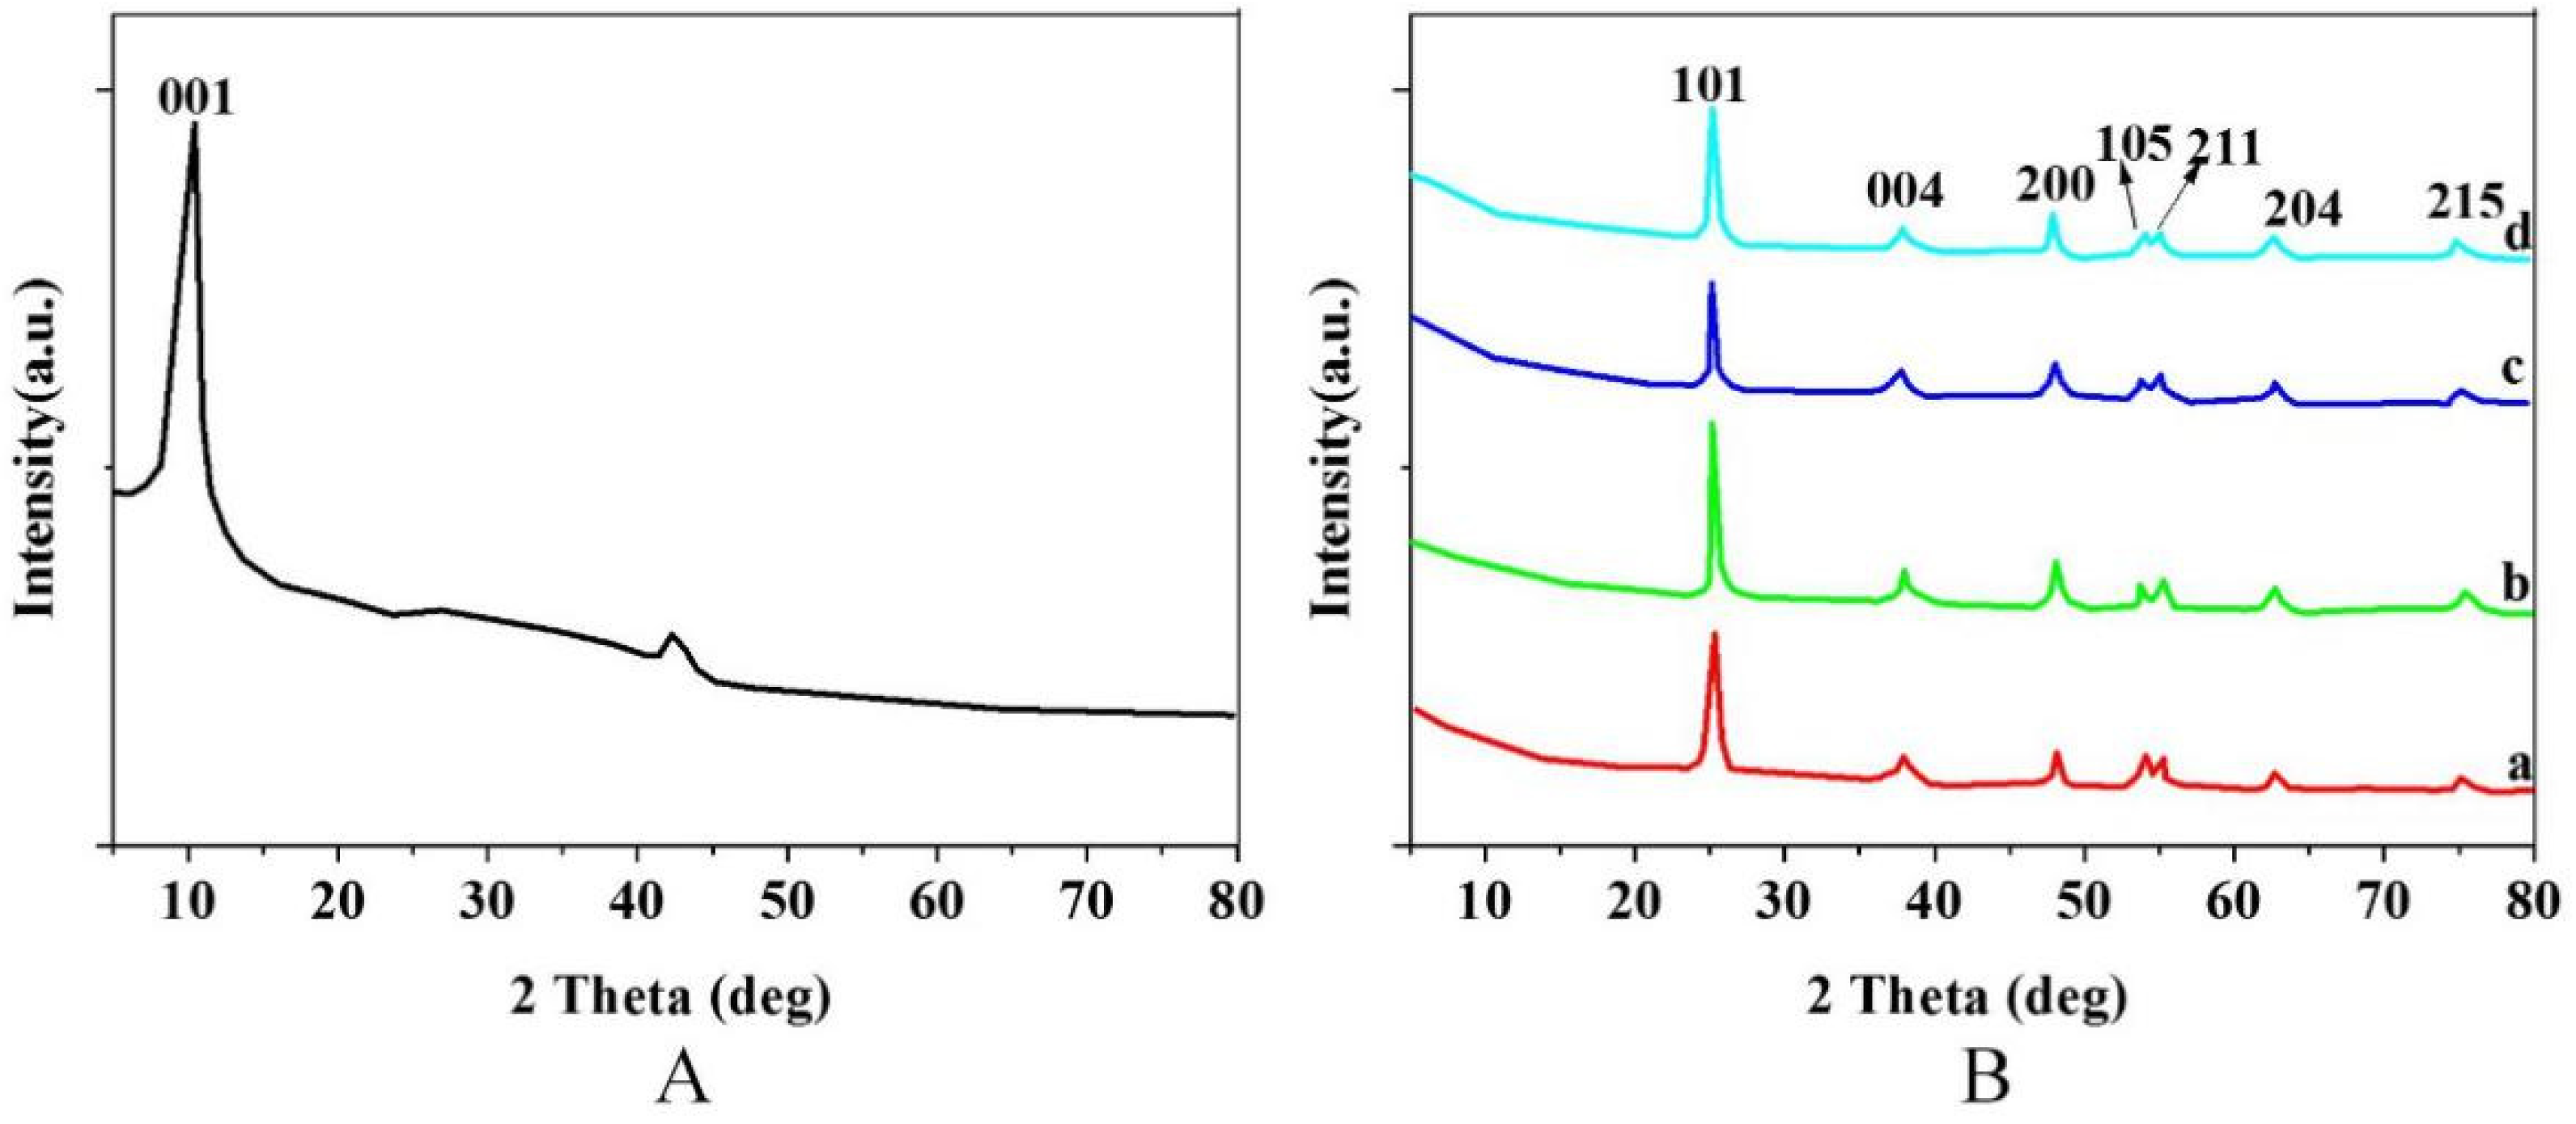
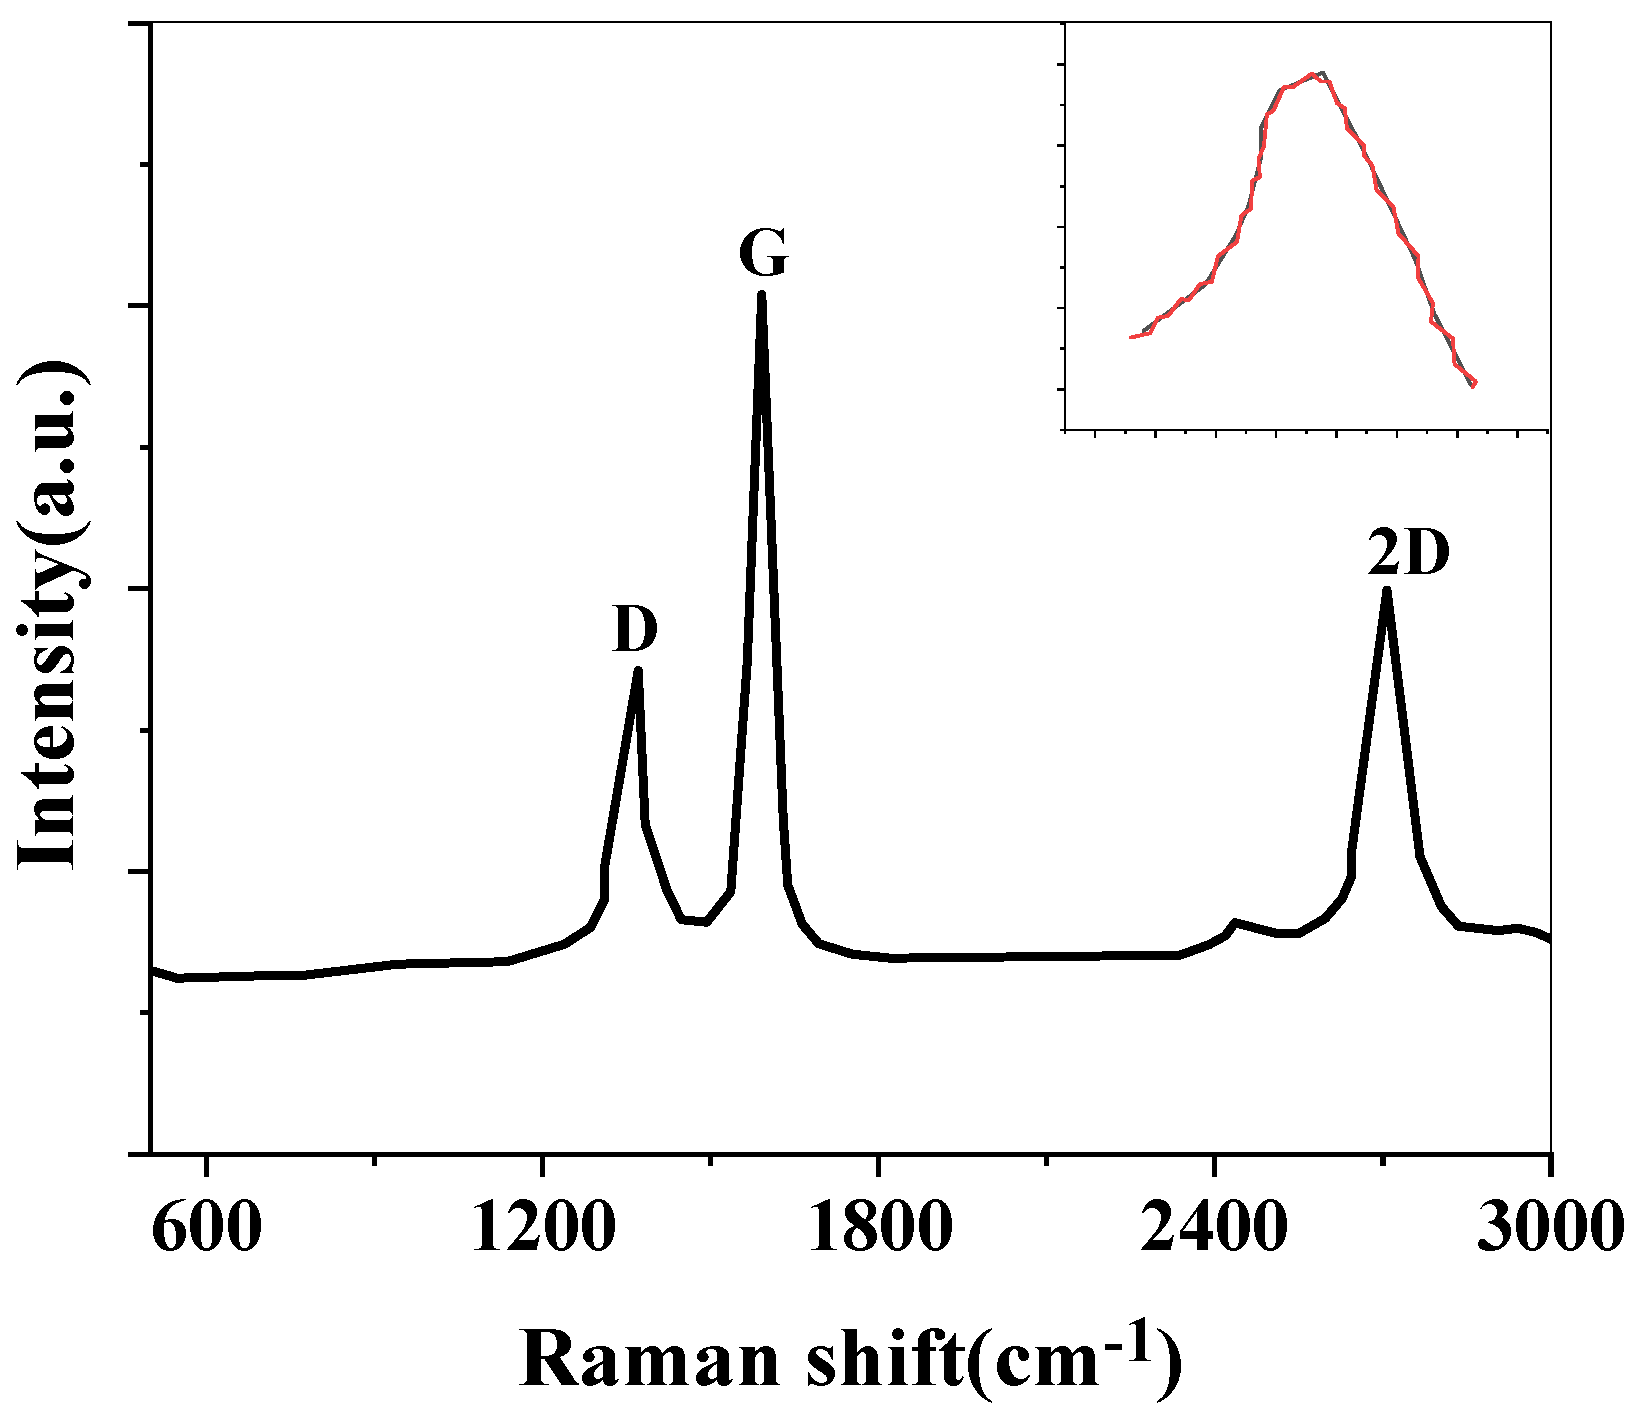
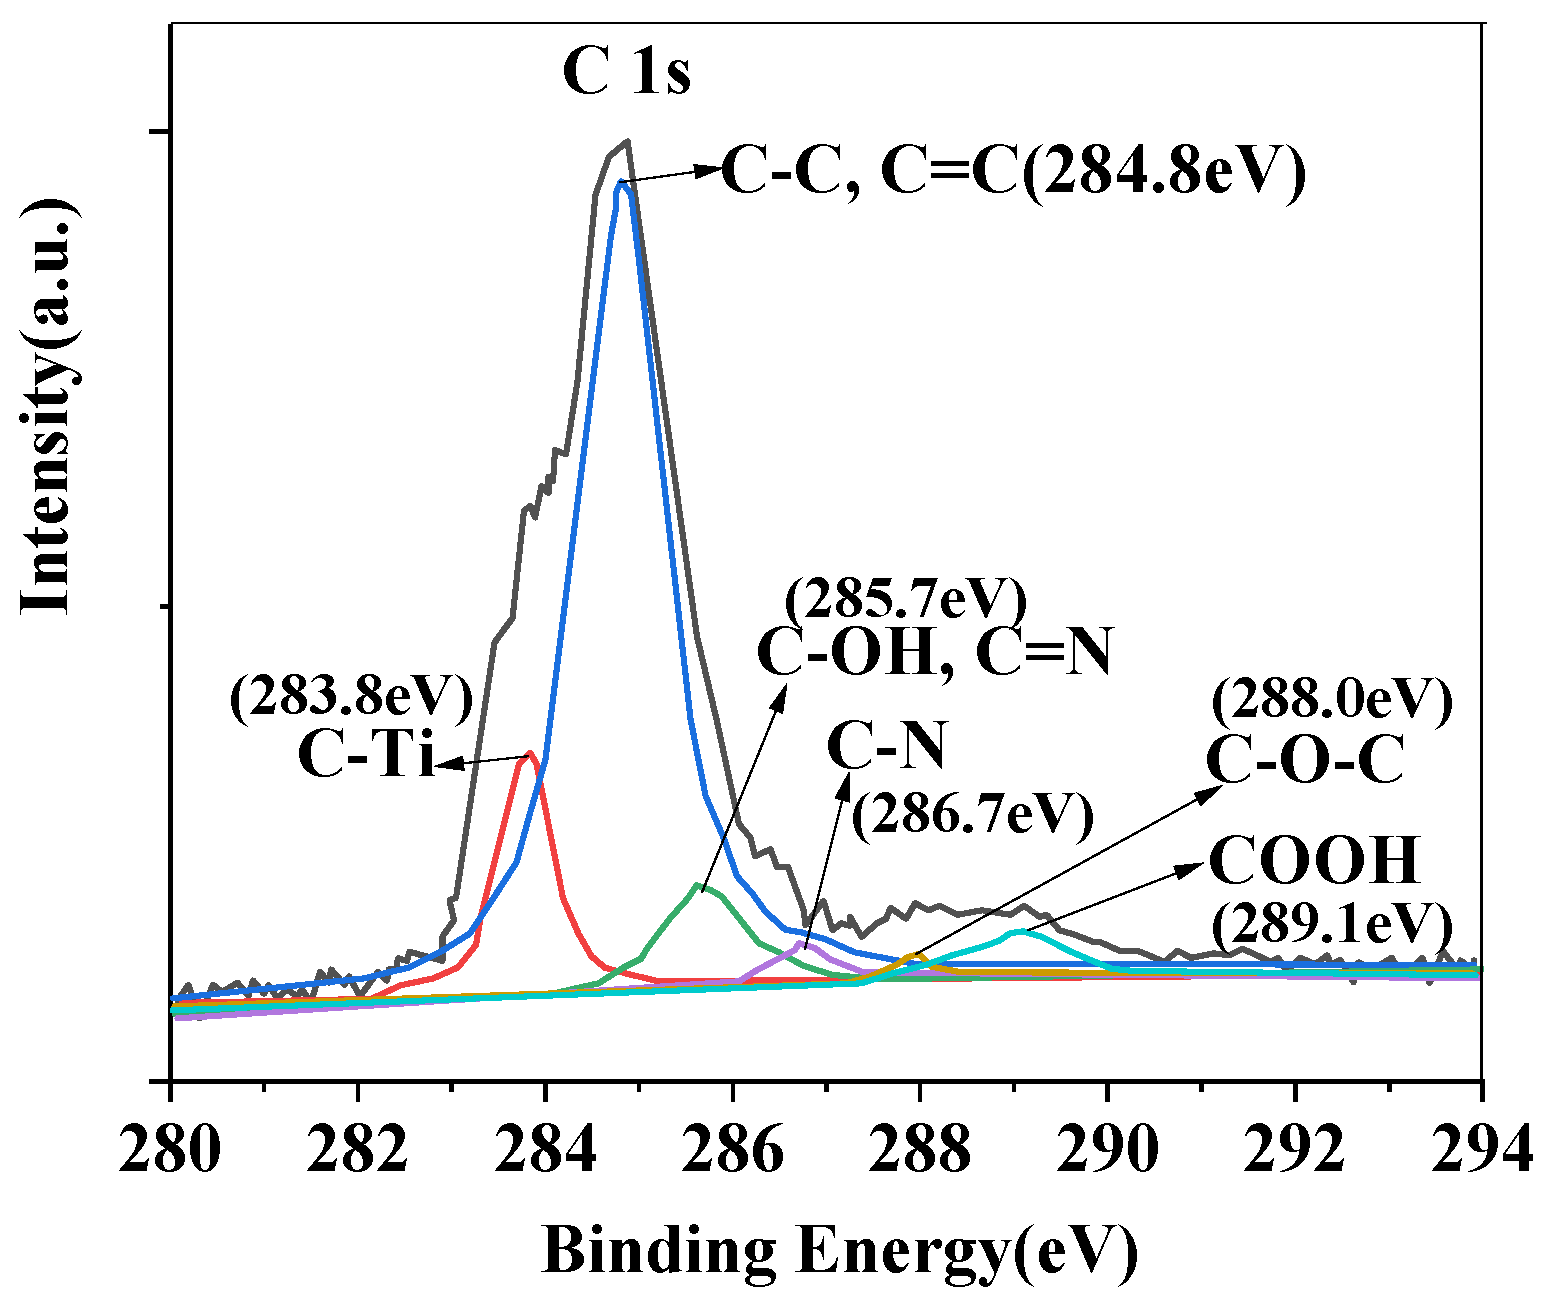
3.1. Characterization Analysis
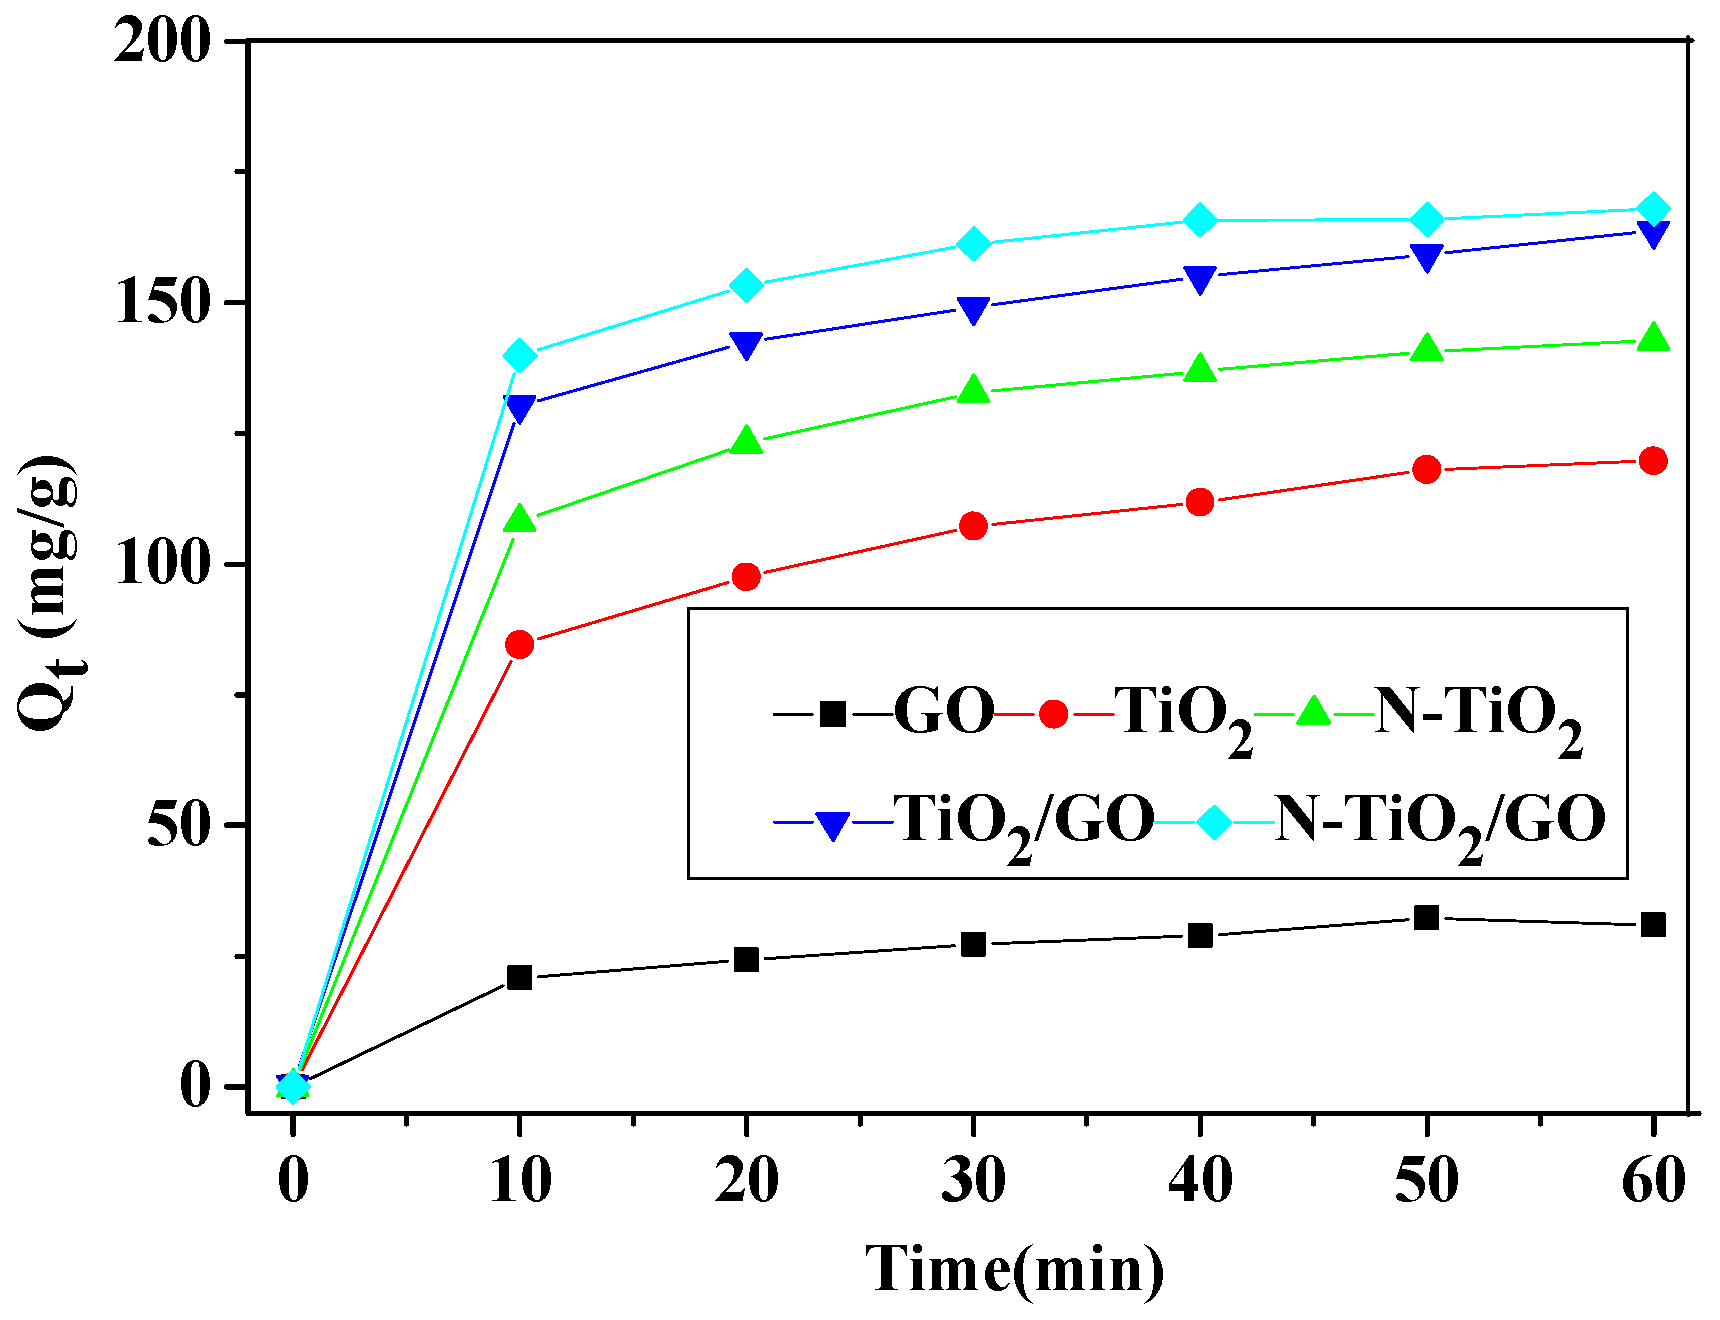
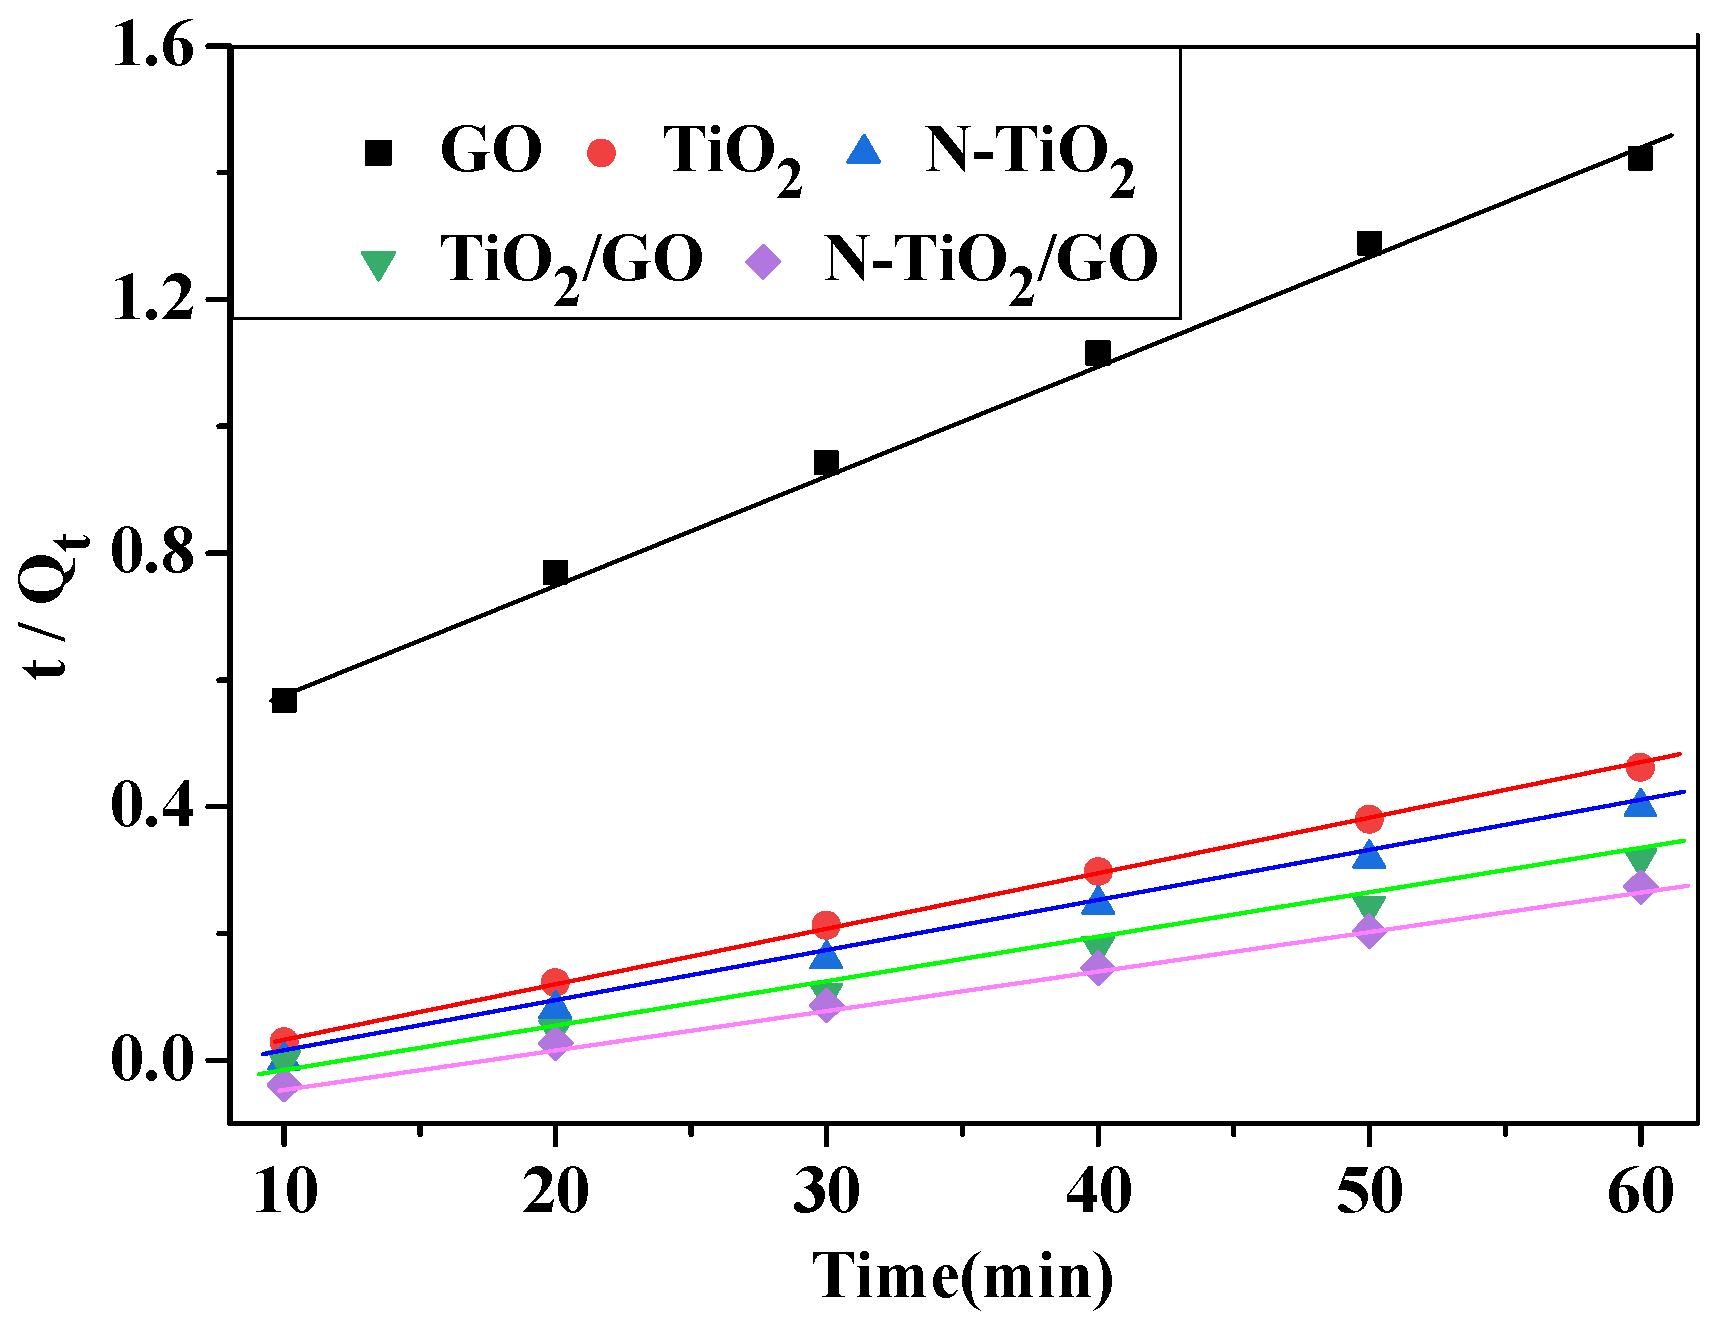
3.2. Adsorption Performance Analysis
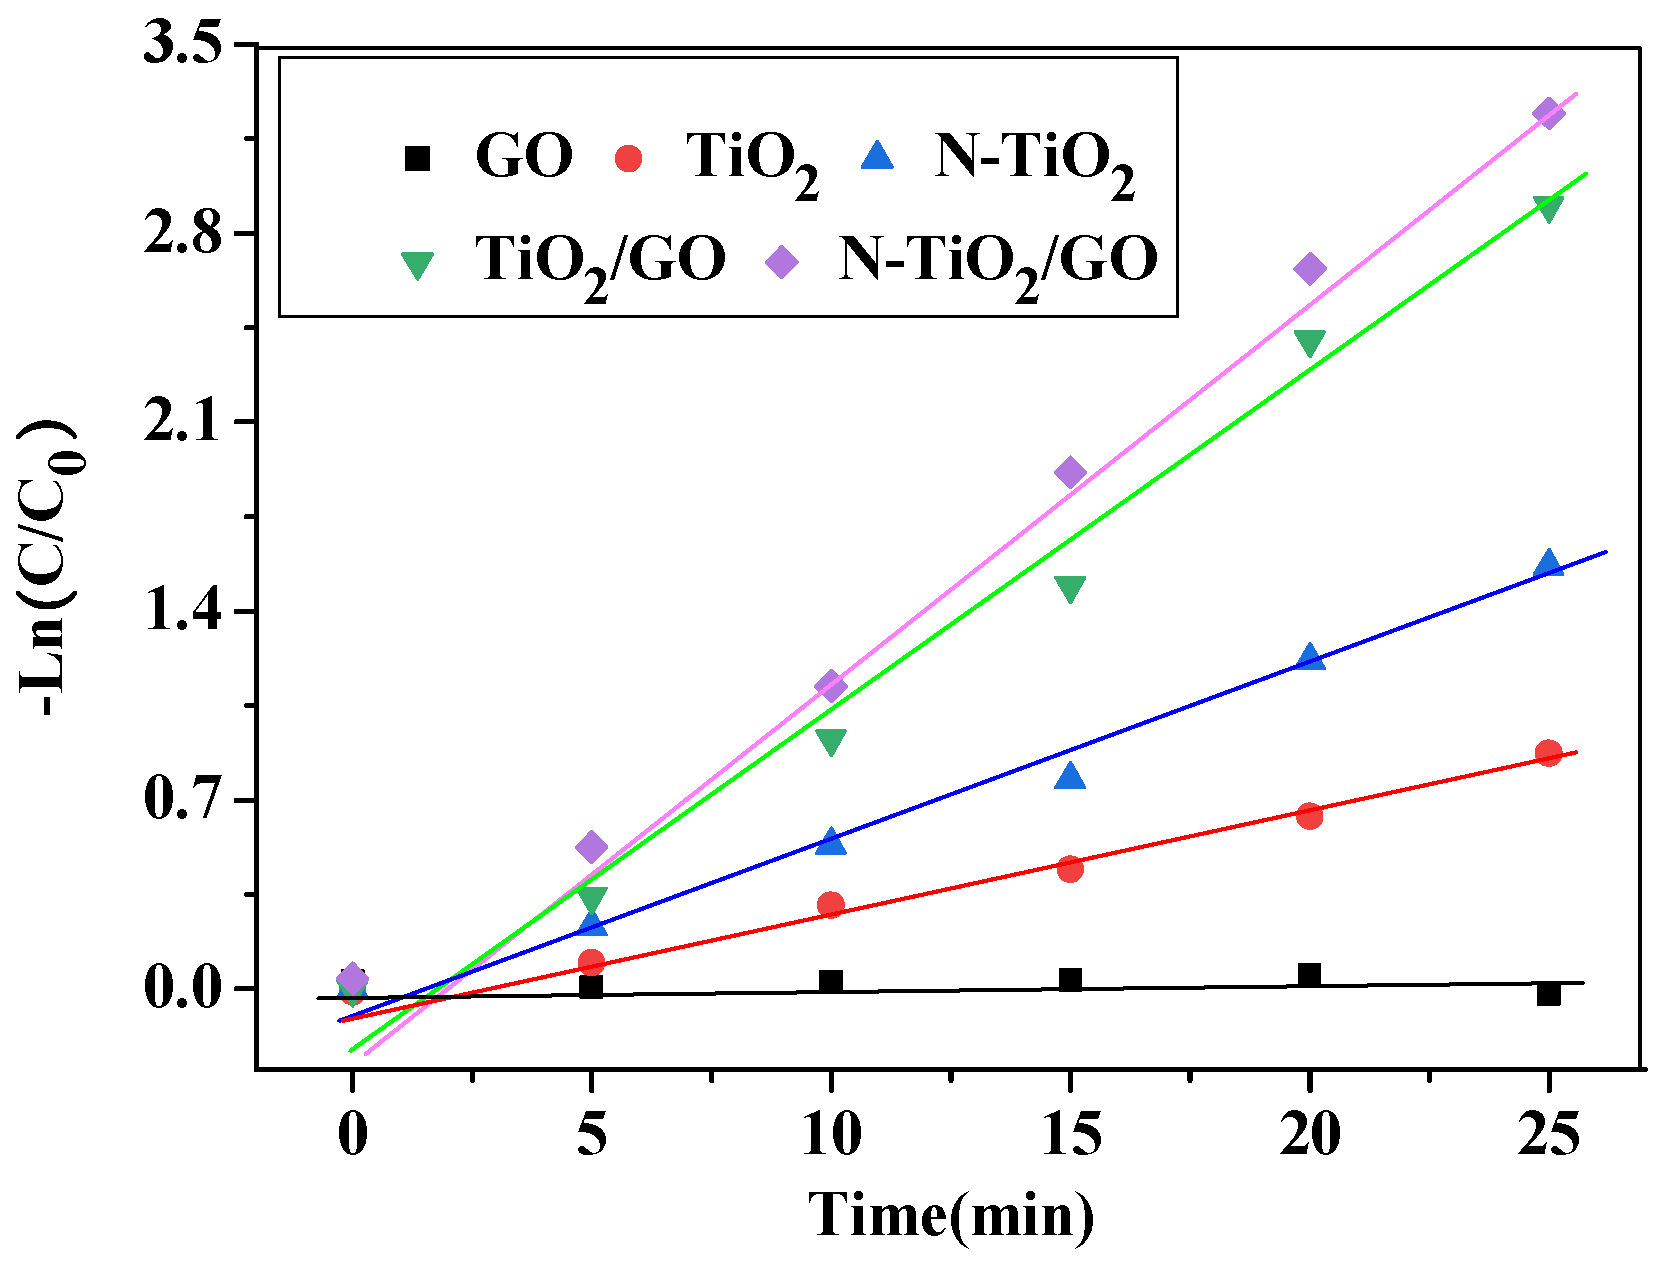
3.3. Photocatalysis Performance Analysis
4. Conclusions
Author Contributions
Funding
Institutional Review Board Statement
Informed Consent Statement
Data Availability Statement
Acknowledgments
Conflicts of Interest
References
- Tobaldi, D.M.; Dvoranová, D.; Lajaunie, L.; Rozman, N.; Figueiredo, B.; Seabra, M.P.; Škapin, A.S.; Calvino, J.J.; Brezová, V.; Labrincha, J.A. Graphene-TiO2 hybrids for photocatalytic aided removal of VOCs and nitrogen oxides from outdoor environment. Chem. Eng. J. 2021, 405, 126651. [Google Scholar] [CrossRef] [PubMed]
- Wei, Y.; Zhu, Y.; Jiang, Y. Photocatalytic self-cleaning carbon nitride nanotube intercalated reduced graphene oxide membranes for enhanced water purification. Chem. Eng. J. 2019, 356, 915–925. [Google Scholar] [CrossRef]
- Lv, T.; Wu, M.; Guo, M.; Liu, Q.; Jia, L. Self-assembly photocatalytic reduction synthesis of graphene-encapusulated LaNiO3 nanoreactor with high efficiency and stability for photocatalytic water splitting to hydrogen. Chem. Eng. J. 2019, 356, 580–591. [Google Scholar] [CrossRef]
- He, F.; Meng, A.; Cheng, B.; Ho, W.; Yu, J. Enhanced photocatalytic H2-production activity of WO3/TiO2 step-scheme heterojunction by graphene modification. Chin. J. Catal. 2020, 41, 9–20. [Google Scholar] [CrossRef]
- Checa, M.; Figueredo, M.; Aguinaco, A.; Beltrán, F.J. Graphene oxide/titania photocatalytic ozonation of primidone in a visible LED photoreactor. J. Hazard. Mater. 2019, 369, 70–78. [Google Scholar] [CrossRef] [PubMed]
- Singh, P.; Raizada, P.; Sudhaik, A.; Shandilya, P.; Thakur, P.; Agarwal, S.; Gupta, V.K. Enhanced photocatalytic activity and stability of AgBr/BiOBr/graphene heterojunction for phenol degradation under visible light. J. Saudi Chem. Soc. 2019, 23, 586–599. [Google Scholar] [CrossRef]
- Liu, C.; Zhang, A.Y.; Si, Y.; Pei, D.N.; Yu, H.Q. Photochemical protection of reactive sites on defective TiO2–x surface for electrochemical water treatment. Environ. Sci. Technol. 2019, 53, 7641–7652. [Google Scholar] [CrossRef]
- Walenta, C.A.; Courtois, C.; Kollmannsberger, S.L.; Eder, M.; Tschurl, M.; Heiz, U. Surface Species in Photocatalytic Methanol Reforming on Pt/TiO2 (110): Learning from Surface Science Experiments for Catalytically Relevant Conditions. ACS Catal. 2020, 10, 4080–4091. [Google Scholar] [CrossRef]
- Islam, M.T.; Dominguez, A.; Turley, R.S.; Kim, H.; Sultana, K.A.; Shuvo, M.A.I.; Alvarado-Tenorio, B.; Montes, M.O.; Lin, Y.; Gardea-Torresdey, J.; et al. Development of photocatalytic paint based on TiO2 and photopolymer resin for the degradation of organic pollutants in water. Sci. Total Environ. 2020, 704, 135406. [Google Scholar] [CrossRef]
- Zhang, Q.; Du, R.; Tan, C.; Chen, P.; Yu, G.; Deng, S. Efficient degradation of typical pharmaceuticals in water using a novel TiO2/ONLH nano-photocatalyst under natural sunlight. J. Hazard. Mater. 2021, 403, 123582. [Google Scholar] [CrossRef]
- Fatima, S.; Muzammal, M.; Rehman, A.; Rustam, S.A.; Shehzadi, Z.; Mehmood, A.; Waqar, M. Water pollution on heavy metals and its effects on fishes. Int. J. Fish. Aquat. Stud. 2020, 8, 6–14. [Google Scholar]
- Li, J.; See, K.F.; Chi, J. Water resources and water pollution emissions in China’s industrial sector: A green-biased technological progress analysis. J. Clean. Prod. 2019, 229, 1412–1426. [Google Scholar] [CrossRef]
- Shajudheen, V.P.M.; Viswanathan, K.; Rani, K.A.; Maheswari, A.U.; Kumar, S.S. A simple chemical precipitation method of titanium dioxide nanoparticles using polyvinyl pyrrolidone as a capping agent and their characterization. Int. J. Chem. Mol. Eng. 2016, 10, 556–559. [Google Scholar]
- Hakimi, B.; Ghorbanpour, M.; Feizi, A.A. Comparative Study between Photocatalytic activity of ZnO/bentonite Composites Prepared by Precipitation, Liquid-state Ion Exchange and Solid-state Ion Exchange Methods. J. Water Environ. Nanotechnol. 2018, 3, 273–278. [Google Scholar]
- Kamranvand, F.; Davey, C.J.; Sakar, H.; Autin, O.; Mercer, E.; Collins, M.; Williams, L.; Kolios, A.; Parker, A.; Tyrrel, S.; et al. Impact of fouling, cleaning and faecal contamination on the separation of water from urine using thermally driven membrane separation. Sep. Sci. Technol. 2018, 53, 1372–1382. [Google Scholar] [CrossRef] [PubMed] [Green Version]
- Rezaei, H.; Haghshenasfard, M.; Moheb, A. Optimization of dye adsorption using Fe3O4 nanoparticles encapsulated with alginate beads by Taguchi method. Adsorpt. Sci. Technol. 2017, 35, 55–71. [Google Scholar] [CrossRef] [Green Version]
- Kulli, V.R. On multiplicative minus indices of titania nanotubes. Int. J. Fuzzy Math. Arch. 2018, 16, 75–79. [Google Scholar]
- Tao, X.; Hu, C.; Xu, Z.; Zhu, M.; Xie, M.; Li, Y.; Li, G. Development and antiultraviolet properties of epoxidized styrene–butadiene–styrene nanofibers loaded with nanometer titania dioxide. J. Ind. Text. 2017, 46, 1715–1724. [Google Scholar] [CrossRef]
- Lavand, A.B.; Bhatu, M.N.; Malghe, Y.S. Visible light photocatalytic degradation of malachite green using modified titania. J. Mater. Res. Technol. 2019, 8, 299–308. [Google Scholar] [CrossRef]
- Chen, G.H.; Chen, H.S. Nanometer-Thick Sol–Gel Silica–Titania Film Infused with Superparamagnetic Fe3O4 Nanoparticles for Electromagnetic Interference Shielding. ACS Appl. Nano Mater. 2020, 3, 8858–8865. [Google Scholar] [CrossRef]
- Azeez, F.; Al-Hetlani, E.; Arafa, M.; Abdelmonem, Y.; Nazeer, A.A.; Amin, M.O.; Madkour, M. The effect of surface charge on photocatalytic degradation of methylene blue dye using chargeable titania nanoparticles. Sci. Rep. 2018, 8, 1–9. [Google Scholar] [CrossRef]
- Kuai, L.; Chen, Z.; Liu, S.; Kan, E.; Yu, N.; Ren, Y.; Fang, C.; Li, X.; Li, Y.; Geng, B. Titania supported synergistic palladium single atoms and nanoparticles for room temperature ketone and aldehydes hydrogenation. Nat. Commun. 2020, 11, 1–9. [Google Scholar] [CrossRef] [Green Version]
- Ahadi, A.; Rostamnia, S.; Panahi, P.; Wilson, L.D.; Kong, Q.; An, Z.; Shokouhimehr, M. Palladium comprising dicationic bipyridinium supported periodic mesoporous organosilica (PMO): Pd@ Bipy–PMO as an efficient hybrid catalyst for Suzuki–Miyaura cross-coupling reaction in water. Catalysts 2019, 9, 140. [Google Scholar] [CrossRef] [Green Version]
- Jiang, X.; Gray, P.; Patel, M.; Zheng, J.; Yin, J.J. Crossover between anti-and pro-oxidant activities of different manganese oxide nanoparticles and their biological implications. J. Mater. Chem. B 2020, 8, 1191–1201. [Google Scholar] [CrossRef]
- Kazeem, T.S.; Lateef, S.A.; Ganiyu, S.A.; Qamaruddin, M.; Tanimu, A.; Sulaiman, K.O.; Jillani, S.M.S.; Alhooshani, K. Aluminium-modified activated carbon as efficient adsorbent for cleaning of cationic dye in wastewater. J. Clean. Prod. 2018, 205, 303–312. [Google Scholar] [CrossRef]
- Bie, C.; Zhu, B.; Xu, F.; Yu, J. In situ grown monolayer N-doped graphene on CdS hollow spheres with seamless contact for photocatalytic CO2 reduction. Adv. Mater. 2019, 31, 1902868. [Google Scholar] [CrossRef]
- Kaymak, N.; Bayram, O.; Tataroğlu, A.; Bilge Ocak, S.; Oz Orhan, E. Electrical properties of Graphene/Silicon structure with Al2O3 interlayer. J. Mater. Sci. Mater. Electron. 2020, 31, 9719–9725. [Google Scholar] [CrossRef]
- Wang, G.; Zhang, Q.; Chen, Q.; Ma, X.; Xin, Y.; Zhu, X.; Ma, D.; Cui, C.; Zhang, J.; Xiao, Z. Photocatalytic degradation performance and mechanism of dibutyl phthalate by graphene/TiO2 nanotube array photoelectrodes. Chem. Eng. J. 2019, 358, 1083–1090. [Google Scholar] [CrossRef]
- Zhang, J.; Ma, P.; Hou, Z.; Zhang, X.; Li, C. One-Step Synthesis of SiO x@ Graphene Composite Material by a Hydrothermal Method for Lithium-Ion Battery Anodes. Energy Fuels 2020, 34, 3895–3900. [Google Scholar] [CrossRef]
- Al-Gaashani, R.; Najjar, A.; Zakaria, Y.; Mansour, S.; Atieh, M.A. XPS and structural studies of high quality graphene oxide and reduced graphene oxide prepared by different chemical oxidation methods. Ceram. Int. 2019, 45, 14439–14448. [Google Scholar] [CrossRef]
- Gupta, P.K.; Chauhan, D.; Khan, Z.H.; Solanki, P.R. ZrO2 nanoflowers decorated with graphene quantum dots for electrochemical immunosensing. ACS Appl. Nano Mater. 2020, 3, 2506–2516. [Google Scholar] [CrossRef]


Publisher’s Note: MDPI stays neutral with regard to jurisdictional claims in published maps and institutional affiliations. |
© 2021 by the authors. Licensee MDPI, Basel, Switzerland. This article is an open access article distributed under the terms and conditions of the Creative Commons Attribution (CC BY) license (https://creativecommons.org/licenses/by/4.0/).
Share and Cite
Liu, S.; Su, Z.-L.; Liu, Y.; Yi, L.-Y.; Chen, Z.-L.; Liu, Z.-Z. Mechanism and Purification Effect of Photocatalytic Wastewater Treatment Using Graphene Oxide-Doped Titanium Dioxide Composite Nanomaterials. Water 2021, 13, 1915. https://doi.org/10.3390/w13141915
Liu S, Su Z-L, Liu Y, Yi L-Y, Chen Z-L, Liu Z-Z. Mechanism and Purification Effect of Photocatalytic Wastewater Treatment Using Graphene Oxide-Doped Titanium Dioxide Composite Nanomaterials. Water. 2021; 13(14):1915. https://doi.org/10.3390/w13141915
Chicago/Turabian StyleLiu, Sheng, Zi-Lin Su, Yi Liu, Lin-Ya Yi, Zhan-Li Chen, and Zhen-Zhong Liu. 2021. "Mechanism and Purification Effect of Photocatalytic Wastewater Treatment Using Graphene Oxide-Doped Titanium Dioxide Composite Nanomaterials" Water 13, no. 14: 1915. https://doi.org/10.3390/w13141915