
The Changing and Distribution Laws of Oxygen Transfer Efficiency in the Full-Scale IFAS Process

1
School of Environmental Municipal Engineering, Qingdao University of Technology, 11 Fushun Road, Qingdao 266033, China
2
Qingdao Capital Ruihai Water CO., LTD, Qingdao 266033, China
*
Author to whom correspondence should be addressed.
Water 2021, 13(14), 1933; https://doi.org/10.3390/w13141933
Submission received: 8 June 2021
/
Revised: 11 July 2021
/
Accepted: 12 July 2021
/
Published: 13 July 2021
Abstract
:The integrated fixed-film activated sludge (IFAS) process has been widely used in the upgrading of wastewater treatment plants (WWTPs). The oxygen transfer efficiency (αOTE) is of great significance to the design and operation of the IFAS process. The carrier filling ratio (CFR) and aeration type are two critical factors affecting αOTE and standard oxygen transfer efficiency (αSOTE). However, the distribution and changing laws of αOTE and αSOTE in the full-scale IFAS process areunclear. To optimize the operation of a WWTP and to improve the αOTE of the aeration systems, several off-gas tests were conducted under different aeration types and different CFRs. The results show that for the aerobic tank investigated (the ratio of length and width was 8:1), the αOTE and the αSOTE of the middle of the aeration systems were higher than those of the other two sides. However, the reason for the low αOTE at the beginning and the end of the tank may be different. Coarse-bubble aeration systems had a lower αOTE and almost the same oxygenation capacity (αSOTE) as the fine-bubble aeration systems under constant CFR (43%). The average αSOTE (18.7–28.9%) of the hybrid aeration systems increased with increasing CFR (7.7–57.7%), and different locations exhibited different degrees of change. The results reveal the distribution and changing law of the αOTE of aeration systems in the IFAS process, and attention should be paid to the improvement of the OTE of the plug-flow IFAS process.
1. Introduction
The integrated fixed-film activated sludge (IFAS) process is a hybrid activated sludge/biofilm process [1]. The biomass attached to carrier elements moves freely along with the water in the reactor. The carriers are kept in the reactor by screens [2,3]; therefore, the biomass of the IFAS process is much higher than that of the conventional activated sludge (CAS) process. Due to high biomass, the IFAS process has strong nitrogen and phosphorus removal capacity and requires little space [4]; therefore, the IFAS process is widely used in the upgrading of wastewater treatment plants (WWTPs) [5]. However, to keep the carriers suspended, the IFAS process requires stronger turbulence [6], which leads to the IFAS process requiring much more aeration than the CAS process; therefore, the IFAS process has the disadvantage of poor aeration energy efficiency [7]. The energy required for the electromechanical equipment used in aeration represents 50–80% of the total energy costs of WWTPs [8]. Therefore, improving the oxygen transfer efficiency (αOTE) of the aeration system can produce significant economic effects for the IFAS process.
Many factors affect the OTE of aeration systems, such as the airflow rate [9,10], diffuser density [11,12], contaminant concentration [13,14,15], and sludge characteristics [16,17]. However, the influence of these factors is not the same [8]. The aeration type and carrier filling ratio (CFR) are two significant impact factors among these factors due to the existence of carriers [18]. Regarding the effects of aeration type on the OTE of aeration systems, on the one hand, a coarse-bubble aeration system produces strong turbulence to keep the carriers fluidized well [19]. Still, it also has a very low αOTE due to the large size of bubbles [5]. Fortunately, the αOTE of coarse-bubble aeration systems improves with an increasing CFR [20,21]. On the other hand, although fine-bubble aeration systems have a much higher αOTE than coarse-bubble aeration systems [22]; however, the increase of the CFR results in a slight improvement of the αOTE of fine-bubble aeration systems [23], and sometimes the αOTE of coarse-bubble aeration systems can be higher than that of fine-bubble aeration systems [24].
Regarding the CFR, Barwal found an optimum CFR of 40%, and when the CFR exceeded 40%, the oxygen transfer coefficient (KLa) decreased [25]. Sun investigated the KLa of different aeration types in the moving-bed biofilm reactor (MBBR) process under a CFR ranging from 20% to 50% and found that the highest KLa was achieved under a CFR of 40% [26]. However, the change in αOTE was more unpredictable because of the combined effect of all influencing factors in CAS [27]. Due to the existence of the carriers, the full-scale IFAS process is thus more complex and changeable. As a result, the distribution and changing law of the CFR and aeration type on αOTE and αSOTE in the full-scale IFAS process is not very clear [28]. To improve the OTE of aeration systems in the full-scale IFAS process, the effects of the CFR and aeration type should be investigated.
This study investigated the effects of the CFR and aeration type on the αOTE and αSOTE of aeration systems and determined the distribution and changing law of αOTE and αSOTE of the aeration systems in the full-scale IFAS process. Finally, the study validates our understanding of IFAS systems and aeration technologies and provides data support and experience for the design and operation of WWTPs.
2. Materials and Methods
2.1. Process Operation
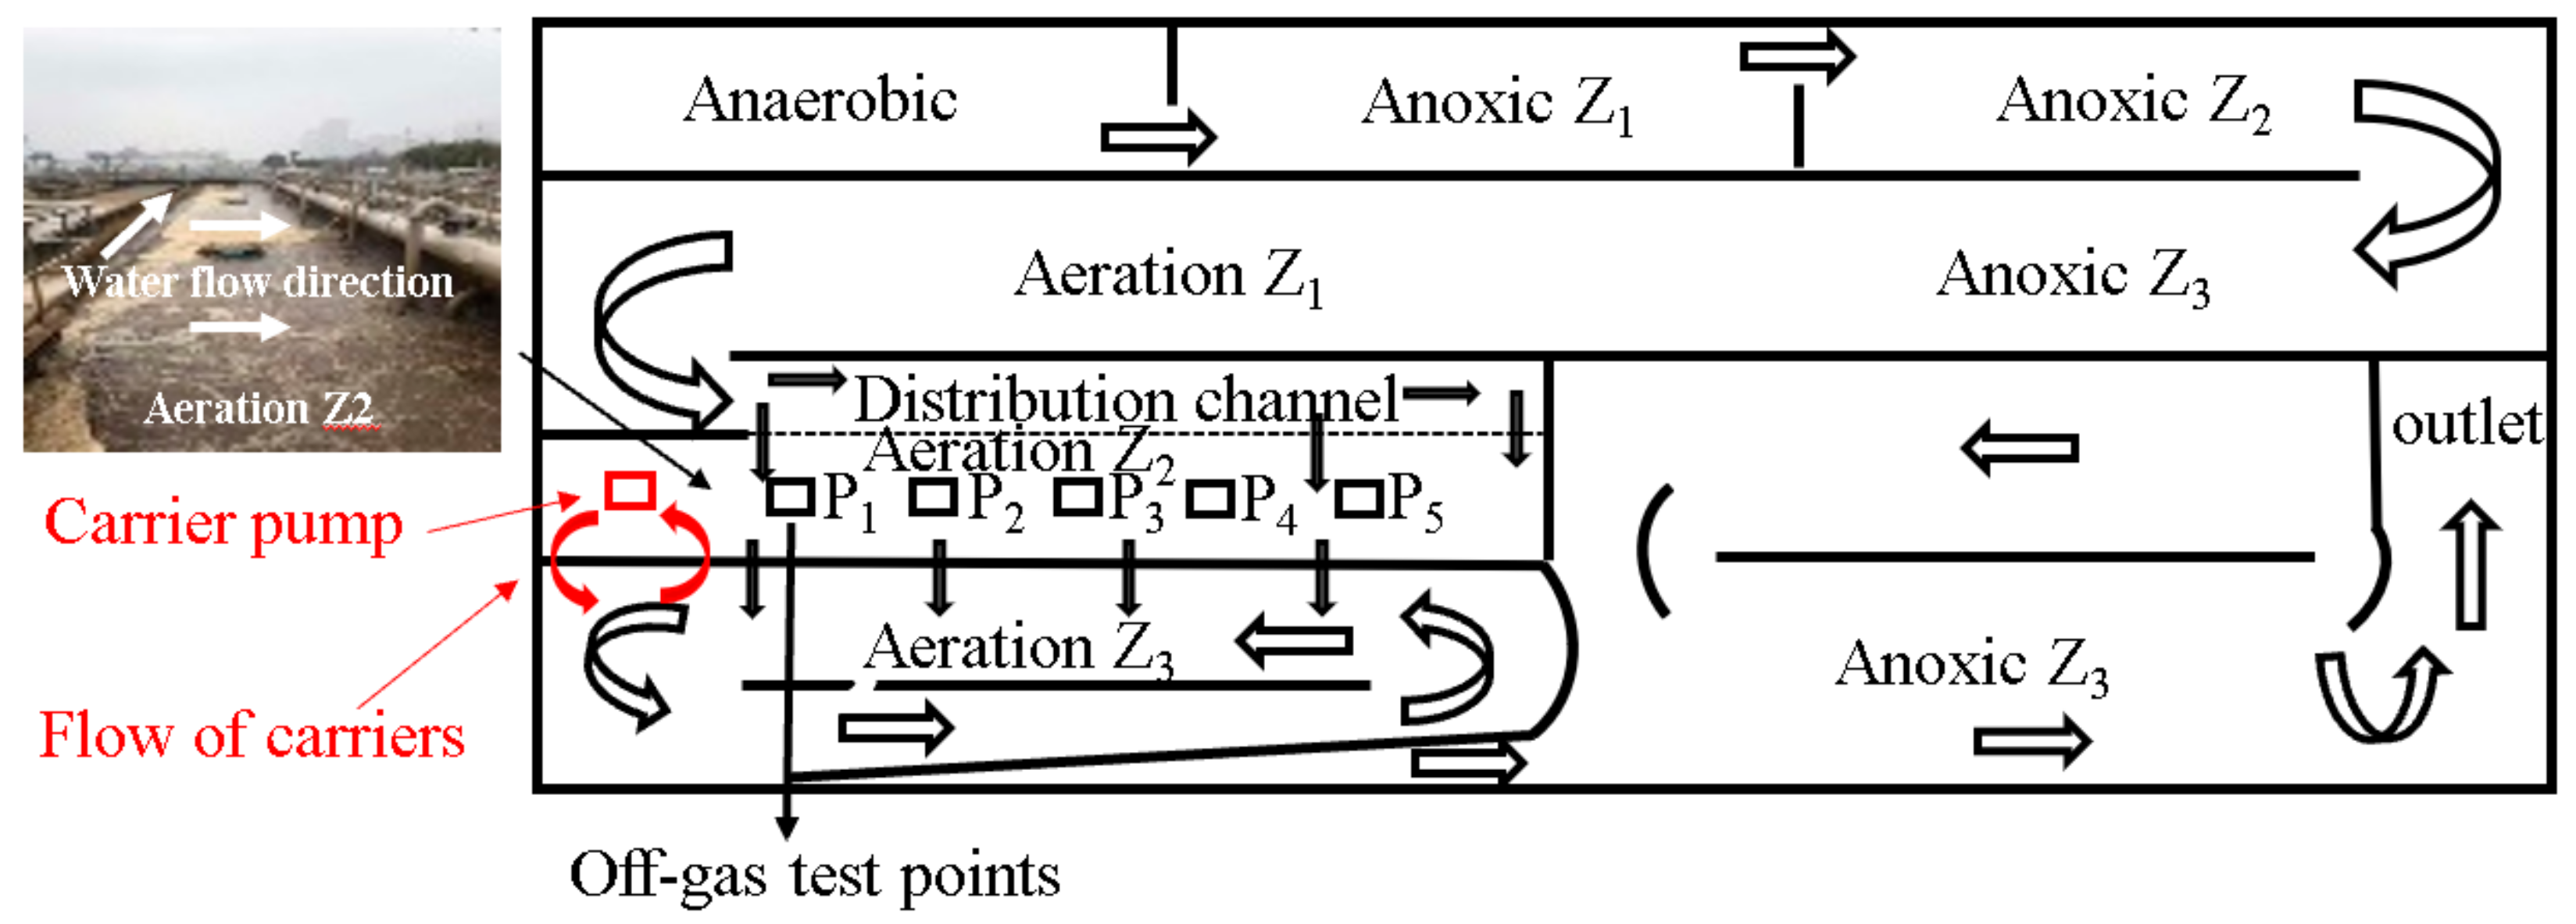
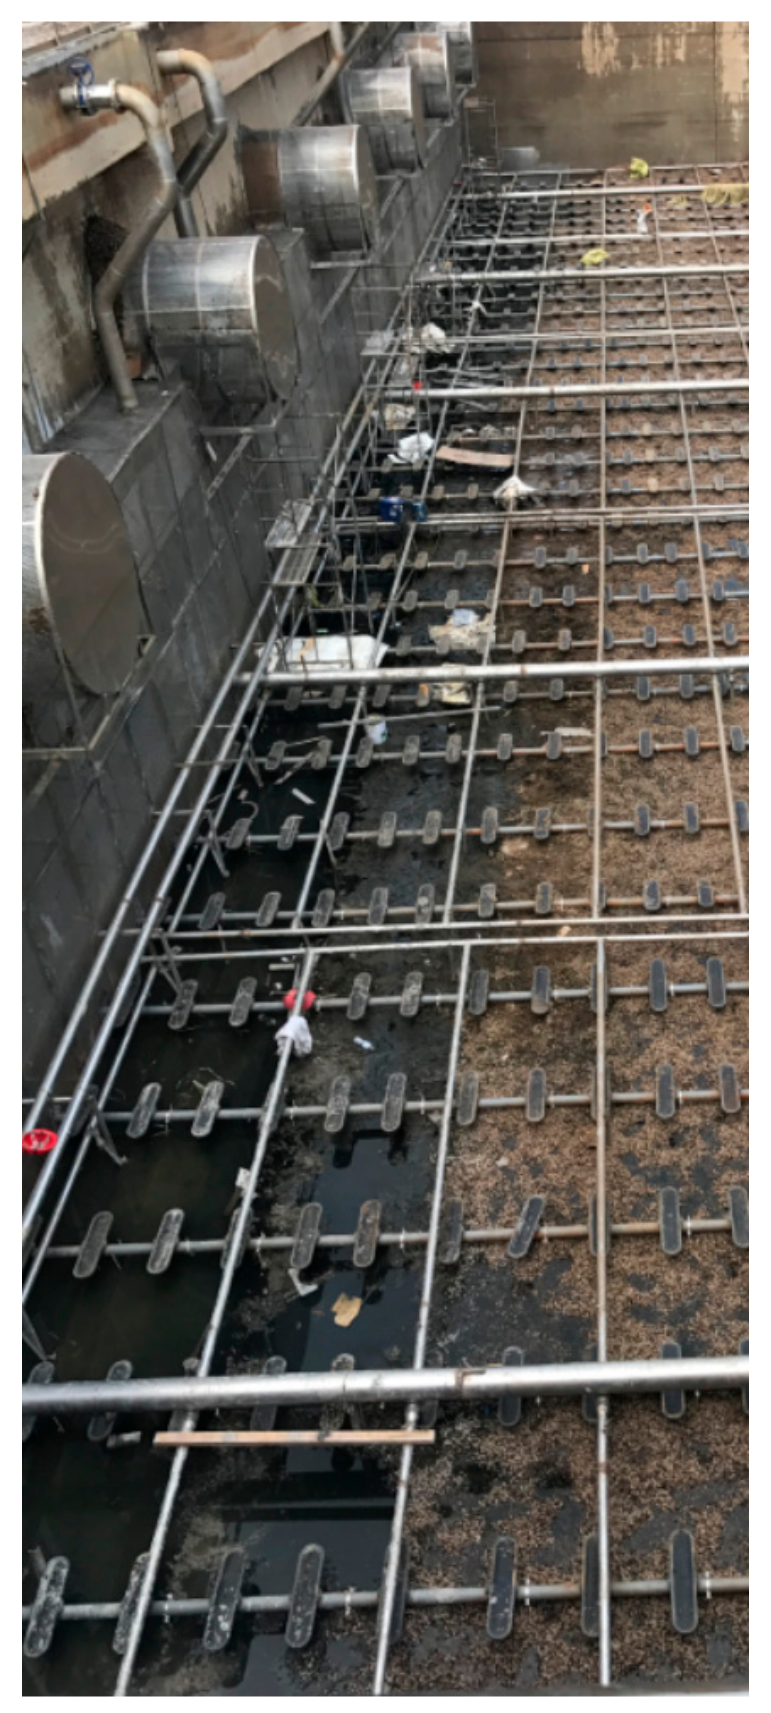
The WWTP was located in Qingdao, China, and consisted of influent screening, primary clarifiers, conventional plug flow activated sludge and IFAS process, secondary clarifiers, effluent cloth filters, and disinfection. The treatment capacity of the WWTP was 250,000 m3/d, and the effluent met the standard A of GB18918-2002 of China. The operating conditions of the WWTP during testing are shown in Table 1. The tank geometry and off-gas test points are shown in Figure 1. The study was conducted in aerobic tank Z2 (L × W × D = 47 m × 8 m × 6 m), and the full-scale IFAS reactor (L × W × D = 47 m × 8 m × 6 m) was equipped with the carriers (Spring Water-Treatment, Ltd., Qingdao, China) with a specific surface area of 500 m2/m3 and a density of 0.96 g/m3. As shown in Figure 2, the coarse-bubble (stainless steel with an orifice size of 5 mm) aeration systems and the fine-bubble (Supratec, OXYFLEX® MF650, Shanghai, China) aeration systems constituted the aeration systems of the IFAS process. The tank was fully covered with the two kinds of aeration systems. The fine-bubble aeration systems were installed 0.5 m above the ground, and the coarse-bubble aeration systems were installed 0.7 m above the ground. The fine-bubble aeration systems and the coarse-bubble aeration systems can work alone or work simultaneously (called hybrid aeration systems). The airflow rates of the coarse-bubble, the fine-bubble, and the hybrid aeration systems during the experiments were 1783 m3/h, 1351 m3/h, and 2262 m3/h, respectively.
2.2. Operation Parameters
The study was conducted in aerobic tank Z2 (Figure 1). The working volume of the tank was 3757 m3, and the CFR of the tank was 46%. The off-gas test was performed at the selected five points (P1–P5; Figure 1), and the spacing between the test points was 8 m. As shown in Figure 1, the wastewater comes from the Aeration Z1, then goes through the water distribution channel, and the water distribution channel distributes the wastewater (the dotted line in Figure 1). The wastewater goes through from Aeration Z2 to Aeration Z3. The carriers were pumped from Aeration Z2 to Aeration Z3 or from Aeration Z3 to Aeration Z2 by a carrier pump (200 m3/h, ZhongKai, Hebei, China). The CFR of the Aeration Z2 was controlled from 7.7% to 57.7%). The running time of the pump was 14 h (from 17:00 to 7:00 the next day). The valve openings of the coarse-bubble aeration systems and fine-bubble aeration systems were 50% and 100%, respectively. The coarse-bubble aeration systems and the fine-bubble aeration systems worked the hybrid aeration systems simultaneously, with the valve openings of the two aeration systems being 50%.
2.3. Determination of αSOTE
The αOTE reflects the actual oxygen transfer capacity, and the αSOTE can be used to compare the oxygenation capacity of different aeration systems. The off-gas tests were conducted under process conditions according to Appendix E of The American Society of Civil Engineers (ASCE) (2018). The schematic diagram of the off-gas method is shown in Figure 3. The dissolved oxygen (DO) was measured with an optical LDO sensor (Hach-Lange, Berlin, Germany). The DO sensor was submerged in the water and beside the collection hood. The electrical conductivity was measured with a 3798-S sensor (Hach-Lange, Berlin, Germany). The off-gas was captured by a hood and diverted to an X-STREAM gas analyzer (Emerson Electric Company, St. Louis, USA). The mole ratio of O2 was measured in the ambient air (MRi) and off-gas (MRe), which was recorded every minute during the tests, and water vapor and CO2 were removed before the off-gas analysis. Appendix E of ASCE (2018) recommended 6–13 mins for each test, and each test should have taken no less than 4 h in this experiment. The αOTE and the αSOTE were calculated as Formulas (1) and (2):
where MRi is the mole ratio of O2 in ambient air, and MRe is the mole ratio of O2 in off-gas.
where θ is the coefficient for temperature correction, which is 1.024, C is the mixed liquor DO concentration, is the saturation DO concentration at 20 °C, is the saturation DO concentration at the experimental temperature, and β is the salinity correction factor.
3. Results and Discussion
3.1. Effects of Aeration Type on αOTE of the IFAS Process
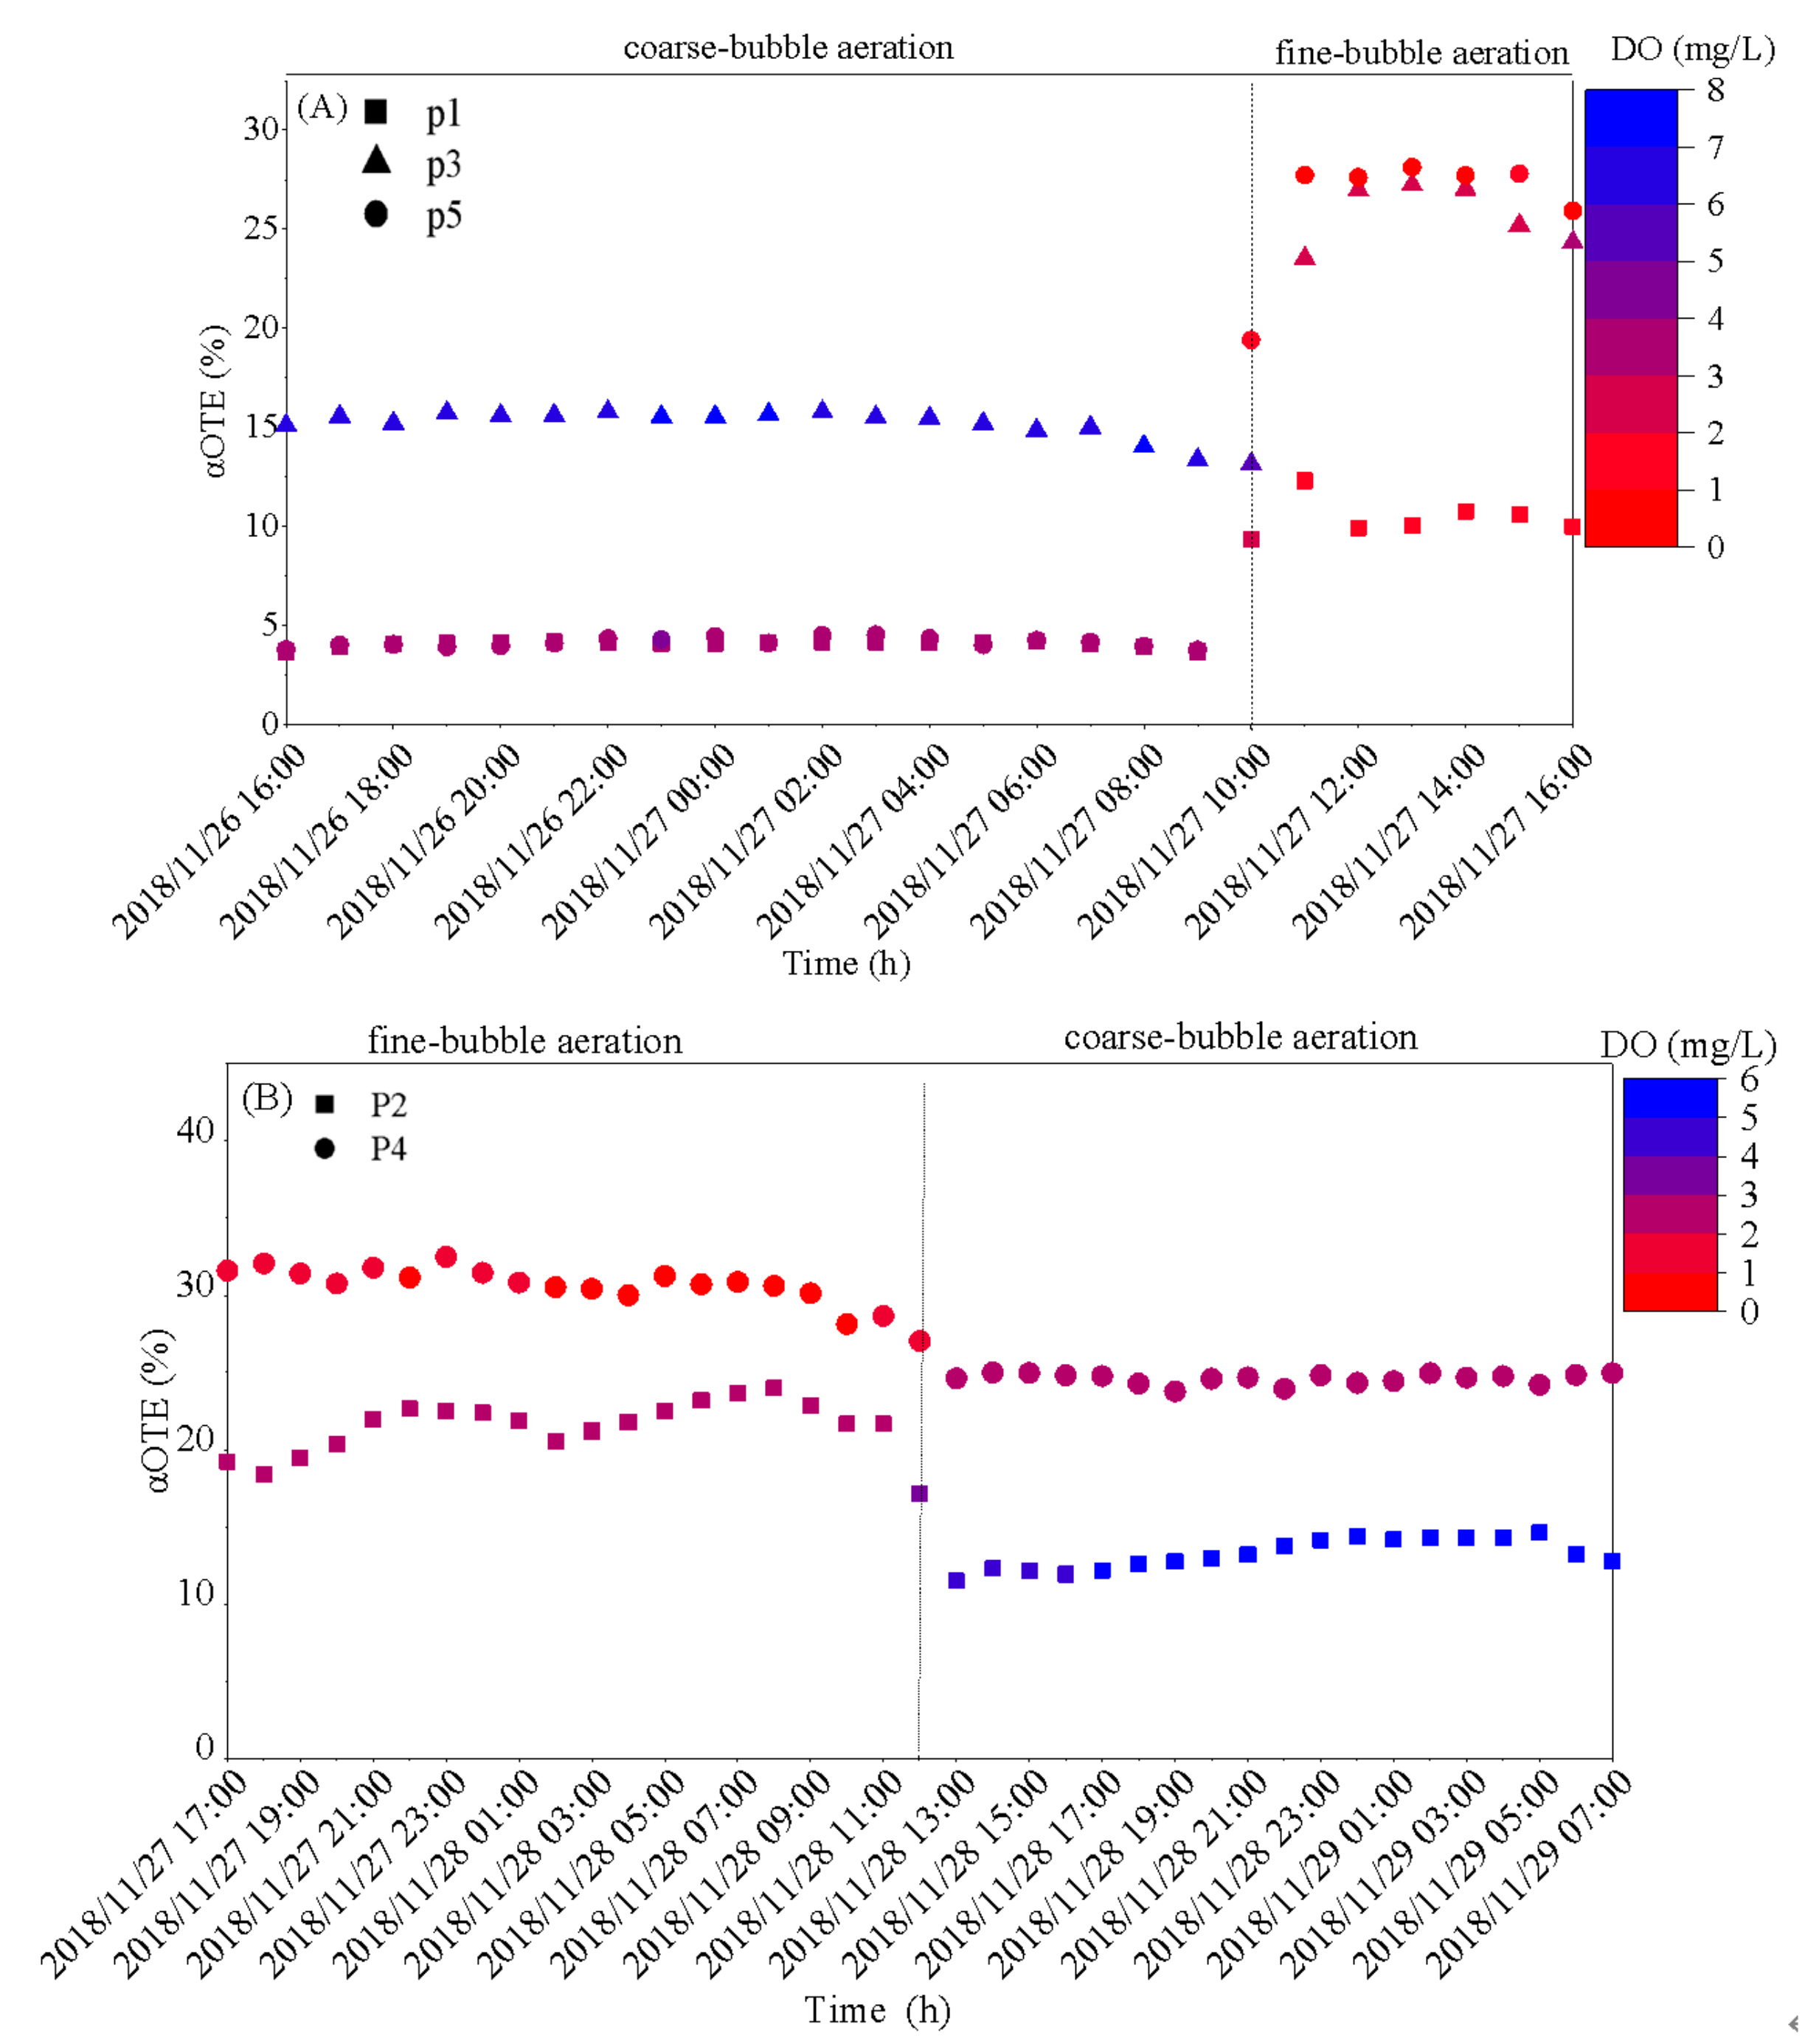
The tests were conducted under the coarse-bubble aeration systems and fine-bubble aeration systems with the constant CFR (43%), respectively. Additionally, the airflow rates of the coarse-bubble aeration systems and fine-bubble aeration systems were 1783 m3/h and 1351 m3/h, respectively.
As shown in Figure 4, the vertical axis stands for the αOTE, and the color scale stands for the DO concentration. The αOTE of the fine-bubble aeration systems was greater than that of the coarse-bubble aeration system. However, the DO showed the opposite pattern. After altering the aeration type (change the coarse-bubble aeration to fine-bubble aeration), for P3, αOTE increased from 15% to 25%, but DO decreased from 6 to 3 mg/L (Figure 4A). At the same time, for P5, αOTE increased obviously from 4% to 27%, but DO decreased from 4 to 1 mg/L (Figure 4A). For P2, it was also apparent that after altering the aeration type, αOTE decreased from 22% to 13% (Figure 4B); at the same time, DO increased from 2.5 to 5 mg/L. Due to the high aeration and large bubbles, the coarse-bubble aeration systems were less energy efficient than the fine-bubble aeration systems. The difference in αOTE between the two aeration systems was significant for P2, P3, and especially for P5.
Previous studies have shown that the application of fine-bubble aeration systems in the IFAS process was more energy efficient than coarse-bubble aeration systems. On the one hand, fine-bubble aeration systems can produce small bubbles. The bubbles have a very high specific surface area. On the other hand, a low DO concentration leads to a high concentration gradient [29]. As a result, the mass transfer force of fine-bubble aeration systems is higher than coarse-bubble aeration systems. However, few studies have reported the uneven distribution of αOTE in the full-scale IFAS process compared with the conventional activated sludge process [7]. The αOTE of different test points had different change degrees, which may have been due to the migration of carriers, which led to the uneven distribution of the carriers [30], and finally accumulated at the end of the tank (P5). As a result, although the CFR was constant, the uneven distribution of the carriers may have caused the different distribution and changing law of αOTE along with the aerobic tank.
3.2. Effects of Aeration Type on the αSOTE of IFAS
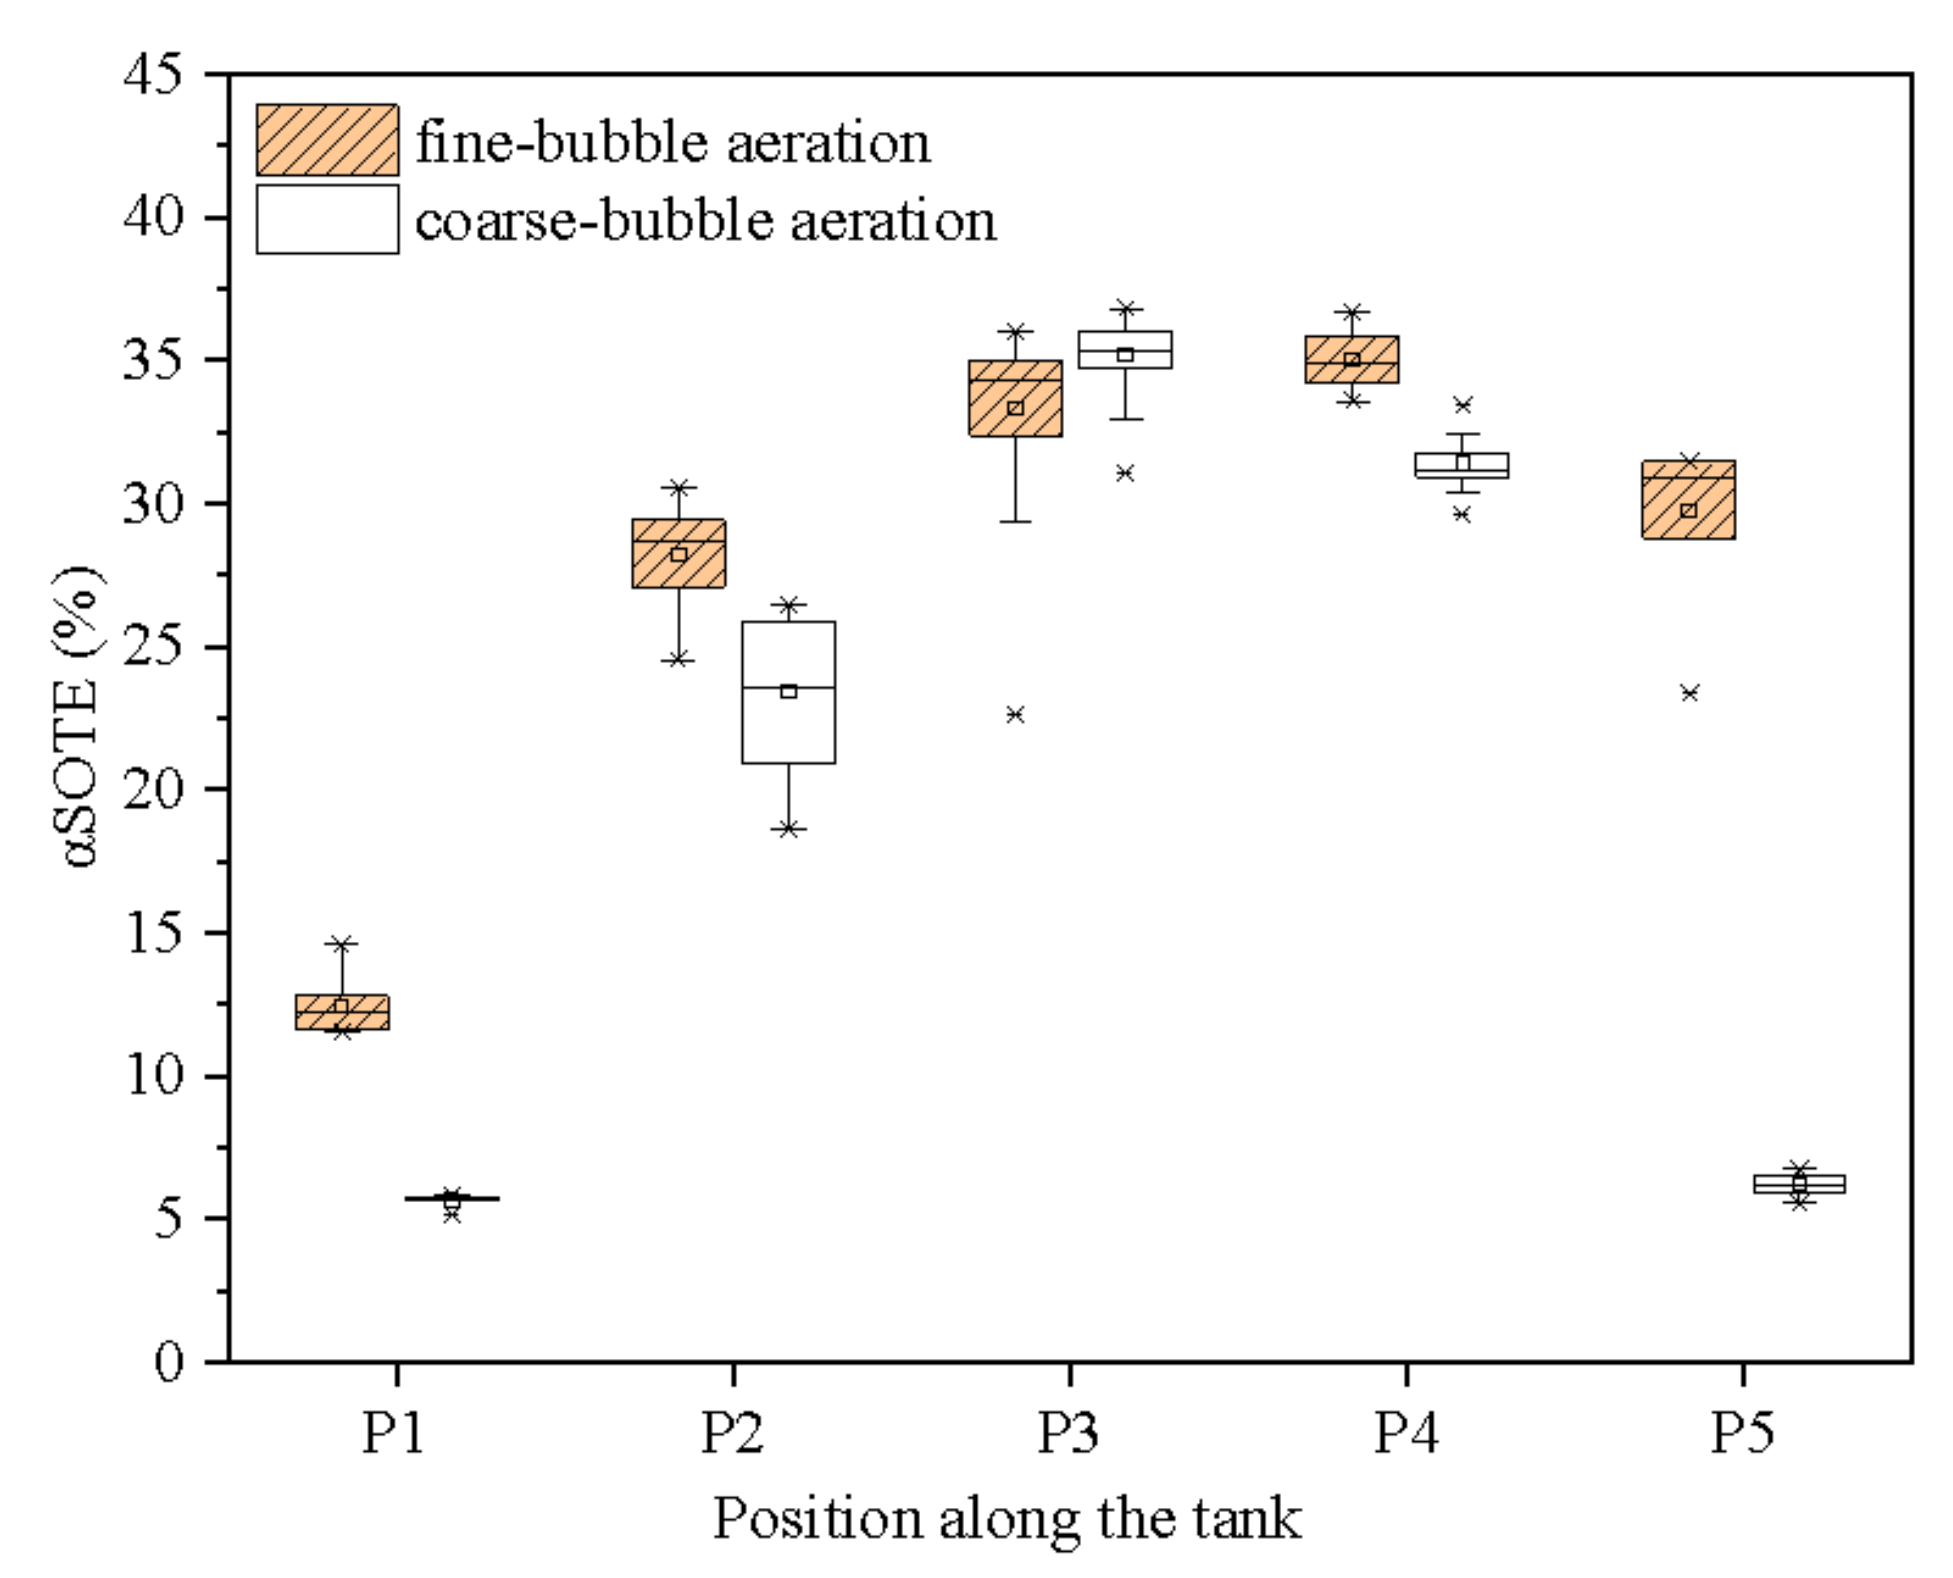
As shown in Figure 5, the αSOTE of coarse-bubble aeration systems and fine-bubble aeration systems were compared at a constant CFR. The αSOTE of the middle of the aeration systems was higher than that of the other two sides. For P2, P3, and P4, the αSOTE of coarse-bubble aeration systems was close to that of fine-bubble aeration systems. The highest αSOTE of fine-bubble aeration systems was 35% (P4), and the lowest αSOTE was 12.5% (P1). For coarse bubble aeration systems, the highest αSOTE and lowest αSOTE were 5.7% (P1) and 35.2% (P3), respectively. The most significant difference of the αSOTE between the fine-bubble aeration systems (29.7%) and the coarse-bubble aeration systems (6.2%) was at P5.
The reason that fine- and coarse-bubble aeration systems had the same αSOTE in the middle of the aerobic tank was that the carriers could spilt the large bubbles into small bubbles [31]. Thus, the specific surface area of bubbles increased. In addition, the blocking effect of the carriers could increase the path of the bubbles [32] and prolong the residence time of bubbles [33]. In addition to the high turbulence intensity, the oxygen mass transfer rate at the gas–liquid interface was improved. The above reasons finally promoted the αSOTE of coarse-bubble aeration systems. The results of Sander’s pilot-scale experiments [23] (in which the CFR was 50%, and the αSOTEs of coarse- and fine-bubble aeration were 22.3% and 30.5%, respectively) were helpful for application to full-scale aeration systems.
The uneven distribution of αSOTE along the aerobic tank may be due to three possibilities: (1) uneven distribution of the load, (2) uneven distribution of carriers, and (3) diffuser fouling. For the first possibility, an increase in the concentration of pollutants would significantly reduce the oxygenation capacity of aeration systems, especially surfactants [34,35]. For fine-bubble aeration systems, the α factors ranged from 0.17 to 0.7 [36], and the αSOTE of the beginning of the tank was lower than that of the end of the tank. The pollutants attached to the gas–liquid interface could hinder the oxygen mass transfer rate [37], especially the surfactant, and could significantly reduce αSOTE [38]. For the second possibility, an uneven water distribution may lead to a plug–flow regime. It may cause an uneven distribution of carriers [30], and different CFRs may lead to different αSOTE values. For the third possibility, the fouling of the diffusers had a more noticeable effect on fine-bubble aeration systems [39,40] but had little impact on coarse-bubble aeration systems [41]. Therefore, the reason for the difference in the distribution law of the fine-bubble and the coarse-bubble aeration systems may be different. For fine-bubble aeration systems, uneven distribution of load and fouling of the diffusers may be the major factor. For coarse-bubble aeration systems, uneven distribution of carriers may be the principal factor. For P5, the high CFR led to the packing of carriers. As a result, the αSOTE of coarse-bubble aeration systems became relatively low with the increased airflow rate.
3.3. Effects of the CFR on the αOTE of IFAS
The hybrid aeration systems were often adopted in the IFAS process. Therefore, the distribution and change law of αOTE in the hybrid aeration systems under different CFRs (7.7–57.7%) was investigated.
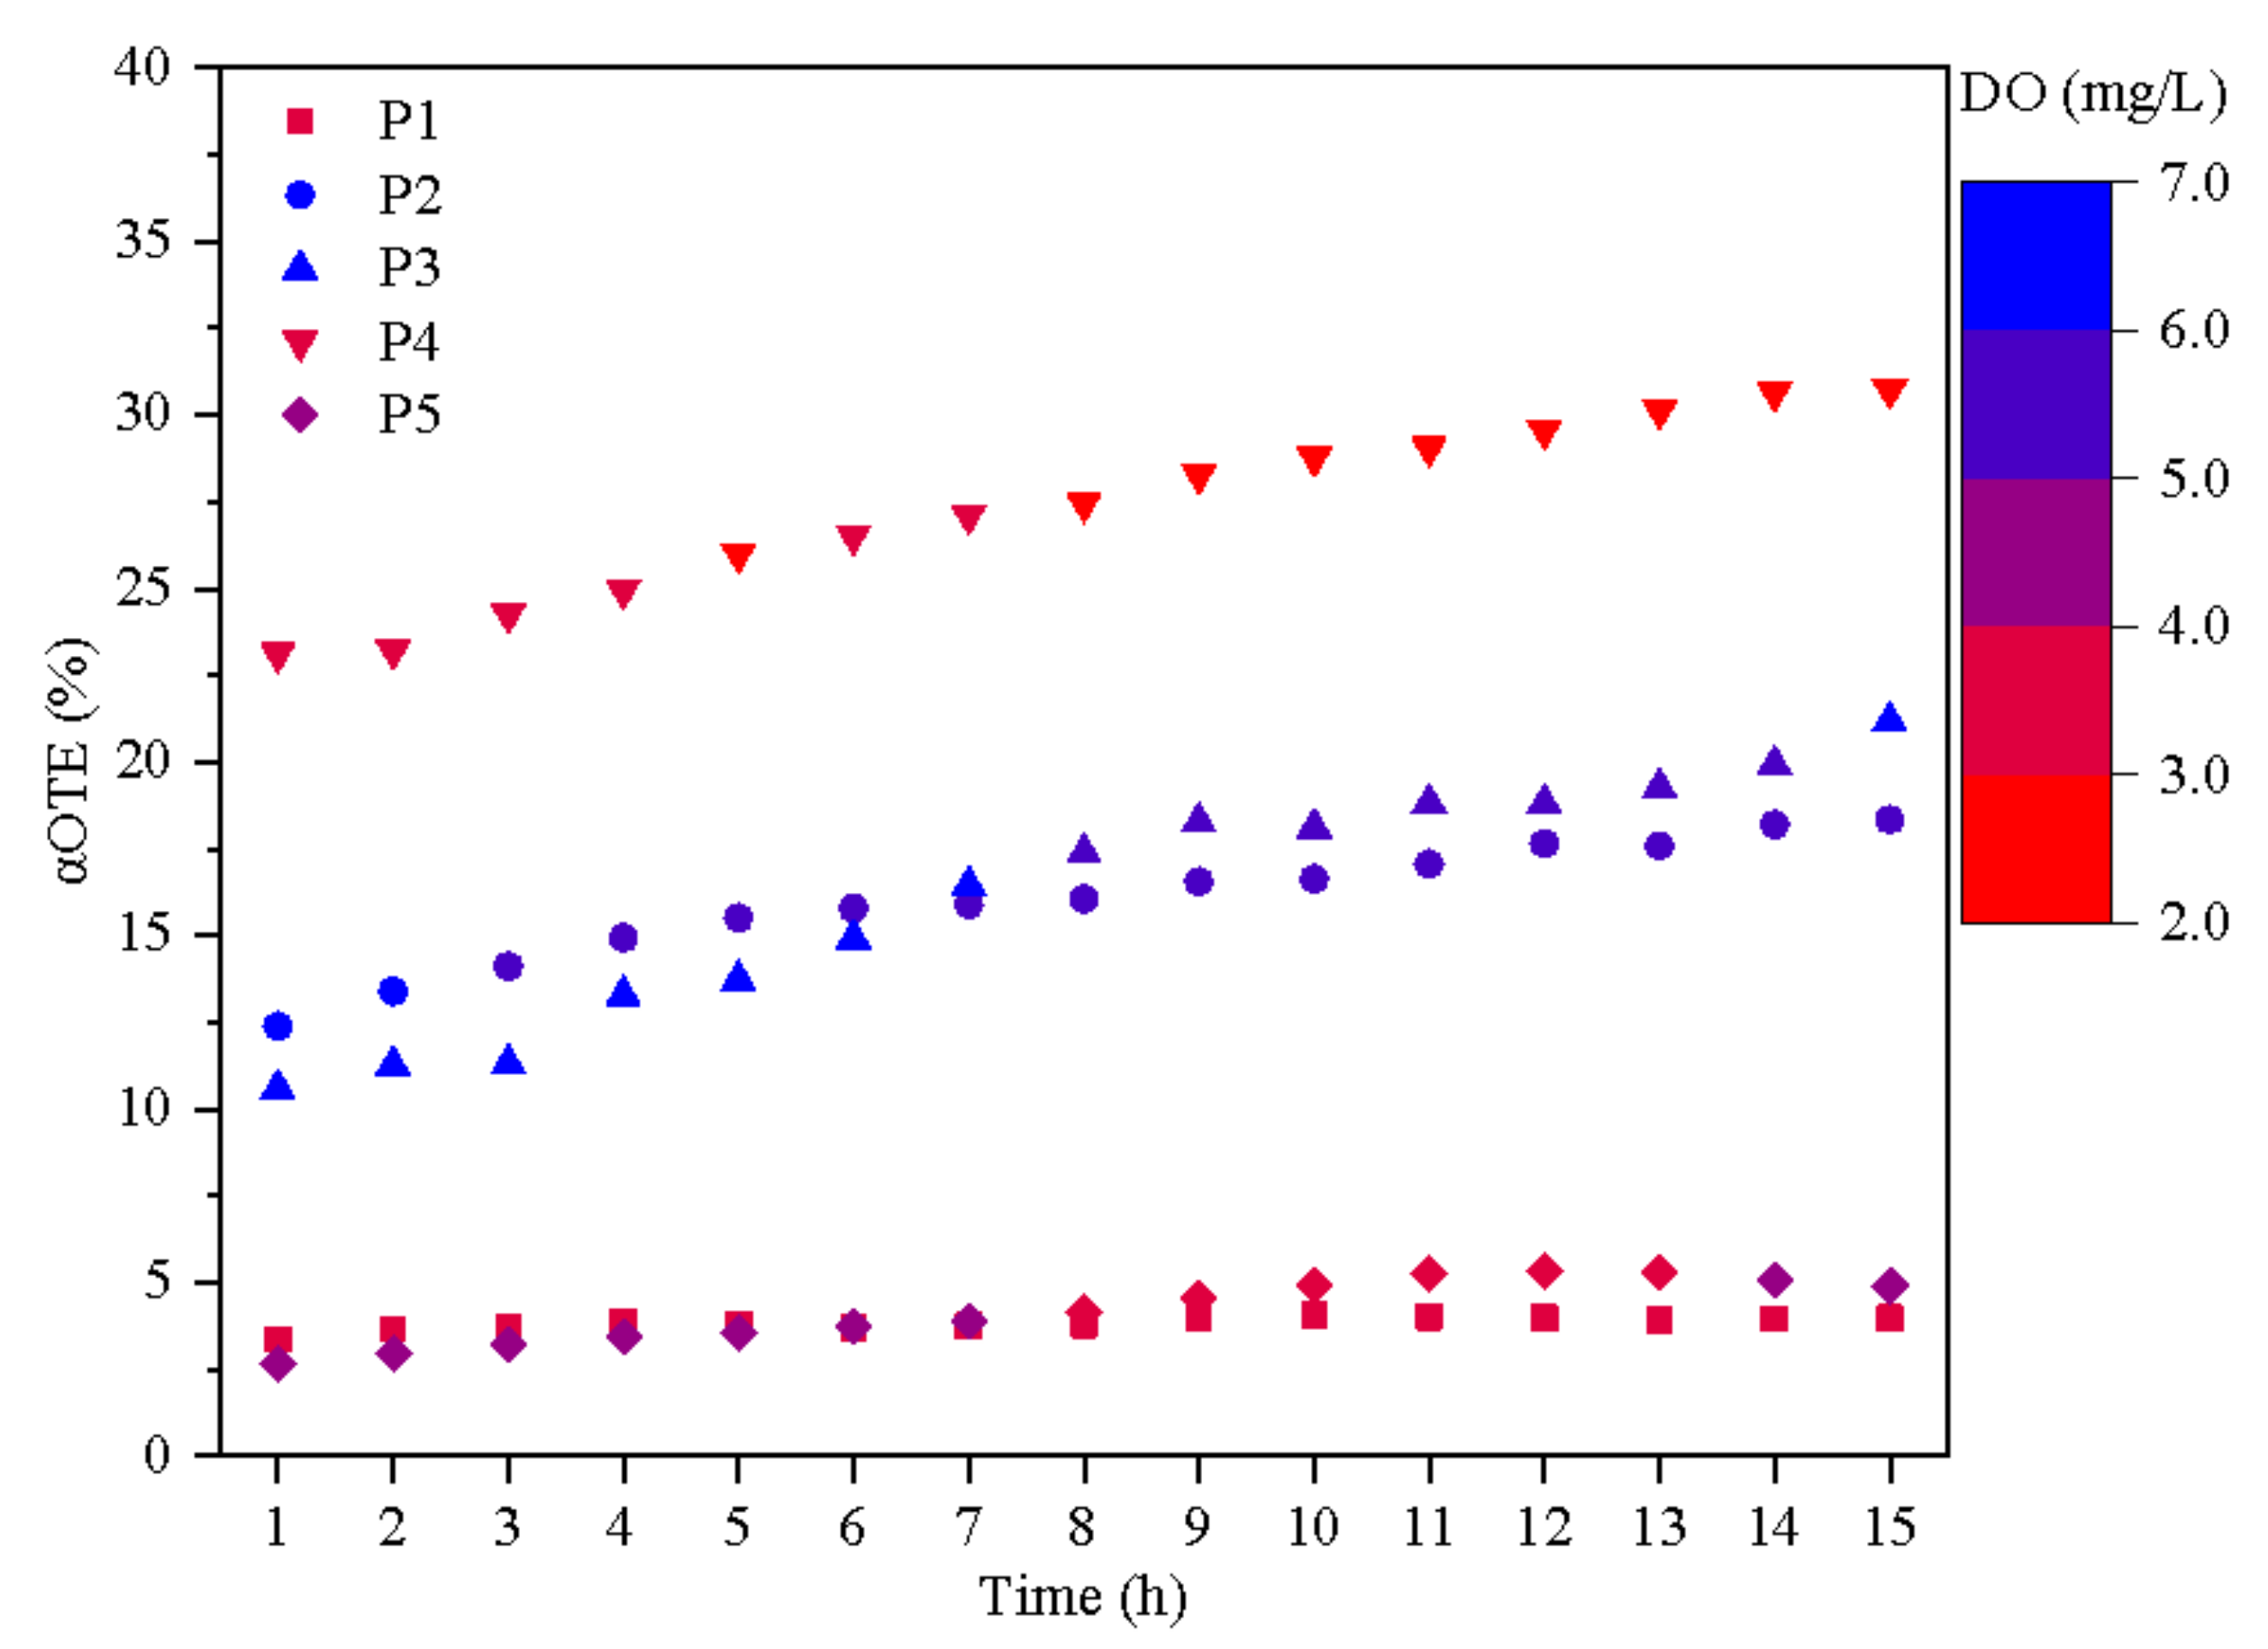
As shown in Figure 6, the vertical axis was the αSOTE of each point, and the color scale was the DO concentration of each test point. The αOTEs were improved by the increase of CFR, especially for P4 (23.1–30.7%), P2 (12.4–18.3%), and P3 (10.6–21.2%). The αOTEs of P1 and P5 and of P2 and P3 were very close, and the αOTE of P4 was the highest and the lowest, respectively. Additionally, the DO of test points showed the same changing law.
The CFR affects the collision and cutting frequency of the carriers on the bubbles, thereby affecting the αOTE of aeration systems [42]. At a low CFR, the carriers had a low shear and hindered effects on the bubbles [26]. With the continuous increase in the CFR, the collision and cutting frequency of the carriers and bubbles increased, and the probability of large bubbles becoming small bubbles increased [33]. However, the increase in the CFR did not unconditionally improve the αOTE of the aeration systems; if the CFR exceeded a specific limitation, it would affect the fluidization of carriers [25], even leading to carrier deposition. Above all, we deduced that due to the uneven distribution of water, the CFR of each point gradually increased along the distribution direction [30], and the CFR of P5 exceeded 57.7%. As a result, the αOTEs of P1 and P5 were lower than those of the other points.
3.4. Effects of the Carrier Filling Ratio on the αSOTE of IFAS
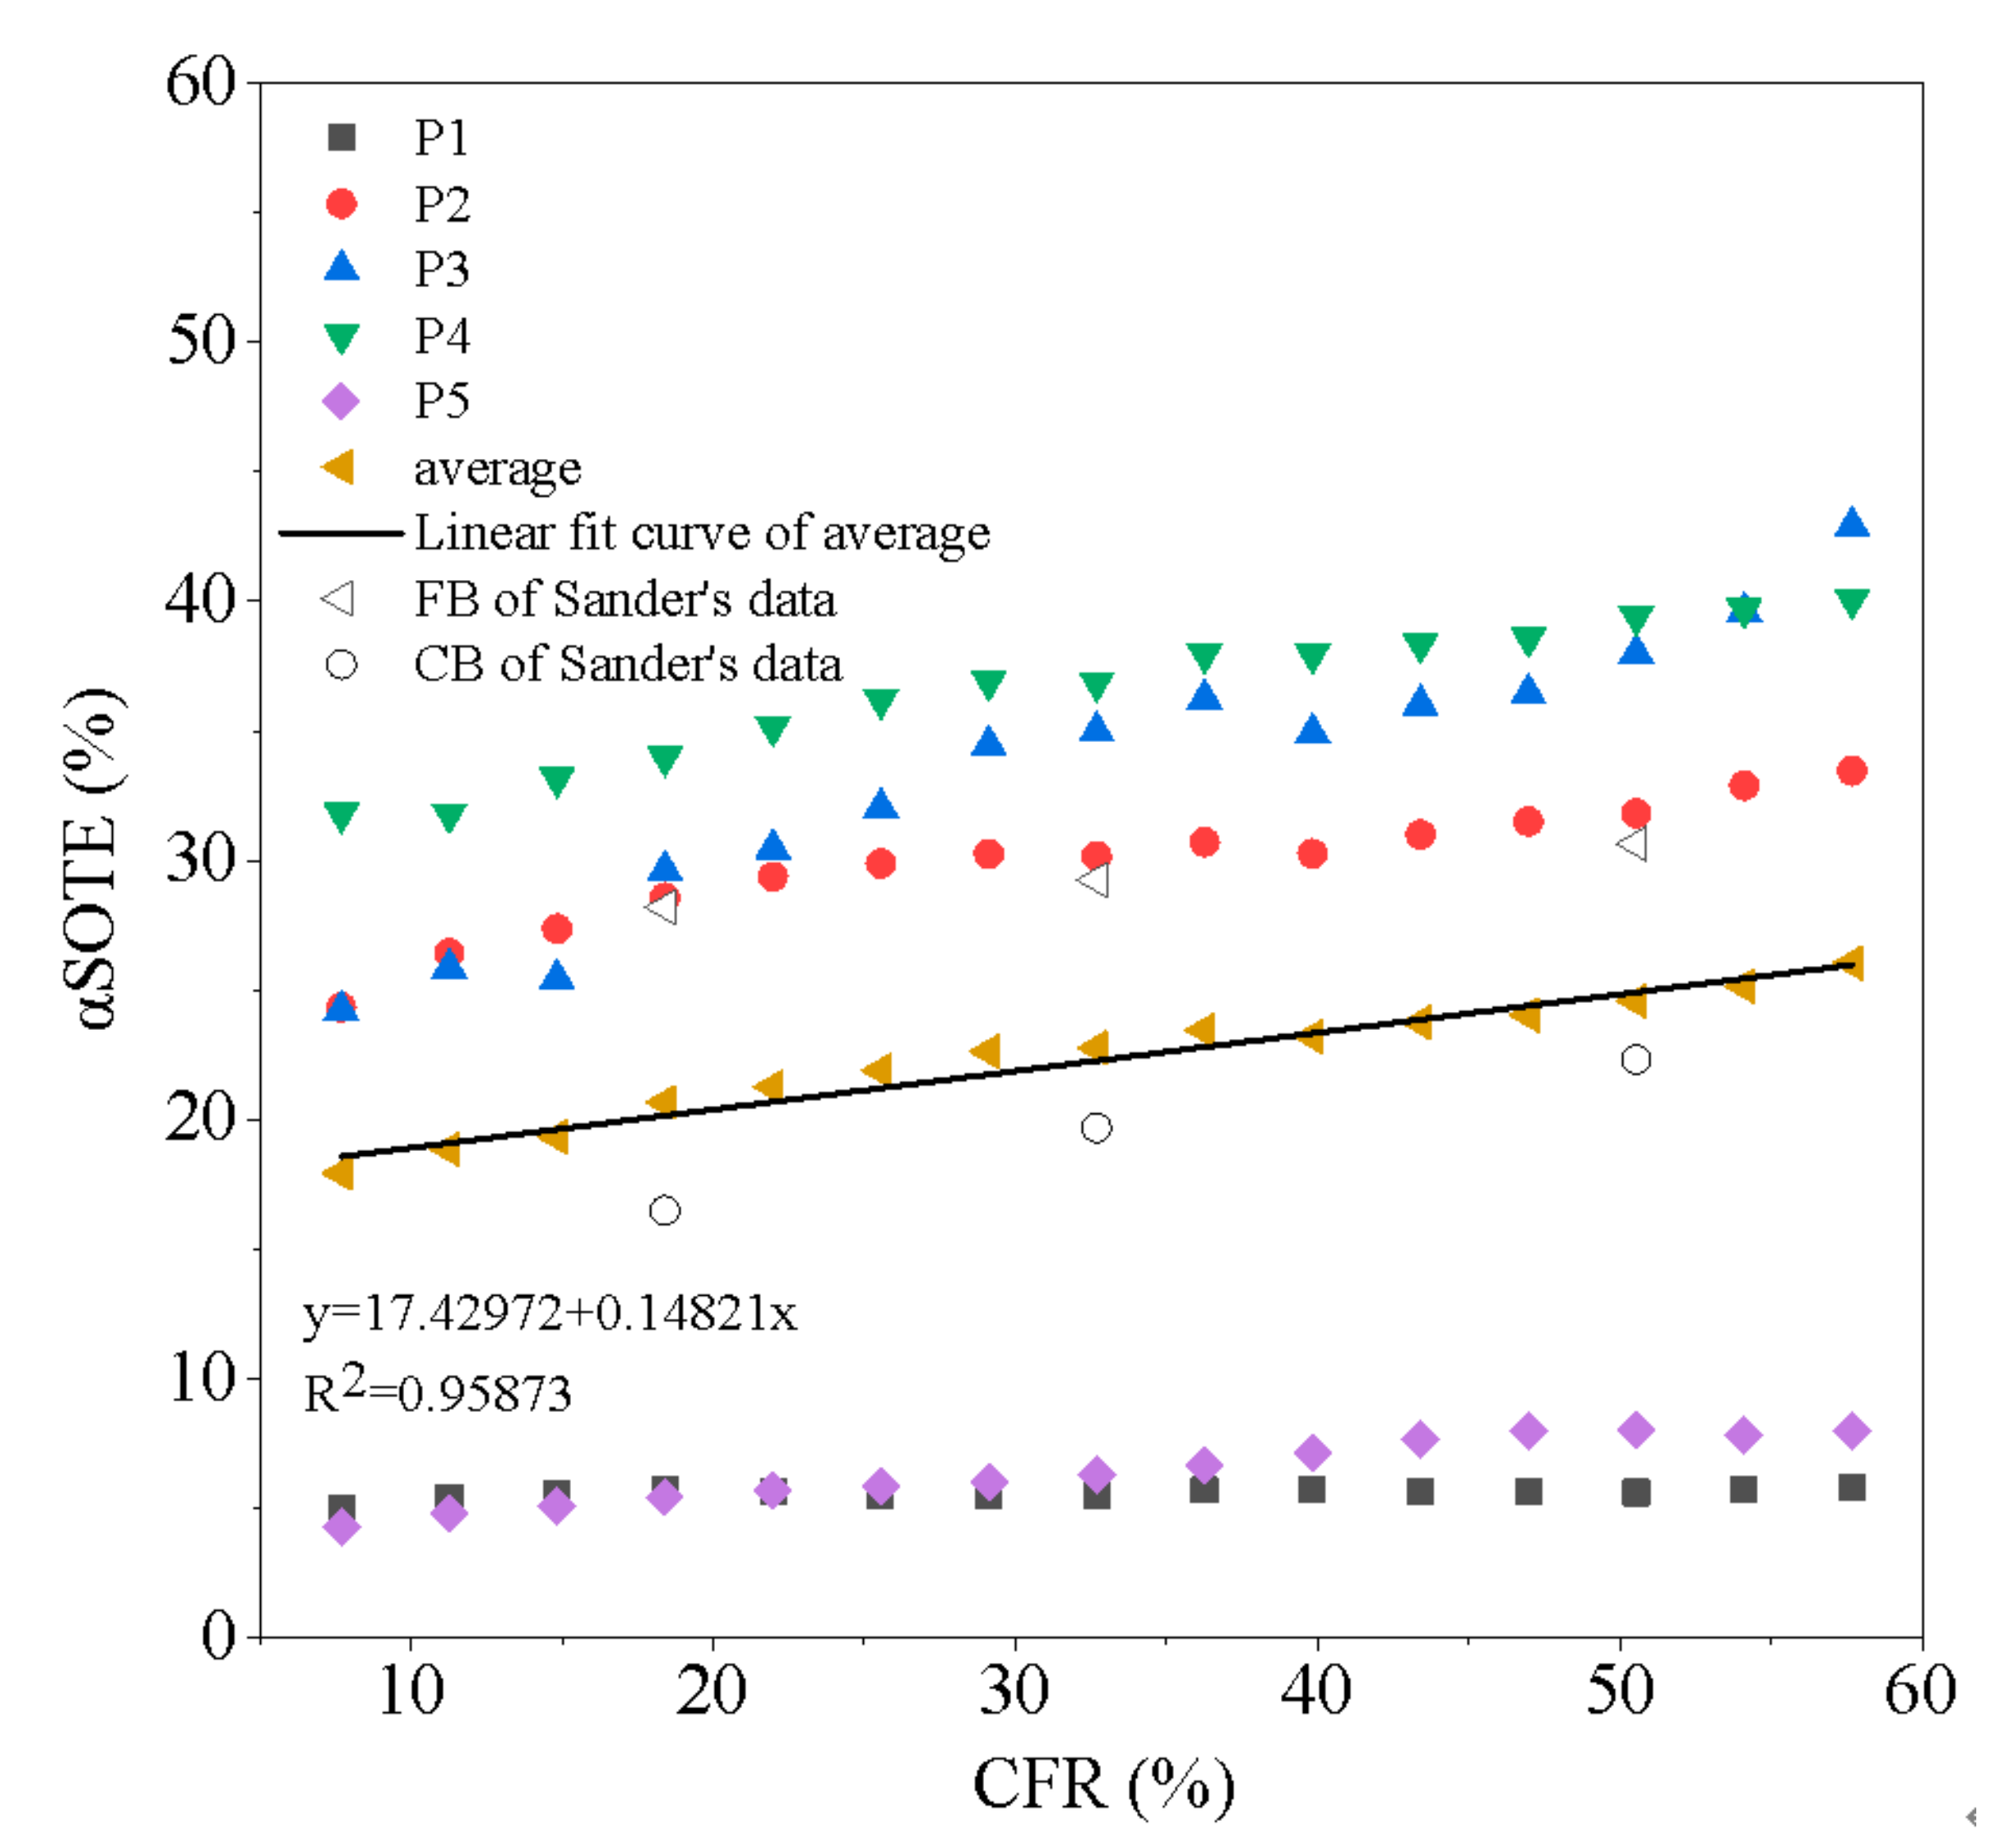
As shown in Figure 7, the αSOTE of all test points under different CFR were compared together, as well as Sander’s data (αSOTE of fine-bubble (FB) and αSOTE of coarse-bubble (CB)). We can conclude that the αSOTEs of aeration systems were improved by increasing the CFR. The αSOTEs of all the test points were ranked as P4 > P3 > P2 > P5 > P1, and the average αSOTE of the IFAS process ranged from 17.9% to 26.0%. Finally, the fitting function for predicting αSOTE was given as: αSOTE = 17.42972 + 0.14821·CFR (R2 = 0.95873).
The αSOTEs of aeration systems were higher in the middle of the aerobic tank than in the other two sides due to the complex flow regime in the full-scale IFAS process. Sander’s experiment results (Figure 7) [23] showed the same trend. The average αSOTE of the aerobic tank with hybrid aeration systems was close to the results of his pilot reactors. The experimental results show that the αSOTE distribution of the IFAS process was not uniform even under the same aeration system operation conditions. Therefore, attention should be paid to the design of aeration systems in the IFAS process.
4. Conclusions
The primary purpose of this study was to investigate the changing and distribution law of oxygen transfer efficiency in the full-scale IFAS process with different aeration types and different CFRs.
The results of the tests conducted under different aeration types with a constant CFR showed the following:
- The αOTE and DO concentrations of the IFAS process were affected by the aeration type.
- The αSOTE of the middle of the coarse-bubble aeration systems was close to that of the fine-bubble aeration systems with a constant CFR. However, for the other two sides, fine-bubble aeration systems were recommended.
The results of the tests conducted under hybrid aeration systems with different CFRs showed the following:
- The αOTEs were improved by the increasing CFR, especially for the middle of the aeration systems.
- The average αSOTE prediction formula of the hybrid aeration systems was constructed for the full-scale IFAS process.
Author Contributions
Conceptualization, R.G. and X.B.; methodology, X.L., Q.H., X.W. and X.Z.; formal analysis, X.L.; investigation, X.L., Q.H., X.W. and X.Z.; data curation, X.L.; writing—original draft preparation, X.L.; writing—review and editing, R.G.; supervision, R.G. and X.B.; project administration, X.B. All authors have read and agreed to the published version of the manuscript.
Funding
We thank the Ministry of Science and Technology of the People’s Republic of China for funding the research project ‘Major science and technology projects for water pollution control and Treatment’ (Research Grant 2017ZX07101-002-005).
Institutional Review Board Statement
Not applicable.
Informed Consent Statement
Not applicable.
Data Availability Statement
Data available on request due to restrictions eg privacy or ethical. The data presented in this study are available on request from the corresponding author.
Acknowledgments
We thank the help from the staff of the wastewater treatment plant of Licun River.
Conflicts of Interest
The authors declare no conflict of interest.
References
- Di, T.D.; Christensso, M.; Odegaard, H. Hybrid activated sludge/biofilm process for the treatment of municipal wastewater in a cold climate region: A case study. Water Sci. Technol. A J. Int. Assoc. Water Pollut. Res. 2011, 63, 1121–1129. [Google Scholar] [CrossRef]
- Ødegaard, H.; Rusten, B.; Westrum, T. A new moving bed biofilm reactor—Applications and results. Water Sci. Technol. 1994, 29, 157–165. [Google Scholar] [CrossRef]
- Åhl, R.M.; Leiknes, T.; Ødegaard, H. Tracking particle size distributions in a moving bed biofilm membrane reactor for treatment of municipal wastewater. Water Sci. Technol. 2006, 53, 33–42. [Google Scholar] [CrossRef]
- Mannina, G.; Capodici, M.; Cosenza, A.; Di Trapani, D.; Viviani, G. The influence of solid retention time on IFAS-MBR systems: Analysis of system behavior. Environ. Technol. 2019, 40, 1840–1852. [Google Scholar] [CrossRef] [PubMed]
- Bai, Y.; Zhang, Y.; Quan, X.; Chen, S. Enhancing nitrogen removal efficiency and reducing nitrate liquor recirculation ratio by improving simultaneous nitrification and denitrification in Integrated Fixed-Film Activated Sludge (IFAS) process. Water Sci. Technol. 2016, 73, 827–834. [Google Scholar] [CrossRef] [PubMed]
- Rusten, B.; Ødegaard, H. Design and operation of nutrient removal plants for very low effluent concentrations. Proc. Water Environ. Fed. 2007, 2007, 1307–1331. [Google Scholar] [CrossRef]
- Rosso, D.; Lothman, S.E.; Jeung, M.K.; Pitt, P.; Gellner, W.J.; Stone, A.L.; Howard, D. Oxygen transfer and uptake, nutrient removal, and energy footprint of parallel full-scale IFAS and activated sludge processes. Water Res. 2011, 45, 5987–5996. [Google Scholar] [CrossRef]
- Baquero-Rodríguez, G.A.; Lara-Borrero, J.A.; Nolasco, D.; Rosso, D. A critical review of the factors affecting modeling oxygen transfer by fine-pore diffusers in activated sludge. Water Environ. Res. 2018, 90, 431–441. [Google Scholar] [CrossRef] [PubMed]
- Rahimi, Y.; Torabian, A.; Mehrdadi, N.; Habibi-Rezaie, M.; Pezeshk, H.; Nabi-Bidhendi, G.-R. Optimizing aeration rates for minimizing membrane fouling and its effect on sludge characteristics in a moving bed membrane bioreactor. J. Hazard. Mater. 2011, 186, 1097–1102. [Google Scholar] [CrossRef]
- Menniti, A.; Morgenroth, E. The influence of aeration intensity on predation and EPS production in membrane bioreactors. Water Res. 2010, 44, 2541–2553. [Google Scholar] [CrossRef]
- Hreiz, R.; Potier, O.; Wicks, J.; Commenge, J.-M. CFD investigation of the effects of bubble aerator layouts on hydrodynamics of an activated sludge channel reactor. Environ. Technol. 2018, 40, 2657–2670. [Google Scholar] [CrossRef] [PubMed]
- Xu, Y.; Zhu, N.; Sun, J.; Liang, P.; Xiao, K.; Huang, X. Evaluating oxygen mass transfer parameters for large-scale engineering application of membrane bioreactors. Process. Biochem. 2017, 60, 13–18. [Google Scholar] [CrossRef]
- Painmanakul, P.; Hébrard, G. Effect of different contaminants on the α-factor: Local experimental method and modeling. Chem. Eng. Res. Des. 2008, 86, 1207–1215. [Google Scholar] [CrossRef]
- Nasir, E. Circadian Amplification of Alpha Factors, Energy Intensity and Indirect Greenhouse Gas Emissions in Aerated Processes for Water Resource Recovery Facilities; ProQuest Dissertations Publishing: Irvine, CA, USA, 2018. [Google Scholar]
- Jiang, L.-M.; Garrido-Baserba, M.; Nolasco, D.; Al-Omari, A.; DeClippeleir, H.; Murthy, S.; Rosso, D. Modelling oxygen transfer using dynamic alpha factors. Water Res. 2017, 124, 139–148. [Google Scholar] [CrossRef] [PubMed]
- Fan, H.; Liu, X.; Wang, H.; Han, Y.; Qi, L.; Wang, H. Oxygen transfer dynamics and activated sludge floc structure under different sludge retention times at low dissolved oxygen concentrations. Chemosphere 2017, 169, 586–595. [Google Scholar] [CrossRef] [PubMed]
- Henkel, J.; Cornel, P.; Wagner, M. Free water content and sludge retention time: Impact on oxygen transfer in activated sludge. Environ. Sci. Technol. 2009, 43, 8561–8565. [Google Scholar] [CrossRef] [PubMed]
- Houweling, D.; Daigger, G.T. Intensifying Activated Sludge Using Media-Supported Biofilms, 1st ed.; CRC Press: Boca Raton, FL, USA, 2019; ISBN 9780429260278. [Google Scholar]
- Singh, N.K.; Yadav, M.; Singh, R.P.; Kazmi, A.A. Efficacy analysis of a field scale IFAS reactor under different aeration strategies applied at high aeration rates: A statistical comparative analysis for practical feasibility. J. Water Process. Eng. 2019, 27, 185–192. [Google Scholar] [CrossRef]
- Collivignarelli, M.C.; Abbà, A.; Bertanza, G. Oxygen transfer improvement in MBBR process. Environ. Sci. Pollut. Res. Int. 2019, 26, 10727–10737. [Google Scholar] [CrossRef]
- Jing, J.Y.; Feng, J.; Li, W.Y. Carrier effects on oxygen mass transfer behavior in a moving-bed biofilm reactor. Asia Pac. J. Chem. Eng. 2009, 4, 618–623. [Google Scholar] [CrossRef]
- Kim, H.-S.; Gellner, J.; Boltz, J.; Freudenberg, R.; Gunsch, C.; Schuler, A. Effects of integrated fixed film activated sludge media on activated sludge settling in biological nutrient removal systems. Water Res. 2010, 44, 1553–1561. [Google Scholar] [CrossRef]
- Sander, S.; Behnisch, J.; Wagner, M. Energy, cost and design aspects of coarse- and fine-bubble aeration systems in the MBBR IFAS process. Water Sci. Technol. 2017, 75, 890–897. [Google Scholar] [CrossRef]
- Pham, H.; Viswanathan, S.; Kelly, R.F. Evaluation of plastic carrier media impact on oxygen transfer efficiency with coarse and fine bubble diffusers. Proc. Water Environ. Fed. 2008, 2008, 5069–5079. [Google Scholar] [CrossRef]
- Barwal, A.; Chaudhary, R. Impact of carrier filling ratio on oxygen uptake & transfer rate, volumetric oxygen transfer coefficient and energy saving potential in a lab-scale MBBR. J. Water Process. Eng. 2015, 8, 202–208. [Google Scholar] [CrossRef]
- Sun, L.; Zhang, F.; Liu, C.; Bi, X.; Cheng, L.; Li, S.; Liu, Y.; Qiao, Z. Effect of bio-carrier filling rate on oxygen transfer coefficient of different diffusers in MBBR process. Desalin. Water Treat. 2016, 57, 18234–18239. [Google Scholar] [CrossRef]
- Li, H.; Zhu, J.; Kulick, F.M.; Koch, K.; Rothermel, B. Assessment of oxygen transfer, uptake and energy footprint of full scale SSM IFAS systems using off-gas testing. Proc. Water Environ. Fed. 2013, 2013, 3809–3819. [Google Scholar] [CrossRef]
- Daigger, G.T.; Boltz, J.P. Oxygen transfer in moving bed biofilm reactor and integrated fixed film activated sludge processes. Water Environ. Res. 2018, 90, 615–622. [Google Scholar] [CrossRef] [PubMed]
- Cecconi, F.; Garrido-Baserba, M.; Eschborn, R.; Damerel, J.; Rosso, D. Oxygen transfer investigations in an aerobic granular sludge reactor. Environ. Sci. Water Res. Technol. 2020, 5, 47. [Google Scholar] [CrossRef]
- Boltz, J.P.; Johnson, B.R.; Takács, I.; Daigger, G.T.; Morgenroth, E.; Brockmann, D.; Kovács, R.; Calhoun, J.M.; Choubert, J.-M.; Derlon, N. Biofilm carrier migration model describes reactor performance. Water Sci. Technol. 2017, 75, 2818–2828. [Google Scholar] [CrossRef] [Green Version]
- Maas, C.L.; Parker, W.J.; Legge, R.L. Oxygen uptake rate tests to evaluate integrated fixed film activated sludge processes. Proc. Water Environ. Fed. 2006, 2006, 4914–4926. [Google Scholar] [CrossRef]
- Lothman, S.; James Gellner, W.; Stone, A.; Howard, D.; Pitt, P.; Rosso, D. Comparison of oxygen transfer and uptake between an Integrated Fixed-Film Activated Sludge (IFAS) process and a conventional Activated Sludge Process (ASP). Proc. Water Environ. Fed. 2011, 2011, 368–390. [Google Scholar] [CrossRef]
- Zhao, Y.; Yuan, Q.; He, Z.; Wang, H.; Yan, G.; Chang, Y.; Chu, Z.; Ling, Y.; Wang, H. Influence of carrier filling ratio on the advanced nitrogen removal from wastewater treatment plant effluent by denitrifying MBBR. Int. J. Environ. Res. Public Health 2019, 166, 3244. [Google Scholar] [CrossRef] [PubMed] [Green Version]
- Odize, V.; Novak, J.; Omari, A.A.; Rahman, A.; Rosso, D.; Murthy, S.; de Clippeleir, H. Impact of organic carbon fractions and surfactants on oxygen transfer efficiency. Proc. Water Environ. Fed. 2016, 2016, 3940–3947. [Google Scholar] [CrossRef]
- Rosso, D.; Huo, D.L.; Stenstrom, M.K. Effects of interfacial surfactant contamination on bubble gas transfer. Chem. Eng. Sci. 2006, 61, 5500–5514. [Google Scholar] [CrossRef] [Green Version]
- Rosso, D.; Iranpour, R.; Stenstrom, M.K. Fifteen years of offgas transfer efficiency measurements on fine-pore aeration. Proc. Water Environ. Fed. 2001, 77, 204–213. [Google Scholar] [CrossRef]
- Rosso, D. Aeration, Mixing, and Energy: Bubbles and Sparks; IWA Publishing: London, UK, 2018; ISBN 97817804. [Google Scholar]
- Li, Y.; Zhu, T.; Liu, Y.; Tian, Y.; Wang, H. Effects of surfactant on bubble hydrodynamic behavior under flotation-related conditions in wastewater. Water Sci. Technol. 2012, 65, 1060–1066. [Google Scholar] [CrossRef]
- Garrido-Baserba, M.; Sobhani, R.; Asvapathanagul, P.; McCarthy, G.W.; Olson, B.H.; Odize, V.; Al-Omari, A.; Murthy, S.; Nifong, A.; Godwin, J.; et al. Modelling the link amongst fine-pore diffuser fouling, oxygen transfer efficiency, and aeration energy intensity. Water Res. 2017, 111, 127–139. [Google Scholar] [CrossRef]
- Odize, V.O.; Novak, J.; de Clippeleir, H.; Al-Omari, A.; Smeraldi, J.D.; Murthy, S.; Rosso, D. Reverse flexing as a physical/mechanical treatment to mitigate fouling of fine bubble diffusers. Water Sci. Technol. 2017, 76, 1595–1602. [Google Scholar] [CrossRef]
- Knatz, C.; Rafferty, S.; Delescinskis, A. Optimization of water treatment plant flow distribution with CFD modeling of an influent channel. Water Qual. Res. J. Can. 2015, 50, 72–82. [Google Scholar] [CrossRef]
- Gu, Q.; Sun, T.; Wu, G.; Li, M.; Qiu, W. Influence of carrier filling ratio on the performance of moving bed biofilm reactor in treating coking wastewater. Bioresour. Technol. 2014, 166, 72–78. [Google Scholar] [CrossRef]
Figure 1.
Tank geometry and off-gas test points.

Figure 2.
The aeration systems layout.

Figure 3.
The schematic diagram of the off-gas method.

Figure 4.
The αOTE of different aeration types at the five points.

Figure 5.
The αSOTE of the different aeration systems at the five points.

Figure 6.
The αOTE of the test points during the carrier adding process.

Figure 7.
The αSOTE results under different CFRs.


Table 1.
Plant operating conditions during testing.
| Parameters | Concentration |
|---|---|
| Chemical Oxygen Demand (COD) of influent (mg/L) | 1335 ± 273 |
| COD of effluent (mg/L) | 27.3 ± 4.7 |
| NH4+-N in influent (mg/L) | 57.9 ± 5.4 |
| NH4+-N in effluent (mg/L) | 1.8 ± 0.3 |
| Mixed Liquid Suspended Solids (MLSS) (g/L) | 6.5 ± 0.1 |
| Temperature of influent (°C) | 10.2 ± 0.5 |
| Salinity (g/L) | 2.4 ± 0.2 |
| Sludge retention time (d) | 20 ± 0.1 |
Publisher’s Note: MDPI stays neutral with regard to jurisdictional claims in published maps and institutional affiliations. |
© 2021 by the authors. Licensee MDPI, Basel, Switzerland. This article is an open access article distributed under the terms and conditions of the Creative Commons Attribution (CC BY) license (https://creativecommons.org/licenses/by/4.0/).
Share and Cite
MDPI and ACS Style
Liu, X.; Bi, X.; Huang, Q.; Wang, X.; Gu, R.; Zhou, X. The Changing and Distribution Laws of Oxygen Transfer Efficiency in the Full-Scale IFAS Process. Water 2021, 13, 1933. https://doi.org/10.3390/w13141933
AMA Style
Liu X, Bi X, Huang Q, Wang X, Gu R, Zhou X. The Changing and Distribution Laws of Oxygen Transfer Efficiency in the Full-Scale IFAS Process. Water. 2021; 13(14):1933. https://doi.org/10.3390/w13141933
Chicago/Turabian StyleLiu, Xuyang, Xuejun Bi, Qing Huang, Xiaodong Wang, Ruihuan Gu, and Xiaolin Zhou. 2021. "The Changing and Distribution Laws of Oxygen Transfer Efficiency in the Full-Scale IFAS Process" Water 13, no. 14: 1933. https://doi.org/10.3390/w13141933
Note that from the first issue of 2016, this journal uses article numbers instead of page numbers. See further details here.