Article

Evaluation of Integrating SWAT Model into a Multi-Criteria Decision Analysis towards Reliable Rainwater Harvesting Systems

1
Department of Civil Engineering, Shahrood University of Technology, Shahrood, Semnan 3619995161, Iran
2
Department of Civil & Architectural Engineering and Mechanics, The University of Arizona, Tucson, AZ 85721, USA
3
Department of Civil Engineering, Faculty of Engineering, Ferdowsi University of Mashhad, Mashhad 9177948974, Iran
4
Department of Civil Engineering, The University of Texas at Arlington, Arlington, TX 76019, USA
5
Faculty of Civil Engineering and Geosciences, Water Resources Section, Delft University of Technology, 2628 CN Delft, The Netherlands
*
Author to whom correspondence should be addressed.
Water 2021, 13(14), 1935; https://doi.org/10.3390/w13141935
Submission received: 14 June 2021 / Revised: 1 July 2021 / Accepted: 9 July 2021 / Published: 13 July 2021
(This article belongs to the Section Water Resources Management, Policy and Governance)

Abstract

:
Rainwater harvesting (RWH) has been recognized as one of the most reliable and efficient methods for water supply, especially in arid and semi-arid regions (ASARs) facing freshwater scarcity. Nevertheless, due to the inherent uncertainty of input data and subjectivity involved in the selection of influential parameters, the identification of RWH potential areas is a challenging procedure. In this study, two approaches for locating potential RWH sites were implemented. In the first approach, a frequently-used method of the multi-criteria decision analysis and geographic information system (MCDA-GIS) was utilized, while, in the second approach, a novel strategy of integrating the soil and water assessment tool (SWAT) model as a hydrology model into an MCDA-GIS method was proposed to evaluate its performance in locating potential RWH sites. The Mashhad Plain Basin (MPB) was selected as a case study area. The developed potential RWH maps of the two approaches indicated similar patterns for potential RWH areas; in addition, the correlation coefficient (CC) between the two obtained maps were relatively high (i.e., CC = 0.914) revealing that integration of SWAT as a comprehensive hydrologic model does not necessarily result in very different outputs from the conventional method of MCDA-GIS for RWH evaluation. The overlap of developed maps of the two approaches indicated that 3394 km2 of the study area, mainly located in the northern parts, was identified as high-potential RWH areas. The performed sensitivity analysis indicated that rainfall and slope criteria, with weights of 0.329 and 0.243, respectively, had the greatest sensitivity on the model in the first approach while in the second approach, the criterion of runoff coefficient (with weights of 0.358) had the highest impact. Based on results from the identification of the potential locations for conventional RWH techniques, pond and pan techniques are the most proper options, covering high-potential areas of RWH more effectively than other techniques over MPB.

1. Introduction

Freshwater scarcity has become a pivotal issue in sustainable development [1,2,3], especially in arid and semi-arid regions (ASARs) where communities are encountering water scarcity problems, not only in agricultural and industrial sectors, but also for satisfying domestic water demands [4,5,6,7]. Most countries in North Africa and the Middle East are facing water scarcity and its related consequences [8]. Moreover, various factors, such as accelerated climate change, population growth, intensive agricultural activities, and industrialization, as well as continuous pollution of water resources, will exacerbate freshwater scarcity and shortages in the future [9,10]. Therefore, more studies are needed in order to focus more specifically on water conservation planning and management, and the sustainable use of potential water resources [5,8,11].
Rainwater harvesting (RWH) can be considered as one of the most cost-effective and environmentally-friendly water conservation methods, especially in ASARs, which simultaneously address water scarcity issues and alleviates groundwater over-extraction [2,12,13,14]. From a historical perspective, archeological evidence found in Southwest Asia revealed that RWH has been practiced since the Neolithic Age (around 10,000 BC to 4500 BC) [11,15]. Moreover, examples of RWH structures were discovered in Tunisia, Greece, China, and historical Palestine, tracing back thousands of years [2,16]. In general, all schemes for collecting and storing rainwater to supply safe and inexpensive water for different purposes, such as domestic, industrial, and agricultural purposes are identified as RWHs [17,18,19].
In developing countries, where domestic water utilization is low, RWH can meet a large amount of water demand [20,21]. Furthermore, harvested water can be managed and diverted for other purposes, such as groundwater recharge, downstream flood mitigation, soil moisture improvement, irrigation, and livestock purposes [1,22,23]. However, identifying RWH potential areas/zones could be challenging, since several criteria need to be considered, including hydrology, climatic condition, topography, and soil parameters, to maximize water availability, particularly in ASARs [24,25].
Many methods have been applied to incorporate contributing RWH factors to locate potential RWH areas. In this regard, the integrated application of multi-criteria decision analysis (MCDA) and geographic information systems (GIS) has been frequently used for a wide range of objectives in water resource research, including potential RWH assessment [26,27,28]. In Saudi Arabia, geospatial and MCDA methods were implemented for identifying potential areas for some RWH structures [29]. In Egypt, potential RWH and storage areas were determined using remote sensing and decision support systems [30]. In South Africa, in-field RWH and ex-field RWH suitability maps were developed by combining ecological, physical, and socio-economic factors [20]. There are other studies that have been done in which assessment of potential RWHs was conducted through the incorporation of biophysical factors (e.g., slope, soil type, land use) [31,32].
As a multi-criteria decision-making (MCDM) system, the analytical hierarchy process (AHP) was introduced by Saaty [33,34]. It is a favorable decision-supporting technique for solving multiplex problems [35]. Particularly, it has been recognized as the most applicable decision method for the identification of potential RWH areas, along with the GIS platform [36]. In the AHP technique, based on the knowledge of experts and mathematics, decisions are organized and analyzed in a structured procedure. The primary idea behind AHP is to use hierarchical symbols to represent the components of any issue and show links between them [35]. Many studies have made extensive use of AHP in order to identify possible RWH sites [37].
The majority of related studies indicate that the utilization of practical approaches, as well as the selection of proper/suitable criteria, are the two main factors in the successful implementation of geospatial and MCDA methods in mapping potential RWH areas [29,38]. In this study, an assessment of potential RWH through the incorporation of biophysical parameters into MCDA, within a GIS environment, as a frequently used approach, is conducted. Furthermore, the novel approach of integration of SWAT as a hydrological model with MCDA and GIS is adopted to evaluate potential RWHs. The integrated approach of hydrological modeling with MCDA and GIS toward the identification of potential RWH areas in ASARs has already been addressed in numerous studies [25,39,40,41]. The primary reason for utilizing a hydrological model is to obtain, either the potential runoff generation depth and coefficient map, or to incorporate the obtained layer into MCDA to enhance the RWH site selection criteria. Additionally, studies revealed that the combination of SWAT with GIS and MCDA reduces the likelihood of inherent biases in GIS-based MCDA.
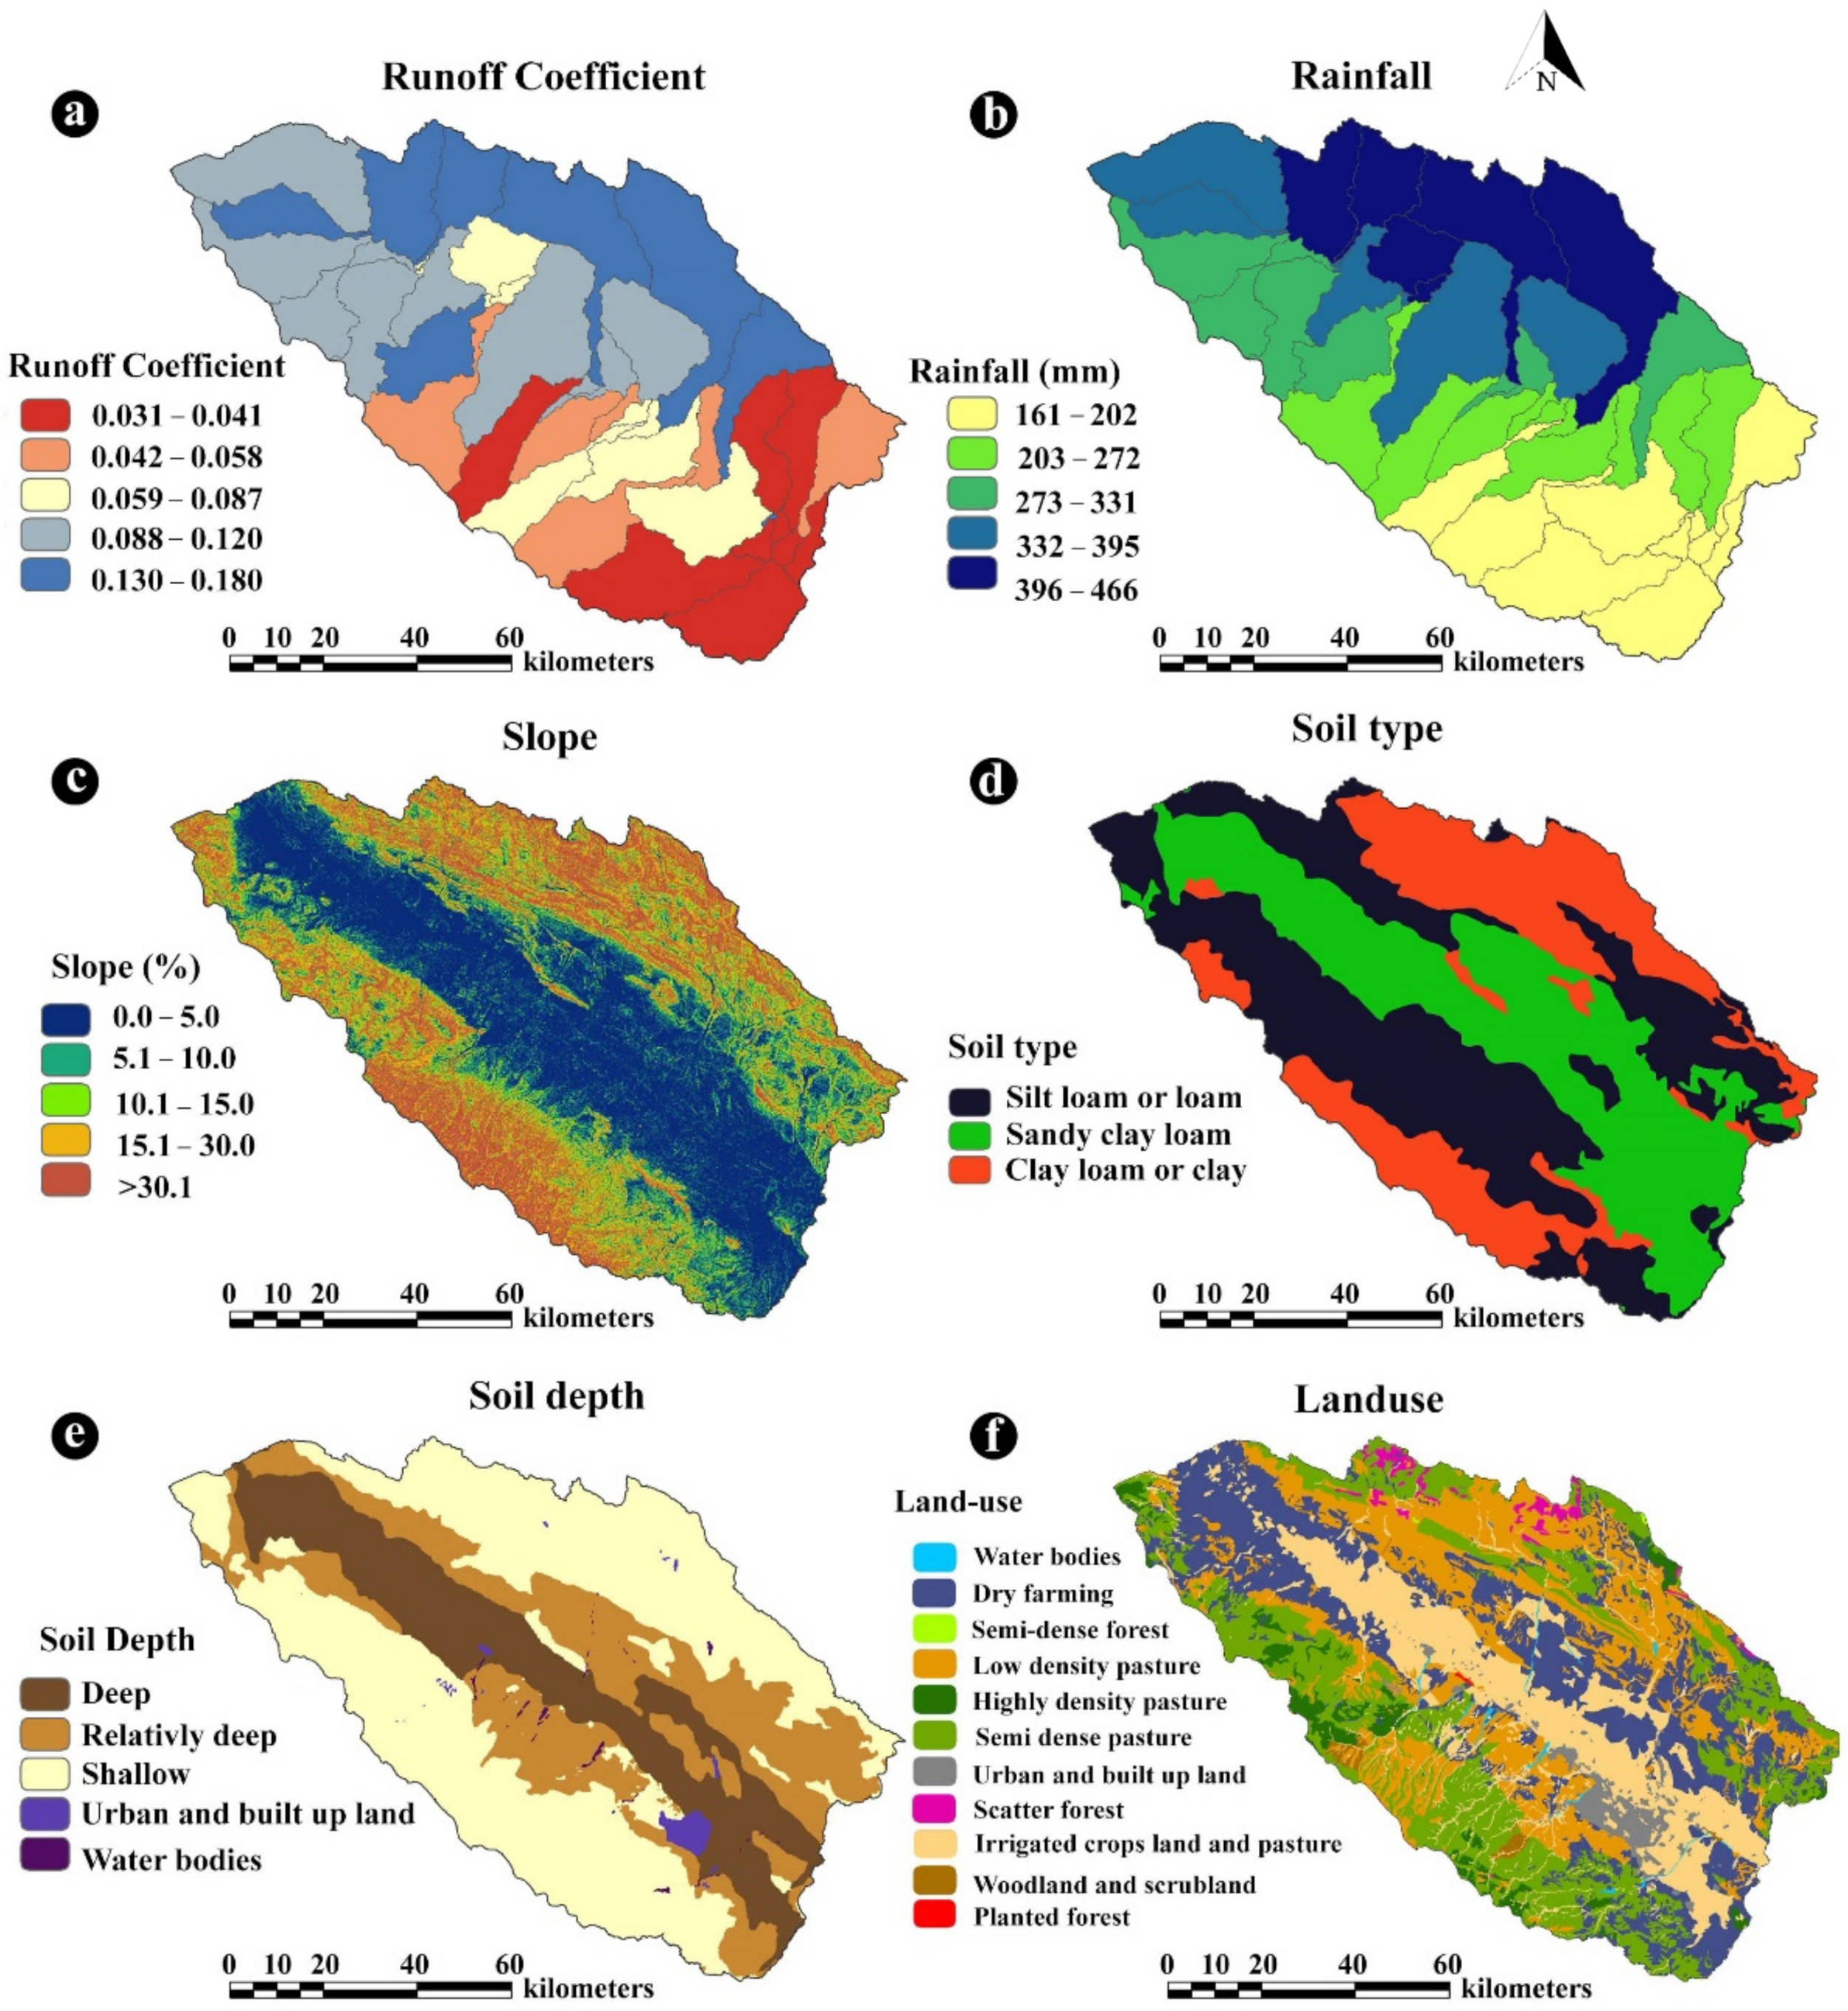
The runoff coefficient is considered as one of the most influential parameters in RWH assessment, accounting for major contributing factors, such as rainfall, topography, land use, and soil texture and structure [29,42]. Meanwhile, in most studies, a runoff coefficient map is generated by utilizing the widely-used method known as the soil conservation service-curve number (SCS-CN) method [43,44,45]. The SCS-CN method calculates runoff depth based on land cover, hydrologic soil group, and antecedent soil moisture content. While the SCS-CN method is simple, easily applicable, and conceptually stable, it is constrained by some factors, such as the basin area (less than 8 km2), low infiltration capacity, and high rainfall depth [44,46].
On the other hand, in ungagged basins, the SWAT model [47] can be considered as a suitable option for hydrological simulations, particularly in developing countries lacking rainfall and runoff records [48,49,50]. Data availability for most parts of the world, along with other advantageous features, including ease of representation, use of spatially available data, and capability of result presentation through GIS, increase the potential of integrating SWAT with the MCDA-GIS approach for the identification of potential RWH areas [51,52]. Moreover, the SWAT model, which requires a higher number of inputs, is more comprehensive compared to the SCS-CN, and its application can lead to a more accurate runoff coefficient map. In addition, the SWAT model includes, not only all factors used in the SCS-CN method, but also the independent interaction of influential factors, including infiltration and evaporation in rainfall–runoff modeling, which enables capturing more variability rather than relying on a single CN as a lumped parameter [48].
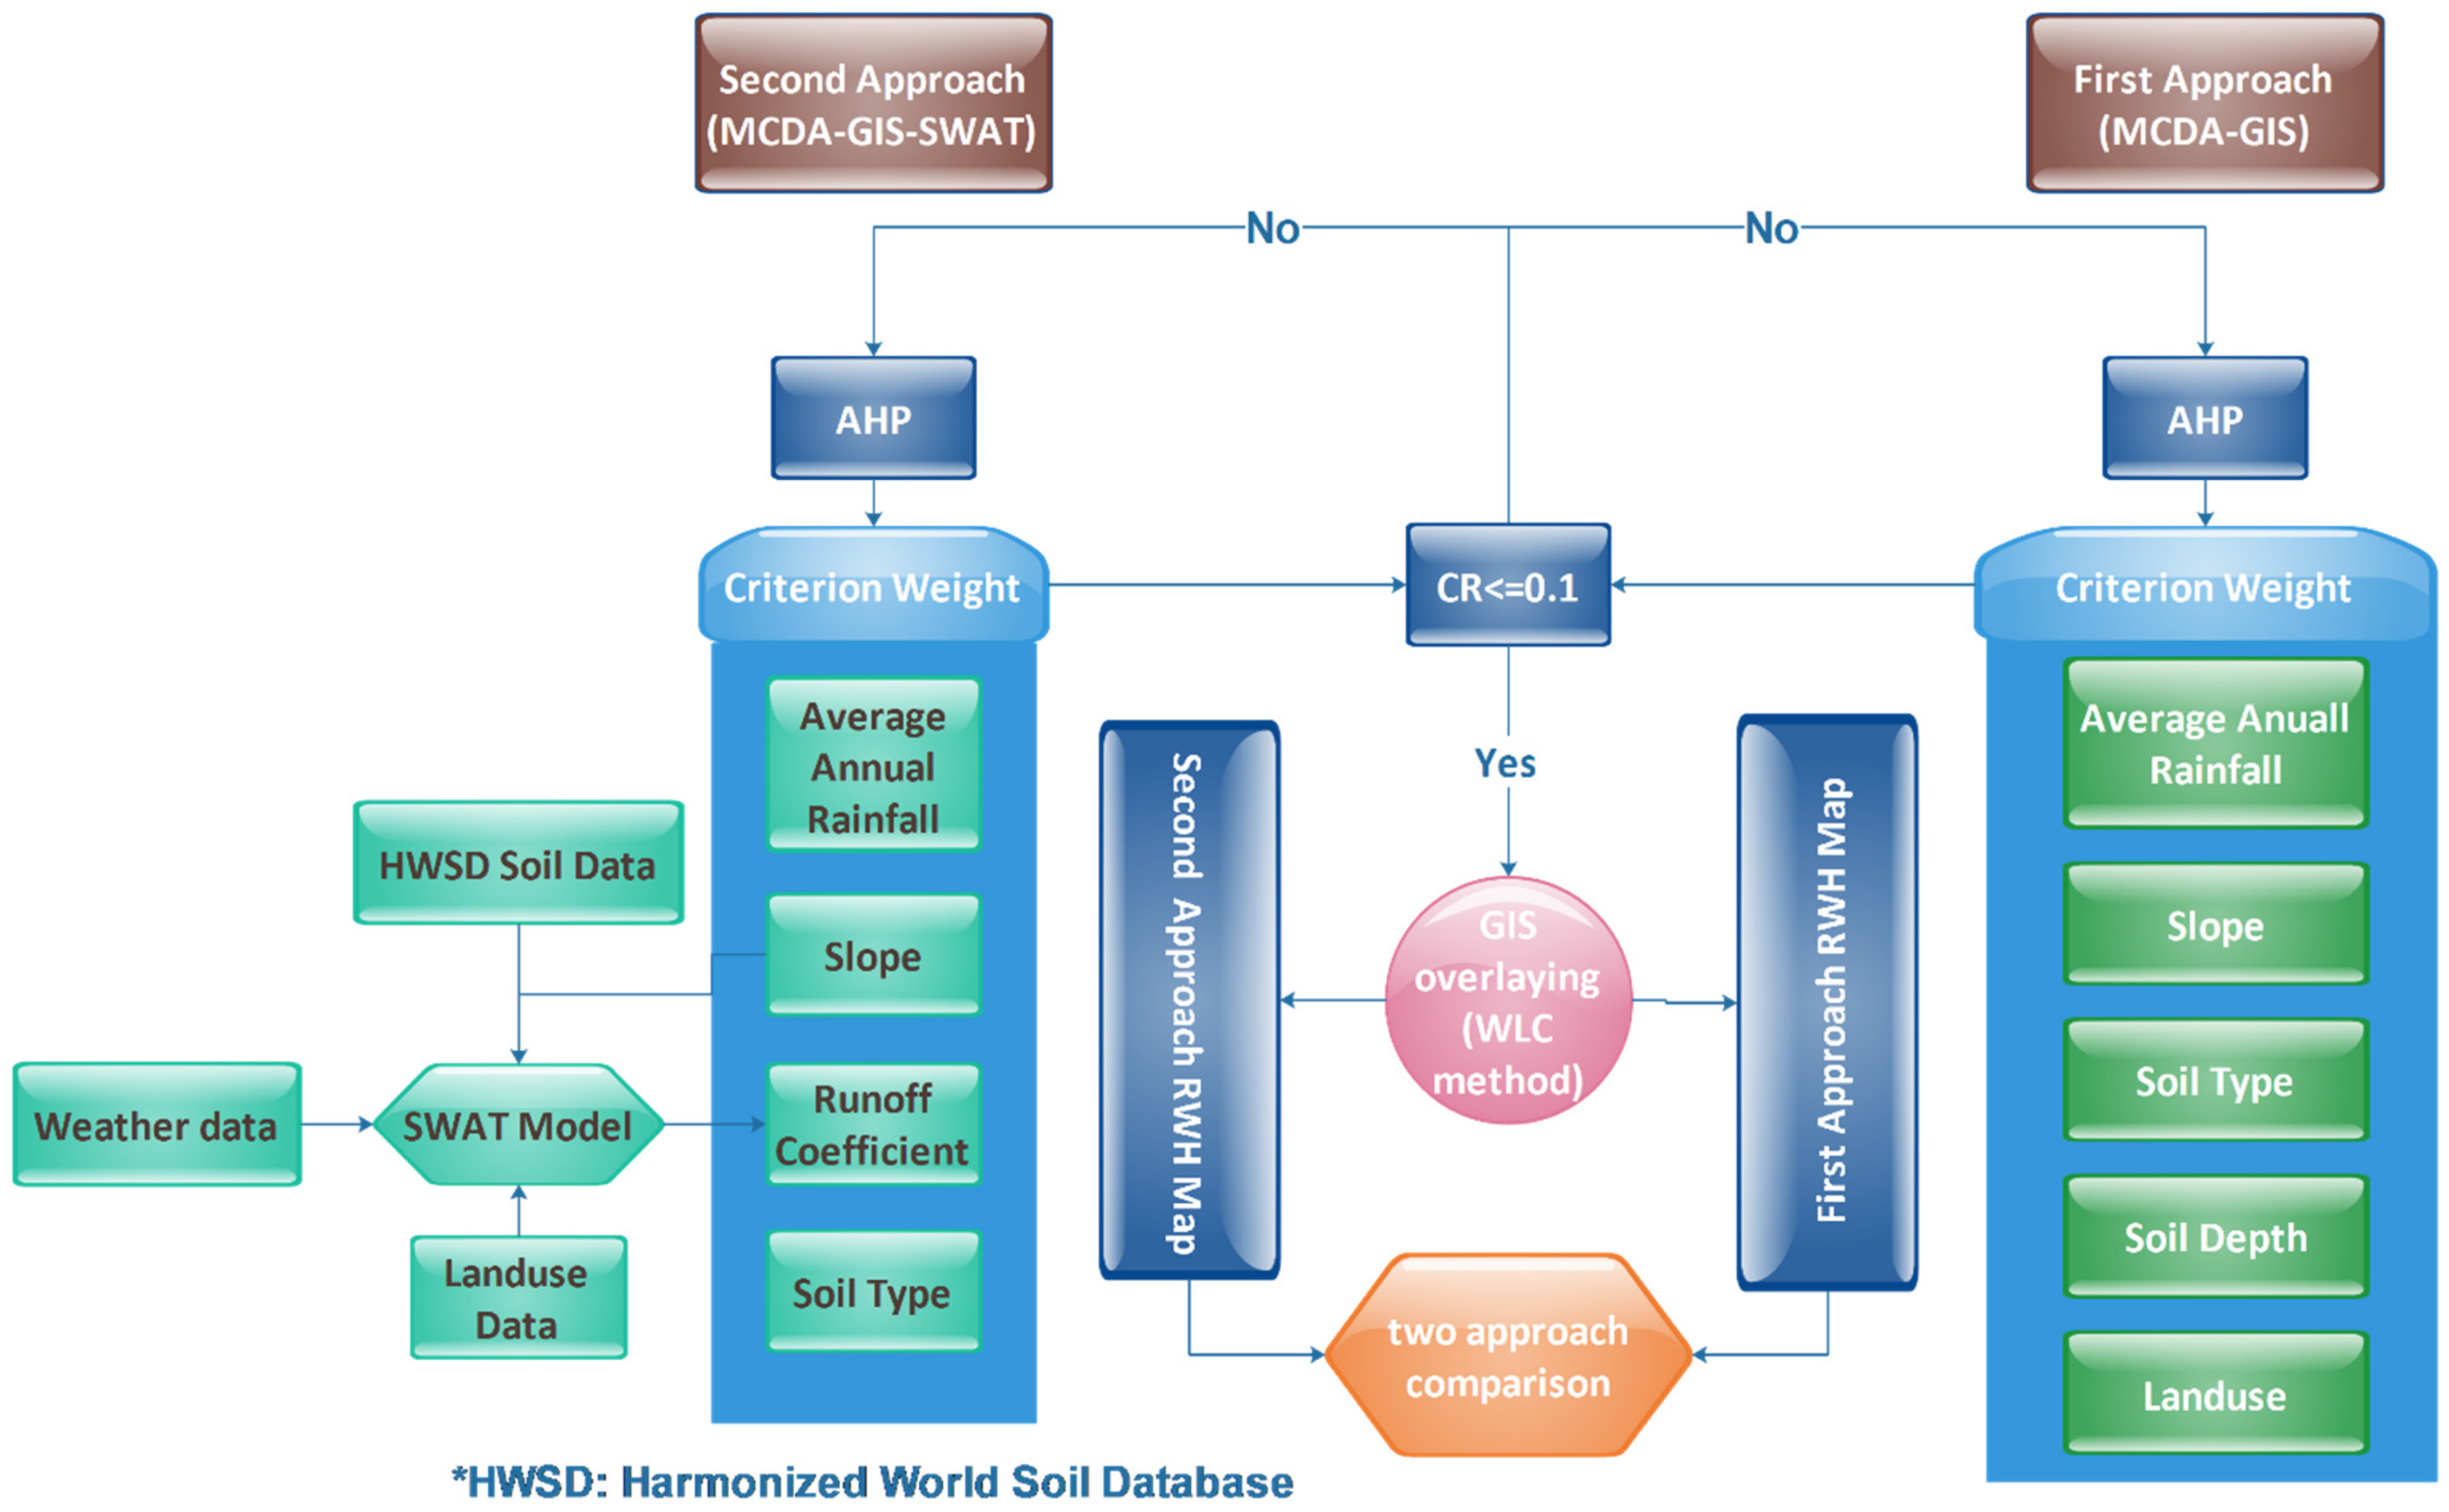
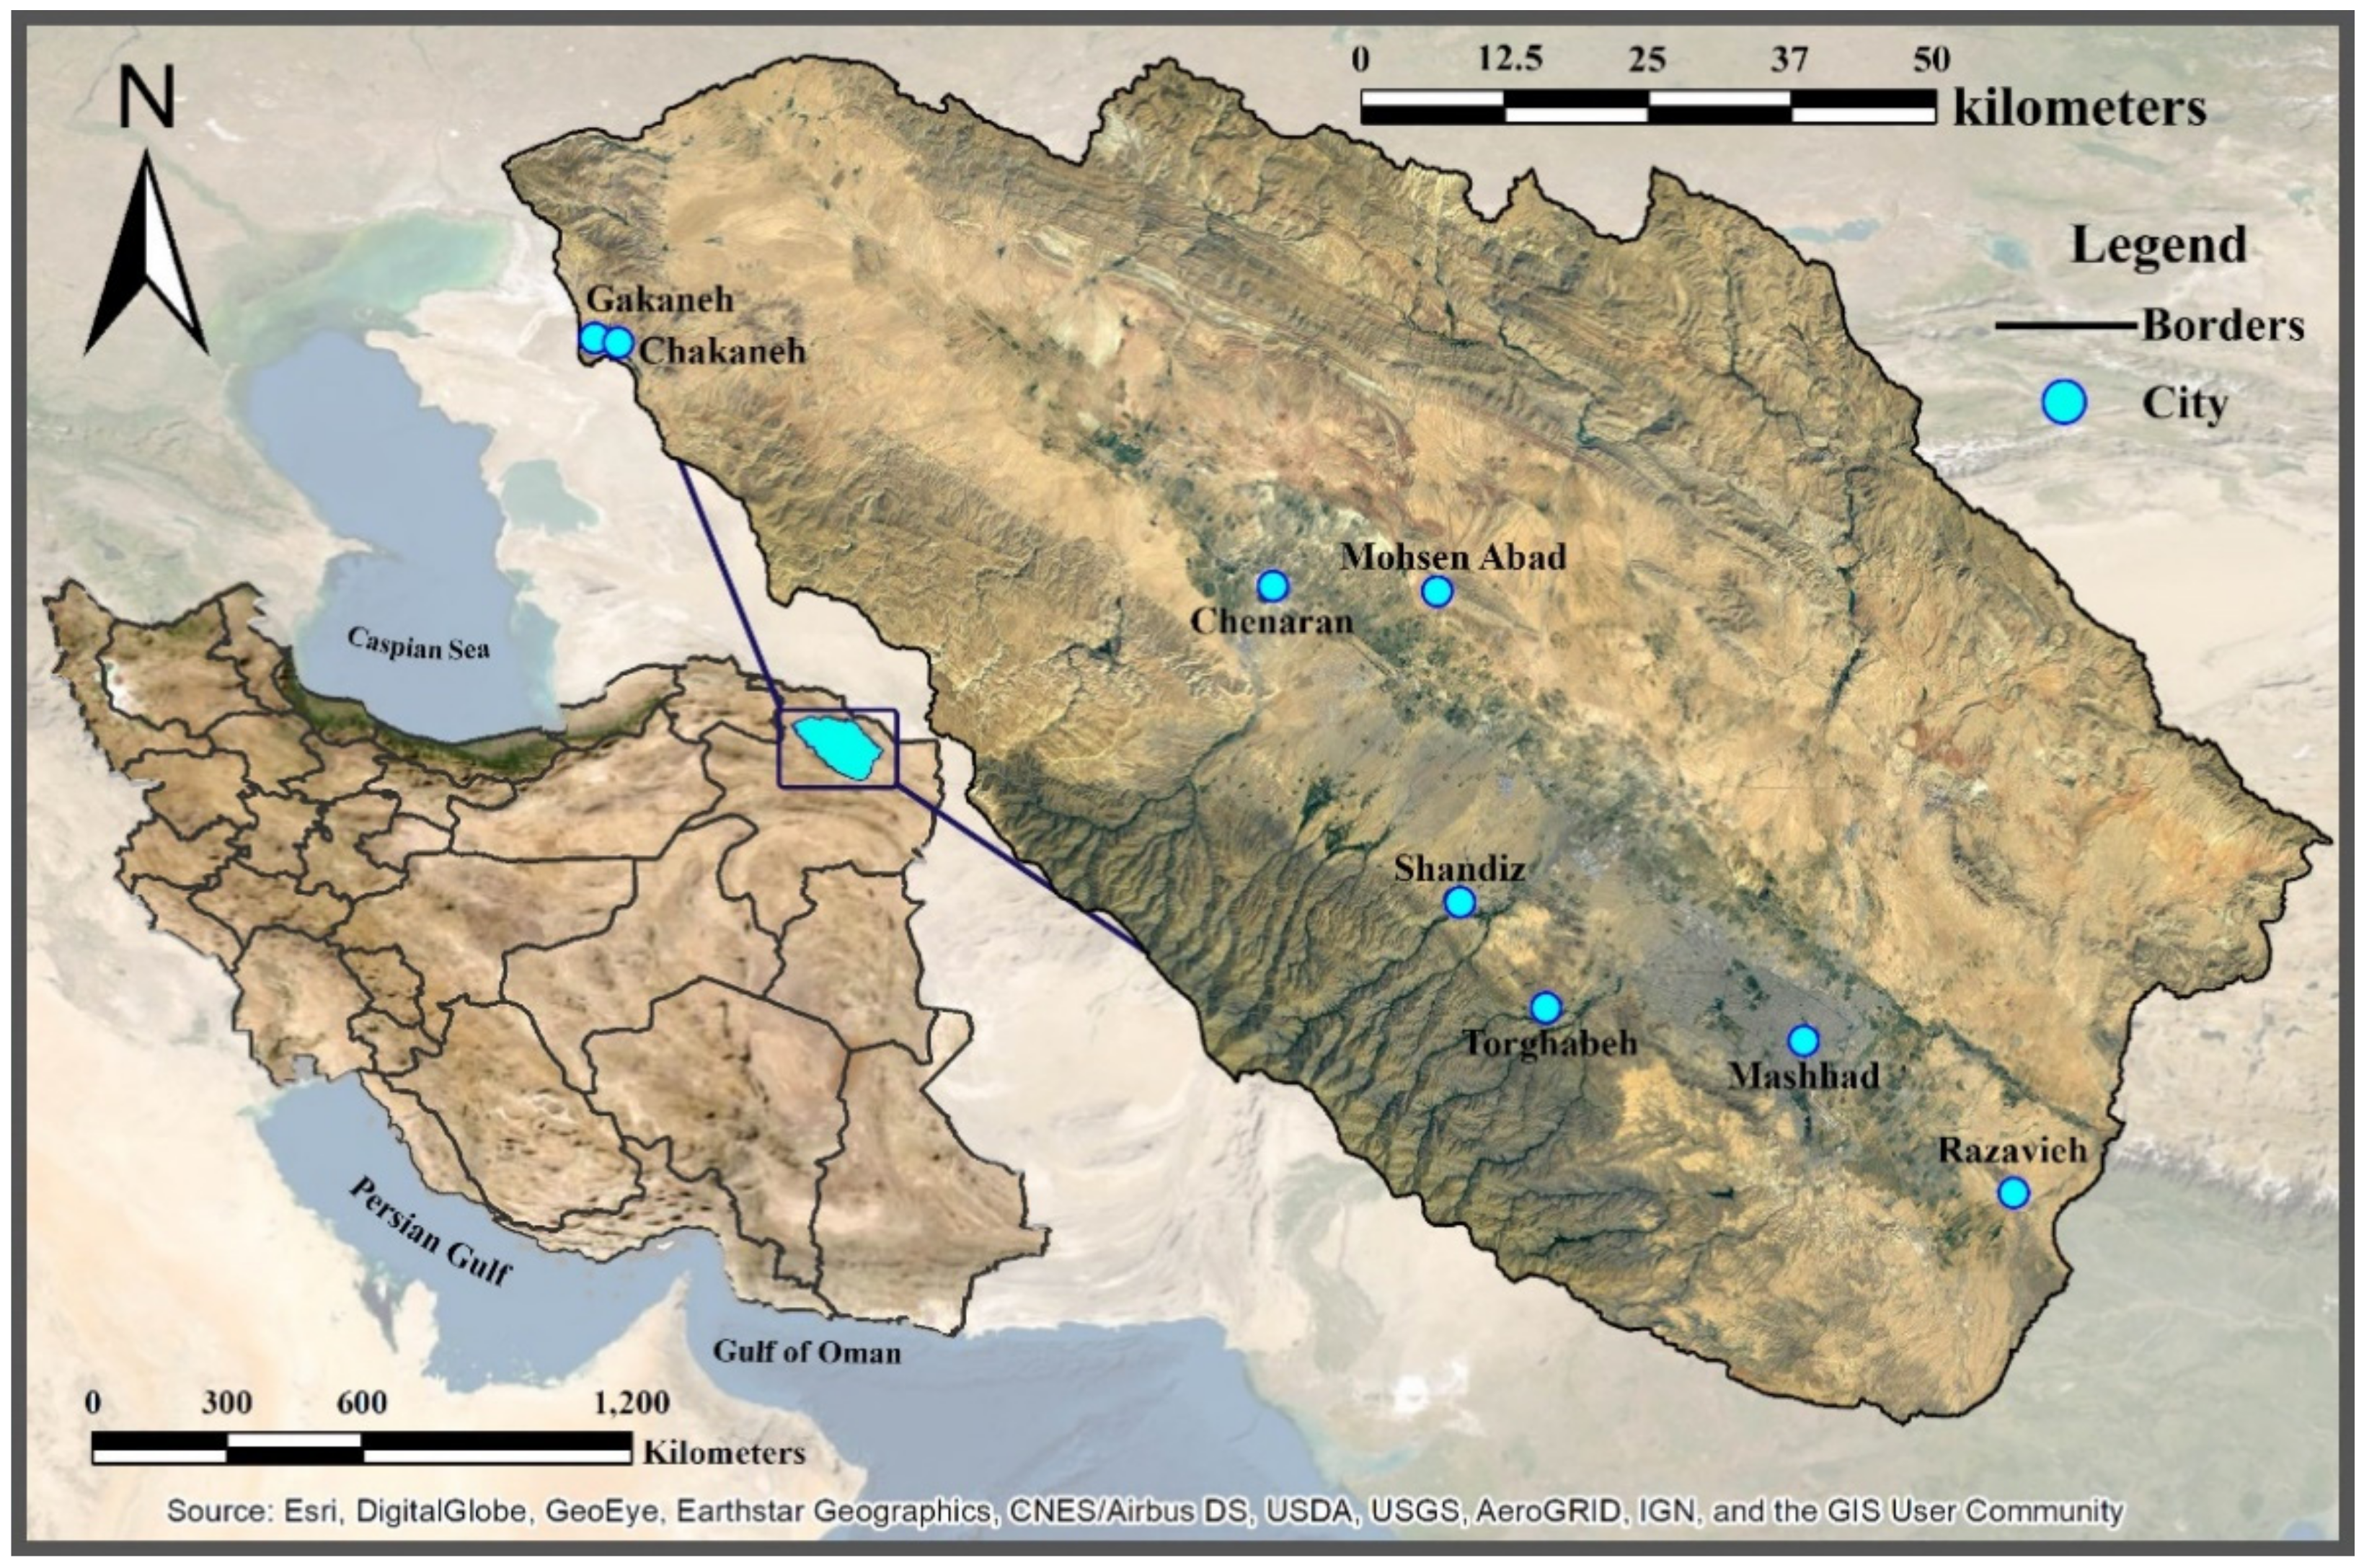
This paper evaluates the impact of incorporating a hydrological model on improving the identification of suitable RWH locations. To enable the evaluation, two approaches, one including hydrological model and the other one excluding the hydrological model, are examined. The integrated MCDA-GIS approach was used as the first approach. The second approach, which incorporates hydrological modeling, was the combination of the SWAT model with MCDA and GIS. MPB is located in northeast Iran and struggles with water supply, especially in recent years. A parameters sensitivity analysis was performed to reduce the subjectivity of parameters selected using expert judgment [48]. In addition, it identified the most sensitive criteria for locating potential RWH zones in MPB. In the end, the most applied RWH structures in ASARs were evaluated for MPB to find the best practices for high-potential areas for RWH.
The inclusive objectives of this research are to: (1) develop and compare the MCDA-GIS approach with the MCDA-GIS integrated with SWAT approach to identify potential RWH zones in the MPB; (2) implement sensitivity analyses on the two approaches to identify the most contributing criteria for potential RWH zone selection; (3) identify the potential location for three conventional RWH techniques (i.e., ponds and pans, terracing, and percolation tank) over MPB. The combined approach of the SWAT model, MCDA, and GIS was evaluated for the first time in ASARs. This paper is categorized as follows: in Section 2, we describe the study basin and the data and methods used in this study. Section 3 presents the results of the evaluation. Section 4 describes conclusions and recommendations for future studies.

2. Materials and Methods

2.1. Study Framework

In this study, a GIS-based MCDA framework has been developed and implemented at a large basin scale for the identification of potential RWH areas. Figure 1 represents the conceptual methodological framework of this study. In the present study, two approaches were developed and compared. In the first approach, five biophysical factors: rainfall, slope, land use, soil type, and soil depth, were incorporated into an MCDA for the evaluation of potential RWH zones. While in the second approach, four factors: slope, rainfall, and soil type, along with the runoff coefficient map derived from the SWAT model were used. The selected criteria in both approaches were weighted using AHP and then normalized and reclassified using GIS techniques. Afterward, different sub-criteria were scored and rasterized. Then, weighted linear combination (WLC) was used in the GIS environment to develop the final potential RWH maps.

2.2. Study Area and Data Collection

The methodology was applied to MPB, located in the northeast of Iran, with an area of 9762 km2, between 35°59′ N to 37°03′ N latitude and 60°06′ to 58°22′ E longitude (Figure 2). The climate of the study area is semi-arid to arid, and the average monthly temperature ranges from 11.6 to 26.7 °C [48]. A review of 19 rain gauge stations during 30 years (1979–2010) indicated an annual average rainfall of 303 mm, which varies from 166 to 486 mm [53]. In general, a V-shaped monthly rainfall pattern is observed. January, February, and March are the wettest months, while the rainfall trend decreases until July, the driest month of the year, and increases again until December. Climate change has increased the temperature trend, while no considerable changes in rainfall patterns are observed [54]. The annual average evapotranspiration ranges from 236 to 310 mm [55]. In addition, the mean elevation of the basin is 1487 m above sea level (ASL), which varies from 856 to 3247 m ASL; and the average land slope in the study area is 16.2%. From the geological point of view, the main constituents of the study area are ultramafic, granitic, and metamorphic rocks. In addition, the northern parts of the study area are sedimentary zones, mainly comprised of limestone, conglomerate, dolomite, and gypsiferous marls, and the higher parts of the MPB include discontinuous loess deposits [56].

2.3. Data Collection

The available data were obtained from various governmental organizations and other direct sources, such as field surveys and RS (i.e., satellite imagery) data; data collection focused on the main influential factors to identify potential RWH areas, including maps of rainfall, soil, and land use. Furthermore, data processing and an assortment of supporting techniques were conducted to perform the data analysis. All the generated/available data (GIS layers) were geo-referenced to the MPB geographical coordinate system (WGS_1984_UTM_ Zone_40N).

2.4. Data Processing and Analysis

2.4.1. Criteria Map Generation

Slope map generation was performed using the ASTER DEM surface and the 3D Analyst tool in the ArcGIS environment. The hydrological soil map was reclassified into three soil groups, according to the soil texture and characteristics (infiltration and soil grading). The land use data were merely descriptive and were not readily available to be incorporated directly into the model; the geological field mapping along with the satellite images were used for better land-use data preparation.
The SWAT model was used due to model compatibility for regions lacking proper available data. The SWAT model incorporates various contributing factors in the runoff process and lessens the inherent biases involved in the MCDA-GIS approach [48].
ASTER DEM was utilized in the SWAT model to delineate basin, sub-basins, and hydrological response units (HRUs). Then, weather data for the period of 1981 to 2010 (i.e., CFSR (climate forecast system reanalysis), daily rainfall, minimum and maximum temperature collected from the GSMaP (global satellite mapping of precipitation)) was imported to build the basin model and enable hydrological simulation. Calibration and validation processes were neglected for two main reasons; the first reason is the inadequacy of observed runoff data to examine the model simulations and the comparative and/or relative survey of the results because in the comparative environment, calibration and validation processes are obviously not necessary. Therefore, the non-calibrated model does not have any impact on the relative runoff coefficient and the optimal locations for RWH. After calculating the annual average rainfall for each station, it was interpolated using the kriging method in ArcGIS, which was later averaged over each sub-basin. With the mean runoff depth obtained from the SWAT model, and the average rainfall over each sub-basin, a mean runoff coefficient was determined for all 43 sub-basins within the study area.
After preparing the selected criteria and assigning normalized scores to each sub-criterion, the final map for each criterion was generated and classified into three classes. For all the criteria, except soil depth, soil type, and land use, the classification method of Jenks natural breaks was applied [57,58]. The Jenks natural breaks method, which is considered a conventional method of classification, has been frequently used by previous studies [30,59,60]. Natural break classes are based on natural groupings inherent in the data. Class breaks are identified such that similar values are grouped and the differences between the mean values of classes maximized [57]. It should be noted that the classification of soil depth, soil type, and land use was done based on the literature and expert judgment.

2.4.2. Comparison of Approaches

To compare the potential RWH maps resulting from the two approaches, the correlation coefficient (CC) between the two maps was calculated using the band collection statistics tool in ArcGIS [61]. The correlation between two grid datasets was calculated as the covariance of two grids divided by-product of standard deviations of two grids, as follows:
CC = Cov ij σ i σ j
where σ i and σ j are the standard deviation of grid i and j, which here can refer to the resulting potential RWH maps of approach 1 and 2, respectively;   Cov ij is the covariance between all pairs of cells of the two grids, calculated as follows:
Cov ij = k = 1 N ( V ik µ i ) ( V jk µ j ) N 1
where V is the cell value, µ is the mean value of each grid, N is the total number of cells in each grid, and k denotes a particular cell in the grid. The CC ranges between −1 to 1, such that CC equal to 1 and −1 showing a fully positive and negative correlation between two grids, respectively.

2.5. Multi-Criteria Decision Analysis

2.5.1. Analytic Hierarchy Process (AHP)

To produce the potential RWH map, AHP was selected as an MCDA technique [62]. AHP has been widely used due to its simple interpretation and implementation, as well as the consistency of its results [59,63,64,65]. However, the main challenge with the MCDA method is how to select the criteria and relative weights, considering the judgment of experts. Therefore, through the use of expert knowledge and extensive review of RWH articles, effective criteria were selected and proper weights and scores were assigned [16,25,66]. Each of the mentioned criteria had different feature classes; the appropriate score for each feature class of the layers was determined and then normalized. Proper scores were assigned to selected thematic layers on a scale of 1–9, proposed by Saaty [67]. A pair-wise comparison of the assigned weights matrices was made using the Saaty AHP approach to determining the weights of the criteria. Subsequently, these desired priority vectors were computed using the eigenvector technique [62] and finally the assigned weights were tested for consistency by computing the consistency ratio as follows [67]:
Consistency Ratio (CR) = (λmax − n)/((n − 1) × RI)
where λmax is the principal eigenvalue computed by the eigenvector technique, n is the number of criteria, and RI denotes random index. More details about the eigenvector technique are provided by Saaty (1980) [67].
It is worth mentioning that the AHP method requires independence between each criterion; while the parameters used in approach 2 (i.e., runoff coefficient, soil type, and slope) are interrelated. Nevertheless, the aims of selecting and including criteria into AHP are two-fold. The selected area for RWH should have, first, the potential of runoff generation and, second, the potential of runoff harvesting. Two areas having the same runoff coefficient and the same amount of rainfall do not necessarily provide the same chance of RWH; the area with a gentler slope and less pervious soil provides a better opportunity for RWH. The runoff coefficient is a key parameter in RWH in the second approach that shows the percent of water that can be available for RWH and has the highest weight compared to the other factors. Rainfall, slope, and soil type are, accordingly, other parameters that determine the feasibility of harvesting rainwater, having lower effective weights in the second approach, respectively.

2.5.2. Rainwater Harvesting Potential Index (RWHPI)

In this study, for each of the two approaches mentioned in previous sections, different criteria were used, as listed in Table 1. These criteria were selected based on their proven effectiveness in locating potential RWH zones in ASARs, as documented in a literature review [16,25]. All thematic layers, along with their normalized weights were integrated using ArcGIS software to map the potential RWH zones for both approaches. The total normalized weights of different features were overlaid in the integrated raster layer using the weighted linear combination (WLC) as Equations (4) and (5), which were used for the first and second approaches, respectively.
RWHPI = ( R ) c ( R ) s + ( S ) c ( S ) s + ( ST ) c ( ST ) s + ( SD ) c ( SD ) s + ( LU ) c ( LU ) s
RWHPI = ( R ) c ( R ) s + ( RC ) c ( RC ) s + ( S ) c ( S ) s + ( ST ) c ( ST ) s
where RWHPI is rainwater harvesting potential index, subscript c shows the normalized weight of each criterion, and subscript s denotes the normalized score of a feature class of each criterion. RWHPI is a dimensionless indicator that is useful for finding the high-potential RWH zones within the study area.

2.6. Sensitivity Analysis

It is very important to check the reliability and robustness of the methodology used in this study and the results should be validated to evaluate the impact and importance of each of the factors affecting the model. Sensitivity analysis was performed to obtain insights into the dependence of model outputs on certain model variables [68]. These analyses, in addition to determining the impact of each variable on the RWH analysis, reduce the subjective aspects of the various criteria. The most sensitive identified criteria are ranked as the first priority for future analyses, to ensure more accurate measurements due to their high weights in the analysis. Single parameter analysis introduced by Napolitano et al. [69] was used to estimate the contamination vulnerability of aquifers in several studies [70,71]. In addition, single parameter sensitivity analysis manages the over-parameterization that commonly occurs in hydrological modeling [48,49,72]. The sensitivity analysis method replaces the initial criteria weight used for the AHP with “effective weights” calculated using Equation (6):
W i = j = 1 n F i   ×   S ij V j     ×   100 / n
where Wi is the effective weight of each factor, F i indicates the initial weight of criterion, S ij is the value score of ith criterion in jth pixel of the raster map, and Vj is the value of the applied index (i.e., RWHPI) and n is the number of pixels in the raster map of the case study. The sensitivity analysis was applied to both approaches.
After performing the sensitivity analysis, the effective weights were applied to obtain the modified RWHPI. The modified RWHPI assumes the same class scoring and parameters as the base RWHPI but using effective weight values obtained from Equation (6), (i.e., W). The modified RWHPI is obtained considering the effective weight of each criterion rather than the initial assigned weight, which reduces the initial subjectivity of the assigned weights selected by using expert judgment.

2.7. Identification of Suitable Sites for Different RWH Techniques

After identifying potential RWH areas and also discarding unsuitable areas for RWH, different RWH techniques for the potential areas were evaluated. For this purpose, the most common techniques used in ASARs for agricultural and domestic applications were considered, including percolation tanks, terracing, and pond and pan [25]. The suitability map for each RWH technique was generated based on common local practice criteria, as well as a comprehensive review of previous studies. The most common parameters applied for the development, planning, and implementation of such techniques are listed in Table 2 [25]. In the following sections, some explanations about several RWH techniques are provided.

3. Results

3.1. Selected Criteria in MCDA

In the present study, two approaches for locating potential RWH zones were implemented and compared to examine the effect of incorporating SWAT as a hydrological model to the frequently used approach of MCDA-GIS [24,25,31,75]. In the calculation of RWHPI and generating RWH potential maps, the highest harvesting possibilities of rainwater, as well as runoff generation, were considered. The RWHPI for the first and second approaches were calculated using Equations (4) and (5), respectively. To guarantee the consistency of the analyses, the procedure of weighting thematic layers in AHP was set such that the consistency ratio for all of the obtained thematic layers would be less than the limit of 0.10 [67]. The selected RWH criteria, as well as the assigned corresponding weights, are shown in Table 3. Their selection was based on expert knowledge and extensive literature reviews over several RWH publications for ASARs.
Most of the selected biophysical criteria in this study have been widely used in previous studies in ASARs. Adham et al. [25] showed that, in 48 studies regarding the potential RWH evaluation through GIS, land cover/use (75% of studies), soil type (75% of studies), rainfall (56% of studies), and slope (83% of studies), were used as influential criteria. The rainfall data are one of the necessities/prerequisites to identify potential RWH zones and technically more rainfall in an area means a higher-potential RWH [80]. In ASARs, in terms of the practical effectiveness of RWH techniques, a minimum available rainfall of 200 mm/year was recommended [81,82]. Daily global rainfall CFSR data for 30 years (1981 to 2010) were used and mean annual rainfall data over the sub-basins were obtained. According to the rainfall map shown in Figure 3b, the annual rainfall ranges from 161 to 466 mm, and over 60% of rainfall occurs during December, February, March, April, and May. The northern sub-basins receive a higher amount of rainfall (about 400 mm/year), while less rainfall (around 161–202 mm/year) is received in the southern sub-basins. The rainfall received in the middle parts of the study area ranges from around 203 to 395 mm/year. In this study, direct consideration of evaporation was ignored due to a lack of data and simplification. However, in the second approach, evaporation was indirectly considered. This is because of the fact that the runoff coefficient map utilized as a biophysical criterion was obtained from a SWAT model, which considers evaporation in the process.
The slope is another criterion for the mapping of potential RWH zones. As the percentage of slope increases, the runoff generation increases, while the harvesting opportunity of rainwater for most RWH techniques decreases—this results in less suitability for RWH [29,77]. Hilly areas respond to rainfall events in the way that a high amount of rainwater rapidly runs off and becomes unavailable, even if the mean amount of rainfall is fairly noticeable. That is the case, particularly in the peak domestic and agricultural demand periods [77]. On the other hand, milder areas retain water for a longer time and facilitate groundwater recharge. Moreover, a large amount of earthwork along with implementing erosion control measures are required for constructing RWH systems on hilly areas, which undermines the economic aspect of building RWH systems in areas with a high degree of slope [31,42]. Typically, areas with higher slopes (>5%) are more prone to erosion due to the uneven distribution of runoff over the area [83]. A slope map is shown in Figure 3c. All around the study area, except for the southeastern border, is surrounded by mountains (high elevation areas), while central portions of the study area are located at lower elevations. The slope ranges between 0 and 1% in almost 37% of the study area and the slope of 9.1% of the study area is in the range of 1 to 3%. Steep areas (>15%) cover 4.1% of the basin. The rest of the desired region is divided into three almost equal portions (around 16% of the study area) that have slope ranges of 3–5%, 5–10%, and 10–15%.
Another important criterion for RWH planning and selecting optimal locations for implementing RWH techniques is the soil type [84,85]. Soil characteristics determine the infiltration capacity rate, water holding capacity, and runoff generation potential [78,85,86,87]. The textural features of soil are determined by the percentage of sand, silt, and clay. Naturally, a higher sand portion in the soil implies a higher infiltration rate, lower water storage capacity, and lower runoff generation potential, while the reverse of these properties is the case when the soil consists of a higher clay percentage [78,86,88]. A soil map is shown in Figure 3d. Sandy clay loam with low infiltration rates forms about 25.4% of the soil in the study area; besides, silt loam, or loam with a moderate infiltration rate forms about 49.3% of the study area. The rest of the basin (almost 25.3%) consists of clay/clay loam with a low infiltration capacity rate and consequently higher runoff potential. There are several factors (e.g., vegetation coverage, soil texture) involved in the amount of runoff that is generated from rainfall events which are reflected in a runoff coefficient [87,89]. Since most of the influential factors in runoff generation are considered in SWAT’s structure, the resultant runoff coefficient map reasonably represents case study characteristics.
The runoff coefficient map (Figure 3a) indicates the average runoff coefficient of each sub-basin over 30 years (1981–2010). The runoff coefficient map values range from 0.03 to 0.18. The northern parts indicate higher values while lower runoff coefficients are shown in the southern sub-basins. Typically, a higher runoff coefficient denotes a higher runoff potential; nevertheless, it should be mentioned that successful RWH is not exclusively the function of high runoff potential, but the potential of harvesting the generated runoff should also be considered, which itself is a function of other criteria to ascertain potential RWH.
Land use characteristics dictate the quantitative and qualitative relations between captured rainfall by the basin, groundwater recharge, evapotranspiration loss, and the remaining water running off a basin [88]. Infiltration is lower in urban and pasture-covered areas, which results in higher overland flow. While, as the vegetation coverage becomes intense, water abstraction, interception, and infiltration are increased and its consequences in less generated runoff [40,48,84]. The land use map (Figure 3f) shows that dominated land covers of low-density pasture, semi-dense pasture, irrigated agriculture, and dry farming constitute 23%, 24%, 19%, and 25% of the study area, respectively. It is worth mentioning that due to the incorporation of the runoff coefficient map, the land use layer was not directly included in the second approach. This is because the runoff coefficient map is highly dependent on land use and SWAT requires a land-use map as an input. Thus, the impact of different land uses on RWH is intrinsically reflected in a runoff coefficient map.
The classification of the soil depth map (Figure 3e) based on FAO suggestions (Food and Agriculture Organization of the United Nations) [90] includes very shallow (<30 cm), shallow (30–50 cm), moderately deep (50–100 cm), and deep (100–150 cm). The soil depth map (Figure 3e) indicates that central portions of the study area are mainly covered by deep soils (20.9%), while outer areas are mostly shallow soils (46%). The rest of the basin (27.6%) has relatively deep soil. Areas with shallow soils are potentially more suitable for RWH than areas with deep soils (with some exceptions, such as terrace (earthwork)) due to lower permeability and higher water generation [91]. In other words, a runoff coefficient is higher in areas with a shallower soil depth. The soil depth layer was not directly included in the second approach due to the high dependency of runoff coefficient on soil depth. A runoff coefficient is interrelated to the soil depth and assumed as its proper representative in the second approach.

3.2. Rainwater Harvesting Potential Maps

RWH Potential maps were produced by integrating the selected layers (Table 3) of each approach using the WLC technique in ArcGIS Spatial Analyst Tools. Afterward, RWHPI was computed using Equations (4) and (5) for the first and second approaches, respectively, to generate the potential RWH maps, shown in Figure 4a,b. The output maps of both approaches were classified into three categories of “low”, “moderate”, and “high” RWH potential. The same classification method of Jenks natural breaks was implemented to classify both potential RWH maps to facilitate the comparison of the two approaches. The RWHPI for both approaches ranged in almost the same intervals for all RWH potential classes, as shown in Figure 4a,b. The low classes ranged in 0.083–0.181 and 0.102–0.193, moderate classes ranged in 0.182–0.253 and 0.194–0.242, and the interval of high classes were 0.254–0.352 and 0.243–0.337 for the first and second approaches, respectively. According to Figure 4a,b, although there are some discrepancies between the two developed maps, the general patterns of both maps are almost identical. The areas with high potential RWH are located in the northern parts of the case study area, while a lesser potential RWH was predicted by both approaches for the southern parts. The northwestern and central parts of the study area had moderate RWH potential.
Apart from the almost identical potential RWH area distributions of both approaches over the case study area, the coverage areas of each class are also analogous (Table 4). Moreover, the overlapping map of both approaches is shown in Figure 4c, where navy blue color shows a high overlap and the white-colored areas indicate no overlap. The overlap percentage of each RWH potential class is also provided in Table 4.
According to Table 4, the low potential RWH class comprises almost 30% of the study area in both approaches, such that 80.4% of the area is in common between the two developed maps. This fact shows the conformity of the two approaches in discriminating areas with less potential for RWH. Areas with high RWH potential cover 45.8% and 35.5% of the study area in the first and second approaches, respectively. While there is a noticeable difference in the percentages of the coverage area, 76.5% of the high potential RWH areas are overlapped in both maps. These areas that encompass 3394 km2 (Figure 4c) are mainly located in the northern part of the study area and are considered the most promising sites for RWH since they are obtained by both approaches. In addition, high potential overlap areas can be listed as top priority zones for RWH interventions by decision-makers. The models’ agreement on their high potential RWH increases their credibility. The moderate class comprises almost the same portions (24.3% and 30.5% for the first and second approach, respectively) of the basin; nevertheless, there is less agreement between the two models in this class and the overlapping coverage is 57.4%. The moderate class in the first approach is located in a more concentrated way, while there are more scatterings in the second approach. To more thoroughly compare implemented approaches, the correlation between the two obtained potential RWH maps was evaluated utilizing the Spearman method. The calculated correlation coefficient is 0.914, which indicates that the two maps are strongly correlated, and both approaches yield almost the same results. Based on the high correlation coefficient, percentages of overlapped area for each of the classes (Table 4), and the general pattern of the two potential RWH maps (Figure 4a,b), the following conclusion is obtained.

3.3. Sensitivity Analysis

Criteria weights and sub-criteria scores have a vital impact on the evaluation of the obtained results. Given that their determination is generally made through expert interpretation, the selection of potential RWH zones can be sensitive to weight changes in criteria-related decision weights [92,93]. For example, considering a feature in which the distribution of feature classes is rather homogeneous, this would have a fairly equal influence on the whole study area. Solving this problem requires sensitivity analysis in such a way that the weight values constantly change to check the amount of change in the final results. At first, as an initial weight, the runoff coefficient was considered as the dominant parameter. The next considered significant parameters included rainfall, slope, soil type, soil depth, and land use, respectively.
The results of the sensitivity analyses (Figure 5) showed that the least sensitive factor in approach 1 was land use (with the mean value of 0.075), which was expected due to the weight factors assigned (Table 3). Additionally, in approach 2, the least sensitive parameter was slope (with the mean value of 0.207). Performed comparison of the RWHI map produced from the sensitivity analyses of approach 1 and approach 2 indicates that these two approaches are well comparable in general, therefore it would be rational to conclude that the assumed weight was fairly suitable and the results are reliable as both weights and final results were rather similar.
The result of sensitivity analysis for both approaches revealed that the effective influence of the assumed weights for rainfall and runoff coefficient layers would be less in reality (Table 5). This can be attributed to the rather homogeneous distribution of rainfall and runoff coefficient layers and the fact that they were averaged for each sub-basin (see Figure 3a,b). Revising the initial weight of criteria with the effective weight obtained from sensitivity analysis, Equation (6), slightly increased the overall overlap of the two approaches with a previous study. The overlap of approaches 1 and 2 after sensitivity analysis were, thus, 47.9 and 37.7%, respectively. To be more specific, using sensitivity analysis decreases the sensitivity of features by minimizing the difference between the estimated weights and their real influence. Examining the results of the sensitivity analysis of approach 1, it is observed that the parameters of rainfall and slope, both had the greatest impact on the model, in other words, have the highest sensitivity. In approach 2, the runoff coefficient parameter had the highest sensitivity. According to the RWH overlap map of the two approaches, about 50% of the study area has a high potential RWH, about 28% moderate, and about 22% low potential RWH (Table 6). Generally, the northern half of MPB has a high potential RWH; however, the southern half of the study area has a moderate to low potential RWH.
In conclusion, using CFSR data does not result in an identical output as using observed data due to the high sensitivity of locating potential RWH areas according to rainfall data; however, the global availability of CFSR data enables RWH analysis all over the world. Thus, more attention should be paid to data quality and also to the fact that the high uncertainty associated with them should not be neglected. In the next step/section, after identifying the high-potential RWH areas, the feasibility of different RWH structures in the study area is assessed.

3.4. Potential Zones for RWH Techniques

After identifying the most suitable areas for RWH, various RWH techniques were determined. As mentioned earlier, the most common RWH techniques are ponds and pans, terracing, and percolation tanks. Figure 6 shows the suitable locations for various RWH techniques from the perspective of both approaches 1 and 2. The whole study area is divided into low, medium, high, and unsuitable classes in terms of suitability for different techniques. The suitability map of the study area from the perspective of different techniques was prepared using criteria related to each technique for both approaches 1 and 2 in the ArcGIS environment, the results of which are according to Table 7. As presented in Table 7, the most suitable areas among the various techniques studied are related to ponds and pans, in which the total area with low, moderate, and high potential for this type of technique is about 44% (or about 4295 km2). After ponds and pans, the most suitable areas, respectively, are tanks with about 30% (about 2928 km2) and terracing with about 20% (about 1952 km2).

3.5. Potential of RWH in MBP Water Management

MPB has been struggling with water scarcity and shortage problems for decades. Currently, surface water supplies about 22% of the water demand in Khorasan Razavi Province, encompassing the MPB, and the rest is provided through groundwater resources. Of the total capacity of the large dams in Khorasan Razavi Province (1549 million cubic meters, MCM), most dams operate at only about 34% of their total capacity. On average, about 6404 MCM are extracted annually from groundwater sources, about 85% of which is exploited through wells, about 9% through qanats, and 6% through springs. However, groundwater recharge potential is only 5300 MCM, which indicates an average annual groundwater shortage of 1100 MCM. Groundwater over-extraction and the low operating capacity of existing dams have eventuated the province’s water crisis. Mashhad, as the center of the province, with an average annual water consumption (industrial, agricultural and domestic water consumption) of 26.46 MCM, has the highest over-exploitation of renewable water in the province (Khorasan Razavi Regional Water Authority [55]).
Nevertheless, based on the demonstrated results (Figure 5), the study area has a high RWH potential. An annual rainfall of 2946 MCM falls on the whole study area of which 1505 and 1569 MCM are on the high potential RWH class, and 952 and 780 MCM is received by the moderate class in the first and second approaches, respectively. Moreover, the rainfall received by the overlap of high potential RWH areas in both approaches is 1436 MCM. The resulting surface runoff within a catchment is one of the decent water resources, once it is managed efficiently, and can be utilized to supply a high portion of water (domestic and agricultural) demands. The results indicate the high potential of the case study area in harvesting rainwater and alleviating the existing water crisis. Finding and implementing efficient water management strategies at a basin/sub-basin scale is an urgent requirement of the MBP. Water shortages will continue to be a major problem in the study area unless efforts are made to achieve sustainable and efficient use of potential RWHs.

4. Conclusions

RWHs are recognized as an applicable and favorable method of water supply, as it conserves existing water resources, while contributes to water scarcity alleviation, particularly in ASARs. Nevertheless, identification of potential RWH areas is challenging due to the inherent uncertainty of input data and the subjectivity involved in selection of influential parameters. In the present study, two approaches for locating potential RWH areas were implemented. In the first approach, a frequently used MCDA-GIS method was utilized, while in the second approach, the SWAT model was included in the analysis in order to examine the effect of incorporating SWAT as a hydrological model into an MCDA-GIS method for RWH assessment. In this study, the SWAT model, as a more comprehensive hydrological model compared to the SCS curve number method was employed for generating the runoff coefficient map.
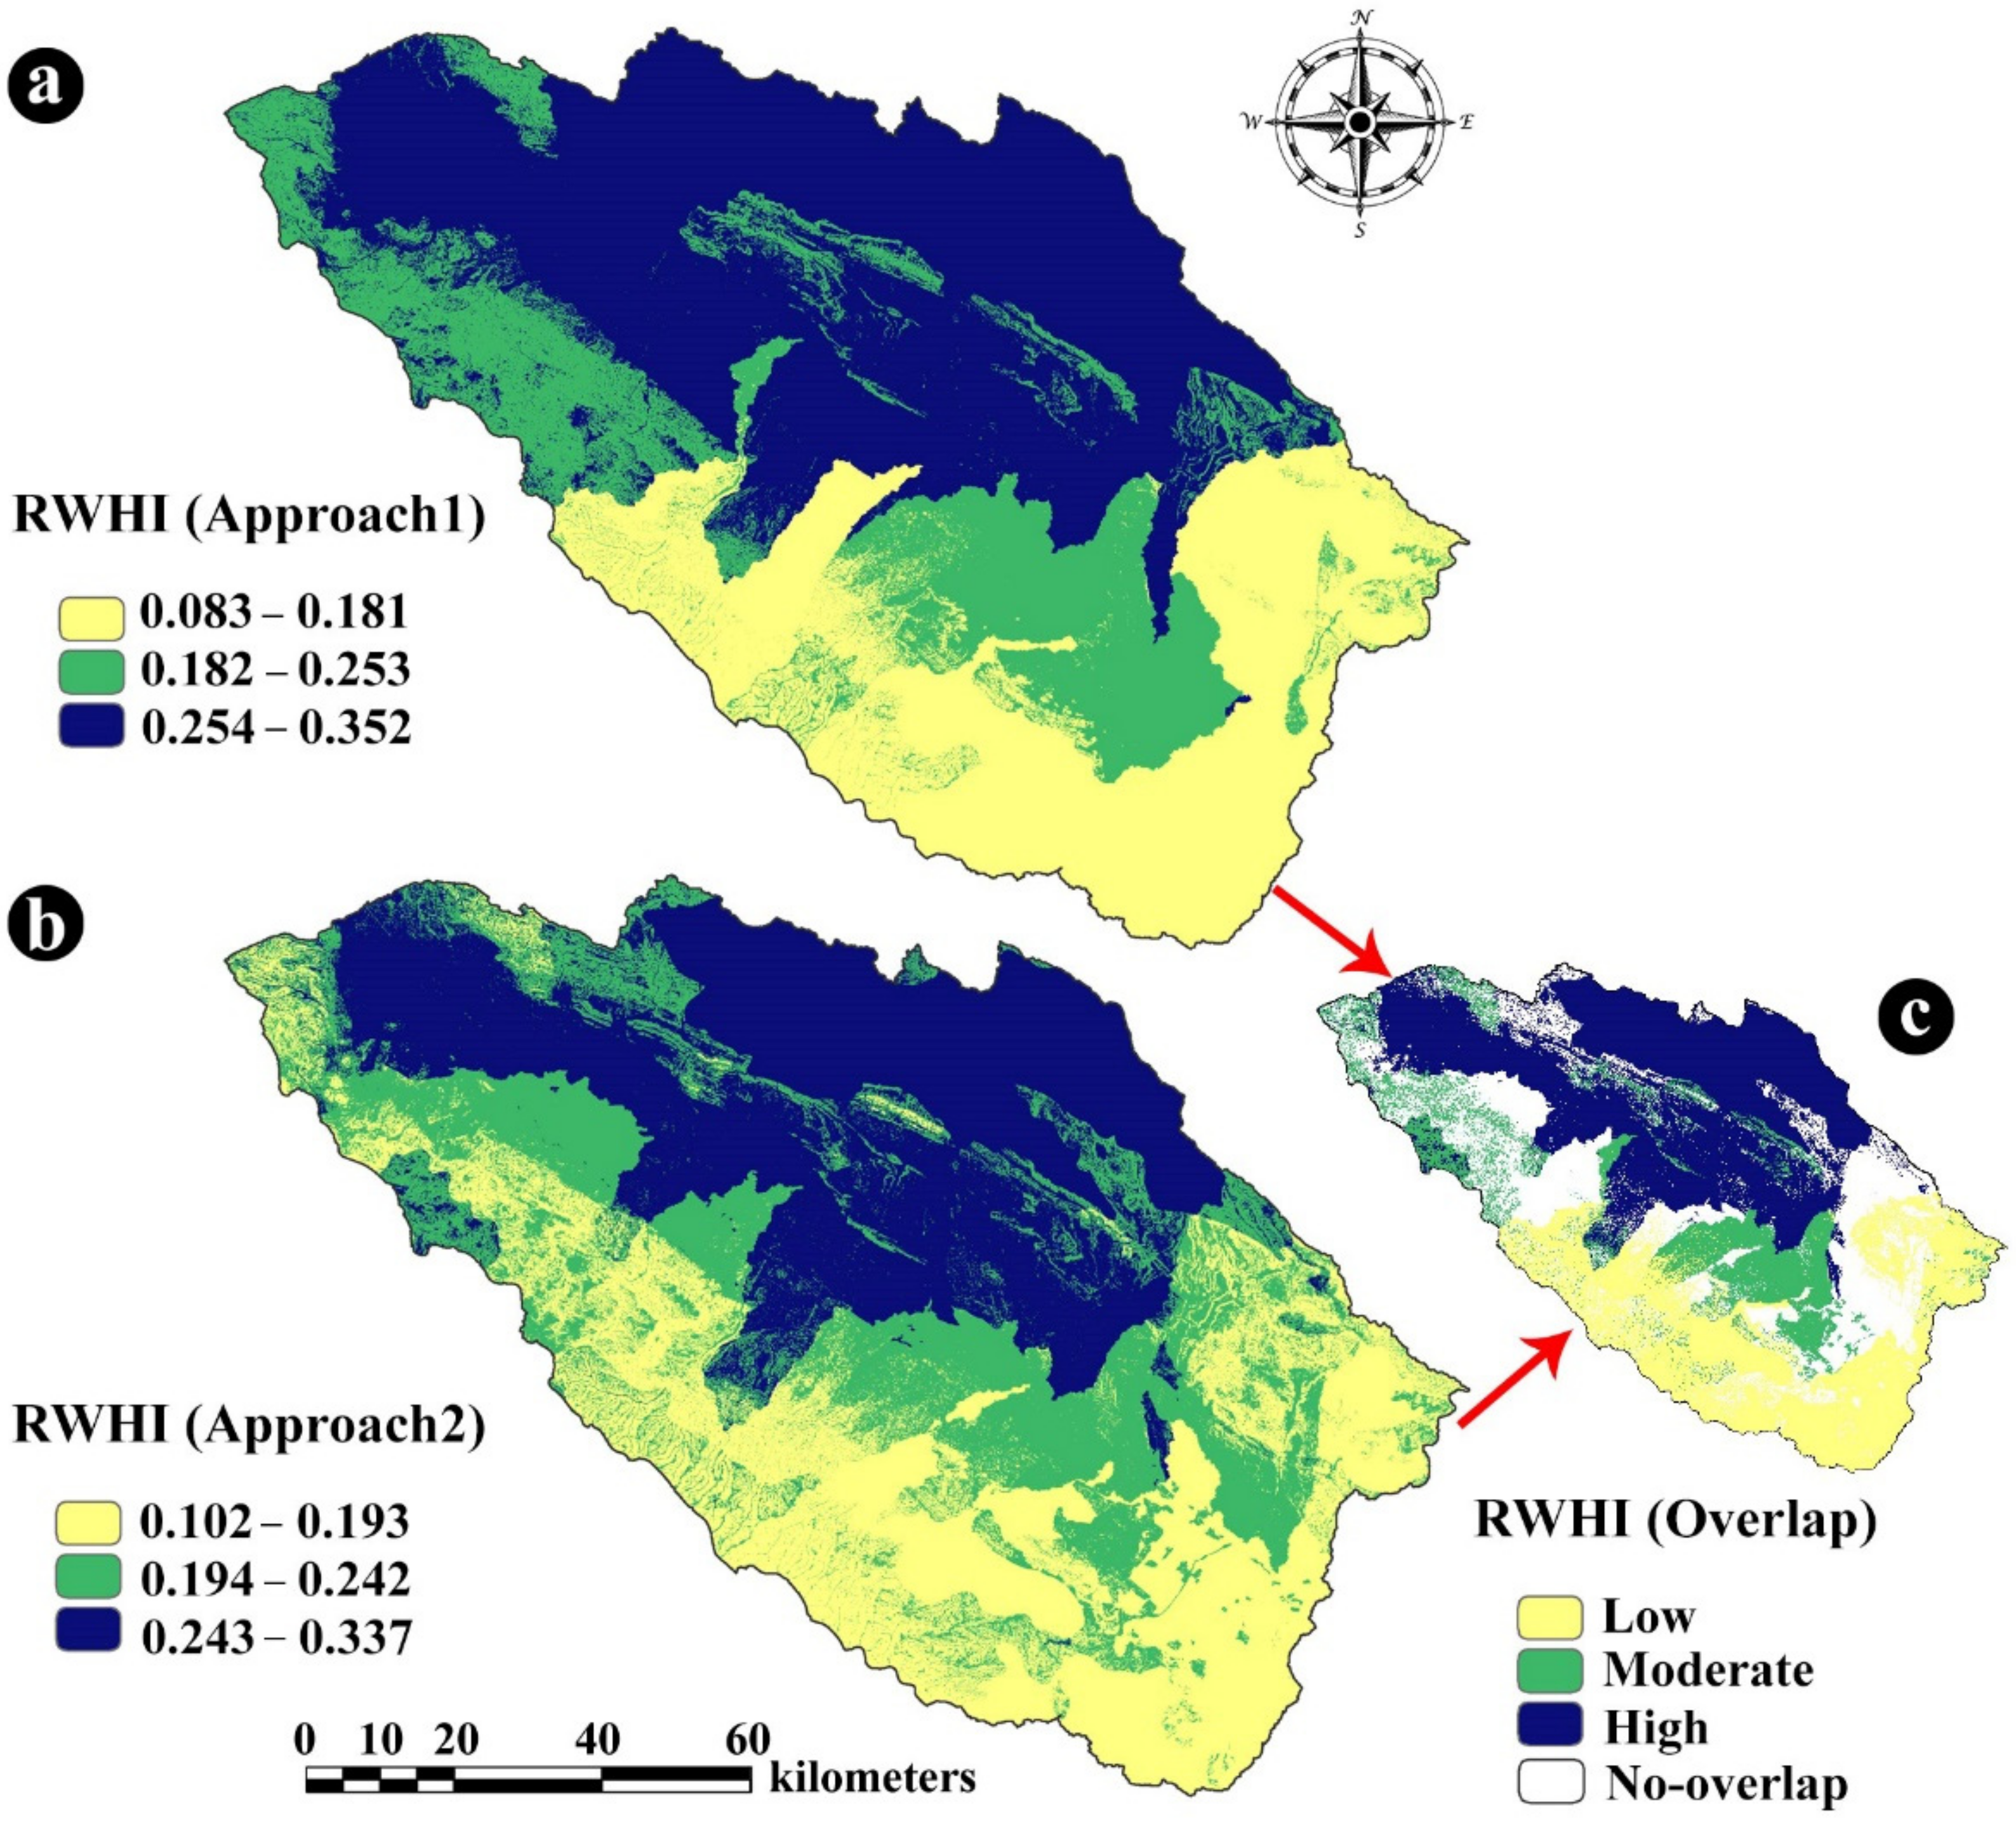
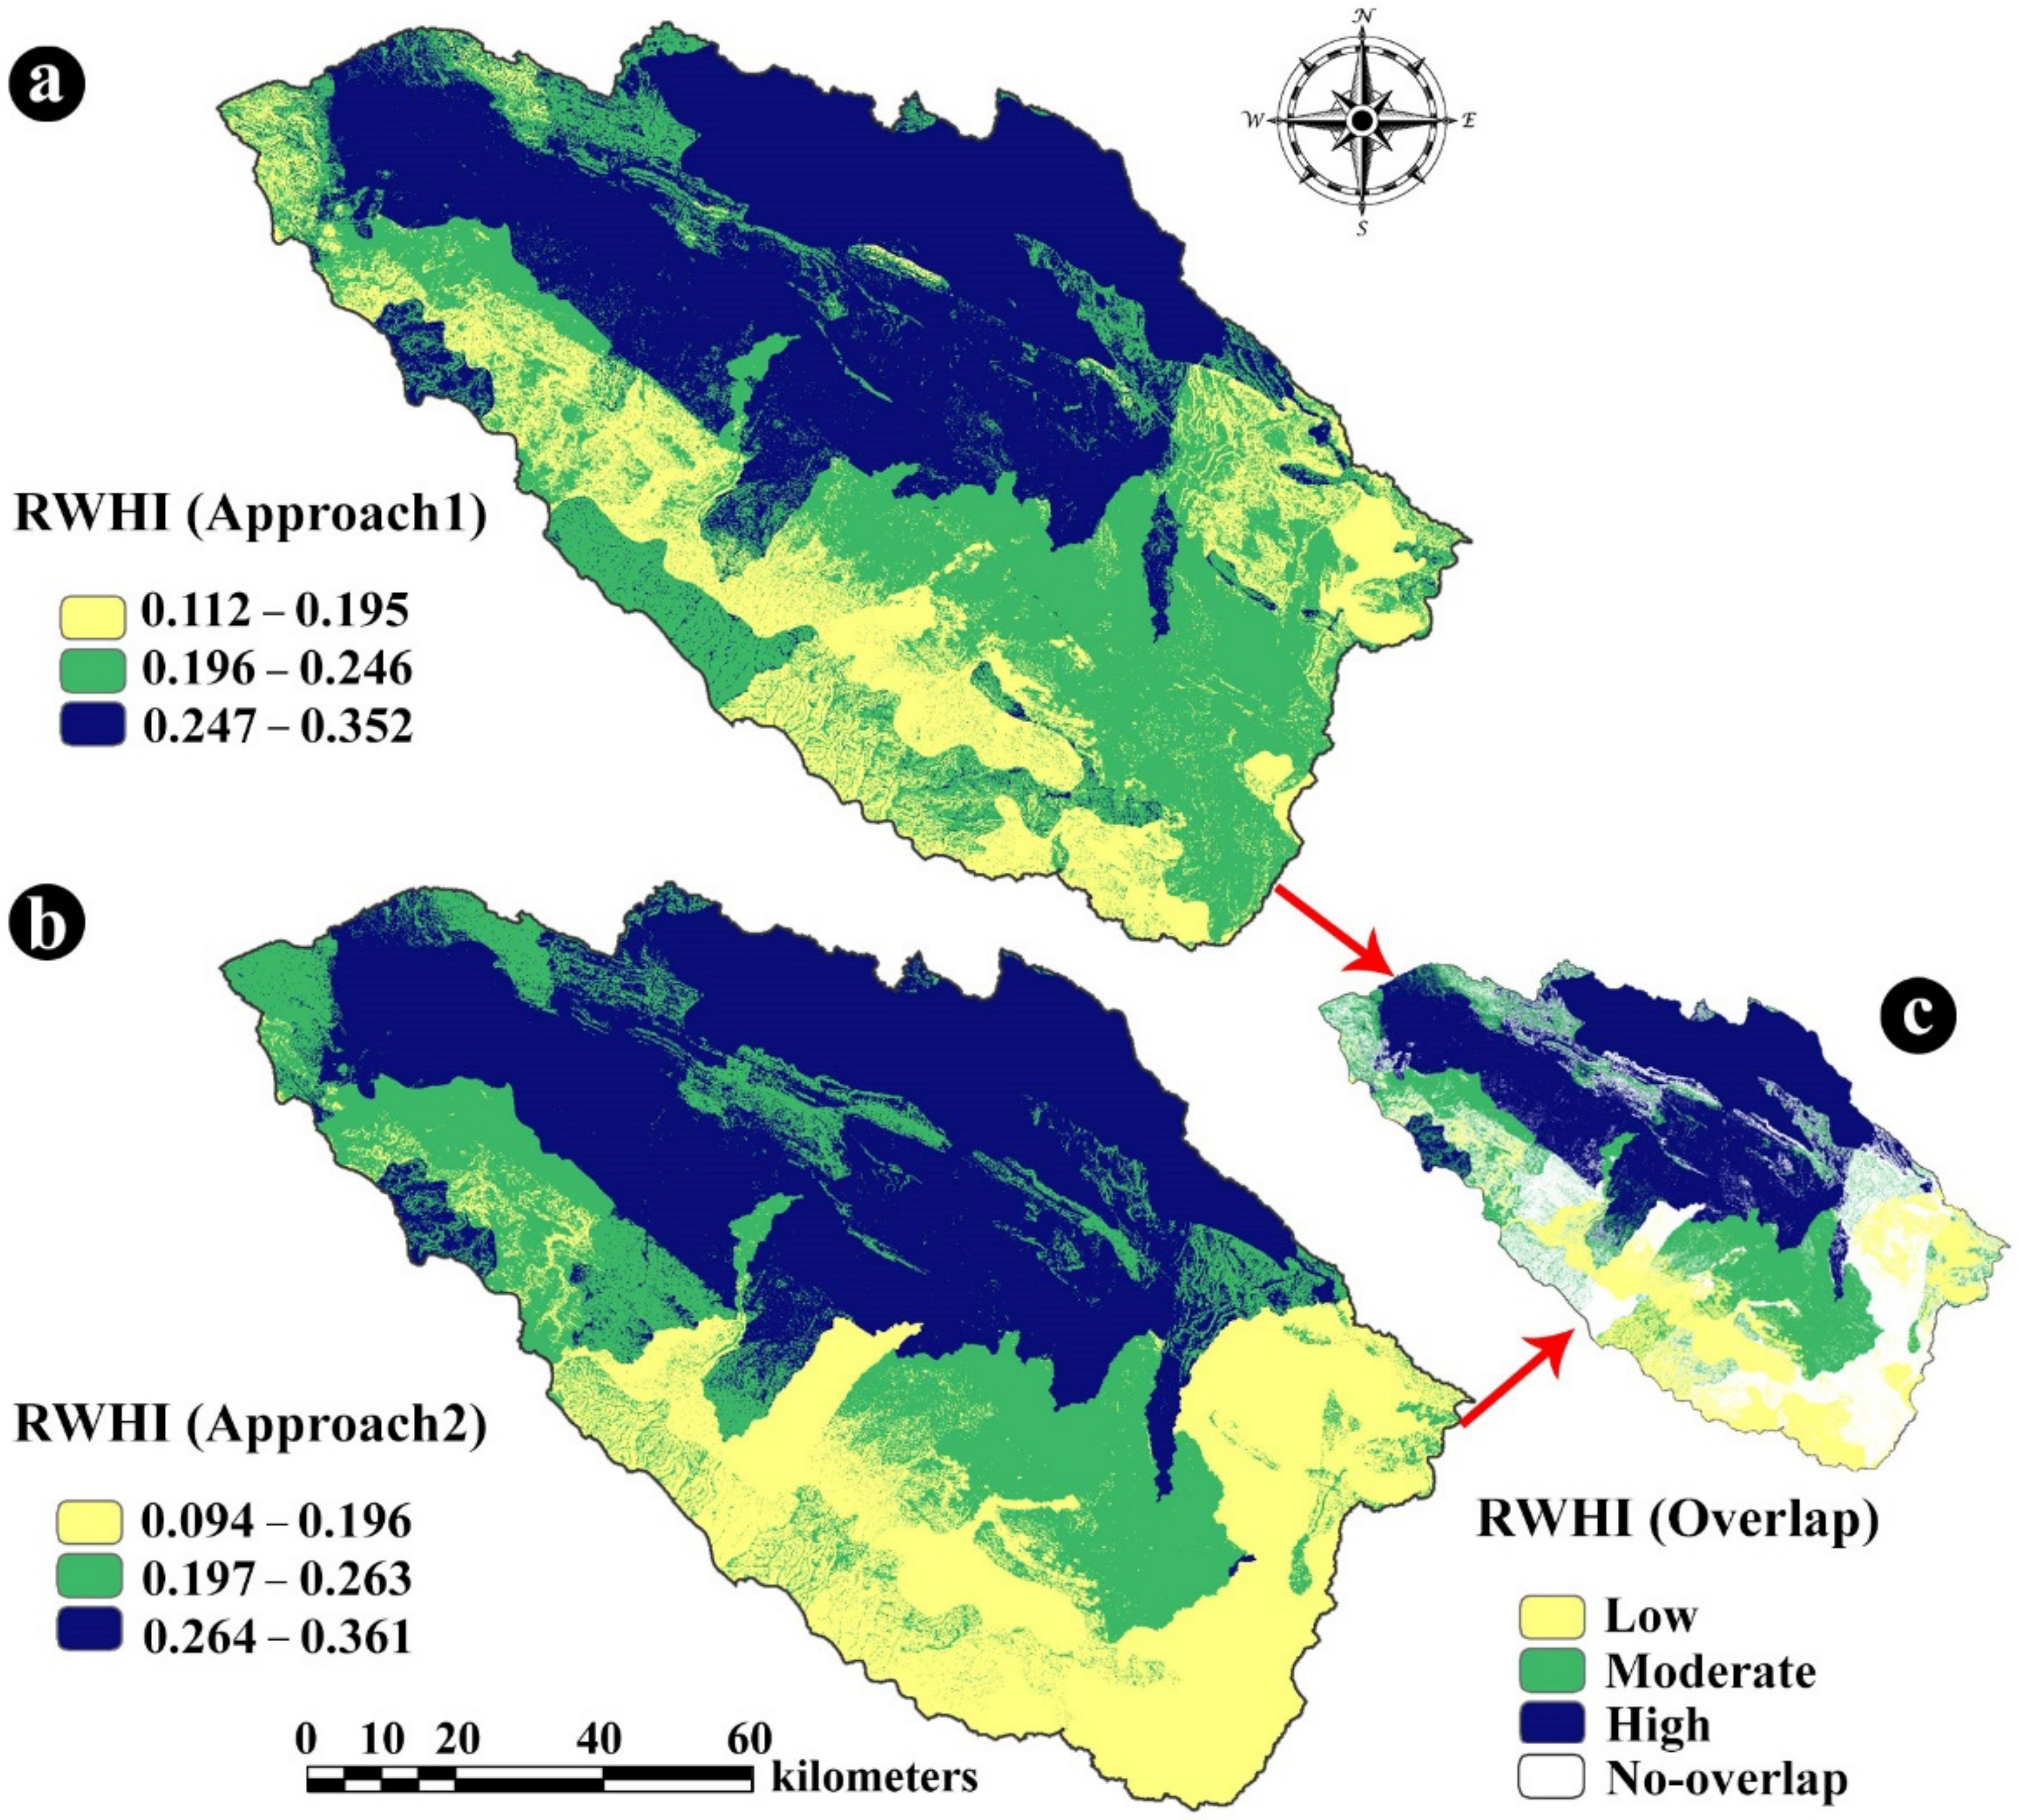
The resultant potential RWH maps of the two approaches indicated a similar pattern for potential RWH areas. In both potential RWH maps, the northern parts of the study area were categorized as the high potential areas, whereas less harvesting potential of rainwater was demonstrated for the southern areas of the case study. In addition, the overlap of the resultant maps of the two approaches indicated that 3394 km2 of the study area is considered a high-potential RWH area. These areas, mainly located in the northern parts of the study area receiving an average annual rainfall of 1366 MCM. Meanwhile, the total capacity of the large dams of Khorasan Razavi Province, where the study area is located, is 1549 MCM. Accordingly, there is high RWH potential in the study area that, if be managed and utilized efficiently, could contribute to water supply and ensure long-term water security.
The high value of the calculated correlation coefficient between the two resultant potential RWH maps (i.e., CC = 0.914), along with provided results, demonstrated that both approaches yield almost identical results. Therefore, it can be stated that the inclusion of SWAT as a hydrological model under the described methodology does not necessarily result in different outputs from conventional MCDA-GIS for RWH evaluation purposes, whereas it demands a higher degree of effort to run the hydrological models. On the other hand, the inclusion of hydrological models can be considered as an efficient strategy to reduce uncertainties embedded in RWH assessment using MCDA. Additionally, there would be less uncertainty associated with the overlapping high-potential RWH areas, since these areas are suggested by a combination of the two approaches, rather than a single conventional MCDA-GIS method.
Moreover, the results of the conducted sensitivity analyses indicate that the rainfall and slope criteria (with weights of 0.329 and 0.243, respectively) have the highest impact on the model in approach 1 whereas the criterion of runoff coefficient (with weights of 0.358) has the highest sensitivity in approach 2. The most-sensitive identified criteria could be ranked as the first priority for future data augmentation to ensure more accurate measurements due to their high weight in the analysis.
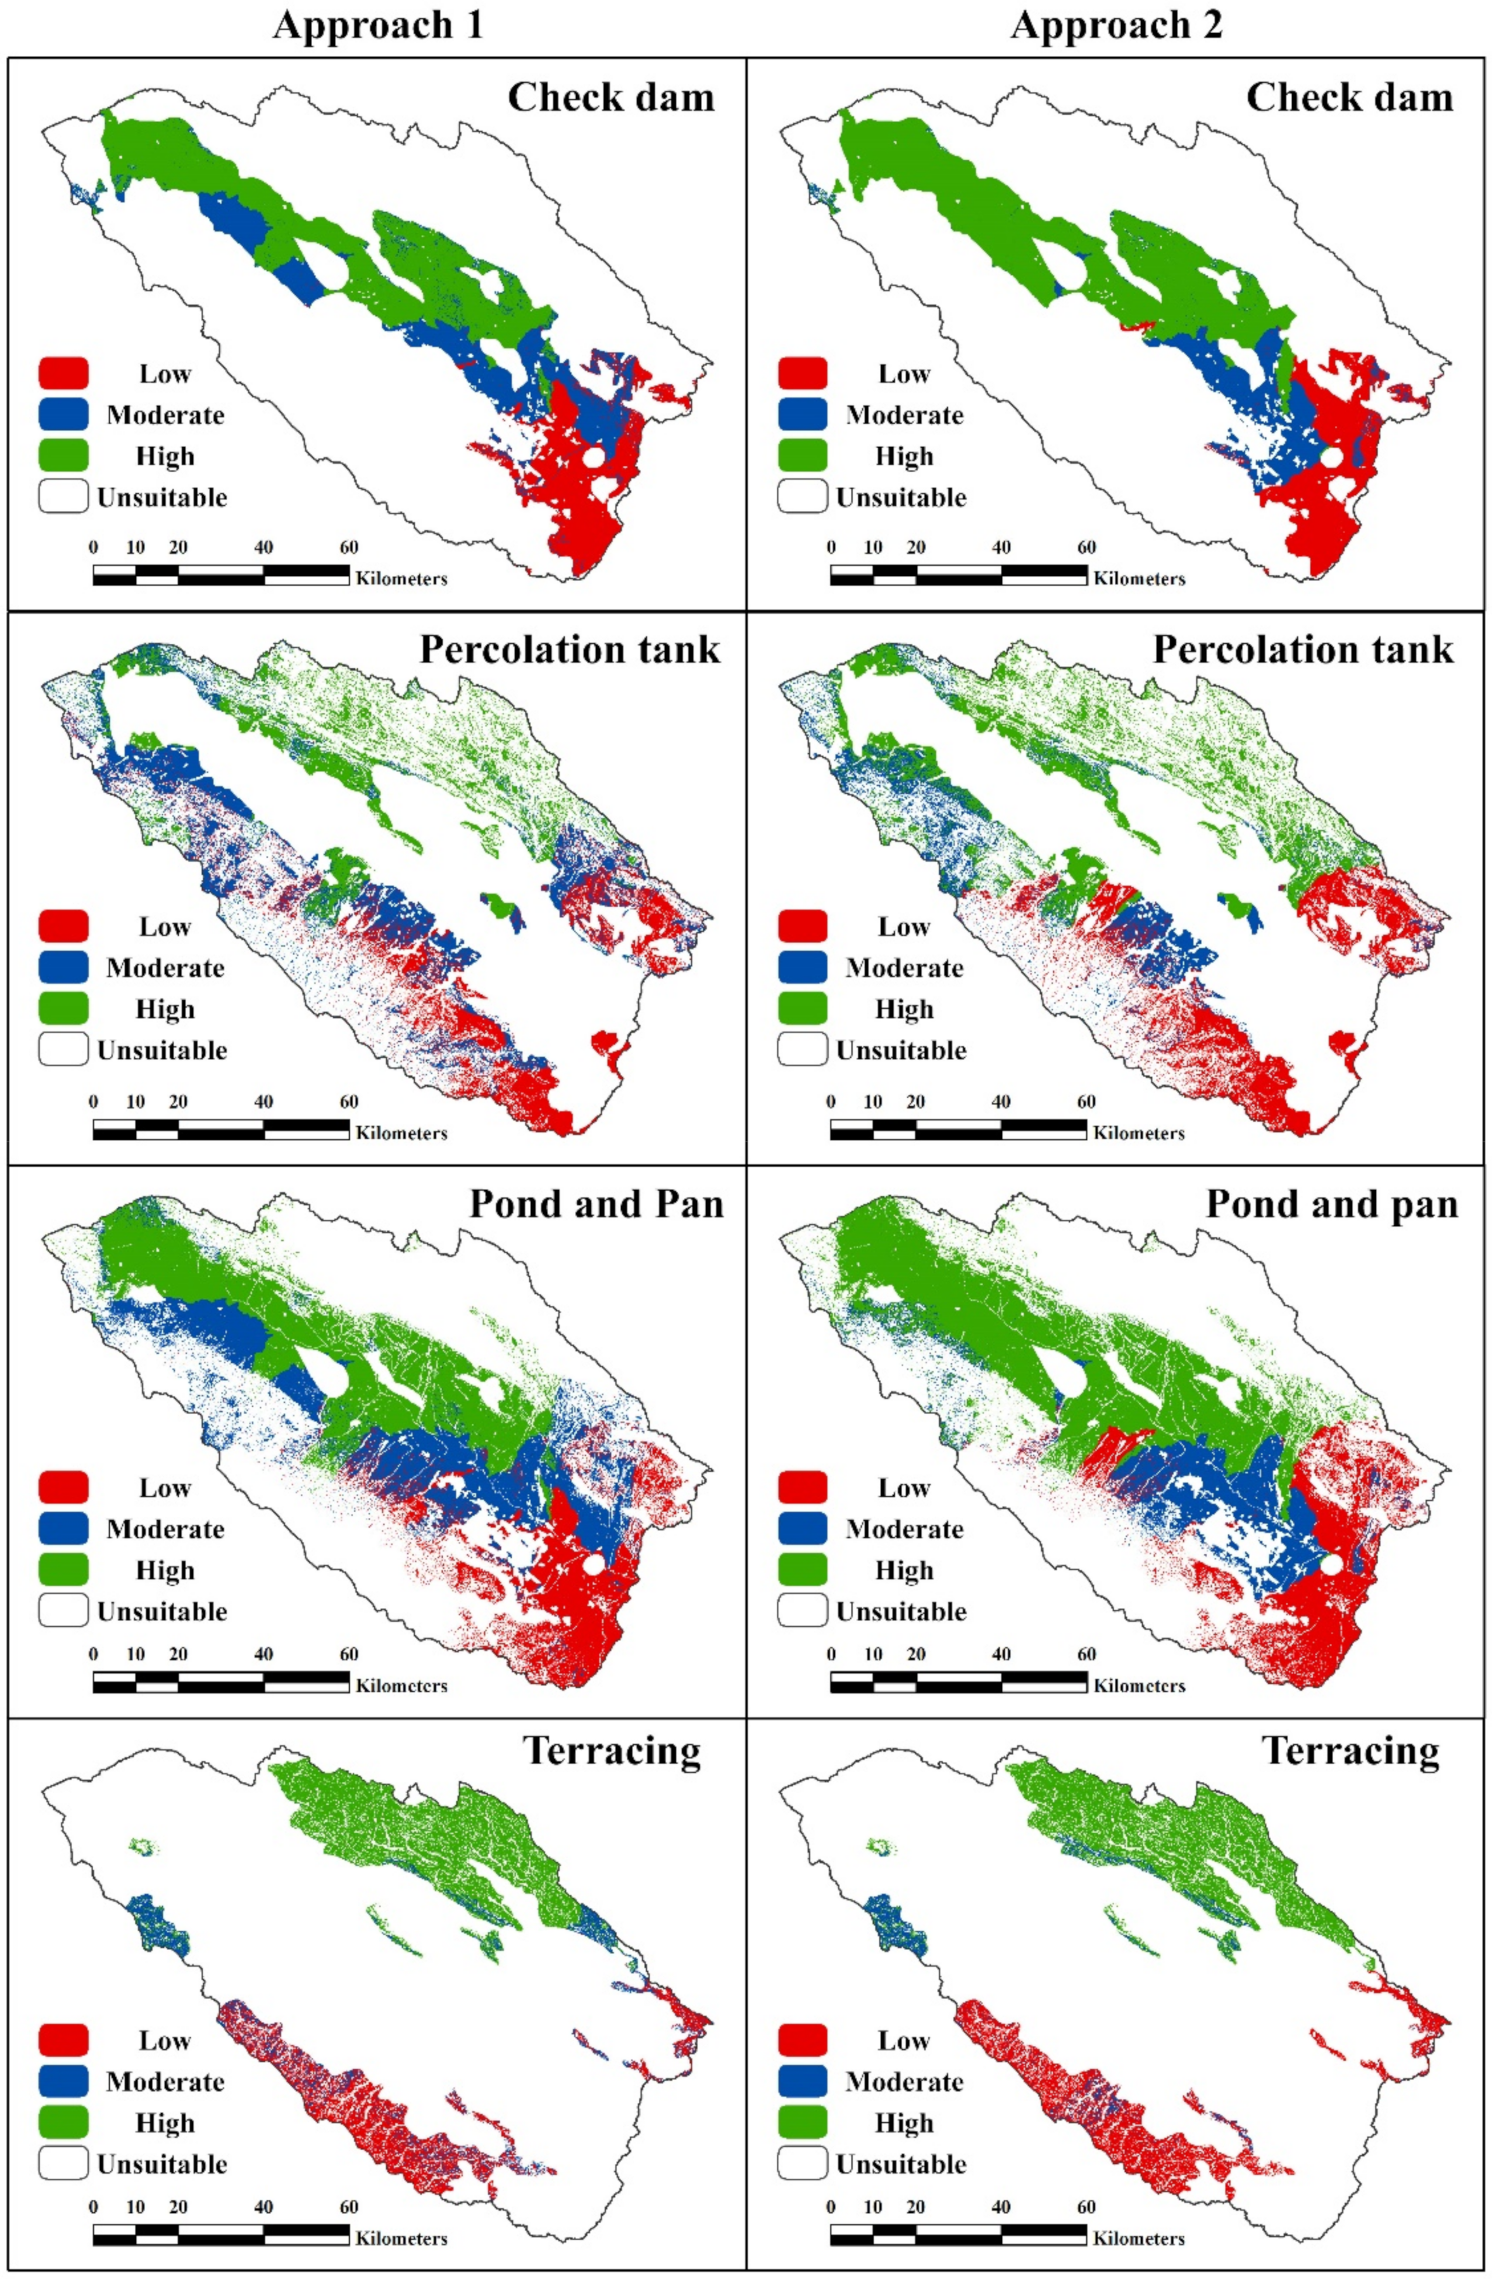
Based on the discussed results, a suitability map of the study area from the perspective of three different techniques was developed using various criteria related to each technique for both approaches 1 and 2, and for both models, with and without sensitivity analyses. Results indicate that the ponds and pans technique is the most suitable option for MPB, covering more areas with a high potential of RWH than the two other techniques for both approaches (21% of the study area on average). After that, terracing and percolation tank cover 11.6% and 10.5% of the study area with high potential for RWH on average, respectively.
It should be noted that the modeling cost, data availability and accuracy, and efficiency of these methods can vary significantly from basin to basin. In more developed countries, data can be obtained with minimal effort and have a high accuracy. On the other hand, the cost of developing a hydrologic model may defeat the purpose of integrating the hydrologic model with the MCDA-GIS approach. The abovementioned cost-benefit analysis is clearly beyond the scope of this project. It is recommended that the above approach be considered in other case studies where the flow of data is readily available and the SWAT model parameters can be calibrated. Therefore, the findings of this research can be compared against those of other areas and the reliability of these results can be further investigated.
Moreover, applying hydrologic models as comprehensive as SWAT are usually demanding in terms of data, time, and effort and their advantages need to justify their application. Meanwhile, since in this study generated maps from two approaches that were highly correlated which may not justify its application. This may be because of the fact that we intended to evaluate the efficiency of the model for areas suffering from data scarcity and, consequently, we did not calibrate the SWAT model. Considering this, we recommend applying this approach for areas with sufficient in situ data in order to calibrate the SWAT model and to assess the results from two approaches to check the justification for using a hydrologic model. It is possible that other hydrologic models result in a different conclusion than those drawn in this research and justify the use of hydrologic models for RWH. It is recommended that a group of different hydrologic models be considered to compare two approaches and further evaluate the use of hydrologic modeling in RWH. Moreover, the comparison between the two approaches might be impacted by the utilized MCDA method. It is recommended that a similar analysis be considered using other MCDA methods, such as ANP, and assess possible impacts. In the end, the identified high-potential RWH areas are based on the initial assessment of this study area. More specific and comprehensive studies are required to consider impacts of other hydrological processes, including evapotranspiration, to estimate the actual harvestable rainwater in these areas and fine-tune the water resources management of MPB.
Results of this research can potentially be helpful for further studies for populated areas in a developing country, such as Iran. While there are many technical issues for implementing RWH techniques in a populated area, such as MPB, it is an inevitable need to help satisfy the ever-increasing demand for domestic water. Consequently, it is well within expectations that this approach, or any other comparable one, be considered for application in the near future.

Author Contributions

Conceptualization, E.G.T.; methodology, E.G.T., S.D., R.A., and B.A.; software, E.G.T., and S.D.; validation, E.G.T., S.D., R.A., B.A., and A.A.; formal analysis, E.G.T., R.A., B.A., and A.G.B.; investigation, E.G.T., R.A., B.A., A.G.B., and A.A.; resources, S.D., E.G.T., R.A., B.A., and A.A.; data curation, S.D., E.G.T., R.A., B.A., and A.G.B.; writing—original draft preparation, E.G.T., R.A., B.A., and A.A.; writing—review and editing, E.G.T., R.A., B.A., A.G.B., and A.A.; visualization, S.D., E.G.T., R.A., B.A., and A.A.; supervision, A.A.; project administration, A.A.; funding acquisition, A.A. All authors have read and agreed to the published version of the manuscript.

Funding

This research received no external funding.

Institutional Review Board Statement

Not Applicable.

Informed Consent Statement

Not Applicable.

Data Availability Statement

Data available on request due to privacy and ethical restrictions.

Acknowledgments

The authors would like to express their sincere gratitude to Amirhossein Shadmehri Toosi who provided insight and expertise that greatly assisted the research.

Conflicts of Interest

The authors declare no conflict of interest.

References

  1. Hafizi Md Lani, N.; Yusop, Z.; Syafiuddin, A. A review of rainwater harvesting in Malaysia: Prospects and challenges. Water 2018, 10, 506. [Google Scholar] [CrossRef] [Green Version]
  2. Musayev, S.; Burgess, E.; Mellor, J. A global performance assessment of rainwater harvesting under climate change. Resour. Conserv. Recycl. 2018, 132, 62–70. [Google Scholar] [CrossRef]
  3. Khorshidi, M.S.; Nikoo, M.R.; Sadegh, M.; Nematollahi, B. A Multi-Objective Risk-Based Game Theoretic Approach to Reservoir Operation Policy in Potential Future Drought Condition. Water Resour. Manag. 2019, 33, 1999–2014. [Google Scholar] [CrossRef]
  4. Adham, A.; Sayl, K.N.; Abed, R.; Abdeladhim, M.A.; Wesseling, J.G.; Riksen, M.; Fleskens, L.; Karim, U.; Ritsema, C.J. A GIS-based approach for identifying potential sites for harvesting rainwater in the Western Desert of Iraq. Int. Soil Water Conserv. Res. 2018, 6, 297–304. [Google Scholar] [CrossRef]
  5. WWAP (United Nations World Water Assessment Programme). The United Nations World Water Development Report 2015: Water for a Sustainable World; UNESCO: Paris, France, 2015. [Google Scholar]
  6. Samadi, F.; Kruzic, A.; Prabakar, S. Effect of Various Inline Injection and Mixing Conditions on Degree of Mixing of Chlorine and Ammonia. In Proceedings of the World Environmental and Water Resources Congress 2018: Water, Wastewater, and Stormwater, Urban Watershed Management, Municipal Water Infrastructure, and Desalination and Water Reuse, Minneapolis, MN, USA, 3–7 June 2018; pp. 159–170. [Google Scholar]
  7. Deb, P.; Kiem, A.S.; Willgoose, G. Mechanisms influencing non-stationarity in rainfall-runoff relationships in southeast Australia. J. Hydrol. 2019, 571, 749–764. [Google Scholar] [CrossRef]
  8. UN Water. Coping with Water Scarcity: Challenge of the Twenty-First Century; UN Water: Geneva, Switzerland, 2007. [Google Scholar]
  9. Alizadeh, B. Improving Post Processing of Ensemble Streamflow Forecast for Short-to-long Ranges: A Multiscale Approach. Ph.D. Dissertation, The University of Texas at Arlington, Arlington, TX, USA, 2019. Available online: http://hdl.handle.net/10106/28663 (accessed on 16 January 2021).
  10. Alipour, M.H.; Kibler, K.M.; Alizadeh, B. Flow alteration by diversion hydropower in tributaries to the Salween river: A comparative analysis of two streamflow prediction methodologies. Int. J. River Basin Manag. 2020, 1–11. [Google Scholar] [CrossRef]
  11. Pandey, D.N.; Gupta, A.K.; Anderson, D.M. Rainwater harvesting as an adaptation to climate change. Curr. Sci. 2003, 85, 46–59. [Google Scholar]
  12. Khorrami, M.; Alizadeh, B.; Ghasemi Tousi, E.; Shakerian, M.; Maghsoudi, Y.; Rahgozar, P. How Groundwater Level Fluctuations and Geotechnical Properties Lead to Asymmetric Subsidence: A PSInSAR Analysis of Land Deformation over a Transit Corridor in the Los Angeles Metropolitan Area. Remote Sens. 2019, 11, 377. [Google Scholar] [CrossRef] [Green Version]
  13. Khorrami, M.; Abrishami, S.; Maghsoudi, Y.; Alizadeh, B.; Perissin, D. Extreme subsidence in a populated city (Mashhad) detected by PSInSAR considering groundwater withdrawal and geotechnical properties. Sci. Rep. 2020, 10. [Google Scholar] [CrossRef]
  14. Aghlmand, R.; Abbasi, A. Application of MODFLOW with Boundary Conditions Analyses Based on Limited Available Observations: A Case Study of Birjand Plain in East Iran. Water 2019, 11, 1904. [Google Scholar] [CrossRef] [Green Version]
  15. Varma, H.; Tiwari, K. Current Status and Prospects of Rainwater Harvesting. Indian National Committee on Hydrology; Report No INCOH/SAR-3/95, INCOH Secretariat; National Institute of Hydrology: Roorkee, India, 1995; p. 47.
  16. Campisano, A.; Butler, D.; Ward, S.; Burns, M.J.; Friedler, E.; DeBusk, K.; Fisher-Jeffes, L.N.; Ghisi, E.; Rahman, A.; Furumai, H. Urban rainwater harvesting systems: Research, implementation and future perspectives. Water Res. 2017, 115, 195–209. [Google Scholar] [CrossRef]
  17. Nikvar Hassani, A.; Farhadian, H.; Katibeh, H. A comparative study on evaluation of steady-state groundwater inflow into a circular shallow tunnel. Tunn. Undergr. Sp. Technol. 2018, 73, 15–25. [Google Scholar] [CrossRef]
  18. Hassani, A.N.; Katibeh, H.; Farhadian, H. Numerical analysis of steady-state groundwater inflow into Tabriz line 2 metro tunnel, northwestern Iran, with special consideration of model dimensions. Bull. Eng. Geol. Environ. 2016, 75, 1617–1627. [Google Scholar] [CrossRef]
  19. Petit-Boix, A.; Devkota, J.; Phillips, R.; Vargas-Parra, M.V.; Josa, A.; Gabarrell, X.; Rieradevall, J.; Apul, D. Life cycle and hydrologic modeling of rainwater harvesting in urban neighborhoods: Implications of urban form and water demand patterns in the US and Spain. Sci. Total Environ. 2018, 621, 434–443. [Google Scholar] [CrossRef]
  20. Kahinda, J.M.; Lillie, E.; Taigbenu, A.; Taute, M.; Boroto, R. Developing suitability maps for rainwater harvesting in South Africa. Phys. Chem. Earth Parts A/B/C 2008, 33, 788–799. [Google Scholar] [CrossRef]
  21. Senay, G.; Verdin, J. Developing index maps of water-harvest potential in Africa. Appl. Eng. Agric. 2004, 20, 789. [Google Scholar] [CrossRef]
  22. Tiwari, K.; Goyal, R.; Sarkar, A. GIS-based methodology for identification of suitable locations for rainwater harvesting structures. Water Resour. Manag. 2018, 32, 1811–1825. [Google Scholar] [CrossRef]
  23. Goyal, R. Rooftop rainwater harvesting: Issues & challenges. Indian Plumb. Today 2014, 125, 148–161. [Google Scholar]
  24. IsIioye, O.A.; Shebe, M.W.; Momoh, U.O.; Bako, C.N. A multi criteria decision support system (MDSS) for identifying rainwater harvesting site(s) in Zaria, Kaduna state, Nigeria. Int. J. Adv. Sci. Eng. Technol. Res. 2012, 1, 53–71. [Google Scholar]
  25. Ammar, A.; Riksen, M.; Ouessar, M.; Ritsema, C. Identification of suitable sites for rainwater harvesting structures in arid and semi-arid regions: A review. Int. Soil Water Conserv. Res. 2016, 4, 108–120. [Google Scholar] [CrossRef] [Green Version]
  26. Melville-Shreeve, P.; Ward, S.; Butler, D. Rainwater harvesting typologies for UK houses: A multi criteria analysis of system configurations. Water 2016, 8, 129. [Google Scholar] [CrossRef] [Green Version]
  27. Jozaghi, A.; Alizadeh, B.; Hatami, M.; Flood, I.; Khorrami, M.; Khodaei, N.; Ghasemi Tousi, E. A Comparative Study of the AHP and TOPSIS Techniques for Dam Site Selection Using GIS: A Case Study of Sistan and Baluchestan Province, Iran. Geosciences 2018, 8, 494. [Google Scholar] [CrossRef] [Green Version]
  28. Shafieardekani, M.; Hatami, M. Forecasting Land Use Change in suburb by using Time series and Spatial Approach; Evidence from Intermediate Cities of Iran. Eur. J. Sci. Res. 2013, 116, 199–208. [Google Scholar]
  29. Jha, M.K.; Chowdary, V.M.; Kulkarni, Y.; Mal, B.C. Rainwater harvesting planning using geospatial techniques and multicriteria decision analysis. Resour. Conserv. Recycl. 2014, 83, 96–111. [Google Scholar] [CrossRef]
  30. Mahmoud, S.H.; Alazba, A. The potential of in situ rainwater harvesting in arid regions: Developing a methodology to identify suitable areas using GIS-based decision support system. Arabian J. Geosci. 2015, 8, 5167–5179. [Google Scholar] [CrossRef]
  31. Al-Adamat, R.; Diabat, A.; Shatnawi, G. Combining GIS with multicriteria decision making for siting water harvesting ponds in Northern Jordan. J. Arid Environ. 2010, 74, 1471–1477. [Google Scholar] [CrossRef]
  32. Mahmoud, W.H.; Elagib, N.A.; Gaese, H.; Heinrich, J. Rainfall conditions and rainwater harvesting potential in the urban area of Khartoum. Resour. Conserv. Recycl. 2014, 91, 89–99. [Google Scholar] [CrossRef]
  33. Saaty, T.L. A scaling method for priorities in hierarchical structures. J. Math. Psychol. 1977, 15, 234–281. [Google Scholar] [CrossRef]
  34. Saaty, T.L. How to make a decision: The analytic hierarchy process. Interfaces 1994, 24, 19–43. [Google Scholar] [CrossRef] [Green Version]
  35. Balkhair, K.S.; Ur Rahman, K. Development and assessment of rainwater harvesting suitability map using analytical hierarchy process, GIS and RS techniques. Geocarto Int. 2019, 36, 421–448. [Google Scholar] [CrossRef]
  36. Wu, R.S.; Molina, G.L.L.; Hussain, F. Optimal sites identification for rainwater harvesting in northeastern Guatemala by analytical hierarchy process. Water Resour. Manag. 2018, 32, 4139–4153. [Google Scholar] [CrossRef] [Green Version]
  37. Krois, J.; Schulte, A. GIS-based multi-criteria evaluation to identify potential sites for soil and water conservation techniques in the Ronquillo watershed, northern Peru. Appl. Geogr. 2014, 51, 131–142. [Google Scholar] [CrossRef]
  38. Jha, M.K.; Peiffer, S. Applications of Remote Sensing and GIS Technologies in Groundwater Hydrology: Past, Present and Future; BayCEER: Bayreuth, Germany, 2006. [Google Scholar]
  39. Weerasinghe, H.; Schneider, U.; Löw, A. Water harvest-and storage-location assessment model using GIS and remote sensing. Hydrol. Earth Syst. Sci. Discuss. 2011, 8, 3353–3381. [Google Scholar] [CrossRef]
  40. Kadam, A.K.; Kale, S.S.; Pande, N.N.; Pawar, N.; Sankhua, R. Identifying potential rainwater harvesting sites of a semi-arid, basaltic region of Western India, using SCS-CN method. Water Resour. Manag. 2012, 26, 2537–2554. [Google Scholar] [CrossRef]
  41. Shadmehri Toosi, A.; Ghasemi Tousi, E.; Ghassemi, S.A.; Cheshomi, A.; Alaghmand, S. A multi-criteria decision analysis approach towards efficient rainwater harvesting. J. Hydrol. 2020, 582, 124501. [Google Scholar] [CrossRef]
  42. Critchley, W.; Siegert, K.; Chapman, C.; Finket, M. Water Harvesting: A Manual for the Design and Construction of Water Harvesting Schemes for Plant Production; Scientific Publishers: Jodhpur, India, 2013. [Google Scholar]
  43. Rallison, R.E. Origin and evolution of the SCS runoff equation. In Proceedings of the Symposium on Watershed Management, Boise, ID, USA, 21–23 July 1980; pp. 912–924. [Google Scholar]
  44. US SCS. National Engineering Handbook, Section 4: Hydrology; US Soil Conservation Service, USDA: Washington, DC, USA, 1985.
  45. Chow, V.T.; Maidment, D.R.; Mays, L.W. Applied Hydrology, 1st ed.; McGraw-Hill: New York, NY, USA, 1988. [Google Scholar]
  46. Sorrell, R.C. Computing Flood Discharges for Small Ungaged Watersheds; Michigan Department of Environment, Great Lakes, and Energy (EGLE): Lansing, MI, USA, 2010. Available online: https://www.michigan.gov/documents/deq/wrd-scs_558239_7.pdf (accessed on 25 September 2020).
  47. Arnold, J.G.; Srinivasan, R.; Muttiah, R.S.; Williams, J.R. Large area hydrologic modeling and assessment part I: Model development. JAWRA J. Am. Water Resour. Assoc. 1998, 34, 73–89. [Google Scholar] [CrossRef]
  48. Shadmehri Toosi, A.; Calbimonte, G.H.; Nouri, H.; Alaghmand, S. River basin-scale flood hazard assessment using a modified multi-criteria decision analysis approach: A case study. J. Hydrol. 2019, 574, 660–671. [Google Scholar] [CrossRef]
  49. Kundu, S.; Khare, D.; Mondal, A. Past, present and future land use changes and their impact on water balance. J. Environ. Manag. 2017, 197, 582–596. [Google Scholar] [CrossRef] [PubMed]
  50. Deb, P.; Kiem, A.S. Evaluation of rainfall–runoff model performance under non-stationary hydroclimatic conditions. Hydrol. Sci. J. 2020, 65, 1667–1684. [Google Scholar] [CrossRef]
  51. Ouessar, M.; Sghaier, M.; Mahdhi, N.; Abdelli, F.; De Graaff, J.; Chaieb, H.; Yahyaoui, H.; Gabriels, D. Assessment. An integrated approach for impact assessment of water harvesting techniques in dry areas: The case of Oued Oum Zessar watershed (Tunisia). Environ. Monit. Assess. 2004, 99, 127–140. [Google Scholar] [CrossRef] [PubMed]
  52. Gary, G. Design of Individual and Community-Scale Rainwater Harvesting Systems for Domestic Water Use in Austin, Texas; Department of Civil, Architectural, and Environmental Engineering, The University of Texas at Austin: Arlington, TX, USA, 2013. [Google Scholar]
  53. IRIMO. Iran Metrological Organization. Available online: https://www.irimo.ir/eng/index.php (accessed on 12 January 2021).
  54. Rahimi, J.; Malekian, A.; Khalili, A. Climate change impacts in Iran: Assessing our current knowledge. Theor. Appl. Climatol. 2019, 135, 545–564. [Google Scholar] [CrossRef]
  55. KHRW. Regional Water Company of Khorasan Razavi. Available online: http://www.khrw.ir (accessed on 2 February 2021).
  56. Karimi, A.; Haghnia, G.H.; Ayoubi, S.; Safari, T. Impacts of geology and land use on magnetic susceptibility and selected heavy metals in surface soils of Mashhad plain, northeastern Iran. J. Appl. Geophys. 2017, 138, 127–134. [Google Scholar] [CrossRef]
  57. Jenks, G.F. The data model concept in statistical mapping. Int. Yearb. Cartogr. 1967, 7, 186–190. [Google Scholar]
  58. Chen, Y.; Yu, J.; Khan, S. The spatial framework for weight sensitivity analysis in AHP-based multi-criteria decision making. Environ. Model. Softw. 2013, 48, 129–140. [Google Scholar] [CrossRef]
  59. Kazakis, N.; Kougias, I.; Patsialis, T. Assessment of flood hazard areas at a regional scale using an index-based approach and Analytical Hierarchy Process: Application in Rhodope–Evros region, Greece. Sci. Total Environ. 2015, 538, 555–563. [Google Scholar] [CrossRef]
  60. Kourgialas, N.N.; Karatzas, G.P. A flood risk decision making approach for Mediterranean tree crops using GIS; climate change effects and flood-tolerant species. Environ. Sci. Policy 2016, 63, 132–142. [Google Scholar] [CrossRef]
  61. Snedecor, G.W.; Cochran, W.G. Statistical Methods; Iowa State University Press: Ames, IA, USA, 1967. [Google Scholar]
  62. Saaty, T.L.; Vargas, L.G. Models, Methods, Concepts & Applications of the Analytic Hierarchy Process, 1st ed.; Springer: New York, NY, USA, 2001. [Google Scholar]
  63. Oikonomidis, D.; Dimogianni, S.; Kazakis, N.; Voudouris, K. A GIS/remote sensing-based methodology for groundwater potentiality assessment in Tirnavos area, Greece. J. Hydrol. 2015, 525, 197–208. [Google Scholar] [CrossRef]
  64. Junior, R.V.; Varandas, S.; Fernandes, L.S.; Pacheco, F.A.L. Environmental land use conflicts: A threat to soil conservation. Land Use Policy 2014, 41, 172–185. [Google Scholar] [CrossRef]
  65. Spiliotis, M.; Skoulikaris, C. A fuzzy AHP-outranking framework for selecting measures of river basin management plans. Desalin. Water Treat 2019, 167, 398–411. [Google Scholar] [CrossRef]
  66. Adham, A.; Wesseling, J.G.; Riksen, M.; Ouessar, M.; Ritsema, C.J. A water harvesting model for optimizing rainwater harvesting in the wadi Oum Zessar watershed, Tunisia. Agric. Water Manag. 2016, 176, 191–202. [Google Scholar] [CrossRef]
  67. Saaty, T.L. The Analytic Hierarchy Process: Planning. Priority Setting. Resource Allocation; MacGraw-Hill: New York, NY, USA, 1980. [Google Scholar]
  68. Munoz-Carpena, R.; Parsons, J.E.; Gilliam, J.W. Modeling hydrology and sediment transport in vegetative filter strips. J. Hydrol. 1999, 214, 111–129. [Google Scholar] [CrossRef]
  69. Napolitano, P.; Fabbri, A.G. Single-parameter sensitivity analysis for aquifer vulnerability assessment using DRASTIC and SINTACS. IAHS Publ.-Ser. Proc. Rep. Int. Assoc. Hydrol. Sci. 1996, 235, 559–566. [Google Scholar]
  70. Bordbar, M.; Neshat, A.; Javadi, S. A new hybrid framework for optimization and modification of groundwater vulnerability in coastal aquifer. Environ. Sci. Pollut. Res. 2019, 26, 21808–21827. [Google Scholar] [CrossRef] [PubMed]
  71. Nazzal, Y.; Howari, F.M.; Iqbal, J.; Ahmed, I.; Orm, N.B.; Yousef, A. Investigating aquifer vulnerability and pollution risk employing modified DRASTIC model and GIS techniques in Liwa area, United Arab Emirates. Groundw. Sustain. Dev. 2019, 8, 567–578. [Google Scholar] [CrossRef]
  72. Box, G.E.; Jenkins, G.M.; Reinsel, G.C. Time Series Analysis: Forecasting and Control; Holden-Day: San Francisco, CA, USA, 1970. [Google Scholar]
  73. Durbude, D.G.; Venkatesh, B. Site suitability analysis for soil and water conservation structures. J. Indian Soc. Remote Sens. 2004, 32, 399–405. [Google Scholar] [CrossRef]
  74. Ramakrishnan, D.; Bandyopadhyay, A.; Kusuma, K. SCS-CN and GIS-based approach for identifying potential water harvesting sites in the Kali Watershed, Mahi River Basin, India. J. Earth Syst. Sci. 2009, 118, 355–368. [Google Scholar] [CrossRef] [Green Version]
  75. Girma, M. Identification of Potential Rainwater Harvesting Areas in the Central Rift Valley of Ethiopia Using a GIS Based Approach. Master’s Thesis, Wageningen University, Wageningen, The Netherlands, 2009. [Google Scholar]
  76. Al-Adamat, R.; AlAyyash, S.; Al-Amoush, H.; Al-Meshan, O.; Rawajfih, Z.; Shdeifat, A.; Al-Harahsheh, A.; Al-Farajat, M. The combination of indigenous knowledge and geo-informatics for water harvesting siting in the Jordanian Badia. J. Geogr. Inf. Syst. 2012, 4, 366–376. [Google Scholar] [CrossRef] [Green Version]
  77. De Winnaar, G.; Jewitt, G.P.W.; Horan, M. A GIS-based approach for identifying potential runoff harvesting sites in the Thukela River basin, South Africa. Phys. Chem. Earth Parts A/B/C 2007, 32, 1058–1067. [Google Scholar] [CrossRef]
  78. Mbilinyi, B.; Tumbo, S.; Mahoo, H.; Mkiramwinyi, F. GIS-based decision support system for identifying potential sites for rainwater harvesting. Phys. Chem. Earth Parts A/B/C 2007, 32, 1074–1081. [Google Scholar] [CrossRef]
  79. Mati, B.; De Bock, T.; Malesu, M.; Khaka, E.; Oduor, A.; Meshack, M.; Oduor, V. Mapping the potential of rainwater harvesting technologies in Africa. A GIS overview on development domains for the continent and ten selected countries. Tech. Man. 2006, 6, 126. [Google Scholar]
  80. Al-Adamat, R. GIS as a decision support system for siting water harvesting ponds in the Basalt Aquifer/NE Jordan. J. Environ. Assess. Policy Manag. 2008, 10, 189–206. [Google Scholar] [CrossRef]
  81. Prinz, D. Water Harvesting—Past and Future. In Sustainability of Irrigated Agriculture; Pereira, L.S., Feddes, R.A., Gilley, J.R., Lesaffre, B., Eds.; Springer: Dordrecht, The Netherlands, 1996; pp. 137–168. [Google Scholar]
  82. Tumbo, S.; Mbillinyi, B.; Mahoo, H.; Mkiramwinyi, F. Determination of Suitability Levels for Important Factors for Identification of Potential Sites for Rainwater Harvesting; Sokoine University of Agriculture: Morogoro, Tanzania, 2016. [Google Scholar]
  83. Hatibu, N.; Mahoo, H.F.; Gowing, J.W.; Kajiru, G.; Lazaro, E.; Mzirai, O.; Rockstrom, J.; Rwehumbiza, F.; Senkondo, E. Rainwater Harvesting for Natural Resources Management: A Planning Guide for Tanzania; Sida’s Regional Land Management Unit: Nairobi, Kenya, 2000.
  84. Jasrotia, A.; Majhi, A.; Singh, S. Water balance approach for rainwater harvesting using remote sensing and GIS techniques, Jammu Himalaya, India. Water Resour. Manag. 2009, 23, 3035–3055. [Google Scholar] [CrossRef]
  85. Selvam, S.; Magesh, N.; Chidambaram, S.; Rajamanickam, M.; Sashikkumar, M.C. A GIS based identification of groundwater recharge potential zones using RS and IF technique: A case study in Ottapidaram taluk, Tuticorin district, Tamil Nadu. Environ. Earth Sci. 2015, 73, 3785–3799. [Google Scholar] [CrossRef]
  86. Adham, A.; Riksen, M.; Ouessar, M.; Ritsema, C.J.W. A methodology to assess and evaluate rainwater harvesting techniques in (semi-) arid regions. Water 2016, 8, 198. [Google Scholar] [CrossRef] [Green Version]
  87. Alaghmand, S.; Beecham, S.; Hassanli, A. Impacts of vegetation cover on surface-groundwater flows and solute interactions in a semi-arid Saline floodplain: A case study of the lower Murray river, Australia. Environ. Process. 2014, 1, 59–71. [Google Scholar] [CrossRef] [Green Version]
  88. NSWRI. National Soil and Water Research Institute of Iran Ministry of Agriculture. Available online: https://www.maj.ir/ (accessed on 18 March 2020).
  89. Bathrellos, G.D.; Skilodimou, H.D.; Chousianitis, K.; Youssef, A.M.; Pradhan, B. Suitability estimation for urban development using multi-hazard assessment map. Sci. Total Environ. 2017, 575, 119–134. [Google Scholar] [CrossRef] [PubMed]
  90. FAO. Guidelines for Soil Description, 3rd ed.; Food and Agriculture Organization of United Nations: Rome, Italy, 1990. [Google Scholar]
  91. Steenhuis, T.S.; Winchell, M.; Rossing, J.; Zollweg, J.A.; Walter, M.F. SCS runoff equation revisited for variable-source runoff areas. J. Irrig. Drain. Eng. 1995, 121, 234–238. [Google Scholar] [CrossRef]
  92. Fernández, D.; Lutz, M. Urban flood hazard zoning in Tucumán Province, Argentina, using GIS and multicriteria decision analysis. Eng. Geol. 2010, 111, 90–98. [Google Scholar] [CrossRef]
  93. Chang, N.-B.; Parvathinathan, G.; Breeden, J.B. Combining GIS with fuzzy multicriteria decision-making for landfill siting in a fast-growing urban region. J. Environ. Manag. 2008, 87, 139–153. [Google Scholar] [CrossRef]
Figure 1. Conceptual methodology framework used in this research.
Water 13 01935 g001
Figure 2. Mashhad Plain Basin in Northeastern Iran.
Water 13 01935 g002
Figure 3. Layers and corresponding feature classes. (a) Runoff coefficient, (b) rainfall, (c) slope, (d) soil type, (e) soil depth, and (f) land use.
Water 13 01935 g003
Figure 4. RWH potential map of the study area for the first and second approaches and for the overlap of the two approaches.
Water 13 01935 g004
Figure 5. Potential RWH map of the study area for the first and second approaches after sensitivity analyses.
Water 13 01935 g005
Figure 6. Suitable areas for various RWH techniques, as obtained from the two approaches.
Water 13 01935 g006
Table 1. The criteria used in RWHPI.
Thematic LayerAbbreviation1st Approach2nd Approach
Runoff CoefficientRC-
Soil TypeST
SlopeS
RainfallR
Land UseLU-
Soil DepthSD-
Table 2. The common techniques and criteria used for RWH site selection in ASARs.
RWH Techniques Rainfall (mm)Slope%Soil TypeLand Use/CoverReference
Pond and Pan>200<5Silty loam, sandy clay loamPlanting forests, low-density pasture, semi-dense pasture, woodland and scrubland, high-density pasture, irrigated cropland and pasture, dry farming[24,31,73,74,75,76]
Terracing200–10005–30Clay loam, sandy clay, sandy loamSemi-dense forest, low-density pasture, woodland and scrubland, planting forests, dry farming, semi-dense pasture, rock protrusions, high-density pasture[37,77,78]
Percolation tank<1000<10Clay loam, silt loamSemi-dense pasture, woodland and scrubland, low-density pasture, rock protrusions, high-density pasture, dry farming[74,76,79]
Table 3. Weights of the thematic layers (criteria) and their features (sub-criteria).
Thematic LayerFeature ClassAssigned ScoreLayers Relative Weights
Approach 1Approach 2
Runoff Coefficient0.031–0.0412-0.387
0.042–0.0584
0.059–0.0876
0.088–0.128
0.13–0.189
Rainfall (mm/year)161–20220.3800.275
203–2724
273–3316
332–3958
396–4669
Slope (%)0–590.2340.198
5–108
10–157
15–305
>303
Soil TypeSilt loam or loam50.1790.140
Sandy clay loam7
Clay loam or clay9
Soil depthWater bodies90.107-
Very shallow8
Shallow7
Relatively deep5
Deep3
Land useSemi-dense forest20.100-
Woodland and scrubland3
Planting forests4
Scatter forest5
Dry farming, irrigated cropland6
High density pasture7
Low and semi-dense pasture8
Urban and built-up land, water bodies9
Table 4. Three classes of potential RWH using two approaches.
RWH Potential ClassesApproach 1Approach 2Percentage of Overlap of the Two Approaches (%)
The Portion of Study Area (%)The Portion of Study Area (%)
Low29.93432.9
Moderate24.330.519.1
High45.835.548.0
Table 5. Statistics of the effective weights from sensitivity analysis.
Approach 1
ParameterInitial Weight (W), (AHP)Min (Wi)Max (Wi)Mean (μ)SD (σ)
Rainfall0.3800.1050.6390.3290.126
Slope 0.2340.0300.4750.2430.126
Soil Type0.1790.1340.5650.2650.083
Soil Depth0.1070.0330.2610.0880.035
Land Use0.1000.0140.1970.0750.023
Approach 2
ParameterInitial Weight (W), (AHP)Min (Wi)Max (Wi)Mean (μ)SD (σ)
Runoff Coefficient0.3870.1330.5800.3580.100
Rainfall0.2750.0710.4410.2260.073
Slope 0.1980.0230.4730.2070.119
Soil Type0.1400.0990.5550.2090.087
Table 6. Three classes of potential RWH in the two approaches after sensitivity analysis.
RWH Potential ClassesApproach 1Approach 2Percentage of Overlap of the Two Approaches (%)
The Portion of Study Area (%)The Portion of Study Area (%)
Low21.930.322.1
Moderate28.428.227.8
High39.741.450.1
Table 7. The total potential area of the various RWH techniques in the study area as percentages.
RWH Techniques ClassApproach 1Approach 2
Without Sensitivity Analysis With Sensitivity AnalysisWithout Sensitivity AnalysisWith Sensitivity Analysis
TerracingPoor5.72.26.86.1
Moderate3.35.61.92.2
Very Good11.112.311.311.8
Total20.020.020.020.0
Percolation TankPoor8.97.49.89.5
Moderate11.812.87.110.4
Very Good9.29.713.110.0
Total29.929.929.929.9
Pond and PanPoor10.34.010.710.9
Moderate15.319.39.111.4
Very Good18.220.524.021.4
Total43.743.743.743.7
Publisher’s Note: MDPI stays neutral with regard to jurisdictional claims in published maps and institutional affiliations.

