Article

Changing Land Use and Population Density Are Degrading Water Quality in the Lower Mekong Basin

1
Global Water Center, Department of Biology, University of Nevada, 1664 N. Virginia Street, Reno, NV 89557, USA
2
Department of Natural Resources and Environmental Science, University of Nevada, Reno, NV 89557, USA
3
Department of Watershed Sciences, Utah State University, Logan, UT 84322, USA
4
W.A. Franke College of Forestry and Conservation, University of Montana, Missoula, MT 59812, USA
5
Inland Fisheries Research and Development Institute, Fisheries Administration, No. 186, Preah Norodom Blvd., Phnom Penh 12300, Cambodia
6
Centre for Biodiversity Conservation, Royal University of Phnom Penh, Russian Boulevard, Phnom Penh 12000, Cambodia
*
Author to whom correspondence should be addressed.
Water 2021, 13(14), 1948; https://doi.org/10.3390/w13141948
Submission received: 6 May 2021 / Revised: 5 July 2021 / Accepted: 7 July 2021 / Published: 15 July 2021

Abstract

:
Establishing reference conditions in rivers is important to understand environmental change and protect ecosystem integrity. Ranked third globally for fish biodiversity, the Mekong River has the world’s largest inland fishery providing livelihoods, food security, and protein to the local population. It is therefore of paramount importance to maintain the water quality and biotic integrity of this ecosystem. We analyzed land use impacts on water quality constituents (TSS, TN, TP, DO, NO3, NH4+, PO43−) in the Lower Mekong Basin. We then used a best-model regression approach with anthropogenic land-use as independent variables and water quality parameters as the dependent variables, to define reference conditions in the absence of human activities (corresponding to the intercept value). From 2000–2017, the population and the percentage of crop, rice, and plantation land cover increased, while there was a decrease in upland forest and flooded forest. Agriculture, urbanization, and population density were associated with decreasing water quality health in the Lower Mekong Basin. In several sites, Thailand and Laos had higher TN, NO3, and NH4+ concentrations compared to reference conditions, while Cambodia had higher TP values than reference conditions, showing water quality degradation. TSS was higher than reference conditions in the dry season in Cambodia, but was lower than reference values in the wet season in Thailand and Laos. This study shows how deforestation from agriculture conversion and increasing urbanization pressure causes water quality decline in the Lower Mekong Basin, and provides a first characterization of reference water quality conditions for the Lower Mekong River and its tributaries.

1. Introduction

Water quality is becoming degraded worldwide [1] due to increasing sediment loads and nutrient concentrations of nitrogen and phosphorus into rivers and downstream coastal areas [2]. Rivers provide a wide range of ecosystem services [3] which are particularly valuable in tropical developing countries where the livelihoods depend directly on freshwater resources [4]. In Southeast Asia’s Mekong Basin, food security and economic well-being of nearly 70 million people depend on about 2.3 million tonnes of fish caught from the Mekong Basin annually. Fish production in this region represents around 20% of worldwide inland fisheries production [5]. In addition to its economic importance, the Mekong River Basin is also a hotspot for biodiversity and is home to critically endangered mega-fish species [6]. Despite its ecological and economic importance, the Mekong Basin is experiencing high rates of environmental degradation from multiple causes such as deforestation, rapid population growth, agricultural development, fish overharvest, and dam development [7,8,9,10].
Drivers of land use change vary between countries in the lower Mekong Basin, but in the last 30 years deforestation has increased in Cambodia, Laos, Thailand, and Vietnam [11]. Of these countries, Cambodia has the most forested land, but is experiencing particularly high deforestation rates, with 19% of tropical forest, 31% of the floodplain, and 18% of upland forest converted to other uses from 1993 to 2017 [9]. In addition to forest loss, the use of fertilizers for agriculture, and in particular rice production, has increased [12]. Water quality that was considered “moderate” or “good” by the Mekong River Commission in the past [13] has now been degraded [14,15], primarily in Mekong tributaries [14]. The degradation of water quality in the Mekong River has become a concern because of its importance for drinking, domestic uses, and agriculture, so water degradation could harm human, animal, and ecosystem health [16]. While some studies on water quality in the Lower Mekong have noted a decline of water quality [14,15,16], we found only one study that assessed the effects of land use change on total suspended solids (TSS) and dissolved inorganic nitrogen (NO3) [17]. A comprehensive study that assesses the effects of land use change on multiple water quality parameters in the Lower Mekong Basin is needed to provide reference conditions for water quality, including nutrients, dissolved oxygen, and total suspended solids, which are key parameters for driving ecosystem productivity.
Defining reference conditions can improve our understanding of how riverine systems may respond to global environmental changes and inform management strategies to preserve water quality and ecological integrity of rivers. Reference nutrient concentrations are less known and studied than physical habitats in river systems [18]; this information is available for temperate areas of the United States [19] and Europe [20,21], but typically is unavailable for tropical areas, limiting the understanding of riverine nutrient dynamics and trophic ecology. Although some studies have been carried out defining baseline nutrient concentrations in rivers and streams of tropical regions in Brazil [22,23], to our knowledge this information is unavailable for tropical rivers of Southeast Asia.
In this study, our objectives were to (1) identify parameters that should be monitored to define water quality, and (2) use long-term land use and water quality data to define reference conditions for the Lower Mekong Basin. We used multiple regression models to estimate relationships between anthropogenic land uses and water quality parameters, then the models were used to define reference nutrient concentrations expected in the absence of anthropogenic land use. This research is needed to determine reference water quality values for the Lower Mekong River basin that can support management practices and increase the understanding of tropical aquatic systems.

2. Materials and Methods
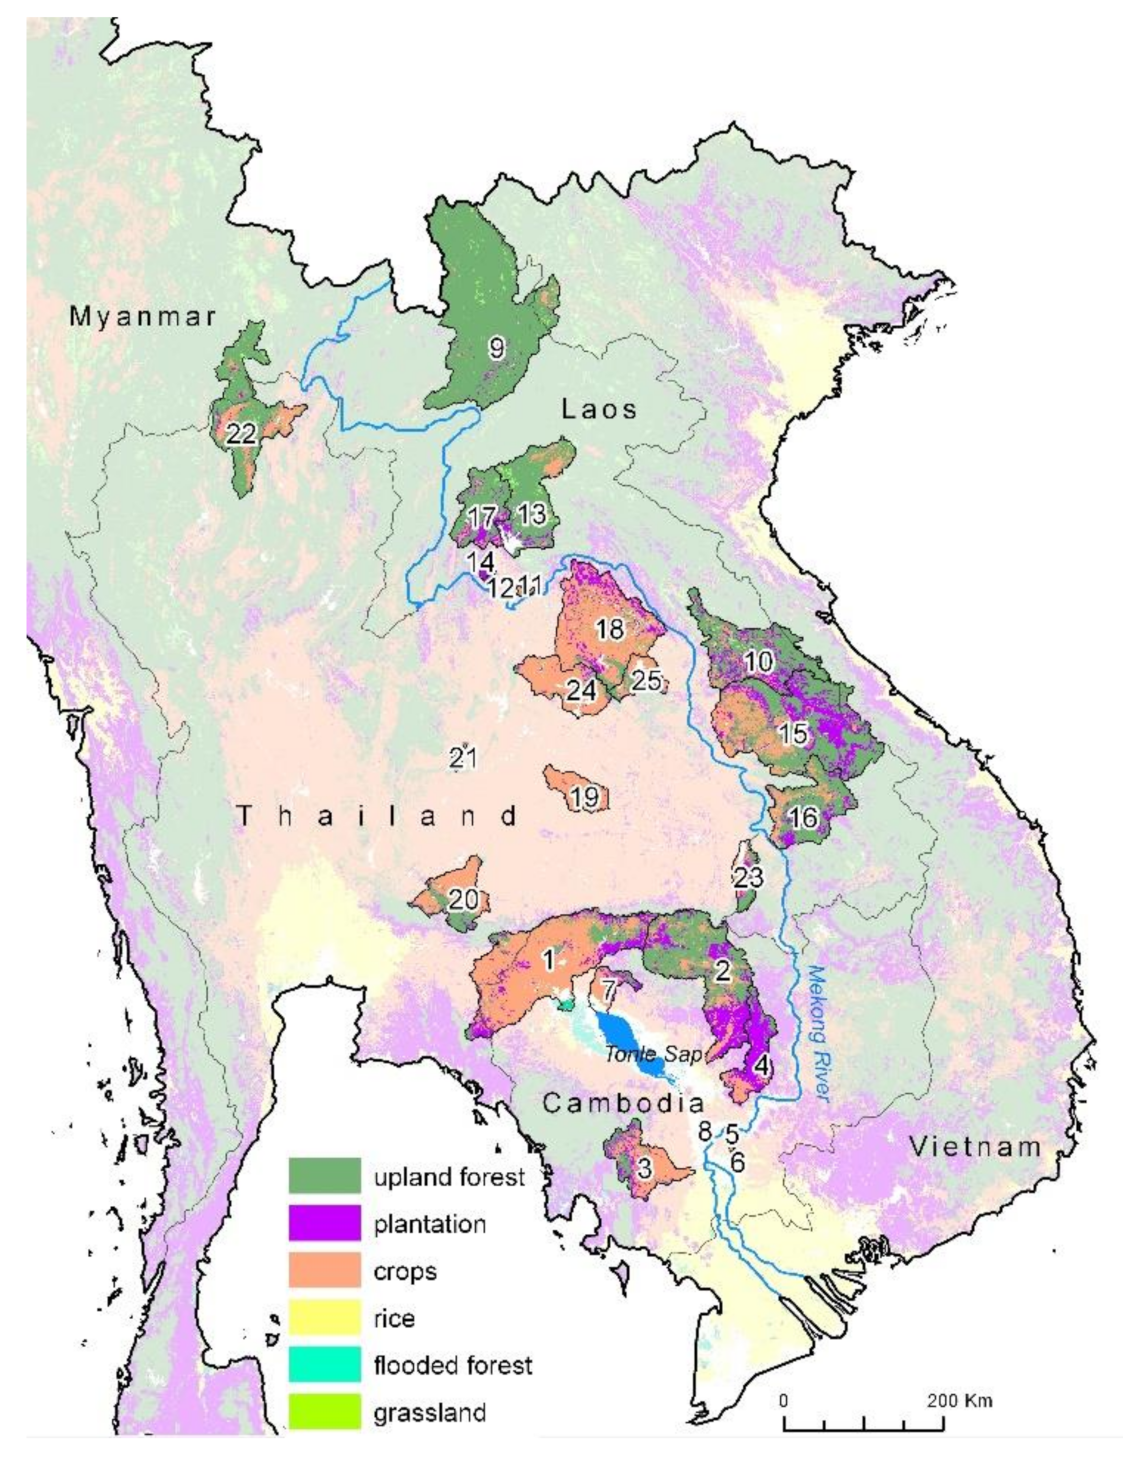
2.1. Study Area

The Mekong River is one of the most important rivers of the world. It is the 12th longest in the world and the 3rd longest in Asia, and the second most biodiverse river of the world [24]. In this study, we focus on the Lower Mekong Basin located in Southeast Asia, which includes the countries of Laos, Cambodia, Thailand, and Vietnam (Figure 1). However, not enough data were available for Vietnam, so we could not include it in the analyses. The climate of the Lower Mekong Basin is tropical, with a dry season from December to May and a wet season from June to November.
Most forested areas are in Laos and Cambodia, although high rates of deforestation have recently occurred [9]. Lowland areas are dominated by rice cultivation [17]. Most people live in urban areas, with lower population densities in agricultural areas. The main cities are located along the mainstream of the Mekong River, and 40% of the population live along the riverbank [25].
Since 2010, dam development has increased substantially in the Lower Mekong Basin. In Cambodia, most sites we selected were undammed (Neak Luong, Backprea, PhnomKrom, Tonle Sap, and the Mekong mainstream). In Laos, SeBangFai, BenKengDone, and HouayMakiHiao were undammed, but all others were located near dams. In Thailand, only BanSom was undammed, and all other sampling stations were located either upstream or downstream of dams (for the full sites list see next section and Supplementary Material 1 and 2).

2.2. Data Collection

We analyzed water quality data available from the Water Quality Monitoring Network and the Fisheries Program of the Mekong River Commission (MRC). Stations were spread throughout the lower Mekong Basin, with nine stations in Laos, eight in Cambodia, and eight in Thailand (Figure 1). In Cambodia, the selected stations were Backprea (1), Kampong Thom (2), Kampong Toul (3), Kampong Thmar (4), Mekong (5), Neak Luong (6), Phnom Krom (7), and Tonle Sap (8). In Laos, the selected stations were Ban Hat Kham (9), Ban Keng Done (10), Houay Mak Hiao (11), Nam Houm Dam (12), Nam Ngum (13), Nam Souang (14), Se Bang Fai (15), Sedone Bridge (16), Thaleth Keokou (17). In Thailand, the selected stations were Ban Chai Buri (18), Ban Ku Phra Kona (19), Ban Som (20), Bad Tan Ton (21), Chiang Rai (22), Lam Dom Noi (23), Lam Pao Dam Site (24), Nam Kae (25), (Figure 1). These stations were selected because their watersheds were non-overlapping. We also selected one watershed for the entire Tonle Sap Basin and one watershed encompassing the Mekong River upstream of Phnom Penh (Figure 1). The non-overlapping watersheds were used in regression analyses to establish land use effects on water quality parameters and reference values (see next sessions). We report the Mekong and the Tonle Sap watersheds only for the assessment of land use changes trough time, and for a characterization of water quality parameters in relation to reference values.
Water quality collections included nutrients (nitrogen and phosphorus chemical constituents), total suspended solids, and dissolved oxygen, and were conducted by the MRC in partnership with each member country by collecting grab water samples between the 13th and 18th day of each month (MRC, 2015). We selected data available from the year 2000 to 2017 to match available land use data. Mean concentration of the water quality parameters were measured for the dry season (December to May) and rainy season (June to November) of each year. The final dataset included between 100 and 297 observations for each water quality parameter.
Water quality analyses were completed following the Standard Methods [26] or the national standards, complying with the requirements of method validation of ISO/IEC 17025-2005. Total suspended solids (TSS) were measured using a 0.45 µm pore size glass fiber filter following the standard method. Dissolved inorganic nitrogen (NO3) was analyzed by using the 4500- NO3 standard method, (minimum detection limit of 0.001 mg/L). Ammonium (NH4+) was measured following the 4500- NH4+-standard method (minimum detection limit of 0.002 mg/L). Phosphorus (PO43−) and total phosphorus (TP) concentrations were measured using the stannous chloride method (minimum detection limit of 0.003 mg/L). Dissolved oxygen (DO mg/L) was measured by a calibrated oxygen probe.

2.3. Watershed Delineation and Land Use Characterization

For each water quality sampling station, we delineated upstream watersheds using a global 90-m resolution Digital Elevation Model (DEM) [27]. We used ArcGIS 10.6 Spatial Analyst hydrology tools [28] to perform standard hydrological image pre-processing steps prior to watershed delineation [29]. These included filling pits, calculating flow direction within an eight-cell neighborhood, and calculating flow accumulation. We then used the ArcGIS 10.6 Watershed Tool in Spatial Analyst to delineate all upslope cells in the watershed.
For each watershed we calculated the proportion of land cover categories (crop, rice, flooded forest, upland forest, grassland, plantation, urban) and population density (number of people per km2) from 2000 to 2017 using an annual timestep. Crop refers to all non-plantation crops excluding rice, and includes cassava, mangoes, maize, sweet potatoes, groundnuts, soybeans, sesame seeds, dry beans, and pepper. Total forest and flooded forest cover were calculated using annual-resolution forest cover from [9], which were temporally smoothed using a median filter to ensure realistic changes from one year to the next. We used percentage of forest and flooded forest only to analyze their trends during time, but those percentages were not used in the reference conditions estimation, where we only included anthropogenic land uses (see next section for reference conditions estimation). The additional land cover types were downloaded from the Regional Land Cover Monitoring System [30]. Fully urbanized land cover types were rare in this study area. Therefore, we used the Gridded Population of the World dataset version 4 [31], which provided gridded population estimates at 1 km resolution for five-year increments (2000, 2005, 2010, 2015, 2020). For the intervening years, we estimated the population by linearly interpolating between the five-year start and endpoints.
For each of the six watersheds, we mapped the proportion of each land cover type within the watershed at an annual-resolution from 2000 to 2017, except for the gridded population data which was mapped as a population count in 1-km grid cells. In addition to calculating land cover changes through time within each watershed, we also determined whether dams were present in each watershed. We first overlaid the Global Reservoir and Dam (GRanD) v1.01 [32] to determine the presence of large dams. Due to the lack of data on smaller dams and to ensure timeliness of the data, we used the Esri World Imagery [33] and searched every watershed to determine whether dams were present. If dams were present on the mainstem of the river in which water quality samples were collected, we categorized the watershed as “dammed”, regardless of dam size.

2.4. Statistical Analyses

We correlated the percentage of land use in each category with water quality parameters (TSS, TN, TP, DO, NO3, NH4+, PO43−). To define reference values for water quality parameters in the absence of anthropogenic activity, we developed multiple regression models and used stepwise variable selection to relate water quality parameters to the percentage of anthropogenic land use categories (crop, rice, grassland, plantation, urban) and population density, in the twenty-three non overlapping (independent) watersheds. Then, we identified the intercept value where anthropogenic activity equals zero and confidence intervals around the estimates to define reference values in the absence of anthropogenic influence. We ran separate models for the wet and dry seasons. Water quality data were log transformed to be normally distributed for parametric tests. This is the best-model regression approach used by [19] in temperate regions and by [23] in the tropics. Finally, we assessed nutrient limitation using mean nutrient concentration values and the Redfield ratio, commonly used to express nutrient limitation [34], where a N:P ration below 7:1 by mass considered nitrogen limited and above phosphorus limited [35]).

3. Results

Land use changed from 2000 to 2017 in the 30 watersheds that we analyzed for this study (Figure 1). In general, urban population and the percentage of crop, rice, and plantations increased, while upland forest and flooded forest decreased (Figure 2).
We found that TSS was positively correlated to population and flooded forest, while negatively correlated to grassland and upland forest. TN was positively correlated to population and crop, and negatively correlated to upland forest, rice, and grassland. TP was positively correlated to population, flooded forest, and crop, and was negatively correlated to upland forest. DO was positively correlated to upland forest and negatively correlated to population, flooded forest, and crop. NO3 was positively correlated to population and crop and negatively correlated to upland forest and rice. NH4+ was positively correlated with population and crop and negatively correlated to upland forest and grassland. We found no significant correlation for PO43− (Supplementary Material 3 and 4).
Table 1 and Table 2 report best multiple regression models with anthropogenic land uses and population density, for the dry and wet season respectively, from which we estimated reference water quality parameters reported in Table 3.
Either urban percentage or population density appeared in all models indicating how urbanization and population density are important drivers of nutrient concentration increases.
Figure 3 and Figure 4 report reference values (horizontal lines in the figure) for TSS, TN, TP, and DO for the dry and wet season for all study watersheds. They also show mean and median baseline water quality parameters from 2000 to 2017. In the dry season (Figure 3), TSS was higher than reference conditions in Cambodia and close to reference in Laos and Thailand, with two sites below reference conditions in Laos (Nam Houm Dam and Nam Ngum) and one site below reference in Thailand (Ban Chai Buri). In the wet season (Figure 4), TSS values were close to reference in Cambodia, but they were lower than reference at four sites in Laos (Houay Mak Hiao, Nam Houm Dam, Nam Ngum, Nam Souang) and in all sites in Thailand except for Chiang Rai.
TN concentrations were higher than the reference value in three sites in Cambodia, but only in the dry season, and were on the reference range in the wet season. In Laos, median values show that TN was higher than reference, in all sites, particularly at Houay Mak Hiao, Nam Houm Dam, and Se Bang Fai in the dry season. In Thailand, TN concentrations were higher than reference values in Ban Som and Ban Ku Phra Kona for both dry and wet seasons. Some sites in all three countries had higher TP concentrations compared to reference values (especially Backprea, Phnom Krom, and Tonle Sap in Cambodia, Houay Mak Hiao and Nam Ngum in Laos, and Ban Som and Chiang Rai in Thailand) and Cambodia had only one site near reference TP concentrations (Kampon Toul). Laos and Thailand had more sites in the range of reference values for TP. DO was close to reference values at all sites in the dry and wet seasons except for Houay Mak Hiao and Nam Ngum in Laos.
Figure 5 and Figure 6 show watershed reference values for NO3, NH4+, and PO43− for the dry and wet seasons, respectively. In Cambodia, water concentrations of NO3, NH4+, PO43− were much closer to reference values than in Laos and Thailand, but sites in Cambodia still exceeded reference conditions, especially in Backprea, Phnom Krom, and Tonle Sap. In Laos, the site with the highest NO3 and NH4+ concentrations was Houay Mak Hiao. In general, Laos sites fell above reference conditions for NH4+ and PO43− but closer or sometimes below reference for NO3. In Thailand, several sites had higher NO3, NH4+, PO43− than reference both in the dry and in the wet season (Ban Ku Phra Kona, Ban Som, Chiang Rai).
When assessed by the Redfield ratio, all rivers in Cambodia were nitrogen limited, while in Thailand and Laos nutrient limitation varied, with some nitrogen limited sites and some phosphorus limited sites.

4. Discussion

4.1. Effect of Land Use in Water Quality Parameters

In this study we show that deforestation, agriculture, and urbanization pressure have increased in the last 17 years in the Lower Mekong Basin, and these changes in land use have led to the degradation of water quality, particularly with respect of TSS, TN, TP, DO, NO3, NH4+, and PO43− concentrations. Agriculture and the use of fertilizers are driving changes in water quality, together with the increasing urbanization and population density, lack of proper sewage treatment, and inadequate sanitation facilities common in areas as tropical developing countries [36]. We found differences between the dry and wet season for water quality parameters, but in general all explanatory models included agricultural activity (either rice, crop, or plantation), urbanization and/or population density as drivers of change in water quality.
These findings support results from temperate rivers [37] and some tropical rivers [38], showing that land use changes into agriculture are major drivers of water quality degradation. However, our results differ from other highly urbanized tropical regions in Brazil [23] where urbanization was the strongest driver of nutrient concentrations in rivers, and non-intensive subsistence-level agriculture did not increase water nutrient concentrations. Most fertilizer use occurs in Europe and the United States, although fertilizers are increasing in Asia [39], which is increasingly replacing subsistence cultivations with intensive agricultural activities [17]. Interestingly, we found that NO3 and TN were positively correlated to agriculture (crops) but were negatively correlated to rice paddies, showing that traditional rice cultivation was not associated with an increase of nitrogen concentration in our sites. This was also found by [17]. However, the percentage of rice paddy cultivation at our sites was small, compared to other crops land use (Figure 1).
In general, water quality parameters were closer to reference values in Cambodia than they were in Laos and Thailand. Cambodia had higher TP concentrations compared to reference values, while Laos and Cambodia had higher TN, NH4+, and NO3 than reference values. TSS was variable in our study, mirroring results by [17]. In general, TSS varied more from reference conditions during the wet season, and the sites that showed larger departure from the reference conditions where those with a dam either upstream or downstream, while dam free rivers had TSS values closer to the reference values.

4.2. Defining Baseline Reference Water Quality Parameters

Tropical countries are rapidly developing, increasing urbanization and agricultural land cover that can affect current and future water quality. In this study, we generate a first time estimate of reference conditions for watersheds in the absence of anthropogenic impacts for which policies could be developed to improve water quality.
The approach we used has been commonly applied to establish reference water quality parameters in temperate areas of the United States [19,40,41] and Europe [42], as well as in tropical rivers of Venezuela [38] and Brazil [23], and tropical reservoirs in Brazil [43]. To our knowledge this is the first study identifying reference conditions for water quality for tropical rivers of Southeast Asia. The reference values of this study for TN and TP were lower than those found in rivers in Brazil [22,23], but higher than what was reported for Venezuela [38] and in the range of what was found by [43]. These results show that there is variability in reference nutrient concentrations among tropical areas. Reference conditions in this area could be different than tropical rivers in South America due to different soil or geological characteristics, determining different baseline reference conditions. Reference values in this study were in the range of those reported by [19] in temperate areas but were near the low end of the range. The paucity of studies on reference nutrient concentration for tropical rivers and lakes shows that more research is needed to understand how reference values and nutrient ecoregions vary within and between tropical and temperate regions. Reference conditions are also needed to inform water quality monitoring programs for tropical developing countries.
The MRC routinely monitors water quality parameters which indicate fairly-good status of water quality in the Lower Mekong Basin, although the indexes used by MRC are based on the Canadian Water Quality Index and may not be appropriate for tropical systems. A handful of studies in the Lower Mekong Basin show increasing water quality changes that have caused degradation [14,15], and increased nutrient fluxes [44]. Those studies assess water quality based on long-term average loads or nutrient fluxes [45], but no well-defined standards have been determined to assess how much current water quality parameters have been impaired from reference conditions. Reference parameters are needed to monitor water quality and ecosystem integrity, decreasing water quality and nutrient enrichment can adversely affect aquatic life and human health.

5. Conclusions

Preserving the ecological integrity of the Lower Mekong River is important to sustain the livelihoods of the population living within its basin. Our study showed that:
  • Watersheds in the Lower Mekong Basin experienced increasing deforestation, agricultural expansion, urban development, and population density from 2000 to 2017.
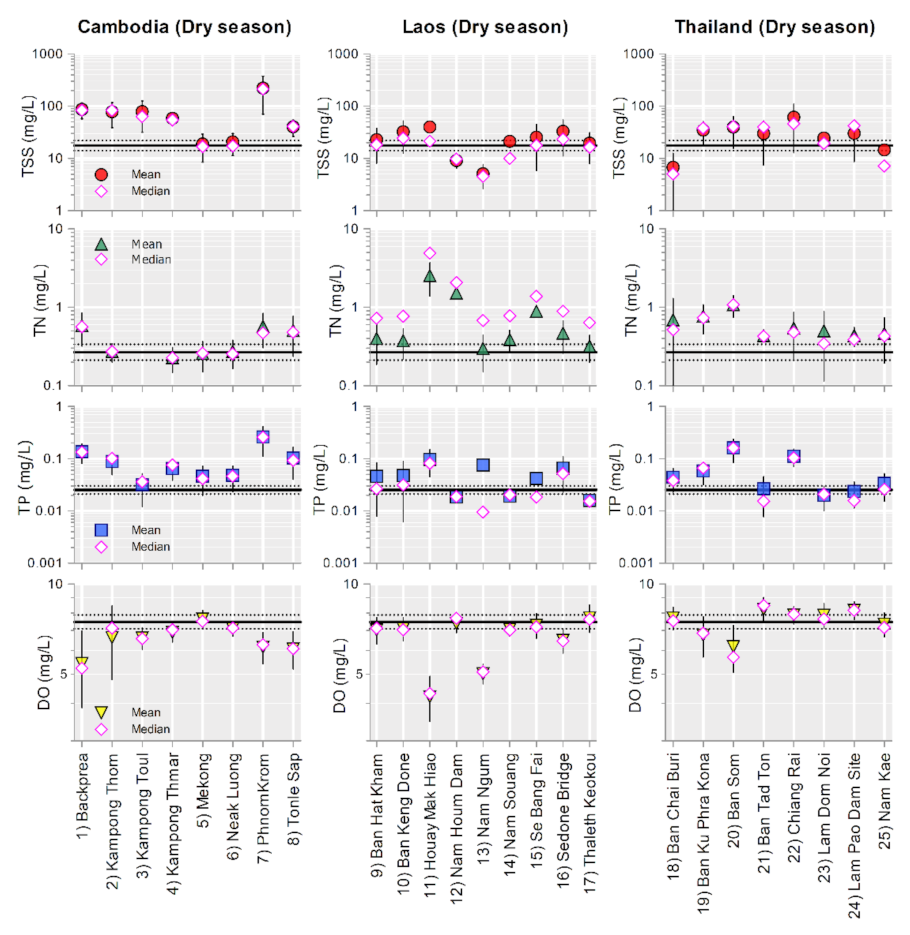
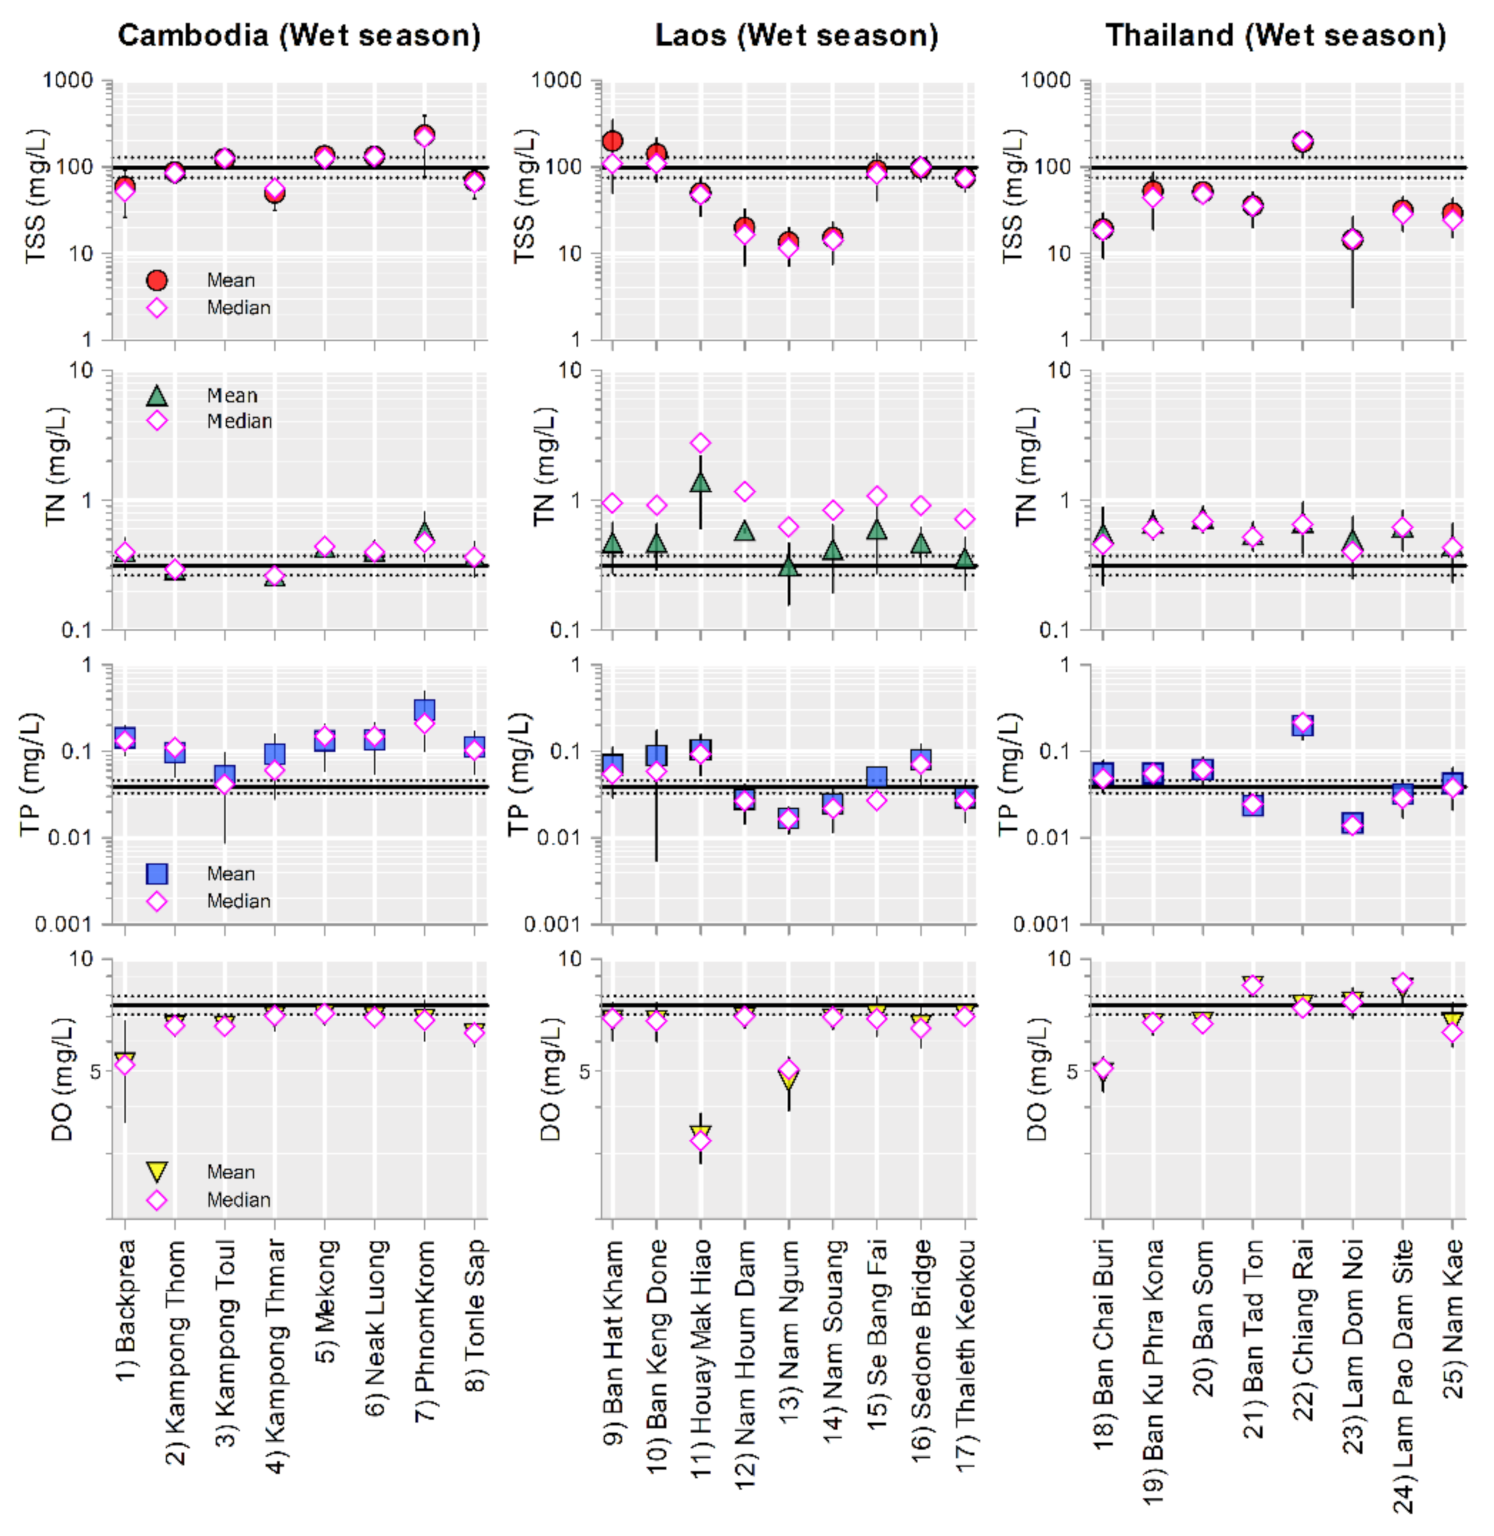
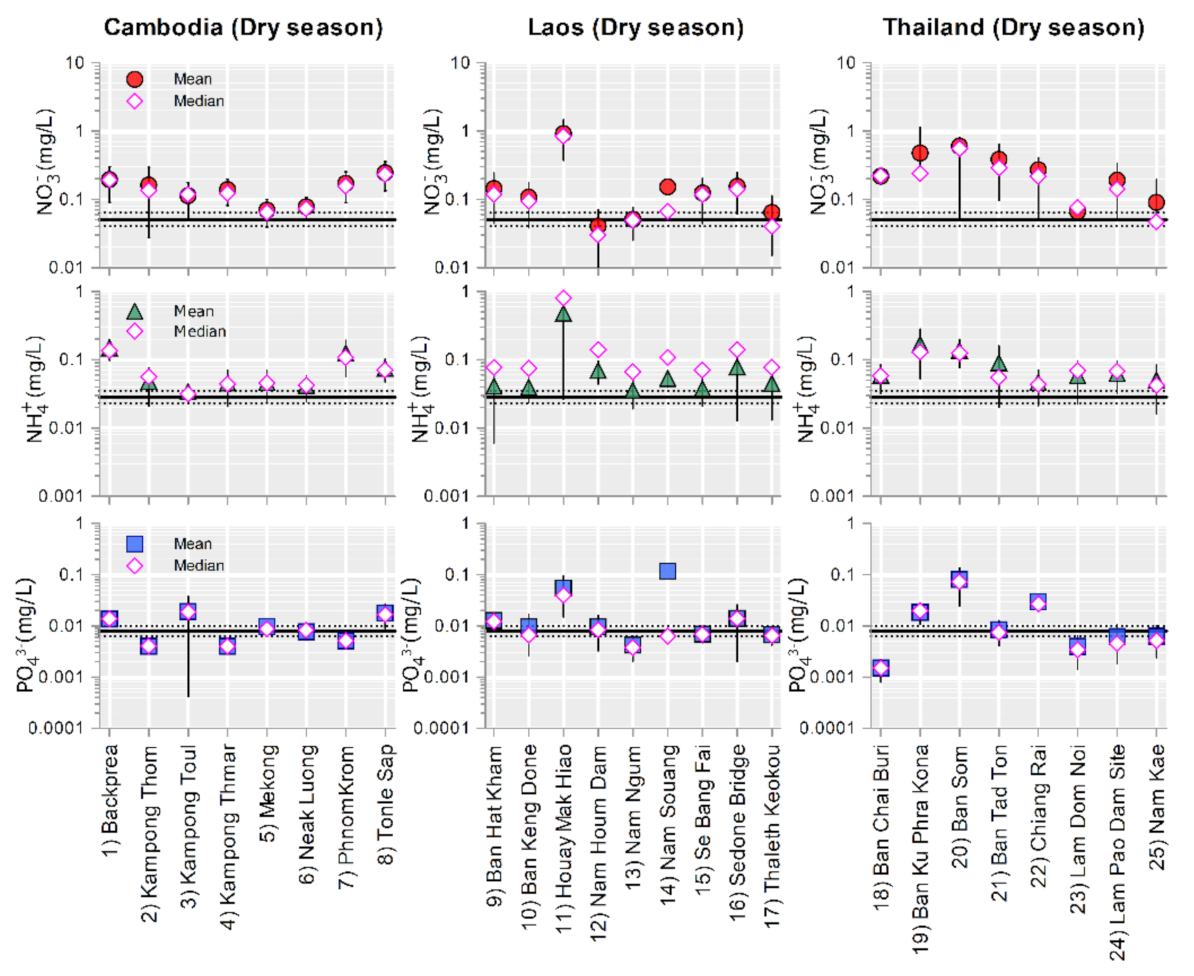
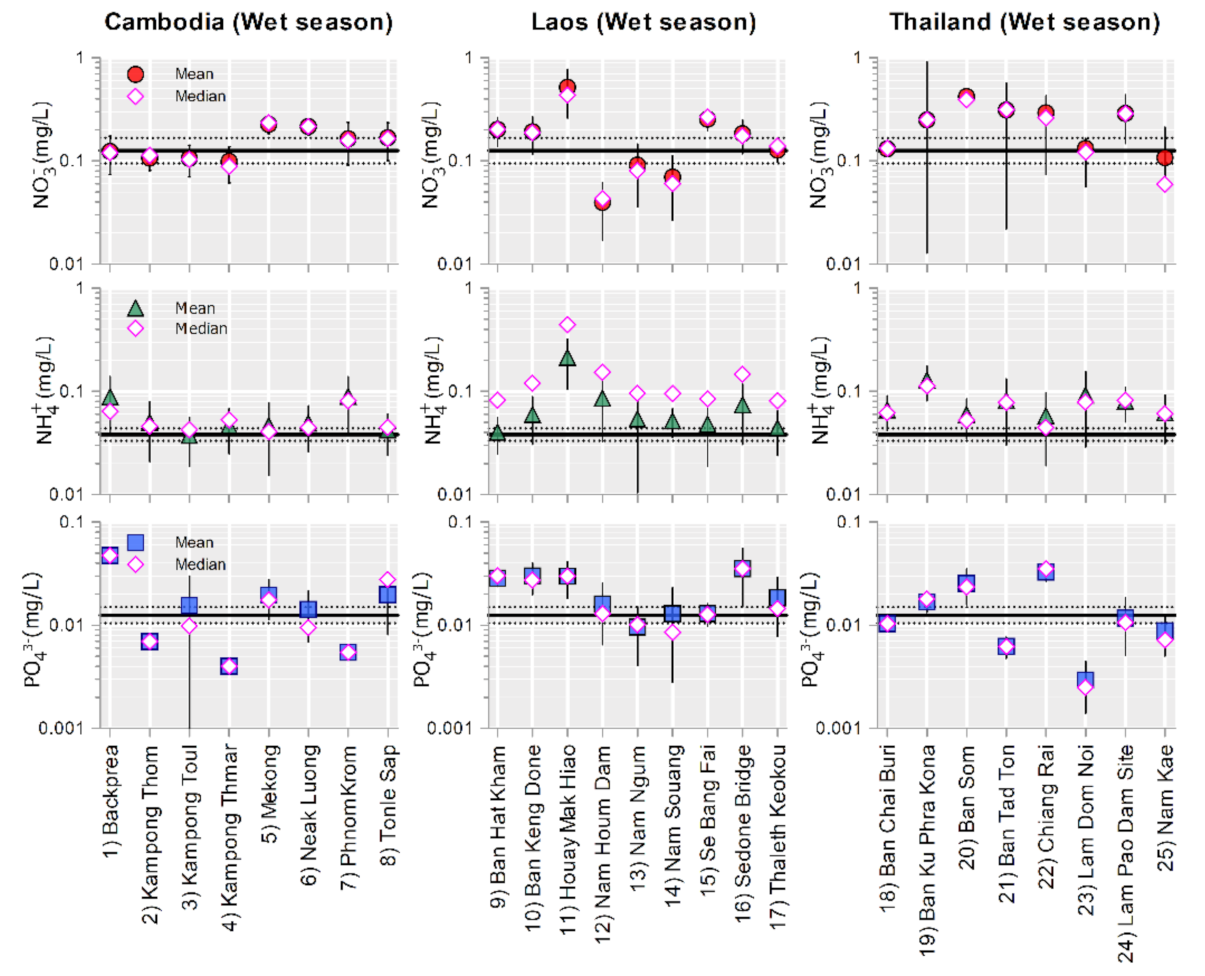
  • These land use changes have decreased water quality. Many sites are impaired in comparison with reference conditions and nutrient concentrations have increased. In Cambodia, TN, NH4+, and NO3 concentrations were close to reference conditions but TP values were higher than reference. In Laos and Thailand TN, NH4+, NO3, and TP concentrations were higher than reference conditions.
  • In several sites in Laos and Thailand, TSS are decreasing in the wet season. This was not observed in Cambodia, where most study sites were undammed.
  • All rivers in Cambodia were nitrogen limited when assessed by the Redfield ratio, indicating that TP is being exported by these rivers more than algal demand relative to total nitrogen. In some sites of Thailand and Laos, nutrient limitation shifted from nitrogen to phosphorus.
This study presents baseline water quality parameters specific for the Lower Mekong Basin, to support water management agencies planning effective monitoring strategies, including proper fertilizer management and control, development of sewage treatment and sanitation infrastructures, that should be implemented to avoid further water quality degradation in the future. We found that the percentage of upland forest was negatively correlated to all nutrient concentrations, showing that maintaining upland forest is important to preserve water quality. Further research could characterize specific nutrient ecoregions for the Mekong Basin, including soil, vegetation, and geological characteristics of the basin.

Supplementary Materials

The following are available online at https://www.mdpi.com/article/10.3390/w13141948/s1, Supplementary Material 1: Watershed-station names and mean (2000–2017) water quality parameters ± standard deviation in the dry season. “n” refers to number of observations. Supplementary Material 2: Watershed-station names and mean (2000–2017) water quality parameters ± standard deviation in the wet season. “n” refers to number of observations. Supplementary Material 3: Correlation analysis between land use categories and water quality parameters in the dry season for the watersheds of our study in the Lower Mekong Basin. Supplementary Material 4: Correlation analysis between land use categories and water quality parameters in the wet season for the watersheds of our study in the Lower Mekong Basin.

Author Contributions

Conceptualization, F.T., S.C.; data curation: F.T., P.B.N., S.S.; methodology, F.T., S.C., T.E.D., S.L.; formal analysis, F.T.; writing—original draft preparation, F.T.; writing—review and editing, F.T., S.C., S.E.N., T.E.D., S.L., S.S., Z.H.; funding acquisition, S.C., S.E.N., Z.H. All authors have read and agreed to the published version of the manuscript.

Funding

This research was funded by United States Agency for International Development (USAID) Wonders of the Mekong Cooperative Agreement No: AID-OAA-A-16-00057 to Z.H. and S.C.

Data Availability Statement

The data presented in this study are available on request from the corresponding author.

Acknowledgments

We thank the Mekong River Commission for providing the database for our analysis.

Conflicts of Interest

The authors declare no conflict of interest.

References

  1. Foley, E.A. Global consequences of land use. Science 2005, 309, 570–574. [Google Scholar] [CrossRef] [Green Version]
  2. Paerl, H.W.; Hall, N.S.; Peierls, B.; Rossignol, K.L. Evolving Paradigms and Challenges in Estuarine and Coastal Eutrophication Dynamics in a Culturally and Climatically Stressed World. Chesap. Sci. 2014, 37, 243–258. [Google Scholar] [CrossRef]
  3. Dodds, W.K.; Perkin, J.S.; Gerken, J.E. Human impact on freshwater ecosystem services: A global perspective. Environ. Sci. Technol. 2013, 47, 9061–9068. [Google Scholar] [CrossRef] [PubMed]
  4. Fluet-Chouinard, E.; Funge-Smith, S.; McIntyre, P.B. Global hidden harvest of freshwater fish revealed by household surveys. Proc. Natl. Acad. Sci. USA 2018, 115, 7623–7628. [Google Scholar] [CrossRef] [Green Version]
  5. Nuon, V.; Lek, S.; Ngor, P.B.; So, N.; Grenouillet, G. Fish Community Responses to Human-Induced Stresses in the Lower Mekong Basin. Water 2020, 12, 3522. [Google Scholar] [CrossRef]
  6. Campbell, T.; Pin, K.; Ngor, P.B.; Hogan, Z. Conserving Mekong Megafishes: Current Status and Critical Threats in Cambodia. Water 2020, 12, 1820. [Google Scholar] [CrossRef]
  7. Hirsch, P. Underlying Causes of Deforestation in the Mekong Region; Australian Mekong Resource Centre: Sydney, NSW, Australia, 2000. [Google Scholar]
  8. Campbell, I.; Barlow, C. Hydropower Development and the Loss of Fisheries in the Mekong River Basin. Front. Environ. Sci. 2020, 8, 566509. [Google Scholar] [CrossRef]
  9. Lohani, S.; Dilts, T.E.; Weisberg, P.J.; Null, S.E.; Hogan, Z.S. Rapidly Accelerating Deforestation in Cambodia’s Mekong River Basin: A Comparative Analysis of Spatial Patterns and Drivers. Water 2020, 12, 2191. [Google Scholar] [CrossRef]
  10. Null, S.E.; Farshid, A.; Goodrum, G.; Gray, C.A.; Lohani, S.; Morrisett, C.N.; Prudencio, L.; Sor, R. A Meta-Analysis of Environmental Tradeoffs of Hydropower Dams in the Sekong, Sesan, and Srepok (3S) Rivers of the Lower Mekong Basin. Water 2021, 13, 63. [Google Scholar] [CrossRef]
  11. WWF Greater Mekong. Ecosystems in the Greater Mekong: Past Trends, Current Status, Possible Futures (2013). Available online: http//:wwf.panda.org/greatermekong (accessed on 6 July 2018).
  12. Berg, H. Rice monoculture and integrated rice-fish farming in the Mekong Delta, Vietnam—Economic and ecological considerations. Ecol. Econ. 2002, 41, 95–107. [Google Scholar] [CrossRef]
  13. MRC. Diagnostic Study of Water Quality in the Lower Mekong Basin Technical Paper No.15; Mekong River Commission: Vientiane, Laos, 2007; p. 57. [Google Scholar]
  14. Chea, R.; Grenouillet, G.; Lek, S. Evidence of Water Quality Degradation in Lower Mekong Basin Revealed by Self-Organizing Map. PLoS ONE 2016, 11, e0145527. [Google Scholar] [CrossRef] [Green Version]
  15. Sor, R.; Ngor, P.B.; Soum, S.; Chandra, S.; Hogan, Z.S.; Null, S.E. Water Quality Degradation in the Lower Mekong Basin. Water 2021, 13, 1555. [Google Scholar] [CrossRef]
  16. Wilbers, G.-J.; Becker, M.; Nga, L.T.; Sebesvari, Z.; Renaud, F.G. Spatial and temporal variability of surface water pollution in the Mekong Delta, Vietnam 485–486, 653–665. Sci. Total Environ. 2014, 485–486;653–665. [Google Scholar]
  17. Ly, K.; Metternicht, G.; Marshall, L. Linking Changes in Land Cover and Land Use of the Lower Mekong Basin to Instream Nitrate and Total Suspended Solids Variations. Sustainability 2020, 12, 2992. [Google Scholar] [CrossRef] [Green Version]
  18. Wurtsbaugh, W.A.; Heredia, N.A.; Laub, B.G.; Meredith, C.S.; Mohn, H.E.; Null, S.E.; Pluth, D.A.; Roper, B.B.; Saunders, W.C.; Stevens, D.K.; et al. Approaches for studying fish production: Do river and lake researchers have different perspectives? Can. J. Fish. Aquat. Sci. 2015, 72, 149–160. [Google Scholar] [CrossRef]
  19. Dodds, W.K.; Dodds, W.K.; Oakes, R.M. A technique for establishing reference nutrient concentrations across watersheds affected by humans. Limnol. Oceanogr. Methods 2004, 2, 333–341. [Google Scholar] [CrossRef]
  20. Baattrup-Pedersen, A.; Kristensen, E.A.; Jørgensen, J.; Skriver, J.; Kronvang, B.; Andersen, H.E.; Hoffman, C.C.; Larsen, L.M.K. Can a priori defined reference criteria be used to select reference sites in Danish streams? Implications for implementing the Water Framework Directive. J. Environ. Monit. 2009, 11, 344–352. [Google Scholar] [PubMed]
  21. Nijboer, R.C.; Verdonschot, P.F. Variable selection for modelling effects of eutrophication on stream and river ecosystems. Ecol. Model. 2004, 177, 17–39. [Google Scholar] [CrossRef]
  22. Cunha, D.G.F.; Dodds, W.K.; Calijuri, M.D.C. Defining Nutrient and Biochemical Oxygen Demand Baselines for Tropical Rivers and Streams in São Paulo State (Brazil): A Comparison Between Reference and Impacted Sites. Environ. Manag. 2011, 48, 945–956. [Google Scholar] [CrossRef] [PubMed]
  23. Tromboni, F.; Dodds, W.K. Relationships Between Land Use and Stream Nutrient Concentrations in a Highly Urbanized Tropical Region of Brazil: Thresholds and Riparian Zones. Environ. Manag. 2017, 60, 30–40. [Google Scholar] [CrossRef]
  24. Schmitt, R.J.P.; Bizzi, S.; Castelletti, A.; Kondolf, G.M. Improved trade-offs of hydropower and sand connectivity by strategic dam planning in the Mekong. Nat. Sustain. 2018, 1, 96–104. [Google Scholar] [CrossRef]
  25. Soukhaphon, A.; Baird, I.G.; Hogan, Z.S. The Impacts of Hydropower Dams in the Mekong River Basin: A Review. Water 2021, 13, 265. [Google Scholar] [CrossRef]
  26. Clesceri, L.S.G.A.; Eaton, A.D. Standard Methods for the Examination of Water and Wastewater, 22nd ed.; APHA American Public Health Association: Washington, DC, USA, 1998. [Google Scholar]
  27. Jarvis, A.; Reuter, H.I.; Nelson, A.; Guevara, E. Hole-Filled SRTM for the Globe Version 4. C.G.IAR-CSI SRTM 90m Database. 2008, Volume 15, pp. 25–54. Available online: http://srtm.csi.cgiar.org (accessed on 30 November 2020).
  28. ESRI. Spatial Analyst Extension for ArcGIS Software Version 10.7.1; Environmental Systems Research Institute: Redlands, CA, USA, 2019. [Google Scholar]
  29. Tarboton, D.; Bras, R.L.; Rodriguez-Iturbe, I. On the extraction of channel networks from digital elevation data. Hydrol. Process. 1991, 5, 81–100. [Google Scholar] [CrossRef]
  30. Mekong, S. Regional Land Cover Monitoring System Version 2. 2020. Available online: https://www.landcovermapping.org/en/landcover/ (accessed on 11 April 2020).
  31. Doxsey-Whitfield, E.; MacManus, K.; Adamo, S.B.; Pistolesi, L.; Squires, J.; Borkovska, O.; Baptista, S.R. Taking Advantage of the Improved Availability of Census Data: A First Look at the Gridded Population of the World, Version 4. Pap. Appl. Geogr. 2015, 1, 226–234. [Google Scholar] [CrossRef]
  32. Lehner, B.; Liermann, C.R.; Revenga, C.; Vörösmarty, C.; Fekete, B.; Crouzet, P.; Döll, P.; Endejan, M.; Frenken, K.; Magome, J.; et al. High-resolution mapping of the world’s reservoirs and dams for sustainable river-flow management. Front. Ecol. Environ. 2011, 9, 494–502. [Google Scholar] [CrossRef] [Green Version]
  33. ESRI. World Imagery Basemap. 2020. Available online: https://www.arcgis.com/home/webmap/viewer.html?webmap=a2e7c99be14d421abac4f002d6c301f5#! (accessed on 30 November 2020).
  34. Tromboni, F.; Thomas, S.A.; Gücker, B.; Neres-Lima, V.; Lourenço-Amorim, C.; Moulton, T.P.; Silva-Junior, E.F.; Feijó-Lima, R.; Boëchat, I.G.; Zandonà, E. Nutrient Limitation and the Stoichiometry of Nutrient Uptake in a Tropical Rain Forest Stream. J. Geophys. Res. Biogeosci. 2018, 123, 2154–2167. [Google Scholar] [CrossRef]
  35. Dodds, W.K.; Whiles, M.R. Freshwater Ecology: Concepts and Environmental Applications of Limnology, 2nd ed.; Academic Press: Cambridge, MA, USA, 2010. [Google Scholar]
  36. Capps, K.A.; Bentsen, C.N.; Ramírez, A. Poverty, urbanization, and environmental degradation: Urban streams in the developing world. Freshw. Sci. 2016, 35, 429–435. [Google Scholar] [CrossRef]
  37. Secchi, S.; Gassman, P.W.; Jha, M.; Kurkalova, L.; Kling, C.L. Potential water quality changes due to corn expansion in the Upper Mississippi River Basin. Ecol. Appl. 2011, 21, 1068–1084. [Google Scholar] [CrossRef] [Green Version]
  38. Castillo, M.M. Land use and topography as predictors of nutrient levels in a tropical catchment. Limnologica 2010, 40, 322–329. [Google Scholar] [CrossRef] [Green Version]
  39. UNEP. Vital Water Graphics: An Overview of the State of the World’s Fresh and Marine Waters, 2nd ed.; UNEP GRID Arendal, 2008; Available online: http://www.unep.org/dewa/vitalwater/index.html (accessed on 10 April 2021).
  40. Weigel, B.M.; Robertson, D.M. Identifying Biotic Integrity and Water Chemistry Relations in Nonwadeable Rivers of Wisconsin: Toward the Development of Nutrient Criteria. Environ. Manag. 2007, 40, 691–708. [Google Scholar] [CrossRef] [PubMed]
  41. Dodds, W.K.K.; Welch, E.B. Establishing nutrient criteria in streams. J. N. Am. Benthol. Soc. 2000, 19, 186–196. [Google Scholar] [CrossRef]
  42. Baattrup-Pedersen, A.; Springe, G.; Riis, T.; Larsen, S.E.; Sand-Jensen, K.; Larsen, L.M.K. The search for reference conditions for stream vegetation in northern Europe. Freshw. Biol. 2008, 53, 1890–1901. [Google Scholar] [CrossRef] [PubMed]
  43. Cunha, D.; Ogura, A.; Calijuri, M.d.C. Nutrient reference concentrations and trophic state boundaries in subtropical reservoirs. Water Sci. Technol. 2012, 65, 1461–1467. [Google Scholar] [CrossRef] [PubMed]
  44. Liljeström, I.; Kummu, M.; Varis, O. Nutrient Balance Assessment in the Mekong Basin: Nitrogen and Phosphorus Dynamics in a Catchment Scale. Int. J. Water Resour. Dev. 2012, 28, 373–391. [Google Scholar] [CrossRef]
  45. Oeurng, C.; Cochrane, T.A.; Arias, M.E.; Shrestha, B.; Piman, T. Assessment of changes in riverine nitrate in the Sesan, Srepok and Sekong tributaries of the Lower Mekong River Basin. J. Hydrol. Reg. Stud. 2016, 8, 95–111. [Google Scholar] [CrossRef] [Green Version]
Figure 1. Land use cover in Cambodia, Laos, and Thailand in 2017. The watersheds we analyzed in this study are shown with bold colors, while areas outside of the watersheds are shaded. Watershed numbering corresponds to labels in Figures 3–6.
Water 13 01948 g001
Figure 2. Land use changes in study watersheds of Cambodia, Laos, Thailand, and Vietnam from 2000 to 2017. Note that y axes differ among panels.
Water 13 01948 g002
Figure 3. Mean TSS, TN, TP, and DO concentrations for the dry season in Cambodia, Laos, and Thailand. Black solid horizontal lines represent reference values with dotted lines corresponding to the 95% confidence interval.
Water 13 01948 g003
Figure 4. Mean TSS, TN, TP, and DO concentrations for the wet season in Cambodia, Laos, and Thailand. Black solid horizontal lines represent reference values with dotted lines corresponding to the 95% confidence interval.
Water 13 01948 g004
Figure 5. Mean NO3, NH4+, PO43− concentrations for the dry season in Cambodia, Laos, and Thailand. Black horizontal lines report reference values and dotted lines correspond to the 95% confidence interval.
Water 13 01948 g005
Figure 6. Mean NO3, NH4+, PO43− concentrations for the wet season in Cambodia, Laos, and Thai land. Black horizontal lines report reference values and dotted lines correspond to the 95% confidence interval.
Water 13 01948 g006
Table 1. Multiple regression models with anthropogenic drivers in the dry season.
Dry Season
Dependent VariableObservations (n)Independent VariableEstimateStandard Errorp-ValueAdj. R2
Log[TSS] (mg/L)297Intercept1.240.05<0.0010.13
Population0.010.00<0.001
Crop−8.720.18<0.001
Rice−3.360.77<0.001
Urban−40.0714.490.01
Log[TN] (mg/L)204Intercept−0.570.05<0.0010.26
Rice−3.710.51<0.001
Population0.0040.00<0.001
Urban−41.610.35<0.001
Grassland4.412.1050.05
Log[TP] (mg/L)297Intercept−1.600.040<0.0010.21
Population0.010.001<0.001
Rice−3.060.61<0.001
Crop−0.580.15<0.001
Log[DO] (mg/L)296Intercept0.870.01<0.0010.20
Urban22.472.84<0.001
Rice0.770.14<0.001
Grassland−1.870.49<0.001
Population−0.0010.00<0.001
Log[NO3] (mg/L)296Intercept−1.300.05<0.0010.27
Rice−5.040.61<0.001
Population0.010.00<0.001
Grassland8.122.21<0.001
Urban−46.5412.87<0.001
Log[NH4+] (mg/L)297Intercept−1.550.05<0.0010.31
Rice−3.960.48<0.001
Population0.010.00<0.001
Urban−46.119.69<0.001
Plantation0.220.110.05
Log[PO43−] (mg/L)111Intercept−2.100.05<0.0010.03
Urban54.3625.200.05
Table 2. Multiple regression models with anthropogenic drivers in the wet season.
Wet Season
Dependent VariableObservations (n)Independent VariableEstimateStandard Errorp-ValueAdj. R2
Log[TSS] (mg/L)285Intercept1.980.06<0.0010.263
Crop−1.490.15<0.001
Population0.010.00<0.001
Plantation−0.600.14<0.001
Log[TN] (mg/L)187Intercept−0.510.04<0.0010.166
Population0.000.00<0.001
Rice−1.720.36<0.001
Grassland6.001.55<0.001
Urban−187.290.05
Log[TP] (mg/L)284Intercept−1.410.04<0.001 0.255
Population0.010.00<0.001
Crop−0.740.14<0.001
Urban39.7910.68<0.001
Log[DO] (mg/L)281Intercept0.880.01<0.0010.280
Crop−0.230.02<0.001
Rice0.790.13<0.001
Urban21.103.00<0.001
Grassland−2.760.57<0.001
Log[NO3] (mg/L)285Intercept−0.900.06<0.0010.167
Plantation−0.420.13<0.001
Grassland6.681.89<0.001
Population0.000.000.001
Log[NH4+] (mg/L)285Intercept−1.420.03<0.0010.166
Rice−2.500.45<0.001
Population0.000.00<0.001
Urban−27.828.850.001
Log[PO43−] (mg/L)100Intercept−1.900.04<0.0010.018
Urban34.9420.660.05
Table 3. Baseline reference values for the dry and wet season, calculated with anthropogenic models (also reported). CI95_low and CI95_high refer to the lower and higher 95% confidence interval, respectively.
Dry SeasonReference ValueCI95_lowCI95_highIndependent Variables
TSS (mg/L)17.514.121.9Crop+Rice+Population+Urban
TN (mg/L)0.2660.2110.336Rice+Grassland+Population+Urban
TP (mg/L)0.02520.02110.030Rice+Crop+Population
DO (mg/L)7.487.017.88Crop+Rice+Grassland+Population+Urban
NO3 (mg/L)0.0510.0400.064Rice+Grassland+Population+Urban
NH4+ (mg/L)0.0280.0230.035Rice+Plantation+Population+Urban
PO43− (mg/L)0.0080.0060.010Urban
Wet SeasonReference ValueCI95_lowCI95_highIndependent Variables
TSS (mg/L)98.175.2127.8Crop+Plantation+Population
TN (mg/L)0.3130.2630.372Rice+Grassland+Population+Urban
TP (mg/L)0.0390.0330.046Crop+Population+Urban
DO (mg/L)7.5037.0907.941Crop+Rice+Grassland+Urban
NO3 (mg/L)0.1260.0950.168Plantation+Grassland+Population
NH4+ (mg/L)0.0380.0330.044Rice+Population+Urban
PO43− (mg/L)0.0130.0100.015Urban (p = 0.094)
Publisher’s Note: MDPI stays neutral with regard to jurisdictional claims in published maps and institutional affiliations.

