
Water Footprint of Rangeland Beef Production in New Mexico
by
 , , and
Mohammed N. Sawalhah
1,* ,
,
Hatim M. E. Geli
2,3,*,
Jerry L. Holechek
3,
Andres F. Cibils
3,
Sheri Spiegal
4 and
Craig Gifford
5 1
Department of Lands Management and Environment, Prince Al-Hasan Bin Talal Faculty for Natural Resources and Environment, The Hashemite University, Zarqa 13133, Jordan
2
New Mexico Water Resources Research Institute, New Mexico State University, Las Cruces, NM 88003, USA
3
Department of Animal and Range Sciences, New Mexico State University, Las Cruces, NM 88003, USA
4
USDA-ARS Jornada Experimental Range, Las Cruces, NM 88003, USA
5
Extension Animal Sciences and Natural Resources Department, New Mexico State University, Las Cruces, NM 88003, USA
*
Authors to whom correspondence should be addressed.
Water 2021, 13(14), 1950; https://doi.org/10.3390/w13141950
Submission received: 8 June 2021
/
Revised: 7 July 2021
/
Accepted: 13 July 2021
/
Published: 15 July 2021
(This article belongs to the Special Issue Water Footprint Assessment Research)
Abstract
:New Mexico (NM) has been identified as the state in the US that will be most adversely impacted by climate change and associated water stress. Roughly 92% of NM is rangeland, most of which is grazed by beef cattle. We calculated the blue (surface and ground) and green (precipitation) water footprints (WF) of NM beef cattle industry (cow-calf, backgrounding, and feedlot). This analysis indicated that the weighted average WF of NM beef cattle was 28,203 L/kgmeat. The majority of the WF was accounted for green water (82%; 23,063 L/kgmeat) used by rangeland forages. Blue water accounted for only 18% (5140 L/kgmeat) of the total beef WF estimate. The relative contribution of green vs. blue water varied significantly among the different phases of beef production. In cow-calf, green water accounted for 99.5% of the WF whereas blue water, accounted for 100% of beef WF during backgrounding and feedlot. Based on our estimate, NM cow-calf operations is about a third or a quarter of the blue water (m3/year) used to produce corn or wheat, and only 5% or less of the water used to produce cotton or hay. In NM, irrigation accounts for about 84% of freshwater use followed by public/domestic use of 10%. Mining, thermo-electric, livestock production, aquaculture, and industrial uses collectively account for the other 6%.
1. Introduction
Meeting the food and nutrition needs of a growing human population, expected to reach almost 10 billion by 2050 [1,2], while lowering the environmental footprint of agriculture is perhaps the most significant challenge of modern farming. According to the global agricultural productivity index (GAP) [3], the current rate of growth of agricultural productivity is below the rate required rate to meet the projected demand [3]. Beef is a major component of the human diet, representing about 22.5% of global meat consumption [4]. Demand for meat (especially beef) is projected to increase by 50% over the next 30 years [5]. Despite these trends in demand, beef cattle production systems—especially those in dryland ecosystems such as the rangelands of the southwestern United States (US)—face many sustainability challenges [6], the most important of which is associated with climate change-driven increased variability and scarcity of water supply needed to produce the necessary feed for beef cattle [7].
Water scarcity has been recognized as a primary global risk to humanity over the next decade [2,8]. Currently, about two-thirds of the world population lives under water stress conditions at least one month of the year, and roughly 6% of humanity face severe water scarcity throughout the year [2]. In order to minimize the severe water stress expected in coming decades, it will be essential to use water much more efficiently than at present [9,10,11]. Thus, a better understanding of water consumption by the various human activities including one of its most important ones—food production—is critically needed. In other words, efficient use of water resources in agriculture requires the assessment of the amount of water consumed to produce a given amount of food. Such information is useful in developing relevant resource management practices (water, land, labor) to sustainably increase food production while simultaneously mitigating related environmental impacts.
An effective assessment indicator that combines water use and food production is the “water footprint” approach developed by Hoekstra [12] and the Water Footprint Network [13]. It involves quantifying the total volume of freshwater used to produce different types of food commodities (i.e., crops and animal products) and other goods, and services. Analogous to the ecological footprint concept developed in the 1990s, the water footprint provides a geographically explicit indicator on how economic choices and processes affect water use. Under the water footprint approach, categories of green, blue, and grey are used to distinguish different types of water used by humans directly or indirectly [12]. Green water is that from precipitation that has infiltrated into the soil and directly used for plant growth. Extractable water in aquifers, lakes, rivers, marshes, glaciers, and snowpack is classified as blue water. Grey water is treated wastewater that is recycled and reused to produce additional goods and services.
Uncertainty exists in the United States about the extent to which improving the efficiency of water use can overcome declining freshwater supplies, especially as the demand associated with an added 80 to 100 million people (current US population is ~326 million) is expected by 2050 [8,10,11,14]. The rapidly growing southwestern US is projected to be more adversely impacted by climate change and become drier than any other part of the US [8,14]. In particular, the state of New Mexico (NM) has been identified as the state facing the highest risk of climate-change driven water scarcity [8,14]. A recent report by the World Resources Institute [15], predicts that NM is the only US state that will be under extremely high risk of water stress conditions with a score of 4.26 on a five-point scale, placing NM in the same category as some of the most water-stressed countries in the world. Moreover, regionally, it is predicted that the aridity index of the southwestern US including NM will likely increase [16,17]. NM’s water demand relative to its annual water supply makes it particularly vulnerable to extended drought or modest increases in economic activity [15].
Agriculture (food production and processing) is a critical part of NM’s economy, accounting for roughly 12 to 13% of its GDP in the 2010s [18]. Beef cattle production has long been the backbone of NM’s agricultural sector recently accounting for around one third of agricultural revenues [19]. Sawalhah et al. [20] found beef cattle inventory in New Mexico to be 10% lower in the 2010s compared to the 1990s. Additionally, Zaied et al. [21] found that production of forage crops in New Mexico had decreased significantly over the last 60 years. This decline in agricultural commodities was explained by several factors including an observed rise in mean annual temperature. Other primary components of NM’s agricultural revenues include dairy products (41%), hay (4.4%), pecans (2.8%), chile (1.4%), and onions (1.3%), all of which mostly depend on irrigation water. Analyses of water-use by these different sectors are lacking and little is known about how they may be impacted by declining availability of freshwater (both surface and ground) due to climate change. Water footprint analyses would allow policymakers to identify enterprises that are most water efficient and develop effective incentives to maximize agricultural productivity relative to water inputs.
The goal of the study was to assess water use in New Mexico, US with focus on its beef cattle industry. Because of its geographic location, wide diversity of dryland ecosystems, the socioeconomic importance of rangeland livestock production, and predicted vulnerability to water scarcity, New Mexico is potentially a useful indicator of the tradeoffs associated with water use for food production in other dryland ecosystems of the world. The specific objective was to evaluate the water footprint of NM’s beef cattle industry in terms of green and blue water use and compare the blue water use of beef cattle with those of important crops in the state.
2. Materials and Methods
2.1. Study Area
The study area involved the entire state of New Mexico (NM, latitude 34°18′25.7184″ N, longitude 106°1′5.0376″ W), which covers an area of ≈314,900 km2 in the southwestern US. Most of NM’s land is suitable for grazing livestock, with 92% of its area classified as rangeland. Elevations range from 866 m in southeastern NM (northern end of the Red Bluff Reservoir on the Pecos River) to 4011 m at Wheeler Peak (northcentral New Mexico’s Sangre de Cristo Range, southern end of the Rocky Mountains). Long-term mean annual precipitation for the state is 370 mm [20]. In general, NM’s climate is characterized by low relative humidity, abundant sunshine, four definite seasons, and peak precipitation in the summer months of July and August with a lesser peak in January [22,23]. NM’s mean annual temperature and evaporation rates are 11.5 °C and more than 250 mm, respectively.
2.2. New Mexico Beef Production Systems
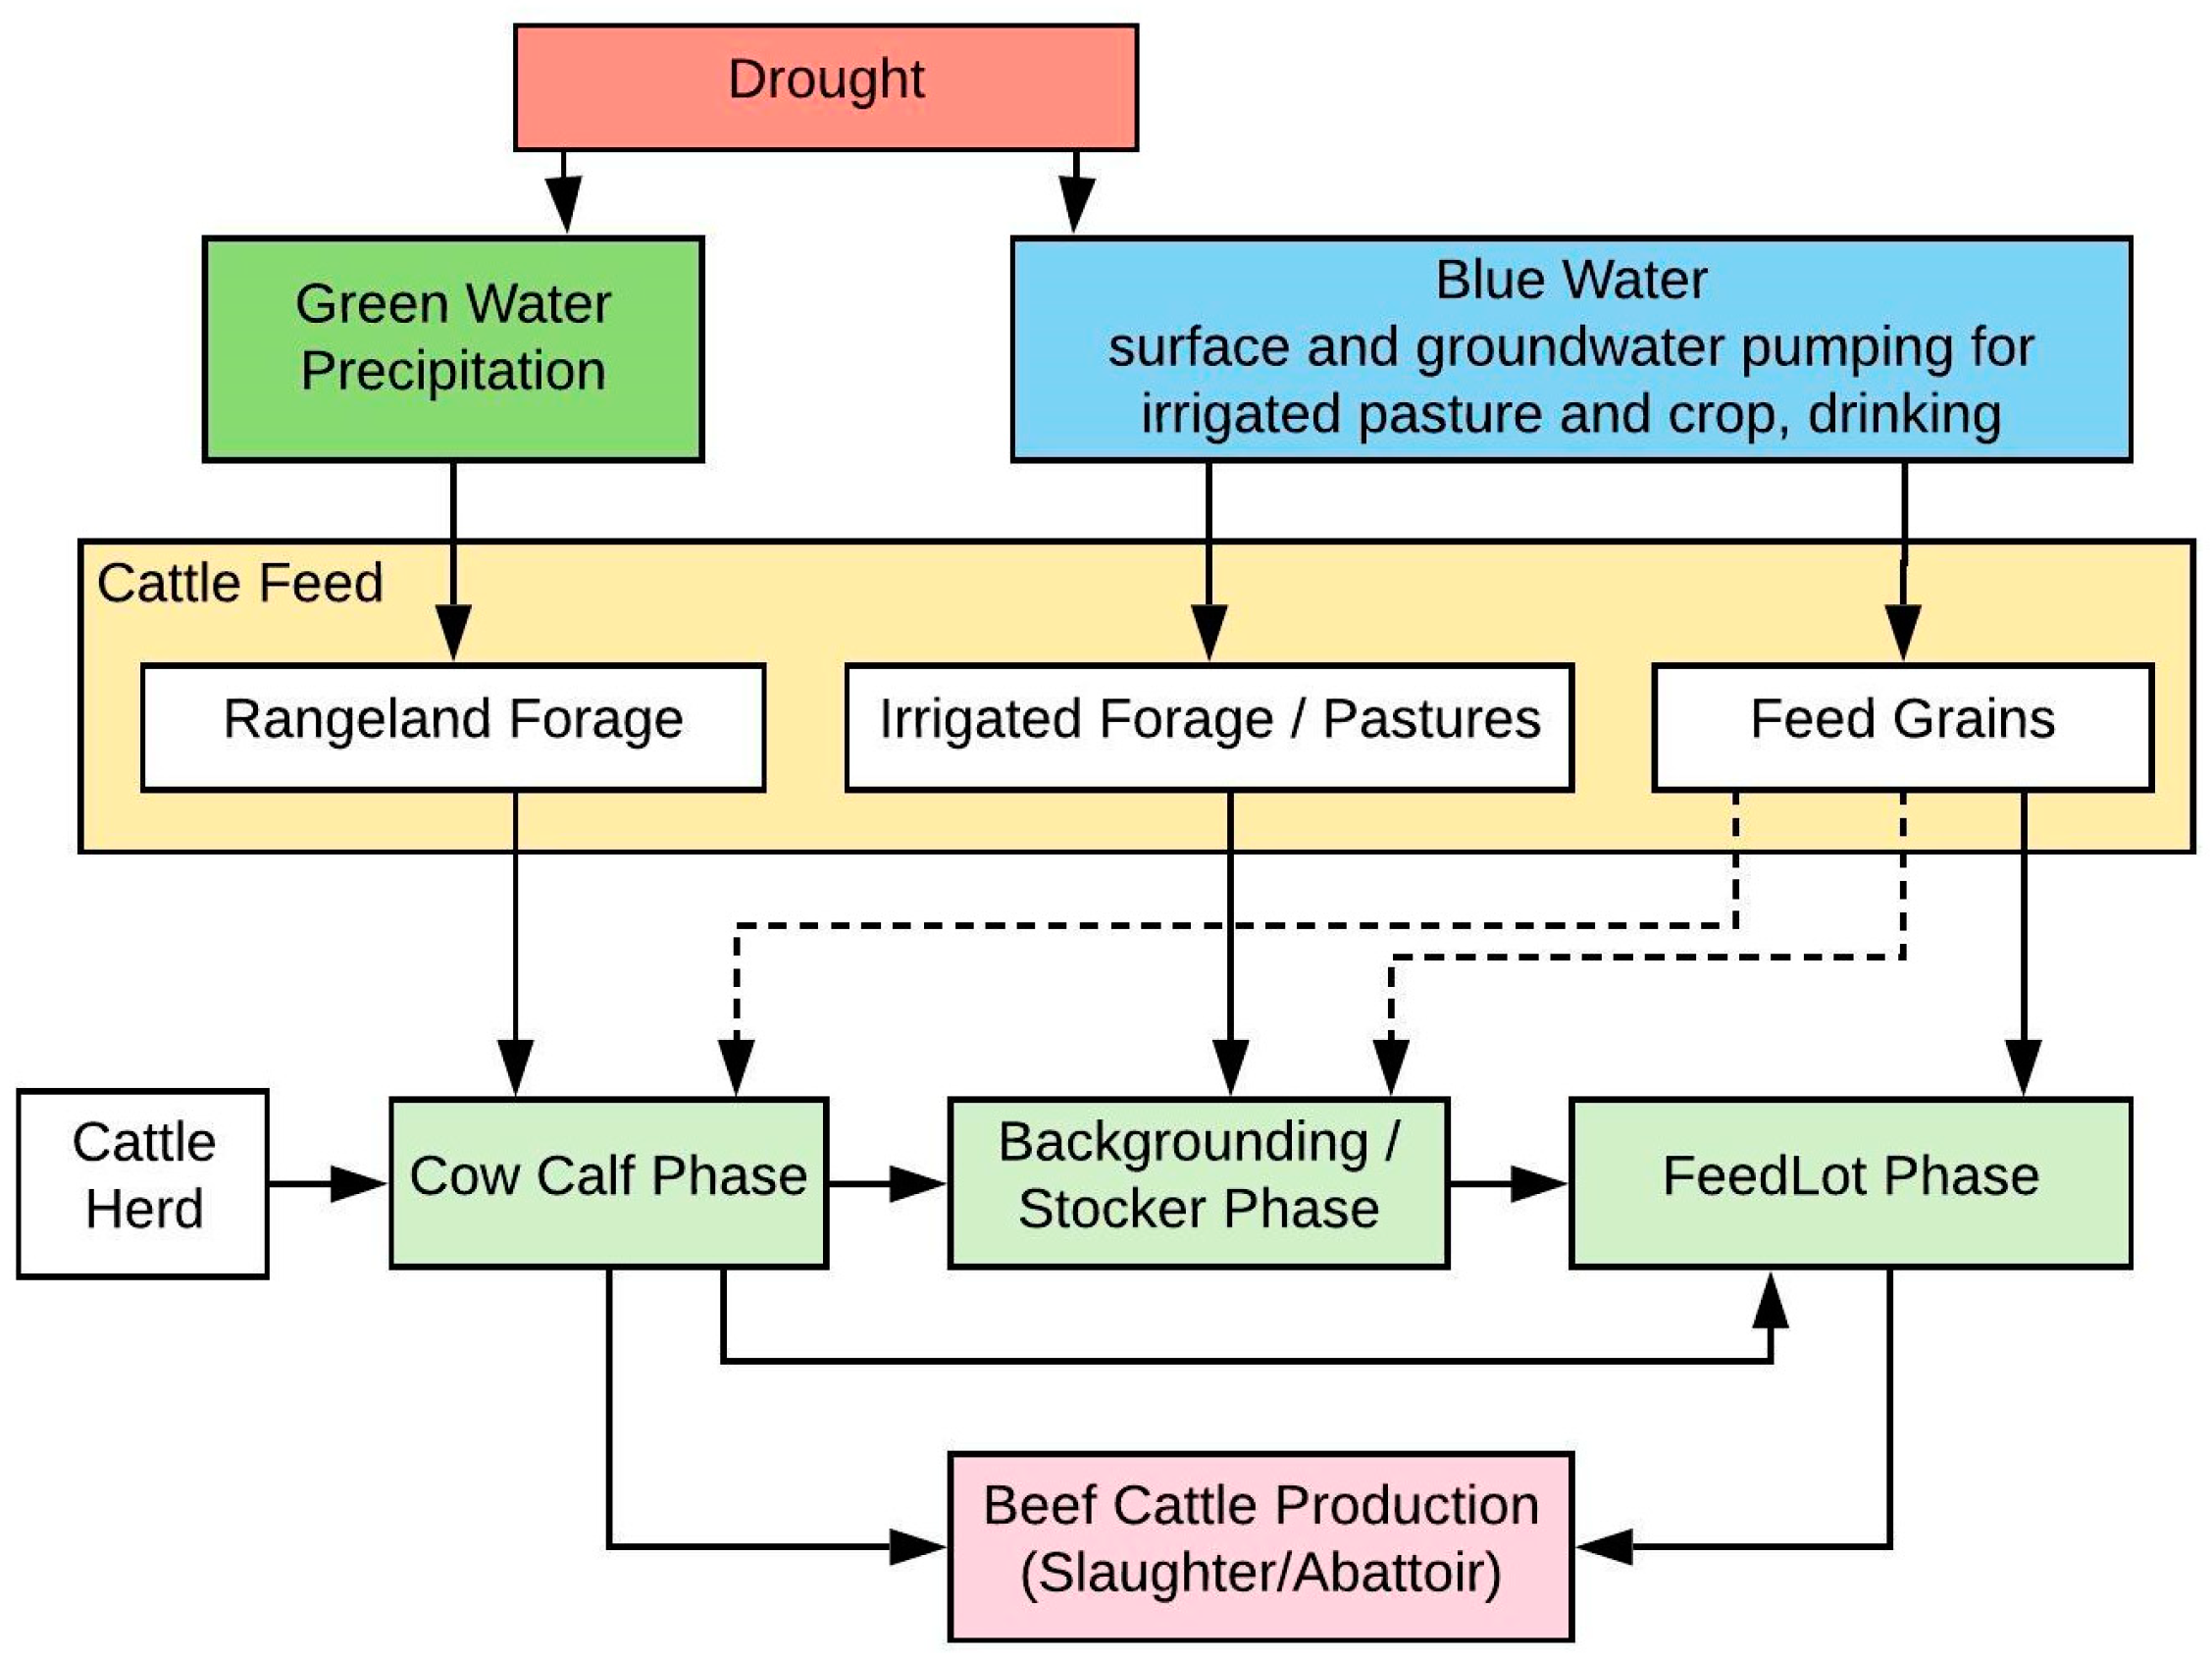
Beef production in New Mexico entails three phases: cow-calf (i.e., grazing on rangeland ranches), backgrounding/stocker (i.e., grazing of weaned calves on irrigated pasture or rangeland), and feedlot (i.e., grain-based diets fed in confinement to previous year’s calf crop) (Figure 1) [24,25]. The cow-calf operation includes the main breeding herd that produces an annual crop of weaned calves. Cattle in these operations graze standing forage in natural rangelands year-round and therefore rely heavily on green water (water from precipitation used directly by natural vegetation) and to a lesser extent on blue water (surface and ground water) which is used to produce feed supplements or is consumed as drinking water. After weaning (typically in the fall), some calves are transferred to backgrounding/stocker operations where they remain over the winter months and are prepared for feedlot finishing (other calves are sent directly to feedlots). Stocker operations rely heavily on irrigated winter wheat or alfalfa pastures, which depend mainly on blue water. In the spring, stockers are moved to feedlots where their main diet consists of cereal grains and grain byproducts, which are mainly produced using blue water. Thus, these operation phases (Figure 1) were used to guide the calculations of the total beef cattle water footprints. In any given year in the state, the cow-calf has the highest inventory overall. Most calves are exported out-of-state for backgrounding/stocker and feedlot phases, but New Mexico has a small number of these operations, which is reflected in the modeling below.
2.3. Data
Water footprint modeling in this study relied on a diversity of data sets, including weather, livestock inventory, crop production, and forage production. Weather data—including annual precipitation (mm), mean annual air temperature (°C), and the self-calibrated Palmer Drought Severity index (Sc-PDSI) for the entire state—were retrieved from the Western Regional Climate Center [26]. Years with <75% of the long-term average annual precipitation were considered as drought years, following the definition of the Society for Range Management [27].
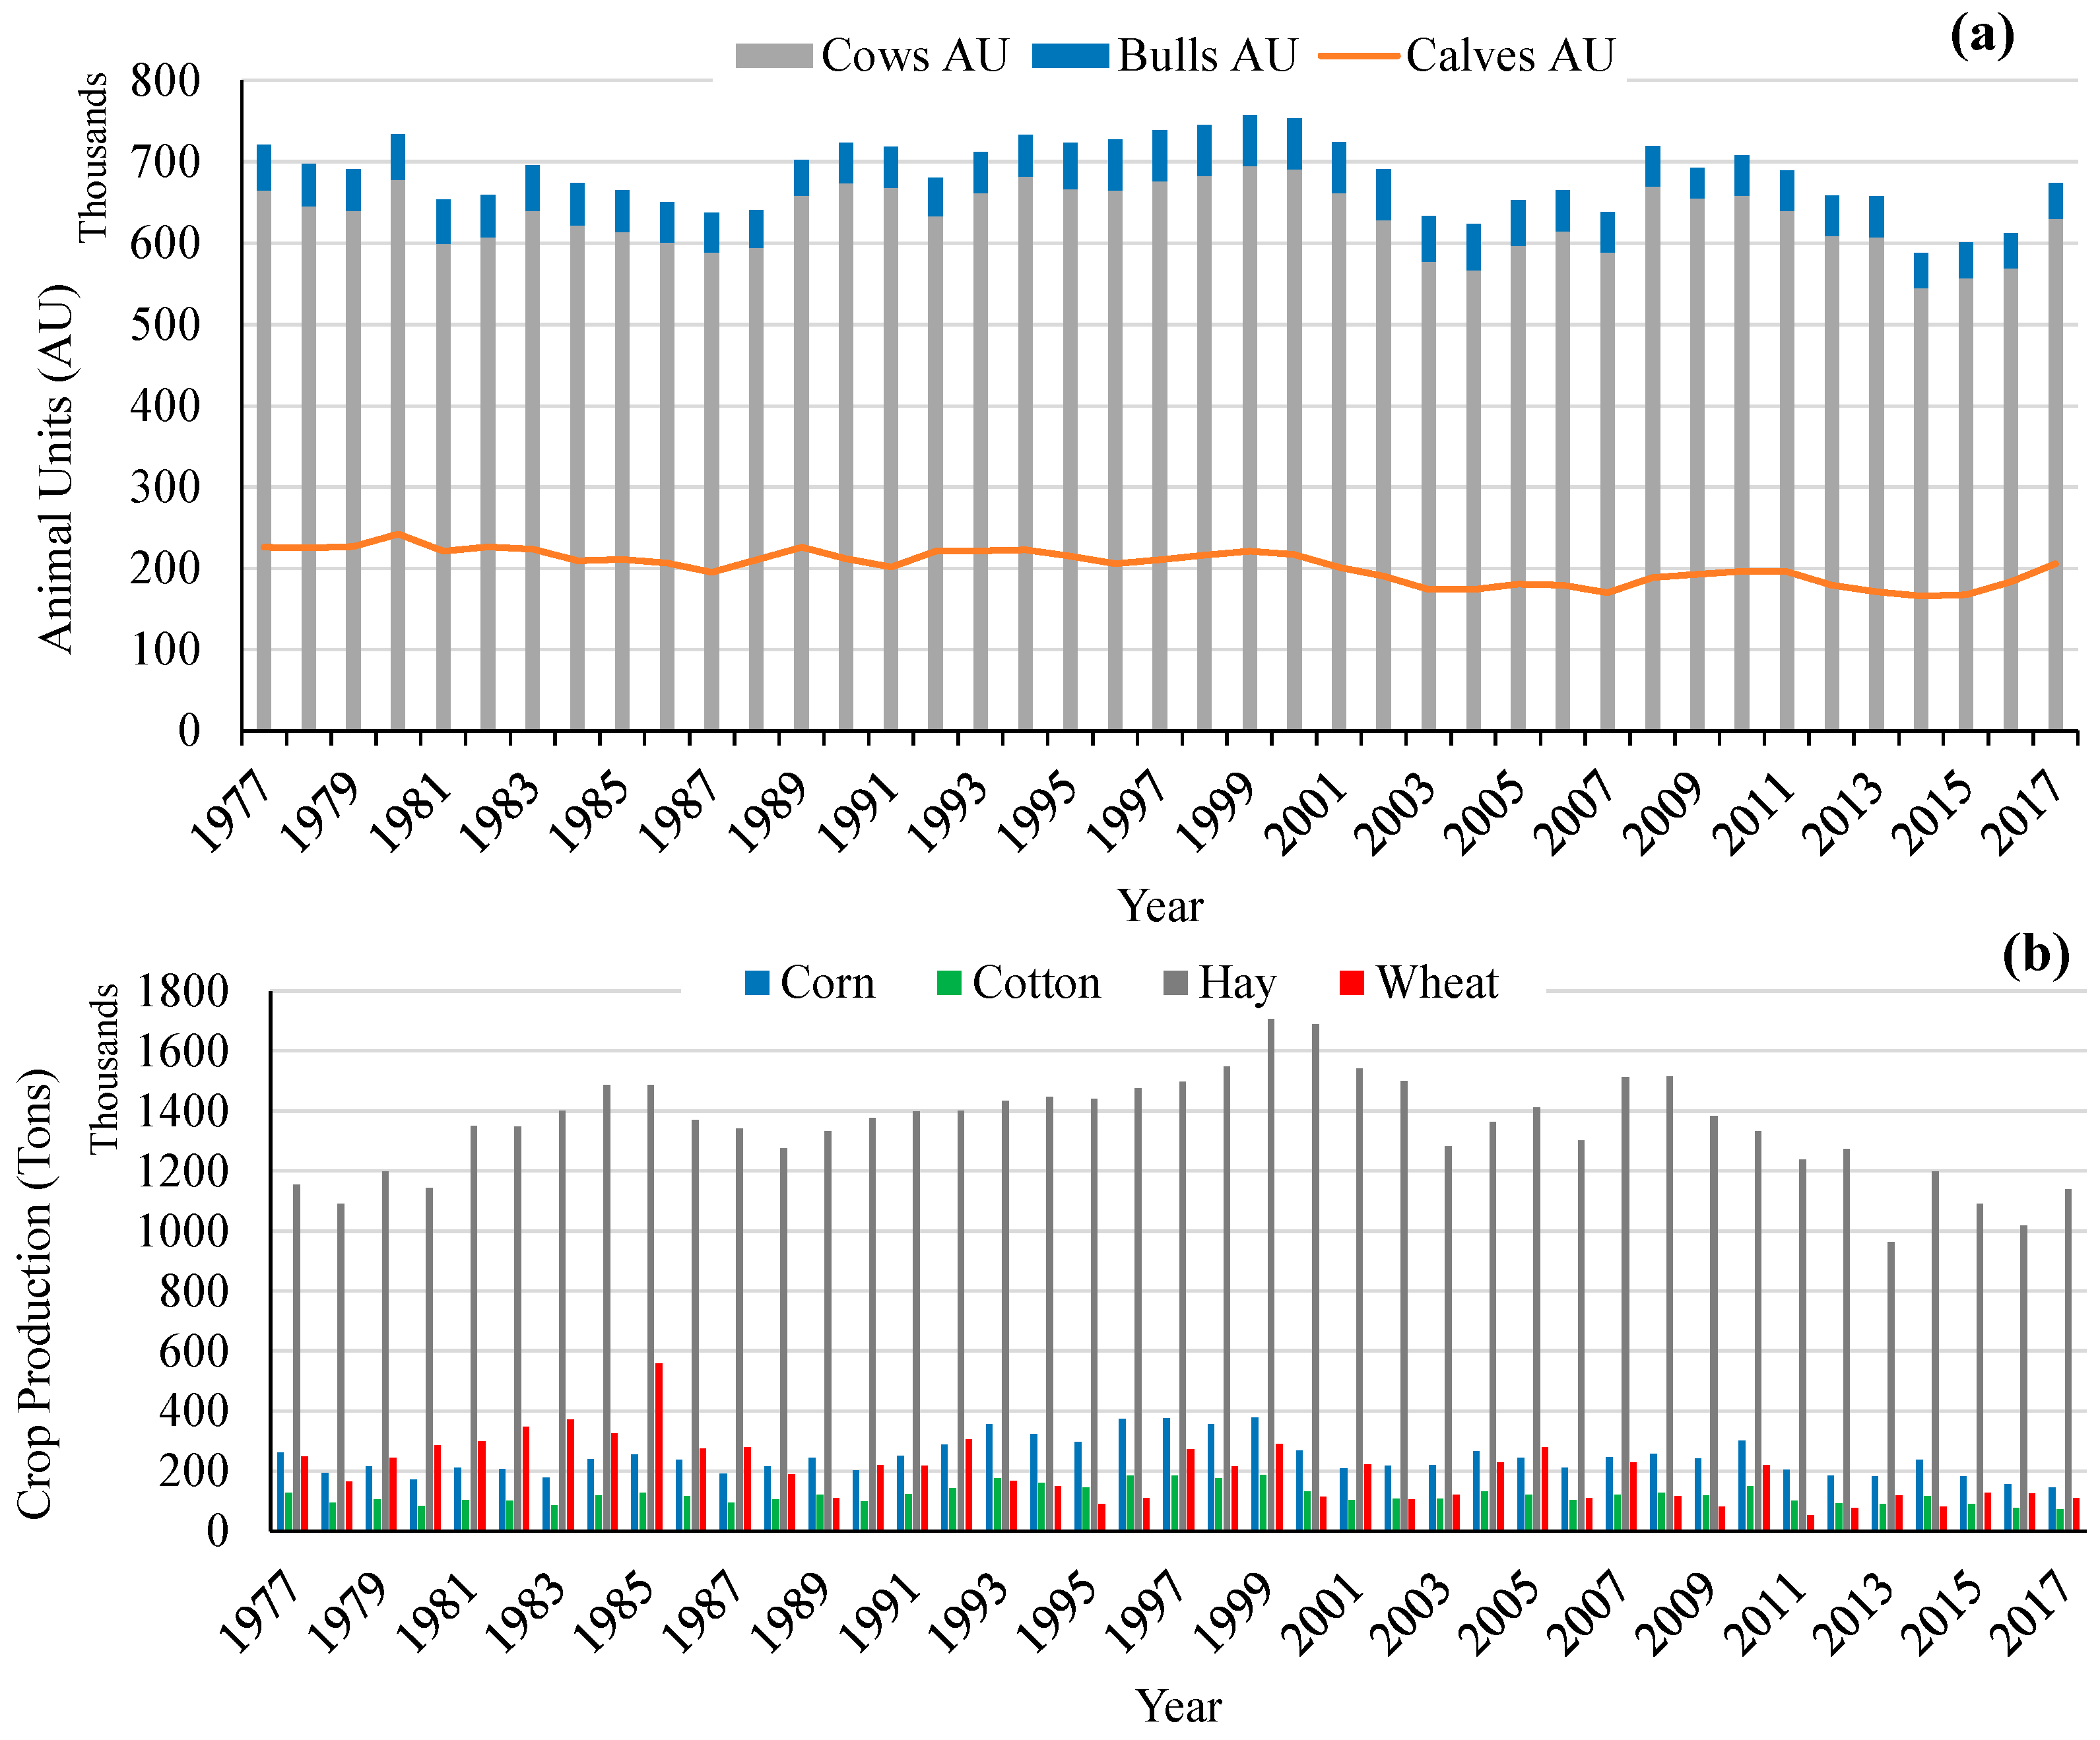
Statewide inventory of beef cows, bulls, calf crop and major crops (corn, cotton, hay, and wheat) used in the water footprint calculations were retrieved from the US Department of Agriculture−National Agricultural Statistics Service databases [19] for the 1977−2017 period (Figure 2). The exported number of beef cattle were retrieved from New Mexico Livestock Board [28]. All animal data were converted to animal units (AU), defined as a 454 kg cow and her calf of up to 6 months of age [23]. AU conversions for each category (bulls, weaned calves, yearlings) were based on expected weight-derived dry matter intake of each compared to the predicted intake of a 454 kg cow. Blue water footprints in (L/kg) and (m3/year) for main NM crops (corn, cotton, hay, and wheat), some of which are used to provide feed for beef cattle, were retrieved from Marston et al. [29]. The area of vegetation cover including shrub, tree, and perennial forb and grass was obtained from remotely sensed-based data retrieved from the Rangeland Analysis Platform—a monitoring tool for rangeland productivity [30,31,32] for the entire state of New Mexico. This data was used to estimate the total production of standing forage over rangelands.
2.4. Beef Cattle Water Footprint (WF)
The total water footprint of beef cattle (WFbeef) which can be represented in liters of water per kg of meat (L/kgmeat) is a function of the water required to produce the feed (WFfeed) in liters of water per kg of feed (L/kgfeed) and the water consumed directly by the animal as drinking water (WFdrink) in liters of water per animal head (L/head), shown in Equation (1) as
where WFfeed is the amount of water used to produce the feed consumed by beef cattle (L/kgfeed, feed water footprint). Based on NM’s beef production systems, the total water footprint of beef cattle (WFbeef) can be partitioned into the green (GWF) and blue water footprint (BWF) as shown in Table 1.
2.4.1. Green Water Footprint
To estimate the total amount of GWF, it was assumed that the cow-calf operations were the only phase of beef production in New Mexico that relies on rangeland forages (see below) and, therefore, represents the only production phase that uses green water (Figure 1). The total annual beef cow AUs were calculated using the national average beef cow weights retrieved from the USDA-NASS [19], as the average weight of beef cows in NM was not available. Bull weights were also not available; therefore, to convert bull numbers to AU a conversion factor of 1.25 AU was assumed for each bull [23]. The total AUs were calculated by adding those corresponding to beef cows and bulls. The annual feed requirements (AUYrequirements) were calculated for each AU using a 2% of their body weight as their daily dry matter feed requirements, which was considered as 3311 kg feed per AUY (3311 kg DM/AUY) as suggested by Holechek et al. [23]. The offtake from cow-calf operations (AUYcow-calf offtake) was calculated as 0.4 AU for each weaned calf, which equals 118 kg of meat at 65% dressing percentage [33].
The total water footprint for the standing forage (WFstanding forage) consumed per grazing animal was calculated based on forage Net Primary Productivity. The total annual Aboveground Net Primary Production (ANPP) in grams per square meter (gram/m2) was estimated as a function of the annual precipitation (APPT) in (mm) following the model proposed by Sala et al. [34], as ANPP = 0.6 (APPT-56). The annual forage production of NM’s rangelands was calculated by multiplying the ANPP by the total area of NM weighted by the fraction of the cover that is considered as rangeland [35]. To estimate the amount of precipitation needed to produce 1 kg of forage, the total amount of annual precipitation in cubic meters over the rangeland area was divided by the total forage production in kg—which represents a direct estimate of the water footprint of the standing forage.
The total water footprint per AUY (WFAUY) was estimated by multiplying the water footprint of standing rangeland forage by the AUYrequirements in kg forage per AUY as shown in Equation (2). In order to calculate the GWF per kg of meat produced (L/kgmeat) for the cow-calf operation phase, the total water footprint per AUY was divided by the per capita offtake (AUYcow-calf offtake) as shown in Equation (3).
where WFstanding forage is the amount of water (in this case from precipitation) needed to grow 1 kg of standing rangeland forage in L/kg, and AUYrequirement is the total amount of feed required per AU per year in kg (i.e., 3311 kg per AUY).
2.4.2. Blue Water Footprint
Cow-Calf Phase
The calculation of the BWF of feed supplements that were provided each year in the cow-calf operations required several assumptions that are applicable to NM’s beef cattle production systems. The amount of feed supplement provided to beef cattle on rangeland depends on annual precipitation. Thus, less feed supplement is needed during years with higher than above average precipitation amounts, whereas more is required in drought years. It was assumed that each AU require 1.36 kg of feed supplement per day. It was also assumed that cattle were supplemented with commonly used ‘range cubes’ [36] for 2, 3 and 4 months each year on good (above long-term average annual precipitation), average, and drought (<75% the long average annual precipitation) years, respectively. Feed supplement composition was based on cubes that consist of an average of (commonly used) 20% and 32% crude protein content (i.e., range cubes). Each kg of supplement contains on average 39% cottonseed meal, 15% soybean hulls, 23% wheat middlings, 6% cottonseed hulls, and 17% dried distillers grains [36]. Water footprint for a kg of supplement (BWFsupplement, L/kgsupplement) was calculated based on its composition by multiplying the percentage of each component by its water footprint, as shown in Table 2 and Equation (4). To estimate the water footprint of feed supplements for each AUY (we assumed that all ingredients were grown in New Mexico), the total amount of feed supplements used was multiplied by the water footprint for each kg of supplement (Equation (5)). The BWF of supplement for each kg of beef meat (L/kgmeat) was calculated by dividing the total water footprint of supplements for each AUY by the offtake rate (Equation (6)).
where BWFsupplement is the amount of water (i.e., water footprint) needed or used to produce a kg of supplement (L/kgsupplement); WFcottonseed meal, WFsoybean hulls, WFwheat middlings, WFcottonseed hulls, and WFdried distillers grains are the amount of water needed (or used) to produce the individual constituents in a protein cube; and BWFcow-calf supplement is the blue water footprint for supplemental feed used by beef cattle during the cow-calf phase.
Drinking water consumed by livestock in cow-calf operations was calculated following the model of Beckett and Oltjen [41], as shown in Equation (7):
where water intake is the total water intake per head (L), weight is the animal weight (kg), temperature is the air temperature (°C); a, b1, and b2 are the regression parameters.
The regression coefficients in Equation (7) differ based on animal classes (cattle on maintenance rations, cows nursing calves, pregnant cows, growing calves, bulls, Table 3). The yearly predicted total water intake for all AUs was calculated as the sum of: (1) cows with calves (85% of cow AUs) times the water consumption for lactating cows for 4 months of the year; (2) cows without calves (15% of cow AUs) times the water consumption for maintenance animals for 4 months of the year; (3) pregnant cows (92% of cow AUs) times the water consumption for pregnant cows for 8 months of the year; (4) non-pregnant cows (8% of cows AU) times the water consumption for maintenance cows for 8 months of the year; (5) calf AUs times the water consumption for growing calves for 205 days; and (6) bull AUs times the water consumption for bulls for 12 months of the year [41].
The calculated water intake (Equation (7)) was adjusted by subtracting the amount of water contained in the forage. An average of 25% water content was assumed to be the amount of water contained in the forage [41].
The BWF of drinking water (BWFcow-calf drink) for each kg of meat produced (L/kgmeat) was calculated by dividing direct water consumption for each AUY (AUYdrinking water) by the offtake from each AU (AUYcow-calf offtake) (Equation (8)). The total BWF for each kg of meat produced (BWFcow-calf total) (L/kgmeat) in the cow-calf operation stage was calculated by adding the BWF of the feed supplement (BWFcow-calf supplement) and the BWF of drinking water (BWFcow-calf drink) (Equation (9)).
Backgrounding/Stocker Phase
Although some rangeland-based stocker operations exist in NE New Mexico, the majority of backgrounding occurs on irrigated pasture. To calculate weight gains and time on irrigated pasture, it was assumed that weaned calves grazed on irrigated winter wheat and alfalfa pastures after weaning at 0.4 AU (or 182 kg) until they reached 0.6 AU (or 272 kg) and used an 8:1 feed conversion ratio. Based on these assumptions, each animal would consume 720 kg of dry matter forage, which was assumed to consist of 50% winter wheat and 50% alfalfa [42]. The offtake from the backgrounding/stocker operation was considered to be 58.5 kg meat per head, which was calculated as 65% dressing percentage of the 90 kg of live weight that animals gained during this period. The BWF (L/kgmeat) from the forage consumed by the animals in backgrounding/stocker operations was calculated by dividing the total water footprint of forage (L/kgforage) as explained in Equations (10) and (11), and Table 3 by the offtake (Equation (12)).
where BWFforage is the blue water footprint of the forage consumed by calves in the background/stoker phase (L/kgmeat); WFwinter wheat and WFalfalfa are the water footprint of grazed winter wheat and alfalfa, respectively; BWFAU forage is the total blue water footprint consumed based on feed requirements by all AU.
The drinking water intake was calculated as 4 L/kg of dry matter intake following Sweeten et al. [43]. This amount was added to the forage water footprint to estimate the overall BWF for stockers.
Feedlot Phase
It was assumed that cattle would gain 318 kg (from 0.6 to 1.3 AU) at a 5:1 feed conversion ratio. Feedlot ration was assumed to be 12% alfalfa hay, 60% corn, 8% distiller grains, and 20% other feed crops and minerals [42]. The offtake from the feedlot (AUfeedlot offtake) operation was considered to be 206.7 kg meat per head, which was calculated using 65% dressing percentage of the 318 kg live weight an animal gains during this period. The water footprint (L/kgmeat) from the feed consumed by cattle in the feedlot (BWFfeedlot feed) was calculated by dividing the total water footprint of feed (L/kgfeed) (Equations (13) and (14), Table 2) by the offtake (Equation (15)).
where BWFfeed is the blue water footprint for all feed consumed by cattle (L/kgmeat); WFalfalfa hay, WFcorn, WFdistiller grains, and WFother blue water of feed components consumed by cattle—alfalfa, corn, distiller grains, and other (L/kgmeat); and BWFAU feed the total blue water footprint of feed consumed by all AU.
As with stockers, drinking water intake of feedlot animals was calculated as 4 L/kg of dry matter intake following Sweeten et al. [43]. This amount was added to the feed water footprint to calculate the overall BWF for feedlot animals.
2.4.3. Overall Water Footprint of Beef Production in NM
The overall water footprint of beef (L/kgmeat) for New Mexico’s beef production systems was calculated based on a weighted average of the water footprint of each of the three phases of beef production (i.e., cow-calf, backgrounding/stocker, feedlot). The weights were based on the relative percentage of offtake as represented in terms of kg of meat per head (kgmeat/head) contributed by each phase. These weights, as shown in Table 4, are 31% (or 0.4 AU), 15% (or 0.2 AU), and 54% (or 0.7 AU) relative to 1.25 AU from cow-calf, backgrounding/stocker, and feedlot, respectively.
2.4.4. Sensitivity Analysis
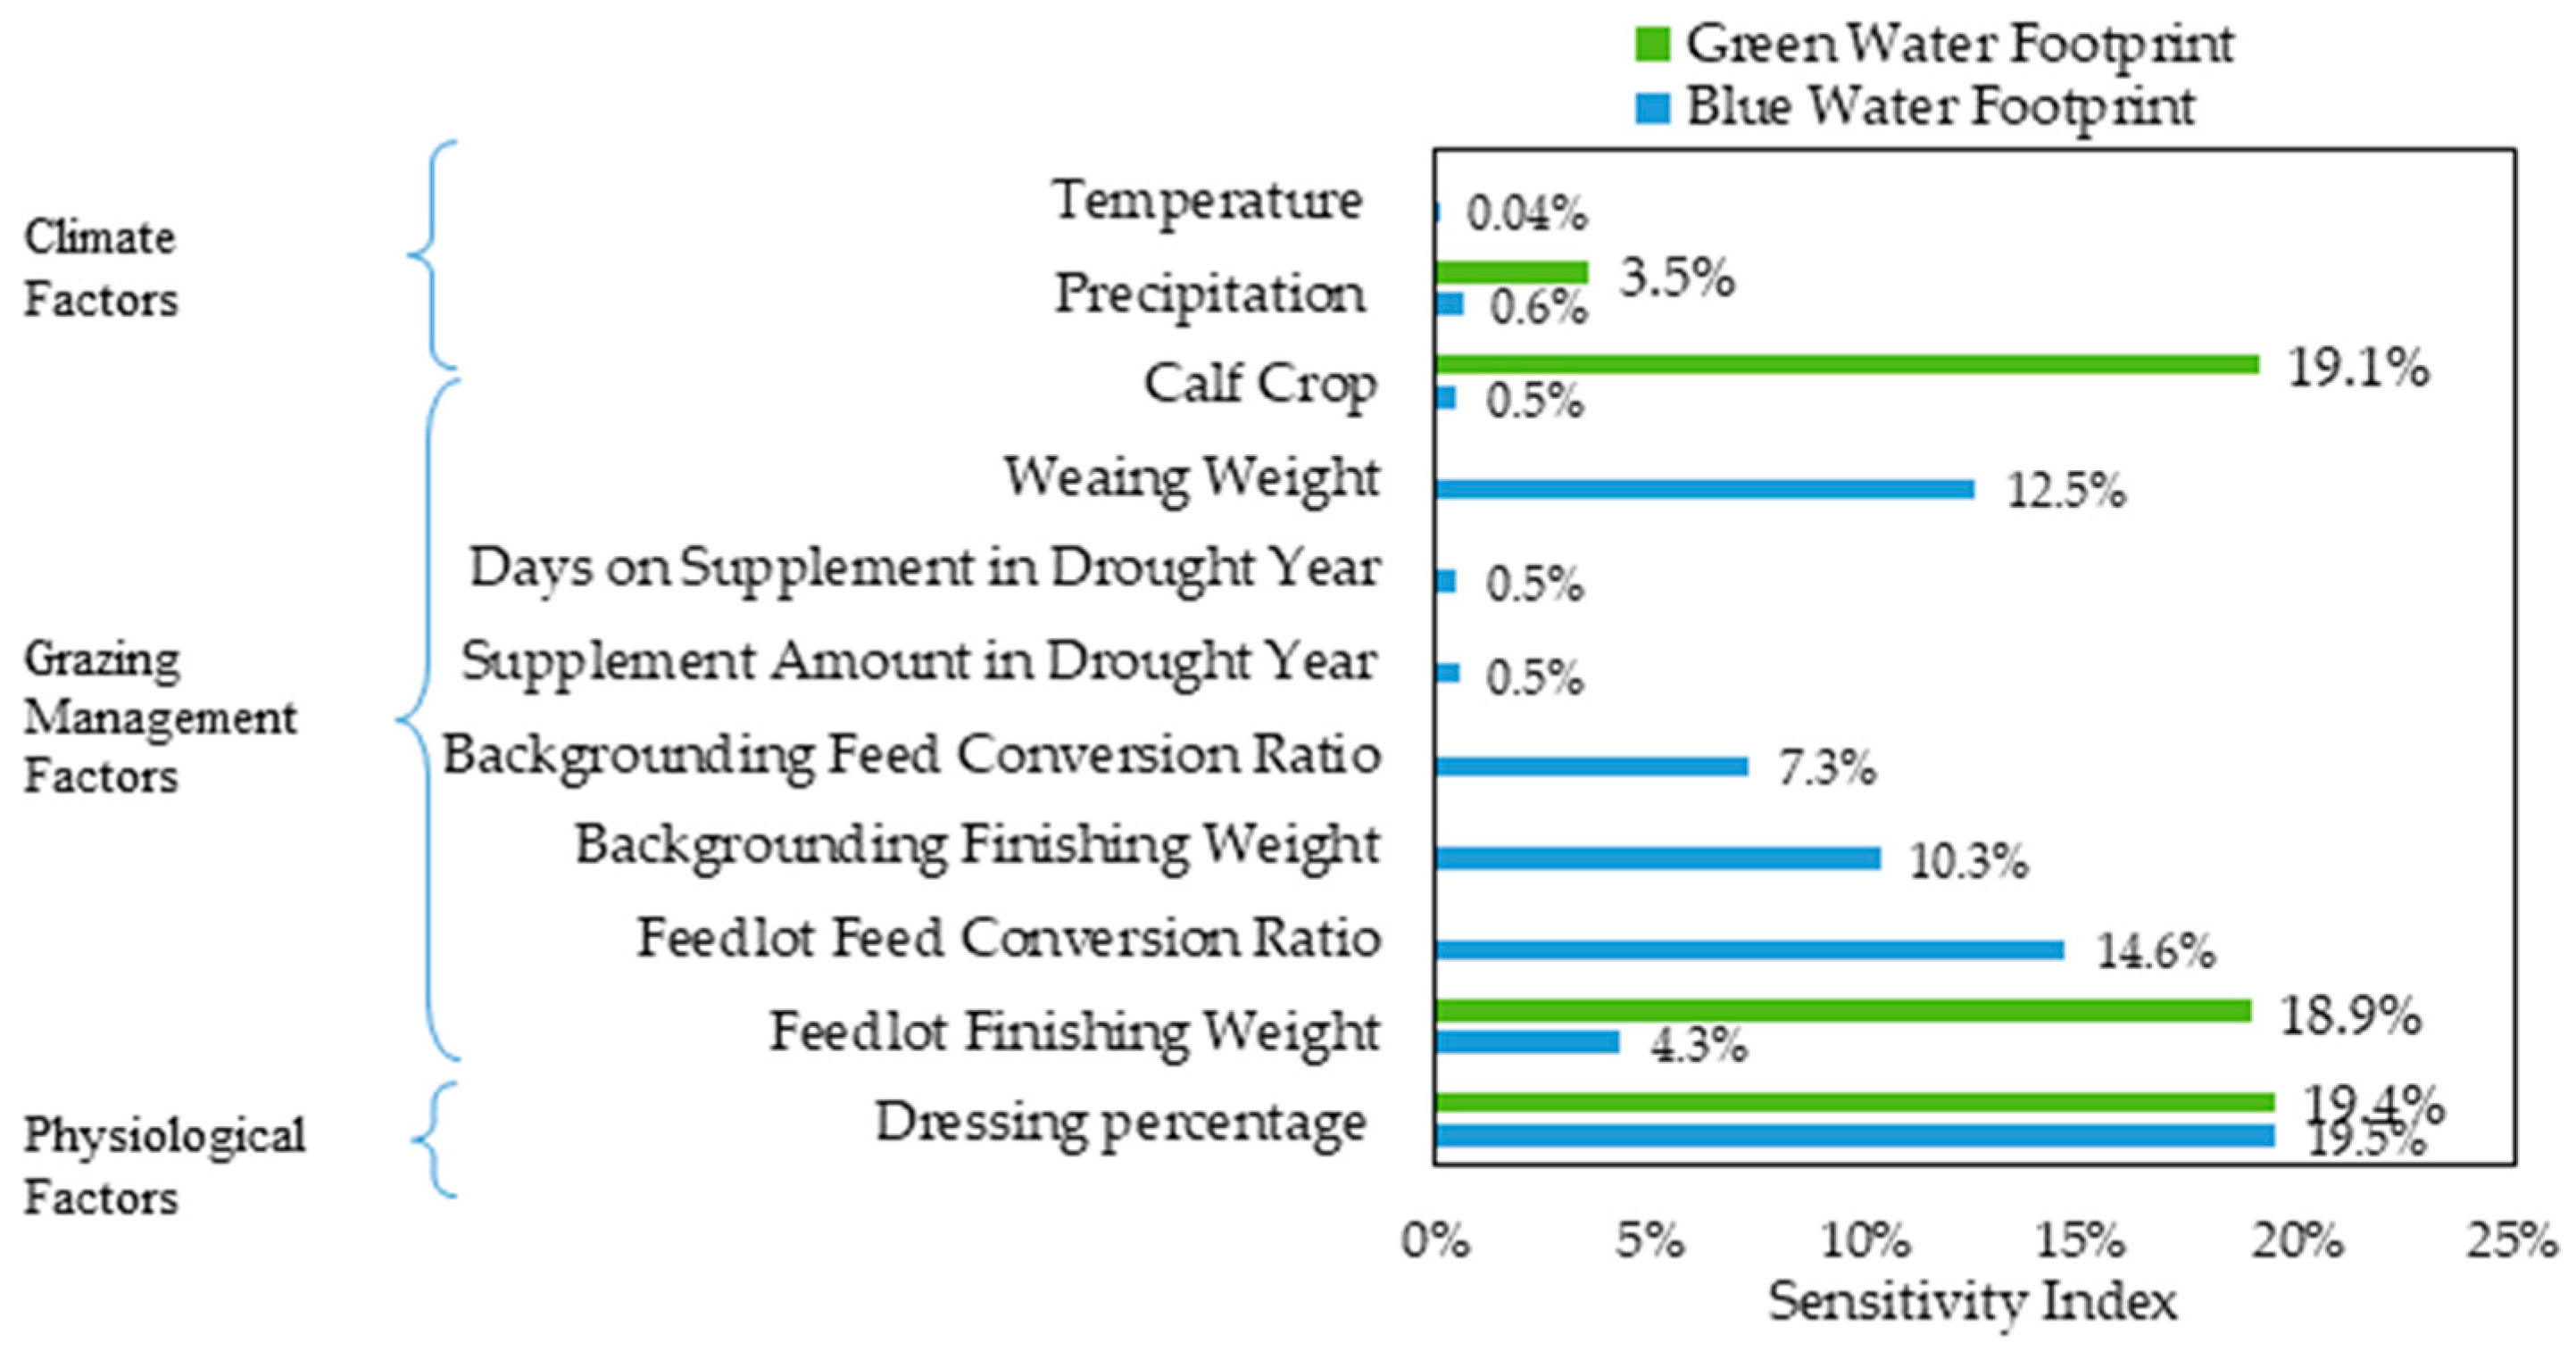
To determine how different factors can affect the water footprint of beef production, a sensitivity analysis was conducted using the sensitivity index as described in Hamby [44]. The sensitivity index was calculated as a percentage of the output difference resulting from a ±10% change in the model input factors [45]. The list of factors considered in the sensitivity analysis included air temperature, precipitation, calf crop, weaning weight, numbers of days on the supplement and the supplement amount during a drought year, feed conversion ratio and finishing weight during backgrounding and feedlot phases, and the dressing percentage.
2.5. The Total Blue Water Use of Beef and Crops
Blue water footprint calculations (L/kgmeat) described in previous sections were used to calculate total water use (m3/year) of beef production in NM. To do this we assumed that: (a) all calves are weaned in the state; (b) 26% of the calves are backgrounded in the state; and (c) 19% of calves finished in the state. These assumptions were made based on the number of exported beef cattle reported by New Mexico Livestock Board [28]. Cow-calf ranchers in NM typically breed their cows in late spring so that calving occurs in late winter to early spring and weaning takes place in the fall (October–November). During drought years, ranchers often chose to wean calves early, typically during the summer. Thus, we assumed that the inventory of cattle exported from January to May were yearlings that had been born and backgrounded in NM, and were then exported for finishing out of state, while those exported from June to December were calves weaned in NM and exported for backgrounding and finishing outside of state lines.
Blue water footprint (L/kg) for main NM’s crops (corn, cotton, hay, and wheat) were retrieved from Marston et al. [29] and were used to estimate blue water use (m3/year) for each crop. Annual crop production for the entire state of NM was multiplied by its BWF (L/kg) for the period from 1977 to 2017. Marston et al. [29] used the dynamic water balance model developed by Mekonnen and Hoekstra [39] to estimate the water footprint of crops. These estimates were considered conservative because the model accounts for the evapotranspiration (ET) requirement only, but not for other potential consumptive water uses such as evaporation losses from irrigation reservoirs and distribution canals. However, these sources of water loss (use) are considered to be very small in relation to a crop’s ET requirements. Therefore, we considered the Marston et al. [29] blue water footprint estimates for main NM crops (corn, cotton, hay, and wheat) to be reasonable and consequently used them to conduct comparisons with our estimates of beef production BWF.
3. Results and Discussion
3.1. Water Footprint of Beef Production
Our estimates of the average water footprint of NM’s beef production were 28,203 L/kgmeat, the majority of which was accounted for by green (precipitation) water as it represented about 82% or 23,063 L/kgmeat used by rangeland forages (Table 4). Blue water accounted for only 18% (or 5140 L/kgmeat) of the total beef WF estimate (Table 4). The relative contribution of green and blue water varied significantly among the different phases of beef production. In cow-calf operations, green water accounted for 99.5% of the WF, whereas blue water accounted for 100% of beef WF during backgrounding and feedlot production phases.
These numbers highlight the importance of NM’s rangeland for the sustainability of its beef production systems. At the same time, it provides an indication of vulnerability of these systems to variable precipitation—and increased temperature as indicated in [46,47], though the model [34] used in this analysis to calculate forage production was dependent only on precipitation. The need for more GW in this type of production system is due to the amount of precipitation needed to produce 1 kg of standing forage compared to the amount of BW needed to produce 1 kg of grain used in feedlot. This is most likely due to the fact that the feed conversion ratio for grain is higher than that of forage. Both factors—precipitation and temperature—can affect rangeland productivity (i.e., standing forage) thus further analysis is needed to address their effect on grazing capacity, stoking rate, and forage availability (average productivity in kg per hectare). To maintain the estimated GWF (i.e., meet the feed requirements), the number of animals in a hectare of land would need to be reduced given the projected trends in temperature, precipitation, and aridity index [48]. In other words, more hectares of rangeland per animal would be needed (i.e., or reduce the number of animals that can graze in a hectare) to sustain the current level of beef cattle production.
Similarly, more BW is needed in the backgrounding phase compared to that of feedlot finishing if calves in the backgrounding phase mostly graze irrigated forage pastures which need more blue water to grow, their feed conversion ratio is lower than that of grain, and their moisture content is higher than grain.
Estimates of beef cattle WF in the US ranged from as low as 1763 L/kgmeat [49] to about 100,000 L/kgmeat [50]. It would be challenging to provide a consistent comparison across different studies for the total WF due to the wide range of assumptions made to produce these estimates. The comparisons described below should be carefully considered as several studies included only BW in their estimates, while others developed estimates for systems that do not include the use of rangeland forages (GWF) in any stage of the beef production process. The study by [45], which did not consider GWF, found that the average BWF was about 5040 L/kgmeat for the southern US region with a minimum and maximum values of 1359 and 14,771 L/kgmeat, respectively. The study by [40] indicated that the total WF for the USA on average is about 20,217 L/kg with the green, blue, and grey WF is about 94.5, 2.6 and 2.9%, respectively.
3.2. Sensitivity Analysis
3.2.1. Green Water Footprint
It appeared that the GWF was mostly sensitive to the dressing percentage, calf crop, and feedlot finishing weight with an observed lesser sensitivity to precipitation as each has contributed to 19.4, 19.1, 18.9, and 3.5% change in GWF (Figure 3).
The GWF estimate could potentially be decreased (i.e., conserved) by ≈2100 L/kgmeat or 9% by increasing the dressing percentage, calf crop, and feedlot finishing weight by 10%. Decreasing these factors by 10% could potentially result in increasing the GWF estimate by ≈2700 L/kgmeat or 12%. Since the cow-calf operations were the only production phase that uses green water, therefore the offtake at the cow-calf operations was directly affected by the change in dressing percentage and calf crop, and indirectly by the changes in feedlot finishing weight. This indirect effect occurred because the percentage of the offtake at the cow-calf phase from the total offtake decreases as feedlot finishing weight increases and vice versa.
3.2.2. Blue Water Footprint
The BWF of NM beef production was highly sensitive to weaning weights (cow-calf phase), final weight in backgrounding phase, feed conversion ratio in the feedlot phase, and dressing percentage, each of which changed the BWF by 12.5%; 10.3%; 14.6%; and 19.5% respectively (Figure 3). The BWF showed moderate sensitivity to feed conversion ratio during backgrounding (7.3%) and finishing weight in the feedlot phase (4.3%). The BWF was almost unaffected (<1%) by changes in the value of all other parameters in our water footprint model for New Mexico (Figure 1) which is consistent with results reported by Beckett and Oltjen [41].
The BWF estimate was most sensitive to dressing percentage, which is a measure of the hot carcass weight relative to the weight of a live animal. A 10% increase in dressing percentage could potentially decrease the BWF by 474 L/kgmeat or 9%. Decreasing the dressing percentage by 10% could increase the BWF by 653 L/kgmeat or 13%. This inverse relationship is due to the increased offtake in each slaughtered animal that occurs as a function of greater dressing percentage, which could therefore aid in conserving BW. Dressing percentage in beef cattle is affected by a number of genetic (breed, sex) and non-genetic (diet, age, gut fill) factors [51]. Therefore, opportunities exist to greatly improve water use efficiency in dryland beef production systems through genetic selection programs and management strategies that can lead to greater per capita offtake through increased dressing percentages.
This sensitivity analysis found two lesser, yet potentially relevant factors that include calf weaning weights and feedlot feed conversion ratios that can also influence blue water footprint of New Mexico’s beef production systems. For example, weaning calves that are slightly heavier (10% heavier) can result in reducing the BWF from 5140 to 4823 L/kgmeat or 6%, whereas improving feed conversion ratio in feedlot operations by 10% (i.e., 4.5:1 instead of 5:1) can result in a similar reduction in BWF from 5140 to 4803 L/kgmeat or 7% These findings are in agreement with those from Maré and Jordaan [52] that suggested that weaning heavier calves and improving feed conversion ratio in feedlot cattle have the potential to conserve blue water.
Feed conversion efficiencies in terms of kg of feed (dry mass) needed to produce one kg of output (meat) were 22.1, 12.3, and 7.7 kg for cow-calf, backgrounding, and feedlot operations, respectively. These results support our finding that the overall WF of each phase of beef production, is mostly a function of that of the feed used to raise and fatten cattle [53,54,55,56].
3.3. Blue Water Use by Beef Cattle and Crops
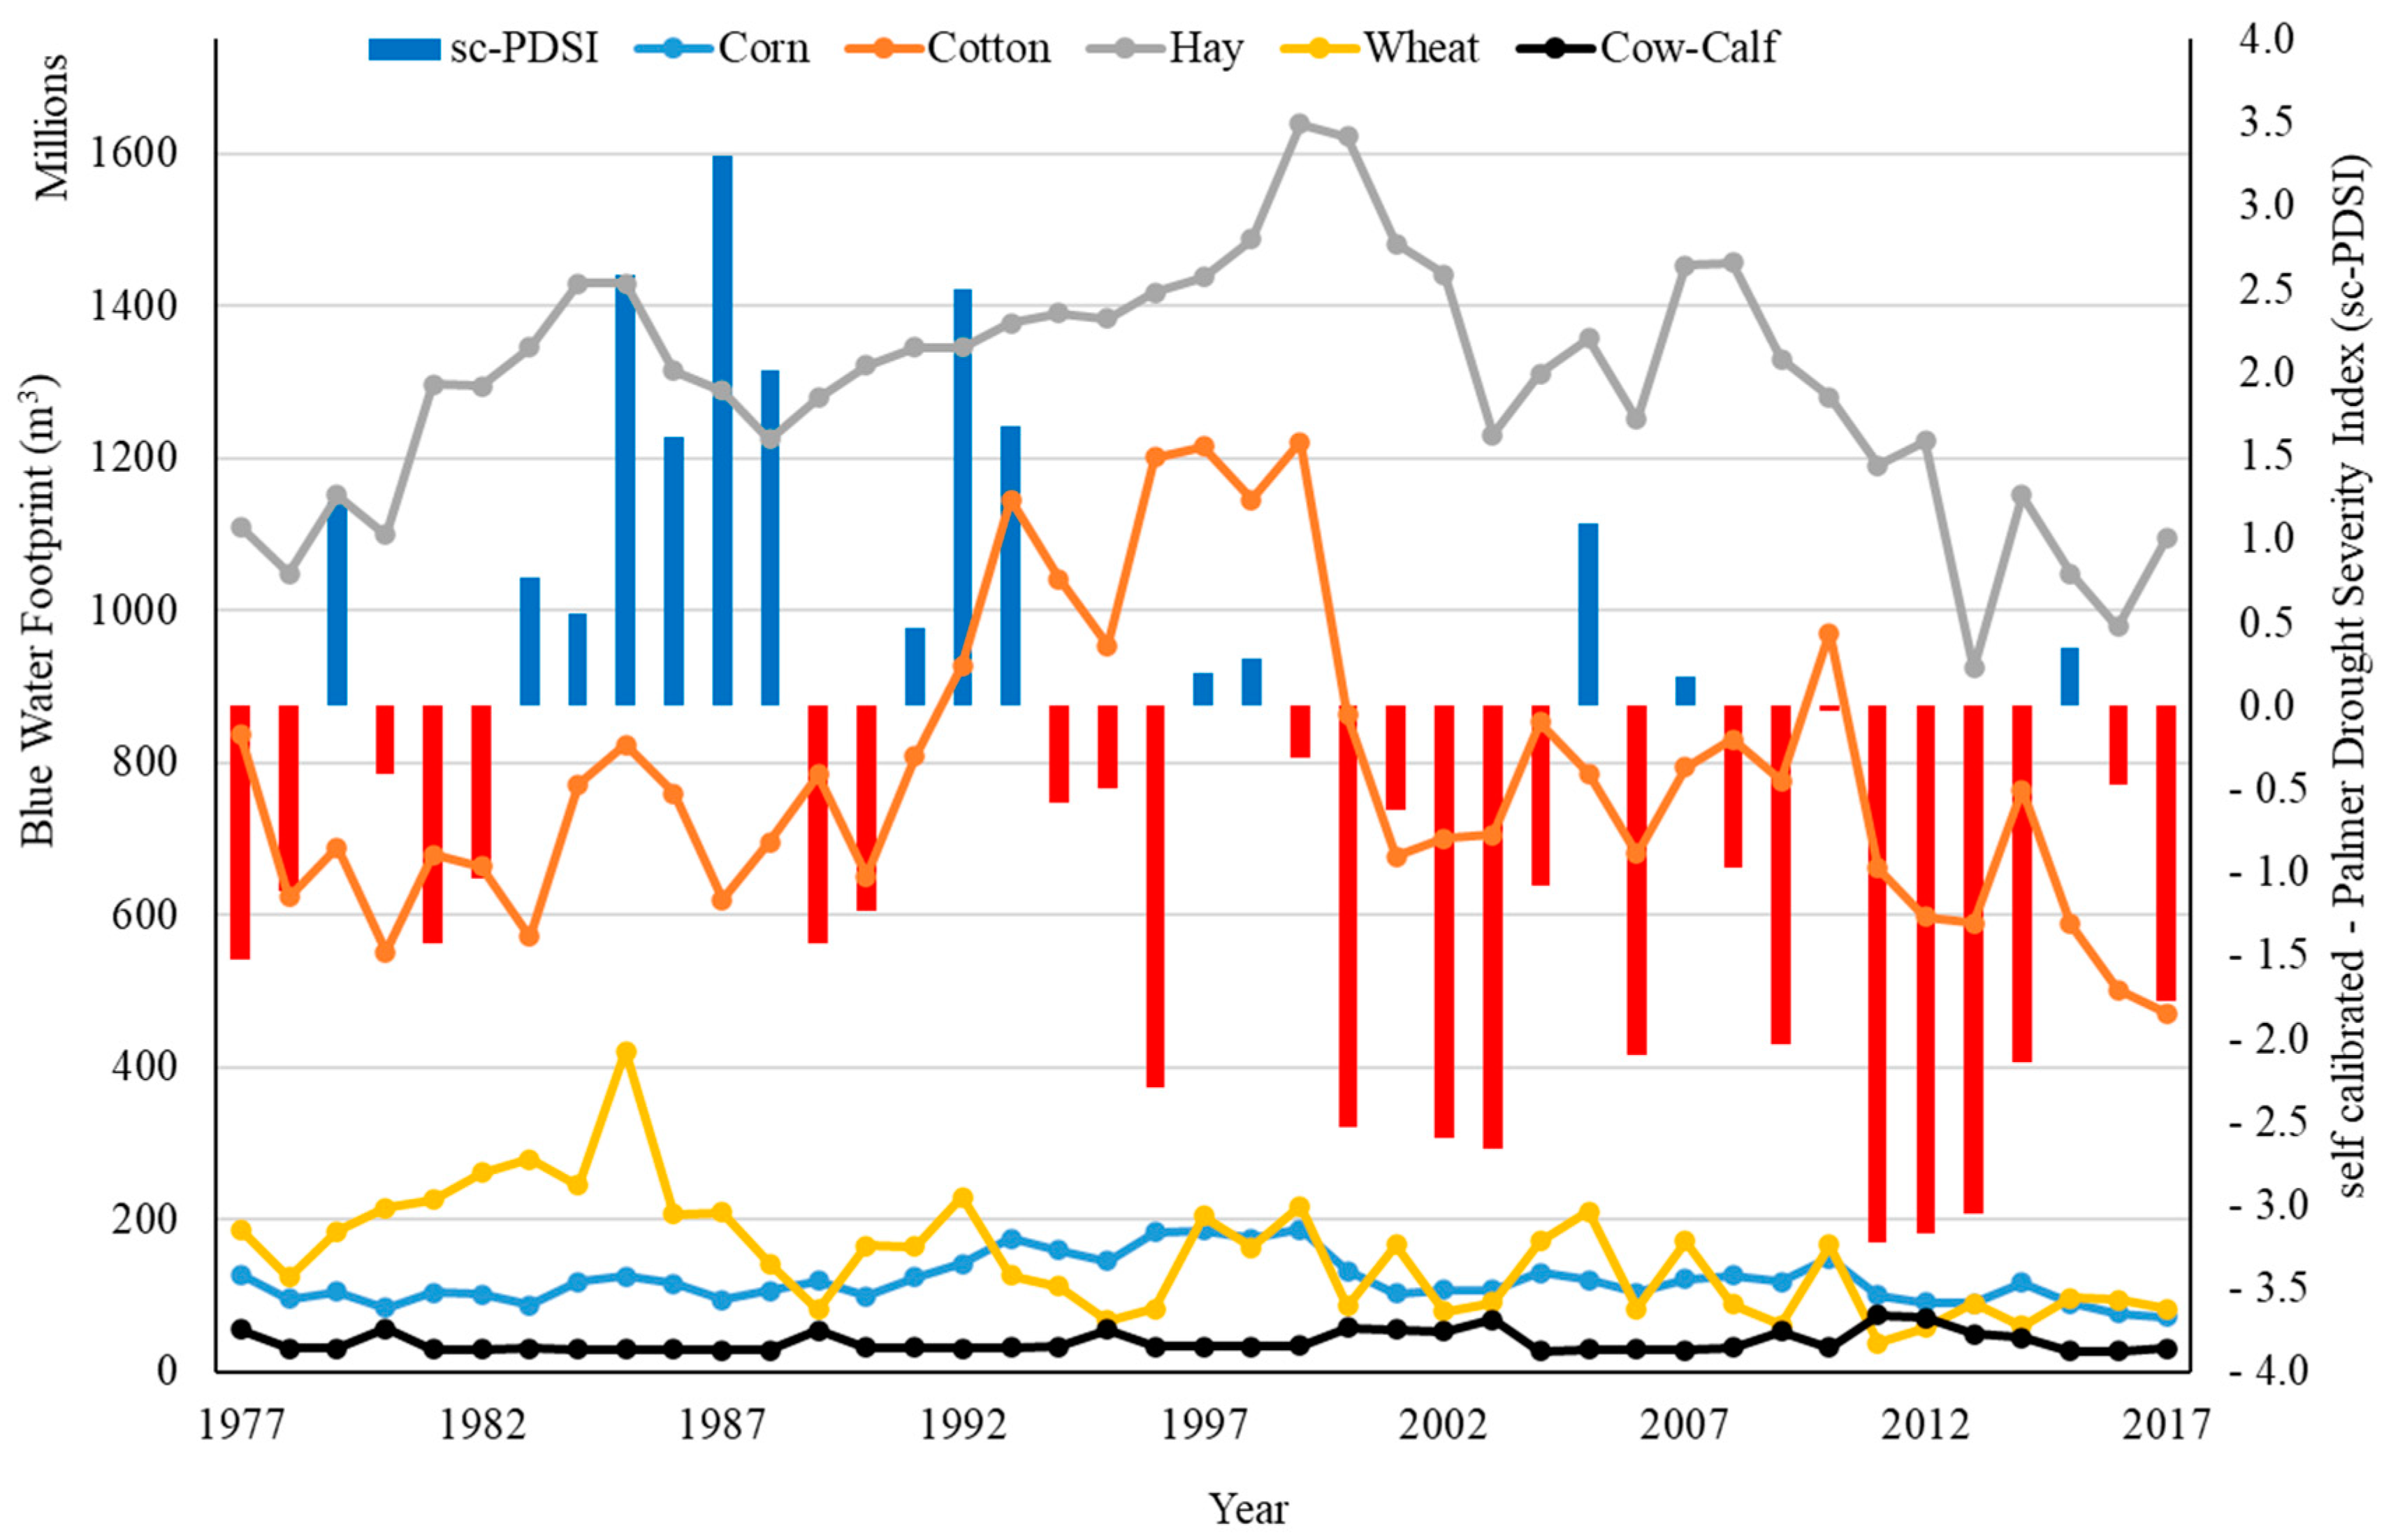
Estimates of blue water use for NM’s beef production and crops used as feeds are shown in Figure 4 for the 1977–2017 period. NM cow-calf operations represented a third (33%), or a quarter (26%) of the blue water (m3/year) used to produce corn or wheat, and only 5% or less of that used to produce cotton or hay (Figure 4). Crop production in New Mexico is only feasible with irrigation. The 40-year average (1977–2017) for blue water use by cow-calf operations (ranches) in NM according to our estimate was around 40 million m3/year compared to 1300, 786, 152, and 121 million m3/year used to grow hay, cotton, wheat, and corn, respectively, over the same period (Figure 4).
Based on our assumption that beef calves in NM are weaned at 0.4 AU (about 182 kg), which represents 118 kg of meat based on a 65% dressing percentage, one such calf requires around 44 m3 of blue water in the cow-calf phase, whereas 114, 771, 89, and 58 m3 of blue water are needed to produce the same amount (118 kg) of irrigated hay, cotton, wheat, and corn, respectively. It is not surprising therefore that in New Mexico, irrigation accounted for 84% of freshwater use in 2015 followed by public/domestic use (10%; Dieter et al. [57]). Mining, thermo-electric, livestock production, aquaculture, and industrial uses accounted for 2.0%, 1.2%, 1.1%, 0.9%, and 0.1%, respectively, in that same year.
It should also be recognized that backgrounding of weaned calves on rangeland can also occur in some ranches in the less arid areas of New Mexico. Our estimates suggest that this practice, where feasible, represents significant blue water savings. Although rangeland-finishing is still the exception rather than the rule in New Mexico, results reported by [58] suggest that this could be a viable alternative to further reduce the BWF of Southwestern beef production.
3.4. Drought, and BWF, GWF
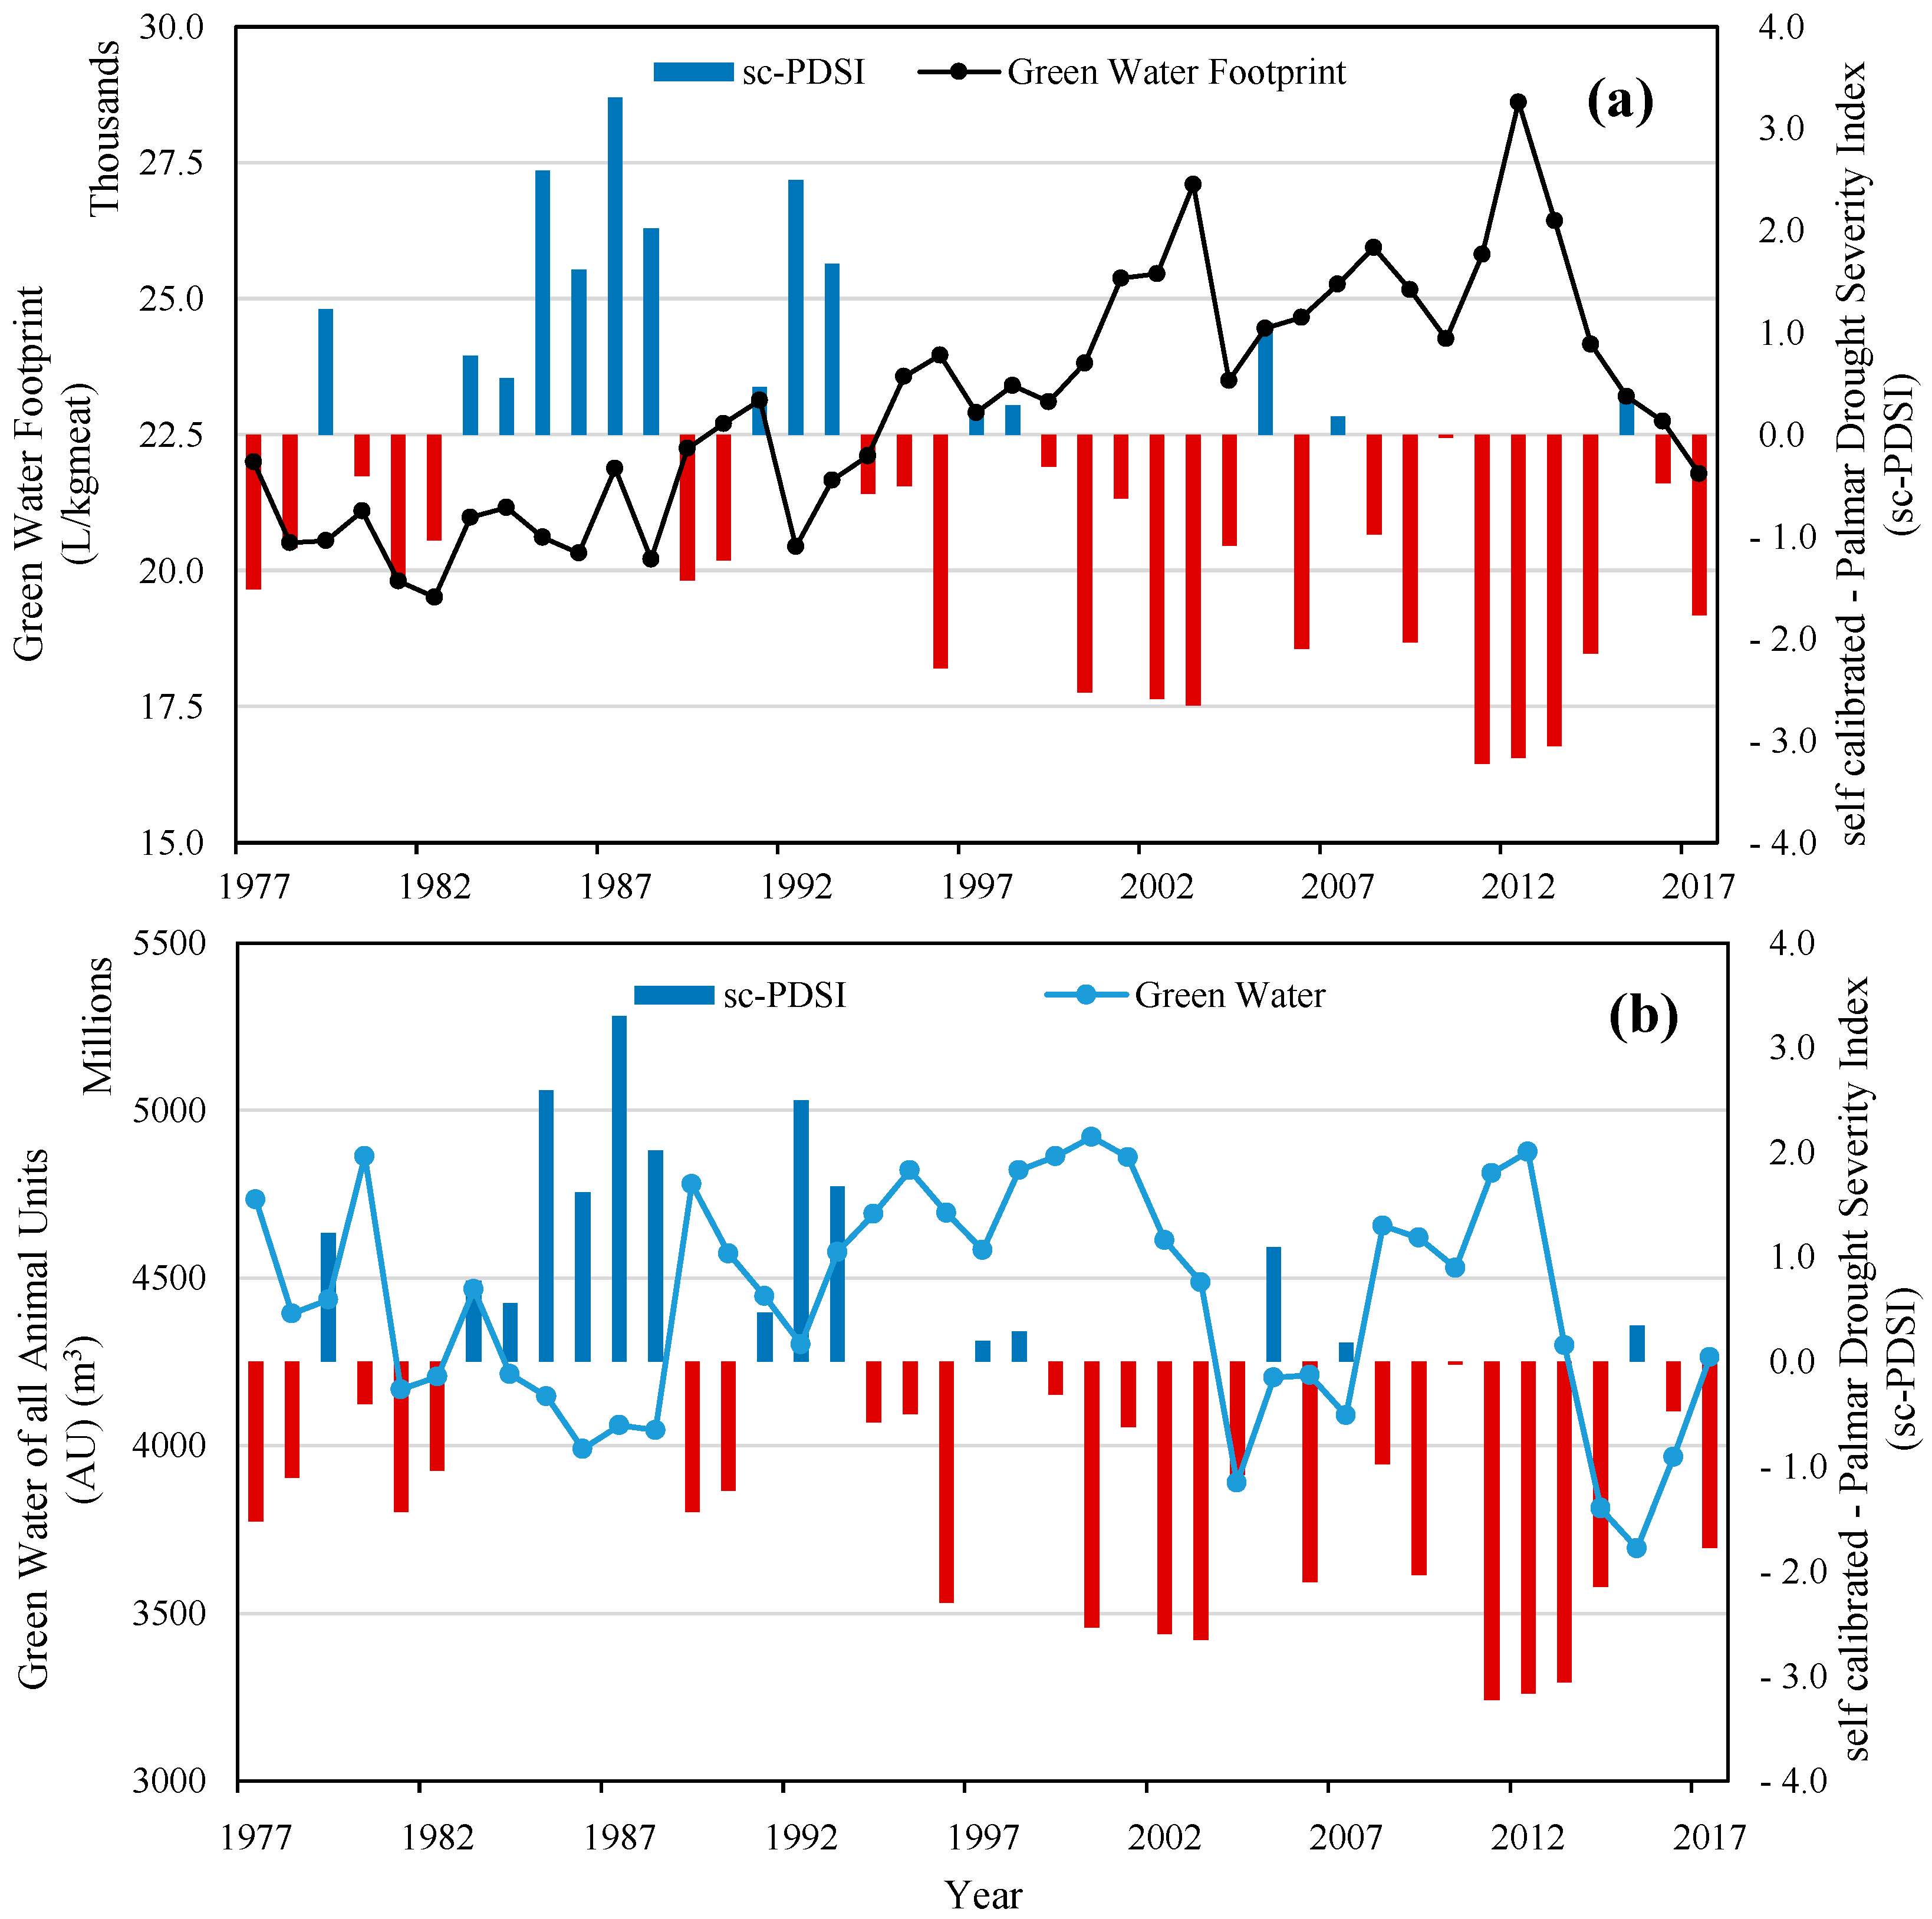
The correlation between the BWF of beef cattle at the cow-calf phase as well as some of the crops used in feed supplements and drought was evaluated to characterize the interannual variability of BWF relative to drought. A significant negative correlation between the BWF of cow-calf operations and sc-PDSI drought index (r = −0.63, p < 0.0001, Figure 5) is consistent with common grazing practices in the state. The BWF of this stage of beef production increased during drought years and decreased in years of above average precipitation, likely as a function of NM cattle inventory dynamics, which typically exhibit a time lag with regards to climate-exhibiting peaks in drought years and nadirs in wet years [20]. Although not captured by our analyses, increased amounts of supplement feed and lighter calf weaning weights in drought years—both of which have a strong to moderate effect on BWF—are likely to further increase the amount of BW needed to produce a pound of beef during a drought. Further analysis of how droughts impact the BWF of the entire beef production chain in NM is warranted. The sc-PDSI was not significantly correlated with BWF of crops except for wheat, whose BWF was positively correlated with sc-PDSI (r = 0.67, p < 0.0001, Figure 5).
New Mexico rangeland grazing capacity declined by 20% during 1976–2017 period compared to 1920–1975 [20]. This decline was associated with climate change, which resulted in more frequent and prolonged droughts [47]. Because of the time lag dynamics connecting water footprint and drought described above, the BWF of the cow-calf stage of arid land beef production is likely to increase. Sustainable extensification strategies involving the use of heritage cattle breeds that require less supplement feed inputs [59] could be used as an adaptation strategy in ranching systems of the desert Southwest [47].
It appeared that drought may affect GWF and the total GW consumed by rangeland beef cattle. These relationships between drought, sustainability of beef cattle production, reduced forage production and quality, and animal intake are important to understand. There was interannual variability in the calculated GWF, which can be due to many factors. It appeared that drought was negatively correlated with GWF (r = 0.35, p-value < 0.001)—meaning that as drought conditions improved the GWF decreased and vice versa. Similarly, drought was negatively correlated with the total GW (r = 0.125, p-value < 0.05).
4. Conclusions
The goal of this study was to assess the water use of beef cattle production systems in New Mexico, US using the water footprint concept. NM’s beef cattle production systems consist of three phases that include cow-calf, backgrounding/stocker, and feedlot and depend mainly on blue and green waters. This analysis indicated that the weighted average water footprint of New Mexico’s beef production was 28,203 L/kgmeat, the majority of which was accounted for by the green water as it represented about 82% due to the use of rangeland forages (Table 4). The blue water footprint accounted for 18% of the total water footprint of beef production, which was found to be relatively low compared to that of irrigated crops grown in New Mexico. The water footprint of beef production was sensitive to a number of production variables and management practices that can be adjusted or used as a guidance to develop practices to improve the sustainability of beef production and water use. For example, the significant dependence of the beef production on green water suggested the need to identifying potential management practices that allow to effectively reduce water use while simultaneously sustain production such as the introduction of new breeds that are adaptable to harsh environment conditions—drought, increased temperature—and consume less forage as well as improving grazing management. This study provides insights into how changes in climate may impact the southwestern US beef production systems and other agricultural commodities and supports policies that allow to better manage arid land scarce water resources. Our results provide criteria to guide the southwestern US ranchers to make better informed decisions regarding freshwater saving strategies associated with the types of cattle and external feed inputs provided.
Author Contributions
M.N.S. and A.F.C. conceived the idea for this paper. The first draft of the writing generated by M.N.S., A.F.C., H.M.E.G. and J.L.H. Tables and figures were generated by M.N.S. and H.M.E.G., M.N.S., H.M.E.G. and A.F.C. designed the model and the computational framework and analyzed the data. M.N.S. performed the calculations. The final paper was edited by M.N.S., A.F.C., H.M.E.G., J.L.H., S.S. and C.G. The final edits were compiled by M.N.S. and H.M.E.G. and converted the paper to the final format for this journal. All authors have read and agreed to the published version of the manuscript.
Funding
This research was funded with a grant from the National Science Foundation # 1739835 and # IIA-1301346 to Hatim Mohammed Eisa Geli and collaborators. Partial support was provided by the USDA National Institute of Food and Agriculture, Hatch Funds to Jerry Lee Holechek and Andres Francisco Cibils. SAS CAP grant #12726269 to Andres Francisco Cibils, Sheri Spiegal and Craig Gifford.
Conflicts of Interest
The authors declare no conflict of interest. The funders had no role in the design of the study; in the collection, analyses, or interpretation of data; in the writing of the manuscript, or in the decision to publish the results. Any opinions, findings, and conclusions or recommendations expressed in this material are those of the author(s) and do not necessarily reflect the views of the National Science Foundation.
References
- Searchinger, T.; Hanson, C.; Ranganathan, J.; Lipinski, B.; Waite, R.; Winterbottom, R.; Dinshaw, A.; Heimlich, R.; Boval, M.; Chemineau, P. Creating a Sustainable Food Future. A Menu of Solutions to Sustainably Feed More Than 9 Billion People by 2050. World Resources Report 2013–2014: Interim Findings; World Resources Institute: Washington, DC, USA, 2014. [Google Scholar]
- United Nations. World Population Prospects 2019 Highlights (ST/ESA/SER.A/423); United Nations: New York, NY, USA, 2019; p. 39. [Google Scholar]
- Steensland, A.; Thompson, T. 2020 Global Agricultural Productivity Report: Productivity in a Time of Pandemics; Virginia Tech College of Agriculture and Life Sciences: Blacksburg, VA, USA, 2020. [Google Scholar]
- Revell, B.J. One Man’s Meat… 2050? Ruminations on Future Meat Demand in the Context of Global Warming. J. Agric. Econ. 2015, 66, 573–614. [Google Scholar] [CrossRef]
- Alexandratos, N.; Bruinsma, J. World Agriculture towards 2030/2050: The 2012 Revision. Available online: https://ageconsearch.umn.edu/record/288998 (accessed on 8 June 2021).
- Spiegal, S.; Cibils, A.F.; Bestelmeyer, B.T.; Steiner, J.L.; Estell, R.E.; Archer, D.W.; Auvermann, B.W.; Bestelmeyer, S.V.; Boucheron, L.E.; Cao, H.; et al. Beef Production in the Southwestern United States: Strategies Toward Sustainability. Front. Sustain. Food Syst. 2020, 4, 114. [Google Scholar] [CrossRef]
- Briske, D.D.; Ritten, J.P.; Campbell, A.R.; Klemm, T.; King, A.E.H. Future Climate Variability Will Challenge Rangeland Beef Cattle Production in the Great Plains. Rangelands 2021, 43, 29–36. [Google Scholar] [CrossRef]
- USGCRP; United States Global Change Research Program, Washington, DC, USA. Personal communication, 2017.
- Nations, U. Managing Water under Risk and Uncertainty. The United Nations World Water; United Nations Educational, Scientific and Cultural Organization: Paris, France, 2012; p. 68. [Google Scholar]
- Alley, W.M.; Alley, R. High and Dry; Yale University Press: New Haven, CT, USA, 2017. [Google Scholar]
- Pearce, F. When the Rivers Run Dry; Beacon Press: Boston, MA, USA, 2018. [Google Scholar]
- Hoekstra, A. The Water Footprint Assessment Manual: Setting the Global Standard; Earthscan: London, UK, 2011. [Google Scholar]
- Network, W.F. Aims and History; Water Footprint Network. 2018. Available online: http://waterfootprint.org (accessed on 29 August 2019).
- The U.S. Global Change Research Program. Impacts, Risks, and Adaptation in the United States: Fourth National Climate Assessment, Volume II: Report-in-Brief; Reidmiller, D.R., Avery, C.W., Easterling, D.R., Kunkel, K.E., Lewis, K.L.M., Maycock, T.K., Stewart, B.C., Eds.; U.S. Global Change Research Program: Washington, DC, USA, 2018; p. 186.
- WRI (World Resources Institute). Aqueduct Water Risk Atlas. 2019. Available online: https://www.wri.org/aqueduct (accessed on 10 August 2019).
- Gremer, J.R.; Bradford, J.B.; Munson, S.M.; Duniway, M.C. Desert Grassland Responses to Climate and Soil Moisture Suggest Divergent Vulnerabilities across the Southwestern United States. Glob. Chang. Biol. 2015, 21, 4049–4062. [Google Scholar] [CrossRef] [PubMed] [Green Version]
- Bestelmeyer, B.T.; Peters, D.P.C.; Archer, S.R.; Browning, D.M.; Okin, G.S.; Schooley, R.L.; Webb, N.P. The Grassland–Shrubland Regime Shift in the Southwestern United States: Misconceptions and Their Implications for Management. BioScience 2018, 68, 678–690. [Google Scholar] [CrossRef] [Green Version]
- Diemer, J.; Crawford, T.; Patrick, M. Agriculture’s Contribution to New Mexico’s Economy. N. M. State Univ. Agric. Exp. Stat. Circ. 2014, 675, 8. [Google Scholar]
- National Agricultural Statistics Service and The National Association of Secretaries of State. New Mexico Agricultural Statistics. 2017 Annual Bulletin; National Agricultural Statistics Service and The National Association of Secretaries of State: Las Cruces, NM, USA, 2018.
- Sawalhah, M.N.; Holechek, J.L.; Cibils, A.F.; Geli, H.M.E.; Zaied, A. Rangeland Livestock Production in Relation to Climate and Vegetation Trends in New Mexico. Rangel. Ecol. Manag. 2019, 72, 832–845. [Google Scholar] [CrossRef]
- Zaied, A.J.; Geli, H.M.E.; Sawalhah, M.N.; Holechek, J.L.; Cibils, A.F.; Gard, C.C. Historical Trends in New Mexico Forage Crop Production in Relation to Climate, Energy, and Rangelands. Sustainability 2020, 12, 2051. [Google Scholar] [CrossRef] [Green Version]
- Gay, C.W.; Dwyer, D.D.; Allision, C.; Schickedanz, J. New Mexico Range Plants. N. M. Coop. Ext. Circ. 1980, 374, 86. [Google Scholar]
- Holechek, J.; Pieper, R.; Herbel, C. Range Management Principles and Practices; Prentice Hall: Upper Saddle River, NJ, USA, 2011. [Google Scholar]
- Culbert, J.I. Cattle Industry of New Mexico. Econ. Geogr. 1941, 17, 155–168. [Google Scholar] [CrossRef]
- Drouillard, J.S. Current Situation and Future Trends for Beef Production in the United States of America—A Review. Asian Australas. J. Anim. Sci. 2018, 31, 1007. [Google Scholar] [CrossRef] [Green Version]
- Western Regional Climate Center. Climate of New Mexico, Western Regional Climate Center. Available online: https://wrcc.dri.edu/wwdt/time/ (accessed on 6 June 2020).
- Society for Range Management. A Glossary of Terms Used in Range Management, 3rd ed.; Society for Range Management: Denver, CO, USA, 1989. [Google Scholar]
- Gauman, J.; New Mexico Livestock Board, Albuquerque, NM, USA. Exported Weaned Calves. Personal communication, 2019. [Google Scholar]
- Marston, L.; Ao, Y.; Konar, M.; Mekonnen, M.M.; Hoekstra, A.Y. High-resolution Water Footprints of Production of the United States. Water Resour. Res. 2018, 54, 2288–2316. [Google Scholar] [CrossRef]
- Jones, M.O.; Allred, B.W.; Naugle, D.E.; Maestas, J.D.; Donnelly, P.; Metz, L.J.; Karl, J.; Smith, R.; Bestelmeyer, B.; Boyd, C.; et al. Innovation in Rangeland Monitoring: Annual, 30 m, Plant Functional Type Percent Cover Maps for U.S. Rangelands, 1984–2017. Ecosphere 2018, 9, e02430. [Google Scholar] [CrossRef]
- Jones, M.O.; Robinson, N.P.; Naugle, D.E.; Maestas, J.D.; Reeves, M.C.; Lankston, R.W.; Allred, B.W. Annual and 16-Day Rangeland Production Estimates for the Western United States. bioRxiv 2020, 77, 112–117. [Google Scholar] [CrossRef]
- Robinson, N.P.; Jones, M.O.; Moreno, A.; Erickson, T.A.; Naugle, D.E.; Allred, B.W. Rangeland Productivity Partitioned to Sub-Pixel Plant Functional Types. Remote Sens. 2019, 11, 1427. [Google Scholar] [CrossRef] [Green Version]
- Samuelson, K.L.; Hubbert, M.E.; Galyean, M.L.; Löest, C.A. Nutritional Recommendations of Feedlot Consulting Nutritionists: The 2015 New Mexico State and Texas Tech University Survey. J. Anim. Sci. 2016, 94, 2648–2663. [Google Scholar] [CrossRef]
- Sala, O.E.; Parton, W.J.; Joyce, L.A.; Lauenroth, W.K. Primary Production of the Central Grassland Region of the United States. Ecology 1988, 69, 40–45. [Google Scholar] [CrossRef]
- USDA-NRCS. Rangeland Analysis Platform. Available online: https://rangelands.app/ (accessed on 24 March 2020).
- Scholljegerdes, E.; New Mexico State University, Las Cruces, NM, USA. Feed Supplement Composition. Personal communication, 2020. [Google Scholar]
- Sammis, T.W. Yield of Alfalfa and Cotton as Influenced by Irrigation 1. Agron. J. 1981, 73, 323–329. [Google Scholar] [CrossRef]
- US Department of Agriculture (USDA). Irrigation Water Requirements. In Part 623. National Engineering Handbook; US Department of Agriculture (USDA): Washington, DC, USA, 1993; Chapter 2; p. 210. [Google Scholar]
- Mekonnen, M.M.; Hoekstra, A.Y. The Green, Blue and Grey Water Footprint of Crops and Derived Crop Products. Hydrol. Earth Syst. Sci. 2011, 15, 1577–1600. [Google Scholar] [CrossRef] [Green Version]
- Mekonnen, M.M.; Hoekstra, A.Y. The Green, Blue and Grey Water Footprint of Farm Animals and Animal Products. Volume 2: Appendices; UNESCO-IHE, Institute for Water Education: Delft, The Netherlands, 2010. [Google Scholar]
- Beckett, J.L.; Oltjen, J.W. Estimation of the Water Requirement for Beef Production in the United States. J. Anim. Sci. 1993, 71, 818–826. [Google Scholar] [CrossRef]
- Duff, G.; New Mexico State University, Las Cruces, NM, USA. Animal Feed Consumption. Personal communication, 2020. [Google Scholar]
- Sweeten, J.M.; O’Neal, H.P.; Withers, R.F. Feedyard Energy Guidlines; Texas A & M University, Agricultural Extension Service: College Station, TX, USA, 1990. [Google Scholar]
- Hamby, D.M. A review of techniques for parameter sensitivity analysis of environmental models. Environ. Monit. Assess. 1994, 32, 135–154. [Google Scholar] [CrossRef]
- Rotz, C.A.; Asem-Hiablie, S.; Place, S.; Thoma, G. Environmental Footprints of Beef Cattle Production in the United States. Agric. Syst. 2019, 169, 1–13. [Google Scholar] [CrossRef]
- Schwalm, C.R.; Anderegg, W.R.; Michalak, A.M.; Fisher, J.B.; Biondi, F.; Koch, G.; Litvak, M.; Ogle, K.; Shaw, J.D.; Wolf, A. Global Patterns of Drought Recovery. Nature 2017, 548, 202–205. [Google Scholar] [CrossRef] [PubMed]
- Holechek, J.L.; Geli, H.M.; Cibils, A.F.; Sawalhah, M.N. Climate Change, Rangelands, and Sustainability of Ranching in the Western United States. Sustainability 2020, 12, 4942. [Google Scholar] [CrossRef]
- McIntosh, M.M.; Holechek, J.L.; Spiegal, S.A.; Cibils, A.F.; Estell, R.E. Long-Term Declining Trends in Chihuahuan Desert Forage Production in Relation to Precipitation and Ambient Temperature. Rangel. Ecol. Manag. 2019, 72, 976–987. [Google Scholar] [CrossRef]
- Capper, J.L. The Environmental Impact of Beef Production in the United States: 1977 Compared with 2007. J. Anim. Sci 2011, 89, 4249–4261. [Google Scholar] [CrossRef] [PubMed] [Green Version]
- Pimentel, D.J.; Houser, E.; Preiss, O.; White, H.; Fang, L.; Mesnick, T.; Barsky, S.; Tariche, J.; Schreck, S.A. Water Resources: Agriculture, the Environment, and Society. BioScience 1997, 47, 97–106. [Google Scholar] [CrossRef]
- Coyne, J.M.; Evans, R.D.; Berry, D.P. Dressing Percentage and the Differential between Live Weight and Carcass Weight in Cattle Are Influenced by Both Genetic and Non-Genetic Factors. J. Anim. Sci. 2019, 97, 1501–1512. [Google Scholar] [CrossRef]
- Maré, F.A.; Jordaan, H. Industrially Finished Calves: A Water Footprint-Profitability Paradox. Water 2019, 11, 2565. [Google Scholar] [CrossRef] [Green Version]
- Gerbens-Leenes, P.W.; Mekonnen, M.M.; Hoekstra, A.Y. The Water Footprint of Poultry, Pork and Beef: A Comparative Study in Different Countries and Production Systems. Water Resour. Ind. 2013, 1–2, 25–36. [Google Scholar] [CrossRef] [Green Version]
- Hoekstra, A.Y. The Hidden Water Resource Use behind Meat and Dairy. Anim. Front. 2012, 2, 3–8. [Google Scholar] [CrossRef]
- Mekonnen, M.M.; Hoekstra, A.Y. A Global Assessment of the Water Footprint of Farm Animal Products. Ecosystems 2012, 15, 401–415. [Google Scholar] [CrossRef] [Green Version]
- Ridoutt, B.G.; Sanguansri, P.; Freer, M.; Harper, G.S. Water Footprint of Livestock: Comparison of Six Geographically Defined Beef Production Systems. Int. J. Life Cycle Assess. 2012, 17, 165–175. [Google Scholar] [CrossRef]
- Dieter, C.H.; Caldwell, M.A.; Hamis, R.R.; Ivahenko, T.T.; Lovelace, J.K.; Barker, N.L.; Linsey, K.S. Estimated Use of Water in the United States in 2015; U.S. Geological Survey Circular: Reston, VA, USA, 2018; p. 65.
- McIntosh, M.M.; Cibils, A.F.; Estell, R.E.; Nyamuryekung’e, S.; González, A.L.; Gong, Q.; Cao, H.; Spiegal, S.A.; Soto-Navarro, S.A.; Blair, A.D. Weight Gain, Grazing Behavior and Carcass Quality of Desert Grass-Fed Rarámuri Criollo vs. Crossbred Steers. Livest. Sci. 2021, 249, 104511. [Google Scholar] [CrossRef]
- Anderson, D.M.; Estell, R.E.; Gonzalez, A.L.; Cibils, A.F.; Torell, L.A. Criollo Cattle: Heritage Genetics for Arid Landscapes. Rangelands 2015, 37, 62–67. [Google Scholar] [CrossRef] [Green Version]
Figure 1.
New Mexico beef cattle production systems.

Figure 2.
New Mexico beef cows, bulls, and weaned calves as animal units (AU) (a) and main crops (b) between 1977 and 2017 [19].
Figure 2.
New Mexico beef cows, bulls, and weaned calves as animal units (AU) (a) and main crops (b) between 1977 and 2017 [19].

Figure 3.
Sensitivity of estimates of blue water footprint of beef production in New Mexico to a 10% change in the model input parameters values.
Figure 3.
Sensitivity of estimates of blue water footprint of beef production in New Mexico to a 10% change in the model input parameters values.

Figure 4.
Relationship between annual blue water use of common New Mexico irrigated crops and cow-calf operations and self-calibrated Palmer Drought Severity Index (sc-PDSI) for the 1977–2017 period.
Figure 4.
Relationship between annual blue water use of common New Mexico irrigated crops and cow-calf operations and self-calibrated Palmer Drought Severity Index (sc-PDSI) for the 1977–2017 period.

Figure 5.
Comparison of drought based on the self-calibrated Palmer Drought Severity Index (sc-PDSI) and beef cattle (a) green water footprint (GWF) and (b) total green water consumption over New Mexico between 1977 to 2017.
Figure 5.
Comparison of drought based on the self-calibrated Palmer Drought Severity Index (sc-PDSI) and beef cattle (a) green water footprint (GWF) and (b) total green water consumption over New Mexico between 1977 to 2017.


Table 1.
Beef cattle water footprint scheme in New Mexico by production system.
| Production System | Green Water Footprint (GWF) | Blue Water Footprint (BWF) |
|---|---|---|
| Cow-calf | ||
| Backgrounding/Stocker | - | |
| Feedlot | - |
Table 2.
Blue water footprint (L/kg) of selected feed components used in this study along with the source of data.
Table 2.
Blue water footprint (L/kg) of selected feed components used in this study along with the source of data.
| Feed | BWF (L/kg)/Level | Reference |
|---|---|---|
| Alfalfa | 830/New Mexico | Sammis [37] |
| Corn | 1137/USA | USDA [38] |
| Cottonseed meal | 279/Global | Mekonnen and Hoekstra [39] |
| Cottonseed hulls | 432/Global | Mekonnen and Hoekstra [39] |
| Dried distillers grains | 66/Global | Mekonnen and Hoekstra [40] |
| Winter wheat | 986/USA | USDA [38] |
| Wheat middlings | 382/Global | Mekonnen and Hoekstra [39] |
| Soybean hulls | 58/Global | Mekonnen and Hoekstra [39] |
Table 3.
Model coefficients for drinking water requirements during the cow-calf phase (Adapted from Beckett and Oltjen [41]).
Table 3.
Model coefficients for drinking water requirements during the cow-calf phase (Adapted from Beckett and Oltjen [41]).
| Animal Class | Model Coefficients | ||||
|---|---|---|---|---|---|
| Intercept | Animal Weight (kg) b1 | Temperature (°C) b2 | Temperature2 (°C) b3 | R2 | |
| Maintenance cow | −0.28 | 0.034 | −0.38 | 0.03 | 0.93 |
| Nursing cow | 37 | 0.0 | 1.2 | 0.0088 | 0.98 |
| Pregnant cow | 39 | −0.034 | −0.013 | 0.026 | 0.94 |
| Calf | 0.9 | 0.067 | 0.0034 | 0.017 | 0.99 |
| Bull | 9.5 | 0.038 | −0.68 | 0.052 | 0.95 |
Table 4.
Annual average beef water footprint (L/kgmeat) for New Mexico beef cattle production system for the different operation phases.
Table 4.
Annual average beef water footprint (L/kgmeat) for New Mexico beef cattle production system for the different operation phases.
| Production System | Offtake | Weight | Green Water Footprint | Blue Water Footprint | Total Water Footprint |
|---|---|---|---|---|---|
| (AU) | (%) | _________________________(L/kgmeat)____________________________ | |||
| Cow-calf | 0.4 | 31 | 74,396 | 372 | 74,769 |
| Backgrounding/Stocker | 0.2 | 15 | 0 | 11,224 | 11,224 |
| Feedlot | 0.7 | 54 | 0 | 6187 | 6187 |
| Weighted Average | 23,063 | 5140 | 28,203 | ||
Publisher’s Note: MDPI stays neutral with regard to jurisdictional claims in published maps and institutional affiliations. |
© 2021 by the authors. Licensee MDPI, Basel, Switzerland. This article is an open access article distributed under the terms and conditions of the Creative Commons Attribution (CC BY) license (https://creativecommons.org/licenses/by/4.0/).
Share and Cite
MDPI and ACS Style
Sawalhah, M.N.; Geli, H.M.E.; Holechek, J.L.; Cibils, A.F.; Spiegal, S.; Gifford, C. Water Footprint of Rangeland Beef Production in New Mexico. Water 2021, 13, 1950. https://doi.org/10.3390/w13141950
AMA Style
Sawalhah MN, Geli HME, Holechek JL, Cibils AF, Spiegal S, Gifford C. Water Footprint of Rangeland Beef Production in New Mexico. Water. 2021; 13(14):1950. https://doi.org/10.3390/w13141950
Chicago/Turabian StyleSawalhah, Mohammed N., Hatim M. E. Geli, Jerry L. Holechek, Andres F. Cibils, Sheri Spiegal, and Craig Gifford. 2021. "Water Footprint of Rangeland Beef Production in New Mexico" Water 13, no. 14: 1950. https://doi.org/10.3390/w13141950
Note that from the first issue of 2016, this journal uses article numbers instead of page numbers. See further details here.