
Landscape Pattern Change of Impervious Surfaces and Its Driving Forces in Shanghai during 1965–2010
by
Yang Yao
1,2, 
Sen Zhang
3,
Yuqing Shi
3,
Mengqi Xu
3,
Jiaquan Zhang
3,
Yongming Zhang
1 and
Jun Zhao
3,* 1
School of Environmental and Geographical Sciences, Shanghai Normal University, Shanghai 200234, China
2
Chinese Research Academy of Environmental Sciences, Beijing 100012, China
3
Department of Environmental Science and Engineering, Shanghai University, Shanghai 200444, China
*
Author to whom correspondence should be addressed.
Water 2021, 13(14), 1956; https://doi.org/10.3390/w13141956
Submission received: 19 May 2021
/
Revised: 9 July 2021
/
Accepted: 9 July 2021
/
Published: 16 July 2021
(This article belongs to the Section Urban Water Management)
Abstract
:Rapid urbanization influences the landscape pattern of impervious surfaces, and potentially affects surface water quality. Using ArcGIS and Fragstats, this study analyzed the temporal change of the landscape pattern of impervious surfaces in Shanghai over the past 45 years, and its driving forces and impact on water quality were also analyzed. The results show that both low and high impervious surfaces showed different degrees of expansion, and as a result, the pervious surfaces and water area reduced by 40.1% and 13.8%, respectively. It proves that the fragmentation and diversity of impervious surfaces in Shanghai notably increased in the past decades, and especially the low and high impervious surfaces show substantial changes. The primary driving forces of the landscape pattern change are population density, unit area Gross Domestic Product (GDP), and the percentage of primary industry. The result of Redundancy analysis (RDA) is that the explanatory ability of landscape pattern to water quality variations decreased from 68.7% to 46.4% in the period 2000–2010. It should be stressed that the contribution of the configuration of impervious surfaces to water quality variation is less than that of the percentage of impervious surfaces.
1. Introduction
Impervious surface is an important indicator affecting surface water quality, and its changes in landscape pattern would impact surface hydrological process [1,2]. Since the last decades, China’s surface water quality has been potentially affected by the expansion of impervious surfaces to varying degrees. As one of the key indicators to denote the level of urbanization and environmental quality, impervious surfaces have received more and more attention, and its percentage, location, density, shape, convergence, and diversity, which all could be regarded as landscape pattern, would notably affect stream quality and health [3,4,5].
Previous research on impervious surfaces is dominated by estimation and mapping techniques, spatial distributions, and relationships between Percentage of Total Impervious Area (PTIA) and environmental indicators [5,6,7,8], especially for water quality [9,10,11,12,13,14]. Little research has focused on the landscape pattern of impervious surfaces, despite the fact that the landscape pattern will also affect the hydrological process in urban watersheds [5,15,16,17]. Therefore, studying the change of landscape pattern of impervious surfaces and its driving forces is of significance to urban planning and management.
The landscape metric of impervious surfaces is an important method for analysis of landscape patterns [18], and it aims to explore the temporal and spatial change of the landscape pattern of impervious surfaces. Landscape metrics are algorithms that quantify specific spatial characteristics of patches, classes of patches, and entire landscape mosaics, and can also analyze and compare the patterns at different scales. Using landscape metrics, it is possible to compare different landscapes’ configuration and monitor its change over time.
Several methods can be used for mapping the impervious surfaces, and the most common is derived from remote sensing images [19,20,21,22,23]. However, due to the complexity of the impervious surface information in remote sensing images, the shadows in the image and image resolution directly affect the accuracy of impervious surface extraction [24]. The latest research shows that this technology often results in poor extraction, and significant deviations occur with different algorithms, especially for linear mosaics such as rivers and roads [25], however, these two mosaics in the landscape are very important in research on the impact of impervious surfaces on water quality [22].
In order to improve the accuracy of impervious surface extraction and map more accurate impervious surfaces, it may be necessary to use a sampling method for land use data. It has proved a valuable method to obtain impervious surface coefficients of different land use types by using vectorization techniques in ArcGIS [26]. In addition, due to the fact that the environmental effects of the impervious surface of each land use may be different, the impervious surface coefficients of the same land type (such as residential land) may also have significant differences, and the novelty of this study is that the land use type was divided in a more detailed way and plenty of land uses were sampled, so the impervious surface coefficients of each land use would be calculated more precisely. Previous studies are mostly based on the impact of PTIA on water quality, so, the other novelty is to explore the impact of configuration of impervious surfaces on water quality, such as Patch Density (PD), Contagion Index (CONTAG) and Shannon Diversity Index (SHDI).
2. Study Area and Methods
2.1. Study Area and Data
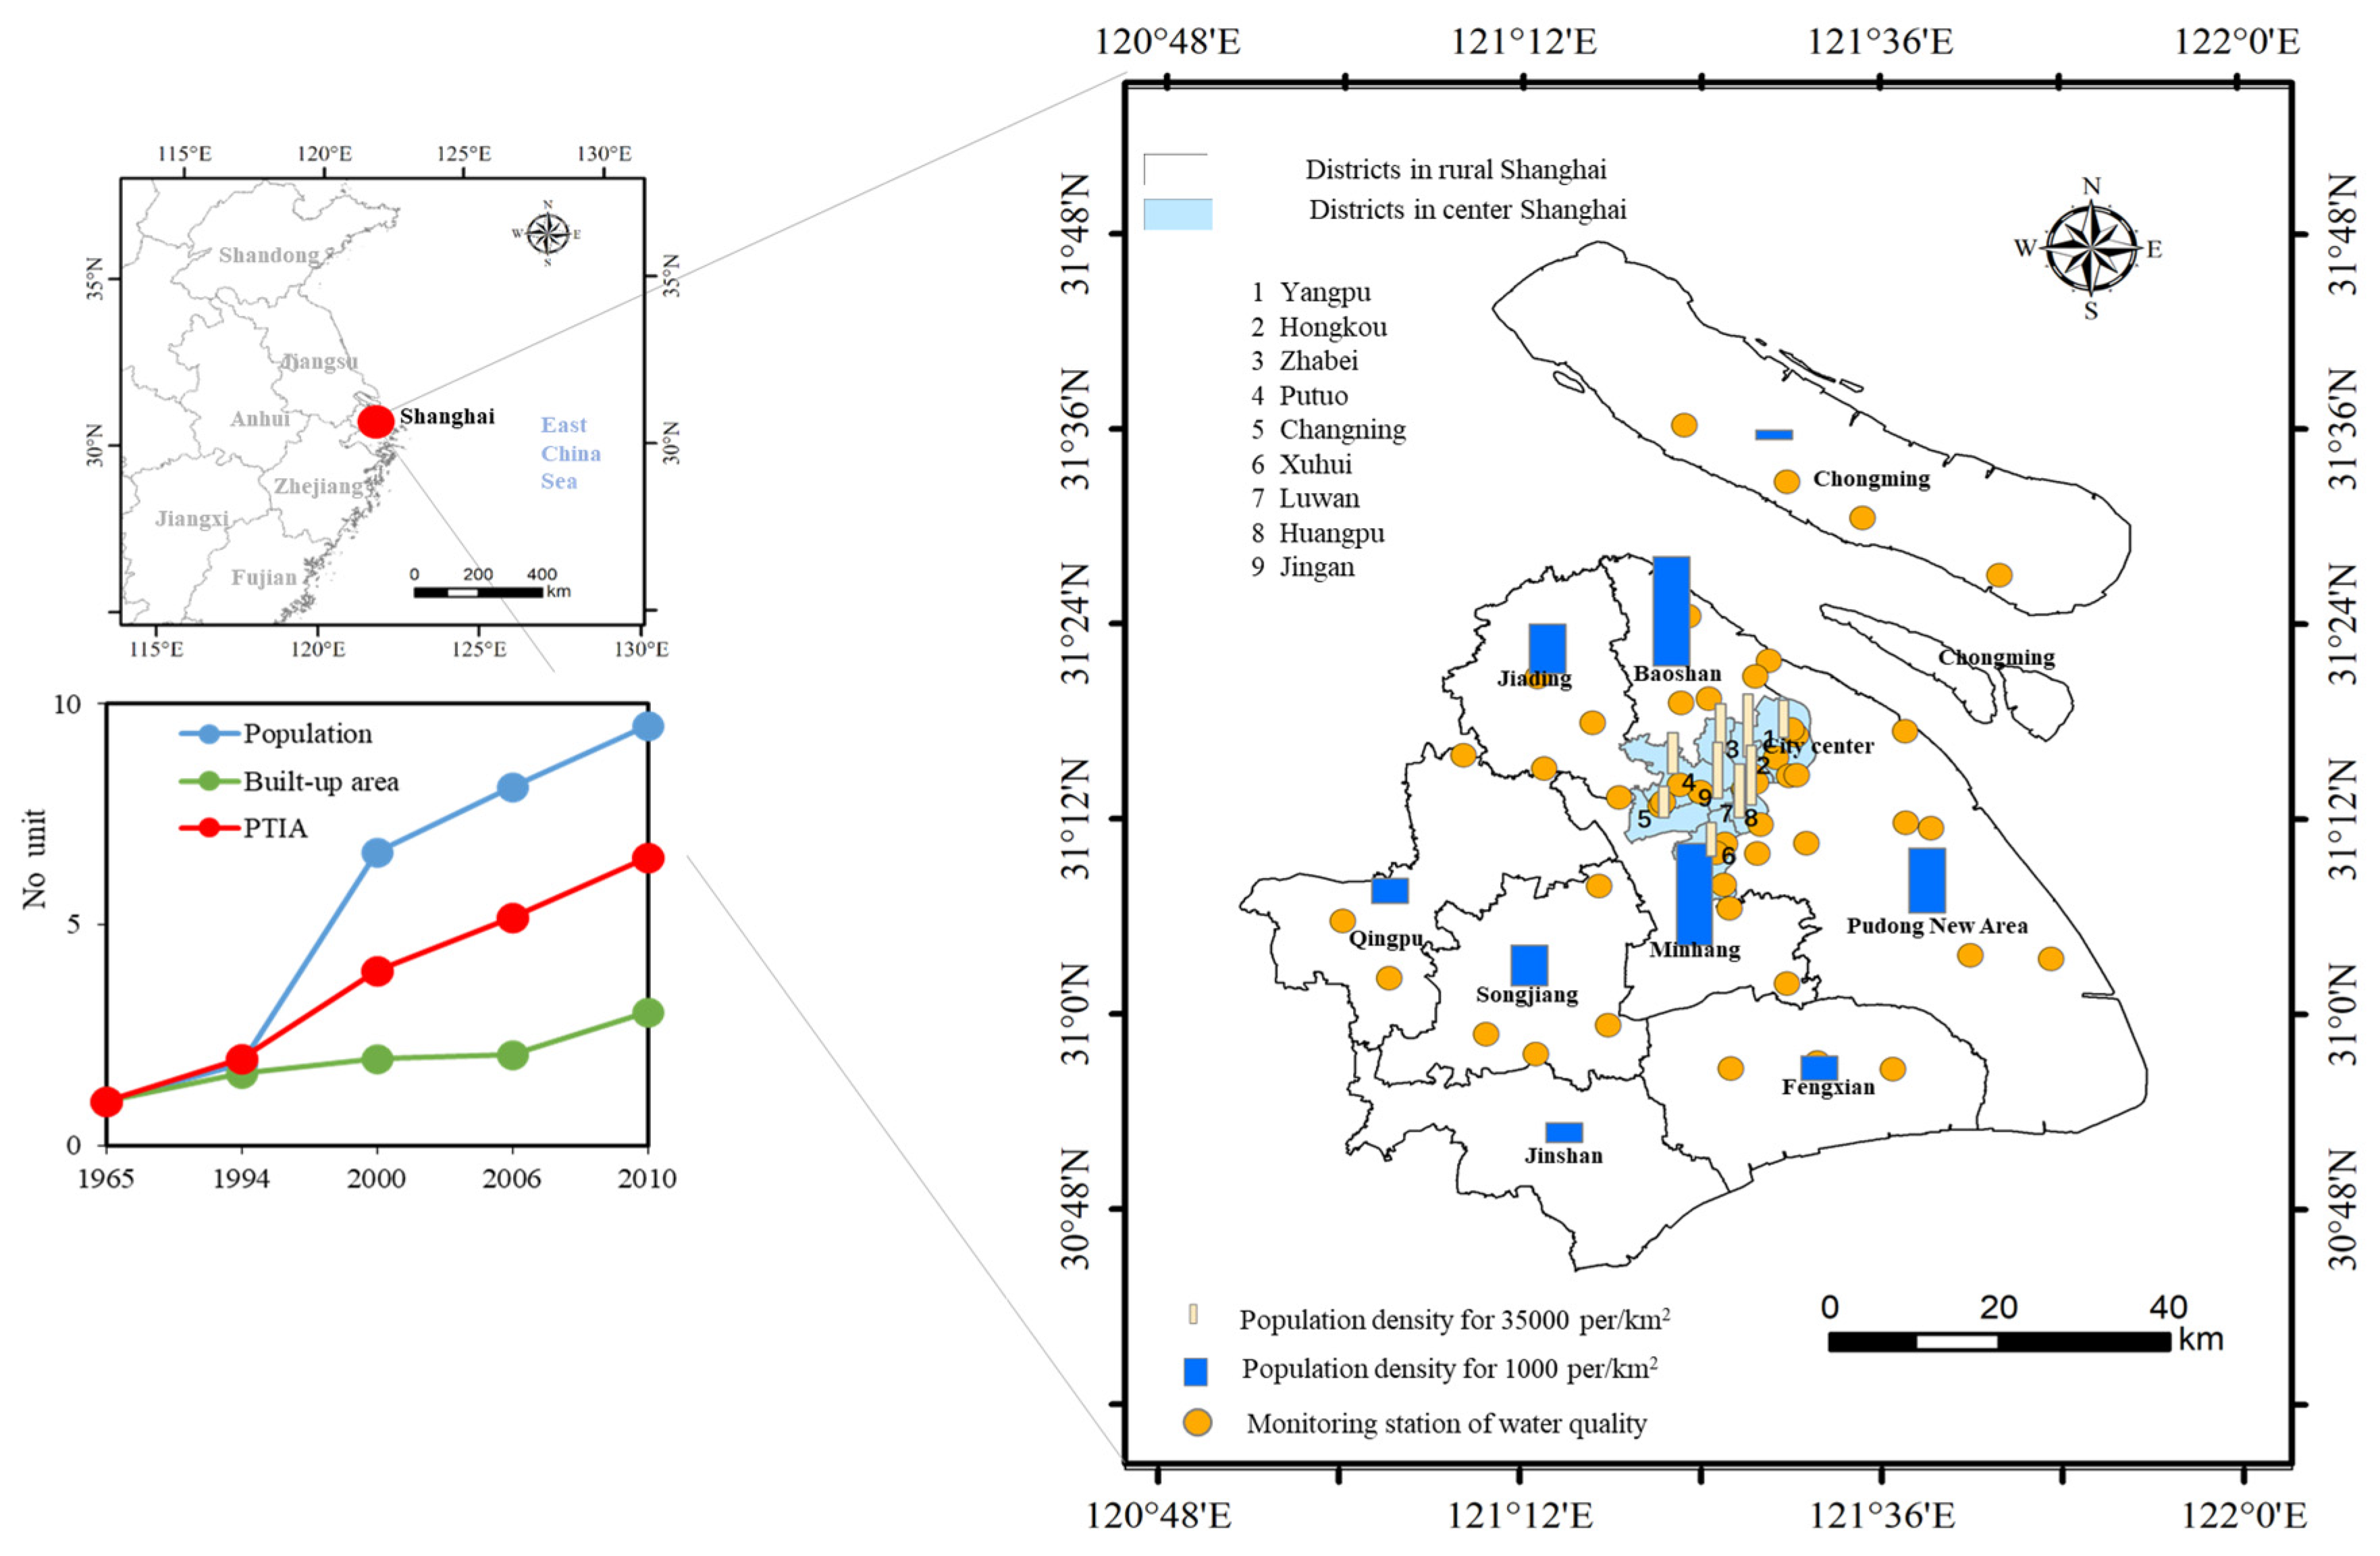
The geographical position of Shanghai is 30°40′–31°53′ N, 120°51′–122°12′ E, with a population of 24.00 million (2018) and an area of 6340.50 km2. According to Shanghai Statistics Yearbook [27], the population density in the center of Shanghai is 23,793 persons per km2, and in the suburbs it is 2867 (2018). Shanghai is located on the Pacific Ocean’s west coast, in the front edge of the Yangtze River Delta. It is part of the alluvial plain of the Delta, and is covered with dense water systems, with a river network density of 3.41 km/km2. The study area of this study is 4927.5 km2 in which Chongming Island is excluded because of the lack of data (Figure 1).
The land use data include 1965, 1994, 2000, 2003, 2006 and 2010 in Shanghai, and data for 1965 and 1994 are aerial data with a spatial resolution of 2 m, and data for 2000, 2003, 2006, and 2010 are from QuickBird satellite remote sensing, interpreted by ENVI software, sourced from the Key Laboratory of Geographic Information Science of the Ministry of Education, East China Normal University, with a scale of 1:10,000 and a spatial resolution of 1.4 m. The remote sensing image was processed by geometric correction, spectral processing, image stitching, coordinate positioning, and water enhancement. Finally, the data were processed in ArcGIS 10.2 to determine land use, which is based on Urban Land Classification and Planning and Construction Land Standards of China (GB 50137–2011). The different land use types differ in their impervious surface coefficients, and the standard deviation of the coefficients of sampling data can usually be controlled within 10%, indicating that the results of this technique are more accurate, so it can be applied to the entire area (Fu et al. 2019).
Besides, the driving forces of the landscape pattern of impervious surfaces, such as the total population, population density, GDP, the percentage of Primary Industry, Secondary Industry and Tertiary Industry, are all from the Shanghai Statistics Yearbook [27]. Water quality data (including Dissolved Oxygen (DO),the chemical oxygen demand (COD), total nitrogen (TN), the total phosphorus (TP), un-ionized ammonia (NH3–N),Phenol and Oil) from 48 monitoring stations were derived from the Shanghai Environmental Protection Agency (2000, 2003 and 2010). There are a total of 48 water quality monitoring stations administrated by the Shanghai environmental protection department, which are located in urbanized areas, industrialized areas, regional main rivers and water source protection areas.
2.2. Methods
2.2.1. Definition of Impervious Surfaces Based on Land Uses
Generally speaking, roads, industrial, residential land and public buildings are regarded as impervious surfaces, while green spaces, agricultural, water, and natural villages are regarded as pervious surfaces. However, in land use data interpreted from remote sensing images, the pervious surfaces such as auxiliary green spaces in industrial and residential land are not identified, and the impervious surfaces such as roads in pervious surfaces are also ignored. This study used the impervious surface coefficients method (ISC) to map the impervious surfaces in Shanghai, and by random sampling of each land use, an impervious surface coefficient would be calculated and assigned to a certain land use, then this coefficient will be used to map the impervious surfaces in Shanghai.
According to the impervious surface coefficients (ISC) of different land use types, this research divides impervious surfaces into four types—pervious surface (ISC = 0), low impervious surfaces (0 < ISC < 0.6), high impervious surfaces (0.6 < ISC < 1) and water (Fu et al., 2019). Pervious surfaces include agricultural land, natural villages, green spaces, etc.; low impervious surfaces include new residential, villas, parks, etc.; high impervious surfaces include industrial land, old residential, public building, roads and squares, roofs, etc.; water areas are comprised of rivers and lakes (Table 1).
2.2.2. Methodology
ArcGIS 10.2 was used to reclassify land uses into the above-mentioned four impervious surfaces and then convert it into a TIF map that can be used to calculate the landscape metrics in Fragstats 5.0. There are three types of landscape metrics including area, density and aggregation index, and the area includes Percentage of Landscape and Largest Patch Index, the density includes Patch Density and Shannon Diversity Index, and the aggregation includes Aggregation Index and Contagion Index (Table 2) [28,29].
Multiple linear stepwise regressions and Pearson correlations are used to determine a relationship between landscape metrics and socio-economic drivers in SPSS 19.0, in which Percentage of Primary Industry (PPI), Percentage of Secondary Industry (PSI), and Percentage of Tertiary Industry (PSI) are explanatory variables. Percentage of Total Impervious Area (PTIA), Patch Density (PD), Contagion Index (CONTAG) and Shannon Diversity Index (SHDI) are dependent variables.
In order to determine the explanatory ability of an impervious landscape pattern to water quality variation in Shanghai, Canoco 5.0 software was used to conduct Redundancy analysis (RDA) between environmental variables and species variables. The water quality indicators of 48 monitoring stations are regarded as species variables (response variables), and the landscape metrics of impervious surfaces in each buffer are regarded as environmental variables (explanatory variables). In the operation, the variable screening process of the Monte Carlo Permutation method was selected to identify significant variables (499 unrestricted screening cycles).
3. Results
3.1. Composition of Different Impervious Surfaces Changed
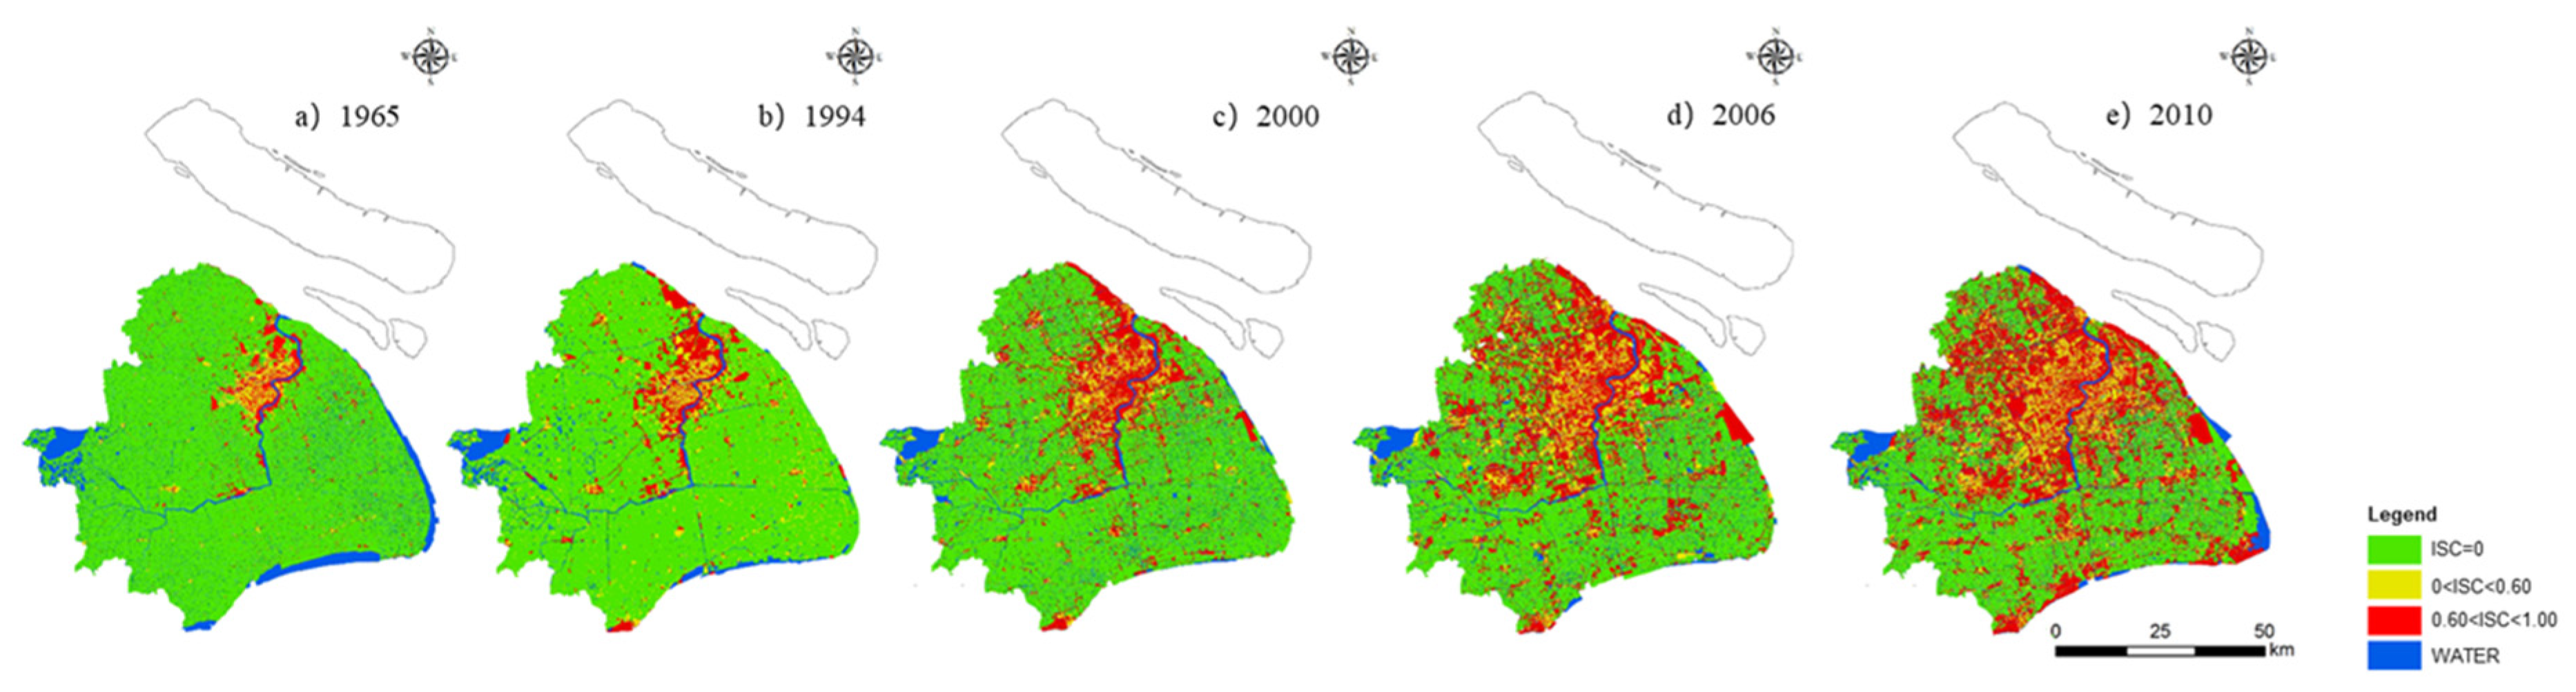
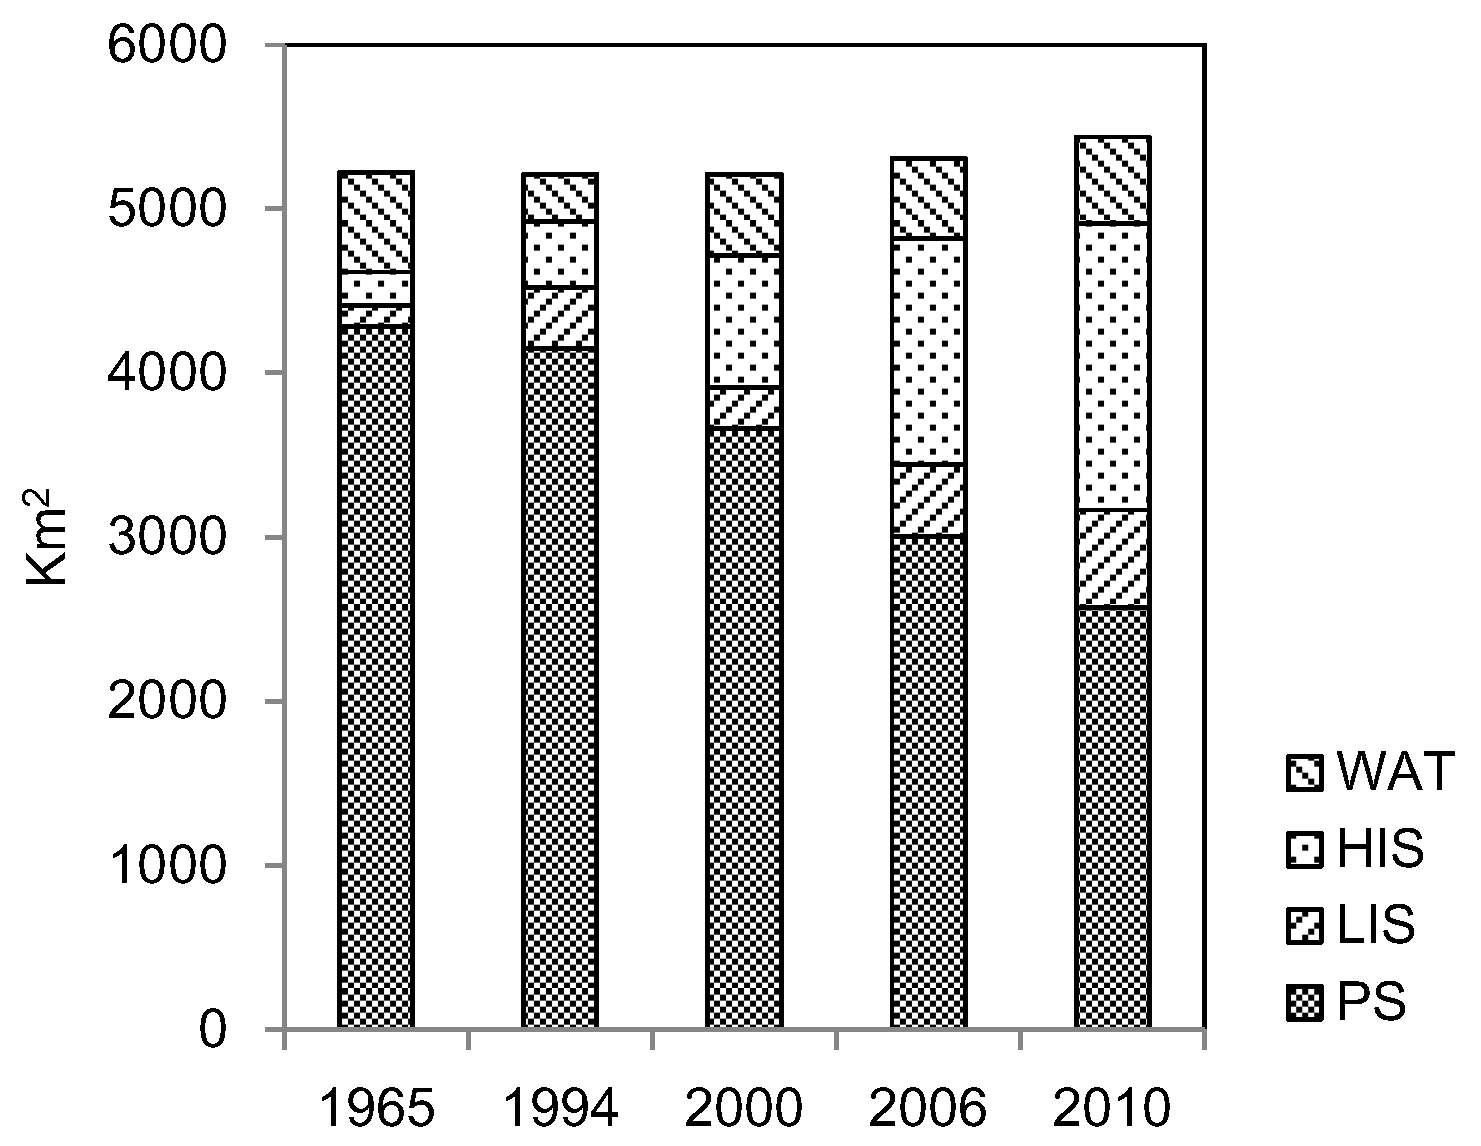
From 1965 to 2010, with the rapid urbanization, Shanghai’s impervious surfaces continued to expand from the city center to surrounding suburbs. The percentage of total impervious area enlarged from 7.0% to 43.7%. Meanwhile, pervious surfaces reduced from 4287 to 2570 km2, low impervious surfaces expanded from 121 to 596 km2, high impervious surfaces expanded from 207 to 1747 km2, and water area dropped slightly from 608 to 524 km2 (Figure 2).
Figure 3 shows that pervious surfaces, low impervious surfaces, high impervious surfaces and water changed notably during the period 1965–2010. In terms of area changes, both low and high impervious surfaces showed different degrees of expansion, and the pervious surfaces and water area reduced by 40.1% and 13.8%, respectively.
3.2. Fragmentation and Diversity of Impervious Surface Patches Increased
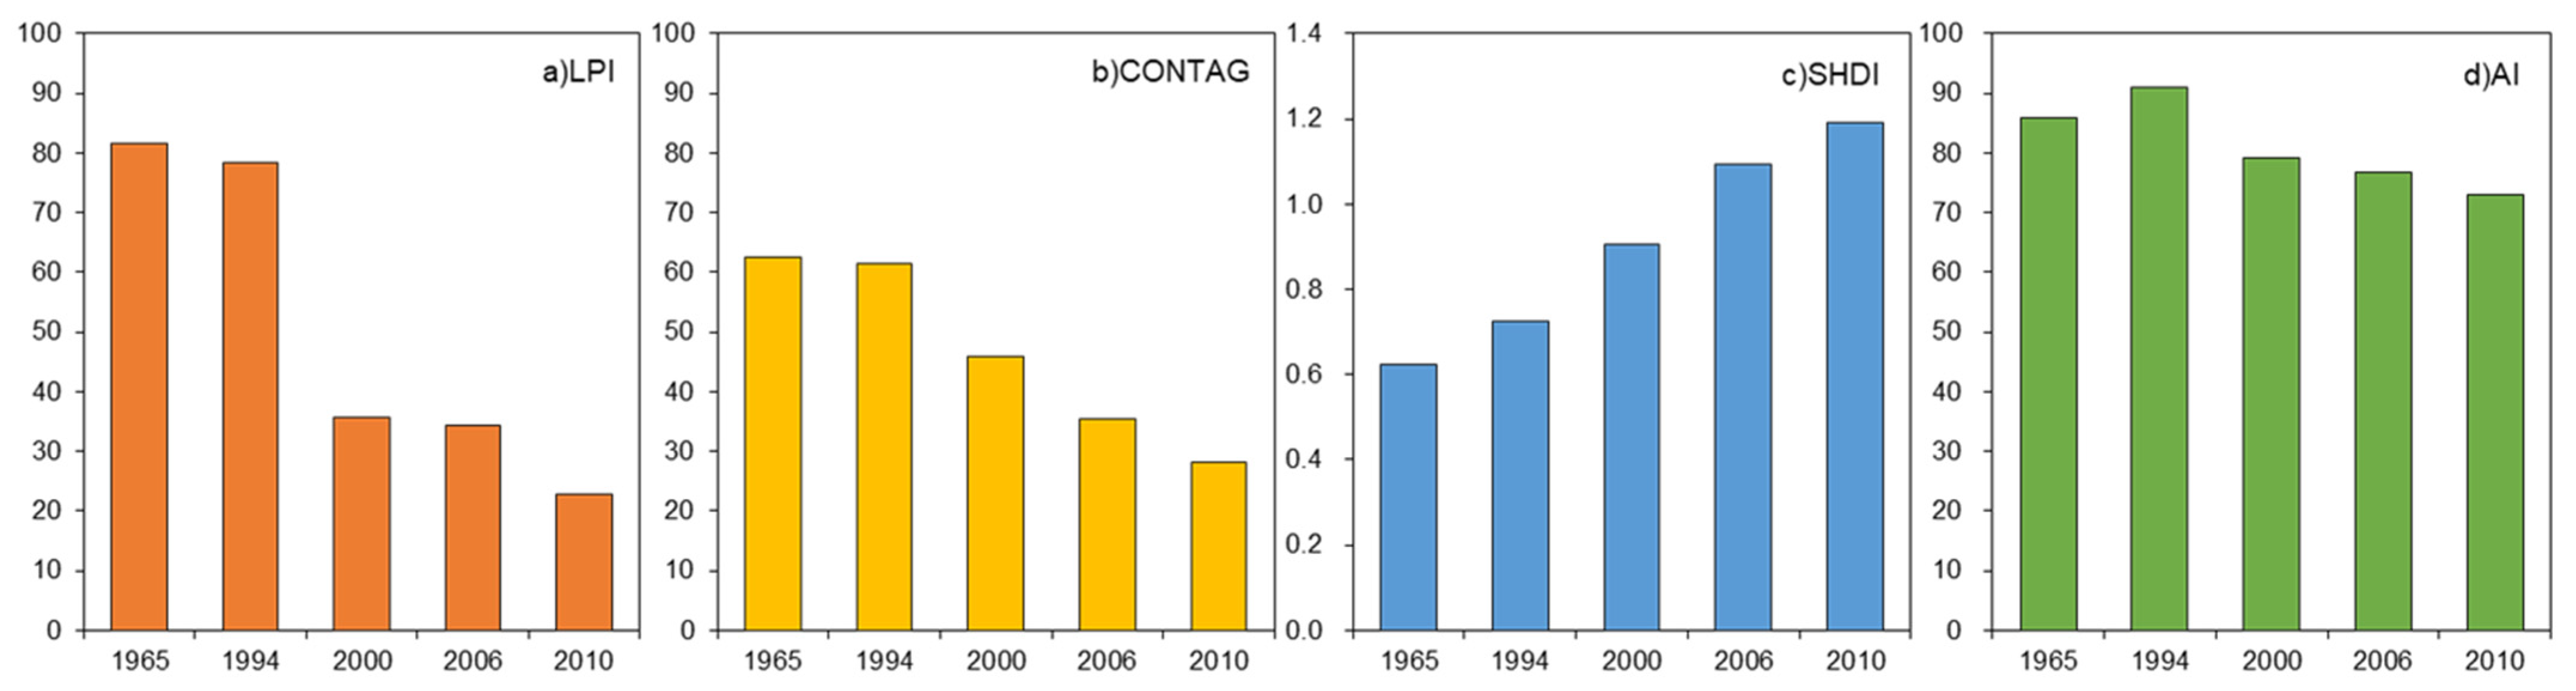
The impervious surfaces patches were calculated at the landscape level (Figure 4 and Figure 5). It showed that LPI, CONTAG, and AI were on a gradual decline. Among them, LPI displayed the largest drop, reaching 71.9%. SHDI showed a gradual increase from 0.6 to 1.2. Therefore, it seems to prove that the fragmentation of impervious surfaces increased, and landscape diversity also increased.
3.3. Landscape Pattern Change of Different Impervious Surfaces
3.3.1. Pervious Surfaces Continuously Reduced and Its Fragmentation Increased
During the period of 1965–2010, the percentage of pervious surfaces in Shanghai declined notably, and rapid urbanization had become apparent by reducing pervious surfaces; patch density (PD) was on the rise, with an increase up to 27 times. The reason may be that impervious patches replaced the pervious surfaces, and were embedded into pervious surfaces, so fragmentation increased; and largest patch index (LPI) decreased, with a decline of 72%, indicating that urbanization was continuously expanding and the largest patch (agricultural land) of the pervious surfaces decreased, and its influence on the landscape pattern becomes less and less. AI showed an overall downward trend in pervious surfaces, but the decline was only 11%, indicating that pervious surfaces were becoming scattered, but the overall degree of aggregation was still relatively high.
3.3.2. Low Impervious Surfaces Expanded, but Have a Tendency to Disperse
The percent of low impervious surfaces showed a clear rise, expanded by about four times, which showed that these surfaces in Shanghai are increasing over time, and the rapid urbanization has led to the connection of low impervious surfaces; patch density is also increasing for this type of surface, with an increase of more than 12 times. On one hand, the reason may be the expanding of low impervious surfaces, accompanied by the pervious surfaces and water transferred into low impervious surfaces. On the other hand, large blocks of low impervious surfaces may be broken and divided into smaller pieces, LPI firstly decreased and then increased. Aggregation index (AI) generally decreased from 70 to 61, which indicates that the expansion of low impervious surfaces has a tendency to disperse over time.
3.3.3. High Impervious Surfaces Grew Dramatically, and the LPI Increased
The percentage of high impervious surfaces showed a rapid upward trend over time, and its growth rate is the fastest among all impervious surfaces types, from 4% to 32%, which shows that public buildings, industrial land and roads grew rapidly, and their percentage in Shanghai is continuing to grow. Patch density showed an overall upward trend, indicating that the high impervious surfaces were gradually increasing but were fragmented; LPI also increased by more than 13 times, which shows that in the process of urbanization, public buildings, industrial land, road and square patches have gradually expanded and then connected. The AI has not changed so much, with the average value remaining at about 71, indicating that high impervious surfaces in Shanghai are relatively aggregated in the city center.
3.3.4. Change of Water Area Is Not Significant
The percentage of water area firstly reduced and then stabilized with time. It was 11.0% in 1965 and stabilized at 9.0–10.0% in 2000–2010, indicating that water area reduced in the earlier stages of urbanization, but after entering the 21st century, water area stabilized. PD, LPI, and AI kept stable. The impact of urban development is that the water surface is polluted or disappears, leading to the continuous reduction of water surface percentage [30]. The Yangtze River Delta, where Shanghai is located, is the most urbanized and densely populated area in China, and the most direct impact of urbanization on river systems is in the landfill of rivers [31].
3.4. The Driving Forces of Landscape Pattern Change
Taking each district of Shanghai as samples, Patch Density (PD), Contagion Index (CONTAG) and Shannon Diversity Index (SHDI) of 2010 are selected as variables (Table 3), and Pearson correlation was performed to determine the linear relationship between the landscape pattern of impervious surfaces and socio-economic indicators such as population and economic, and then we used multiple linear stepwise regression methods to explore the driving forces that influenced landscape metrics.
Pearson correlation analysis shows that most landscape metrics are strongly related to Population Density (POP_D), and its correlation coefficients with pervious surfaces, low impervious surfaces, and high impervious surfaces are 0.938, 0.951 and 0.913, respectively. PD has different degrees of correlation with Population Density (POP_D), Unit Area Gross domestic product (UAGDP), Percentage of Primary Industry (PPI), Percentage of Secondary Industry (PSI), and Percentage of Tertiary Industry (PTI). CONTAG and SHDI are not correlated with POP_D (Table 4).
To further define the relationship between landscape metrics and socio-economic drivers, a multiple linear stepwise regression model was performed. The results showed Percentage of Total Impervious Area (PTIA) was positively correlated with POP_D and negatively correlated with PPI, with the multiple linear regression equation:
PTIA = 0.001 POP_D** − 3.462 PPI** + 33.881 (R2 = 0.860)
PD was positively decided by POP_D and negatively correlated with UAGDP, with the multiple linear regression equation:
PD = 1.238 POP_D** − 0.419 UA GDP** + 1.023 (R2 = 0.903)
SHDI was negatively correlated with PPI and PTI, with the multiple linear regression equation:
SHDI = −0.915 PPI** − 0.446 PTI* + 0.112 (R2 = 0.640)
CONTAG has low correlation with socio-economic indicators. Among the landscape metrics, PD has the best fit, and it seems that the landscape pattern of impervious surfaces is more related to POP_D and UAGDP.
3.5. Influence of Landscape Metrics on Water Quality
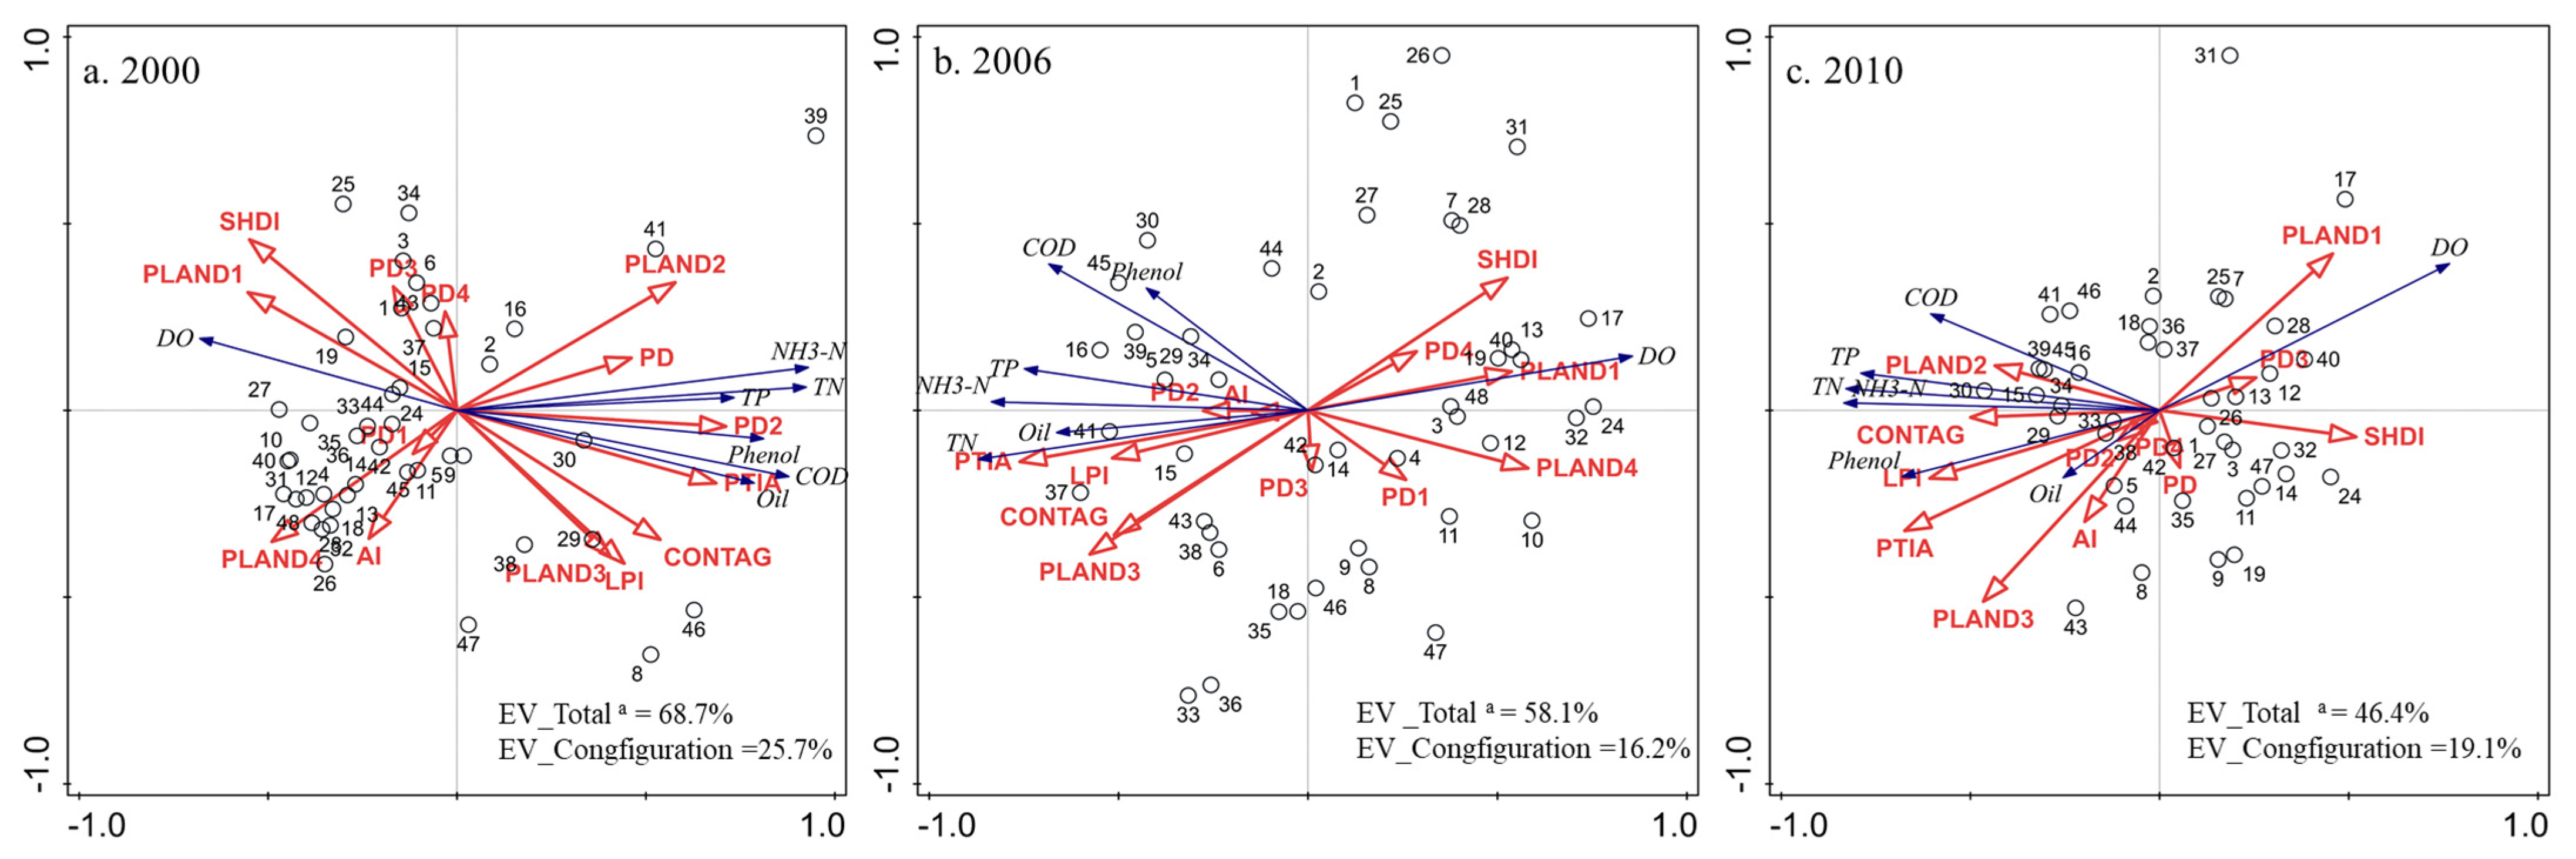
As shown in Figure 6, PTIA, percent pervious surface, and percent low and high impervious surfaces, PLAND1 (Percentage of Pervious Surface), PLAND2 (Percentage of Low impervious surfaces), and PLAND3 (Percentage of High impervious surfaces) all have a significant correlation with water quality.
From the two-dimensional RDA sequence of the spatial pattern of impervious surfaces and the spatial differentiation of surface water quality in Shanghai, it can be seen that PTIA is in line with other water quality metrics such as COD, NH3–N, TN, TP, Phenol, and Oil. Different degrees of positive correlation are in line with expectations. The result of RDA is that the explanatory ability of landscape pattern to water quality variations decreased from 68.7% to 46.4% in the period 2000–2010. It should be stressed that Figure 6 also shows that the explanatory ability of configuration (including SHDI, PD, LPI, AI, and CONTAG) for the variation of water quality is less than that of the percentage of impervious surfaces.
4. Discussion
4.1. Comparison with Previous Research
Literature is very limited on the change of landscape pattern of impervious surfaces in world cities. Among the existing research, some conclusions are consistent with this study, and some are different. The impervious surfaces growth of the National Capital Region of Delhi and China’s Qinhuai River Basin is consistent with that of Shanghai, and both are the most significant [32,33].
For the driving forces, the expanding of impervious surfaces in Xiamen was notably related to the GDP and population, which is very similar to this study [34]. Through further analysis on economic drivers, this study finds that the more important economic factor in Shanghai is unit area GDP, and the percentage of Tertiary Industry. In the National Capital Region of Delhi, Xiamen China, and Guangdong—Hong Kong—Macao Greater Bay Area, the fragmentation and diversity of the landscape pattern of impervious surfaces all increased continuously, which is consistent with our study, but in the Qinhuai River Basin, the fragmentation and diversity of the landscape pattern of impervious surfaces have gradually become connected from disorder and fragmentation, and the stability of the landscape has gradually strengthened [32,33,34,35].
4.2. The Primary Driving Forces Are Population Density and Unit Area GDP
This study shows that the primary driving forces of the landscape pattern of impervious surfaces are population density, unit area GDP, and percentage of Primary Industry. The driving forces of the change of landscape pattern are similar to that of impervious surfaces area (Fu et al. 2019; Li et al. 2018; Wang et al. 2020). The measure of urbanization may also include essential indicators such as total industrial output value, total retail sales of consumer goods and the proportion of the non-agricultural population. However, due to the lack of open statistics, these indicators’ analysis was missed in this study, so this article only selects POP_D, GDP, UAGDP, PPI, PSI, and PTI.
4.3. Influence of Urbanization on Landscape Metrics
The urban growth pattern of Shanghai is shown as the edge growth pattern of the central city in the earlier stage of urbanization (1965–1994), and as shown in Figure 2, the high impervious surfaces in central city continue to expand.
During the accelerated period of urbanization, the city center continued its expansion from 1965 to 2000, but the growth rate slowed down, and surrounding area close to the city center began to expand quickly, and the high impervious surfaces in suburbs gradually increased in this period. As shown in Figure 5, with urbanization, public buildings, roads and industrial land have been expanding in the center of Shanghai.
From 2000 to 2010, we observed a continuous sprawl pattern consisting of multiple centers, including the city center and several urban areas in suburban regions (Figure 2). Thus, the current situation of land use and landscape pattern have been changed to a great extent, resulting in significant landscape diversity and high fragmentation of various types of impervious patches. The above results are consistent with the research of Li et al. [36].
4.4. Policy Implications
In the earlier stage of urbanization, non-point source pollution is dominated by impervious surfaces, and therefore, correlation between PTIA and water quality is more notable. However, in the later stage, the impervious surfaces of the city become cleaner due to street sweeping and the rainwater collection capacity is getting more developed, and there will be less non-point source pollution; thus, impervious surfaces might no longer be an important factor determining water quality, as the correlation is no longer apparent [14]. Therefore, in urban landscape planning, it is very necessary to introduce certain permeable grounds such as green spaces, permeable roads and squares, and wetlands, and so the landscape diversity can be increased. Additionally, the coverage of street sweeping should be expanded to reduce the generation of non-point source pollution.
4.5. Limitations
4.5.1. Selection of Landscape Metrics
In this study, the landscape metrics involved Percentage of patch, Largest Patch Index, Patch Density, Shannon Diversity Index, Aggregation Index, and Contagion Index. Although these metrics can eliminate some unnecessary indicators to a certain extent, there may inevitably be mistaken deletions and omissions of other indicators. Therefore, the introduction of landscape metrics may need to be further studied in the future, such as using principal component analysis (PCA), cluster analysis, and other methods to select appropriate metrics [37,38,39,40,41,42,43].
4.5.2. Application of the Impervious Surface Coefficients
In order to identify the pervious area dispersed in the impervious surfaces or the impervious area dispersed in the pervious surfaces, firstly an impervious surface coefficient would be calculated through random sampling land uses, and then be used to map the impervious area in Shanghai. The method in this study can reduce some errors, but the coefficients obtained by random sampling would be assigned all patches of a certain land use, which will inevitably produce new errors.
4.5.3. Different Sources of Remote Sensing Images
There are different data sources for land use data, and this will affect the research results. The land use data for 1965 and 1989 was generally through aerial photography, and data of the other years used remote sensing images from QuickBird satellite, which reduces the data consistency to a certain extent.
5. Conclusions
This study analyzed the change of the landscape pattern of impervious surfaces of Shanghai in the past 45 years. It showed that from 1965 to 2010, pervious surfaces reduced by 40%, low impervious surfaces expanded by 393%, high impervious surfaces expanded by 744%, and water reduced by 14%. The fragmentation and diversity of the landscape pattern notably increased. Patch Density of all pervious and non-pervious surfaces all increased, in which the pervious surface is the most significant. The Largest Patch Index of high impervious surfaces has increased by thirteen times. The Aggregation Index of pervious surfaces, low impervious surfaces and water all showed a downward trend, and only the high impervious surfaces increased by 18.1%.
The most important driving forces of the landscape pattern change of impervious surfaces are population density, unit area GDP, and the percentage of Primary Industry. The influence of landscape metrics on water quality continues to decrease, and the contribution of the configuration of impervious surfaces to water quality is less than that of the percentage of impervious surfaces.
Author Contributions
Conceptualization, Y.Y. and J.Z. (Jun Zhao); methodology, S.Z.; software, Y.S.; validation, M.X., Y.Z. and J.Z. (Jiaquan Zhang); formal analysis, Y.Y.; investigation, S.Z.; resources, Y.S.; data curation, M.X.; writing—original draft preparation, Y.Y.; writing—review and editing, J.Z. (Jun Zhao).; visualization, Y.Y.; supervision, J.Z. (Jun Zhao); project administration, Y.Y.; funding acquisition, Y.Y. All authors have read and agreed to the published version of the manuscript.
Funding
The study was funded by the National Key R&D Program of China (No. 2019YFC0408205) and The National Social Science Fund of China (18ZDA046).
Institutional Review Board Statement
Not applicable.
Informed Consent Statement
Not applicable.
Data Availability Statement
The data used in this study are available upon request, from the corresponding author.
Acknowledgments
We thank the Key Laboratory of Geographic Information Science, Ministry of Education of East China Normal University, for providing land use data of Shanghai.
Conflicts of Interest
The authors declare no conflict of interest.
Abbreviations
| ISC | Impervious surface coefficient |
| PTIA | Percentage of Total Impervious Area |
| PLAND | Percentage of Landscape |
| PLAND1 | Percentage of Landscape of Pervious Surface |
| PLAND2 | Percentage of Landscape of Low impervious surfaces |
| PLAND3 | Percentage of Landscape of High Im2pervious Surfaces |
| PLAND4 | Percentage of Landscape of Water |
| LPI | Largest Patch Index |
| PD | Patch Density |
| PD1 | Patch Density of Pervious Surfaces |
| PD2 | Patch Density of Low impervious surfaces |
| PD3 | Patch Density of High impervious surfaces |
| PD4 | Patch Density of Water |
| SHDI | Shannon Diversity Index |
| AI | Aggregation Index |
| CONTAG | Contagion Index |
| POP_D | Population Density |
| GDP | Gross Domestic Product |
| UAGDP | Unit Area GDP |
| PPI | Percentage of Primary Industry |
| PSI | Percentage of Secondary Industry |
| PTI | Percentage of Tertiary Industry |
| DO | Dissolved Oxygen |
| COD | The Chemical Oxygen Demand |
| TN | Total Nitrogen |
| TP | The Total Phosphorus |
| NH3–N | Un-ionized Ammonia |
References
- Akter, T.; Quevauviller, P.; Eisenreich, S.J.; Vaes, G. Impacts of climate and land use changes on flood risk management for the Schijn River, Belgium. Environ. Sci. Policy 2018, 89, 163–175. [Google Scholar] [CrossRef]
- Aulenbach, B.T.; Landers, M.; Musser, J.W.; Painter, J.A. Effects of Impervious Area and BMP Implementation and Design on Storm Runoff and Water Quality in Eight Small Watersheds. JAWRA J. Am. Water Resour. Assoc. 2017, 53, 382–399. [Google Scholar] [CrossRef]
- Bailey, D.; Herzog, F.; Augenstein, I.; Aviron, S.; Billeter, R.; Szerencsits, E.; Baudry, J. Thematic resolution matters: Indicators of landscape pattern for European agro-ecosystems. Ecol. Indic. 2007, 7, 692–709. [Google Scholar] [CrossRef]
- Bierwagen, B.G.; Theobald, D.M.; Pyke, C.R.; Choate, A.; Groth, P.; Thomas, J.V.; Morefield, P. National housing and impervious surface scenarios for integrated climate impact assessments. Proc. Natl. Acad. Sci. USA 2010, 107, 20887–20892. [Google Scholar] [CrossRef] [Green Version]
- Nagy, R.C.; Lockaby, B.G.; Kalin, L.; Anderson, C.J. Effects of urbanization on stream hydrology and water quality: The Florida Gulf Coast. Hydrol. Process. 2012, 26, 2019–2030. [Google Scholar] [CrossRef]
- Chen, S.; Shen, S.; Chen, L.; Lu, G. Test of engineering properties of impervious soil with salt. Adv. Technol. Water Resour. 2015, 35, 66–70. [Google Scholar]
- Chithra, S.; Nair, M.H.; Amarnath, A.; Anjana, N. Impacts of impervious surfaces on the environment. Int. J. Eng. Sci. Invent. 2015, 4, 2319–6726. [Google Scholar]
- Cui, X.; Wang, X. Urban land use change and its effect on social metabolism: An empirical study in Shanghai. Habitat Int. 2015, 49, 251–259. [Google Scholar] [CrossRef]
- Deng, C.; Wu, C. BCI: A biophysical composition index for remote sensing of urban environments. Remote Sens. Environ. 2012, 127, 247–259. [Google Scholar] [CrossRef]
- Edwards, A.W.F.; Cavalli-Sforza, L.L. A Method for Cluster Analysis. Biometrics 1965, 21, 362. [Google Scholar] [CrossRef]
- Feng, S.S.; Fan, F.L. Spatiotemporal changes of landscape pattern using impervious surface in Guangdong-Hong Kong-Macao Greater Bay Area, China. Chin. J. Appl. Ecol. 2018, 29, 2907–2914. [Google Scholar]
- Fu, B.-J.; Zhao, W.-W.; Chen, L.-D.; Liu, Z.-F.; Lu, Y.-H. Eco-hydrological effects of landscape pattern change. Landsc. Ecol. Eng. 2005, 1, 25–32. [Google Scholar] [CrossRef]
- Fu, B.; Peng, Y.; Zhao, J.; Wu, C.; Liu, Q.; Xiao, K.; Qian, G. Driving forces of impervious surface in a world metropolitan area, Shanghai: Threshold and scale effect. Environ. Monit. Assess. 2019, 191, 771. [Google Scholar] [CrossRef]
- Han, L.; Xu, Y.; Yang, L.; Deng, X.; Hu, C.; Xu, G. Temporal and spatial change of stream structure in Yangtze River Delta and its driving forces during 1960s–2010s. Acta Geogr. Sin. 2015, 70, 819–827. [Google Scholar]
- Jacobson, C.R. Identification and quantification of the hydrological impacts of imperviousness in urban catchments: A review. J. Environ. Manag. 2011, 92, 1438–1448. [Google Scholar] [CrossRef] [PubMed]
- Jat, M.K.; Garg, P.K.; Khare, D. Monitoring and modelling of urban sprawl using remote sensing and GIS techniques. Int. J. Appl. Earth Obs. Geoinf. 2008, 10, 26–43. [Google Scholar] [CrossRef]
- Jin-hua, R.; Shao-hua, W.; Sheng-lu, Z.; Chen, L. Advances in Remote Sensing Research on Urban Impervious Surface. Remote Sens. Land Resour. 2012, 24, 8–15. [Google Scholar]
- Karamizadeh, S.; Abdullah, S.M.; Manaf, A.A.; Zamani, M.; Hooman, A. An Overview of Principal Component Analysis. J. Signal Inf. Process. 2013, 4, 173–175. [Google Scholar] [CrossRef] [Green Version]
- Kim, H.; Jeong, H.; Jeon, J.; Bae, S. The Impact of Impervious Surface on Water Quality and Its Threshold in Korea. Water 2016, 8, 111. [Google Scholar] [CrossRef] [Green Version]
- Lee, C.; Kim, K.; Lee, H. GIS based optimal impervious surface map generation using various spatial data for urban nonpoint source management. J. Environ. Manag. 2018, 206, 587–601. [Google Scholar] [CrossRef] [PubMed]
- Lee, S.-W.; Hwang, S.-J.; Lee, S.-B.; Hwang, H.-S.; Sung, H.-C. Landscape ecological approach to the relationships of land use patterns in watersheds to water quality characteristics. Landsc. Urban Plan. 2009, 92, 80–89. [Google Scholar] [CrossRef]
- Li, J.; Li, C.; Zhu, F.; Song, C.; Wu, J. Spatiotemporal pattern of urbanization in Shanghai, China between 1989 and 2005. Landsc. Ecol. 2013, 28, 1545–1565. [Google Scholar] [CrossRef]
- Li, M.; Zang, S.; Wu, C.; Na, X. Spatial and temporal variation of the urban impervious surface and its driving forces in the central city of Harbin. J. Geogr. Sci. 2018, 28, 323–336. [Google Scholar] [CrossRef] [Green Version]
- Liu, C.; Shao, Z.; Chen, M.; Luo, H. MNDISI: A multi-source composition index for impervious surface area estimation at the individual city scale. Remote Sens. Lett. 2013, 4, 803–812. [Google Scholar] [CrossRef]
- Liu, Z.; Li, Y.; Peng, J. Progress and perspective of the research on hydrological effects of urban impervious surface on water environment. Prog. Geogr. 2011, 30, 275–281. [Google Scholar]
- Luo, Y.; Zhao, Y.; Yang, K.; Chen, K.; Pan, M.; Zhou, X. Dianchi Lake watershed impervious surface area dynamics and their impact on lake water quality from 1988 to 2017. Environ. Sci. Pollut. Res. 2018, 25, 29643–29653. [Google Scholar] [CrossRef]
- McGarigal, K.; Marks, B.J. FRAGSTATS: Spatial pattern analysis program for quantifying landscape structure. PNW-GTR-351. Portland, OR: U.S. Department of Agriculture, Forest Service, Pacific Northwest Research Station. Gen. Tech. Rep. 1995, 122, 351. [Google Scholar]
- Qi, W.; Qu, Y.-b.; Liu, H.-y.; Li, L. Selection of representative landscape pattern indexes and land use division. China Land Sci. 2009, 23, 33–37. [Google Scholar]
- Ridd, M.K. Exploring a V-I-S (vegetation-impervious surface-soil) model for urban ecosystem analysis through remote sensing: Comparative anatomy for cities. Int. J. Remote Sens. 1995, 16, 2165–2185. [Google Scholar] [CrossRef]
- Romero-Calcerrada, R.; Perry, G.L. The role of land abandonment in landscape dynamics in the SPA ‘Encinares del río Alberche y Cofio, Central Spain, 1984–1999. Landsc. Urban Plan. 2004, 66, 217–232. [Google Scholar] [CrossRef]
- Salerno, F.; Gaetano, V.; Gianni, T. Urbanization and climate change impacts on surface water quality: Enhancing the resilience by reducing impervious surfaces. Water Res. 2018, 144, 491–502. [Google Scholar] [CrossRef]
- Sherard, J.L. A Current Review of Experience with Asphaltic Concrete Impervious Membranes on the Upstream Slope of Earth and Rockfill Dams. In Embankment Dams: James L. Sherard Contributions; ASCE: Reston, VA, USA, 1992; pp. 10–29. [Google Scholar]
- Song, M.; Du, J.; Zheng, W.; Li, C.; Biao, G. Quantifying the spatial-temporal changes of impervious surface landscape pattern from 1988 to 2015 in Qinhuai River Basin. J. Geo-Inf. Sci. 2017, 19, 238–247. [Google Scholar]
- Tang, J.; Di, L.; Rahman, S.; Yu, Z. Spatial–temporal landscape pattern change under rapid urbanization. J. Appl. Remote Sens. 2019, 13, 024503. [Google Scholar] [CrossRef]
- Uygun, B.Ş.; Albek, M. Determination effects of impervious areas on urban watershed. Environ. Sci. Pollut. Res. 2014, 22, 2272–2286. [Google Scholar] [CrossRef]
- Verbeiren, B.; Van De Voorde, T.; Canters, F.; Binard, M.; Cornet, Y.; Batelaan, O.; Verbeiren, B.; Van De Voorde, T.; Canters, F.; Binard, M.; et al. Assessing urbanisation effects on rainfall-runoff using a remote sensing supported modelling strategy. Int. J. Appl. Earth Obs. Geoinf. 2013, 21, 92–102. [Google Scholar] [CrossRef]
- Wang, W.; Yao, X.; Ji, M.; Zhang, J. Spectral data treatments for impervious endmember derivation and fraction mapping from Landsat ETM+ imagery: A comparative analysis. Front. Earth Sci. 2015, 9, 179–191. [Google Scholar] [CrossRef]
- Wang, Z.; Zhang, S.; Peng, Y.; Wu, C.; Lv, Y.; Xiao, K.; Zhao, J.; Qian, G. Impact of rapid urbanization on the threshold effect in the relationship between impervious surfaces and water quality in shanghai, China. Environ. Pollut. 2020, 267, 115569. [Google Scholar] [CrossRef]
- Wu, C.; Murray, A.T. Estimating impervious surface distribution by spectral mixture analysis. Remote Sens. Environ. 2003, 84, 493–505. [Google Scholar] [CrossRef]
- Xian, G.; Homer, C. Updating the 2001 National Land Cover Database Impervious Surface Products to 2006 using Landsat Imagery Change Detection Methods. Remote Sens. Environ. 2010, 114, 1676–1686. [Google Scholar] [CrossRef]
- Xiao, J.; Liu, X.; Ji, N.; Yu, L. Study on the Change of Landscape Pattern of Shijiazhuang City in the Process of Rapid Urbanization. J. Southwest China Norm. Univ. Nat. Sci. 2014, 39, 149–155. [Google Scholar]
- Yang, K.; Yuan, W.; Zhao, J.; Xu, S. Stream structure characteristics and its urbanization responses to tidal river system. Acta Geogr. Sin. 2004, 59, 557–564. [Google Scholar]
- Zhou, Z.-L.; Sha, J.-M.; Fan, Y.-X.; Shuai, C.; Gao, S. Temporal and spatial variations of impervious surface landscape pattern and the driving factors in Xiamen City, China. Chin. J. Appl. Ecol. 2020, 31, 230–238. [Google Scholar]
Figure 1.
Location and the spatial distribution of population density in the city center and suburbs of Shanghai including the changes of population, built-up area and PTIA (each year’s value of population, built-up area and PTIA divided by the data of 1965) and monitoring station of water quality.
Figure 1.
Location and the spatial distribution of population density in the city center and suburbs of Shanghai including the changes of population, built-up area and PTIA (each year’s value of population, built-up area and PTIA divided by the data of 1965) and monitoring station of water quality.

Figure 2.
The evolution of spatial distribution of impervious and non-impervious surfaces in Shanghai (a–e) (1965–2010). From 1965 to 2010, Shanghai’s impervious surfaces continued to expand from the city center to surround-ing suburbs.
Figure 2.
The evolution of spatial distribution of impervious and non-impervious surfaces in Shanghai (a–e) (1965–2010). From 1965 to 2010, Shanghai’s impervious surfaces continued to expand from the city center to surround-ing suburbs.

Figure 3.
Change of four types of impervious and non-impervious surfaces in Shanghai (1965–2010). WAT = water, HIS = high impervious surfaces, LIS = low impervious surfaces, PS = pervious surfaces.
Figure 3.
Change of four types of impervious and non-impervious surfaces in Shanghai (1965–2010). WAT = water, HIS = high impervious surfaces, LIS = low impervious surfaces, PS = pervious surfaces.

Figure 4.
The landscape metrics of impervious surfaces at the landscape level (1965–2010). (a) LPI decreased year by year from 82 to 23; (b) CONTANG decreased year by year from 22 to 28; (c) SHDI increased year by year from 0.6 to 1.2; (d) AI decreased year by year from 86 to 73.
Figure 4.
The landscape metrics of impervious surfaces at the landscape level (1965–2010). (a) LPI decreased year by year from 82 to 23; (b) CONTANG decreased year by year from 22 to 28; (c) SHDI increased year by year from 0.6 to 1.2; (d) AI decreased year by year from 86 to 73.

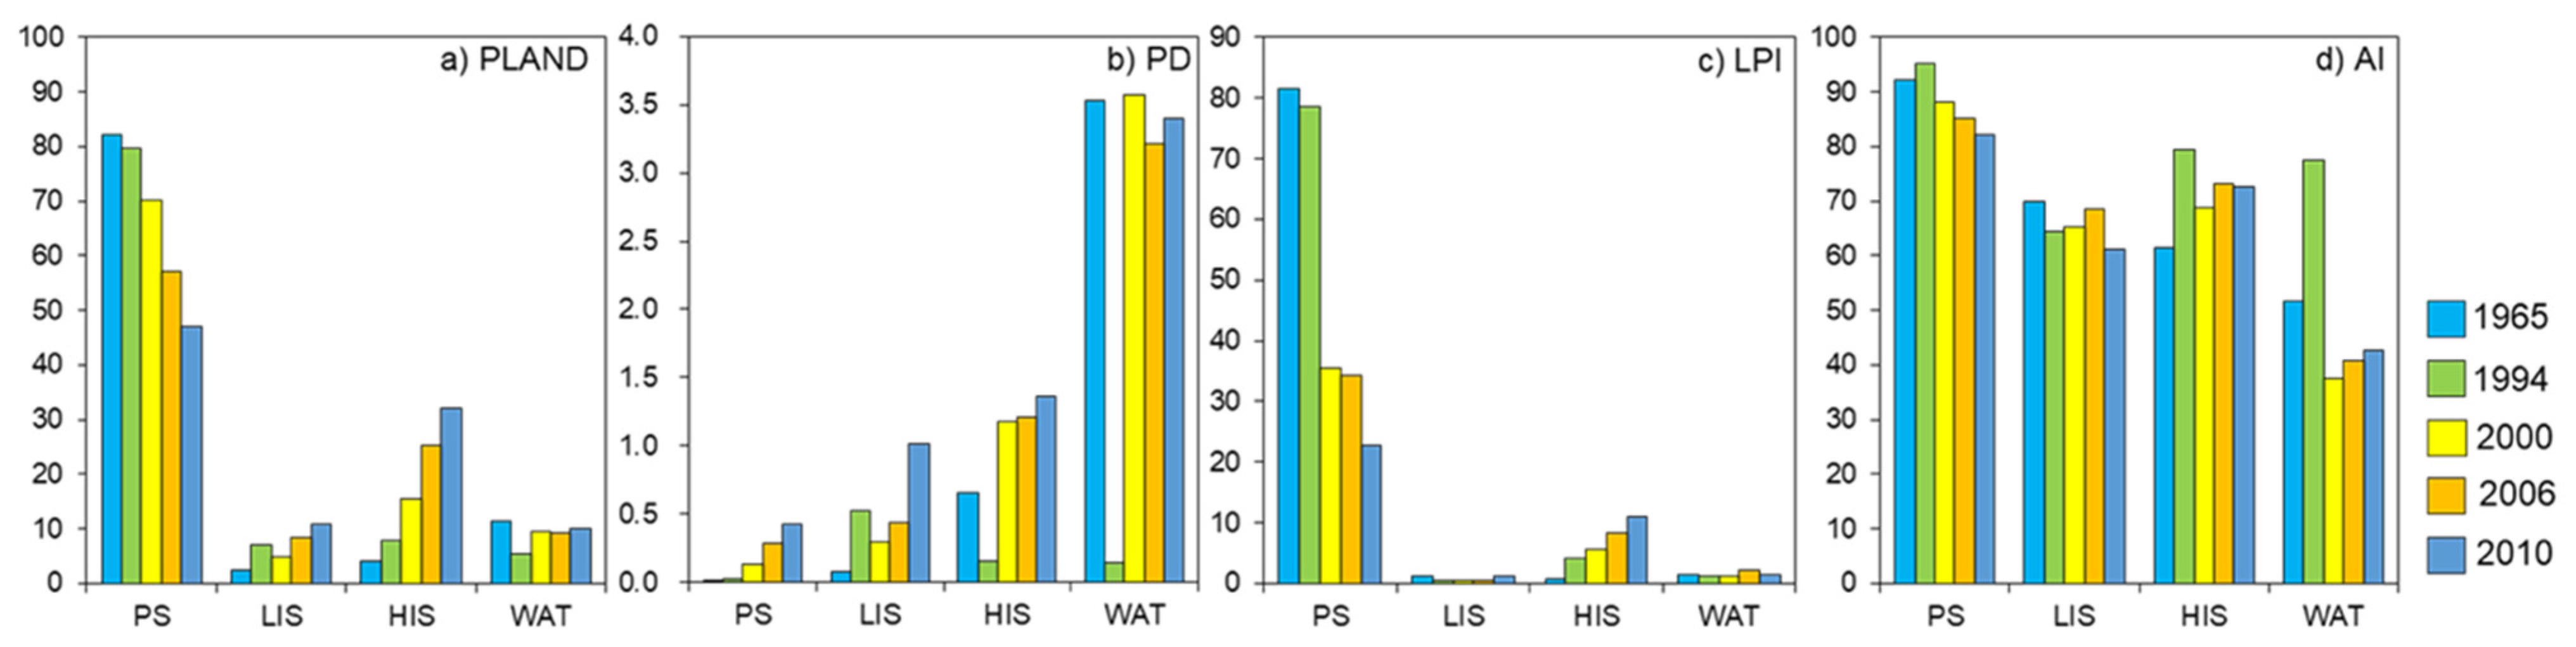
Figure 5.
The landscape metrics of different impervious and non-impervious surfaces in Shanghai (1965–2010). PS = pervious surfaces, LIS = low impervious surfaces, HIS = high impervious surfaces, WAT = water. (a) The PLAND of PS was decreasing year by year. The PLAND of LIS and HIS were increasing year by year and the PLAND of HIS had the fastest rising speed, up to 70%, WAT kept stable; (b) The PD of PS, LIS and HIS were increasing year by year, WAT kept stable; (c) The LPI of PS decreased obviously from 82 to 23 and the LPI of HIS increased year by year, reaching 11.04 in 2010; (d) The AI of PS and LIS decreased from 92 to 82 and from 70 to 61 and The AI of HIS and WAT kept stable.

Figure 6.
RDA two-dimensional sort of impervious landscape and water quality in Shanghai. (a) The abbreviations in the figure are defined in the Table for Terms and abbreviations. (b) EV_total is the sum of the explanatory ability of all environmental variables. (c) EV_Configuration is only the explanatory abilities of spatial configurations such as PD, AI, and CONTAG.


Table 1.
The impervious surface and non-impervious surface coefficient of each land use type.
| Land Use Type | ISC | Sample Size | Standard Deviation | Reclassification of Impervious Surfaces | Combination of Land Use Types | Interval Range of ISC |
|---|---|---|---|---|---|---|
| Park green space | 0.33 | 20 | 14.12 | Low impervious surfaces | New residential, villas, parks | 0–60% |
| villa | 0.49 | 30 | 10.82 | 0–60% | ||
| New residential | 0.55 | 30 | 9.64 | 0–60% | ||
| Public buildings | 0.64 | 20 | 11.03 | High impervious surfaces | Old residential, public building, industrial land, road and square | 60–100% |
| Old residential | 0.73 | 30 | 10.36 | 60–100% | ||
| Industrial land | 0.75 | 20 | 11.95 | 60–100% | ||
| Road and square, roofs | 1.00 | / | / | 60–100% | ||
| / | / | / | / | Pervious surface | Agricultural land, natural village | 0 |
| / | / | / | / | Water | Rivers, lakes | / |
Table 2.
The ecological implications and calculation formula of landscape metrics.
| Types | Landscape Metrics | Abbreviation | Ecological Meaning | Calculation Formula |
|---|---|---|---|---|
| Area | Percentage of Landscape | PLAND | The ratio of the area of a particular type of patch to the total area of the regional landscape | |
| Largest Patch Index | LPI | The ratio of the largest patch in the same type of patch to the total area of this type of patch | ||
| density | Patch Density | PD | Reflect the degree of fragmentation of the landscape and the degree of spatial heterogeneity of the landscape | |
| Shannon Diversity Index | SHDI | Reflects the change in the number of landscape elements and the proportion of each landscape element. When the landscape is composed of a single element, its value is 0 | SHDI = | |
| Gathering | Aggregation Index | AI | The ratio of the number of adjacent public sides of a landscape type grid to the maximum possible number of public sides between the grids of this type of landscape, which represents the degree of aggregation of the type of landscape | AI = |
| Contagion Index | CONTAG | Describe the degree of agglomeration of different types of patches in the landscape. The larger the value, the larger the landscape is composed of a few large clusters, and the smaller it is composed of many scattered small patches. | CONTAG = |
Table 3.
The landscape metrics of impervious surfaces in each district of Shanghai (2010).
| Order | District | PS (%) | LIS (%) | HIS (%) | WAT (%) | PD | CONTAG | SHDI |
|---|---|---|---|---|---|---|---|---|
| 1 | Average | 36.0358 | 22.0342 | 35.0286 | 6.9014 | 12.7312 | 41.4283 | 0.9974 |
| 2 | Baoshan | 52.9339 | 16.1899 | 23.8687 | 7.0076 | 10.0282 | 27.7171 | 1.1597 |
| 3 | Fengxian | 76.4006 | 5.6739 | 11.3865 | 6.5389 | 6.7728 | 48.1139 | 0.7942 |
| 4 | Huangpu | 0.2216 | 19.9943 | 69.2707 | 10.5134 | 16.3485 | 60.0208 | 0.8265 |
| 5 | Jiading | 60.6294 | 10.4614 | 20.9815 | 7.9277 | 9.3539 | 29.7429 | 1.0681 |
| 6 | Jinshan | 79.1254 | 4.6228 | 10.2912 | 5.9607 | 5.0435 | 52.1657 | 0.7295 |
| 7 | Jingan | 0.3228 | 32.5468 | 66.6594 | 0.4711 | 27.2628 | 63.8487 | 0.6794 |
| 8 | Luwan | 0.4088 | 28.4314 | 65.2797 | 5.88 | 22.9346 | 59.6815 | 0.8251 |
| 9 | Minhang | 48.5804 | 17.8723 | 25.9988 | 7.5485 | 4.7871 | 24.5934 | 1.2037 |
| 10 | Pudong | 54.9473 | 11.3881 | 23.2103 | 10.4543 | 2.3304 | 24.9218 | 1.1515 |
| 11 | Putuo | 22.1126 | 38.458 | 36.6143 | 2.8151 | 19.6043 | 34.0858 | 1.1696 |
| 12 | Qingpu | 64.2581 | 5.6646 | 11.486 | 18.5913 | 3.2748 | 34.743 | 1.0082 |
| 13 | Songjiang | 69.1375 | 10.9177 | 12.3459 | 7.5989 | 4.5653 | 40.522 | 0.9511 |
| 14 | Xuhui | 9.918 | 36.4003 | 47.1942 | 6.4875 | 19.6795 | 37.29 | 1.1289 |
| 15 | Yangpu | 15.3587 | 30.9553 | 45.1743 | 8.5117 | 13.1258 | 36.1203 | 1.2194 |
| 16 | Zhabei | 17.9483 | 39.1993 | 40.8339 | 2.0185 | 20.986 | 40.9064 | 1.1199 |
| 17 | Changning | 4.2689 | 43.7712 | 49.8624 | 2.0974 | 17.6012 | 48.3799 | 0.9243 |
Note: the abbreviations have the following meanings, PS: pervious surfaces, LIS: low impervious surfaces, HIS: high impervious surfaces, WAT: water.
Table 4.
Pearson correlation between landscape metrics of impervious surfaces and socio-economic drivers.
Table 4.
Pearson correlation between landscape metrics of impervious surfaces and socio-economic drivers.
| POP_D | GDP | UAGDP | PPI | PSI | PTI | |
|---|---|---|---|---|---|---|
| PS (%) | −0.938 ** | −0.146 | −0.684 ** | −0.666 ** | −0.859 ** | −0.886 ** |
| LIS (%) | −0.789 ** | −0.185 | −0.371 | −0.609 ** | −0.749 ** | −0.775 ** |
| HIS (%) | −0.951 ** | −0.162 | −0.776 ** | −0.580 * | −0.868 ** | −0.886 ** |
| WAT (%) | −0.388 | −0.341 | −0.016 | −0.041 | −0.429 | −0.407 |
| PD | −0.913 ** | −0.385 | −0.542 * | −0.541 * | −0.858 ** | −0.873 ** |
| CONTAG | −0.332 | −0.523 * | −0.371 | −0.503 * | −0.377 | −0.313 |
| SHDI | −0.049 | −0.411 | −0.089 | −0.698 ** | −0.071 | −0.001 |
Note: ‘*’ significant at p = 0.05; ‘**’significant at p = 0.01; the abbreviations have the following meanings, PS: pervious surfaces, LIS: low impervious surfaces, HIS: high impervious surfaces, WAT: water.
Publisher’s Note: MDPI stays neutral with regard to jurisdictional claims in published maps and institutional affiliations. |
© 2021 by the authors. Licensee MDPI, Basel, Switzerland. This article is an open access article distributed under the terms and conditions of the Creative Commons Attribution (CC BY) license (https://creativecommons.org/licenses/by/4.0/).
Share and Cite
MDPI and ACS Style
Yao, Y.; Zhang, S.; Shi, Y.; Xu, M.; Zhang, J.; Zhang, Y.; Zhao, J. Landscape Pattern Change of Impervious Surfaces and Its Driving Forces in Shanghai during 1965–2010. Water 2021, 13, 1956. https://doi.org/10.3390/w13141956
AMA Style
Yao Y, Zhang S, Shi Y, Xu M, Zhang J, Zhang Y, Zhao J. Landscape Pattern Change of Impervious Surfaces and Its Driving Forces in Shanghai during 1965–2010. Water. 2021; 13(14):1956. https://doi.org/10.3390/w13141956
Chicago/Turabian StyleYao, Yang, Sen Zhang, Yuqing Shi, Mengqi Xu, Jiaquan Zhang, Yongming Zhang, and Jun Zhao. 2021. "Landscape Pattern Change of Impervious Surfaces and Its Driving Forces in Shanghai during 1965–2010" Water 13, no. 14: 1956. https://doi.org/10.3390/w13141956
Note that from the first issue of 2016, this journal uses article numbers instead of page numbers. See further details here.