
Phosphorus Release from Sediments in a Raw Water Reservoir with Reduced Allochthonous Input
by
 , and
, and
Bin Zhou
1,2,*, 
Xujin Fu
3,
Ben Wu
2,
Jia He
4,
Rolf D. Vogt
5 ,
,
Dan Yu
3,
Fujun Yue
6 and
Man Chai
3 1
State Key Laboratory of Environmental Criteria and Risk Assessment, Chinese Research Academy of Environmental Sciences, Beijing 100012, China
2
Tianjin Academy of Eco-Environmental Sciences, Tianjin 300191, China
3
Tianjin Huanke Environmental Consulting Co., Ltd., Tianjin 300191, China
4
Beijing Key Laboratory of Urban Hydrological Cycle and Sponge City Technology, College of Water Sciences, Beijing Normal University, Beijing 100875, China
5
Center for Biogeochemistry of the Anthropocene, Department of Chemistry, University of Oslo, N-0315 Oslo, Norway
6
School of Earth System Science, Tianjin University, Tianjin 300072, China
*
Author to whom correspondence should be addressed.
Water 2021, 13(14), 1983; https://doi.org/10.3390/w13141983
Submission received: 9 June 2021
/
Revised: 16 July 2021
/
Accepted: 16 July 2021
/
Published: 19 July 2021
(This article belongs to the Special Issue Watershed Water Environment and Hydrology under the Influence of Anthropogenic and Natural Processes)
Abstract
:Following successful abatement of external nutrient sources, one must shift the focus to the role of phosphorus (P) release from sediment. This enables us to better assess the causes for sustained eutrophication in freshwater ecosystem and how to deal with this challenge. In this study, five sediment cores from the shallow YuQiao Reservoir in northern China were investigated. The reservoir serves as the main raw water source for tap water services of Tianjin megacity, with a population of 15.6 million. Sediment characteristics and P fractions were determined in order to assess the role of the sediments as the P source to the water body. The total P content (TP) in sediments was similar to what was found in catchment soils, although the P sorption capacity of sediments was 7–10 times greater than for the catchment soils. Isotherm adsorption experiments documented that when P concentration in overlying water drops below 0.032–0.070 mg L−1, depending on the site, the sediment contributes with a positive flux of P to the overlying water. Adsorbed P at different depths in the sediments is found to be released with a similarly rapid release rate during the first 20 h, though chronic release was observed mainly from the top 30 cm of the sediment core. Dredging the top 30 cm layer of the sediments will decrease the level of soluble reactive phosphate in the water being sustained by the sediment flux of P.
1. Introduction
1.1. Phosphorus Biogeochemistry and Indexes
Phosphorus (P) is an essential and usually limiting nutrient for primary production in aquatic ecosystems. Main anthropogenic P sources to surface water are generally distinguished between external sources, originating from diffuse (agricultural and aquaculture areas) or point sources (industrial and domestic sewage), and the internal source, which is P released from the sediments [1,2]. An increased flux of P to aquatic system degrades the water quality through eutrophication. The aquatic ecosystem responds to the increased nutrient levels with algae blooms pumping the P down into the lake sediments [3,4]. In the sediments, the mineralization of this organic P builds up a pool of adsorbed labile P. Depending on environmental conditions, the sediment may thereby also act as a P source, releasing labile P to the overlying water. Lake sediment is thus often the key element regulating the trophic level of its aquatic ecosystem [5]. A large number of biochemical and abiotic processes play important roles at the sediment–water interface governing the flux of P to or from the lake water [6,7]. Mineralized P in the sediment is in equilibrium with the pore water, which exchanges with the overlying water through diffusion and convection [8]. However, factors governing the rate of mineralization of P and the release mechanisms between the sediments and water are not well known.
As external pollution sources are eventually being increasingly curbed through effective abatement actions, the internal flux of P from the sediments is becoming the major P source, sustaining a high trophic level in many water bodies. Knowledge on how to limit this internal P loading from the sediment has thus become the key to achieve a sustainable restoration of lake ecosystems [1,8,9]. More studies on this issue are thus now required in order to enhance our ability to select optimum final abatement actions, solving the eutrophication challenge.
Risk of P release from sediments is mainly dependent on the form of P in the sediment, the concentration of P in the overlying water, the sediment texture and its pool of organic matter, as well as several physicochemical factors (i.e., temperature, pH, redox potential) [10,11,12]. The particle size distribution or texture of the sediment govern both the sorption capacity and the porosity, and thus the flow of pore-water. For example, high content of clay and organic matter in the sediments represented large surface area and number of sorption sites, facilitating a great P adsorption capacity [13].
Main forms of P in the sediments are calcium phosphates minerals P (Ca–P), non–mineral P (Fe/Al–P), exchangeable labile P (ex–P), and organic P (OP) [14]. Phosphorus sorption index (PSI) and degree of P saturation (DPS) are proxies that are commonly used to assess the risk of P release from sediments [15]. The threshold concentration of aqueous soluble reactive phosphorus (SRP) for P release is defined as the zero equilibrium P concentration (EPC0) [14,16]. The difference between EPC0 and SRP in overlying water is thus used as a criterion to determine whether the sediment acts as a source or sink of P., i.e., the sediment is a P source if the EPC0 value is higher than SRP in the overlying water body. When deciding the depth of dredging, for removal of contaminated sediments, it is therefore necessary to relate the level of EPC0 at the different depths in the sediments to the required level of SRP in the overlying water.
1.2. Shifting from External to Internal P Sources
YuQiao Reservoir (YQR) is the final water reservoir in the Luanhe–Tianjin water diversion development that supplies raw water to Tianjin for domestic supply, agricultural irrigation, and industrial use [17]. Thus, the water quality of the reservoir directly determines the safety of the city’s water supply system. The rapid economic development within the Luanhe River and the reservoir’s upper catchment basins has intensified the eutrophication in the reservoir since the 1990s [18,19]. Long–term monitoring data show that monthly TP concentrations and the annual tropic indexes have increased rapidly from 0.03 mg L−1 and 15.5 in 1990, to 0.04 mg L−1 and 35.5, respectively, in 2004 [20]. This posed a threat to drinking water quality and thus represented a potential risk for the water supply system of the Tianjin megacity. As the reservoir is the major drinking water source for Tianjin, its eutrophication has required increased investment for water treatment [20].
In the past, the omnipresence of agriculture in the vicinity around the reservoir and the presence of aquaculture in the reservoirs, as well as the disposal of sewage from the local population into channels, has contributed to a massive flux of nutrients and organic matter to the reservoir [21]. In the up–stream Daheiting Reservoir, the total reactive nitrogen (TN) concentration reached its maximum (5.3 mg L−1) in 2013 and the TP concentration peaked at 0.34 mg L−1 in 2016 [22]. This eutrophication in the upstream reservoir led to a high frequency of algae blooms with anoxic conditions in the bottom water. This in turn posed a serious threat to the water quality of the downstream YQR. Owing to the rapid deterioration of upstream water and the release of endogenous phosphorous from the sediments of the reservoir, the water quality of YQR gradually deteriorated. The situation became acute in 2016 when a large–scale cyanobacteria bloom occurred in YQR with an algal density of more than 240 million cell L−1 [18]. This algae bloom resulted in a rapid decline in dissolved oxygen (around 0.7 mg L−1), which seriously threatened the drinking water safety for the millions of citizens living in the Tianjin metropole, forcing the water supply from the YQR to be interrupted [22,23].
Summing up, external input was the main source for the high nutrient levels in the YQR water body. This external input comprised a number of sources, such as the water flux in the Luanhe River and the inflow from the Daheiting reservoir, as well as local seepage from numerous solid waste dumpsites, agricultural non–point sources, fishponds, and village sewage around the reservoir [20,24]. Since the massive alga bloom incident in 2016, a number of comprehensive abatement actions has successfully reduced the external flux of P to the reservoir. As a result, the external sources of nutrients to the YQR are now becoming gradually controlled [20]. The P flux from the sediments now constitute instead the major driving factor for the present sustained eutrophication of the water body [8]. Thus, investigation of its internal P sources with the aim of identifying targeted and optimal treatment measures, ensuring the abatement of algae blooms in the YQR, have become top priority for a sustainable management of the raw water source. In the present study, the contents of different P pools in sediment were determined, and laboratory simulation experiments of P release were conducted. The aim of this study is to: (1) investigate the spatial distribution of P forms in sediment cores; (2) assess factors governing release of P from the sediments; (3) quantify the rate of P release from the sediments; and (4) suggest suitable measure for abating the internal flux of P to the water body.
2. Materials and Methods
2.1. Study Area
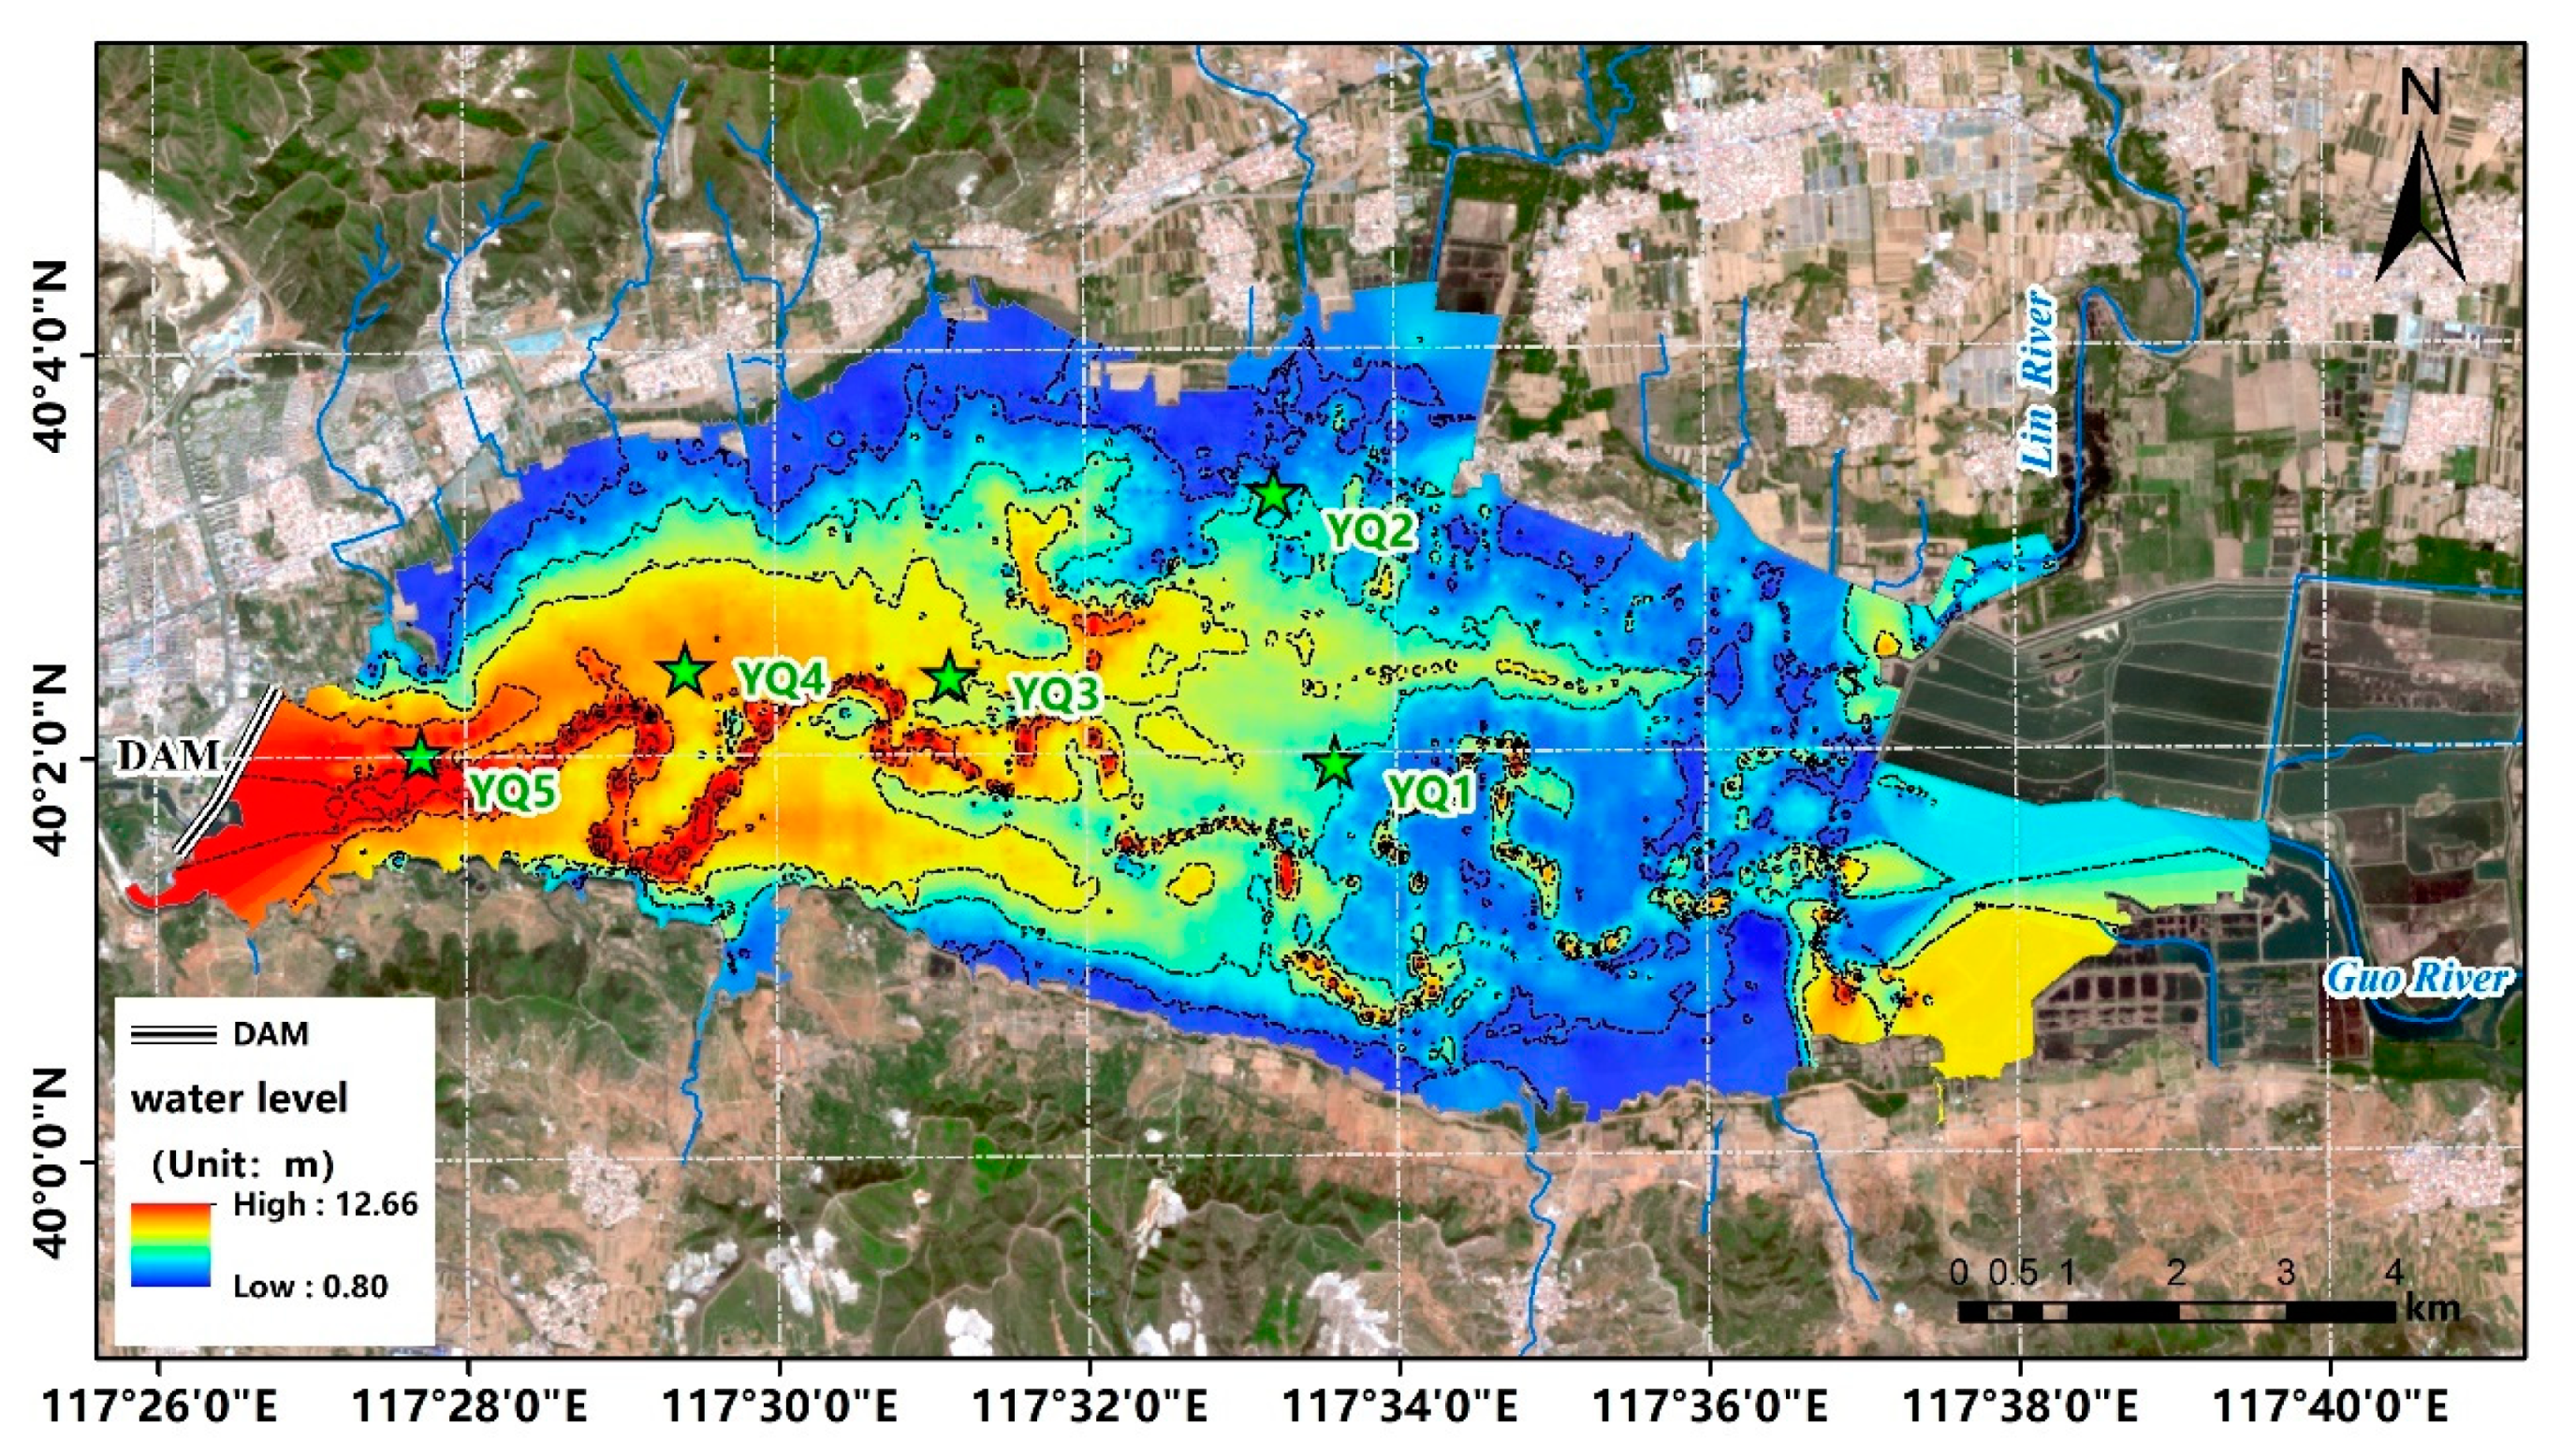
YuQiao Reservoir (39°23′–40°23′ N; 117°26′–118°12′ E) is located in the northern part of Tianjin municipality. This reservoir was formed by a dam, impounded in the Zhou River in 1960, and has formed a shallow lake (0–12.7 m) with an average depth of 4.6 m (Figure 1). Through the Luanhe–Tianjin water diversion, the main water sources for YQR are the Panjiakou and Daheiting reservoirs. In addition, the Lin, Sha, and Li rivers (named Guo River after confluence, Figure 1) are three major tributaries that feed directly into the YQR. The entire catchment area of YQR is about 2060 km2, with an average water storage capacity of 1.6 × 10¹⁰ m3. The catchment is dominated by flat plains, with fluvo–aquic soils, comprising 34.6% of the catchment area. The hill (<500 m a.s.l.) and mountain (>500 m a.s.l.) regions, with mainly brown– and cinnamon soils, comprise 32% and 24.3%, respectively, of the catchment. Urban area accounts for the final 9.1% of the YQR basin area [21]. The reservoir water area in the plains is 74 km2, accounting for 3.6% of the basin area [12,21]. Farmland on the plains and forest in the hills are the two main land uses, covering 33.0% and 40.9% of the entire catchment, respectively. Paddy fields account for 12.6% of the farmland area. Annual average temperature and rainfall is between 10.4–11.5 ℃ and 748.5 mm, respectively. The rainfall shows seasonal monsoonal variation, with most precipitation during the summer months July and August.
2.2. Sampling and Analysis
Five sediment cores were collected from the YQR, capturing the range of water depth (Figure 1) in April 2017. To decrease the direct impact from tributaries, the distance between the sediment core sampling sites and the fluctuation zone is more than 1.5 km, e.g., YQ 2. Water depth increases in the direction of main flow from east (YQ 1) to west (YQ 4), with the deepest water level close to the dam (YQ 5). Sediment cores were sectioned in different depths. For example, each sediment core was sectioned into 10 cm layers along the top 0–50 cm, and at 15 cm intervals below 50 cm for soil basic parameters analysis, while the sectioning into 30 cm layers was used for simulation experiments. All sediment samples were sealed in labeled centrifuge tubes and transported to the laboratory on ice. Sediment pH, particle size distribution (PSD), organic matter content, and effective cation exchange capacity (CECe) were determined using methods as described in a preceding study [25]. Briefly, PSD between silt (0.002–0.05 mm), very fine sand (0.05–0.1 mm), fine sand (0.1–0.25 mm), and clay (<0.002) were determined by a laser particle size analyzer. Organic matter content was determined gravimetrically as the loss on ignition (LOI) at 550 ℃, and CECe was measured by extraction using BaCl2. Amorphous Fe and Al–oxyhydroxide were extracted separately with ammonium oxalate (Feox and Alox) and citrate–bicarbonate–dithionite (Fecbd, Alcbd), and determined in the extracts using ICP–OES. All of the sediment characteristics were determined for all core sections, except for the YQ 1 sediment core, owing to limited samples.
Total inorganic P (IP) in the sediments was extracted using hot (70 °C) 6 mol L−1 H2SO4. The total P (TP) content was determined in a similar manner after combustion of the sediment sample at 550 °C, while organically bound P (OP) was calculated as the difference between TP and IP. The P in extracts of TP and IP were analyzed using Inductively Coupled Plasma Optic Emission Spectroscopy (ICP–OES). Soil test phosphorus concentration (STP), commonly used for agricultural nutrient management, was conducted using the Mehlich–3 extractant [26]. STP in the extract was determined by the molybdenum blue method [27]. P pools in sediment core segments were sequentially extracted into exchangeable P (EX–P), P adsorbed to amorphous iron (Fe–P), and calcium phosphate minerals P (Ca–P), using MgCl2, NaOH + NaCO3, and HAc + NaAc as extractants, respectively [28].
2.3. Sorption Index and P Saturation
P sorption index (PSI) [15] is determined as a single–point isotherm by mixing the sediment with an excess of orthophosphate–P (1.5 mg g−1 sediment) and measuring the concentration of bioavailable P (i.e., STP) remaining in solution. The index is given as the ratio of sorbed (X in mg P kg−1) over the log concentration of STP (log C in mg P L−1) according to Equation (1):
Bache and Williams (1971) found that both the arbitrary value of PSI and STP provided suitable relative proxies for the P sorption capacity (PSC) of the soil. The sum of PSI and STP is therefore applied as a measure for soil PSC in this study. Degree of P Saturation (DPS) in the sediments was accordingly determined using Equation (2).
2.4. Sorption Experiments Fordetermination of EPC0
Aliquots of 0.5 g integrated sediment samples from 0–30 cm and 30–60 cm of the cores were mixed with 50 mL solution of different KH2PO4 concentrations (0.00, 0.025, 0.05, 0.1, 0.2, 0.5, 1, 5, 15, 50, 75 mg L−1) in centrifuge tubes at room temperature. The samples were shaken for 24 h on a shaker set to rotate at 260 rpm. The supernatant was separated by centrifugation immediately after sampling and filtered through a 0.45 µm membrane filter. Phosphate in the filtrate was analyzed using the molybdenum blue method.
2.5. Phosphorus Release Experiment
Each sediment core was sectioned at 30 cm intervals (0–30, 30–60, and 60–90 cm) into three sediment columns. The level of filtered ambient lake water, which was collected from one site, above the open sediment column was kept between 60–80 cm. After 1, 2, 8, 15, 30, 60, 120, 180, 240 h, 0.1 L water was gently collected at 10 cm above sediment surface and replaced by filtered lake sample water, avoiding any disturbance of the sediment.
The release rate of P (R) is calculated using Equation (3) [22]:
where R is release rate (mmol m−2 d−1); V is the water volume in the sedimentary column (L); C0, Cn, Cj − 1 are SRP concentration (mmol P L−1) in the samples collected at the initial, n, and j − 1 times, respectively. Ca is the SRP concentration of added water sample (mmol L−1); Vj−1 is the volume of collected water sample at time j − 1; S is the interface surface area of water and sediment (m2); and t is the release time (d). SRP was determined by the molybdenum blue method.
2.6. Data Statistics
SPSS 22.0 and Excel 2019 were used for statistical data analysis. Origin2017C software (Originlab, Northampton, MA, USA) was used for figure drawing. Correlation between variables were analyzed by Pearson’s correlation coefficients (p < 0.05).
3. Results and Discussion
3.1. Sediment Core Characteristics and Variablity
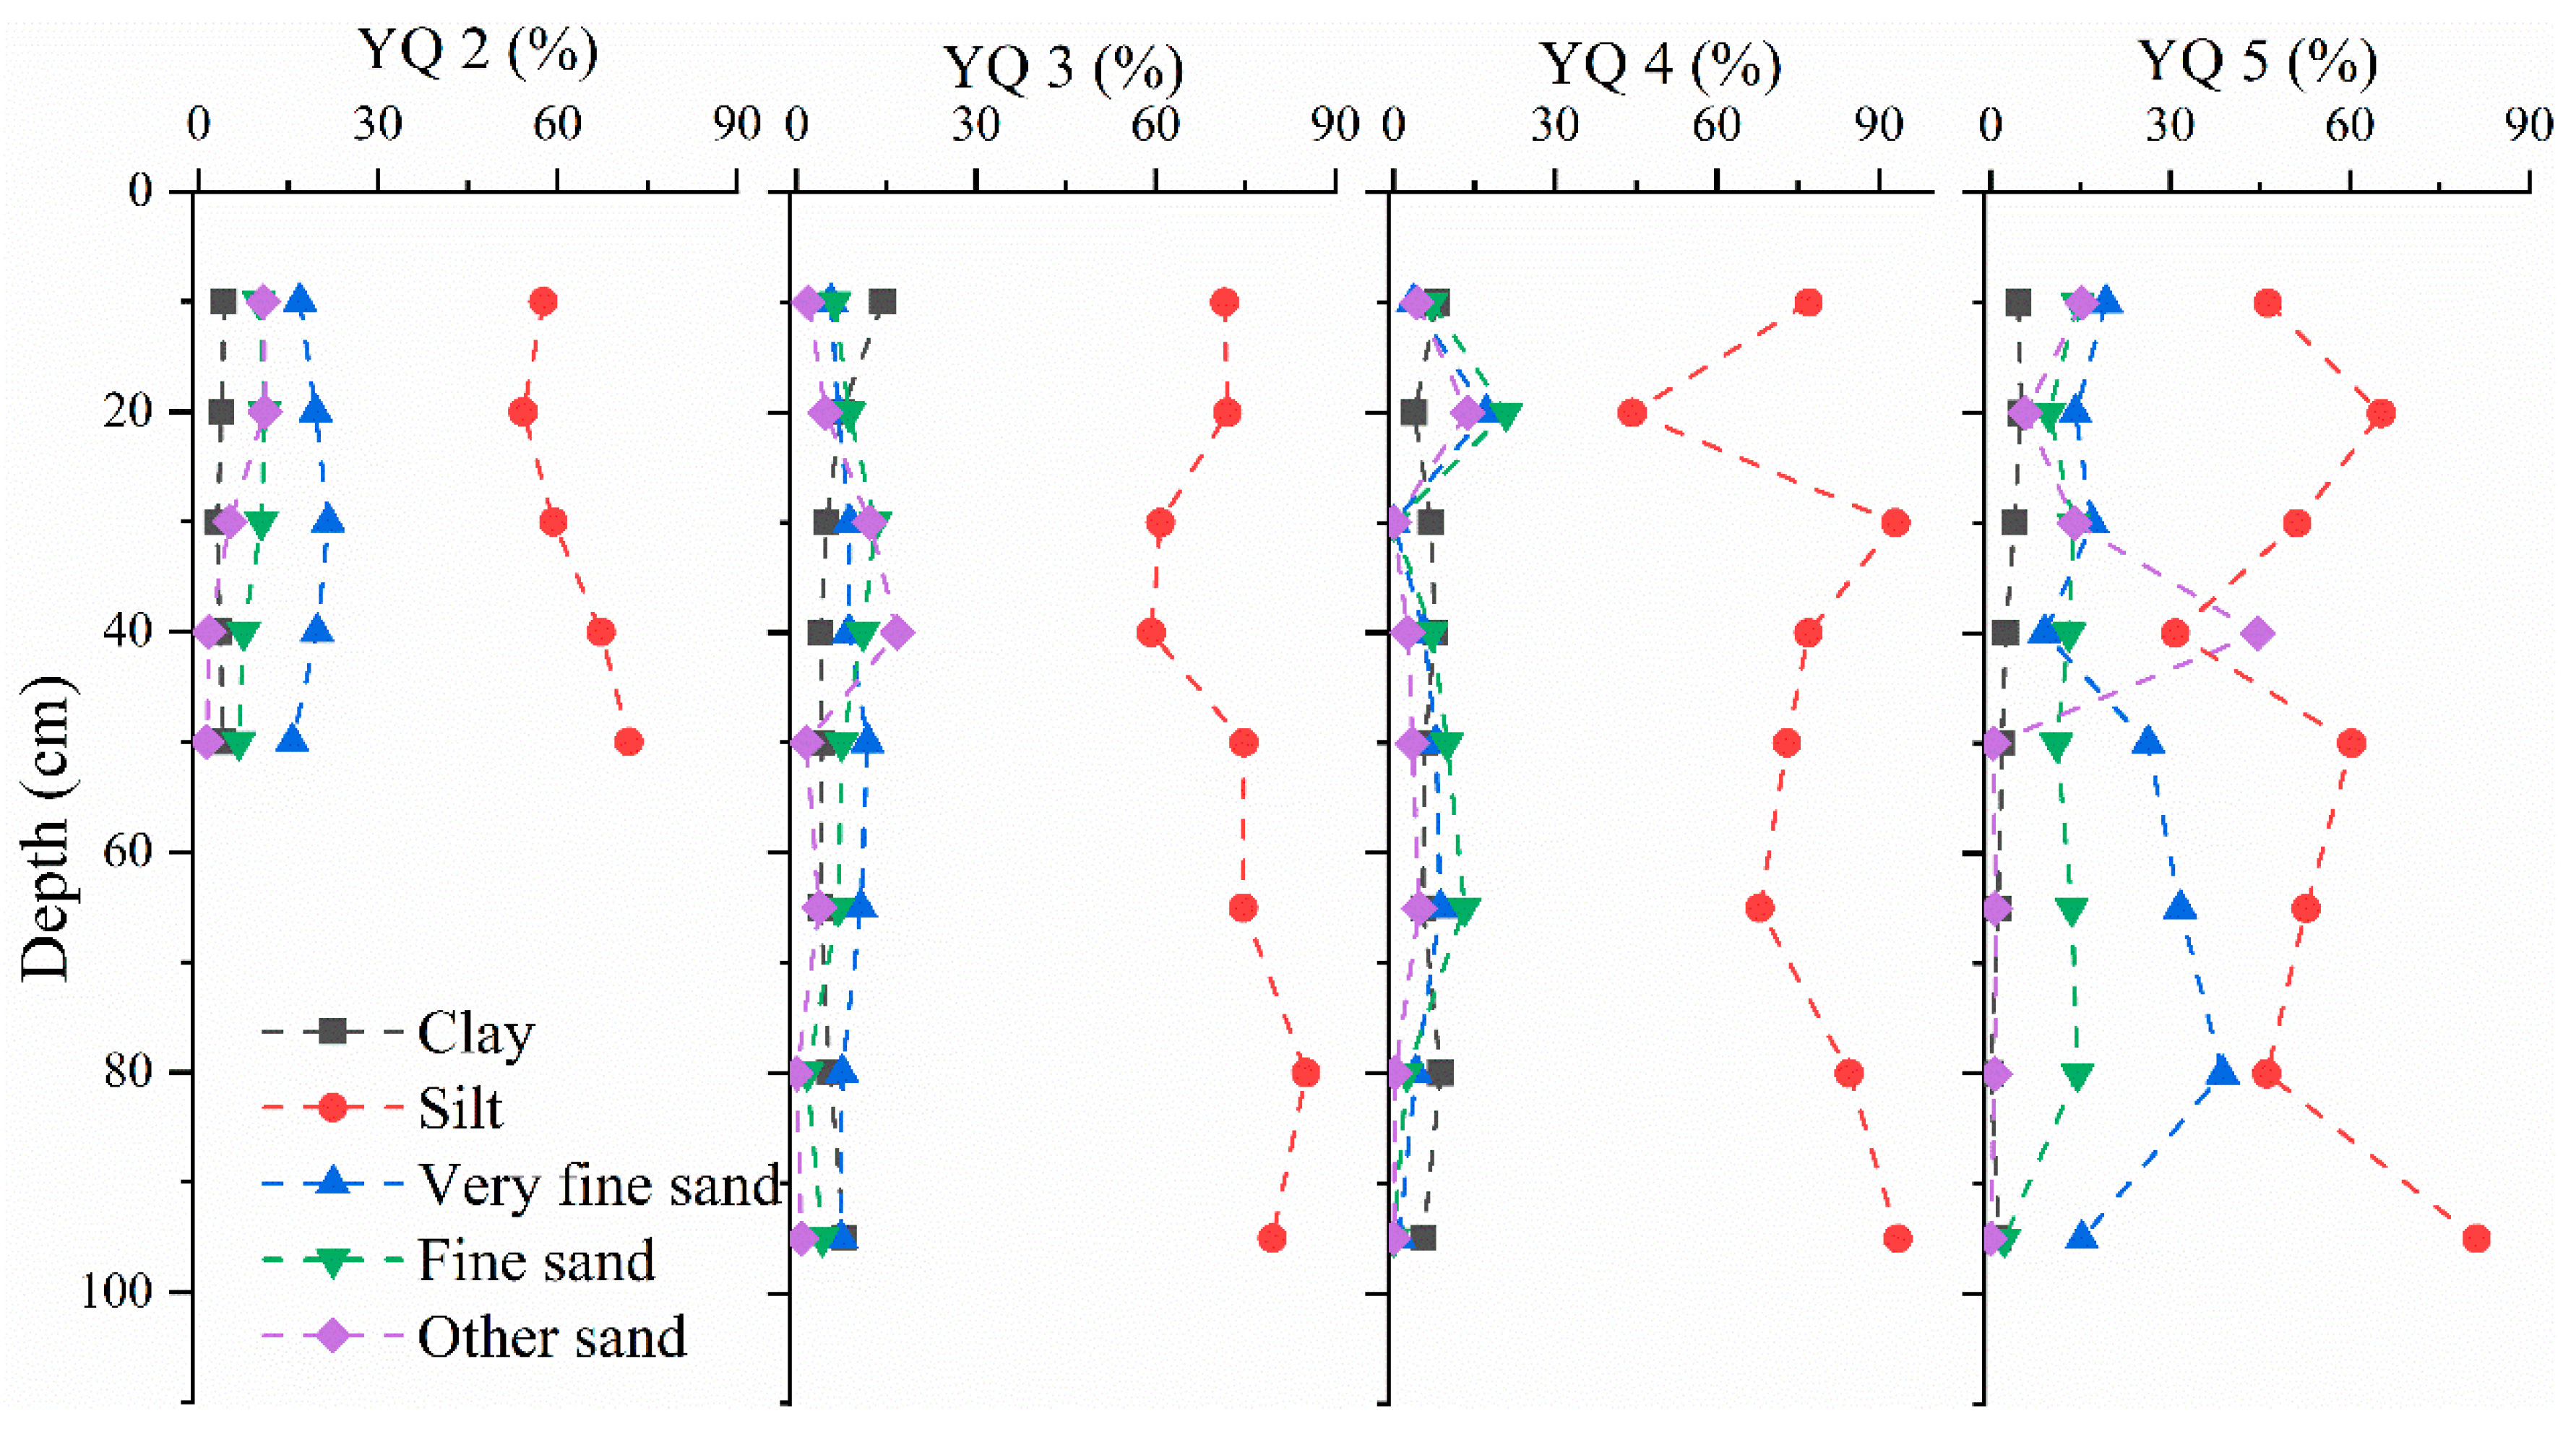
The sediment in YQR is silt loam mainly composed of silt with a minor fraction of clay (Figure 2). This is similar to the particle size distribution of soils in the flat plain region of the local catchment [29]. The clay content decreased further from the top to the bottom of sediment core (Figure 2).
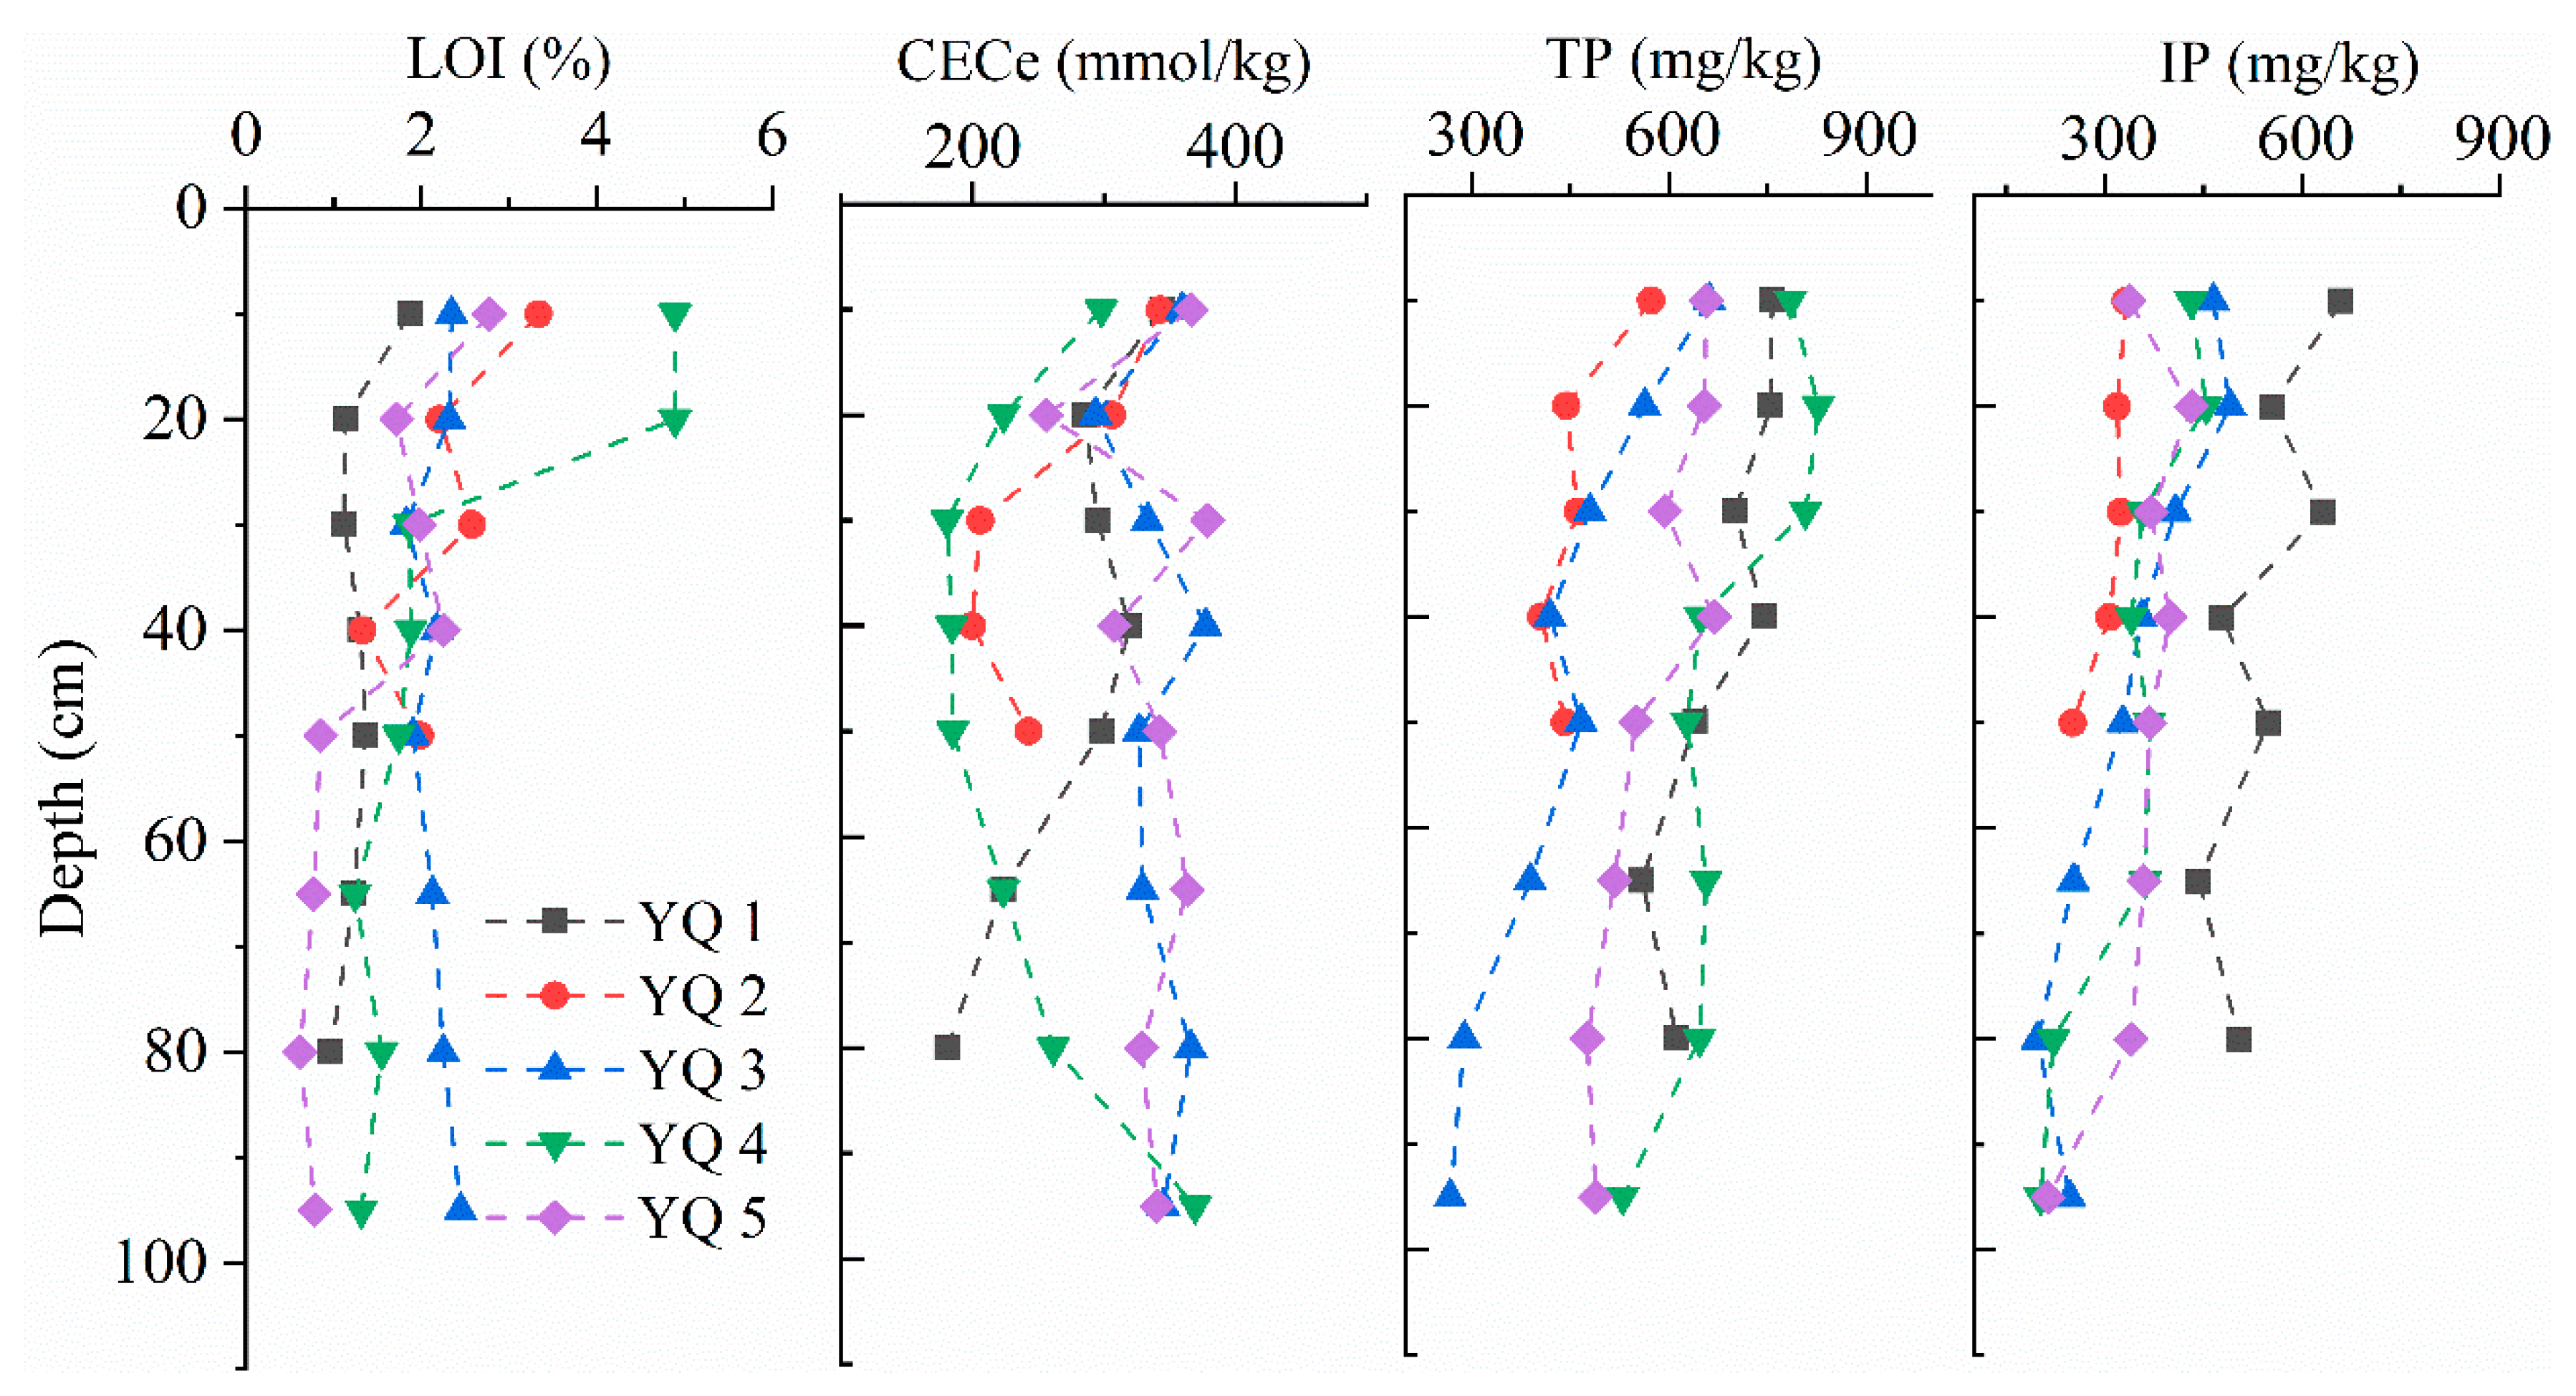
The organic matter content in the sediments is also low, with LOI ranging only from 0.62 to 4.9%, with a mean value of only 1.9% (Table 1, Figure 1). Still, this is 60% higher than what was measured at the end of the 1980s (1.198%) [30]. The highest organic content is found in the top sediments (0–30 cm) (Figure 3), especially in the two middle sediment cores (YQ 3 and 4). The low average LOI are found at the shallowest (YQ1) and deepest water depth (YQ 5) of the reservoir (Table 1, Figure 1). The organic matter content decreases with sediment depth, reaching an organic content in the sediments deeper than 80 cm, which is close to the levels that were measured at the end at the 1980s [30]. Although this is likely partly due to the gradual mineralization of the organic matter in the sediments over time, it may also reflect a rapid enrichment of deposited organic matter over the past 30 years. Based on the comparably low clay and organic matter content, the sorption capacity at the sediments is expected to be low, and the risk of phosphate release is thus high.
CECe reflect the sediment’s ability to hold cations, which influences other soil chemical properties, e.g., adsorption and desorption capacity, and pH [25,31]. The CECe of sediment cores ranged from 180 to 379 mmol/kg, with a mean value of 294 mmol/kg (Figure 3). The base saturation is high with calcium and magnesium ions contributing more than 85% of exchangeable cations, while the percentage of exchangeable iron and aluminum ions are relatively minor. The lowest average CECe are found at YQ 2 and 4, while the highest average CECe are observed at YQ 3 and 5 (Table 1). The spatial variation in CECe does thus not appear to be governed by the clay nor organic matter content.
The concentration of TP in the sediment ranged from 267 to 827 mg/kg, with an average of 577 mg/kg (Figure 3). This is similar to what was found in the local catchment soil [25]. Compared to the levels measured in the 1980s (440 mg/kg) the TP has increased by nearly 30% [32]. It is worth noting that the TP in the middle of the reservoir (YQ 4 with the highest organic content in the surface layers) reached 827 mg/kg at 10–20 cm (Figure 3). Along with the clay and organic matter content, the TP also gradually decreased with depth, but the overall decrease was less than 20%. According to the sediment evaluation standard, formulated by the Ontario Ministry of Environment and Energy (1992), TP concentration in freshwater sediments exceeding 600 mg/kg will cause eutrophication. Although three of the sediment cores with average TP concentrations contain less than 600 mg kg−1 (Table 1), the top 10 cm of sediments in four sediment cores (YQ 1, 3–5) had a TP concentration that exceeded this safety threshold (Figure 3).
IP dominated significantly over OP as the main P pool (mean value 67%, Figure 3). The exception is for the sediment core with the highest organic matter content and TP (YQ 4), which has similar OP and IP contribution. Since IP is the main P fraction in the sediment cores, this study mainly focused on the pools of inorganic phosphorus compounds, including Ex–P, Fe–P, and Ca–P. The results show that Ca–P accounted for 20 to 75% of total phosphorus, while Fe–P accounted for 0.4 to 30% of total phosphorus (Table 1). Ca-P is mainly constituted by calcium phosphate minerals, reflecting a high concentration of calcium ions in solution from weathering of carbonates [33]. The release of phosphate from Fe-P is, on the other hand, governed by the redox potential. As the main active form of P in sediments, Fe–P transformation at the sediment–water interface mainly depends on the fluctuating redox potential to effectively control the entire process of sediment phosphorus adsorption and desorption [34,35]. Under oxygen–rich conditions, Fe3+ and P combine to form the rather insoluble ferric phosphate (Fe3+–P), which is stored in the sediments. Under anoxic conditions, the Fe3+ may act as an electron acceptor in the heterotrophic oxidation of organic matter. This reduces it to Fe2+, which forms the much more soluble ferrous phosphate, allowing the iron–bound phosphorus to be released to the pore water. The labile phosphorus in the sediments is therefore mainly contributed by the Fe–P pool. This is causing the variations in the release of P in sediments to be mainly governed by changes in the redox state and thereby the valence state of iron [36]. Since bioavailable phosphorus is readily assimilated by the biota, the dissolved labile and bioavailable phosphorus content and its percentage of TP are held low despite a large influx [5].
During the summer season in eutrophic waters, there is a high primary production in the surface water layer with photosynthetically active radiation (PAR). This leads to a rich flow of organic matter drizzling down to the sediment, where it becomes partly decomposed and mineralized through heterotrophic respiration. This consumes dissolved oxygen and causes hypoxia below the PAR zone [31,37]. In addition, higher temperatures during the summer increase the activity of microorganisms in the sediment and lower the overall capacity of the water to hold oxygen, causing a more rapid loss of oxygen in the water. During the summer season, due to the rapid accumulation primary productivity in surface water, the combing of low dissolved oxygen at the bottom of the water used by the degradation and high pH quickly reduced Fe3+ to Fe2+ [1,38]. The anoxic conditions then cause the Fe3+ to be reduced to Fe2+, releasing P into solution. This also indirectly implies that by sustaining a high dissolved oxygen level in the water column, it is possible to inhibit the release of P from the sediments and thereby obtain and sustain low phosphorus levels. Under strong alkali conditions (pH > 9), a further increase in pH may cause increased phosphorus release from the sediment [11]. A preceding study of the YQR found that the pH of the water was higher than 9 (i.e., between 9.11 and 10.16) [8]. These high pH levels, which especially arise during alga blooms in the summer season, are likely to diffuse into the pore water of the sediment. The high concentrations of OH- will replace the adsorbed phosphate, resulting in a release of phosphate to the pore water. The Fe–P content of the sediment is therefore an important indicator of the potential of phosphorus release from the sediment [36,39].
The STP concentration ranged from 3.5 to 49.5 mg/kg, with a mean value of 18.5 mg/kg. This was lower than what is found in the catchment soil [25]. However, the PSI values were 7–10 times higher in the sediment than in the catchment soil. This is indicating that the sediments have much higher P sorption capacities than the catchment soil. Compared to catchment soil, the reservoir sediments are thus more prone to adsorb P. On the other hand, as the sediments are typically in an anaerobic state and are exposed to alkaline pH, some of the phosphate bound to Fe3+–P in the sediments would be released to the overlying water. DPS is an indicator to evaluate the degree of P saturation and is used to predict the potential risk for P release, i.e., low DPS value implies a high potential risk of P release. The DPS of sediment cores, ranging from 0.24 to 2.91%, are lower than for the catchment soil [25]. There is therefore a greater risk of P loss from the sediments than from the catchment soils.
3.2. Governing Factors for Adsorption and Desorption of P in the Sediments
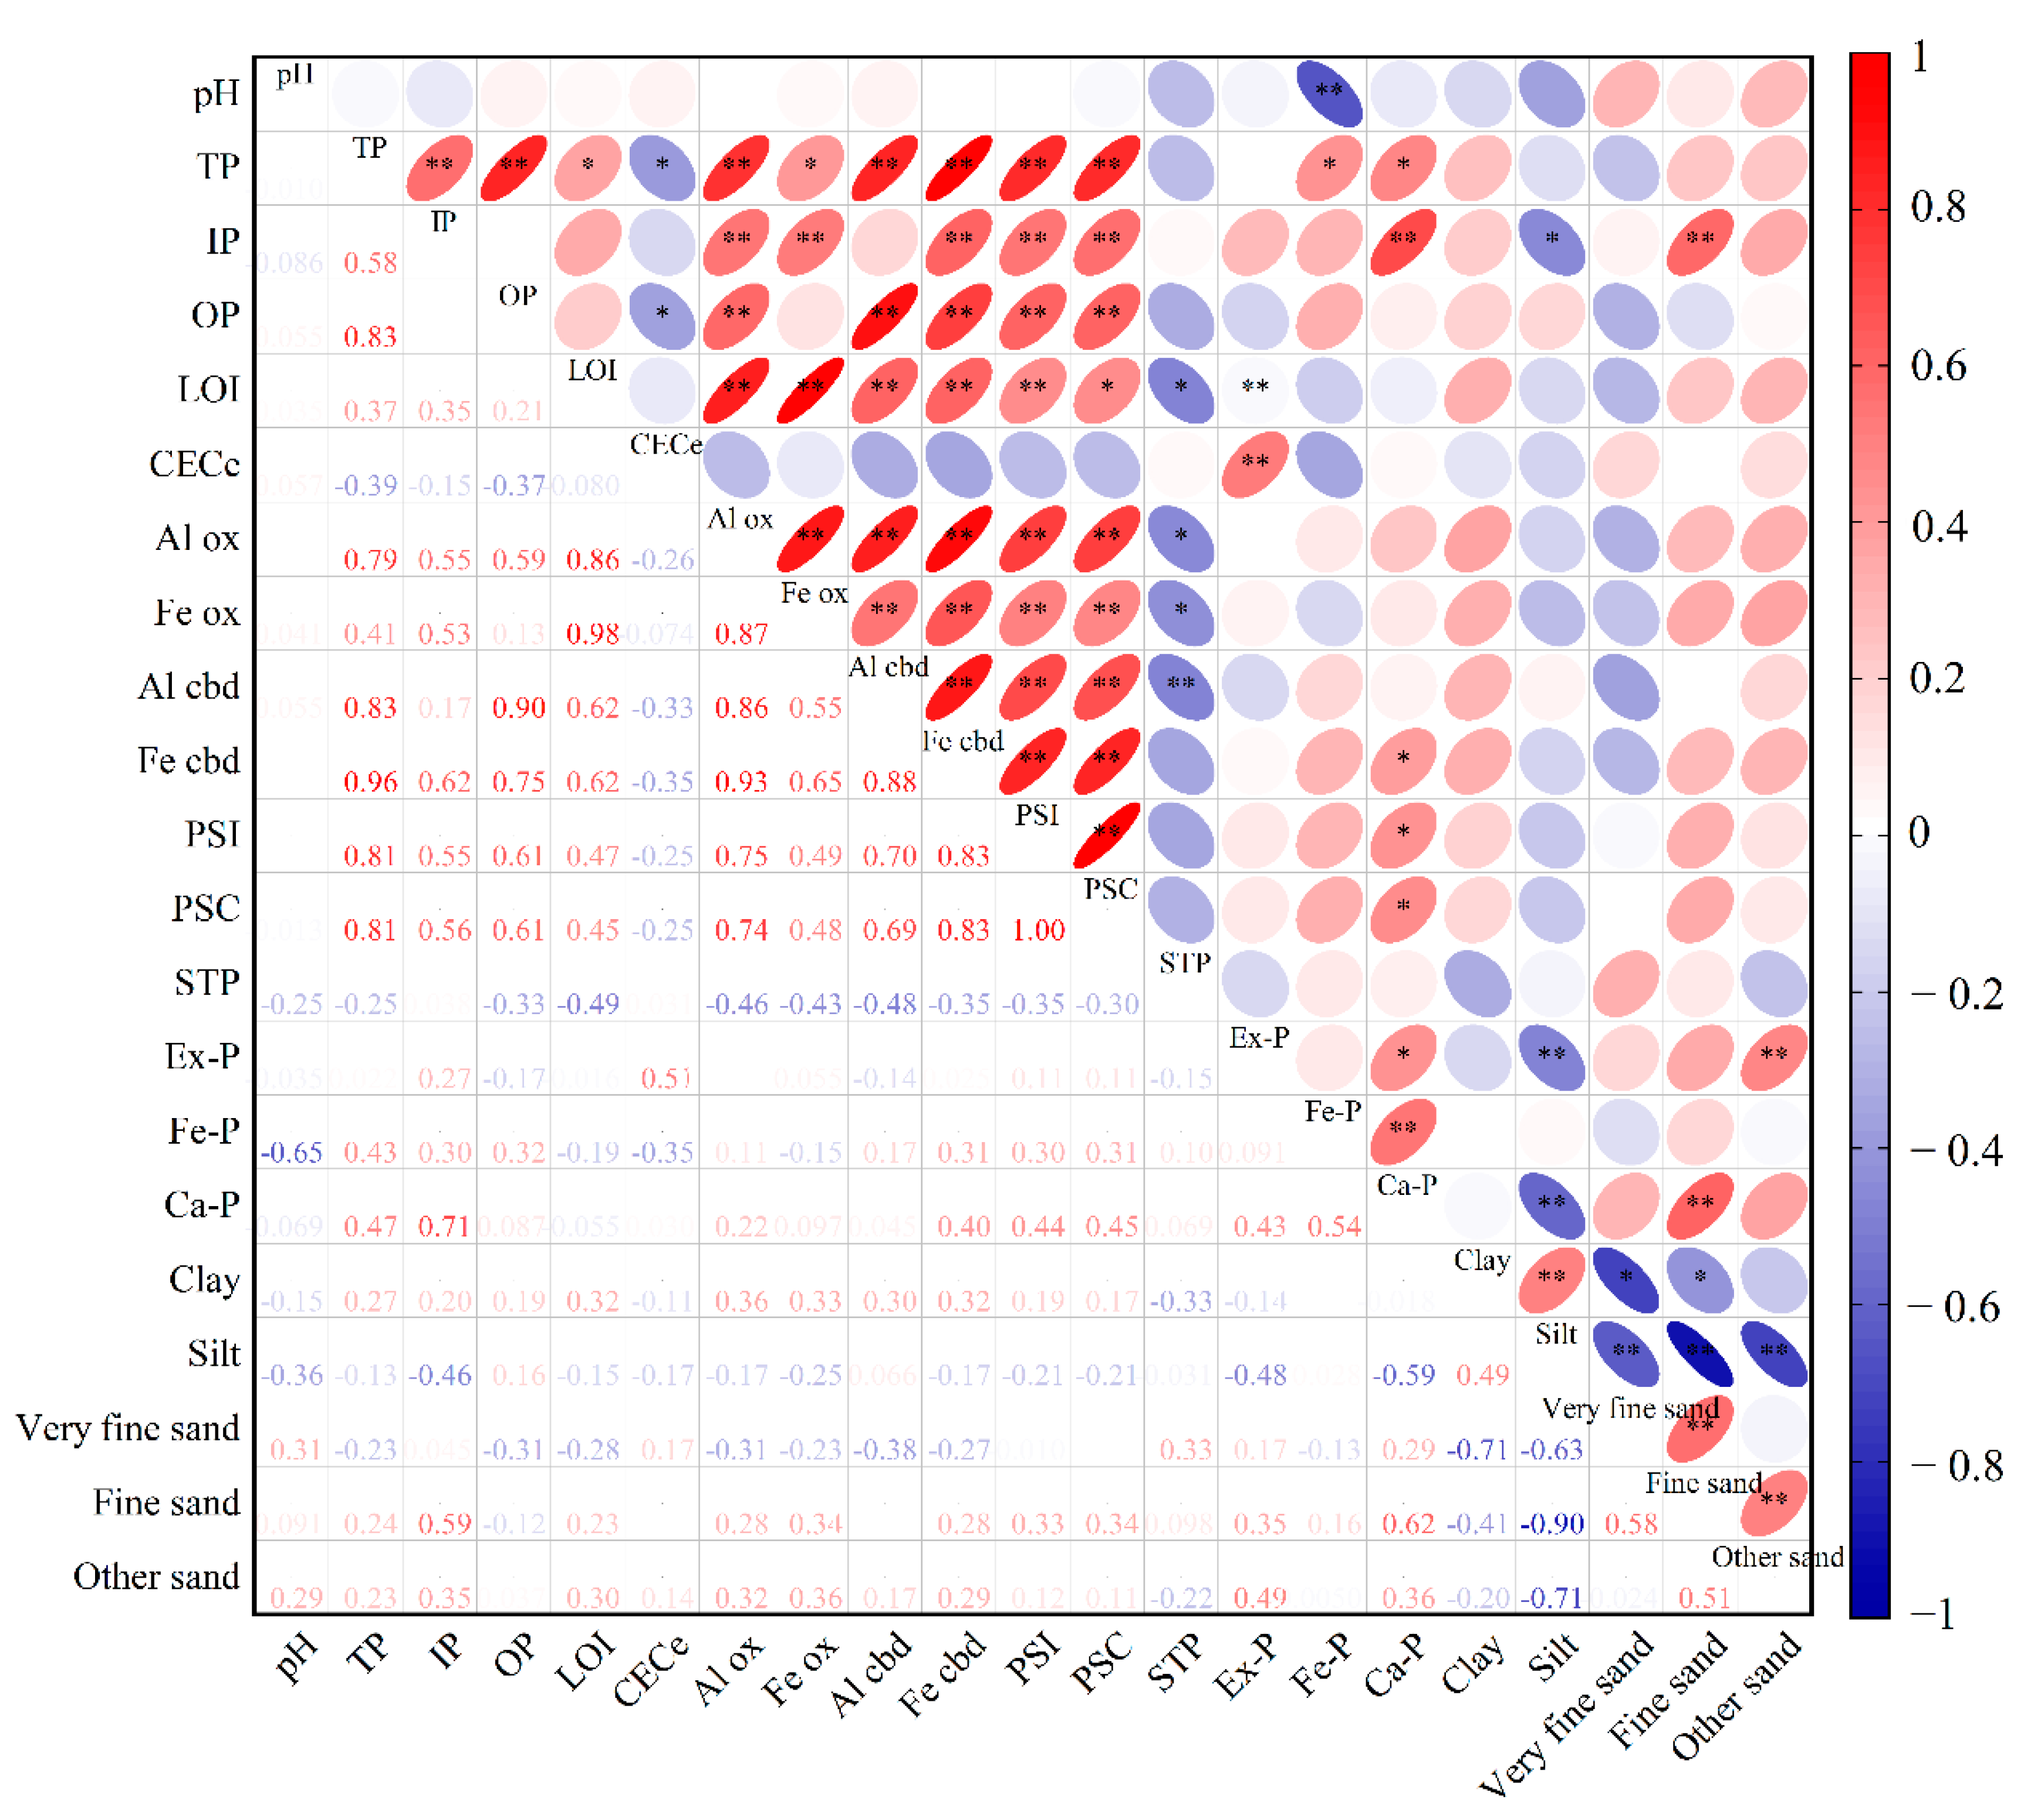
To understand the effects of sediment texture and pools of P on P release, the correlations between PSI and various explanatory factors were assessed in the four fully analyzed sediment cores (YQ 2–5, Figure 4). STP is negatively correlated with organic matter content (LOI), Feox and Alox, Fecdb, and Alcdb concentrations. This reflects that the cocktail of chemicals in the Mehlich–3 extractant is not able to release the P that is bound to organic matter, as well as Fe and Al, despite that the fluoride in the Mehlich–3 is supposed to extract iron and aluminum phosphates. The higher content of organic matter, amorphous iron, and aluminum oxyhydroxides in the sediments, the less is extracted as STP. The Ca–P is positively correlated with fine sand and negatively correlated with silt. This is indicating that the levels of Ca–P in the sediments is mainly reflected by sediment texture, possibly because the calcium phosphate minerals are mainly present as fine–sand–sized particles. The TP concentration is positively correlated to the amount of Al oxyhydroxides and amorphous Fe. The risk of P release (PSI) is significantly (p < 0.01) correlated to the IP concentration, as well as the Al and Fe concentrations. Following the discussion above, it is worth noticing that pH is found to be significantly (p < 0.01) correlated to Fe–P concentration in the sediments (Figure 4). This may be due to the fact that sediments with high pH may have had increased desorption of phosphate from the Fe–P pool in the sediment to the overlying water.
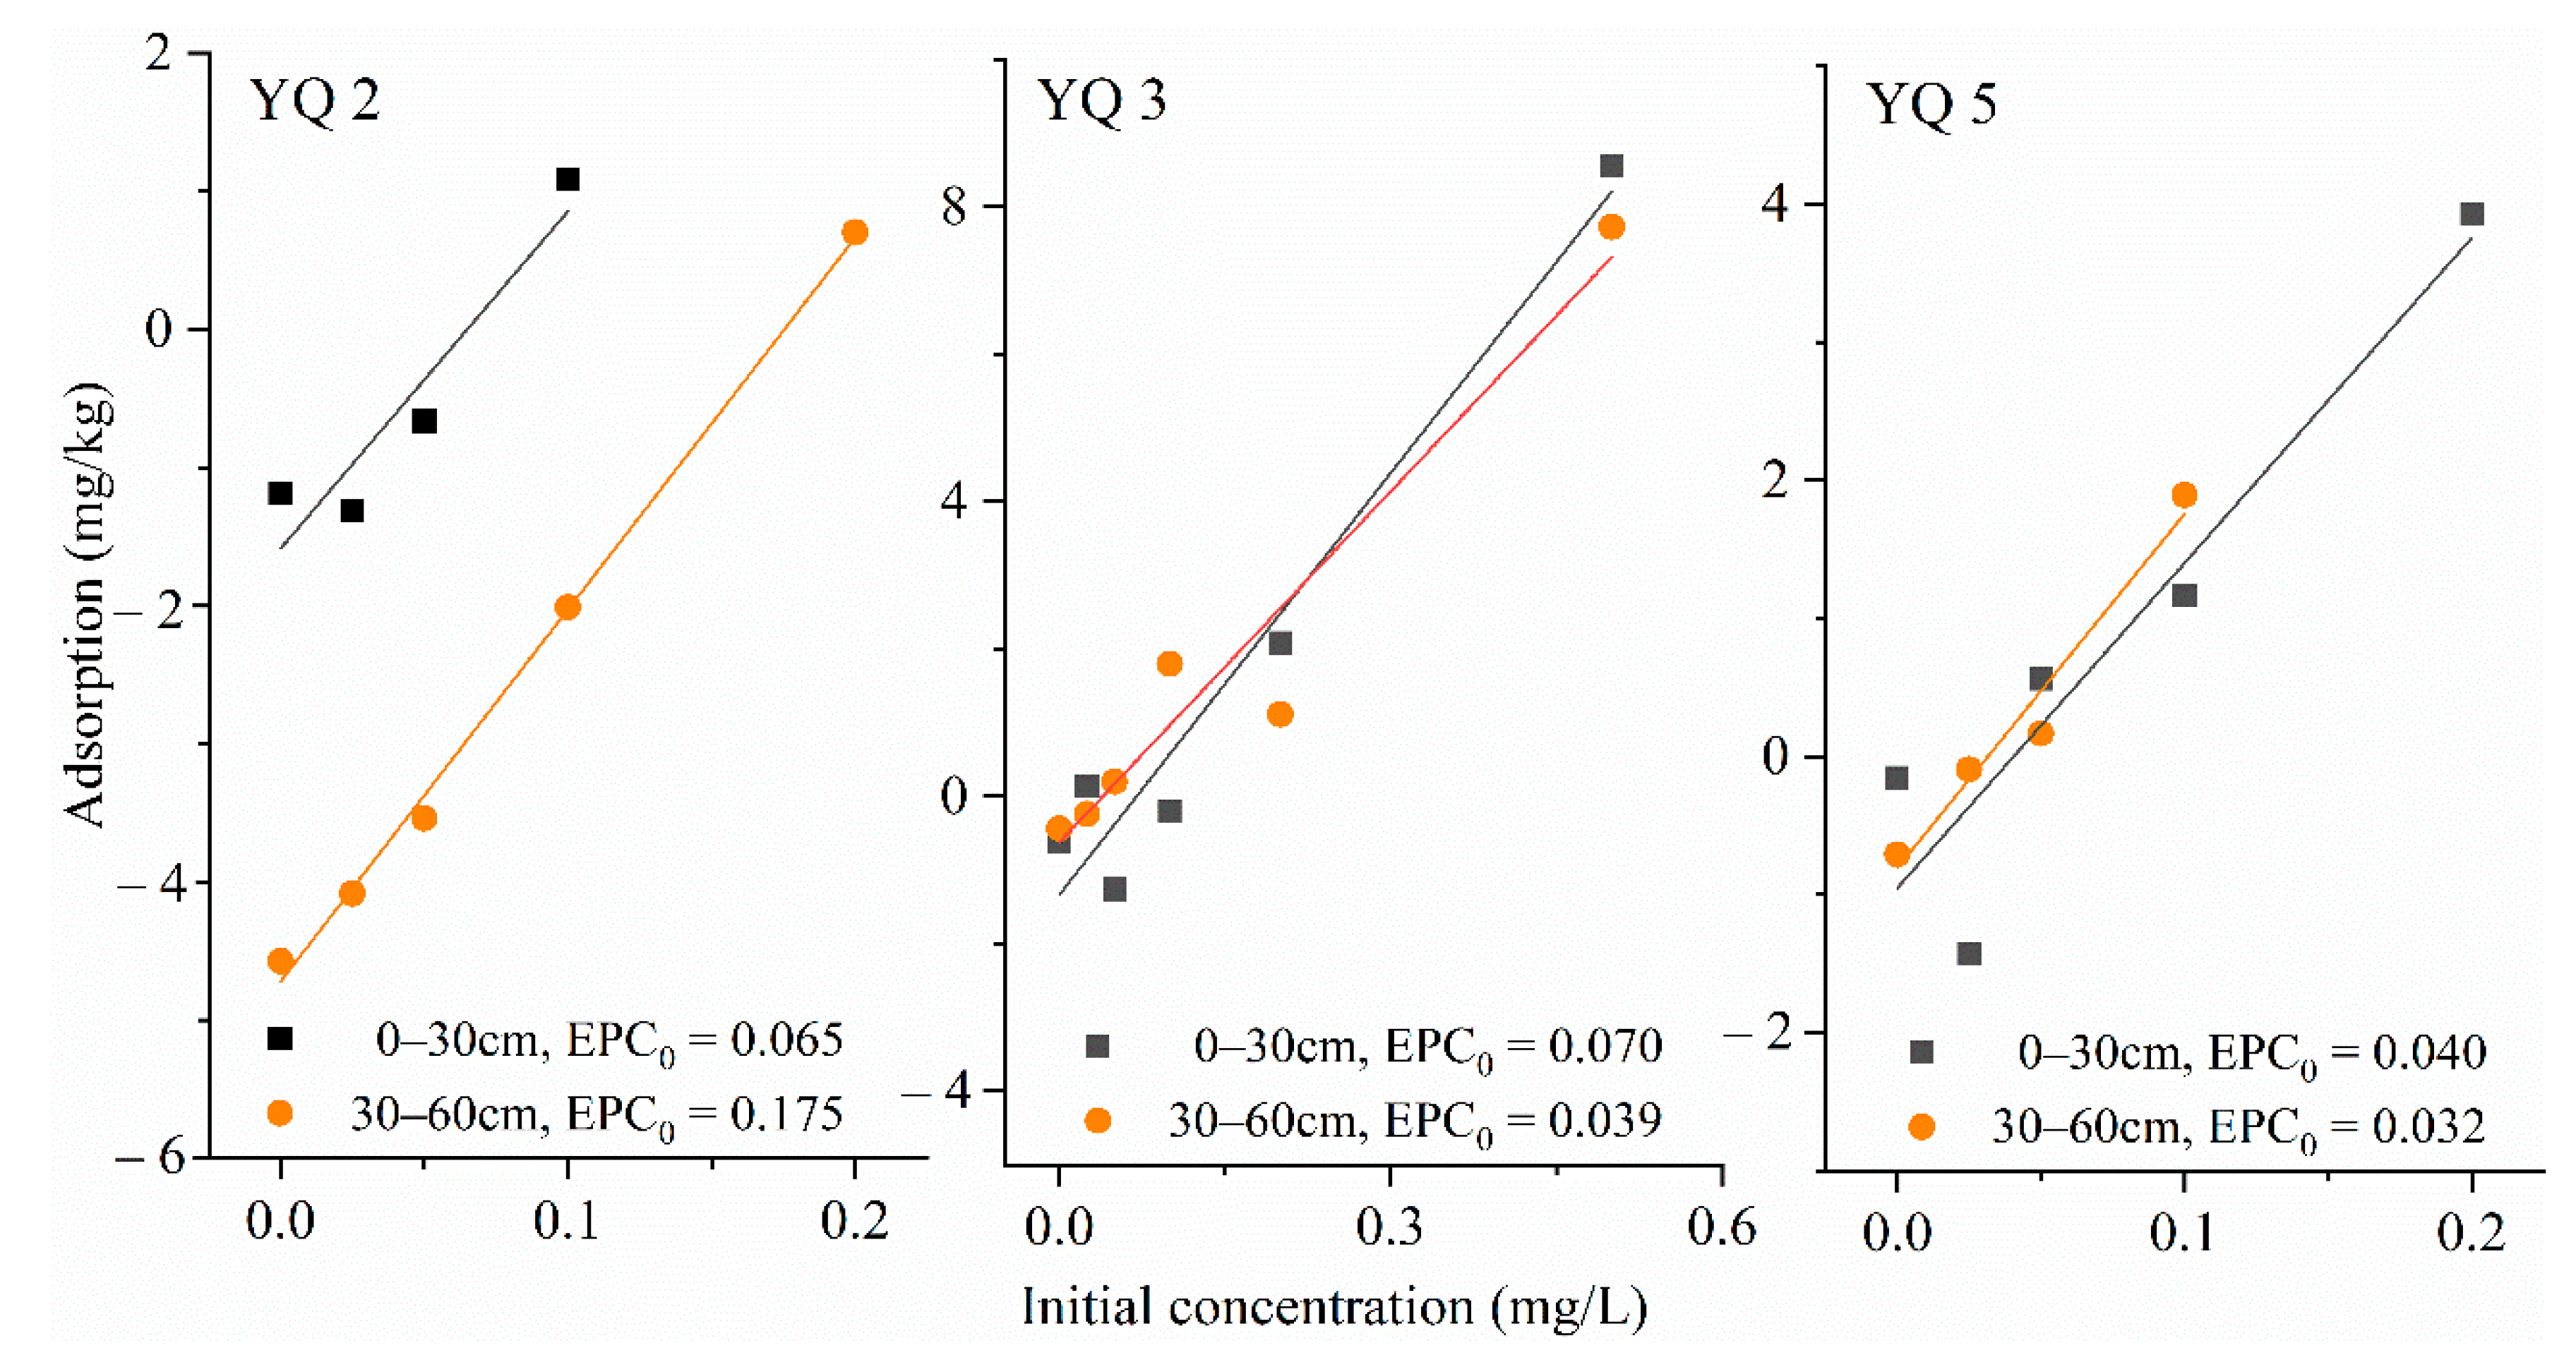
3.3. Phosphorus Adsorption Isotherms
Sediment cores from the north of the reservoir (YQ 2), middle of reservoir (YQ 3), and in front of the dam (YQ 5) were selected for the phosphorus isotherm adsorption analysis. With the exception of 2016 [22], the TP in the reservoir over the past 10 years has remained below 0.05 mg L−1 and the concentration of soluble orthophosphate has been less than 0.01 mg L−1. Now that the external point and non–point sources have been successfully abated, the sediments are activated as an internal source of P, sustaining a high trophic status of the water. In 2016, the annual average TP concentration of the reservoir exceeded 0.32 mg L−1, and the concentration of soluble orthophosphate exceeded 0.14 mg L−1 [22]. During this period, the sediments accumulated the detrital organic matter and adsorbed a great amount of P from the water.
The EPC0 values decreased clearly with increasing sediment depth in YQ 3 and YQ 4 (Figure 5), indicating that the risk of P release is lower in the deeper sediment layers. The shift from adsorption to desorption (EPC0) occurred at SRP levels between 0.032–0.070 mg L−1 (except for YQ 2, 30–60 cm, Figure 5), with an average concentration close to 0.05 mg L−1. That means that the phosphorus in the sediment will release as an internal source when the SRP concentration in the water is lower than 0.05 mg L−1. Considering the high EPC0 levels in the top 30 cm of the sediment, the sediments of YQR have been releasing P to the water during this past decade. According to the results in YQ 3 and 5, the removal of the top 30 cm of the sediments will lower the STP concentration in the water to between 0.032 and 0.039 mg P L−1 (30–60 cm, Figure 5), at which the sediments start to release STP to the water.
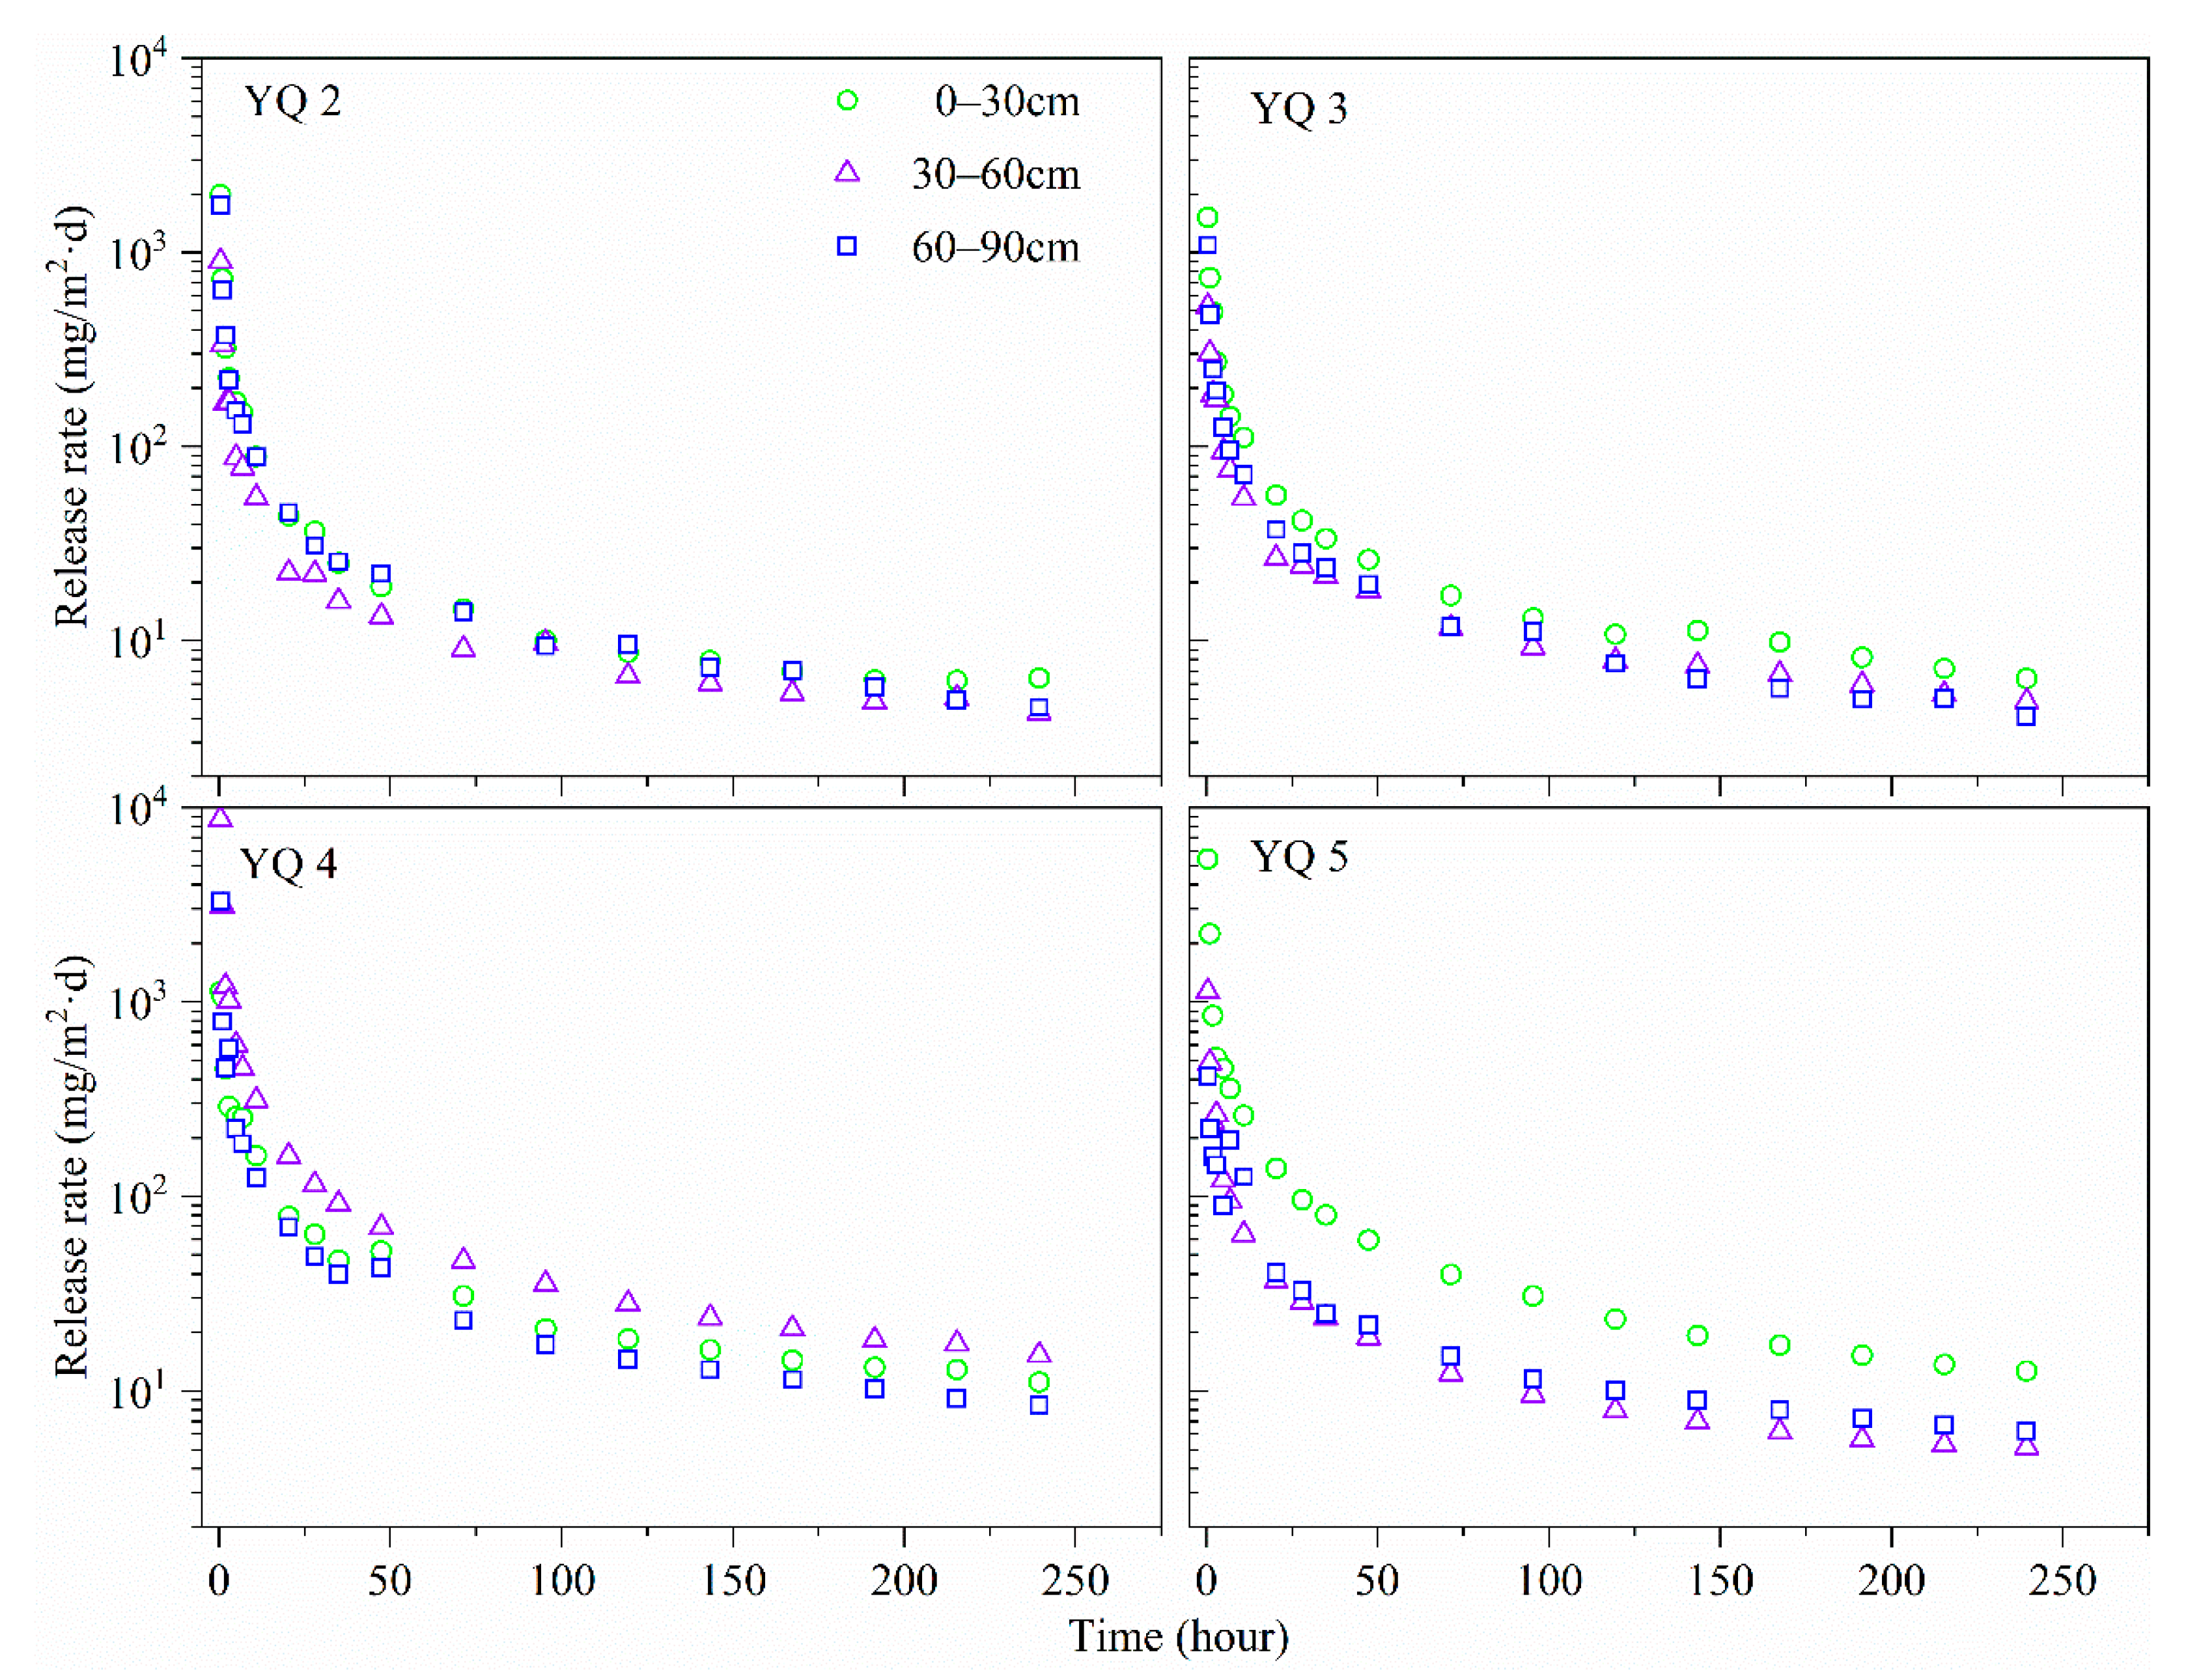
3.4. Phosphorus Release Rate from Sediment Cores
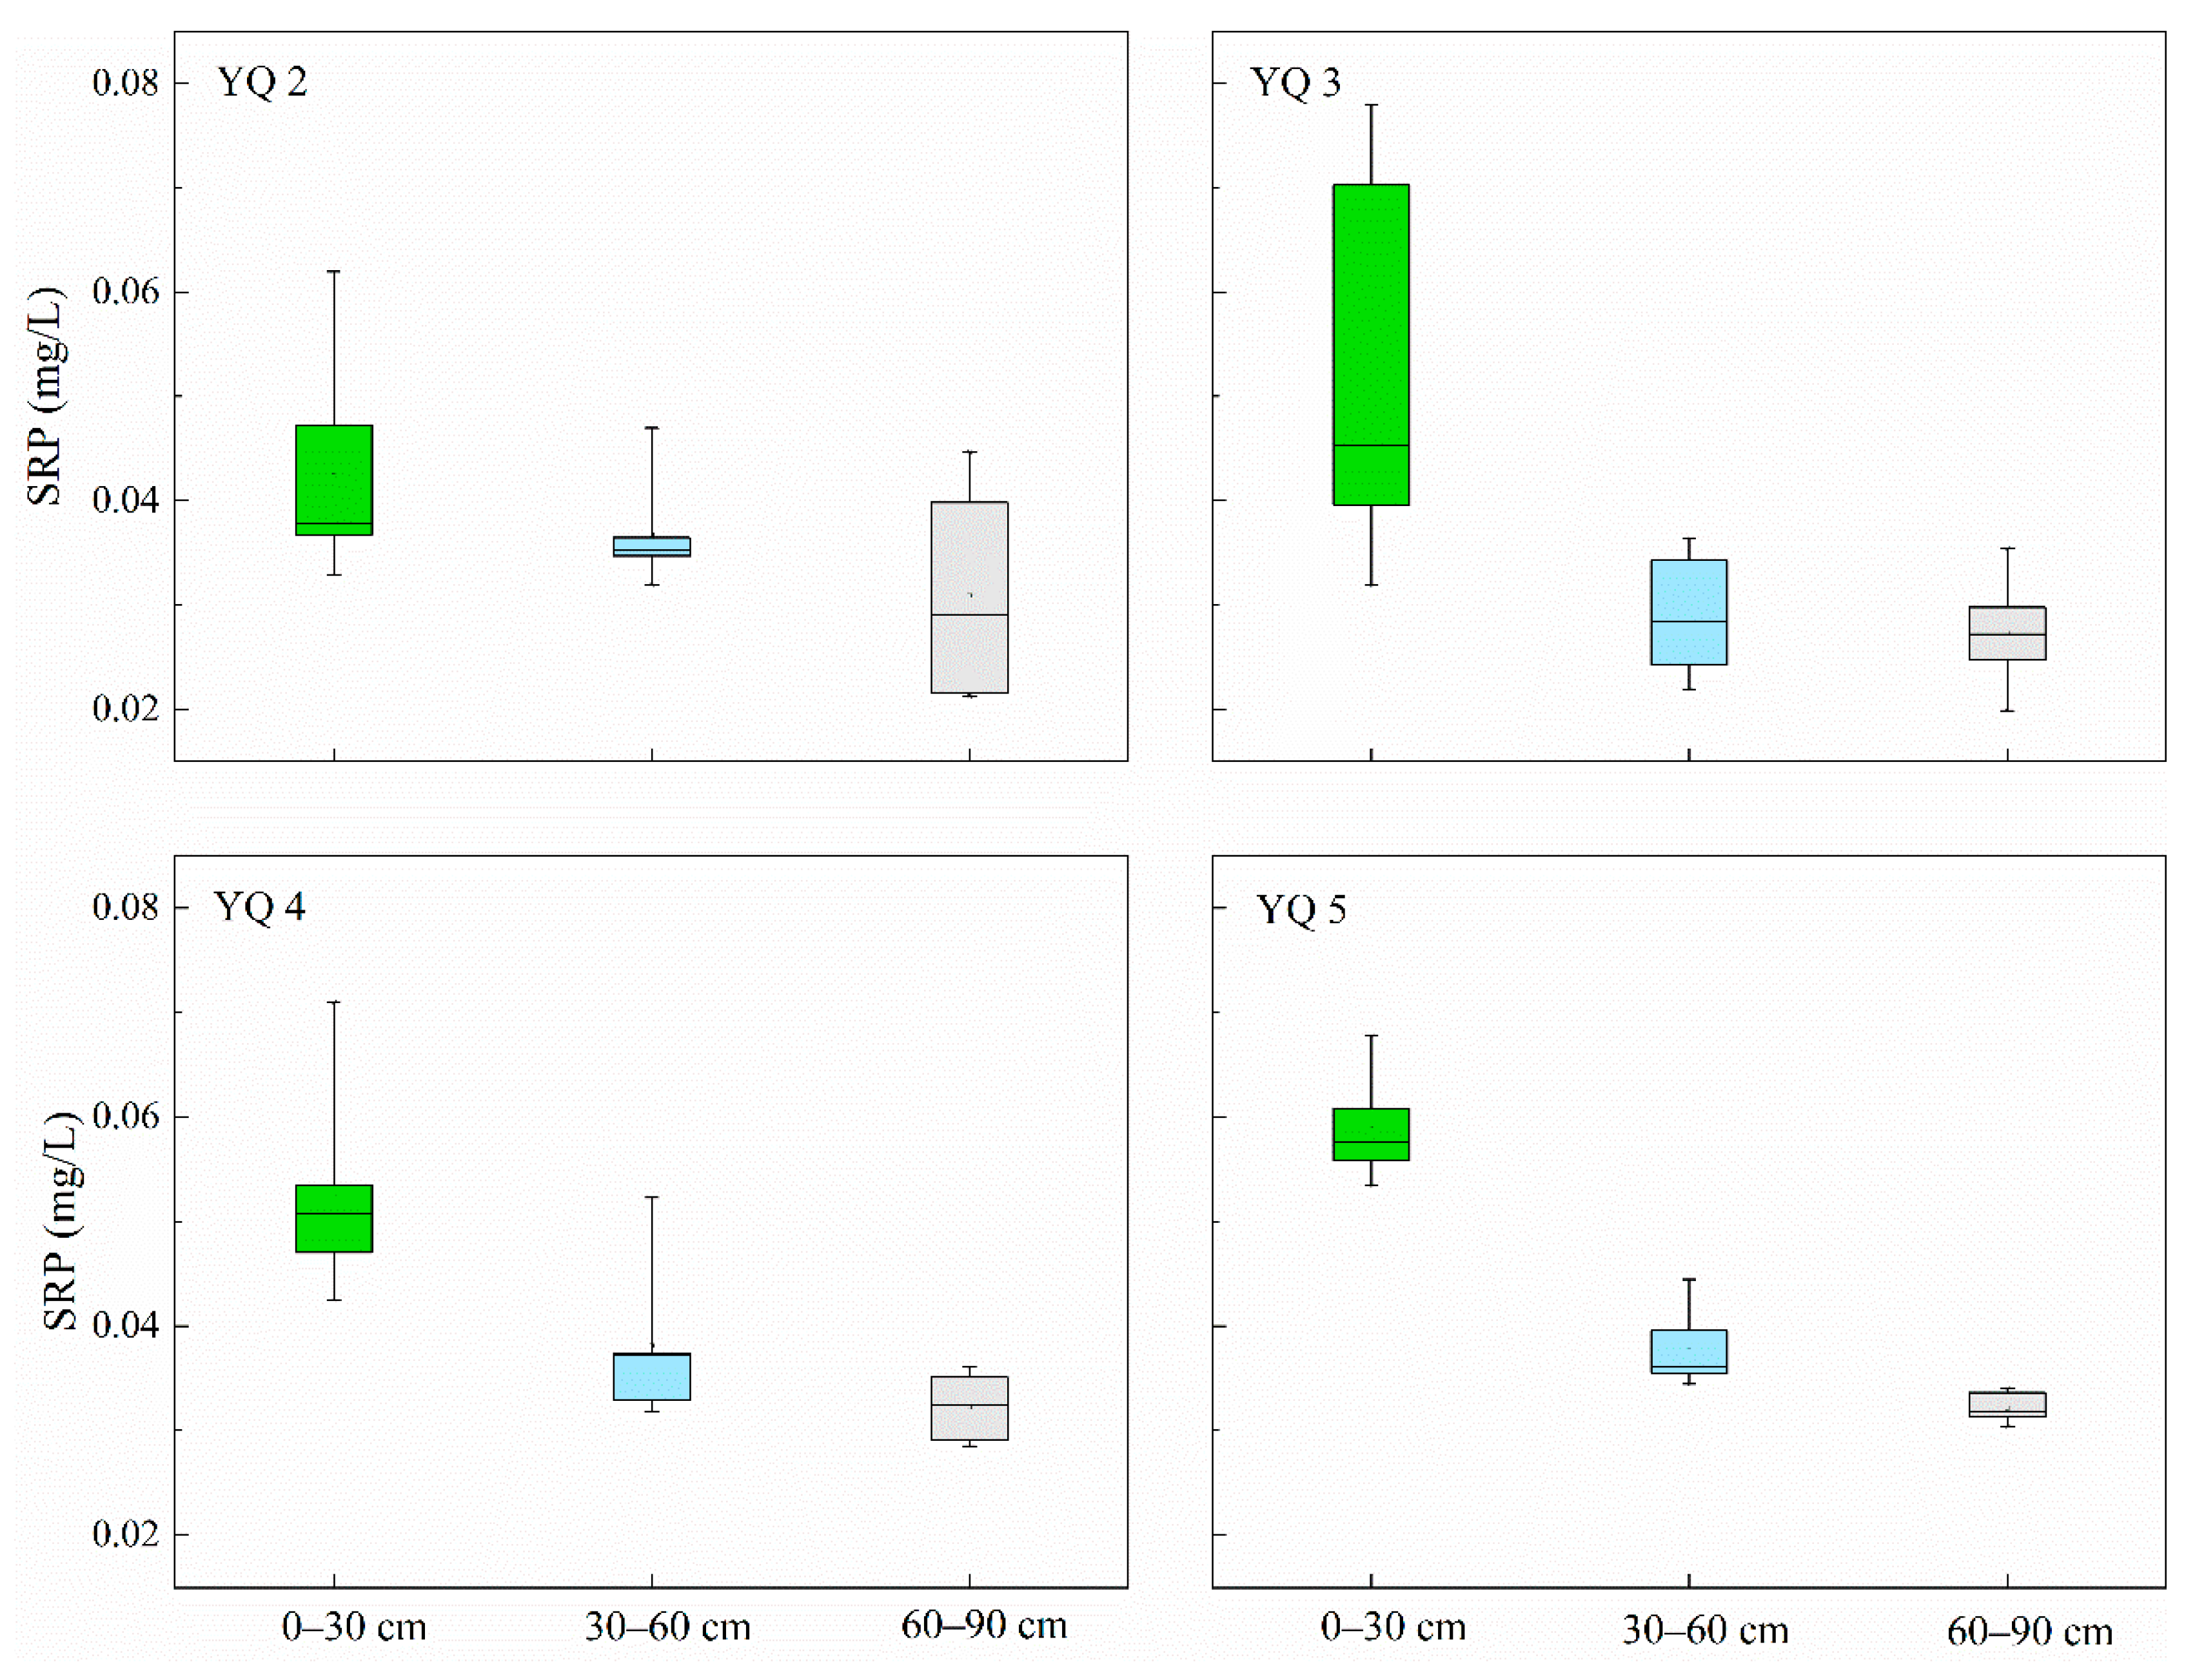
The release of P from the top (0–30 cm), middle (30–60 cm), and bottom (60–90 cm) of the sediment cores to the ambient lake water were measured by column experiments. Time series of the P levels in the water above the sediment cores (Figure 6) show that P is released at all three sediment depths. Rapid release was observed during the first 20 h. After 20 h, the top sediment sustained a higher release than that of the middle and bottom core sections at YQ 2, 3, and 5. This is likely due to the fact that the top sediment cores have a higher content of TP and IP (Figure 3). The exception is again YQ 4, which had the highest release at the middle depth (Figure 6). After 6 days, reflecting a long–term release, the sediments still sustained a significant impact on the phosphorus concentration in the overlying water. In the absence of any external source input, the 0–30 cm top sediments at the four sites were able to maintain an elevated SRP concentration level in the overlying water, e.g., higher than 0.05 mg L−1 at the YQ 3 (Figure 7). The middle and bottom sections of the sediment cores maintained a lower phosphorus concentration between 0.02–0.04 mg L−1.
4. Conclusions
The sediments in the YuQiao drinking water reservoir in Tianjin, China, have accumulated high levels of phosphorus. Now that the external anthropogenic sources of phosphorous to the reservoir are reduced, the phosphorus release from the sediment to the water has increased. The large pool of phosphorus in the sediments will continue to produce a flux of P into the water body, sustaining elevated levels of SRP, causing annual algal blooms. Alga blooms during summer may result in a rapid increase in the pH value, enhancing the replacement effect of the large pool of adsorbed phosphate and causing further eutrophication. Moreover, increased summer temperatures strengthen the anoxic conditions, thereby accelerating the release of phosphorus bound to ferric iron from the sediment. Without abatement actions specifically targeted to reduce or completely remove this internal phosphorous source, it will not be possible to restore the water quality in the YuQiao Reservoir to good ecological conditions. The areas in front of the dam (YQ 5), as well as the middle of the reservoir sediment core (YQ 3), are high–risk areas of phosphorus release that need to be given priority attention in future governance. Our study shows that by removing the top 30 cm of the sediments, the levels of SRP in the water will be reduced to below 0.04 mg P L−1.
Author Contributions
B.Z.: Investigation, data curation, formal analysis, writing original draft, project administration, and funding acquisition. X.F.: Formal analysis, methodology, investigation, review, and editing. B.W. and J.H.: Investigation, data curation, and review. D.Y. and M.C.: Investigation, data curation, and review. F.Y.: review and editing. R.D.V.: Conceptualization, review, and editing. All authors have read and agreed to the published version of the manuscript.
Funding
This research was supported by Tianjin Science and Technology Project (Grant No.18ZXSZSF00130).
Institutional Review Board Statement
Not applicable.
Informed Consent Statement
Not applicable.
Data Availability Statement
The data presented in this study is available on request from the corresponding author.
Conflicts of Interest
The authors declare no conflict of interest.
References
- Chen, Q.; Chen, J.G.; Wang, J.F.; Guo, J.Y.; Jin, Z.X.; Yu, P.P.; Ma, Z.Z. In situ, high–resolution evidence of phosphorus release from sediments controlled by the reductive dissolution of iron–bound phosphorus in a deep reservoir, southwestern China. Sci. Total Environ. 2019, 666, 39–45. [Google Scholar] [CrossRef] [PubMed]
- Nowlin, W.H.; Evarts, J.L.; Vanni, M.J. Release rates and potential fates of nitrogen and phosphorus from sediments in a eutrophic reservoir. Freshw. Biol. 2005, 50, 301–322. [Google Scholar] [CrossRef]
- Cerco, C.F.; Noel, M.R. Impact of Reservoir Sediment Scour on Water Quality in a Downstream Estuary. J. Environ. Qual. 2016, 45, 894–905. [Google Scholar] [CrossRef] [PubMed] [Green Version]
- Maavara, T.; Parsons, C.T.; Ridenour, C.; Stojanovic, S.; Durr, H.H.; Powley, H.R.; Van Cappellen, P. Global phosphorus retention by river damming. Proc. Natl. Acad. Sci. USA 2015, 112, 15603–15608. [Google Scholar] [CrossRef] [PubMed] [Green Version]
- Sondergaard, M.; Jensen, J.P.; Jeppesen, E. Role of sediment and internal loading of phosphorus in shallow lakes. Hydrobiologia 2003, 506, 135–145. [Google Scholar] [CrossRef]
- Corzo, A.; Jiménez–Arias, J.L.; Torres, E.; García-Robledo, E.; Lara, M.; Papaspyrou, S. Biogeochemical changes at the sediment–water interface during redox transitions in an acidic reservoir: Exchange of protons, acidity and electron donors and acceptors. Biogeochemistry 2018, 139, 241–260. [Google Scholar] [CrossRef] [Green Version]
- Santschi, P.; Höhener, P.; Benoit, G.; Buchholtz-ten Brink, M. Chemical processes at the sediment-water interface. Mar. Chem. 1990, 30, 269–315. [Google Scholar] [CrossRef]
- Wen, S.L.; Wang, H.W.; Wu, T.; Yang, J.; Jiang, X.; Zhong, J.C. Vertical profiles of phosphorus fractions in the sediment in a chain of reservoirs in North China: Implications for pollution source, bioavailability, and eutrophication. Sci. Total Environ. 2020, 704, 135318. [Google Scholar] [CrossRef]
- Zeng, J.; Han, G. Preliminary copper isotope study on particulate matter in Zhujiang River, southwest China: Application for source identification. Ecotoxicol. Environ. Saf. 2020, 198, 110663. [Google Scholar] [CrossRef] [PubMed]
- Boström, B.; Andersen, J.M.; Fleischer, S.; Jansson, M. Exchange of phosphorus across the sediment-water interface. Hydrobiologia 1988, 170, 229–244. [Google Scholar] [CrossRef]
- Wu, Y.H.; Wen, Y.J.; Zhou, J.X.; Wu, Y.Y. Phosphorus release from lake sediments: Effects of pH, temperature and dissolved oxygen. KSCE J. Civ. Eng. 2014, 18, 323–329. [Google Scholar] [CrossRef]
- Zhang, C.; Zhang, W.N.; Huang, Y.X.; Gao, X.P. Analysing the correlations of long-term seasonal water quality parameters, suspended solids and total dissolved solids in a shallow reservoir with meteorological factors. Environ. Sci. Pollut. Res. 2017, 24, 6746–6756. [Google Scholar] [CrossRef] [PubMed]
- Gérard, F. Clay minerals, iron/aluminum oxides, and their contribution to phosphate sorption in soils—A myth revisited. Geoderma 2016, 262, 213–226. [Google Scholar] [CrossRef]
- Bao, L.L.; Li, X.Y.; Su, J.J. Alteration in the potential of sediment phosphorus release along series of rubber dams in a typical urban landscape river. Sci. Rep. 2020, 10, 2714. [Google Scholar] [CrossRef] [PubMed] [Green Version]
- Bache, B.W.; Williams, E.G. A PHOSPHATE SORPTION INDEX FOR SOILS. J. Soil Sci. 1971, 22, 289–301. [Google Scholar] [CrossRef]
- Cao, X.Y.; Chen, X.Y.; Song, C.L.; Zhou, Y.Y. Comparison of phosphorus sorption characteristics in the soils of riparian buffer strips with different land use patterns and distances from the shoreline around Lake Chaohu. J. Soils Sediments 2019, 19, 2322–2329. [Google Scholar] [CrossRef]
- Zhai, H.Y.; He, X.Z.; Zhang, Y.; Du, T.T.; Adeleye, A.S.; Li, Y. Disinfection byproduct formation in drinking water sources: A case study of Yuqiao reservoir. Chemosphere 2017, 181, 224–231. [Google Scholar] [CrossRef] [PubMed]
- Huo, D.; Chen, Y.X.; Zheng, T.; Liu, X.; Zhang, X.Y.; Yu, G.L.; Qiao, Z.Y.; Li, R.H. Characterization of Microcystis (Cyanobacteria) Genotypes Based on the Internal Transcribed Spacer Region of rRNA by Next-Generation Sequencing. Front. Microbiol. 2018, 9, 971. [Google Scholar] [CrossRef] [PubMed] [Green Version]
- Zhou, B.; Vogt, R.D.; Xu, C.Y.; Lu, X.Q.; Xu, H.L.; Bishnu, J.P.; Zhu, L. Establishment and Validation of an Amended Phosphorus Index: Refined Phosphorus Loss Assessment of an Agriculture Watershed in Northern China. Water Air Soil Pollut. 2014, 225, 2103. [Google Scholar] [CrossRef] [Green Version]
- Li, X.; Xu, Y.; Zhao, G.; Shi, C.L.; Wang, Z.L.; Wang, Y.Q. Assessing threshold values for eutrophication management using Bayesian method in Yucliao Reservoir, North China. Environ. Monit. Assess. 2015, 187, 195. [Google Scholar] [CrossRef] [PubMed]
- Zhou, B.; Xu, Y.P.; Vogt, R.D.; Lu, X.Q.; Li, X.M.; Deng, X.W.; Yue, A.; Zhu, L. Effects of Land Use Change on Phosphorus Levels in Surface Waters-a Case Study of a Watershed Strongly Influenced by Agriculture. Water Air Soil Pollut. 2016, 227, 160. [Google Scholar] [CrossRef]
- Wen, S.L.; Wu, T.; Yang, J.; Jiang, X.; Zhong, J.C. Spatio-Temporal Variation in Nutrient Profiles and Exchange Fluxes at the Sediment-Water Interface in Yuqiao Reservoir, China. Int. J. Environ. Res. Public Health 2019, 16, 3071. [Google Scholar] [CrossRef] [Green Version]
- Chen, Y.Y.; Zhang, C.; Gao, X.P.; Wang, L.Y. Long-term variations of water quality in a reservoir in China. Water Sci. Techol. 2012, 65, 1454–1460. [Google Scholar] [CrossRef]
- Chang, C.; Sun, D.M.; Feng, P.; Zhang, M.; Ge, N. Impacts of Nonpoint Source Pollution on Water Quality in the Yuqiao Reservoir. Environ. Eng. Sci. 2017, 34, 418–432. [Google Scholar] [CrossRef]
- Zhou, B.; Vogt, R.D.; Lu, X.Q.; Yang, X.G.; Lu, C.W.; Mohr, C.W.; Zhu, L. Land use as an explanatory factor for potential phosphorus loss risk, assessed by P indices and their governing parameters. Environ. Sci. Process. Impacts 2015, 17, 1443–1454. [Google Scholar] [CrossRef] [PubMed] [Green Version]
- Sharpley, A.N. Dependence of Runoff Phosphorus on Extractable Soil Phosphorus. J. Environ. Qual. 1995, 24, 920–926. [Google Scholar] [CrossRef] [Green Version]
- Asher, L.E. An Automated Method for the Determination of Orthophosphate in the Presence of Labile Polyphosphates. Soil Sci. Soc. Am. J. 1980, 44, 173–175. [Google Scholar] [CrossRef]
- Rydin, E. Potentially mobile phosphorus in Lake Erken sediment. Water Res. 2000, 34, 2037–2042. [Google Scholar] [CrossRef]
- Zhou, B.; Vogt, R.D.; Lu, X.Q.; Xu, C.Y.; Zhu, L.; Shao, X.L.; Liu, H.L.; Xing, M.N. Relative Importance Analysis of a Refined Multi-parameter Phosphorus Index Employed in a Strongly Agriculturally Influenced Watershed. Water Air Soil Pollut. 2015a, 226, 25. [Google Scholar] [CrossRef]
- Zheng, Y.; Zhou, L.Y.; Wang, X.; Shen, B.Z. Investigation and evaluation on some elements in the substrate sludge of Yuqiao Reservoir. Acta Agric. Boreali-Sin. 1991, 6, 122–126. [Google Scholar]
- van Dael, T.; De Cooman, T.; Verbeeck, M.; Smolders, E. Sediment respiration contributes to phosphate release in lowland surface waters. Water Res. 2020, 168, 115168. [Google Scholar] [CrossRef] [PubMed]
- Wang, N.L.; Wang, J.M.; Li, H.; Zhou, B.; Xing, M.N.; Liu, H.L. The Accumulation Characteristic of Sedimentary Phosphorus and Its Release Potential in Yuqiao Reservoir. Environ. Prot. Sci. 2020, 46, 56–61. [Google Scholar]
- Smith, E.A.; Mayfield, C.I.; Wong, P.T.S. Physical and chemical characterization of selected natural apatites in synthetic and natural aqueous solutions. Water Air Soil Pollut. 1977, 8, 401–415. [Google Scholar]
- Jaiswal, D.; Pandey, J. Hypoxia and associated feedbacks at sediment-water interface as an early warning signal of resilience shift in an anthropogenically impacted river. Environ. Res. 2019, 178, 108712. [Google Scholar] [CrossRef] [PubMed]
- Yu, P.; Wang, J.; Chen, J.; Guo, J.; Yang, H.; Chen, Q. Successful control of phosphorus release from sediments using oxygen nano-bubble-modified minerals. Sci. Total Environ. 2019, 663, 654–661. [Google Scholar] [CrossRef] [PubMed]
- Tammeorg, O.; Nürnberg, G.; Horppila, J.; Haldna, M.; Niemistö, J. Redox-related release of phosphorus from sediments in large and shallow Lake Peipsi: Evidence from sediment studies and long-term monitoring data. J. Great Lakes Res. 2020, 46, 1595–1603. [Google Scholar] [CrossRef]
- Yang, C.; Yang, P.; Geng, J.; Yin, H.; Chen, K. Sediment internal nutrient loading in the most polluted area of a shallow eutrophic lake (Lake Chaohu, China) and its contribution to lake eutrophication. Environ. Pollut. 2020, 262, 114292. [Google Scholar] [CrossRef] [PubMed]
- Wang, Y.M.; Li, K.F.; Liang, R.F.; Han, S.Q.; Li, Y. Distribution and Release Characteristics of Phosphorus in a Reservoir in Southwest China. Int. J. Environ. Res. Public Health 2019, 16, 303. [Google Scholar] [CrossRef] [PubMed] [Green Version]
- Alam, M.S.; Barthod, B.; Li, J.Y.; Liu, H.; Zastepa, A.; Liu, X.C.; Maria, D. Geochemical controls on internal phosphorus loading in Lake of the Woods. Chem. Geol. 2020, 558, 119873. [Google Scholar] [CrossRef]
Figure 1.
YuQiao Reservoir marked with color–coded water depth and location of sampling sites (YQ 1–5). The light brown and green colors in the surroundings area are mainly agricultural area and mountains, respectively.
Figure 1.
YuQiao Reservoir marked with color–coded water depth and location of sampling sites (YQ 1–5). The light brown and green colors in the surroundings area are mainly agricultural area and mountains, respectively.

Figure 2.
The vertical variation of particle size distribution at four sites.

Figure 3.
The vertical variation of LOI, CECe, TP, and IP at four sites.

Figure 4.
Correlation analysis among variables in the YQ 2–5 sediment cores. * Correlation is significant at p < 0.05; ** Correlation is significant at p < 0.01.
Figure 4.
Correlation analysis among variables in the YQ 2–5 sediment cores. * Correlation is significant at p < 0.05; ** Correlation is significant at p < 0.01.

Figure 5.
Phosphorus adsorption isotherms in sediment cores at two different sediment depths. Please note different scales on the Y–axis.
Figure 5.
Phosphorus adsorption isotherms in sediment cores at two different sediment depths. Please note different scales on the Y–axis.

Figure 6.
Time series of P release rate from four sediment cores and three different sediment depths.
Figure 6.
Time series of P release rate from four sediment cores and three different sediment depths.

Figure 7.
Boxplot for SRP concentration in ambient lake water above the sediments during the simulation of sediment release. The edges of the boxplot represent the 75th and 25th percentiles, respectively. The solid line in the box represented the median value. The branch gave the range of the data except for the outliers.


Table 1.
Characteristics of five sediment cores in YuQiao Reservoir.
| Core Depth (cm) Subsections | YQ 1 80 7 | YQ 2 50 5 | YQ 3 95 8 | YQ 4 95 8 | YQ 5 95 8 | |||||
|---|---|---|---|---|---|---|---|---|---|---|
| Avg | CV a | Avg | CV a | Avg | CV a | Avg | CV a | Avg | CV a | |
| pH | 6.5 | 6 | 7.6 | 1 | 6.9 | 3 | 6.9 | 3 | 7.2 | 3 |
| Clay b | – | – | 3.85 | 13 | 6.58 | 53 | 6.5 | 25 | 2.58 | 69 |
| LOI b | 1.28 | 22 | 2.29 | 33 | 2.17 | 10 | 2.42 | 64 | 1.47 | 56 |
| CECe c | 278 | 20 | 259 | 24 | 341 | 8 | 240 | 28 | 335 | 12 |
| TP d | 681 | 12 | 465 | 14 | 442 | 30 | 691 | 15 | 575 | 14 |
| IP d | 545 | 14 | 306 | 11 | 342 | 31 | 341 | 26 | 352 | 18 |
| OP d | 136 | 52 | 159 | 36 | 99 | 56 | 352 | 19 | 223 | 28 |
| STP d | – | – | 16.1 | 73 | 21.5 | 72 | 14.0 | 71 | 20.2 | 58 |
| Ex–P d | – | – | 3.9 | 30 | 7.3 | 31 | 4.6 | 30 | 9.5 | 39 |
| Fe–P d | – | – | 7.1 | 40 | 50.4 | 58 | 106 | 53 | 82.3 | 16 |
| Ca–P d | – | – | 164 | 12 | 187 | 31 | 194 | 29 | 247 | 17 |
| PSI d | – | – | 1135 | 14 | 1106 | 17 | 1424 | 19 | 1338 | 7 |
| PSC d | – | – | 1151 | 14 | 1128 | 17 | 1438 | 19 | 1358 | 6 |
The units of a, b, c, and d are %, %, mmol/kg, and mg/kg, respectively. Avg and CV mean the average value and coefficient variation.
Publisher’s Note: MDPI stays neutral with regard to jurisdictional claims in published maps and institutional affiliations. |
© 2021 by the authors. Licensee MDPI, Basel, Switzerland. This article is an open access article distributed under the terms and conditions of the Creative Commons Attribution (CC BY) license (https://creativecommons.org/licenses/by/4.0/).
Share and Cite
MDPI and ACS Style
Zhou, B.; Fu, X.; Wu, B.; He, J.; Vogt, R.D.; Yu, D.; Yue, F.; Chai, M. Phosphorus Release from Sediments in a Raw Water Reservoir with Reduced Allochthonous Input. Water 2021, 13, 1983. https://doi.org/10.3390/w13141983
AMA Style
Zhou B, Fu X, Wu B, He J, Vogt RD, Yu D, Yue F, Chai M. Phosphorus Release from Sediments in a Raw Water Reservoir with Reduced Allochthonous Input. Water. 2021; 13(14):1983. https://doi.org/10.3390/w13141983
Chicago/Turabian StyleZhou, Bin, Xujin Fu, Ben Wu, Jia He, Rolf D. Vogt, Dan Yu, Fujun Yue, and Man Chai. 2021. "Phosphorus Release from Sediments in a Raw Water Reservoir with Reduced Allochthonous Input" Water 13, no. 14: 1983. https://doi.org/10.3390/w13141983
Note that from the first issue of 2016, this journal uses article numbers instead of page numbers. See further details here.