
Propagation from Meteorological to Hydrological Drought and Its Influencing Factors in the Huaihe River Basin


1
State Key Laboratory of Hydrology-Water Resources and Hydraulic Engineering Sciences, Hohai University, Nanjing 210098, China
2
Research Center on Flood & Drought Disaster Reduction, China Institute of Water Resources and Hydropower Research, Beijing 100000, China
3
Bureau of Hydrology and Water Resources of Henan Province, Zhengzhou 450000, China
4
School of Hydrology and Water Resources, Nanjing University of Information Science and Technology, Nanjing 210044, China
*
Author to whom correspondence should be addressed.
Water 2021, 13(14), 1985; https://doi.org/10.3390/w13141985
Submission received: 28 May 2021
/
Revised: 8 July 2021
/
Accepted: 14 July 2021
/
Published: 20 July 2021
(This article belongs to the Special Issue Human and Climate Impacts on Drought Dynamics and Vulnerability)
Abstract
:Understanding the propagation from meteorological to hydrological drought is crucial for hydrological drought monitoring and forecasting. In this study, daily precipitation and streamflow data of 16 sub-catchments in the Huaihe River Basin from 1980 to 2014 are used to establish a framework to quantitatively reveal the propagation relationship between meteorological and hydrological drought and explore the impact of climate, catchment properties, and human activities on drought propagation. The propagation from meteorological to hydrological drought is divided into three types. Type-1 propagation indicates that one or several meteorological droughts trigger a hydrological drought. The occurrence probability of Type-1 calculated by the conditional probability on SPI and SRI series varies from 0.25 to 0.48 among all catchments. Features of Type-1 propagation can be concluded as lengthening of duration, amplification of severity, lag of onset time, and reduction of speed. Type-2 propagation indicates that a meteorological drought occurs but no hydrological drought occurs, which accounts for 63–77% of the total meteorological drought events in all catchments. Type-3 indicates that a hydrological drought occurs without a proceeding meteorological drought, which is caused mostly by human activities. The occurrence probability of Type-3 ranges from 0.31 to 0.58. Climate factors have significant effects on hydrological drought duration, while catchment properties represented by topographic index and base flow index significantly relate to hydrological drought severity, propagation time, and occurrence probability of Type-1 propagation. The ratio of crop land reflecting irrigation on hydrological drought is far less than that of topographic index, denoting that the impact of irrigation on hydrological drought is less than that of catchment properties. Reservoirs have significant effects on alleviating the duration and severity of extreme hydrological droughts, but little effects on the average duration and severity of hydrological droughts.
1. Introduction
Drought is one of the costliest natural disasters and is usually categorized into four types: Meteorological drought, hydrological drought, agricultural drought, and socioeconomic drought [1]. In general, meteorological drought is the origin of hydrological drought. The accumulation of precipitation deficits combined with high evaporation lead to meteorological drought. Hydrological drought occurs when streamflow, groundwater or reservoirs levels decline below their long-term means due to the anomalies in atmospheric processes or the effects of human activities. Drought propagation refers to the process that a precipitation anomaly propagates through the terrestrial part of the hydrological cycle from a meteorological drought into soil moisture depletion and eventually into a hydrological drought [2,3]. It has been summarized that drought propagation has common features of pooling, attenuation, lag, lengthening, and reduction of area [3,4]. The pooling phenomenon is that several meteorological droughts combine into a prolonged hydrological drought. The attenuation refers to the phenomenon that meteorological droughts are attenuated when catchment storage is high, causing a smooth of maximum negative anomaly. A lag occurs between meteorological, soil moisture, and hydrological drought. Droughts get longer in duration when moving from meteorological via soil moisture to hydrological drought. From space-time dimensions, the affected area reduces from meteorological to hydrological drought. As for the variation of severity in propagation, the phenomenon is uncertain. For example, Yang et al. [5] found that severity calculated as the accumulated anomaly during the drought period amplified from meteorological to hydrological drought. Liu et al. [4], however, found that severity calculated by a cumulative value representing the total moisture deficits weakened from meteorological to hydrological drought based on the SPEI (Standardized Precipitation Evapotranspiration Index) and SRI (Standardized Runoff Index). Previous studies mostly focus on drought duration and severity, but there are still more characteristics such as speed that need to be investigated. Knowing more about the variation of drought characteristics quantitatively will provide a stronger basis for monitoring and forecasting hydrological droughts.
Drought propagation processes are influenced by climate [6,7,8,9,10,11,12], catchment properties [6,7,8,9,10,12], and human activities [2,9,13,14]. The climate effect indicated by pattern of precipitation (seasonality and aridity), evapotranspiration, snowmelt, and large-scale atmospheric process on propagation is investigated by an ensemble of studies. Huang et al. [9] found that large-scale atmospheric circulation anomaly showed strong effects on the propagation from meteorological to hydrological drought in Wei River Basin. According to Apurv et al. [11], climate aridity and the timing of precipitation with respect to potential evapotranspiration have a significant impact on drought propagation. Bhardwaj et al. [10] found a significant influence of seasonality index (SI) on the propagation time of meteorological to hydrological droughts but no significant relationship between aridity index and propagation time were found in the Indian river basins. Catchment properties, such as the drainage area, land use type (e.g., forest, grass land, and crop land), soil type, topography (e.g., elevation, slope), geology, morphology of stream network, and base flow index (BFI), also influence drought propagation [6,7,8,10,12]. For instance, Barker et al. [12] showed that catchment properties, particularly those related to catchment storage (BFI, percentage of highly productive fractured rock, etc.) are more influential than the average annual rainfall in south and east of the UK. Many studies highlight the importance of storage on drought propagation. Stores such as soil column, groundwater, lakes, and reservoirs determine the transformation of the drought signal. Van Loon and Laaha [6] found that only the combination of a large number of storage factors could explain variability in drought duration in a large number of Austrian catchments. Moreover, some studies stress the importance on whether hydrological drought is governed by climate or catchment properties. The governing factors in determining hydrological drought characteristics are highly dependent on scale. On a global scale, hydrological drought might be more related to the climate as compared to catchment variables, whereas at a regional/catchment scale, catchment properties may have more influence on the hydrological drought. In addition to natural factors, human activities such as reservoir operation and irrigation activities also have a role in drought propagation. Reservoir operation affects the relationship between meteorological and hydrological drought by changing the state of river storage and hydraulic connection [15], and has an opposite effect on hydrological drought in the regions of downstream and upstream of the reservoir. Irrigation intensifies hydrological drought by surface water and groundwater consuming [16]. The response mechanisms of hydrological to meteorological drought are complex due to the diverse catchment characteristics (including natural condition and human activity), and studies on how climate, catchment properties, and human activities affect drought propagation processes still need further investigation.
A majority of previous studies on drought propagation are conducted on a monthly scale and focused on establishing the linear or non-linear relationship between characteristics of diverse drought types [17,18], and analyzing the links between meteorological and hydrological drought with the Pearson correlation or wavelet analysis [9,19,20,21]. Many studies tried to answer the question how to estimate the characteristics of hydrological drought given the propagation relationship using probabilistic approaches. For instance, Wong et al. [22] utilized two approaches (single event and multi-event) to identify the prior meteorological drought associated with each hydrological drought and investigate the dependence structure between the characteristics of meteorological and hydrological drought. Scatter et al. [23] quantified the probabilistic relationships of meteorological and hydrological drought intensities based on the Bayesian network model. Moreover, based on the Bayesian network, Guo et al. [24] explored the propagation thresholds of duration and severity from meteorological to hydrological drought. Zhu et al. [18] proposed a three-dimensional linking procedure to integrate linked meteorological and hydrological drought events and a copula-based method employing the conditional probability distribution to depict the dependence between the characteristics of meteorological and hydrological drought. In general, these studies mainly focus on the relationship of duration and severity between meteorological and hydrological drought. Whether or not a meteorological drought would trigger a hydrological drought or a hydrological drought would occur in the absence of meteorological drought is very important for an early warning prediction of drought.
In this paper, the standardized precipitation index (SPI) and standardized runoff index (SRI) with multiple time scales are used to extract meteorological and hydrological drought events based on the threshold method in the Huaihe River Basin (HRB). The specific objectives of this study are: (1) To establish a comprehensive framework for quantitatively revealing the propagation relationship of meteorological and hydrological drought on a daily basis; (2) to explore the roles of climate, catchment properties, and human activities on drought propagation in the catchment.
2. Study Area and Data
2.1. Study Area
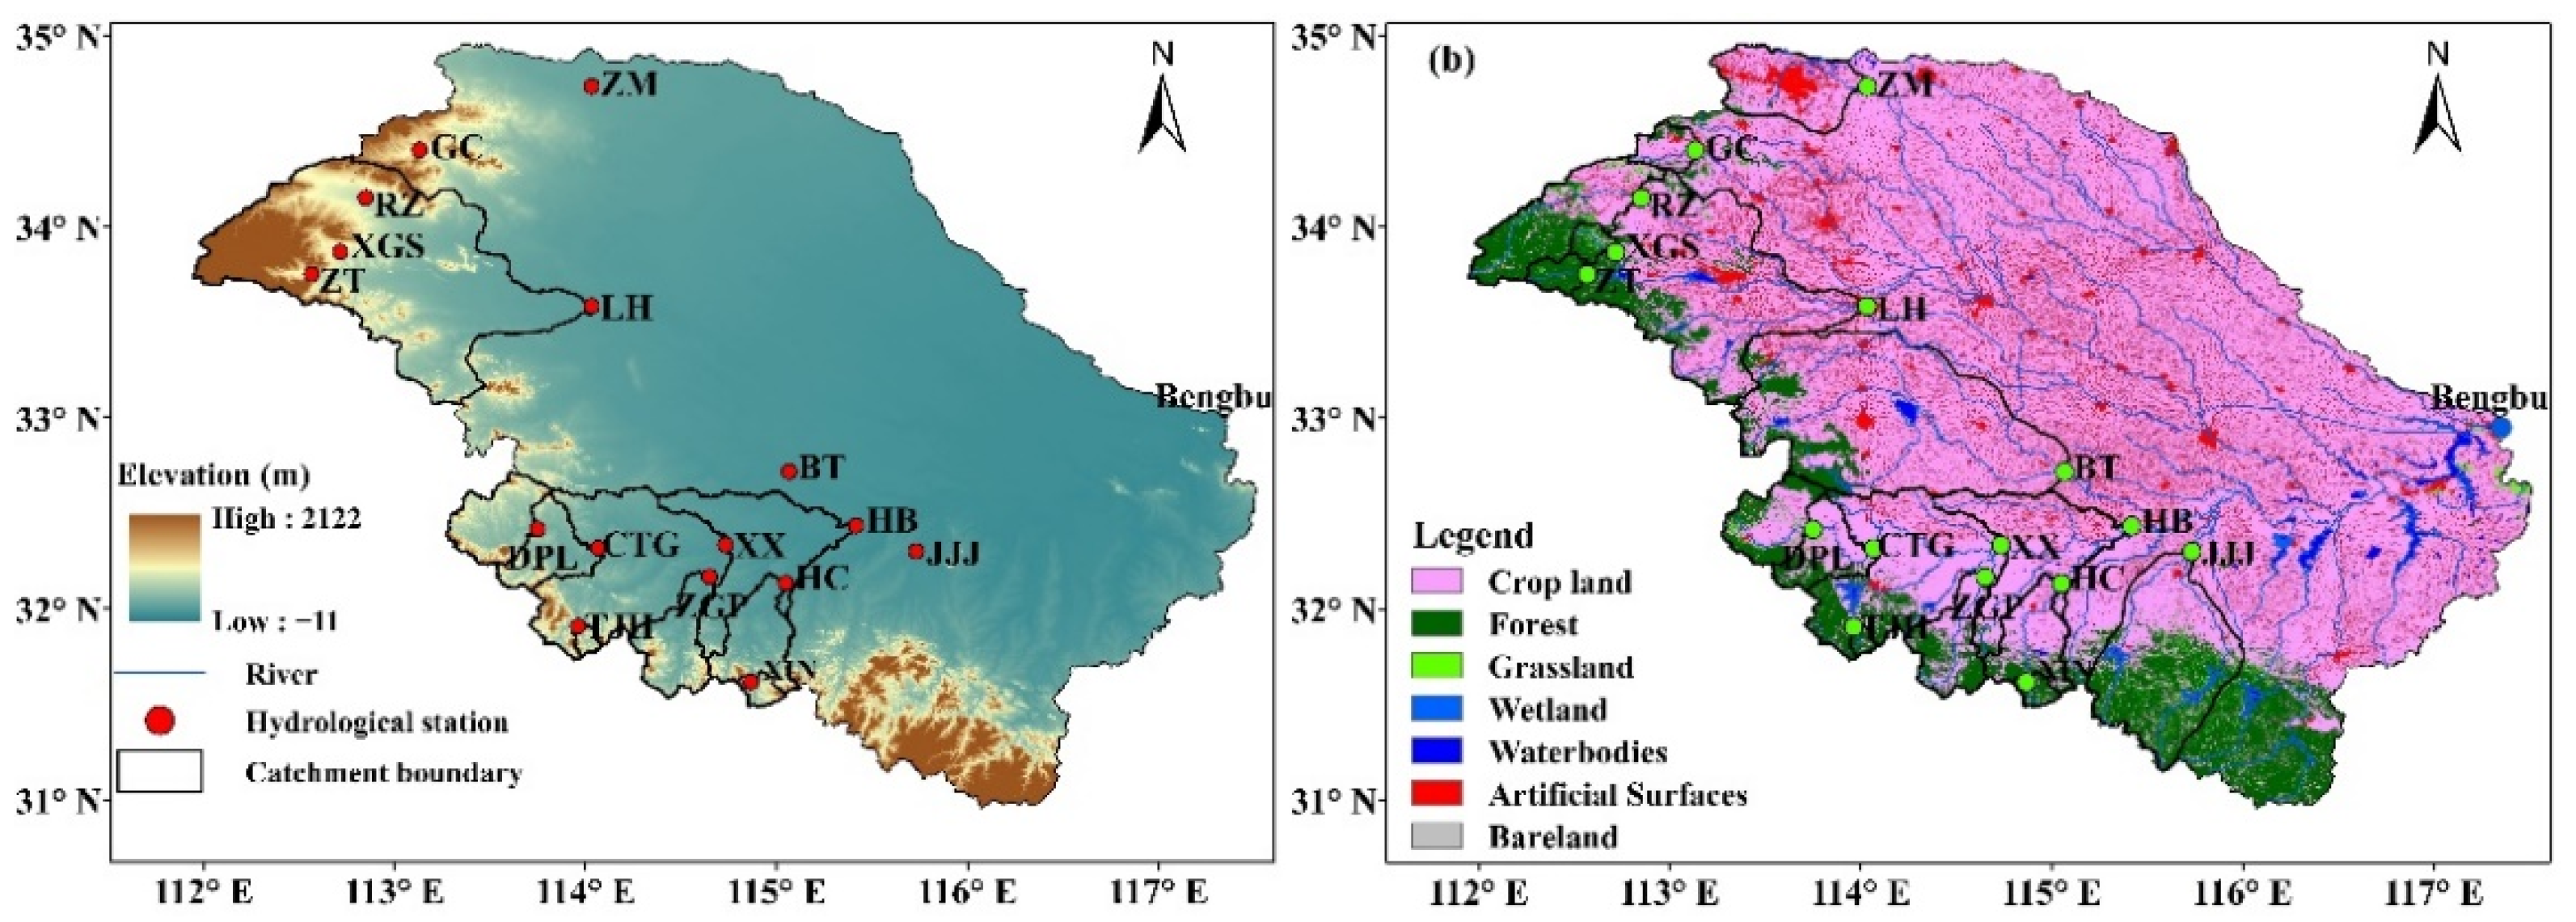
A total of 16 sub-catchments in the upper, middle reaches and tributary of Huaihe River Basin (HRB) were selected for the study (Table 1 and Figure 1). Due to the typical monsoon climate, there is strong seasonality in precipitation and temperature in HRB: Dry and cold in winter, while wet and hot in summer. The average annual precipitation ranges from 600 to 1000 mm in the northern part and 900 to 1400 mm in the southern part during 1980–2014. The inter-annual variation of precipitation is uneven and more than 60% of precipitation falls in the flood season (June to September). The land cover types are shown in Figure 1b. There are 28 large and medium-sized reservoirs in the 16 catchments, all of which were built and put into operation before 1980.
2.2. Data
Daily precipitation observed by the Hydrology and Water Resources Bureau of Henan Province at 184 gauging sites and discharge observed at 16 hydrologic stations during 1980–2014 were used. The Thiessen polygon method was applied to estimate the average areal precipitation of each catchment. SRTM digital elevation data (https://lta.cr.usgs.gov/SRTM, 15 September 2016) with a resolution of 90 m are used to calculate the topographic index. The monthly normalized difference vegetation index (NDVI) with a resolution of 0.05 × 0.05° from 2000 to 2014 was obtained from MODIS MODI13C2 datasets (https://ladsweb.modaps.eosdis.nasa.gov/, 20 October 2016). Land cover data for 2010 with a 30 m resolution were obtained from GlobeLand30 datasets (http://www.globallandcover.com/, 5 June 2019).
3. Methodology
3.1. Drought Characterizing
3.1.1. Drought Indices
The standardized precipitation index (SPI) [25] and standardized runoff index (SRI) [26] are used to quantify meteorological and hydrological drought, respectively. The indices were calculated on a daily basis with a “moving window” approach [27]. Daily precipitation data are first aggregated over time spells of 30, 90, 180, and 365 days. For the cumulative precipitation series with each time scale at each calendar day, a Gamma distribution is fitted to it and then transformed to the standard normal distribution to get a SPI series. The whole SPI series of the entire period is obtained by reorganizing the SPI series at each calendar day. The same procedure is applied to get daily SRI series at 30-, 90-, 180-, and 365-day scale.
3.1.2. Drought Identification
The threshold method [28] was applied to identify drought events on the SPI/SRI series, then drought characteristics (duration and severity) were estimated for those drought events. The procedure is as follows (Figure 2):
- (1)
- Initial identification. Set threshold τ = −1 to capture drought events;
- (2)
- Pooling adjacent droughts. Interval time criteria (tc) was selected to pool mutually dependent droughts. If the interval time t between two adjacent droughts is less than the predefined tc and the drought index between two droughts is less than 0, then two adjacent droughts can be pooled to form a new drought event. Repeat the procedure until the interval time between all the droughts is greater than tc. Then, tc is predefined as 10 days for both meteorological and hydrological drought identification;
- (3)
- Excluding minor droughts. Minor droughts with a short duration have little impact on hydrological conditions but large impacts on drought characterization. If the duration of a drought event is less than the predefined minimum duration Dmin, then the event is excluded. The Dmin is predefined as 10 and 30 days for meteorological and hydrological drought identification, respectively.
3.1.3. Estimation of Drought Characteristics
Most of the previous studies utilized duration and severity to characterize a drought event, but characteristics such as speed describing the drought internal process is rarely considered in the propagation analysis. Therefore, in the study, a drought event is characterized by its duration, severity, and development/recovery speed.
- Drought duration (D) is the period from the onset time to end time of a drought event;
- Drought severity (S) is the sum of SPI/SRI values during a drought;
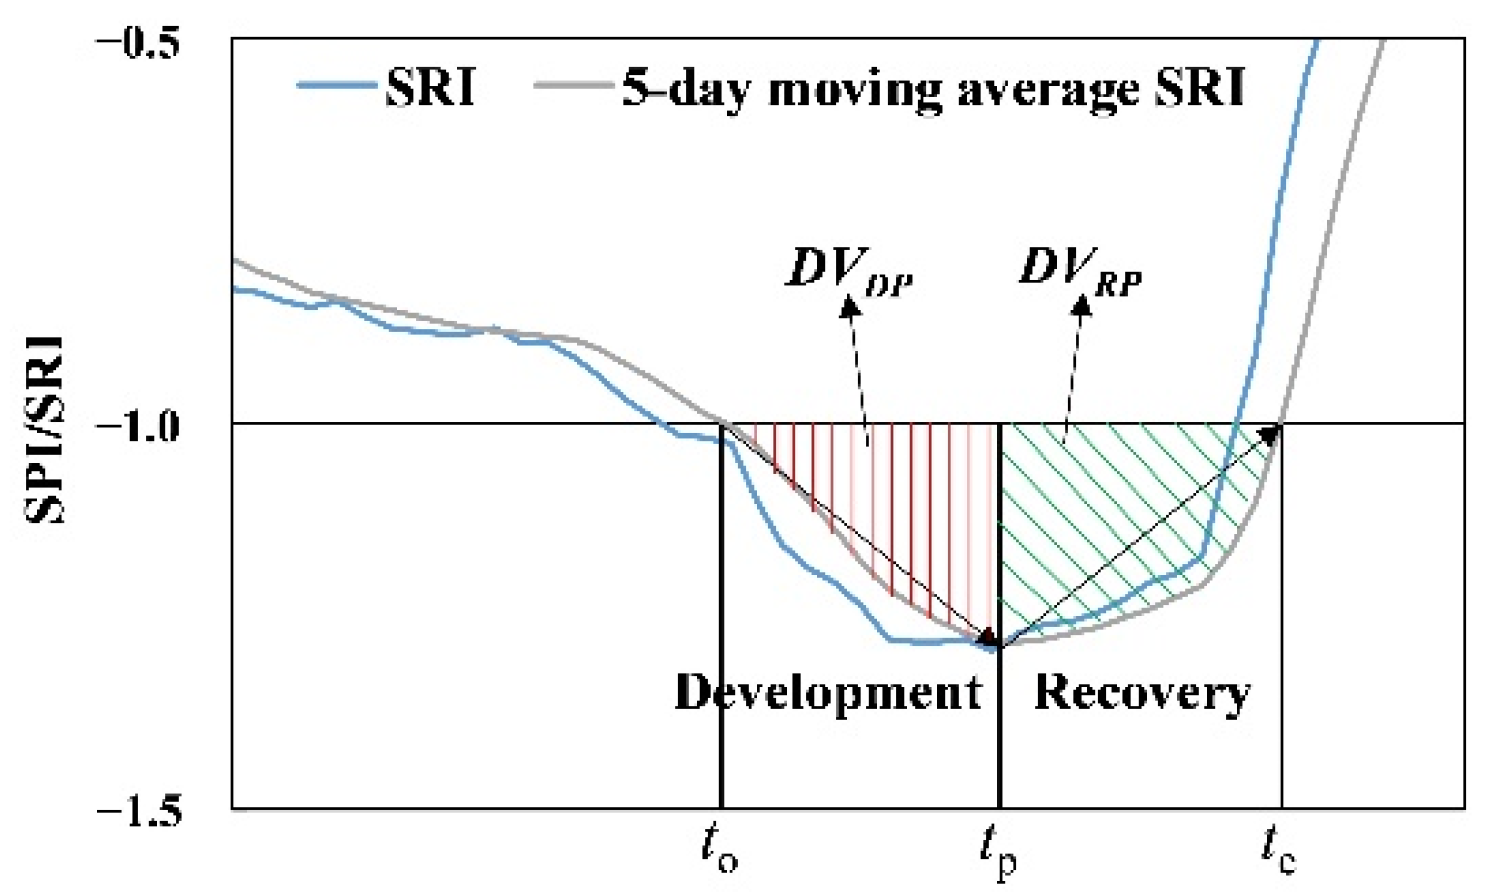
- Drought development speed (DS) is the change rate of the drought index from the onset time (to) to the peak time (tp) during the drought development stage and recovery speed (RS) [29] is the change rate of the drought index from the peak time (tp) to the end time (te) at the drought recovery stage. To reduce the fluctuation of daily series without significantly changing the onset and end time of drought events, the 5-day moving average process is first employed to the daily SPI/SRI series (Figure 3). Then, DS and RS are calculated as follows:where DVDP and DVRP are the deficit volumes of rainfall/streamflow in terms of the 5-day moving average drought index in the development and recovery period, respectively. Additionally, to, tp, and te are the onset, peak, and end time of a drought event. For a pooled drought event, DS (RS) refers to the development (recovery) speed of the first (last) drought.
3.2. Propagation Relationship Analysis
3.2.1. Matching Meteorological and Hydrological Drought Events
The linkage between meteorological and hydrological drought events are judged by their temporal overlapping. The onset and end time of a drought event, combined with the drought duration, are employed to determine whether a meteorological and hydrological drought event has propagation links. If the temporal overlapping of a meteorological and a hydrological drought exceeds one third of their minimum duration, they are considered to be matched [4,18], defined by the following criteria:
where Mo and Me are the onset and end time of a meteorological drought event, respectively; Ho is the onset time of a hydrological drought event. DM and DH are the duration of meteorological and hydrological drought events, respectively. Since the number of drought events decreases with the increase of timescale [12,30], the number of drought events at longer timescales would be limited for statistical analysis. Therefore, meteorological and hydrological drought events both at 30-day scale are utilized to ensure that the sufficient number of meteorological and hydrological drought events are matched for further statistical analysis.
Based on the matching criteria, the matched meteorological and hydrological drought events are identified and then the propagation from meteorological to hydrological drought is divided into three types. Type-1 propagation is the situation that one or several meteorological droughts trigger a hydrological drought. It is further divided into two situations, i.e., the one-to-one situation, when a meteorological drought results in a hydrological drought, and many-to-one situation when several meteorological droughts together result in a prolonged hydrological drought. Type-2 propagation is the situation that a meteorological drought occurs but no hydrological drought occurs. Type-3 propagation denotes the situation that a hydrological drought occurs without the occurrence of a proceeding meteorological drought.
3.2.2. Quantification of Propagation Relationship
The Type-1 propagation is quantified by the occurrence probability of Type-1 (PH|M), the propagation time (TP), and the propagation ratio of drought characteristics (RP) of matched meteorological and hydrological drought events. The Type-2 and Type-3 propagation are quantified by their occurrence probability (PM|NH and PH|NM, respectively).
- Occurrence probability of Type-1 propagation (PH|M) is defined as the probability that a hydrological drought (referred to as H) is triggered when a meteorological drought (referred to as M) occurs. Conditional probability is widely used in studies of probabilistic drought prediction [31,32] and probabilistic links between matched meteorological and hydrological drought characteristics [23,24]. Here, we apply the bivariate conditional probability based on the copula function to estimate PH|M. Assuming that X and Y are random variables with marginal distributions and , the bivariate conditional probability is given by:
In our case, X and Y represent SPI and SRI, respectively; x and y are the real numbers; is the joint cumulative probability calculated by copula. Since the focus of the study is on drought conditions, we only consider the probability that X and Y are less than or equal to −1 (thresholds for meteorological and hydrological drought identification). The correlation of SPI and SRI series is tested using Spearman correlation, then the copula function is applied to derive the joint probability of SPI and SRI series. The marginal distribution of SPI and SRI ( and ) is normal distribution, and the joint distribution is selected from Gaussian, t, Clayton, and Gumbel copula based on AIC [24]. PH|M reflects the sensitivity of hydrological to meteorological drought, and the higher probability indicates that meteorological drought is more likely to propagate to hydrological drought.
- Occurrence probability of Type-2 propagation (PM|NH) is defined to describe the situation that a meteorological drought (M) occurs but no hydrological drought occurs (referred to as NH). PM|NH equals the bivariate conditional probability , given by:PM|NH is calculated as the ratio of the number of meteorological drought events triggering hydrological drought events to the total number of meteorological drought events in the record period, given by:where is the number of meteorological drought events that trigger hydrological drought events and nm is the total number of meteorological drought events.
- Occurrence probability of Type-3 (PH|NM) is defined to quantify the situation that a hydrological drought event occurs without a proceeding meteorological drought event (referred to as NM). PH|NM equals the bivariate conditional probability of , given by:
Considering that a hydrological drought event may occur without a preceding meteorological drought event and a hydrological drought may be triggered by several meteorological drought events, the number of hydrological drought events is the same as the denominator and PH|NM is calculated as:
where is the number of hydrological drought events that is matched to one or more meteorological drought events and mh is the total number of hydrological drought events.
- Propagation time (TP) is the time difference between the onset of matched meteorological and hydrological drought events.where Mo and Ho are the onset time of matched meteorological and hydrological drought events. For the many-to-one situation, Mo refers to the onset time of the first meteorological drought event.
- Propagation ratio of drought characteristics (RP) is the ratio of matched meteorological to hydrological drought event characteristics, given by:where CM,i and CH,i are the characteristics (duration, severity, and development/recovery speed) of matched meteorological and hydrological drought events, respectively; n is the number of hydrological drought events triggered by meteorological drought events. The drought characteristics considered here include the duration, severity, and development/recovery speed, and consequently we have RP-D, RP-S, RP-DS, and RP-RS to represent the propagation ratio of duration, severity, development speed, and recovery speed, respectively. For the many-to-one situation, when calculating RP-D or RP-S, the CM,i should be the sum of duration or severity of all meteorological drought events that triggers the ith hydrological drought event; when calculating RP-DS (RP-RS), the CM,i should be the development (recovery) speed of the first (last) meteorological drought event that triggers the ith hydrological drought event.
3.3. Influence of Climate, Catchment Properties, and Human Activities on Drought Propagation
3.3.1. Selected Influencing Factors
According to the previous studies, the climate is characterized by precipitation, seasonality, aridity, and evapotranspiration, while catchment properties are characterized by the drainage area, land use type, soil type, topography, geology, drainage network, and base flow index (BFI). Rather than the frequently used topography indicators such as elevation and slope, the topographic index [33] from TOPMODEL (a topography-based hydrological model) is applied as an indicator of catchment storage in the present study. To evaluate the effects of human activities, we also defined the ratio of reservoir capacity and the ratio of crop land to represent the reservoir operation and irrigation effects, respectively. The detailed information of influencing factors is listed in Table 2.
3.3.2. Analyze the Influence with the Correlation Analysis
Physically-based models, statistical approaches (linear or nonlinear regression analysis), and supervised learning techniques are mostly used for investigating the role of climate and catchment properties on drought propagation. Physically-based models can provide a valid representation of associated hydrological processes, but the application of physically-based models is often plagued by differences in spatial scale, over/under-parameterization, and model structural error [8,35]. Supervised learning techniques (e.g., Random Forest, Classification and regression trees) can capture subtle functional relationships between the input (climate and catchment variables) and output (streamflow) even if the underlying mechanism producing data is not known [8]. However, the reliability of supervised learning techniques is highly dependent on the representativeness of the data. In comparison, the statistical approach, such as the Pearson correlation analysis, is easier to be used at a diverse spatial extent provided the availability of long-term and reliable observations of atmospheric and hydrological variables. Since catchment variables are likely not independent and the effect of one catchment variable on the other variables is non-negligible, the partial correlation is applied to further investigate the relationship between catchment variables and hydrological drought and propagation characteristics. The partial correlation coefficient between x and y after eliminating the effect of z is calculated as follows:
where x is the hydrological drought characteristics or propagation characteristics (e.g., the propagation time and average duration of hydrological droughts of catchments), y and z are influencing factors (e.g., average annual precipitation and NDVI of catchments).
4. Results
4.1. Characteristics of Meteorological and Hydrological Drought Events
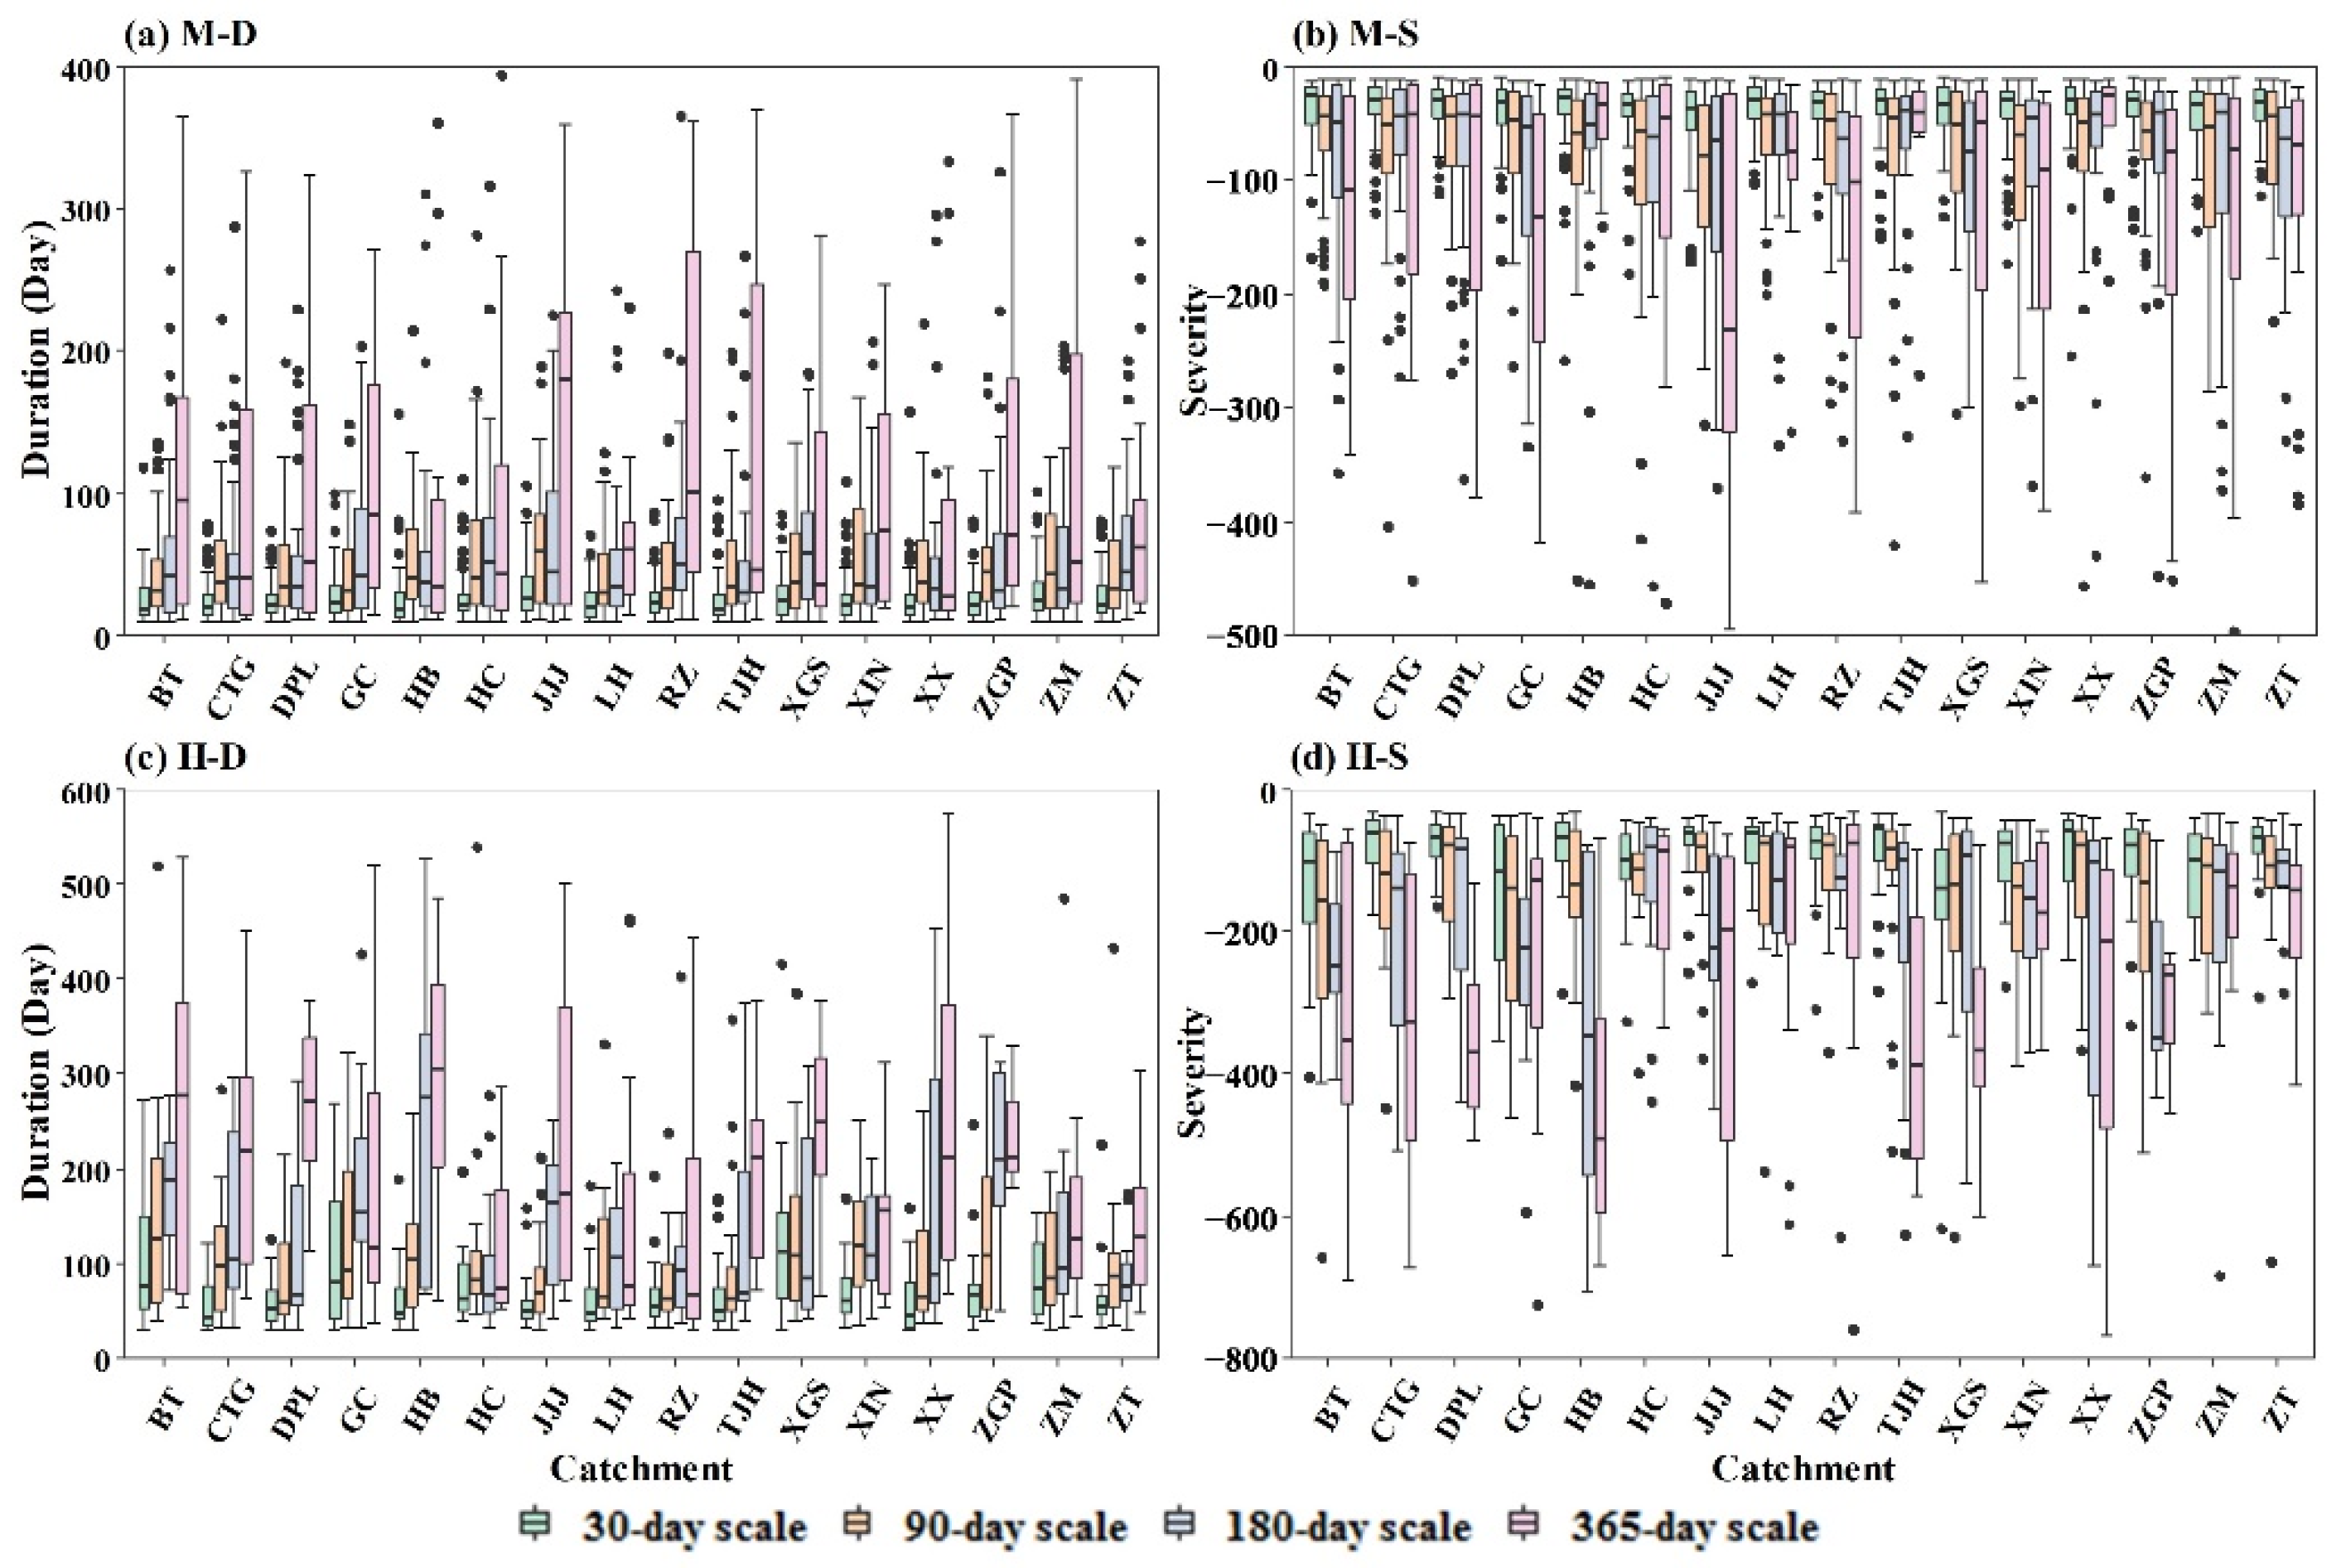
The duration and severity of meteorological and hydrological drought events at 30-, 90-, 180-, and 365-day scale are shown in Figure 4. It is shown that as the time scale increases, the duration of meteorological and hydrological drought becomes longer and the severity becomes larger. This is due to the high-frequency variability in SPI/SRI series at a short time scale, which fluctuates near the threshold, resulting in lots of small and short drought events. Therefore, the duration lengthens and the severity amplifies as the timescale increases. The duration of meteorological and hydrological droughts at 30-day scale varies from 10 to 158 days and from 30 to 417 days, respectively. The greatest severity of meteorological and hydrological droughts at 30-day scale is −257 and −618, respectively. Hydrological droughts have longer durations and greater severities than meteorological droughts in studied catchments at all timescales. The duration and severity of meteorological droughts are relatively stable, with little spatial variability. However, the duration and severity of hydrological droughts vary significantly across catchments. This is due to the fact that the difference of meteorological drought characteristics among catchments is mainly determined by the quantity and concentration of precipitation, whereas hydrological drought characteristics are influenced by the combination of climate, catchment properties, and human intervention, which exhibit large variability among catchments. The spatial pattern of meteorological drought characteristics is also different from that of hydrological drought characteristics, for example, the longest duration of meteorological drought at 30-day scale is in XX, while the longest duration of hydrological drought is in BT, while the greatest severity of meteorological and hydrological drought is in HB and XGS. The large amount and uneven distribution of precipitation leads to a higher severity of meteorological drought in HB. Less precipitation combined with a large percentage of mountainous area makes the runoff of XGS difficult to be replenished during a dry spell.
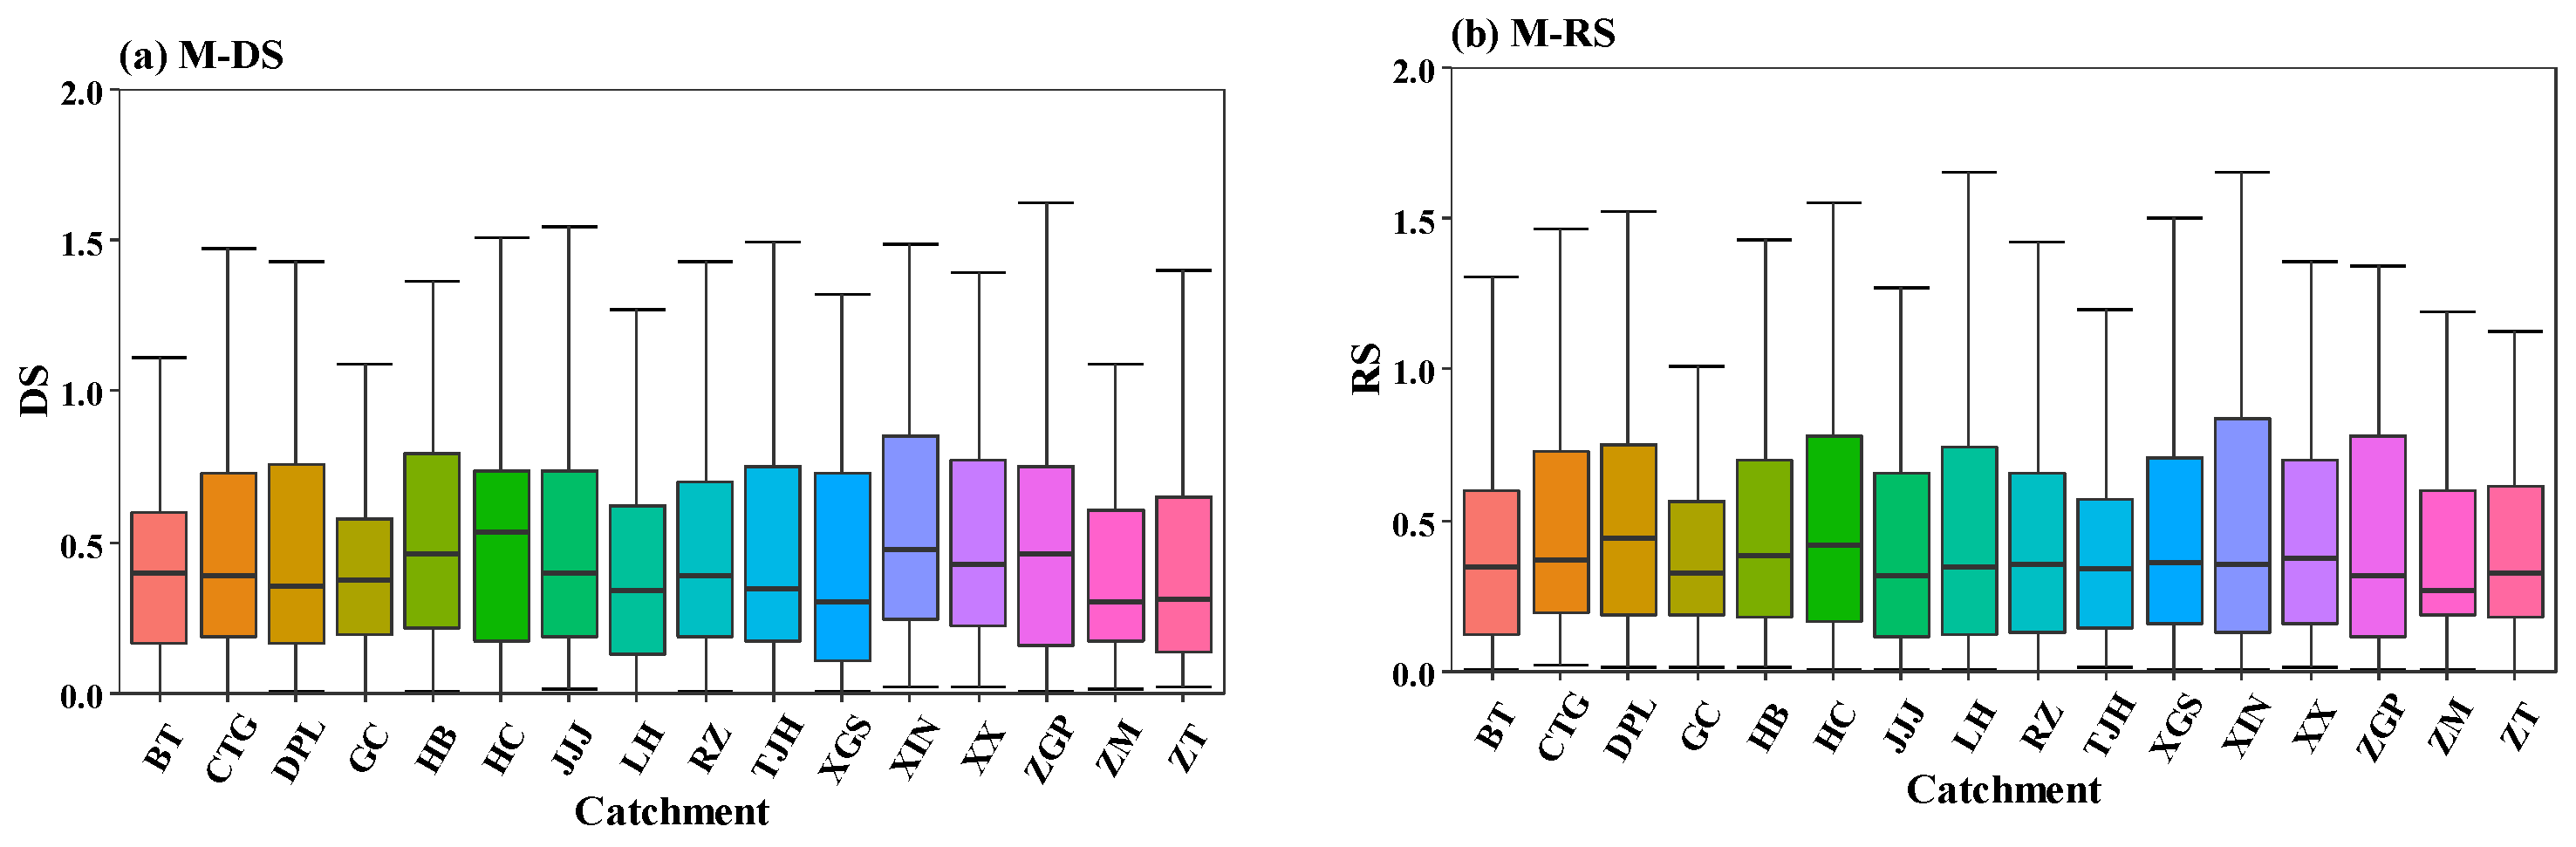
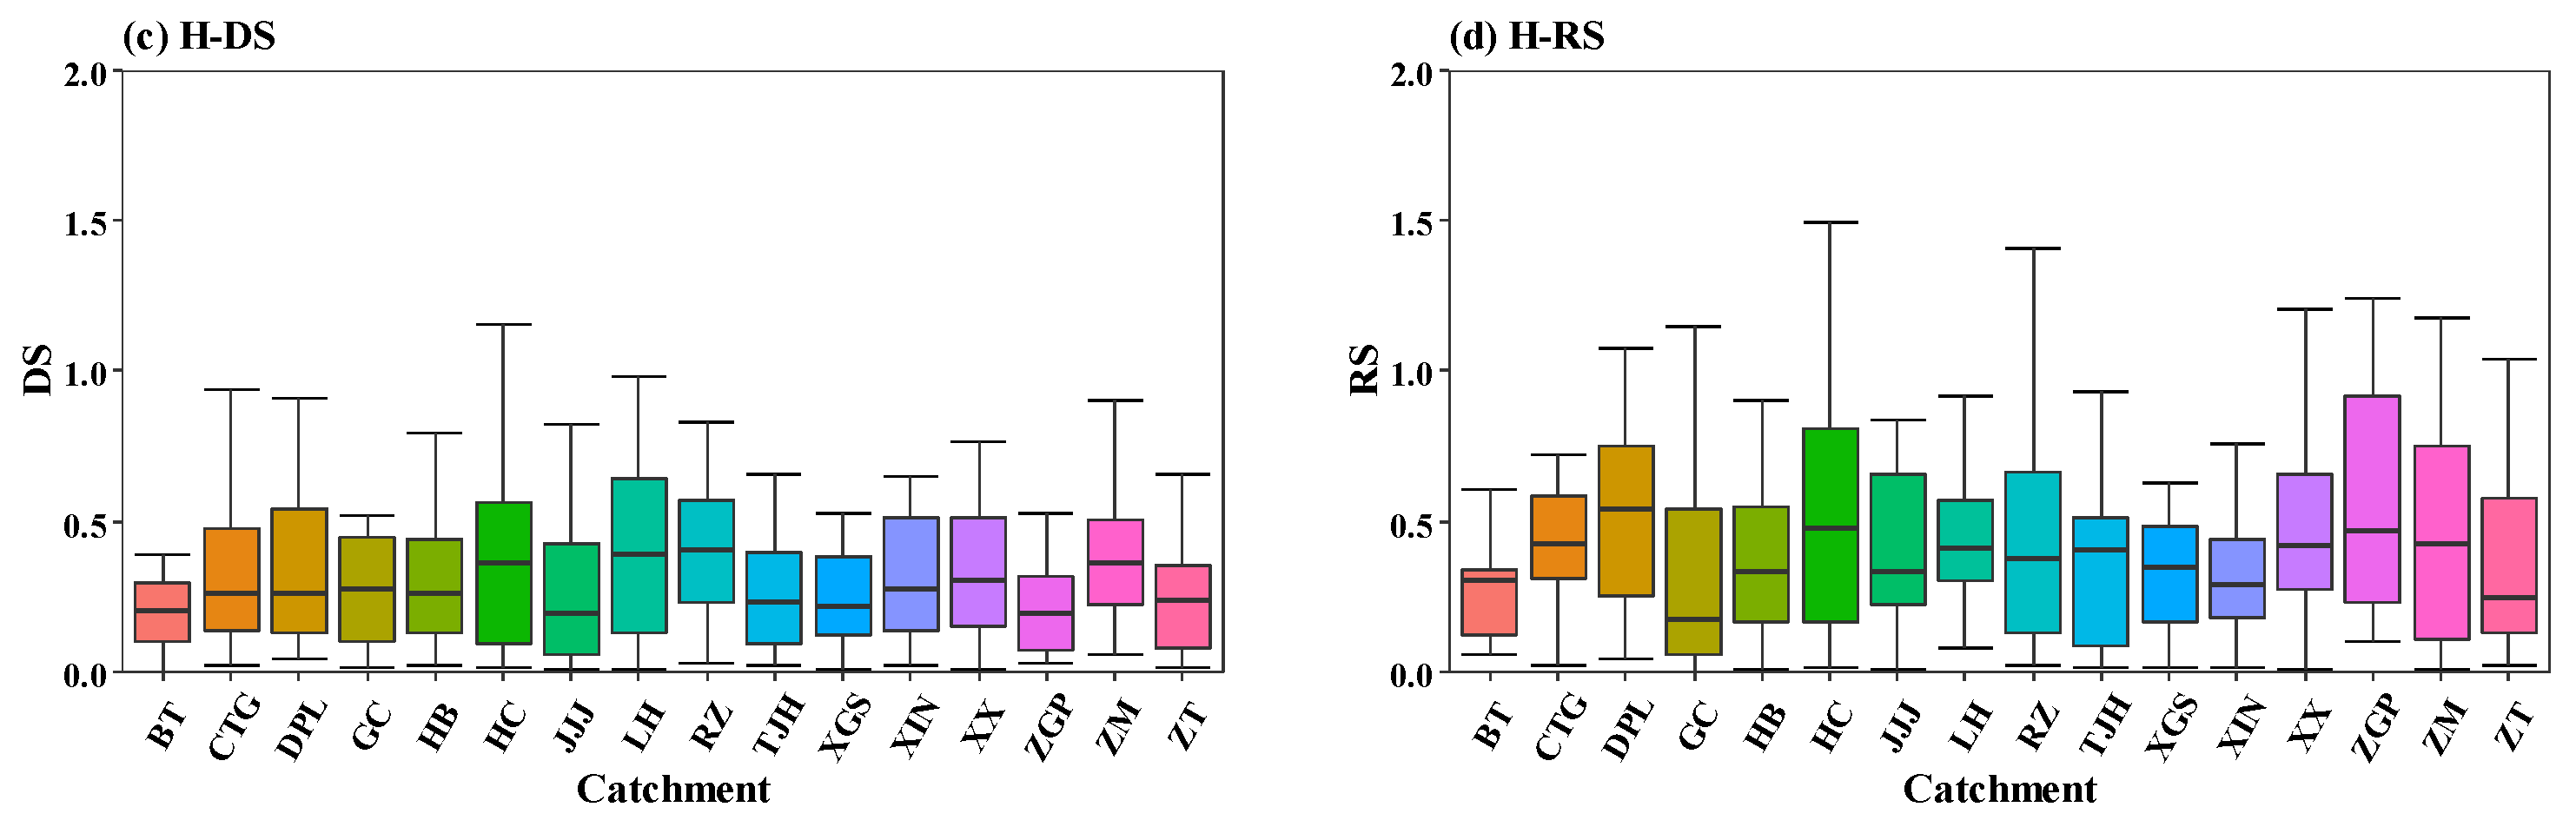
The development/recovery speed (DS/RS) indicates how quickly a drought can develop to its peak and recover to normal conditions. Different from duration and severity, there is no significant relationship between DS/RS and the timescale. Hence, only the 30-day scale is illustrated in Figure 5. Figure 5 shows that hydrological droughts have slower speeds than meteorological droughts. Different from duration and severity, there is no significant relationship between DS/RS and the timescale. At 30-day scale, the DSH (DS of hydrological drought) ranges from 0.06 to 1.58 and the RSH (RS of hydrological drought) varies from 0.05 to 1.50 among all catchments. The DSM (DS of meteorological drought) ranges from 0.05 to 1.68 and the RSM (RS of meteorological drought) varies from 0.05 to 1.60 among all catchments. DPL and CTG have higher DSH than other catchments and BT has the lowest RSH. For catchments with high DS, the drought develops fast to its peak, implying a stronger need for early drought monitoring and quicker response to alleviate hydrological drought than those catchments with low DS. For catchments with low RS, drought recovers slowly to normal conditions, which needs more human interventions such as water imports by water transfer to reduce drought impacts.
4.2. Propagation Features from Meteorological to Hydrological Droughts
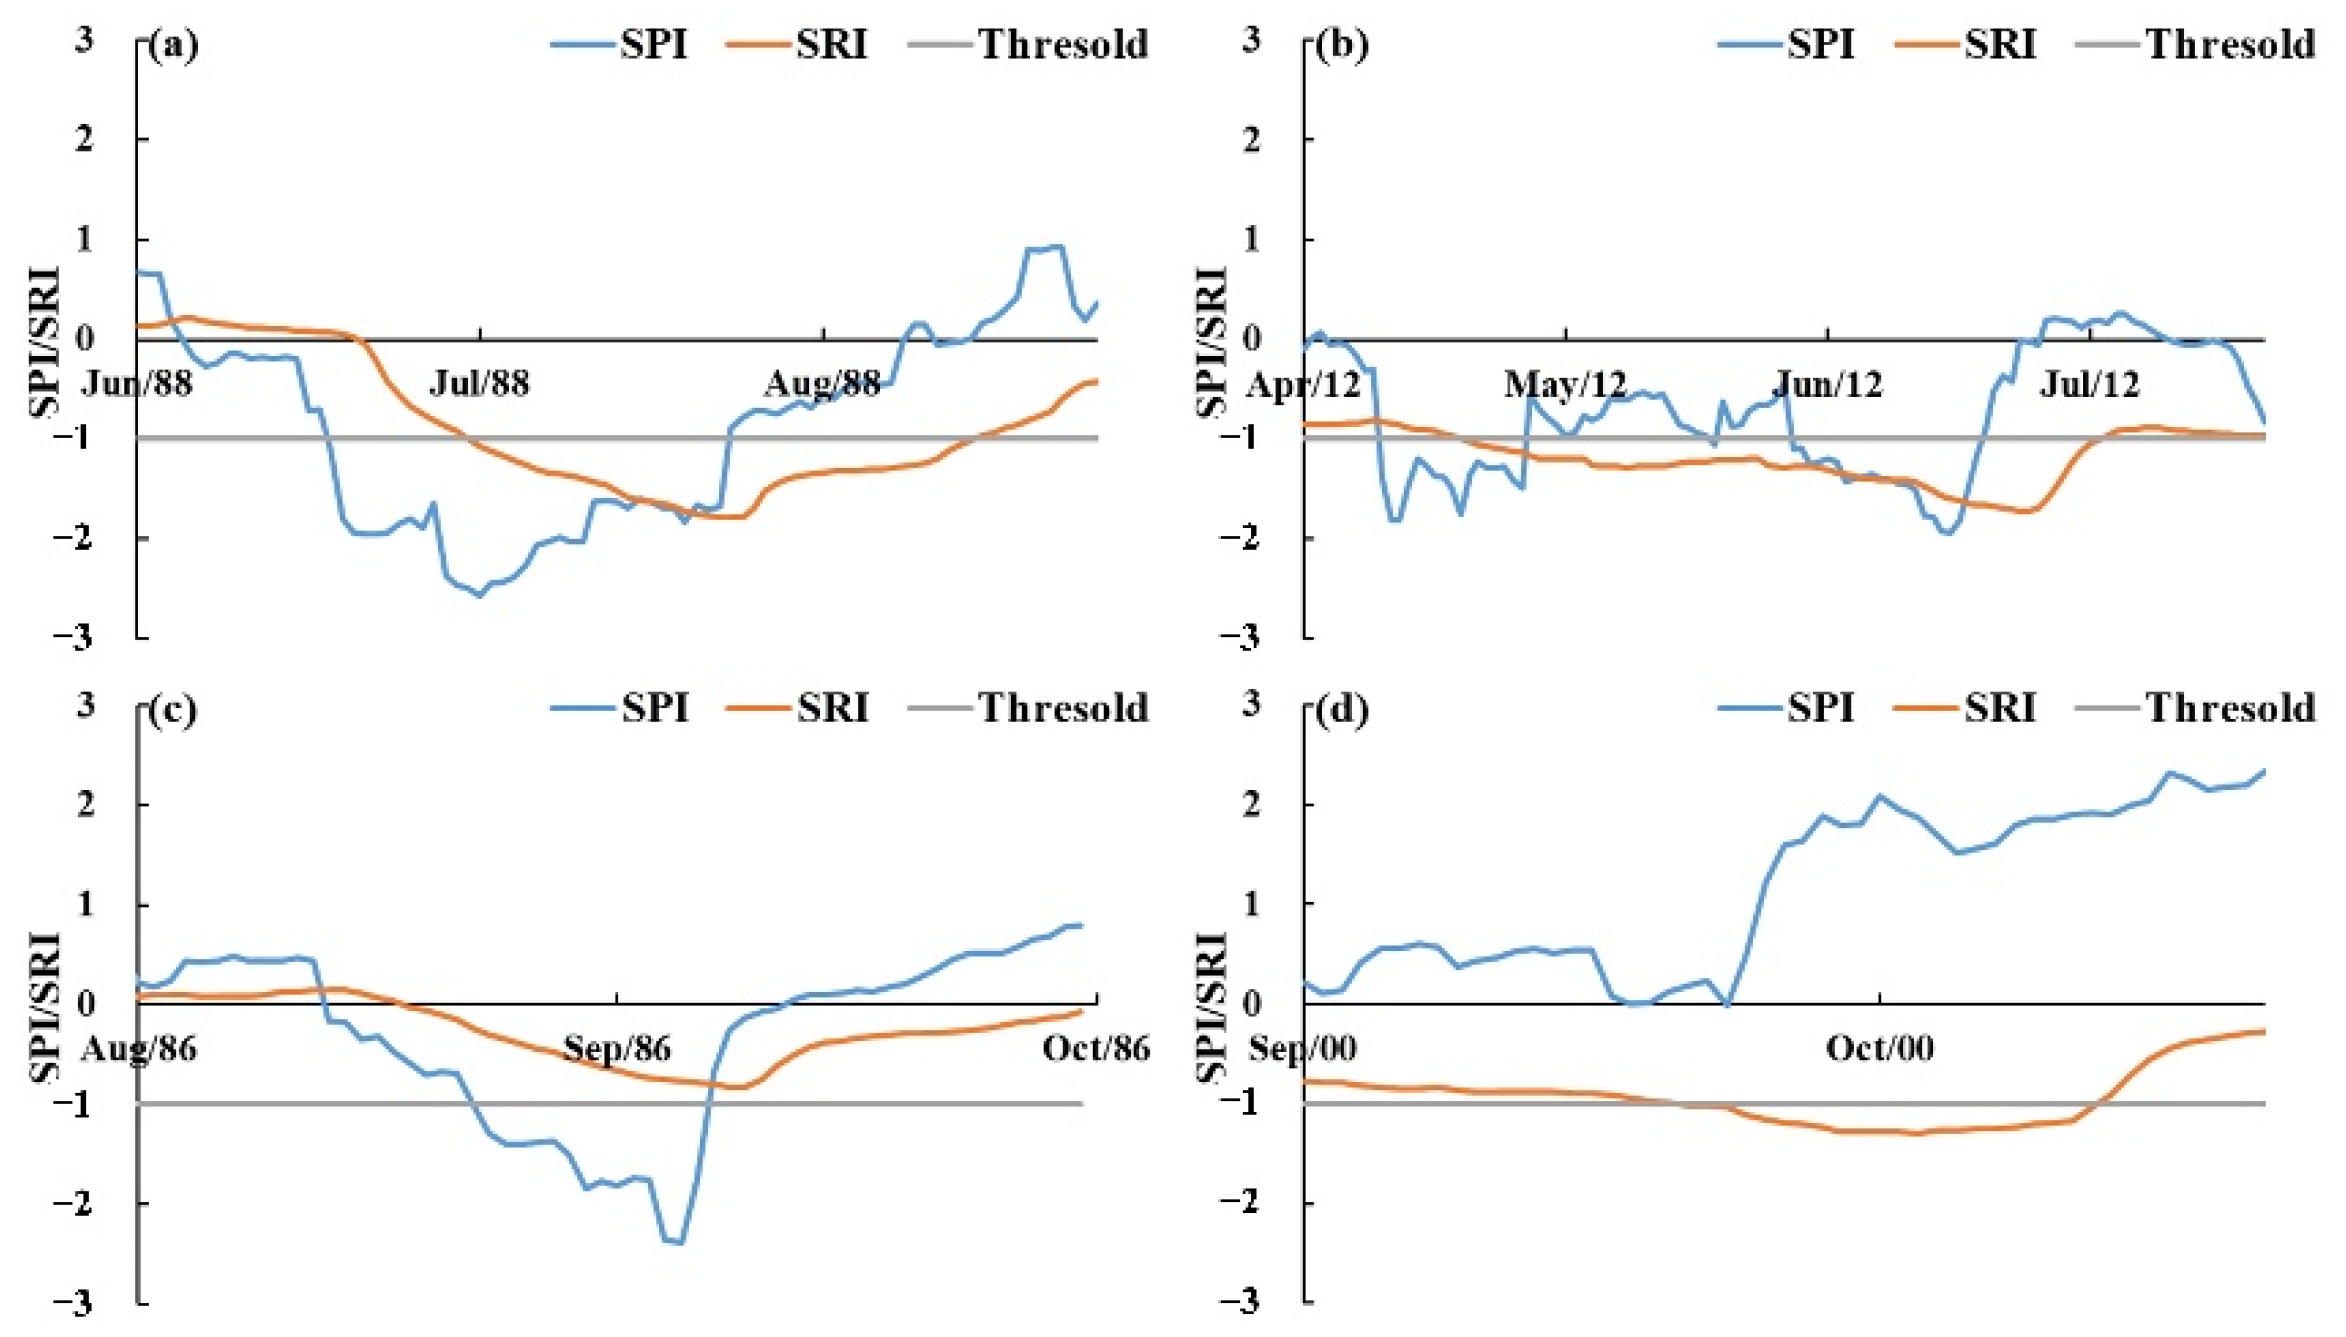
As described in Section 3.2.1, the matched meteorological and hydrological drought events are divided into three types. Examples of the three propagation types are shown in Figure 6. Type-1 propagation consists of one-to-one situation (Figure 6a) and many-to-one situation (Figure 6b). Statistics show that there are more one-to-one situations than many-to-one situations. Type-2 propagation (Figure 6c) happens when the meteorological drought is mild (mostly with short duration and small severity) and the antecedent streamflow is abundant. Type-3 propagation (Figure 6d) is rare, caused mostly by human activities and/or below normal conditions of runoff combined with less precipitation. Hydrological drought events form due to Type-3 propagation and generally have short duration and low severity.
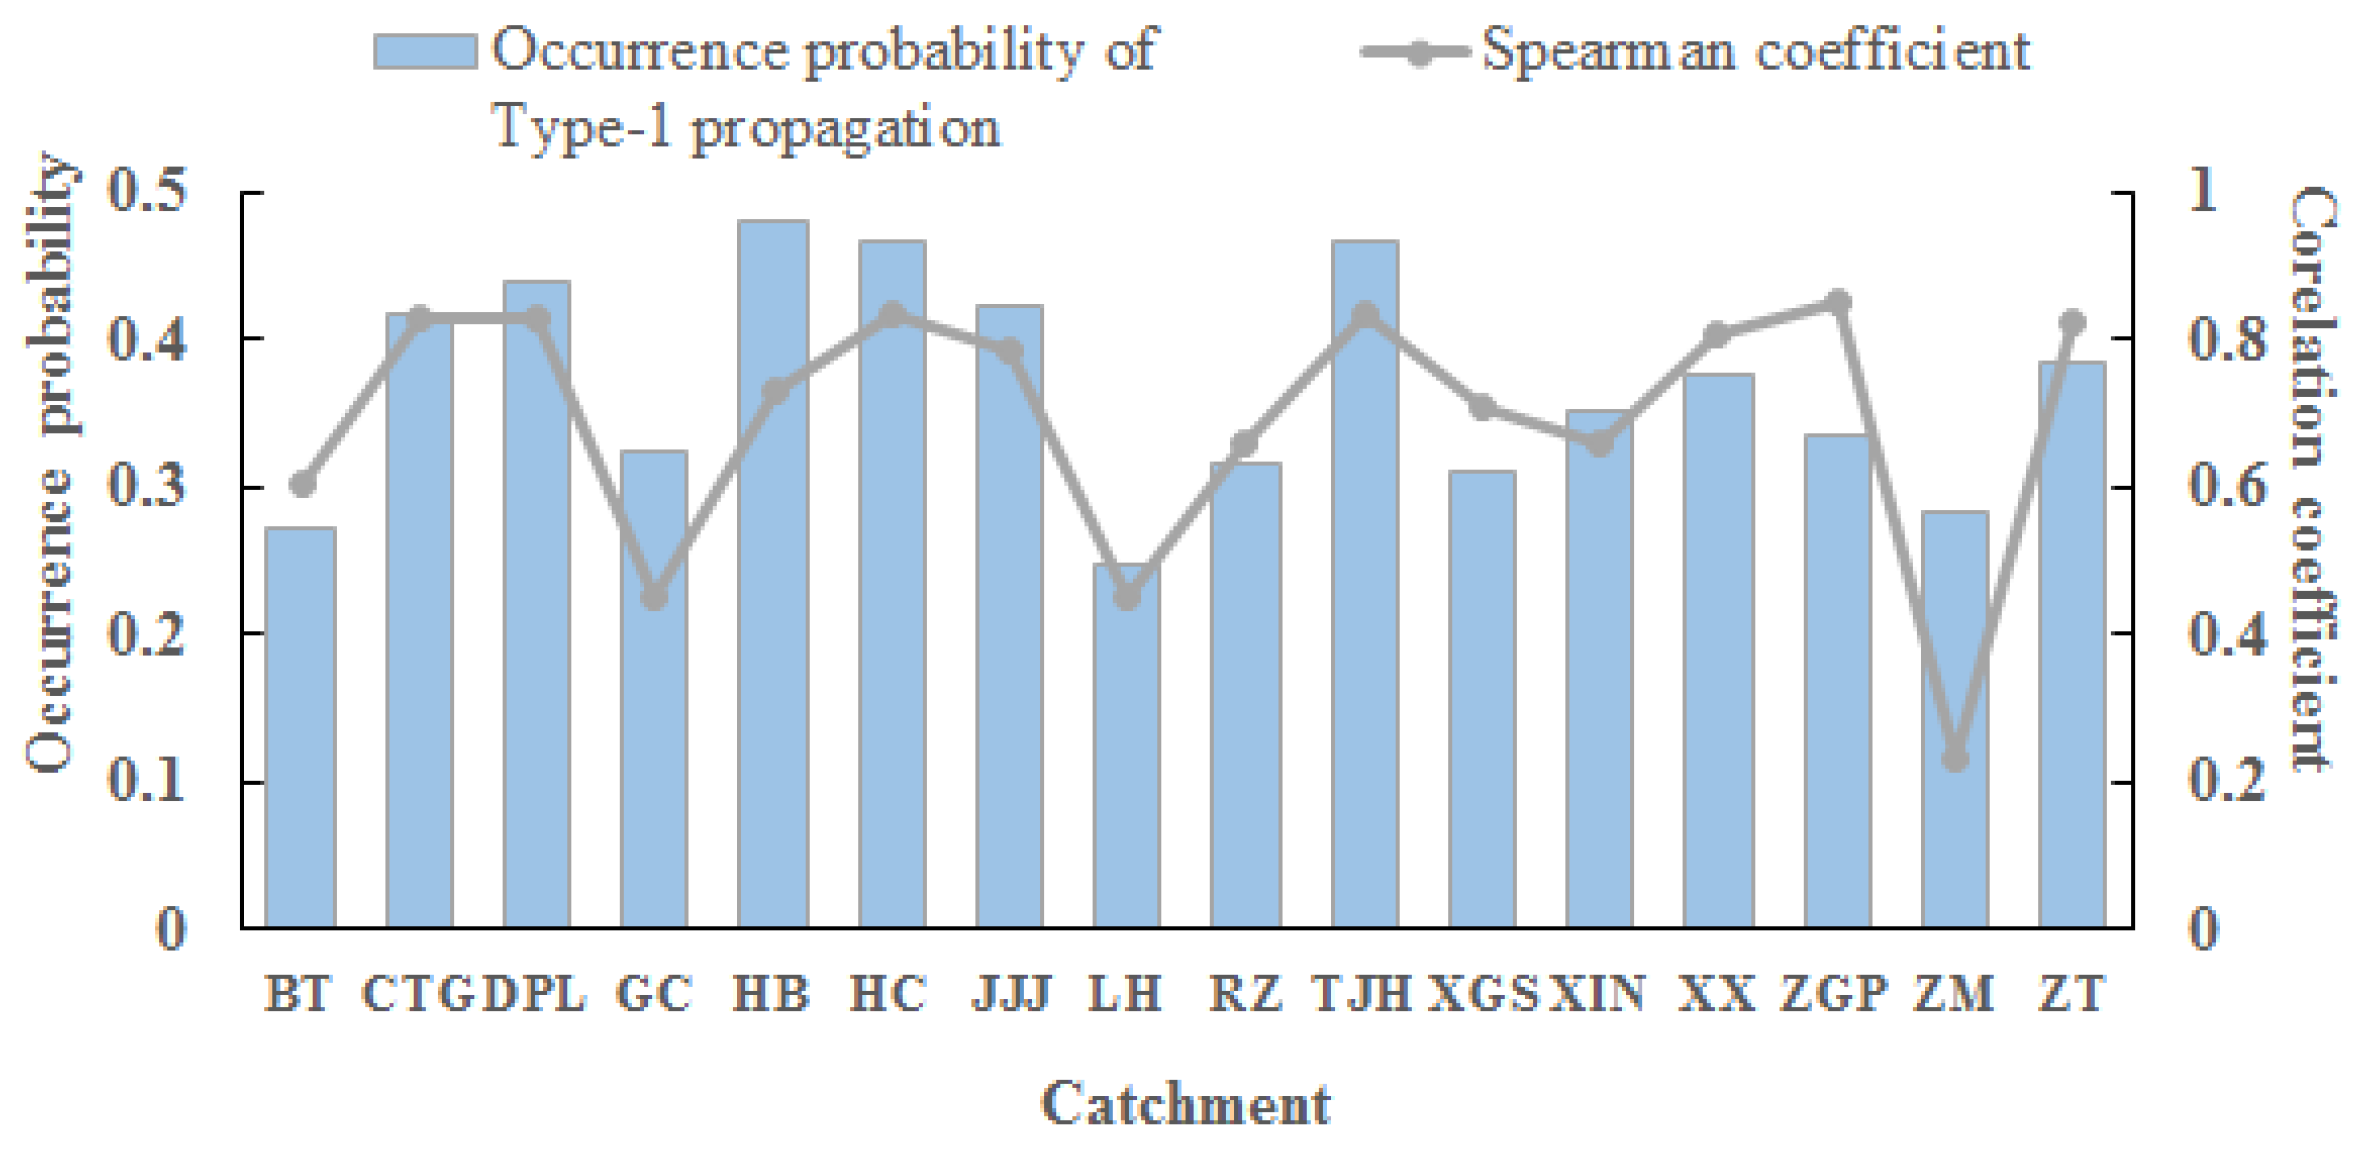
The occurrence probability of Type-1 propagation (PH|M) that a hydrological drought is triggered when a meteorological drought occurs is investigated based on copula functions. Before using the Copula function to build the joint distribution, the correlation between the SPI and SRI series is tested with Spearman correlation. The Spearman correlation coefficient indicates a relatively strong nonlinear relationship between SPI and SRI series except for LH, BT, and ZM catchment (Figure 7). Among Gaussian, t, Clayton, and Gumbel copula, the Gumbel copula has the least AIC, indicating that it fits the joint distribution of SPI and SRI the best. Based on the best-fit Copula function, PH|M is calculated and shown in Figure 7. PH|M varies from 0.25 to 0.48 among all catchments. PH|M is relatively low indicating that less than half of the meteorological drought can trigger a hydrological drought. PH|M is the highest in TJH and the lowest in LH, BT, and ZM (0.25, 0.27, and 0.28, respectively). LH, BT, and ZM also have the weakest correlation between the SPI and SRI series. TJH is located in a mountainous area, with higher rainfall and less percentage of crop land, while LH, ZM, and BT are located in a plain terrain, with less rainfall but more intense human activities. The differences between distinct catchments indicate the comprehensive effect of climate and catchment properties on the drought propagation relationship. It should be noted that the catchment with higher occurrence probability of Type-1 propagation is not equal to the catchment with a more severe hydrological drought. For example, the average drought severity of TJH at 30-day scale (−87.20) is much lower than that of LH (−101.75), which is the lowest PH|M among all catchments (Figure 4).
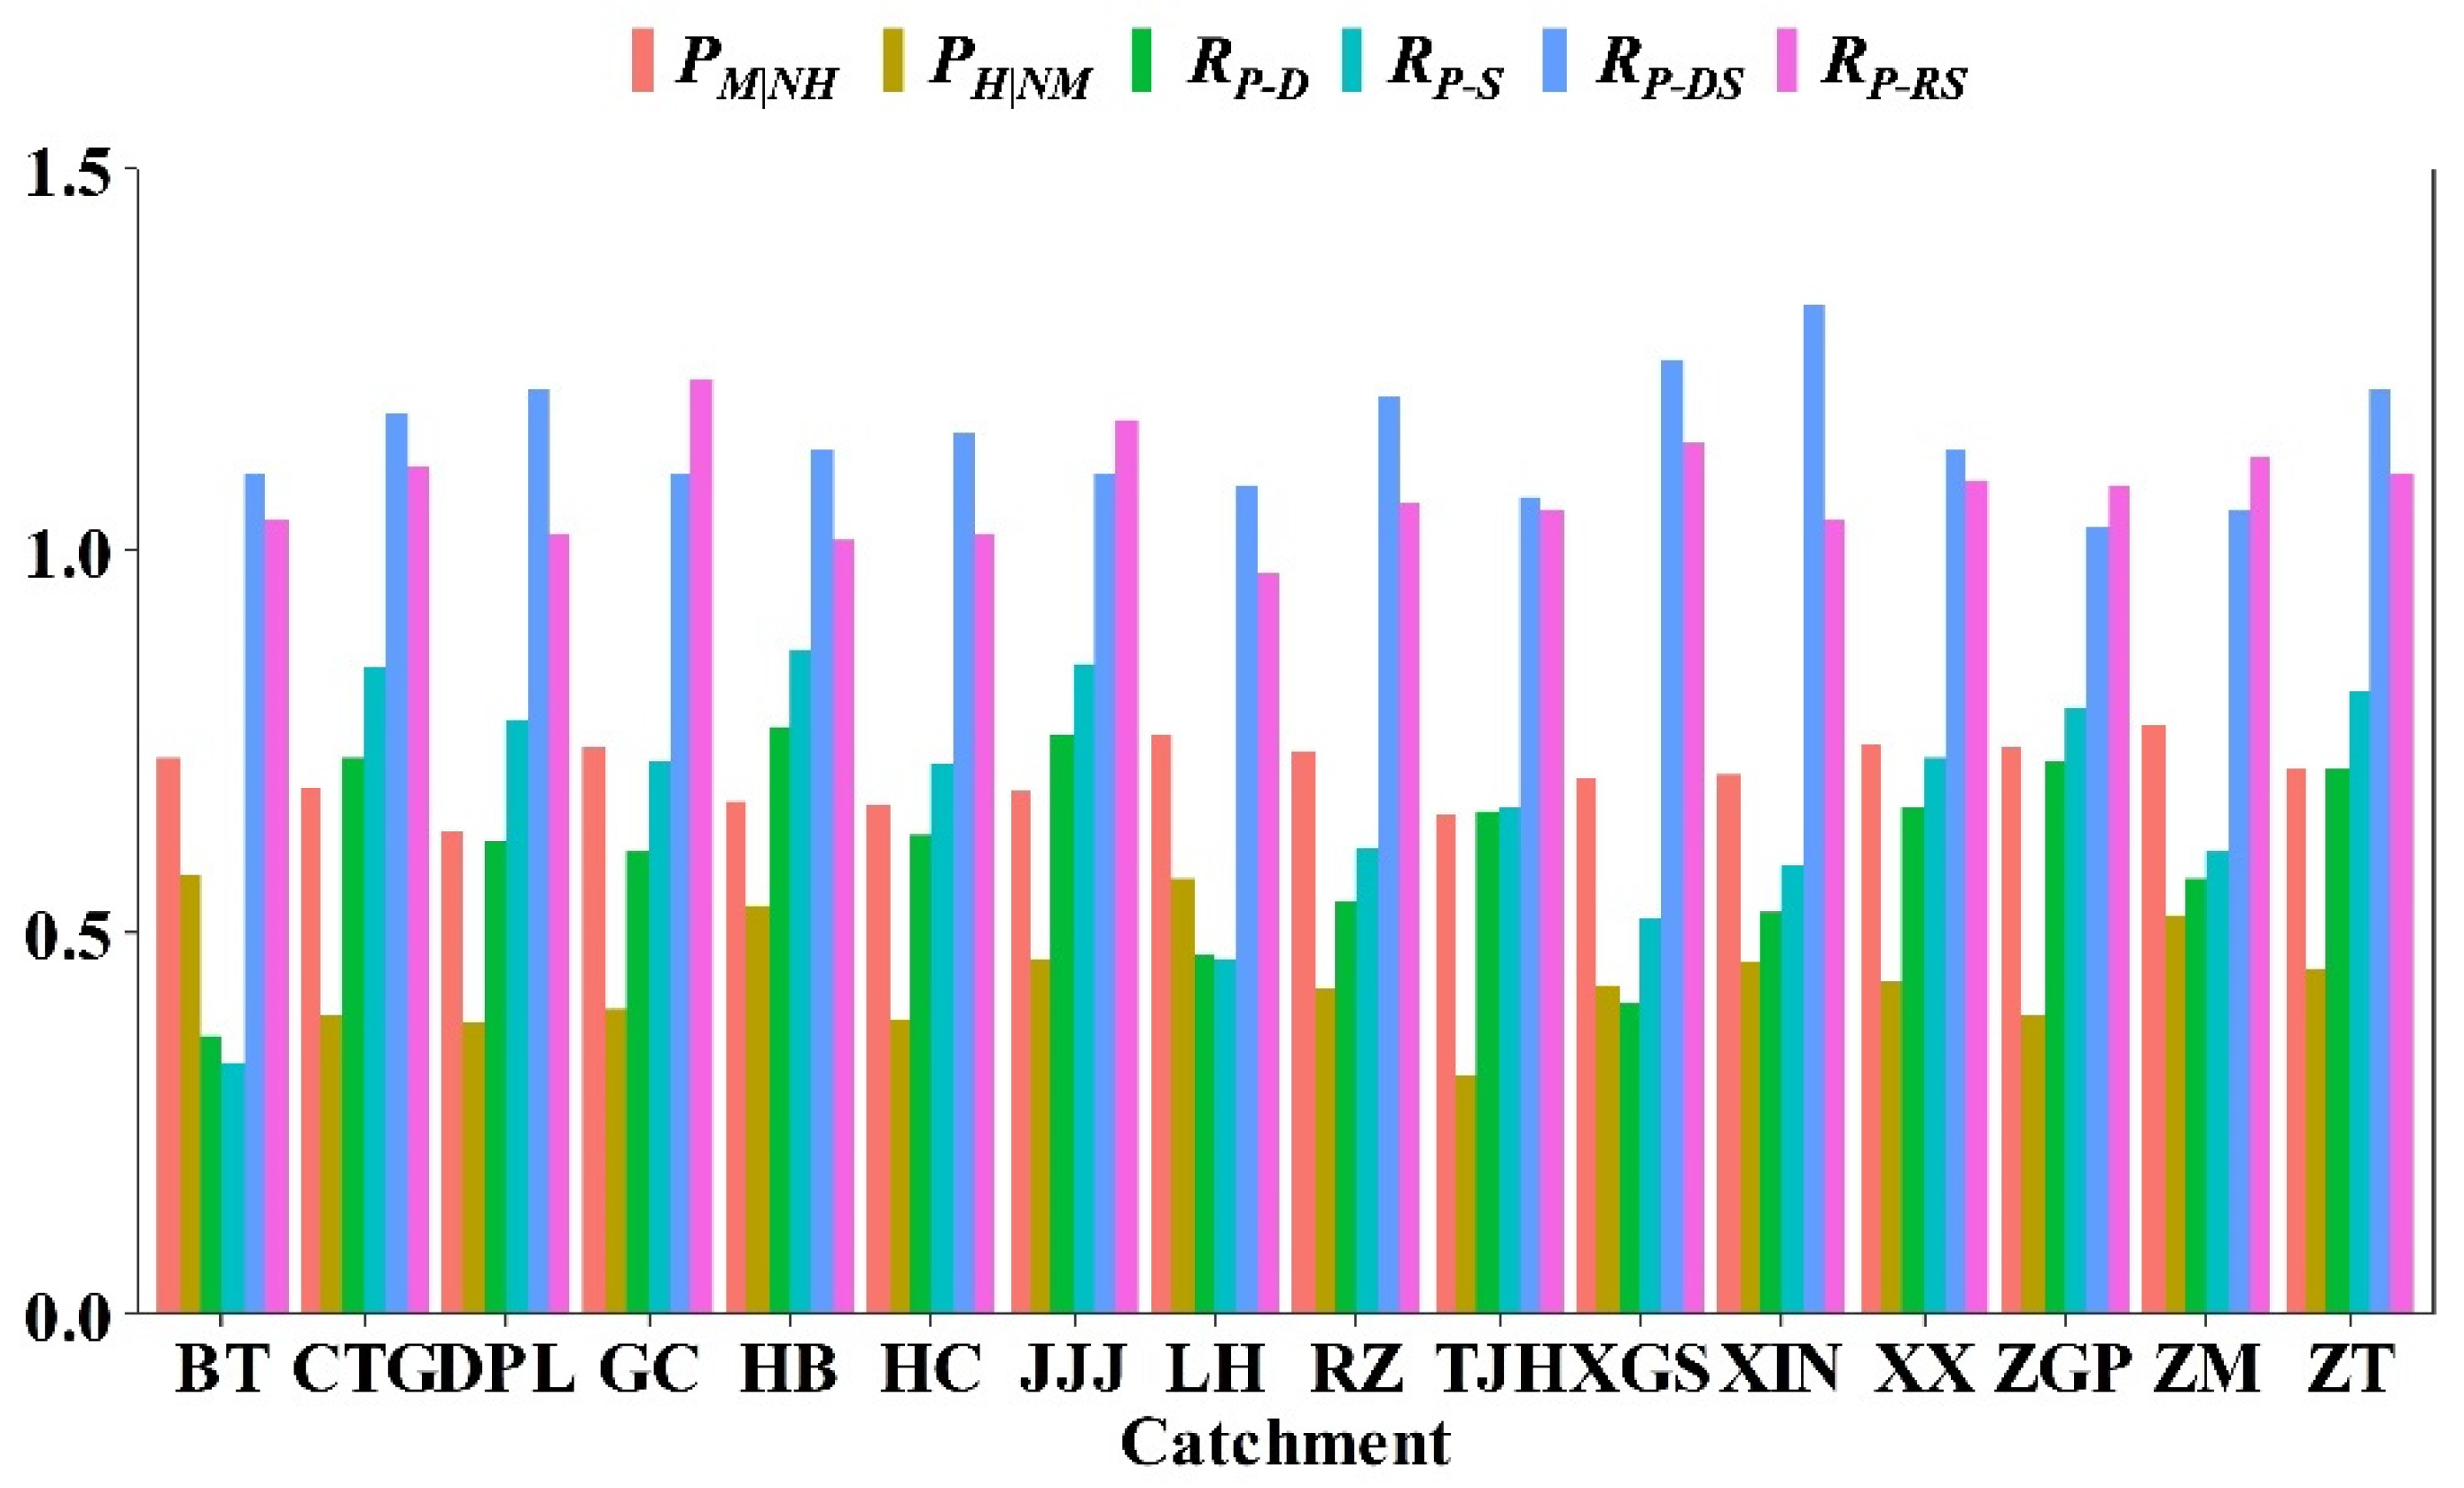
The occurrence probability of Type-2 (PM|NH) varies from 0.63 to 0.77 in all catchments (Figure 8). The occurrence probability of Type-3 (PH|NM) is shown in Figure 8. PH|NM varies from 0.31 to 0.58, which means that 31–58% of hydrological drought events occurs without proceeding to meteorological drought events, i.e., hydrological drought events occur without obvious precipitation deficits. PH|NM in LH, ZM, and BT is the highest, while the lowest PH|NM is in TJH, which is opposite to the occurrence probability of Type-1 propagation (PH|M). Due to the plain terrain associated with catchment storage and intense human activities in LH, ZM, and BT, meteorological and hydrological droughts show a weak synchronization in these catchments, which may increase the occurrence of Type-3 propagation. Figure 8 also shows that the propagation ratio of duration (RP-D) and severity (RP-S) are all lower than 1 indicating that duration lengthens and severity amplifies in drought propagation. The variation of severity (accumulated anomaly) in our studies differs from that in Liu et al. [4]. This is due to the fact that we investigate the propagation phenomenon just in temporal view, and drought propagation in higher dimensions (space-time dimensions) may exhibit different features. It can be observed that the propagation ratio of development/recovery speed (RP-DS and RP-RS in Figure 8) is greater than 1, which means that drought development and recovery speed reduces in propagation from meteorological to hydrological drought. Except for the common discussed propagation features concluded in [2,3], the reduction of speed can also be regarded as an important feature of drought propagation, which can provide valuable information about the internal process of diverse drought types.
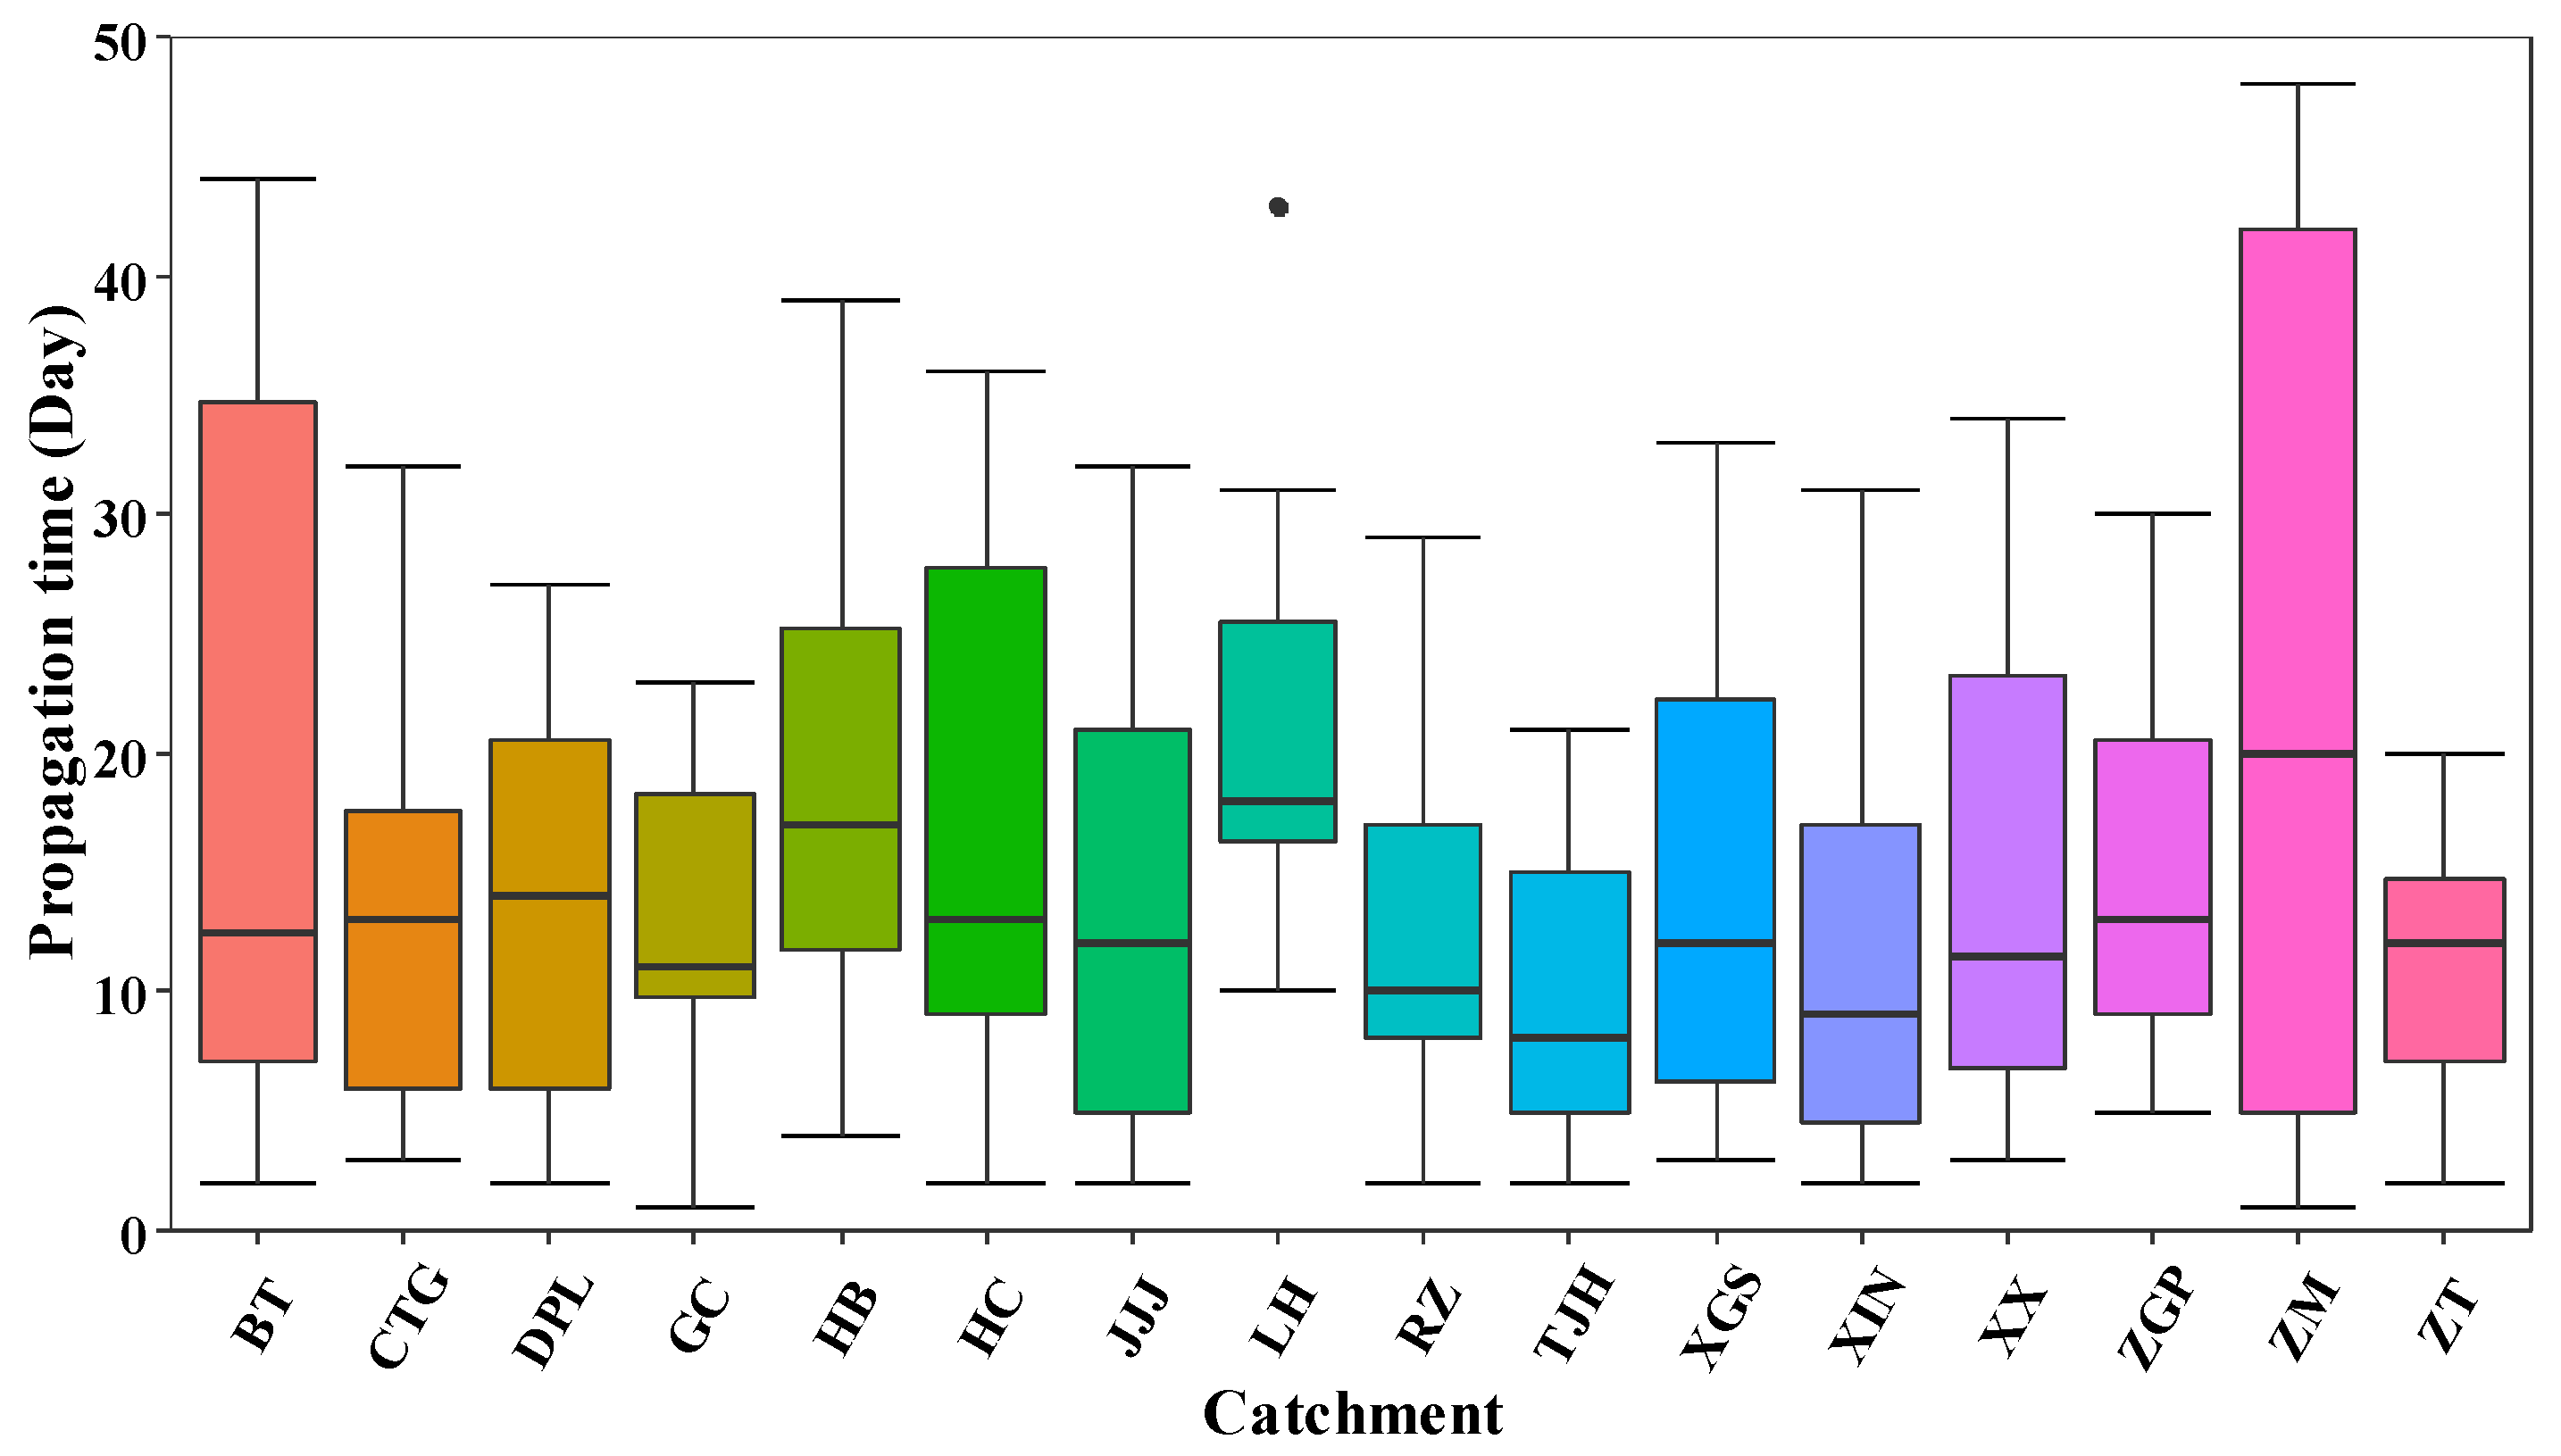
The propagation time (TP) from meteorological to hydrological drought is shown in Figure 9. The TP ranges from 1 to 47 days in study catchments. It is obvious that there is a lag of onset time from meteorological to hydrological drought. ZT and TJH with a smaller area, mountainous terrain, and near-natural conditions have relatively short TP of 1–21 days. A shorter TP indicates that there will be less time to take measures to resist hydrological drought once the meteorological drought occurs. The maximum TP is 47 days in ZM. BT and LH also have a relatively high propagation time longer than 40 days. It is also observed that the catchments with low occurrence probability of Type-1 propagation (PH|M) and high occurrence probability of Type-3 (PH|NM), such as LH, BT, and ZM, have a long TP compared with Figure 7.
4.3. Impacts of Climate and Catchment Properties on Drought Propagation
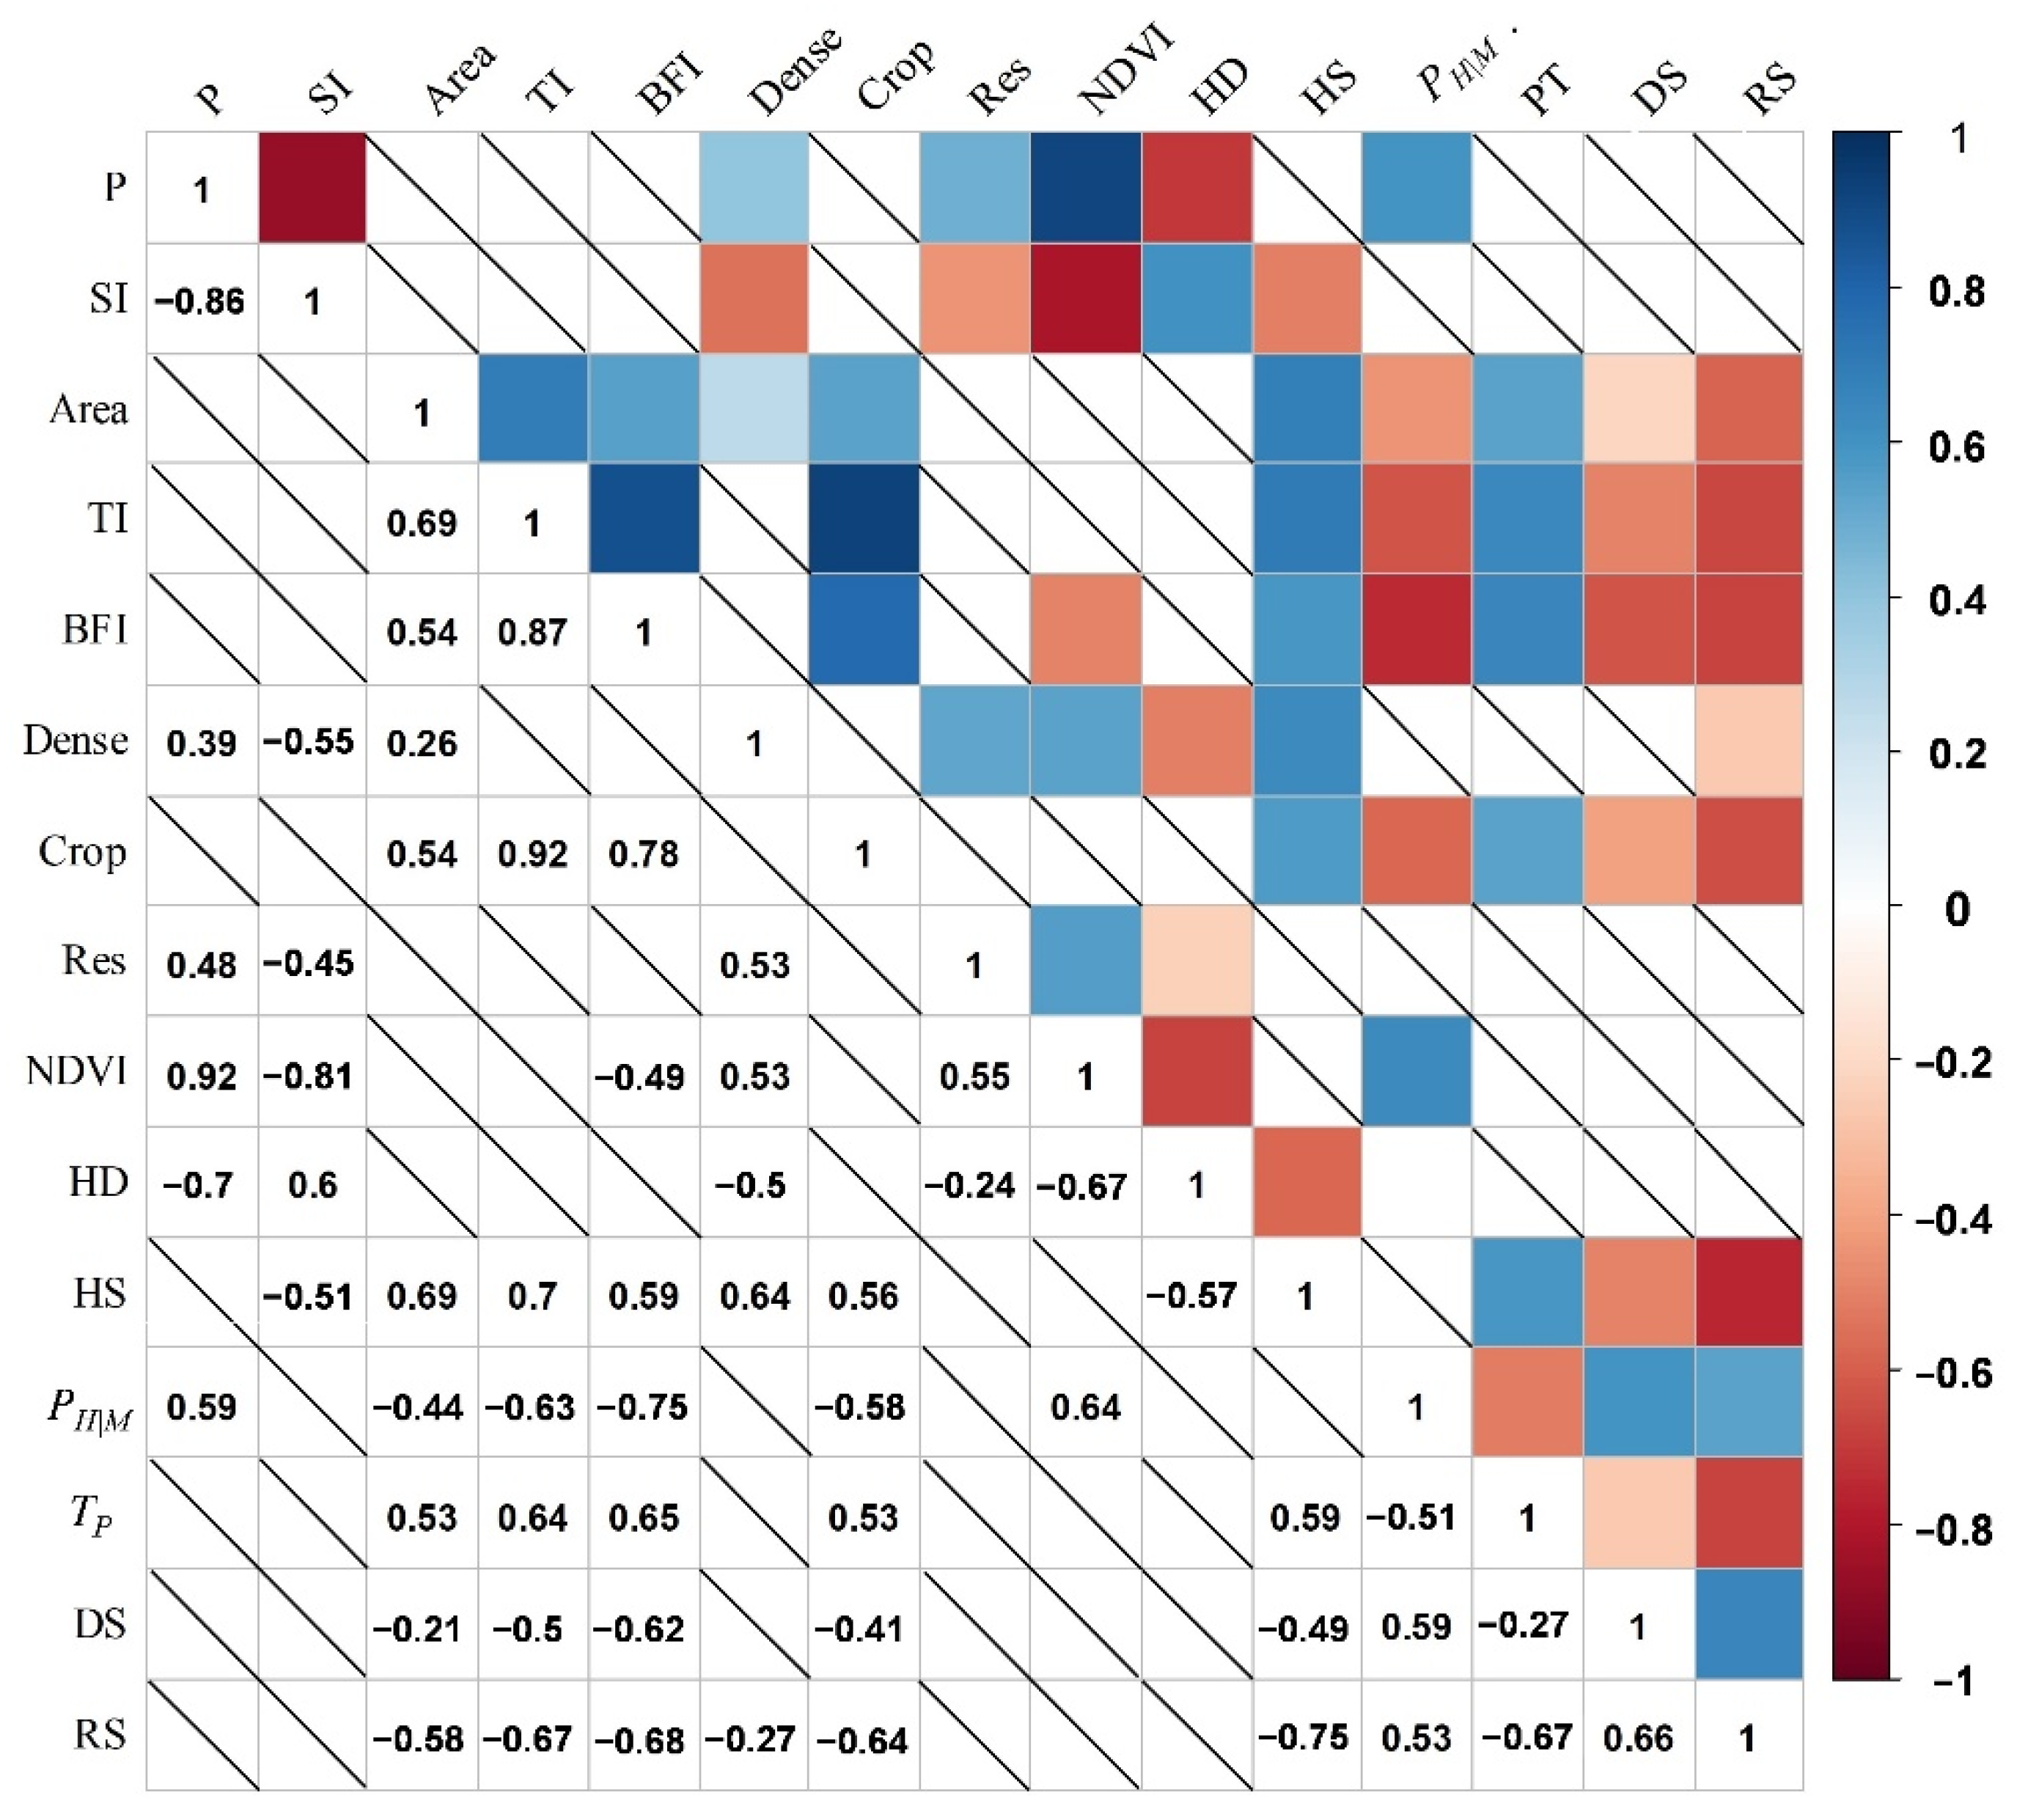
The relationship of hydrological drought and propagation features with climate, catchment properties, and human activities is investigated by Pearson and partial correlation analysis. The factors with significant influence on hydrological drought characteristics are shown in Figure 10. The average annual precipitation is found to be the highest correlation with hydrological drought duration (HD), which has a negative coefficient of −0.70. The relationship between precipitation and HD can be explained by the fact that droughts in catchments with larger average annual precipitation are prone to be relieved by precipitation during the dry spell since the main recharge of runoff is precipitation, which make drought events easily eliminated. The seasonality index (SI) shows a significant positive correlation with HD indicating that duration lengthens with higher seasonality of precipitation. The topographic index (TI) as well as the area and drainage density are found to be the highest correlation with hydrological drought severity (HS) and the Pearson coefficient is 0.70, 0.68, and 0.64, respectively. The TI from TOPMODEL can be mapped in a catchment area as a function of the topography and then gives an indication of where a saturated contributing area might occur, and then how it might spread as a function of storage [33]. The high TI indicates high storage and is easier to be saturated in a catchment that may have less deficit during a drought spell. Factors indicating climate conditions are not significantly correlated with HS.
The base flow index (BFI), TI, area, and NDVI representing catchment properties show the most significant relationship with drought propagation characteristics and they have contrasting influences on propagation time (TP) and occurrence probability of Type-1 propagation (PH|M). The BFI and TI show a positive relationship with TP with a Pearson coefficient of 0.65 and 0.64. The catchment storage related to soil buffering and aquifer recharge-discharge processes can modulate climate variability signals propagating along a terrestrial hydrological system, determining that the time of streamflow responds to precipitation anomalies [35]. PH|M is negatively related to BFI and TI with a coefficient of −0.75 and ‒0.63. Catchments with high BFI or TI usually have high resistance to meteorological drought and decrease the probability of triggering hydrological drought. DS and RS characterizing the hydrological internal process show a significantly negative relationship with BFI and TI (r < −0.6) and a weak relationship with climate factors.
The effect of one variable on the other variables is non-negligible since some influencing factors are interconnected. For example, there is a strong relationship between NDVI and the average annual precipitation (r = 0.92) and they both have a significantly negative effect on HD. The contribution of precipitation and NDVI to HD cannot be separated and quantified. Consequently, there is a need to consider the interaction among different catchment properties and their relative contribution to hydrological drought and drought propagation characteristics. Here, the partial correlation analysis is applied to further investigate the linear correlation between hydrological drought characteristics and influencing factors by controlling the interaction of influencing factors. The factors with a significant influence on hydrological drought characteristics are selected as variables and the results are listed in Table 3. It can be seen that precipitation plays an important role in controlling hydrological drought characteristics (duration and severity) in the studied catchments and the effect is opposite. The deficits in precipitation lead to meteorological drought and eventually to hydrological drought. The other factors indicating catchment properties show a weak correlation with hydrological drought characteristics. In addition, the relationship between propagation characteristics and all the factors is not significant.
4.4. Impacts of Reservoir on Hydrological Drought and Drought Propagation
The ratio of reservoir capacity (Res) is applied to reflect the impact of reservoir operation on hydrological drought but the correlation is weak (Figure 10). The possible reason may be that the function and regulation seasonality of reservoirs are omitted and the impact of reservoir regulation can be offset in different periods. We further analyze the impact of reservoir on hydrological drought and drought propagation using the paired-catchment framework proposed by Van Loon et al. [36]. Based on the framework, TJH (benchmark catchment) and XIN (reservoir-regulated catchment) are selected as paired-catchment. XIN is paired with TJH due to their similarity in climate conditions, catchment properties, and land cover (Table 4). The difference of precipitation and evapotranspiration in two catchments is less than 10%. The BFI and TI representing catchment properties in two catchments is similar, both catchments have no urban extent and very low percentage of cropland. There is a medium-sized reservoir in XIN with a total of 84 million m3 storage capacity but there is no reservoir in TJH. In this way, the impact of reservoir on hydrological drought and drought propagation is isolated and the difference of hydrological drought characteristics can be attributed to reservoir regulation.
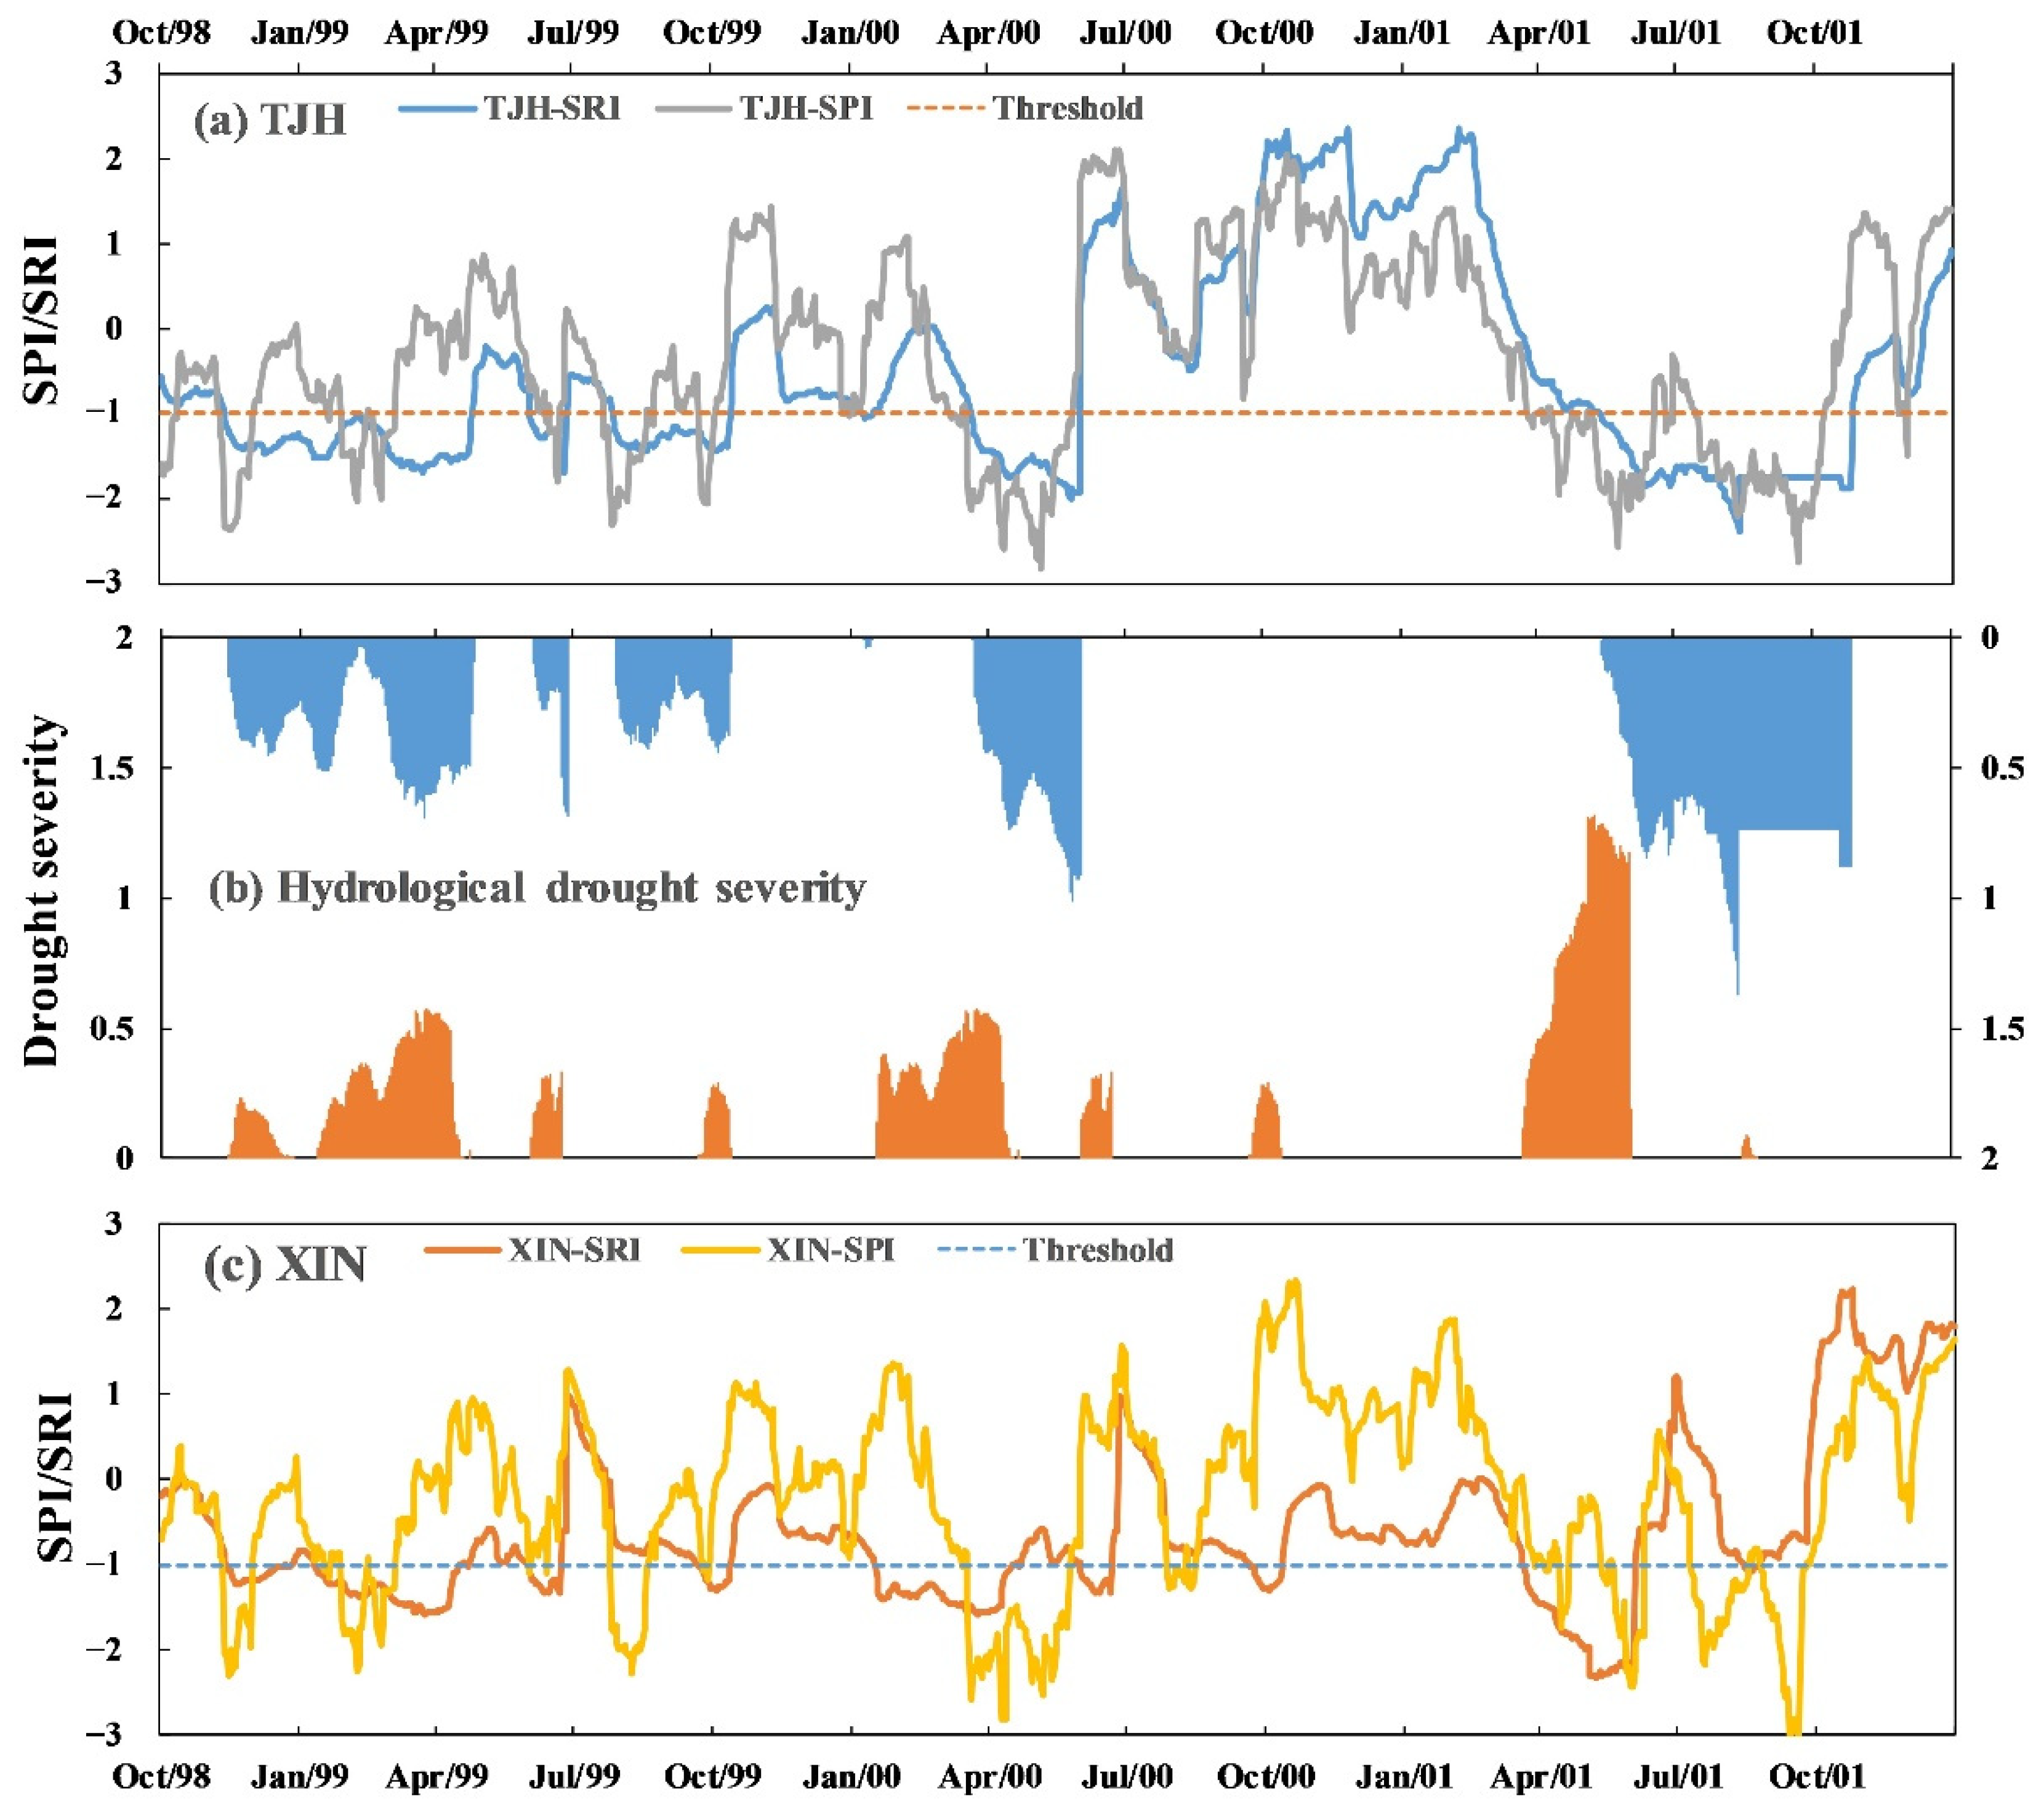
Hydrological drought and drought propagation characteristics of paired-catchment are listed in Table 5. Compared with TJH, the average and maximum severity of hydrological drought in XIN is alleviated due to the impact of reservoir (−10.7 and −7.9%) but the duration is not obviously shortened. Figure 11 shows the comparison of extreme drought process in paired-catchment during 1999–2001. Flow observation in dry season is difficult so there is a flattened section in the SRI process. It can be seen that during April-October in 2001, similar meteorological drought events led to hydrological drought events with significant differences in two catchments. The duration and severity in XIN (74 days and −137, respectively) are considerably lower than that in TJH (168 days and −284, respectively) even with a drier antecedent streamflow condition in XIN, which indicates that the reservoir has an impact of alleviating severe drought. Moreover, some mild hydrological drought events with a short duration such as drought event in September to October in 2000 occurred in XIN but were not seen in TJH due to the reservoir impoundment at the end of flood season (from July to September). The impoundment of reservoir may reduce the streamflow downstream and lead to hydrological drought combined with dry climate conditions. In addition, this effect of reservoir may result in the little difference of average drought duration between reservoir-regulated catchment and no-reservoir catchment. The propagation time (TP) and occurrence probability of Type-1 propagation (PH|M) in two catchments is very close. However, there is a considerable increase in occurrence probability of Type-3 (PH|NM) of XIN compared with TJH, which means that the percentage of a hydrological drought occurring without the occurrence of a proceeding meteorological drought event in XIN is lower than that in TJH. This indicates the role of the reservoir in increasing the occurrence of Type-3 propagation.
5. Discussion
5.1. How to Quantify Propagation Time from Meteorological to Hydrological Drought?
The propagation time from meteorological to hydrological drought implies the time of streamflow deficits propagated from precipitation deficits through the hydrological cycle [10,11]. It is mainly estimated through three kinds of methods, i.e., Pearson correlation-based approach, Wavelet analysis, and time differences between onsets [23] or peaks [10] of matched meteorological and hydrological drought events. The drought propagation time using the Pearson correlation coefficient is determined by the SPI accumulation period with the strongest Pearson correlation coefficient with SSI/SRI [9,12,37,38]. Based on this method, Baker et al. [12] found that the SSI is strongly correlated with SPI over accumulation periods of 1 to 19 months in the UK and considered that the propagation time of meteorological to hydrological drought was 1–19 months. Ding et al. [37] found that the propagation time was considered among 1–12 months between meteorological and hydrological drought in China. Gevaert et al. [38] investigated the correlation at a global scale and found that runoff droughts were related to precipitation deficits over 1–36 months and even up to several years in some dry regions. The Wavelet analysis is mostly used to reflect the correlation of drought indices series between two drought types at multiple periodic scales [20,21]. Li et al. [20] applied the Wavelet cross-correlation (WCC) for detailed cross correlation on different periodic scales and found that the corresponding lag time varied within 0–24 months among different periods in the upper Shaying River Basin.
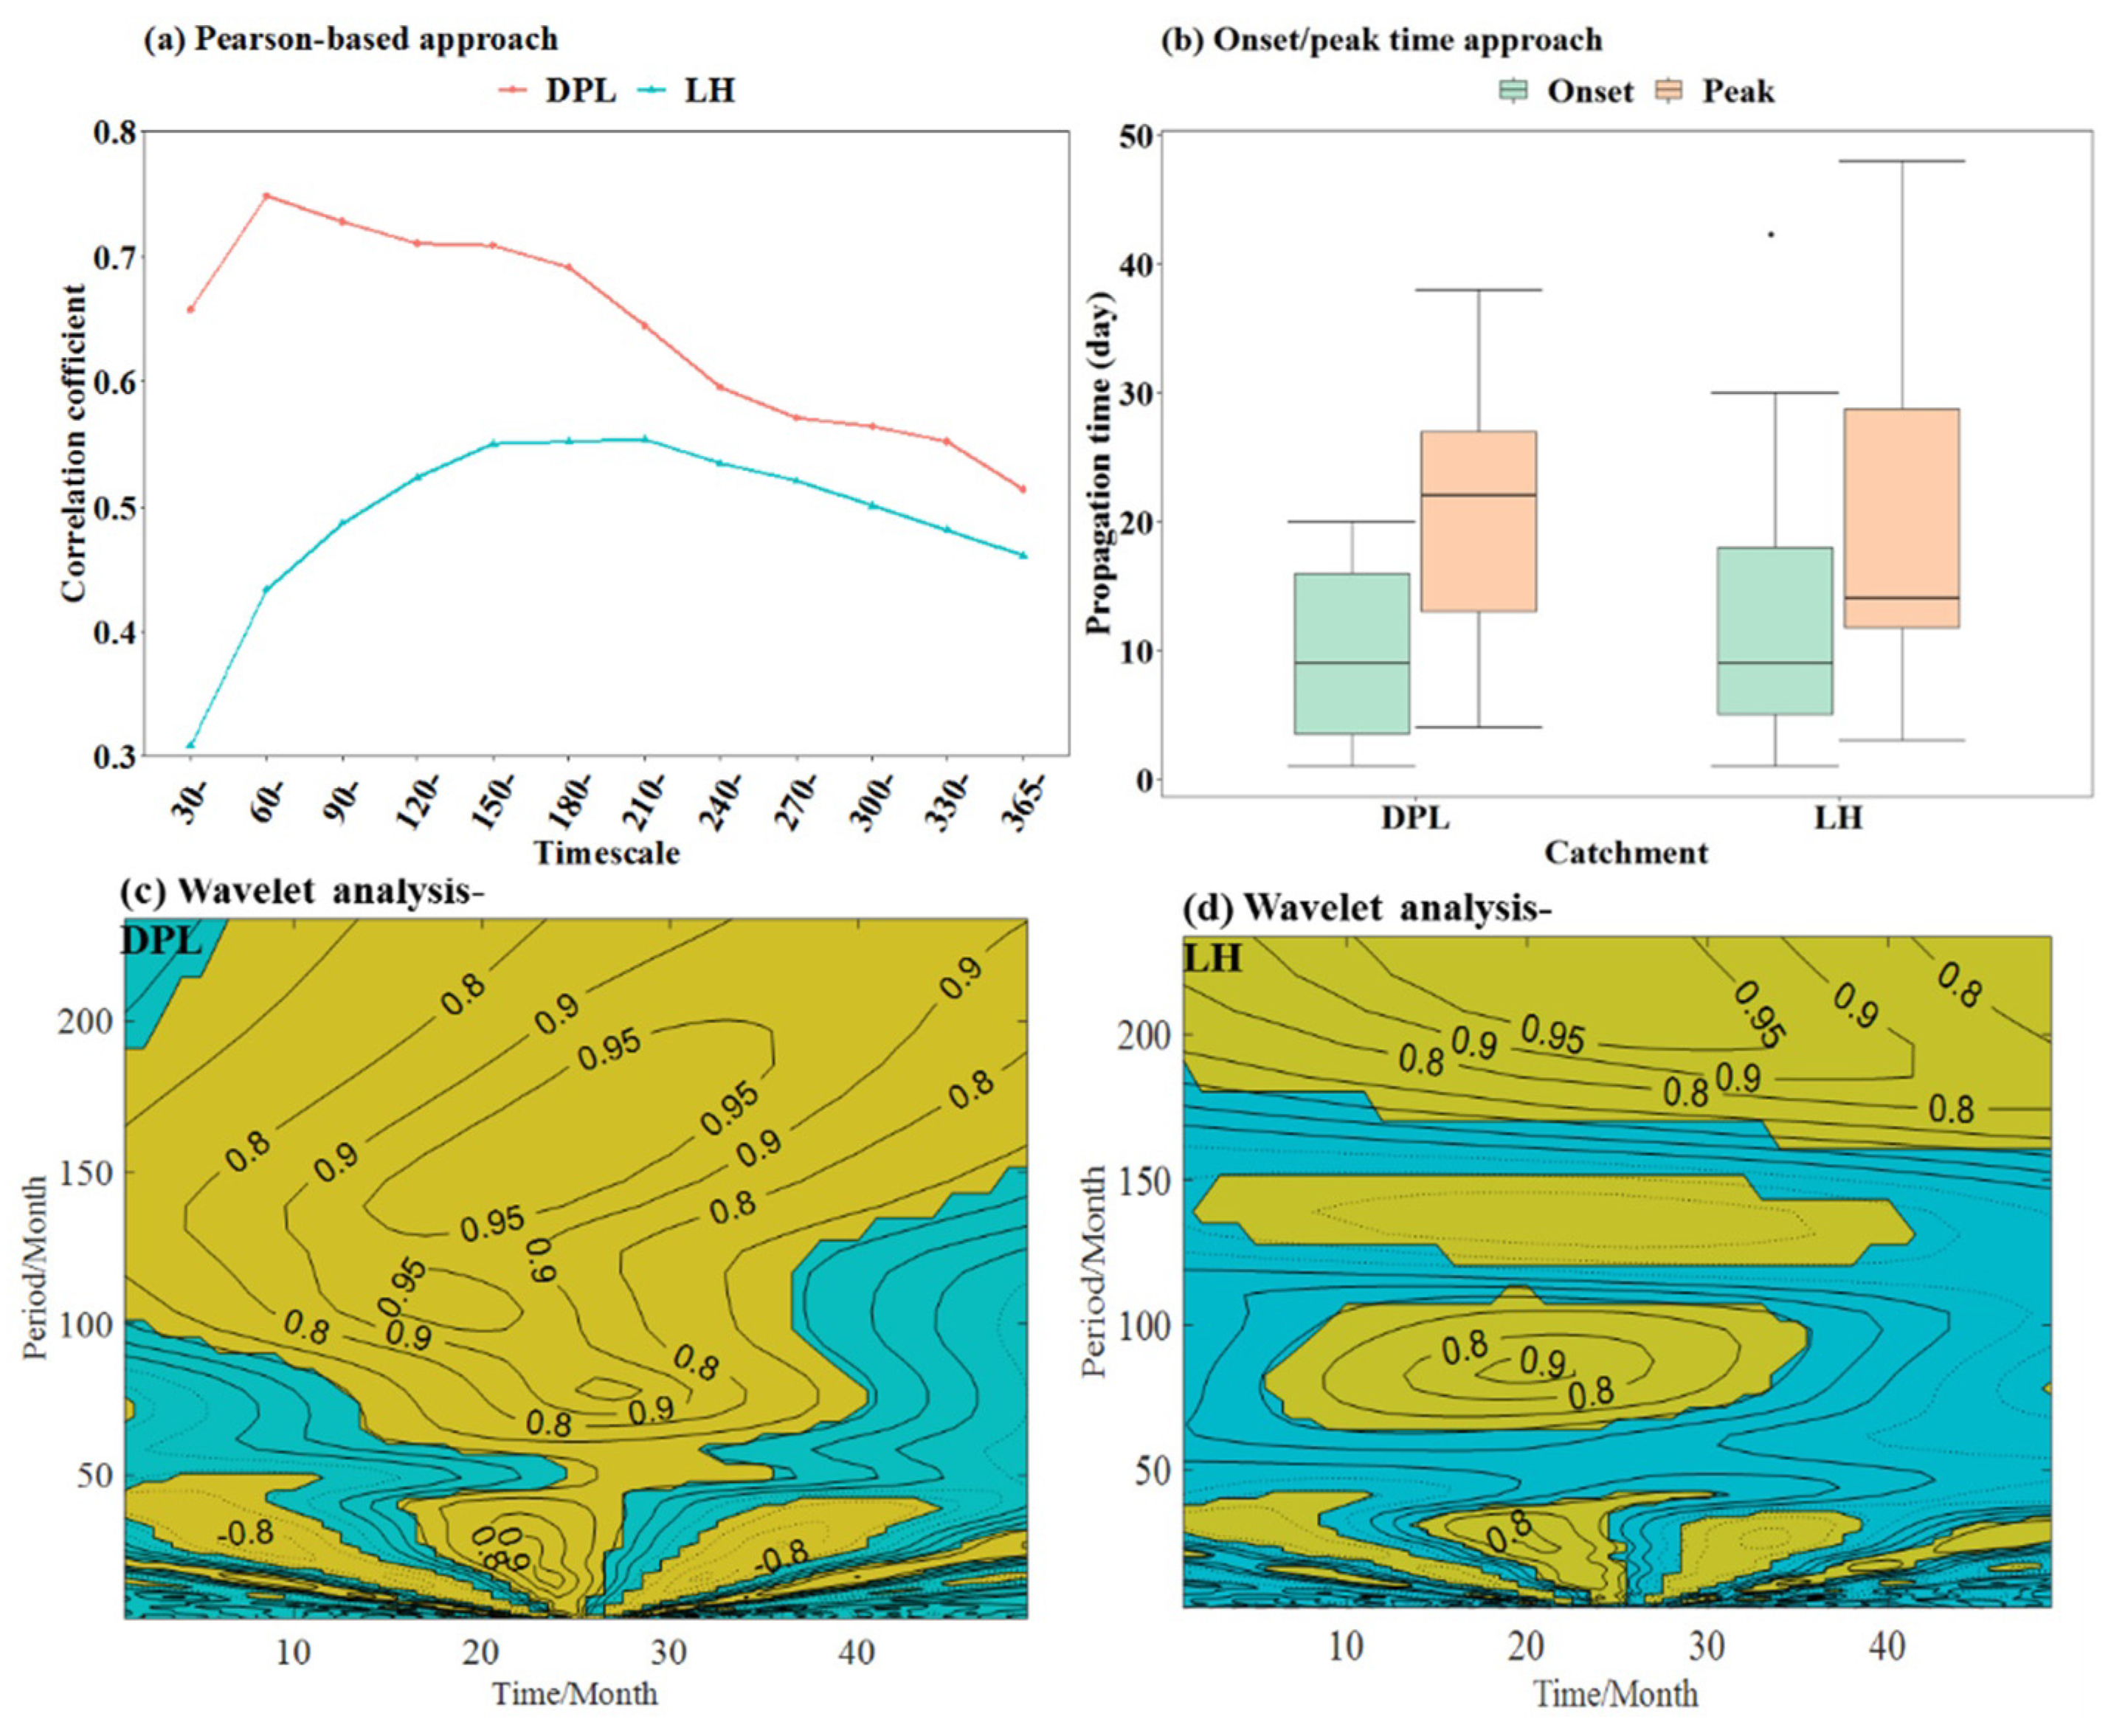
We compared the propagation time calculated by these methods at DPL and LH catchment, and the results exhibits large differences in propagation time calculated by three methods (Figure 12). Figure 12a shows that the propagation time by Pearson correlation is 60 and 210 days (i.e., 2 and 7 months) for DPL and LH catchment, and the correlation in LH with intense human activities is not strong (r = 0.55). From Figure 12b, the propagation time by the onset and peak time difference of matched meteorological and hydrological drought events is 1–42 days and 3–48 days, respectively. Figure 12c shows that the higher coefficients occur in 100- to 120-month cycles with a corresponding time of 15–23 months in DPL, and Figure 12d shows that the 80- to 90- month period with a corresponding time of 17–23 months in LH is based on the Wavelet cross-correlation (WCC). Bhardwaj et al. [10] pointed out that the correlation-based approach for identification of drought propagation is not appropriate for the Indian domain due to the high seasonality in precipitation. Estimates of propagation time based on the correlation of drought indices can be influenced by not only the drought spell but also the wet extremes. The former is slower compared to the latter. In addition, the reservoir operation or seasonal irrigation activities can also affect the statistical relationship between drought indices [13]. Therefore, the propagation time based on statistical correlation cannot reflect the true links between meteorological and hydrological drought in practice. The time difference between meteorological and hydrological drought events is recommended to quantify the propagation time when analyzing the propagation processes. Furthermore, in-depth understanding of the causes of large differences in propagation time obtained by these different methods needs further investigation and would be helpful for drought monitoring.
5.2. Which One Performs Better in Representing the Effect of Catchment Properties on Drought Propagation, Base Flow Index or Topographic Index?
Catchment properties related to the water storage in the catchment show a significant relationship with drought propagation. Catchments with a low storage capacity respond quickly to deficits in the atmospheric process. The base flow index (BFI) is a good indicator of the geological characteristics of a catchment which controls the storage capacity and response time of a catchment [39]. Many related studies found a positive effect of BFI on hydrological drought and propagation characteristics [7,10,12]. Our results also show that BFI is positively related to hydrological drought severity and propagation time. At the same time, we found that the topographic index (TI) also shows a significant relationship with hydrological drought severity and propagation features. The TI has a significantly strong relationship with BFI (r = 0.87), and their influence on hydrological drought characteristics is consistent. To calculate BFI, the crucial step is to separate streamflow hydrographs into quick flow and base flow. Base flow separation methods are often impractical, require expensive materials (observation wells or chemical tracer sampling), and time-consuming methods, and/or are not designed for individual events in small watersheds [40]. Moreover, the BFI is unstable due to the limitation of observation quality especially in the dry season. In contrast, the TI calculated by DEM is easy and can provide spatial information as a function of geology. Therefore, TI is more recommended as an indicator of catchment properties and its effect on hydrological drought needs further investigation.
5.3. How Does Irrigation Affect Hydrological Drought?
Irrigation activities influence hydrological drought mainly by streamflow and groundwater consumption, which usually lead to a decrease in streamflow and groundwater level. The high percentage of crop land in a catchment may increase the amount of evapotranspiration and reduce the water yield capacity thus intensifying hydrological drought. Wada et al. [16] quantified the impact of human water consumption on the intensity and frequency of hydrological drought over the period 1960–2010 worldwide and found that human water consumption subsequently intensified the magnitude of hydrological droughts by 10–500%. Yang et al. [41] illustrated that human water use for irrigation reduced the dry season streamflow and thus exacerbates the hydrological drought in Yellow River. Similar results can be found in other studies [14,42]. Meanwhile, irrigation may also increase the soil water contents and form runoff by return flows, in which the irrigation return flow to the groundwater is large in intensively irrigated basins and return flows cause a redistribution of unconsumed water over the water resources [43,44]. As a result, irrigation may alleviate hydrological drought at a short time scale [13].
Our results in Figure 10 show that the ratio of crop land is positively correlated with hydrological drought severity (HS, which is a negative value). Since the lower the HS, the more severe a hydrological drought is, it seems that the high percentage of crop land weakens hydrological drought in terms of their correlation. Since TI is strongly related to the percentage of crop land (r = 0.92) and HS (r = 0.70), we further investigate the partial relationship between crop land and hydrological drought severity by controlling the relevant variables (TI). The results show that the partial correlation coefficient is −0.36, which means that the positive relation between the ratio of crop land and drought severity HS is caused by the strong positive correlation between TI and the percentage of crop land, and the effect of crop land on hydrological drought is hidden by catchment properties (e.g., TI) related to storage. In other words, the impact of crop land on hydrological drought is far less than that of TI. From this point of view, the impact of irrigation on hydrological drought is less than that of catchment properties. Due to the interconnection between climate, catchment properties, and human activities, the simple linear relationship is not suitable to reflect the effect of climate, catchment properties, and human activities on drought propagation.
6. Conclusions
Understanding the linkages between meteorological and hydrological drought quantitatively and its potential influencing factors will provide a strong basis for monitoring and forecasting hydrological drought. The propagation from meteorological to hydrological drought can be categorized into three types, that is, Type-1 propagation which refers to the case that one or several meteorological droughts trigger a hydrological drought, Type-2 propagation which illustrates that a meteorological drought occurs but no hydrological drought occurs, and Type-3 propagation referring to the case when a hydrological drought occurs without the occurrence of a proceeding meteorological drought. Those propagation relationships and their influencing factors can be explored with a framework consisting of three main steps, i.e., (i) to identify drought events and estimate meteorological/hydrological drought characteristics (duration, severity, and speed) in terms of SPI/ SRI at a specific time scale (e.g., 30-day); (ii) to quantify the propagation relationship based on the conditional probability analysis and propagation indices (including propagation time and propagation ratios of drought characteristics); and (iii) to investigate the impacts of selected climate properties, catchment properties, and human activities on drought propagation based on the correlation analysis.
The framework is applied to daily precipitation and discharge data of 16 sub-catchments in the Huaihe River Basin. It is found that:
- (1)
- The occurrence probability of Type-1 propagation varies from 0.25 to 0.48 among all catchments. The propagation time ranges from 1 to 47 days in study catchments. Catchments with low occurrence probability of Type-1 propagation is found in LH, BT, and ZM, which also have a longer propagation time. Features of Type-1 propagation include the lengthening of duration, amplification of severity, lag of onset time, and reduction of speed.
- (2)
- Climate factors have a significant effect on hydrological drought duration, while the topographic index (TI) from TOPMODEL representing catchment properties significantly correlates with hydrological drought severity. The base flow index (BFI) and TI indicating catchment storage show the strongest relationship with propagation time, probability, and development/recovery speed. Partial correlation analyses show that the impact of crop land on hydrological drought is far less than that of TI, indicating that the impact of irrigation on hydrological drought is less than that of catchment properties.
- (3)
- Reservoir operation has a significant effect on alleviating the duration and severity of extreme hydrological drought. However, it also increases the occurrence of Type-3 propagation due to the impoundment of reservoir upstream at the end of flood season. The off-set of two sides of effect on hydrological drought may be the reason that the average hydrological drought characteristics of paired-catchment is very close.
Author Contributions
Conceptualization, W.W. and J.W.; data curation, H.W.; methodology, W.W., J.W., and H.C.; writing—original draft, J.W.; writing—review and editing, W.W., H.C., H.W., and Y.Z. All authors have read and agreed to the published version of the manuscript.
Funding
This research was funded by the National Natural Science Foundation of China (grant number 41971042; 41901037; and 41830752).
Institutional Review Board Statement
Not applicable.
Informed Consent Statement
Not applicable.
Data Availability Statement
Data sharing not applicable.
Acknowledgments
The financial support from the National Natural Science Foundation of China (nos. 41971042; 41901037; and 41830752) is gratefully acknowledged.
Conflicts of Interest
The authors declare no conflict of interest.
References
- Wilhite, D.A.; Glantz, M.H. Understanding: The drought phenomenon: The role of definitions. Water Int. 1985, 10, 111–120. [Google Scholar] [CrossRef] [Green Version]
- Wang, W.; Ertsen, M.W.; Svoboda, M.D.; Hafeez, M. Propagation of Drought: From Meteorological Drought to Agricultural and Hydrological Drought. Adv. Meteorol. 2016, 2016, 6547209. [Google Scholar] [CrossRef]
- Van Loon, A.F. Hydrological drought explained. WIREs Water 2015, 2, 359–392. [Google Scholar] [CrossRef]
- Liu, Y.; Zhu, Y.; Ren, L.; Singh, V.P.; Yong, B.; Jiang, S.; Yuan, F.; Yang, X. Understanding the Spatiotemporal Links Between Meteorological and Hydrological Droughts From a Three-Dimensional Perspective. J. Geophys. Res. Atmos. 2019, 124, 3090–3109. [Google Scholar] [CrossRef]
- Yang, Y.; McVicar, T.R.; Donohue, R.J.; Zhang, Y.; Roderick, M.L.; Chiew, F.H.S.; Zhang, L.; Zhang, J. Lags in hydrologic recovery following an extreme drought: Assessing the roles of climate and catchment characteristics. Water Resour. Res. 2017, 53, 4821–4837. [Google Scholar] [CrossRef]
- Van Loon, A.; Laaha, G. Hydrological drought severity explained by climate and catchment characteristics. J. Hydrol. 2014, 526, 3–14. [Google Scholar] [CrossRef] [Green Version]
- Valiya Veettil, A.; Mishra, A.K. Multiscale hydrological drought analysis: Role of climate, catchment and morphological variables and associated thresholds. J. Hydrol. 2020, 582, 124533. [Google Scholar] [CrossRef]
- Konapala, G.; Mishra, A. Quantifying Climate and Catchment Control on Hydrological Drought in the Continental United States. Water Resour. Res. 2020, 56, e2018WR024620. [Google Scholar] [CrossRef]
- Huang, S.; Li, P.; Huang, Q.; Leng, G.; Hou, B.; Ma, L. The propagation from meteorological to hydrological drought and its potential influence factors. J. Hydrol. 2017, 547. [Google Scholar] [CrossRef]
- Bhardwaj, K.; Shah, D.; Aadhar, S.; Mishra, V. Propagation of Meteorological to Hydrological Droughts in India. J. Geophys. Res. Atmos. 2020, 125, e2020JD033455. [Google Scholar] [CrossRef]
- Apurv, T.; Sivapalan, M.; Cai, X. Understanding the Role of Climate Characteristics in Drought Propagation. Water Resour. Res. 2017, 53, 9304–9329. [Google Scholar] [CrossRef] [Green Version]
- Barker, L.; Hannaford, J.; Chiverton, A.; Svensson, C. From meteorological to hydrological drought using standardised indicators. Hydrol. Earth Syst. Sci. 2016, 20, 2483–2505. [Google Scholar] [CrossRef] [Green Version]
- Xu, Y.; Zhang, X.; Wang, X.; Hao, Z.; Singh, V.P.; Hao, F. Propagation from meteorological drought to hydrological drought under the impact of human activities: A case study in northern China. J. Hydrol. 2019, 579, 124147. [Google Scholar] [CrossRef]
- Ma, F.; Luo, L.; Ye, A.; Duan, Q. Drought Characteristics and Propagation in the Semiarid Heihe River Basin in Northwestern China. J. Hydrometeorol. 2018, 20, 59–77. [Google Scholar] [CrossRef]
- Zhang, R.; Chen, X.; Zhang, Z.; Shi, P. Evolution of hydrological drought under the regulation of two reservoirs in the headwater basin of the Huaihe River, China. Stoch. Environ. Res. Risk Assess. 2015, 29, 487–499. [Google Scholar] [CrossRef]
- Wada, Y.; van Beek, L.P.H.; Wanders, N.; Bierkens, M.F.P. Human water consumption intensifies hydrological drought worldwide. Environ. Res. Lett. 2013, 8, 34036. [Google Scholar] [CrossRef] [Green Version]
- Yu, M.; Liu, X.; Li, Q. Responses of meteorological drought-hydrological drought propagation to watershed scales in the upper Huaihe River basin, China. Environ. Sci. Pollut. Res. 2020, 27, 17561–17570. [Google Scholar] [CrossRef]
- Zhu, Y.; Liu, Y.; Wang, W.; Singh, V.; Ma, X.; Yu, Z. Three dimensional characterization of meteorological and hydrological droughts and their probabilistic links. J. Hydrol. 2019, 578, 124016. [Google Scholar] [CrossRef]
- Fleig, A.K.; Tallaksen, L.M.; Hisdal, H.; Hannah, D.M. Regional hydrological drought in north-western Europe: Linking a new Regional Drought Area Index with weather types. Hydrol. Process. 2011, 25, 1163–1179. [Google Scholar] [CrossRef]
- Li, Q.; He, P.; He, Y.; Han, X.; Zeng, T.; Lu, G.; Wang, H. Investigation to the relation between meteorological drought and hydrological drought in the upper Shaying River Basin using wavelet analysis. Atmos. Res. 2020, 234, 104743. [Google Scholar] [CrossRef]
- Zhou, J.; Li, Q.; Wang, L.; Lei, L.; Huang, M.; Xiang, J.; Feng, W.; Zhao, Y.; Xue, D.; Liu, C.; et al. Impact of Climate Change and Land-Use on the Propagation from Meteorological Drought to Hydrological Drought in the Eastern Qilian Mountains. Water 2019, 11, 1602. [Google Scholar] [CrossRef] [Green Version]
- Wong, G.; van Lanen, H.A.J.; Torfs, P.J.J.F. Probabilistic analysis of hydrological drought characteristics using meteorological drought. Hydrol. Sci. J. 2013, 58, 253–270. [Google Scholar] [CrossRef] [Green Version]
- Sattar, M.N.; Lee, J.-Y.; Shin, J.-Y.; Kim, T.-W. Probabilistic Characteristics of Drought Propagation from Meteorological to Hydrological Drought in South Korea. Water Resour. Manag. 2019, 33, 2439–2452. [Google Scholar] [CrossRef]
- Guo, Y.; Huang, S.; Huang, Q.; Leng, G.; Fang, W.; Wang, L.; Wang, H. Propagation thresholds of meteorological drought for triggering hydrological drought at various levels. Sci. Total Environ. 2020, 712, 136502. [Google Scholar] [CrossRef]
- McKee, T.B.; Nolan, J.; Kleist, J. The relationship of drought frequency and duration to time scales. Prepr. Eighth Conf. Appl. Climatol. Amer. Meteor Soc. 1993, 17, 179–183. [Google Scholar]
- Shukla, S.; Wood, A. Use of a standardized runoff index for characterizing hydrologic drought. Geophys. Res. Lett. 2008, 35. [Google Scholar] [CrossRef] [Green Version]
- Svoboda, M.; Hayes, M.; Wood, D. Standardized Precipitation Index User Guide; World Meteorological Organization: Geneva, Switzerland, 2012. [Google Scholar]
- Fleig, A.K.; Tallaksen, L.M.; Hisdal, H.; Demuth, S. A global evaluation of streamflow drought characteristics. Hydrol. Earth Syst. Sci. 2006, 10, 535–552. [Google Scholar] [CrossRef] [Green Version]
- Wu, J.; Chen, X.; Yao, H.; Liu, Z.; Zhang, D. Hydrological Drought Instantaneous Propagation Speed Based on the Variable Motion Relationship of Speed-Time Process. Water Resour. Res. 2018, 54, 9549–9565. [Google Scholar] [CrossRef]
- Li, J.; Guo, Y.; Wang, Y.; Lu, S.; Chen, X. Drought Propagation Patterns under Naturalized Condition Using Daily Hydrometeorological Data. Adv. Meteorol. 2018, 2018, 2469156. [Google Scholar] [CrossRef]
- Khedun, C.P.; Mishra, A.K.; Singh, V.P.; Giardino, J.R. A copula-based precipitation forecasting model: Investigating the interdecadal modulation of ENSO’s impacts on monthly precipitation. Water Resour. Res. 2014, 50, 580–600. [Google Scholar] [CrossRef] [Green Version]
- Liu, Y.; Hwang, Y. Improving drought predictability in Arkansas using the ensemble PDSI forecast technique. Stoch. Environ. Res. Risk Assess. 2015, 29, 79–91. [Google Scholar] [CrossRef]
- Beven, K.J.; Kirkby, M.J.; Freer, J.E.; Lamb, R. A history of TOPMODEL. Hydrol. Earth Syst. Sci. 2021, 25, 527–549. [Google Scholar] [CrossRef]
- Arnold, J.G.; Allen, P.M.; Muttiah, R.; Bernhardt, G. Automated Base Flow Separation and Recession Analysis Techniques. Groundwater 1995, 33, 1010–1018. [Google Scholar] [CrossRef]
- Fang, W.; Huang, S.; Huang, Q.; Huang, G.; Wang, H.; Leng, G.; Wang, L. Identifying drought propagation by simultaneously considering linear and nonlinear dependence in the Wei River basin of the Loess Plateau, China. J. Hydrol. 2020, 591, 125287. [Google Scholar] [CrossRef]
- Van Loon, A.F.; Rangecroft, S.; Coxon, G.; Breña Naranjo, J.A.; Van Ogtrop, F.; Van Lanen, H.A.J. Using paired catchments to quantify the human influence on hydrological droughts. Hydrol. Earth Syst. Sci. 2019, 23, 1725–1739. [Google Scholar] [CrossRef] [Green Version]
- Ding, Y.; Xu, J.; Wang, X.; Cai, H.; Zhou, Z.; Sun, Y.; Shi, H. Propagation of meteorological to hydrological drought for different climate regions in China. J. Environ. Manag. 2021, 283, 111980. [Google Scholar] [CrossRef]
- Gevaert, A.I.; Veldkamp, T.I.E.; Ward, P.J. The effect of climate type on timescales of drought propagation in an ensemble of global hydrological models. Hydrol. Earth Syst. Sci. 2018, 22, 4649–4665. [Google Scholar] [CrossRef] [Green Version]
- Bloomfield, J.P.; Allen, D.J.; Griffiths, K.J. Examining geological controls on baseflow index (BFI) using regression analysis: An illustration from the Thames Basin, UK. J. Hydrol. 2009, 373, 164–176. [Google Scholar] [CrossRef] [Green Version]
- Koskelo, A.I.; Fisher, T.R.; Utz, R.M.; Jordan, T.E. A new precipitation-based method of baseflow separation and event identification for small watersheds (<50 km2). J. Hydrol. 2012, 450–451, 267–278. [Google Scholar] [CrossRef]
- Yang, X.; Zhang, M.; He, X.; Ren, L.; Pan, M.; Yu, X.; Wei, Z.; Sheffield, J. Contrasting Influences of Human Activities on Hydrological Drought Regimes Over China Based on High-Resolution Simulations. Water Resour. Res. 2020, 56, e2019WR025843. [Google Scholar] [CrossRef]
- Wan, W.; Zhao, J.; Li, H.-Y.; Mishra, A.; Ruby Leung, L.; Hejazi, M.; Wang, W.; Lu, H.; Deng, Z.; Demissisie, Y.; et al. Hydrological Drought in the Anthropocene: Impacts of Local Water Extraction and Reservoir Regulation in the U.S. J. Geophys. Res. Atmos. 2017, 122, 313–328. [Google Scholar] [CrossRef]
- De Graaf, I.E.M.; Van Beek, L.P.H.; Wada, Y.; Bierkens, M.F.P. Advances in Water Resources Dynamic attribution of global water demand to surface water and groundwater resources: Effects of abstractions and return flows on river discharges. Adv. Water Resour. 2014, 64, 21–33. [Google Scholar] [CrossRef]
- Ebrahimi, H.; Ghazavi, R.; Karimi, H. Estimation of Groundwater Recharge from the Rainfall and Irrigation in an Arid Environment Using Inverse Modeling Approach and RS. Water Resour. Manag. 2016, 30, 1939–1951. [Google Scholar] [CrossRef]
Figure 1.
Location of the catchments and hydrological stations (a) and land cover types in the Huaihe River Basin in 2010 (b).
Figure 1.
Location of the catchments and hydrological stations (a) and land cover types in the Huaihe River Basin in 2010 (b).

Figure 2.
Pooling and excluding procedure in drought identification. (Note: tc and Dmin are the predefined criteria to pool adjacent droughts and exclude minor droughts, respectively).
Figure 2.
Pooling and excluding procedure in drought identification. (Note: tc and Dmin are the predefined criteria to pool adjacent droughts and exclude minor droughts, respectively).

Figure 3.
A conceptualization of drought development and recovery in terms of SPI and SRI. (Note: DVDP and DVRP are the deficit volumes of rainfall/streamflow in terms of the 5-day moving average drought index in the development and recovery period, respectively. Additionally, to, tp, and te are the onset, peak, and end time of a drought event).

Figure 4.
Drought duration and severity at 30-, 90-, 180-, and 365-day scale in HRB: (a) Meteorological drought duration (M-D); (b) meteorological drought severity (M-S); (c) hydrological drought duration (H-D); (d) hydrological drought severity (H-S).
Figure 4.
Drought duration and severity at 30-, 90-, 180-, and 365-day scale in HRB: (a) Meteorological drought duration (M-D); (b) meteorological drought severity (M-S); (c) hydrological drought duration (H-D); (d) hydrological drought severity (H-S).

Figure 5.
Drought speed at 30-day scale in HRB: (a) Meteorological drought development speed (M-DS); (b) meteorological drought recovery speed (M-RS); (c) hydrological drought development speed (H-DS); (d) hydrological drought recovery speed (H-RS).
Figure 5.
Drought speed at 30-day scale in HRB: (a) Meteorological drought development speed (M-DS); (b) meteorological drought recovery speed (M-RS); (c) hydrological drought development speed (H-DS); (d) hydrological drought recovery speed (H-RS).


Figure 6.
Examples of drought propagation: (a) The one-to-one situation of Type-1 at 30-day scale in HB catchment; (b) the many-to-one situation of Type-1 at 30-day scale in HB catchment; (c) Type-2 at a 30-day scale in HB catchment; (d) Type-3 at 30-day scale in XIN catchment.
Figure 6.
Examples of drought propagation: (a) The one-to-one situation of Type-1 at 30-day scale in HB catchment; (b) the many-to-one situation of Type-1 at 30-day scale in HB catchment; (c) Type-2 at a 30-day scale in HB catchment; (d) Type-3 at 30-day scale in XIN catchment.

Figure 7.
Occurrence probability of Type-1 propagation and Spearman coefficient of SPI and SRI in HRB (30-day scale).
Figure 7.
Occurrence probability of Type-1 propagation and Spearman coefficient of SPI and SRI in HRB (30-day scale).

Figure 8.
Occurrence probability of Type-2 (PM|NH) and Type-3 (PH|NM), ratio of duration (RP-D), ratio of severity (RP-S), ratio of development speed (RP-DS), and recovery speed (RP-RS) in HRB.
Figure 8.
Occurrence probability of Type-2 (PM|NH) and Type-3 (PH|NM), ratio of duration (RP-D), ratio of severity (RP-S), ratio of development speed (RP-DS), and recovery speed (RP-RS) in HRB.

Figure 9.
Propagation time (TP) from meteorological to hydrological drought in HRB.

Figure 10.
Pearson correlation coefficient between catchment properties, hydrological drought characteristics, and propagation features. (Note: the grid without a number or filling represents the significance level of correlation coefficient, which is less than 0.05).
Figure 10.
Pearson correlation coefficient between catchment properties, hydrological drought characteristics, and propagation features. (Note: the grid without a number or filling represents the significance level of correlation coefficient, which is less than 0.05).

Figure 11.
Meteorological and hydrological drought processes in paired-catchment during 1999–2001: (a) Benchmark catchment (TJH); (b) hydrological drought severity of two catchments; (c) reservoir-regulated catchment (XIN).
Figure 11.
Meteorological and hydrological drought processes in paired-catchment during 1999–2001: (a) Benchmark catchment (TJH); (b) hydrological drought severity of two catchments; (c) reservoir-regulated catchment (XIN).

Figure 12.
Propagation time calculated by (a) Pearson correlation coefficient; (b) peak/onset time difference; (c) Wavelet analysis for DPL; (d) Wavelet analysis for LH. (Note: all above are calculated based on SPI and SRI at 30-day scale).
Figure 12.
Propagation time calculated by (a) Pearson correlation coefficient; (b) peak/onset time difference; (c) Wavelet analysis for DPL; (d) Wavelet analysis for LH. (Note: all above are calculated based on SPI and SRI at 30-day scale).


Table 1.
Information of the 16 catchments.
| Catchments | Longitude (°) | Latitude (°) | Area (km2) | Annual Precipitation (mm) |
|---|---|---|---|---|
| Dapoling (DPL) | 113.75 | 32.42 | 1640 | 997 |
| Changtaiguan (CTG) | 114.07 | 32.32 | 3090 | 1005 |
| Xixian (XX) | 114.73 | 32.33 | 10,230 | 1020 |
| Huaibin (HB) | 115.42 | 32.43 | 15,780 | 1034 |
| Tanjiahe (TJH) | 113.88 | 31.90 | 173 | 1232 |
| Zhuganpu (ZGP) | 114.65 | 32.17 | 1639 | 1128 |
| Xinxian (XIN) | 114.87 | 31.62 | 274 | 1319 |
| Huangchuan (HC) | 115.05 | 32.13 | 2050 | 1202 |
| Ruzhou (RZ) | 112.85 | 34.15 | 2912 | 628 |
| Xiagushan (XGS) | 112.72 | 33.87 | 359 | 802 |
| Zhongtang (ZT) | 112.57 | 33.75 | 467 | 928 |
| Luohe (LH) | 114.03 | 33.58 | 12,150 | 767 |
| Gaocheng (GC) | 113.13 | 34.40 | 631 | 670 |
| Zhongmou (ZM) | 114.03 | 34.73 | 2132 | 634 |
| Bantai (BT) | 115.07 | 32.72 | 11,104 | 972 |
| Jiangjiaji (JJJ) | 115.73 | 32.30 | 5631 | 1246 |
Table 2.
Climate, catchment properties, and human activities affecting propagation characteristics.
| Index Name | Abbreviation | Details | Units |
|---|---|---|---|
| Average annual precipitation | P | Average annual precipitation is calculated using Thiessen polygon based on station observational data. | mm |
| Seasonality index | SI | The index represents the degree of variability in monthly precipitation within a year [11]. | |
| Drainage area | Area | The total drainage area of catchment. | Km2 |
| Drainage density | Dense | The total length of all the streams and rivers in a drainage basin divided by the total area of catchment. | Km/Km2 |
| Base flow index | BFI | The ratio of base flow and total runoff. Base flow was separated from the total streamflow using the digital filter method [34]. | - |
| Topographic index | TI | ln (α/tanβ) from TOPMODEL [33], α is the cumulative upslope area draining through the per contour length to a pixel and tanβ is the local slope angle of the cell. | - |
| NDVI | NDVI | NDVI quantifies vegetation by measuring the difference between near-infrared (which vegetation strongly reflects) and red light. | - |
| Ratio of reservoir capacity | Res | The ratio of the reservoir storage capacity to the annual average runoff of the catchment, reflecting the impact of reservoir on runoff (only the large- and medium-sized reservoir are considered). | % |
| Ratio of crop land | Crop | The ratio of catchment covered by crop land derived from GlobeLand30 to catchment area, reflecting the proportion of agricultural irrigation consumption in total runoff. | % |
Table 3.
Partial correlation coefficient between drought characteristics and significant influencing factors.
Table 3.
Partial correlation coefficient between drought characteristics and significant influencing factors.
| Area | P | TI | BFI | |
|---|---|---|---|---|
| HD | −0.431 | −0.684 (*) | −0.140 | 0.225 |
| HS | 0.460 | 0.722 (*) | 0.156 | 0.410 |
| PH|M | −0.198 | 0.502 | 0.037 | −0.395 |
| TP | 0.205 | 0.117 | 0.028 | 0.307 |
Note: * Denotes that the partial correlation coefficient is significant at the significance level of 0.05.
Table 4.
Summary of paired-catchment characteristics.
| Catchment | Area (km2) | Precipitation (mm) | ET (mm) | BFI | TI | Land Cover | |
|---|---|---|---|---|---|---|---|
| Crop Land | Forests | ||||||
| TJH (no reservoir) | 173 | 1232 | 64.2 | 0.140 | 7.811 | 17.80% | 82.10% |
| XIN (reservoir) | 274 | 1319 | 64.0 | 0.165 | 7.538 | 13.80% | 81.60% |
Table 5.
Comparison of drought characteristics for paired-catchment (30-day scale).
| Catchment | HD (Day) | HS | TP (Day) | PH|M | PH|NM | ||
|---|---|---|---|---|---|---|---|
| Average | Maximum | Average | Maximum | ||||
| TJH (no reservoir) | 64.6 | 169 | −121 | −277 | 10.7 | 0.48 | 0.31 |
| XIN (reservoir) | 62.5 | 163 | −108 | −255 | 11.0 | 0.45 | 0.46 |
| Difference (%) | −3.3 | −3.6 | −10.7 | −7.9 | 2.8 | 6.3 | 48.4 |
Publisher’s Note: MDPI stays neutral with regard to jurisdictional claims in published maps and institutional affiliations. |
© 2021 by the authors. Licensee MDPI, Basel, Switzerland. This article is an open access article distributed under the terms and conditions of the Creative Commons Attribution (CC BY) license (https://creativecommons.org/licenses/by/4.0/).
Share and Cite
MDPI and ACS Style
Wang, J.; Wang, W.; Cheng, H.; Wang, H.; Zhu, Y. Propagation from Meteorological to Hydrological Drought and Its Influencing Factors in the Huaihe River Basin. Water 2021, 13, 1985. https://doi.org/10.3390/w13141985
AMA Style
Wang J, Wang W, Cheng H, Wang H, Zhu Y. Propagation from Meteorological to Hydrological Drought and Its Influencing Factors in the Huaihe River Basin. Water. 2021; 13(14):1985. https://doi.org/10.3390/w13141985
Chicago/Turabian StyleWang, Jingshu, Wen Wang, Hui Cheng, Hongjie Wang, and Ye Zhu. 2021. "Propagation from Meteorological to Hydrological Drought and Its Influencing Factors in the Huaihe River Basin" Water 13, no. 14: 1985. https://doi.org/10.3390/w13141985
Note that from the first issue of 2016, this journal uses article numbers instead of page numbers. See further details here.