
Simulations and Analysis of GNSS Multipath Observables for Frozen and Thawed Soil under Complex Surface Conditions
by
 ,
,
Chao Gao
1, 
Weihua Bai
2,3,4,5,6,*,
Zhiqiang Wang
1,
Xuerui Wu
7,8,
Lijun Liu
2,3,5,6,
Nan Deng
2,3,4,5,6 and
Junming Xia
2,3,4,5,6 1
Beijing Institute of Tracking and Telecommunications Technology, Beijing 100094, China
2
National Space Science Center, Chinese Academy of Sciences (NSSC/CAS), Beijing 100190, China
3
Beijing Key Laboratory of Space Environment Exploration, Beijing 100190, China
4
School of Astronomy and Space Science, University of Chinese Academy of Sciences, Beijing 100049, China
5
Joint Laboratory on Occultations for Atmosphere and Climate (JLOAC), NSSC/CAS and University of Graz, Beijing 100190, China
6
Key Laboratory of Science and Technology on Space Environment Situational Awareness, CAS, Beijing 100190, China
7
School of Resources, Environment and Architectural Engineering, Chifeng University, Chifeng 024000, China
8
Shanghai Astronomical Observatory, Chinese Academy of Sciences, Shanghai 200030, China
*
Author to whom correspondence should be addressed.
Water 2021, 13(14), 1986; https://doi.org/10.3390/w13141986
Submission received: 29 June 2021
/
Revised: 14 July 2021
/
Accepted: 16 July 2021
/
Published: 20 July 2021
(This article belongs to the Special Issue Remote Sensing Application on Soil Moisture)
Abstract
:The transition of the freeze–thaw state of the land surface soil occurs every year with the season and is closely related to the human living environment. The freezing and thawing changes of the ground surface have important effects on hydrological activities, meteorological conditions, and ecological gas dynamics. Traditional monitoring methods have their limitations. In the past two decades, the emerging GNSS-R/IR (Global Navigation Satellite System-Reflectometry/Interference Reflectometry) technology has provided a new method for monitoring the surface f state; however, fewer works have paid attention to the scattering mechanism models in the current study. In this paper, a forward GNSS multipath model suitable for a complex cold surface is developed. The dielectric constant model with different surface parameters is added. The calculation of snow layer attenuation is employed to take the snow cover into consideration. Based on the first-order radiation transfer equation model, a polarization synthesis method is used to obtain the circularly and linearly polarized vegetation specular scattering characteristics. The surface characteristics and antenna model are coupled. A more detailed forward GNSS multipath model of frozen and thawed soil under complex surface conditions is established. The model is used to simulate and analyze the forward GNSS multipath (Signal to Noise Ratio (SNR), phase and pseudorange) responses of frozen and thawed soil under complex surface conditions (soil salinity, snow and vegetation coverage). Studies have shown that when the soil changes from freezing to thawing due to the change in the phase of the water in the soil, the dielectric constant and BRCS (bi-static radar cross-section) increase, causing the increase in the amplitude of the multipath observation. The higher the salinity content, the larger the amplitude of the multipath observation. The attenuation of the snow cover and the vegetation layer will lead to the reduction of the multipath observation amplitude. For the first time, the model developed by this paper reveals the GNSS multipath observation response of frozen and thawed soil under complex surface conditions in detail, which can provide some theoretical support for subsequent experimental design and data analysis.
1. Introduction
As one of the important components of the cryosphere, frozen soil refers to all kinds of rocks and soils that contain ice and unfrozen water at temperatures of zero degrees Celsius and below. Frozen soil is divided into seasonal frozen soil and permafrost, which accounts for 35% of the total land area of the earth. The area of the land surface that undergoes annual freeze–thaw changes can reach 50 million km. The freezing and thawing changes of the ground surface have important effects on hydrological activities, meteorological conditions, and ecological gas dynamics [1]. As snow and the frozen water from the soil melt, vegetation begins to grow, snow-covered glaciers begin to melt, river flows increase, and flooding may occur. The length of the surface melting time is closely related to the length of the vegetation growing season. The surface freezing time is basically the same as the seasonal snow cover time. Seasonal frozen soil and permafrost store a large amount of organic matter containing carbon and nitrogen. The changes in surface freezing and thawing are closely related to the carbon cycle of terrestrial ecosystems. The sooner the melting time begins, the greater the net primary productivity and net absorption of vegetation. Surface freezing and thawing cycles will change the physical properties of the soil, affect the interaction between the soil and the snowmelt, and influence the water and heat circulation of the soil. The high-resolution soil freeze–thaw cycle plays an important role in studying the past distribution of soil organic carbon in the ecosystem and the earth system [2]. Therefore, it is very important to effectively monitor the spatiotemporal distribution of the surface freeze–thaw state and its related physical parameters.
The period of freezing and thawing has a strong non-uniformity in spatiotemporal changes since it will be affected by the temperature difference, topography, and surface cover types, etc. Meeting the application requirements using monitoring methods that rely on traditional meteorological stations is difficult, and satellite remote sensing technology provides a new method. Visible light and thermal infrared remote sensing are limited by weather conditions, but microwave remote sensing is not affected by clouds and fog, and it can work day and night. Active/passive microwave remote sensing (radar/radiometer) is one of the effective means for surface freeze–thaw monitoring [3]. However, traditional single-station radars and microwave radiometers are expensive, and the spatiotemporal resolution is far from the actual scientific requirements.
Since GNSS-R remote sensing technique employs the existing GNSS constellations as the signal source, its cost is low and the power consumption is small [4]. This remote sensing technique works at L-band, which is suitable for monitoring the surface freeze–thaw state. Compared with traditional polar orbit satellites, GNSS-R can provide continuous observation signals for most areas on the surface of the earth. GNSS-R technology will be a useful supplement to polar orbit satellite observations in space-time resolution and has attracted more and more attention. The GNSS-R receiver can use direct signals for positioning and calculation and has self-positioning and self-timing capabilities, so it is beneficial to data processing, positioning, sensor sleep and scheduling; thus, this technology makes it easy to enter the geographic information system and easy to form a large-scale surface freeze–thaw observation network [5,6].
The GNSS-IR (GNSS-Interference Reflectometry) technology directly uses the multipath information obtained from the interference signal of the direct signal and the reflected signal from geodetic quality GNSS receivers to observe the geophysical parameters [7]. This method does not require the development of special receivers and directly uses geophysical or earth surveying and mapping receivers. For a typical surveying and mapping GPS (Global Positioning System) receiver antenna gain, when the elevation angle is less than 35°, the interferogram information of the direct signal and the reflected signal is the most obvious; therefore, the multipath information can be used to remotely monitor the geophysical parameters. The spatial resolution of this remote sensing method is about 1 km, which is between the traditional site sensor (<1 m) and the spaceborne observation (>100 km). This means that thousands of GPS station data can be used for near-real-time observation of ground geophysical features, and they can provide data for environmental science hydrological remote sensing research. The land application fields of GNSS-IR remote sensing technology mainly involve soil moisture, snow cover thickness and vegetation water content [8,9,10].
Larson et al. [7] used the observation data of a station in Colorado to conduct research and analysis, and they pointed out that there was a linear correlation between the phase and the near-surface soil moisture [11]; Zavorotny et al. [12] used the GPS reflection information model to indicate its physical mechanism. Chew et al. developed a bare soil inversion algorithm based on the previously mentioned physical model [8]. Vey used this algorithm to establish a time series of soil moisture in South Africa for many years, but his research found that the RMSE (root-mean-square error) between the measured data and the soil moisture retrieved by GPS-IR was 0.05 cm/cm, the inversion error is large, and it limited its applications [13]. The study conducted by Chew et al. has pointed out that the influence of vegetation on the phase should not be ignored. Therefore, the amplitude information of SNR was used to remove the influence of vegetation, the phase information of SNR was used for soil moisture retrieval, and this information can also be corrected by the frequency information of the SNR interferogram [9].
Using GNSS-R/IR technology for surface freeze–thaw state monitoring is a relatively new application field. Wu et al. pointed out through theoretical analysis that the use of GNSS-R technology for surface freeze–thaw state monitoring was feasible, and they adopted the idea of virtual dual-station radar and conducted preliminary verification using PBO (plate boundary observation) site data to establish the correlation between the surface freeze–thaw state and multipath observation [14]. Chew et al. used the GNSS-R mode of SMAP (Soil Moisture Active Passive) data (receiver frequency bandwidth adjustment, etc.) to conduct a preliminary analysis of surface freeze–thaw state monitoring [15].
Thus far, fewer works have concentrated on the research of GNSS-IR scattering mechanisms. However, more works related to this topic are needed since they are very important for the interpretation and explanation of receiver observations. Meanwhile, it can be an efficient tool for the development of quantitative inversion algorithms.
This paper develops and establishes a GNSS multipath model suitable for frozen and thawed soil under complex surface conditions. Using it as a tool, the effects of different surface parameters and conditions on GNSS multipath observations are analyzed. It provides a key mechanism tool for GNSS-IR to conduct freeze–thaw monitoring. Section 2 gives the theoretical formula and fundamentals, Section 3 presents the simulation and analysis results, and the discussion and conclusions are given in Section 4 and Section 5, respectively.
2. Theoretical Fundamentals and Formula
In this paper, we have developed a model that can be used to analyze the effects of soil salinity, vegetation and snow cover in frozen and thawed soil on GNSS multipath observations (SNR, phase and pseudorange). Since the dielectric constants are the basic model inputs, we will show the corresponding models in Section 2.1, while the surface scattering models are given in Section 2.2. Lastly, with the two above-mentioned models as inputs, the developed multipath model is presented in Section 2.3.
2.1. Dielectric Constant Models
The soil surface parameters mainly include the physical parameters of the soil (including soil texture information and soil moisture) and the dielectric properties of the soil. The complex permittivity of soil can be expressed as . Where is the real part, which means that the refraction and reflection of the waves are occurring on the surface of two different media, and it is related to the dielectric properties of the medium. The imaginary part is related to the attenuation (absorption and conversion) of the incident electromagnetic waves in the medium.
2.1.1. Normal Temperature Mixed Soil Dielectric Constant Model
Soil is a dielectric mixture composed of air, solid soil, bound water and free water. Each component has an important influence on the soil dielectric constant. In this study, the semi-empirical model proposed by Dobson et al. was used to calculate the dielectric properties of soil at the normal temperature [16,17]. For soil with a volumetric water content of , the complex dielectric constant can be expressed as follows,
where is the shape factor, is the density of the soil block, is the density of the solid matter in the soil, is the dielectric constant of the solid matter in the soil, is the dielectric constant of pure water. However, for high water content, the model underestimates the real part of the dielectric constant. For various soil textures and soil water content, the model underestimates the imaginary part of the dielectric constant. The literature modifies the model, which can be applied in the case of 0.3–1.3 GHz [18]. For the real part of the dielectric constant, linear correction is used to correct the previous expression.
For the imaginary part, the effective conductivity takes a new form:
where S and C are the volume percentage of sand content and clay content, respectively.
2.1.2. Soil Dielectric Constants of Negative Temperature
For frozen soil, due to the phase change of the water in the soil, the calculation of the dielectric constant has added the calculation of the ice [19]:
is the non-frozen water content (%). A and B are parameters related to soil texture, and T is the soil temperature (K). After pulling in the volume percentage of non-frozen soil moisture, the above formula can be modified as follows:
where is the block density and is the specific density of water (g/cm). The volume content of ice can be defined as follows:
where is the total water content and is the specific density of ice (g/cm). After multiplying the volume content of ice and the dielectric constant of ice , the final dielectric constant of frozen soil can be expressed as follows,
where is the dielectric constant, V is the volume content of different components, the superscript is the constant shape factor, and the subscripts s, a, , are solid soil, air, free water and bound water, respectively.
2.1.3. Dielectric Properties of Saline Soil
Based on the Collie model of electrolyte solution [20], the complex dielectric constant of various ionic solutions in saline soil can be expressed as:
where is the complex dielectric constant of water, and are the complex influencing factors of the cation and anion of the i-th medium in the mixed medium solution. These modes are the influence intensity of the cation and anion, respectively, and are related to the ambient temperature. and are the number of cations and anions of the i-th electrolyte, respectively; is the salinity of the i-th electrolyte in the solution, and is a function of the concentration of the i-th electrolyte.
2.2. The Impacts of Land Cover
Different vegetation types, vegetation height, coverage, and structure can form different canopies. The canopy affects the snow distribution by intercepting snowfall and solar radiation, which in turn determines the snow melting time, soil temperature, and water content. Therefore, they will affect the process of soil freezing and thawing. The vegetation layer and the snow layer are important factors influencing the determination of frozen and thawed soil. In this section, we will show the calculations of these two factors.
2.2.1. Influence of Snow Cover
The effect of snow on the temperature and humidity of the soil is extremely complex. Snow cover has a high albedo and adiabaticity, which will cause changes in the surface energy flux, affect soil temperature and soil freezing and thawing time. On the one hand, snow melting can change soil moisture; on the other hand, the depth and amount of infiltration under snow melting are related to the frozen state of frozen soil. At the same time, studies have shown that changes in snow thickness have an important effect on ground temperature. In the unstable period, the effect of snowfall on the surface soil temperature is mainly cooling, and in the stable period, it is mainly thermal insulation. For snow cover, this paper uses the slab model to calculate the snow attenuation [21].
where k is the free space wave number, is the snow cover dielectric constant, is the snow temperature, is the angle of incidence, and is the attenuation factor. This model neglects scattering in the snow layer and can compute two-way transmissivity of the snow layer.
2.2.2. Vegetation Canopy Impact
Vegetation coverage will be an important factor affecting the determination of surface freezing and thawing. Freezing and thawing not only affects the physical and chemical properties of the soil, biogeochemical cycles but also affects the physiological and ecological processes of plants through habitat stress or changes in the soil environment, and this may have an important impact on the productivity of vegetation ecosystems in widely distributed frozen soil. Soil freezing and thawing are essentially caused by the phase change of water in the soil. Vegetation cover is the most important influencing factor to control the soil water and heat cycle. Vegetation can maintain the moisture in the soil and reduce the surface temperature, thus reducing the maximum seasonal freezing (thaw) depth.
In this paper, the first-order radiation transfer equation model is used to calculate the vegetation characteristics [22,23]. We assumed that the incident intensity is and the scattering intensity is , where are the zenith angle and azimuth angle of incidence, respectively, and the zenith angle and azimuth angle of scattering. After the incident energy is scattered by the particles, the scattered energy intensity and the incident energy intensity can be connected through the modified Mueller matrix (modified Mueller matrix).
is the particle orientation, r is the distance between the scattering intensity and the particle, is the electric field scattering matrix of the particle, and it is defined by the scattering amplitude S.
2.3. Forward GNSS Fully Polarized Multipath Model
Changes in geophysical parameters, such as snow thickness, vegetation moisture and biomass, soil moisture, and salinity, can cause changes in multipath information (SNR, phase, and pseudorange) of GNSS receivers. Therefore, the interference multipath data of the direct signal and the reflected signal can be used to monitor the ground geophysical parameters. In this paper, a forward GPS multipath model is used to calculate this characteristic. This model can simultaneously consider the GPS signal polarization, antenna and ground surface response [24].
P represents the electric field energy, G represents the antenna gain, W represents the Woodward ambiguity function, subscript d and r represent the direct and reflected components, and X is the ground and antenna coupling coefficient.
The superscripts R and L are the RHCP and LHCP polarizations, respectively; is the interference phase, and are the co-polarization and cross-polarization scattering coefficients, respectively. The commonly used polarization of scattering models are linear. As for GNSS-IR remote sensing, special circular polarization should be employed. Therefore, we have employed the polarization synthesis to get the corresponding scattering properties. In order to obtain the circular polarization scattering coefficients, this paper uses the method of polarization synthesis [25].
With this formula (Equation (16)), the bistatic scattering cross-section for any combinations of transmitted and received polarizations can be calculated, where the subscripts t and r are the transmitted and received polarizations, respectively; and are the normalized Stokes vectors characterizing the transmitter and receiver polarizations, respectively.
3. Simulations and Analysis
In Section 2, we have presented the theoretical fundamentals and the corresponding formula to establish the relationship between different surface properties (soil temperature, salinity, texture, snow and vegetation cover) and the GPS multipath observables.
In the following, we will carry out some simulations and analyses of the effects of different surface parameters on GNSS multipath observables based on the above-developed model.
3.1. Carrier Frequency Effects on Dielectric Constants
The dielectric properties of soil are affected by frequency. At present, the global GNSS carrier frequency basically covers the L, S, and C frequency bands and can be used for remote sensing research. Table 1 shows the available frequency points of the current navigation systems, e.g., GPS, GLONASS, Galileo, Beidou, IRNSS and QZSS [26].
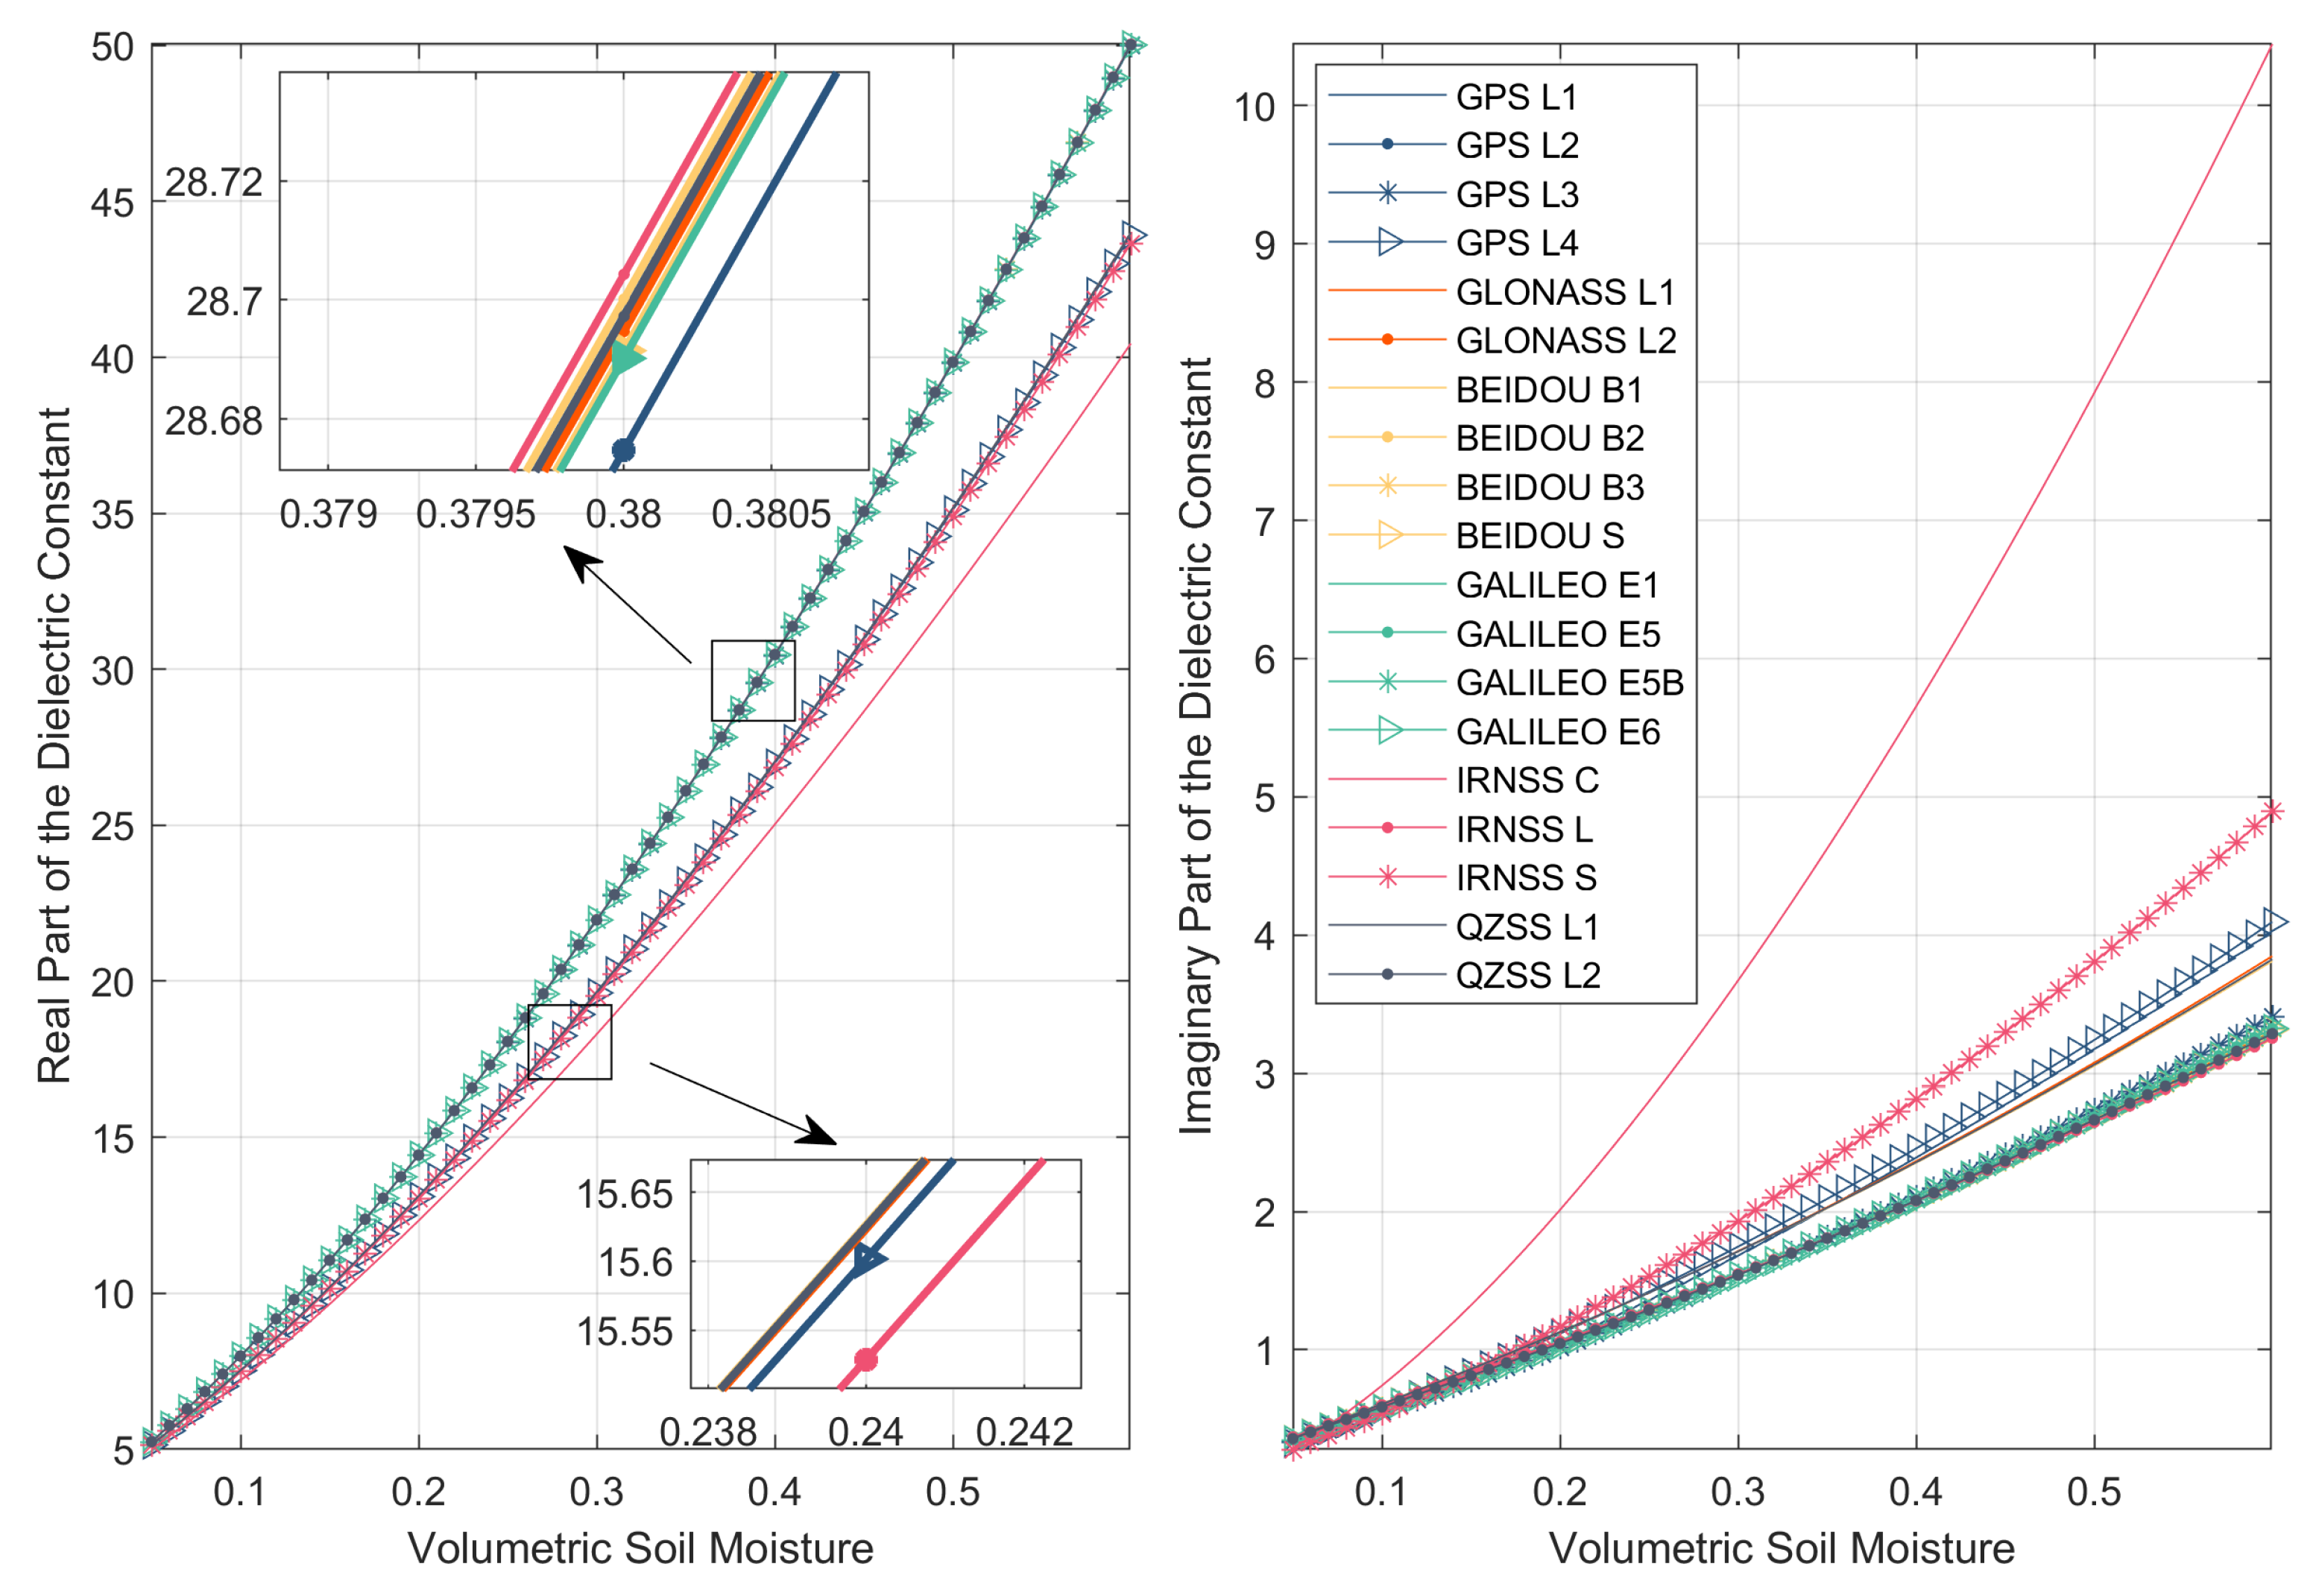
Using the dielectric constant model in Section 2, Figure 1 simulates the relationship between the real and imaginary parts of the dielectric constant with soil moisture content at different carrier frequencies. The soil texture information for simulations is 51.5% sand content and 13.5% clay content. The soil temperature is 25 °C.
It can be seen from Figure 1 that the real part of the dielectric constant decreases with increasing frequency, and the trend of the imaginary part is just the opposite. At different frequencies, as the water content increases, both the real and imaginary parts of the dielectric constant increase. Mostly, the frequency bands of different GNSS systems almost cover the lower L-band to the higher L-band. As in these carrier frequency bands, the dielectric constants are almost the same. However, if the frequency bands cover other frequency bands except for L-band, then the dielectric constants will change more obviously. Compared with the L-band, the dielectric constants corresponding to the frequencies of the C-band and S-band have fluctuations in the real and imaginary parts. Given the difference in real and imaginary parts of the dielectric constant of each navigation satellite system in the L-band, this paper selects the L1 frequency band of GPS for analysis, since the dielectric constant at the L-band is almost the same.
3.2. Soil Texture Effects on Dielectric Constants
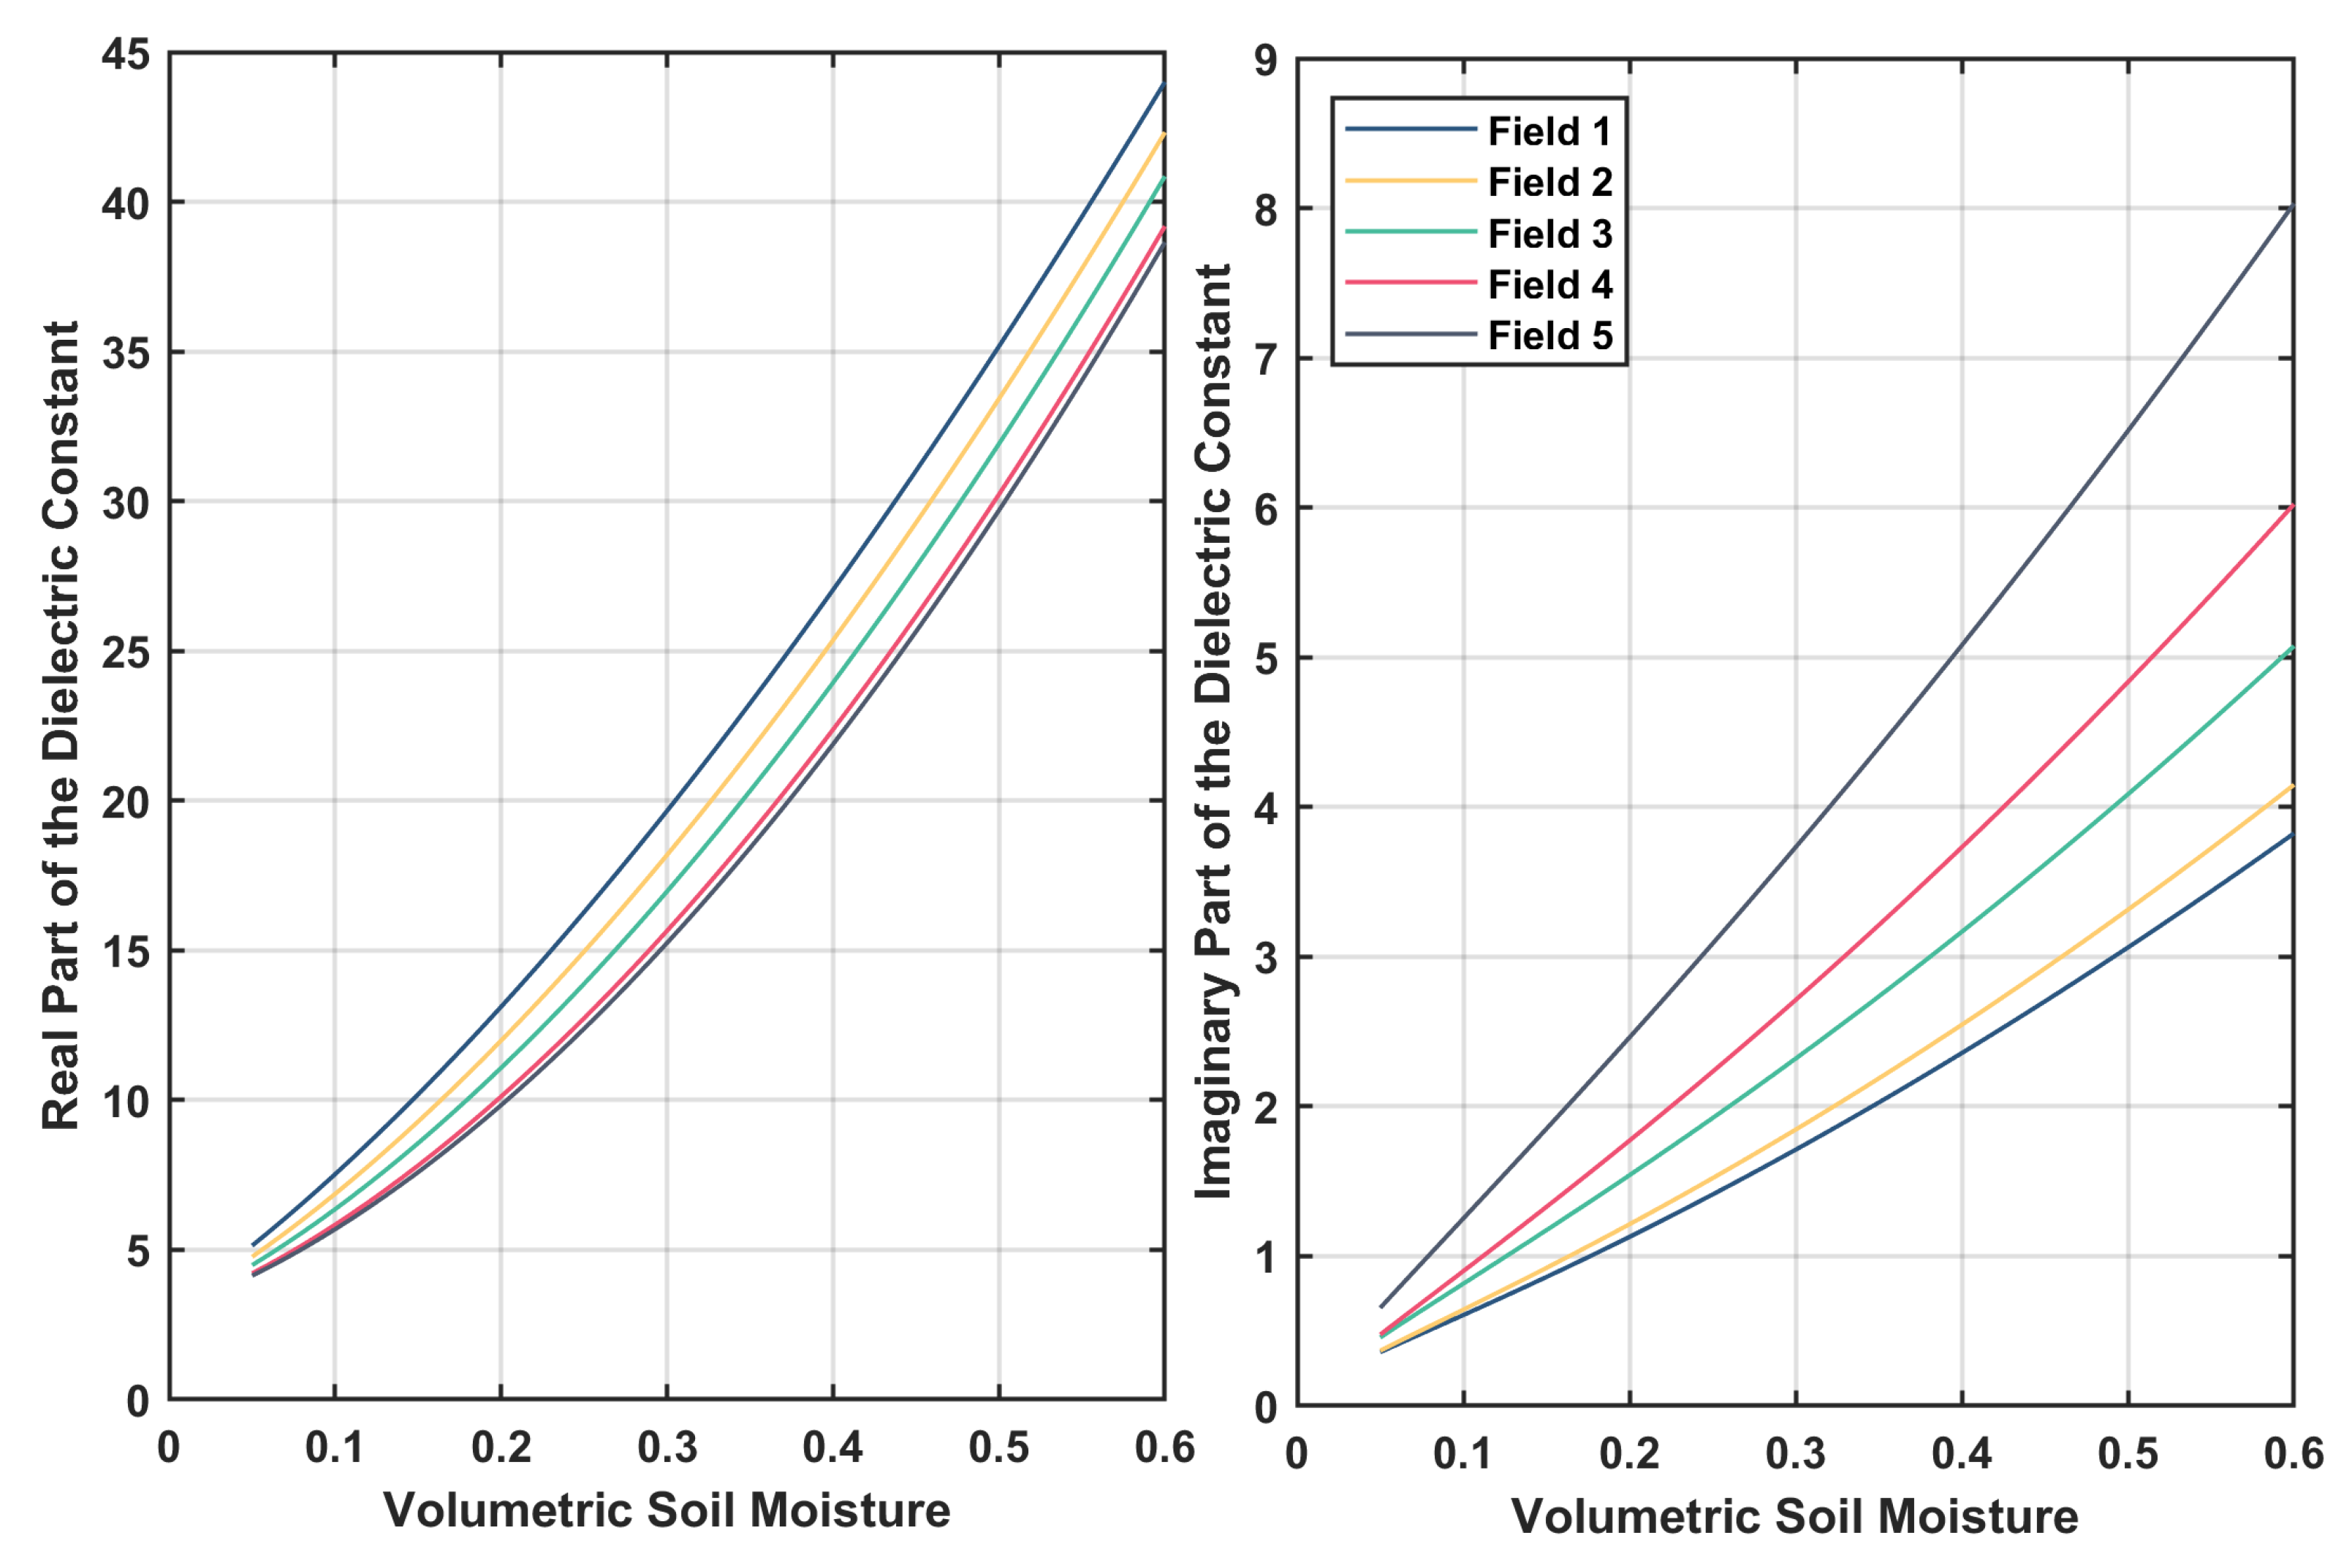
In this paper, five soil texture types are selected to simulate their dielectric properties. Detailed parameters information are shown in Table 2 [17,18].
Table 2 shows five different soil textures (sandy loam, loam and silty loam). The main difference is the sand content and clay content. Using this table as the input of the model, the relationship between the real part and the imaginary part of the dielectric constant at the GPS L1 carrier frequency was simulated and analyzed.
From simulations shown in Figure 2, we can see that the real parts of the dielectric constants for different soil textures vary no more than five, while the variations of the imaginary parts are no more than two. The fluctuations of the dielectric constant corresponding to different soil textures will not affect the surface scattering properties. Indeed, the change of soil texture will finally cause the change of GNSS multipath observables to a certain extent, but from the simulations of dielectric constants in Figure 2, these changes on GNSS multipath observables can be ignored.
3.3. Dielectric Constant Difference and Multipath Observation Responses during Freeze–Thaw Conversion
3.3.1. Dielectric Constant Difference during Freeze–Thaw Conversion
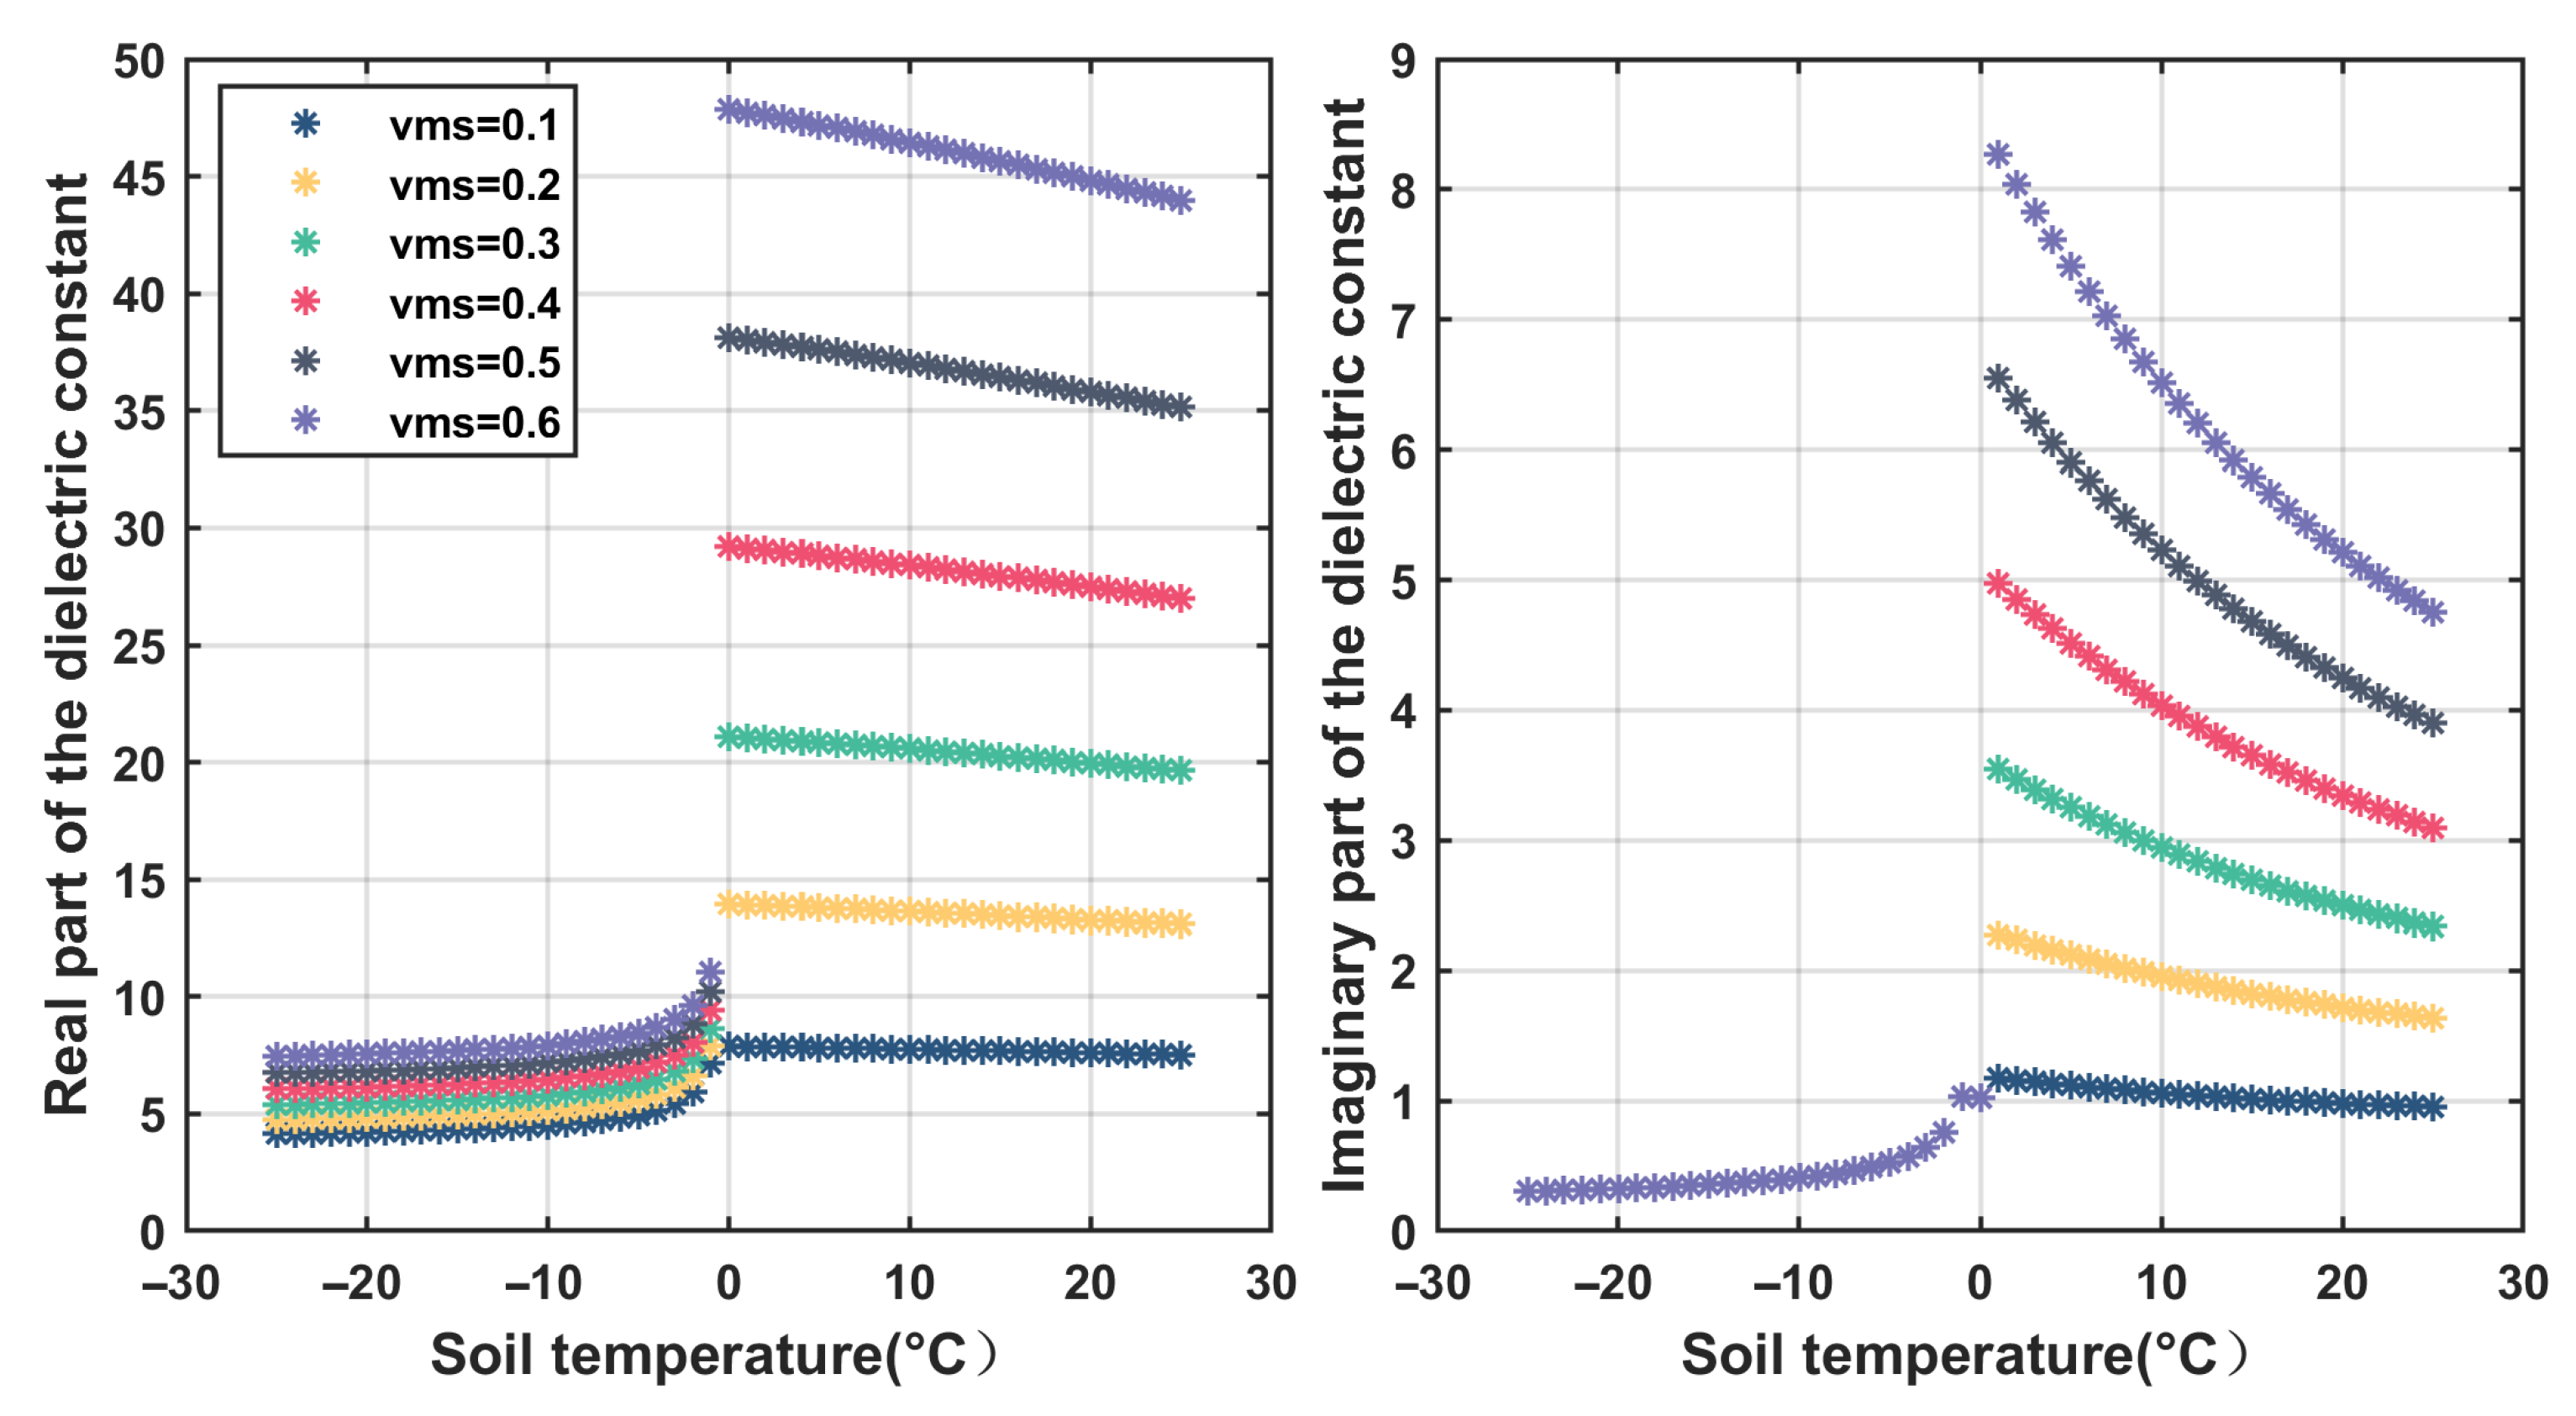
When the soil temperature was converted from negative temperature to positive temperature, the changing relationship of the corresponding dielectric constant was simulated using the dielectric constant model in Section 2.
Figure 3 shows the relationship between the real part and the imaginary part of the dielectric constant with the soil temperature under different soil moisture contents. It can be seen from the figure that when the temperature changes from negative temperature to positive temperature, there is a significant change in the real and imaginary parts of the dielectric constant. This apparent change in dielectric constant will eventually cause changes in the receiver’s multipath observations, which is the root cause of surface freeze–thaw monitoring using GNSS-IR. For the real part of the dielectric constant, whether it is negative or positive, the real part of the dielectric constant increases as the water content increases. For the imaginary part of the dielectric constant, the difference in the imaginary part of the dielectric constant of different water contents is basically zero at negative temperature. At positive temperatures, as the water content increases, the imaginary part of the dielectric constant increases.
3.3.2. Corresponding BRCS Changes during Freeze–Thaw Conversion
The fundamentals for soil F/T detection using GNSS-IR technique are that the dielectric constant of soil will affect the surface scattering properties, and finally, the corresponding multipath information will change. Therefore, the surface scattering properties, which are represented by Bistatic Radar Cross-Section (BRCS), are very important for the final analysis. The scattering properties will change as the surface dielectric constant changes. This section simulates the changes of BRCS when the surface temperature changes with different polarizations.
Figure 4 shows the relationship between BRCS and elevation angle for different polarizations. From the figure, it can be seen that when the soil temperature changes from −1 °C to 1 °C, BRCS increases at various polarizations. For the VV polarization at −1 °C, there is a groove caused by the Brewster angle. After this angle, as the elevation angle increases, the BRCS increases. As the elevation angle increases, the BRCS decreases at HH polarization and RR polarization. The BRCS at LR polarization increases as the elevation angle increases.
3.3.3. GNSS Multipath Observation Changes during Freeze–Thaw Conversion
When a freeze–thaw transition occurs, it will cause changes in multipath observations.
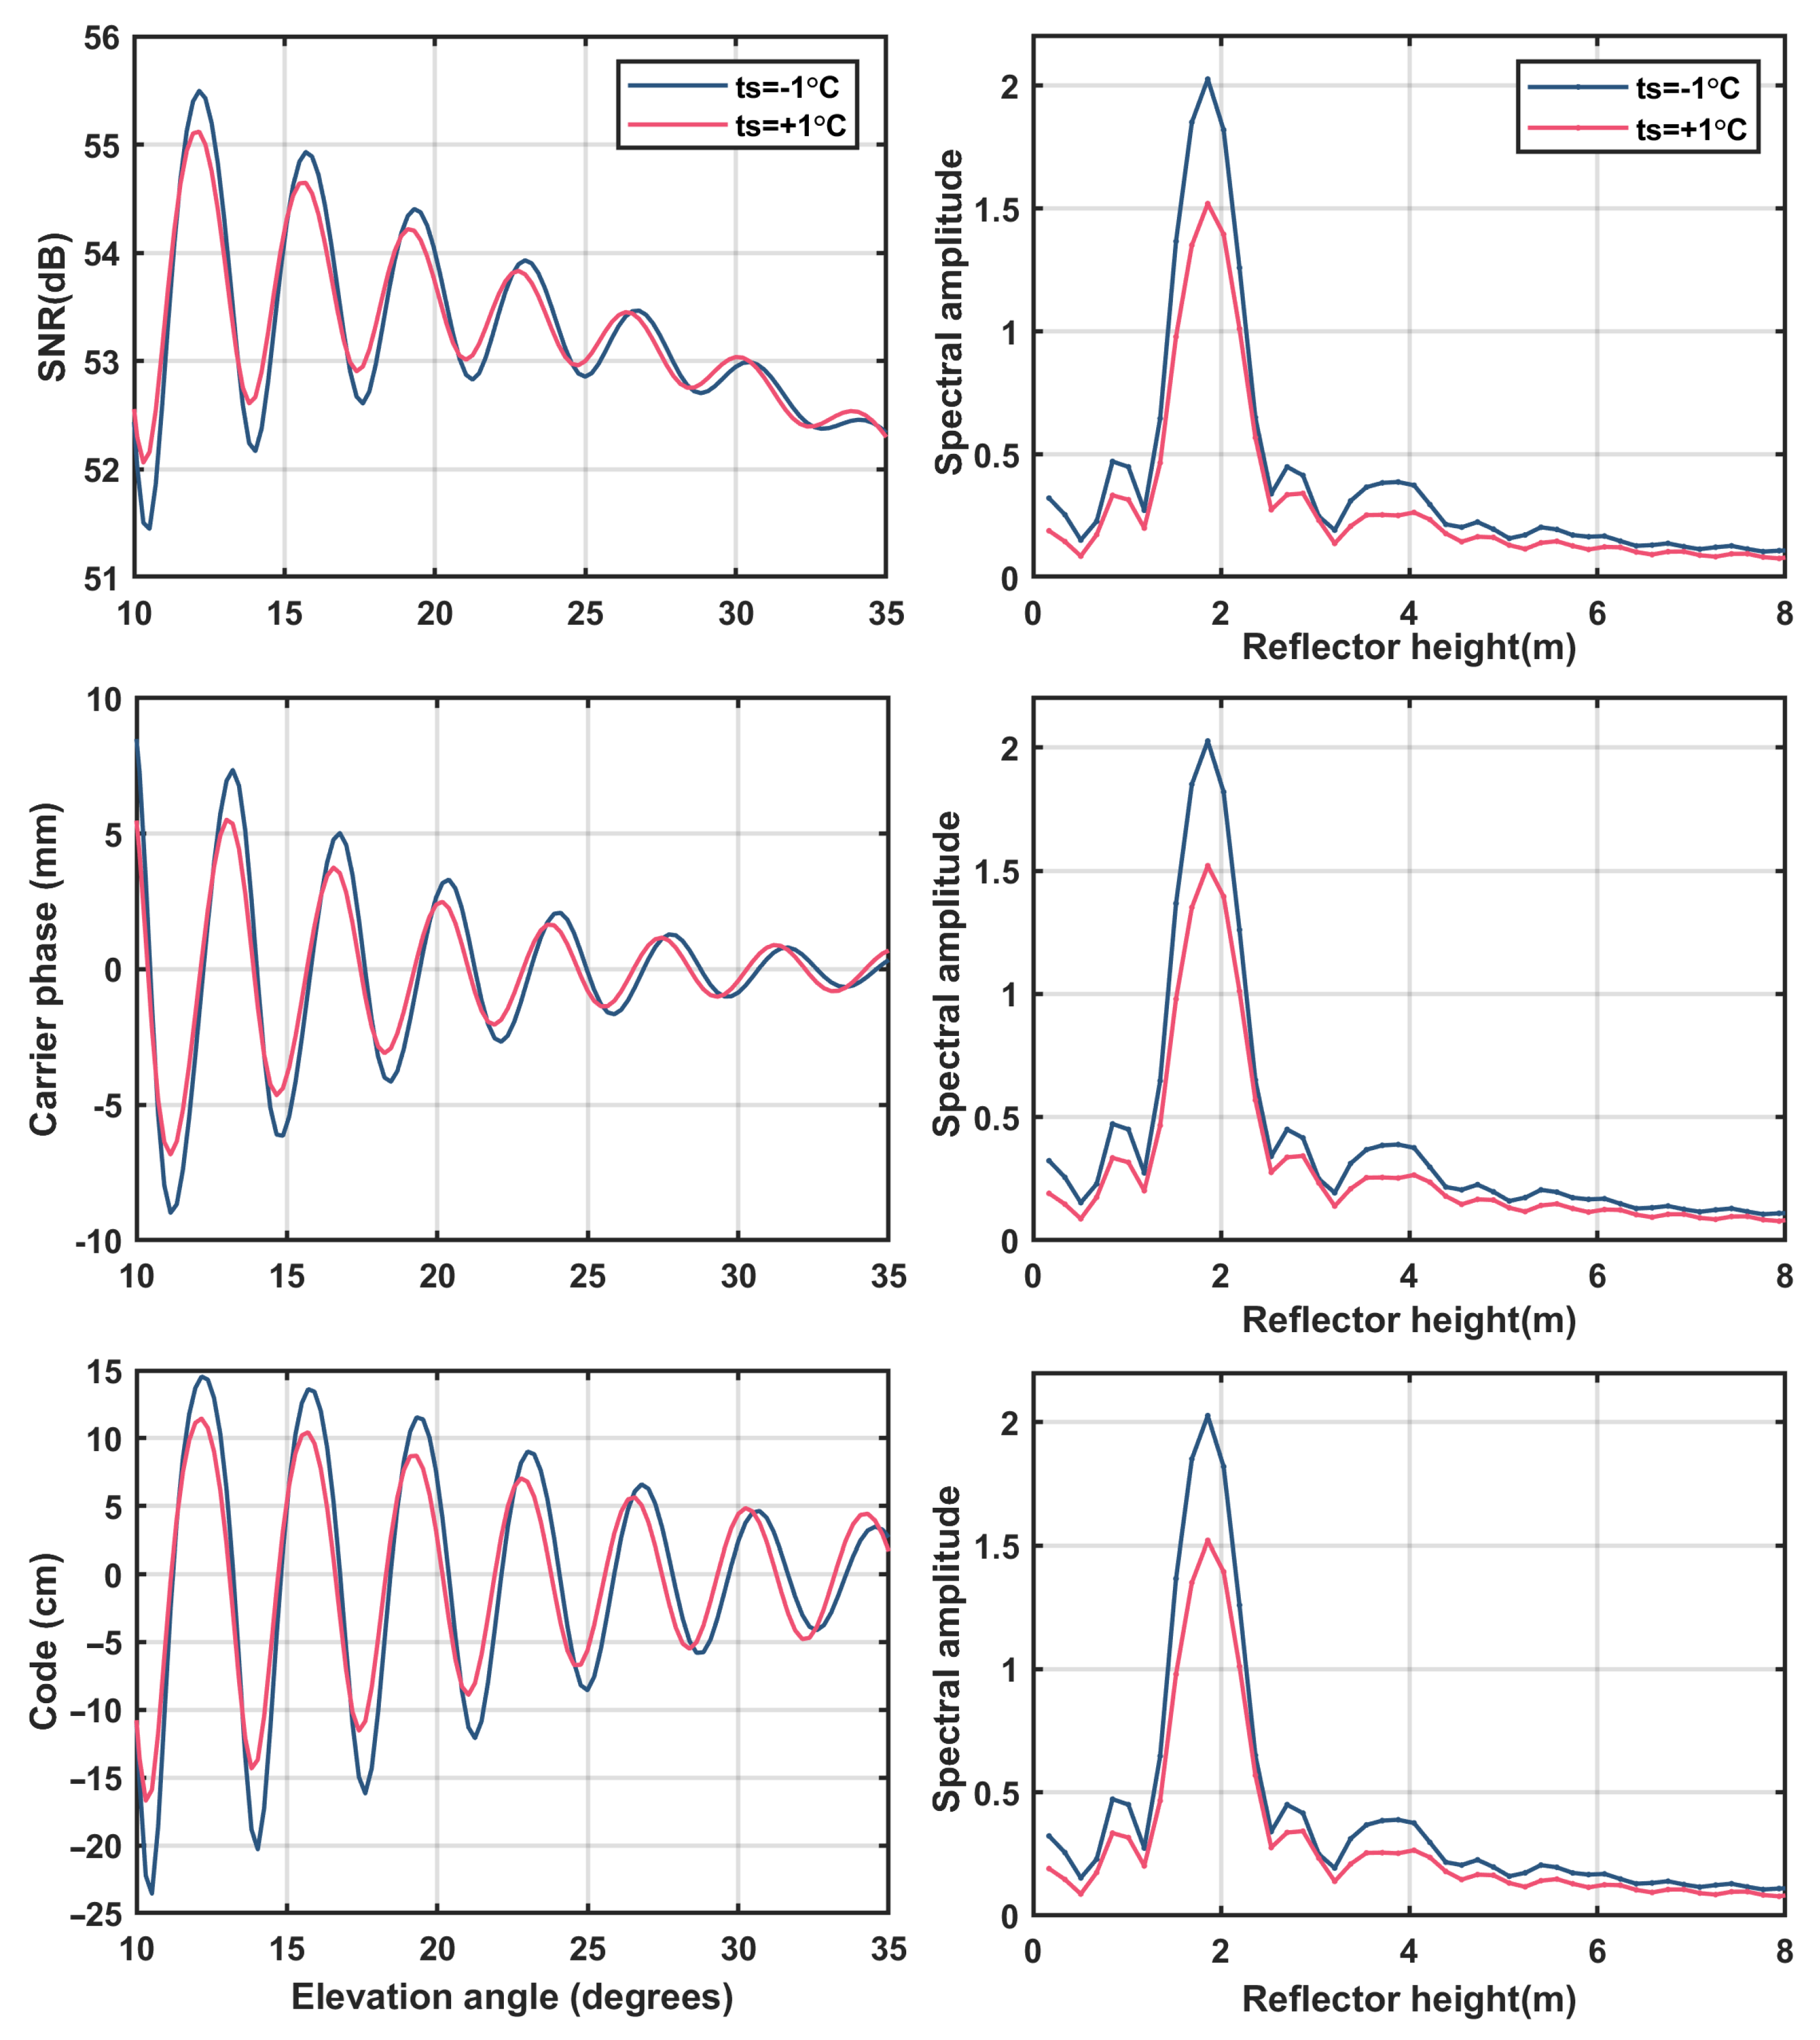
Figure 5 shows the GNSS multipath observations when the soil temperature is −1 °C and 1 °C. It can be seen from the figure that when the temperature changes from negative temperature to positive temperature, SNR, phase and pseudorange sinusoidal vibration amplitude decrease, and the vibration curve in the waveform will have a phase shift. Lomb–Scargle periodograms are computed for GPS multipath signatures. When the soil temperature changes from negative temperature to positive temperature, the effective reflectometer height will decrease. This is because when the soil changes from freezing to thawing, the phase of the water changes, and this will cause the dielectric constant (Figure 4) and the BRCS (Figure 5) to decrease, which ultimately leads to the decrease of the amplitudes and effective reflectometer heights of the multipath observation.
3.4. Dielectric Constant Difference and Multipath Observation Response Caused by Salt Content Change
When freezing and thawing occurs, the salt content in the soil will change dynamically with time and space. The freeze–thaw cycle of salt is one of the important topics in cryosphere research. This section simulates the relationship between the corresponding dielectric constant model, BRCS and GNSS multipath observations when the salinity in the soil solution changes.
3.4.1. Changes in Dielectric Constant
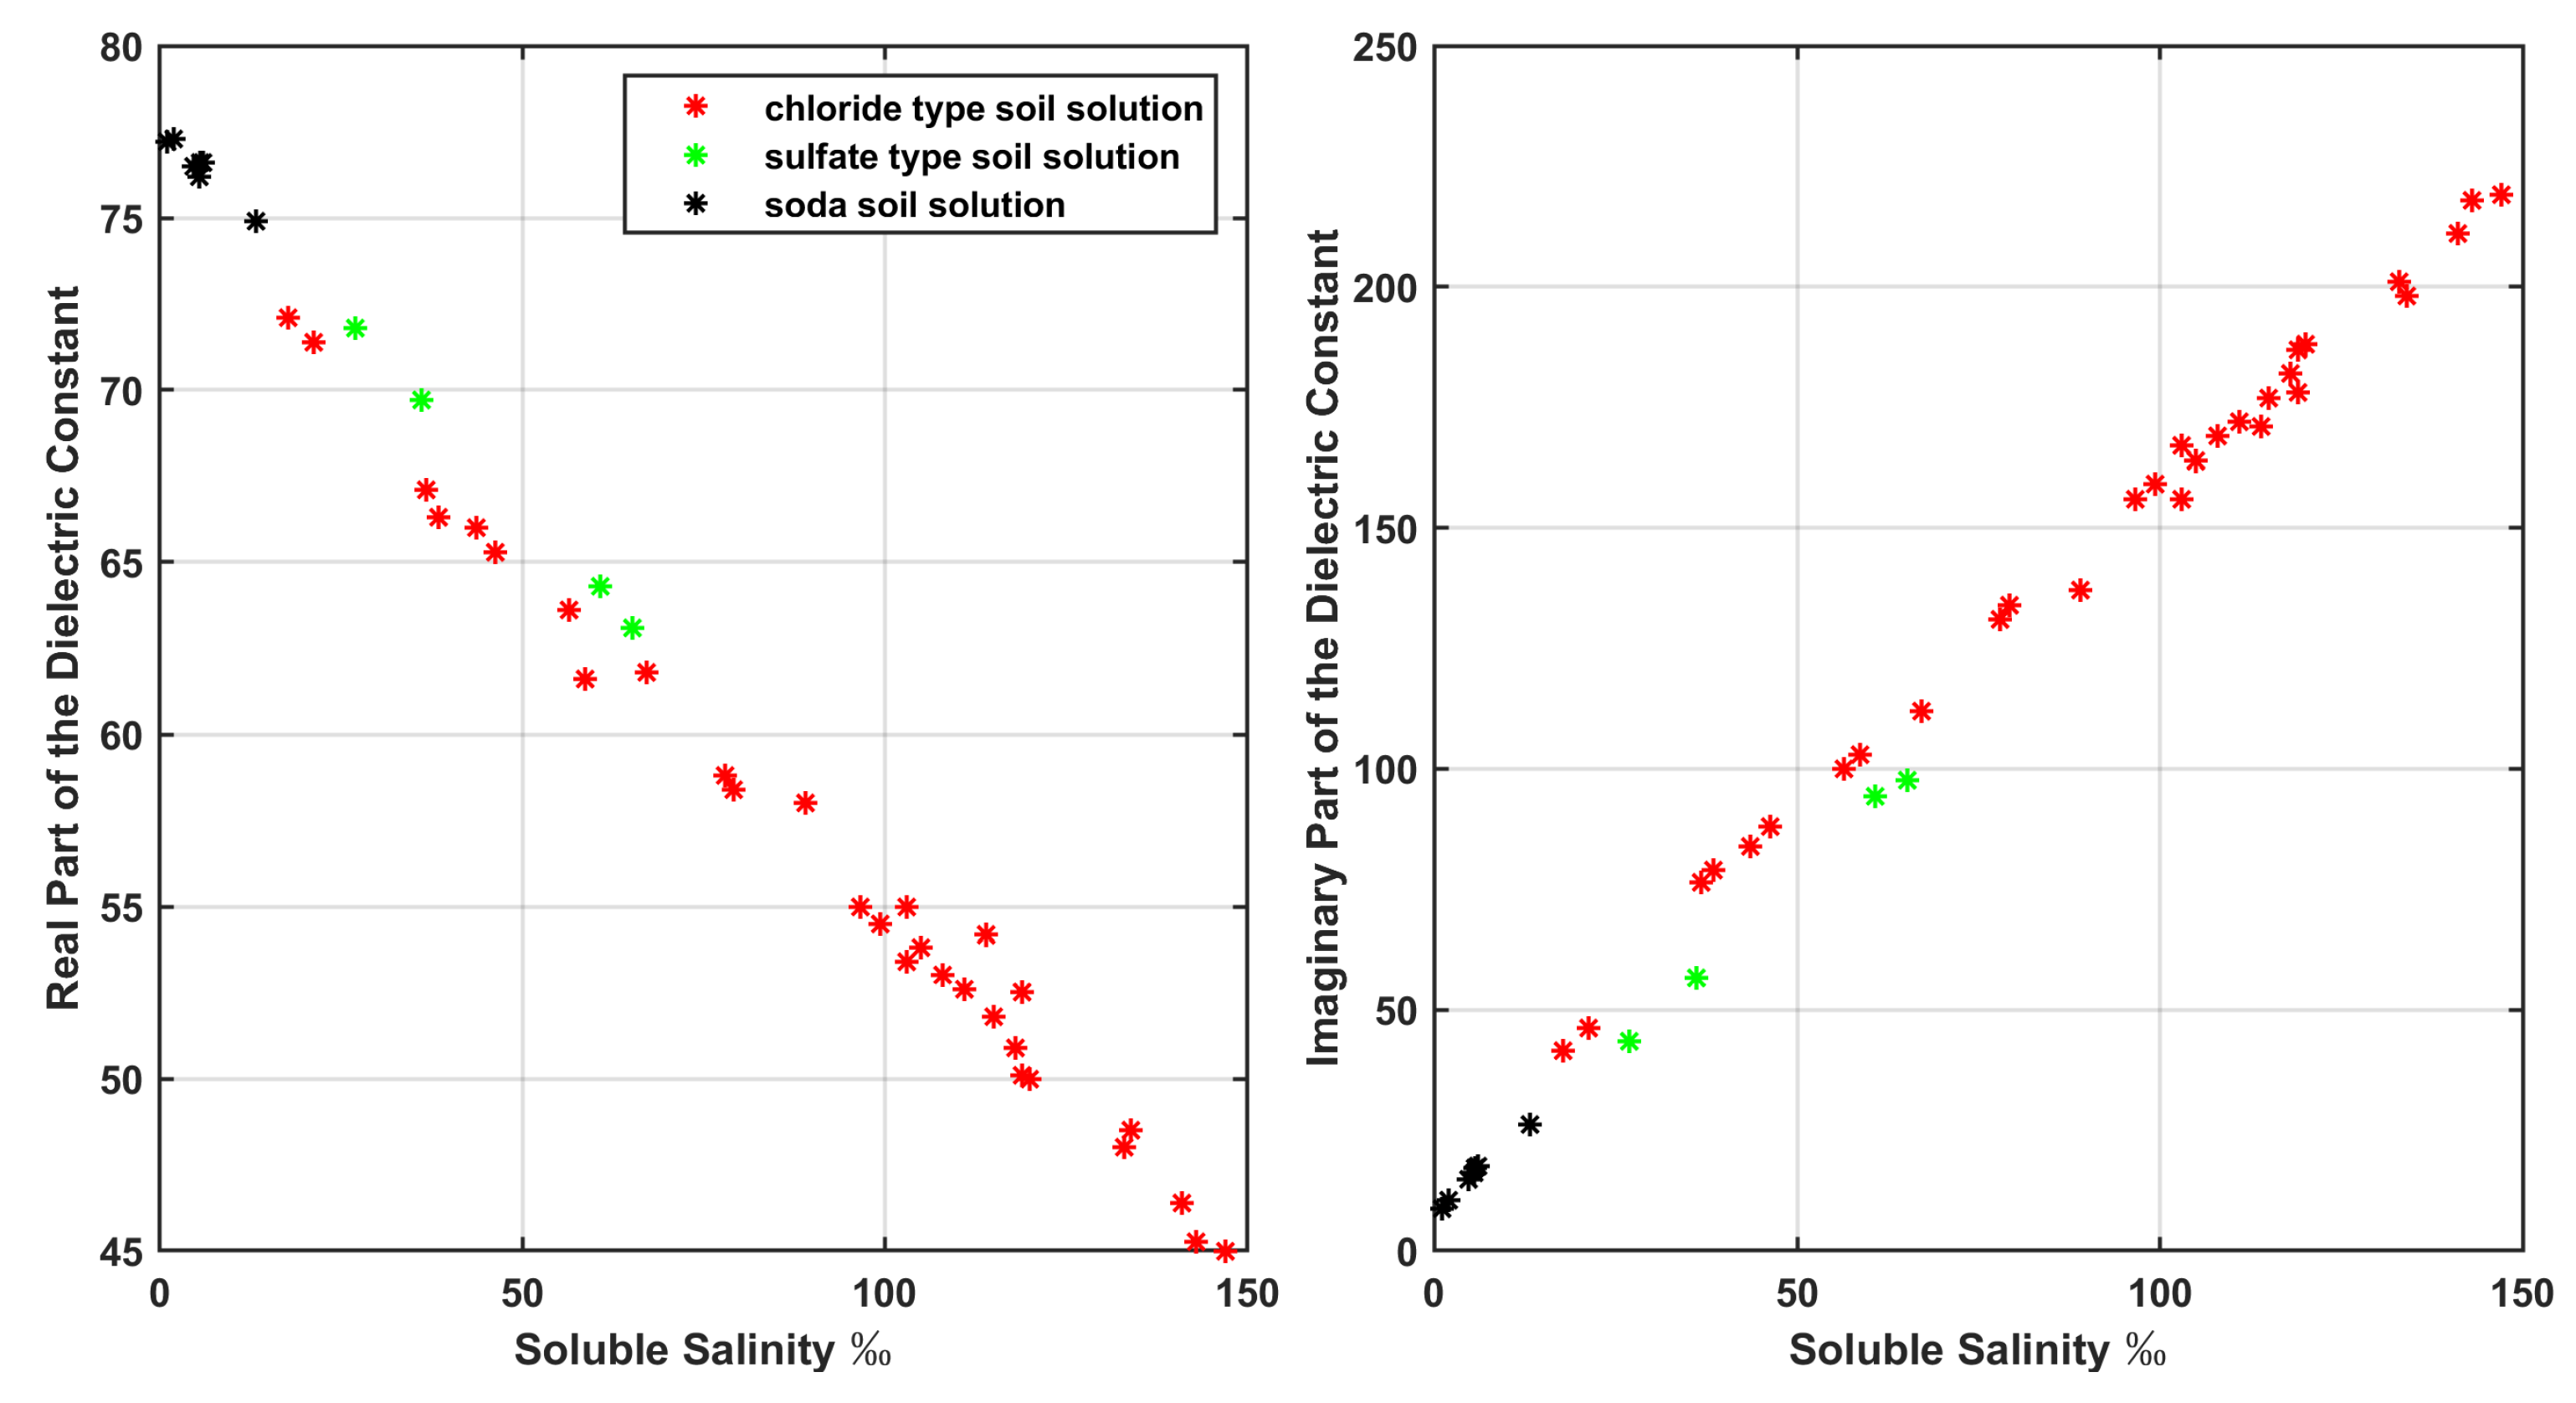
Figure 6 shows the real and imaginary parts of the dielectric constant as a function of the soluble salt content in the soil. The figure simulates the real and imaginary parts of the dielectric constant of the three soil solutions (chloride type soil solution, sulfate type soil solution and soda soil solution). It can be seen from the simulation in the figure that the content of soluble salinity in the soil has a great influence on the dielectric constant. With the increase of soluble salinity, the real part of the dielectric constant decreases and the imaginary part increases.
3.4.2. Difference in Dielectric Constant Caused by Changes in Soil Salinity
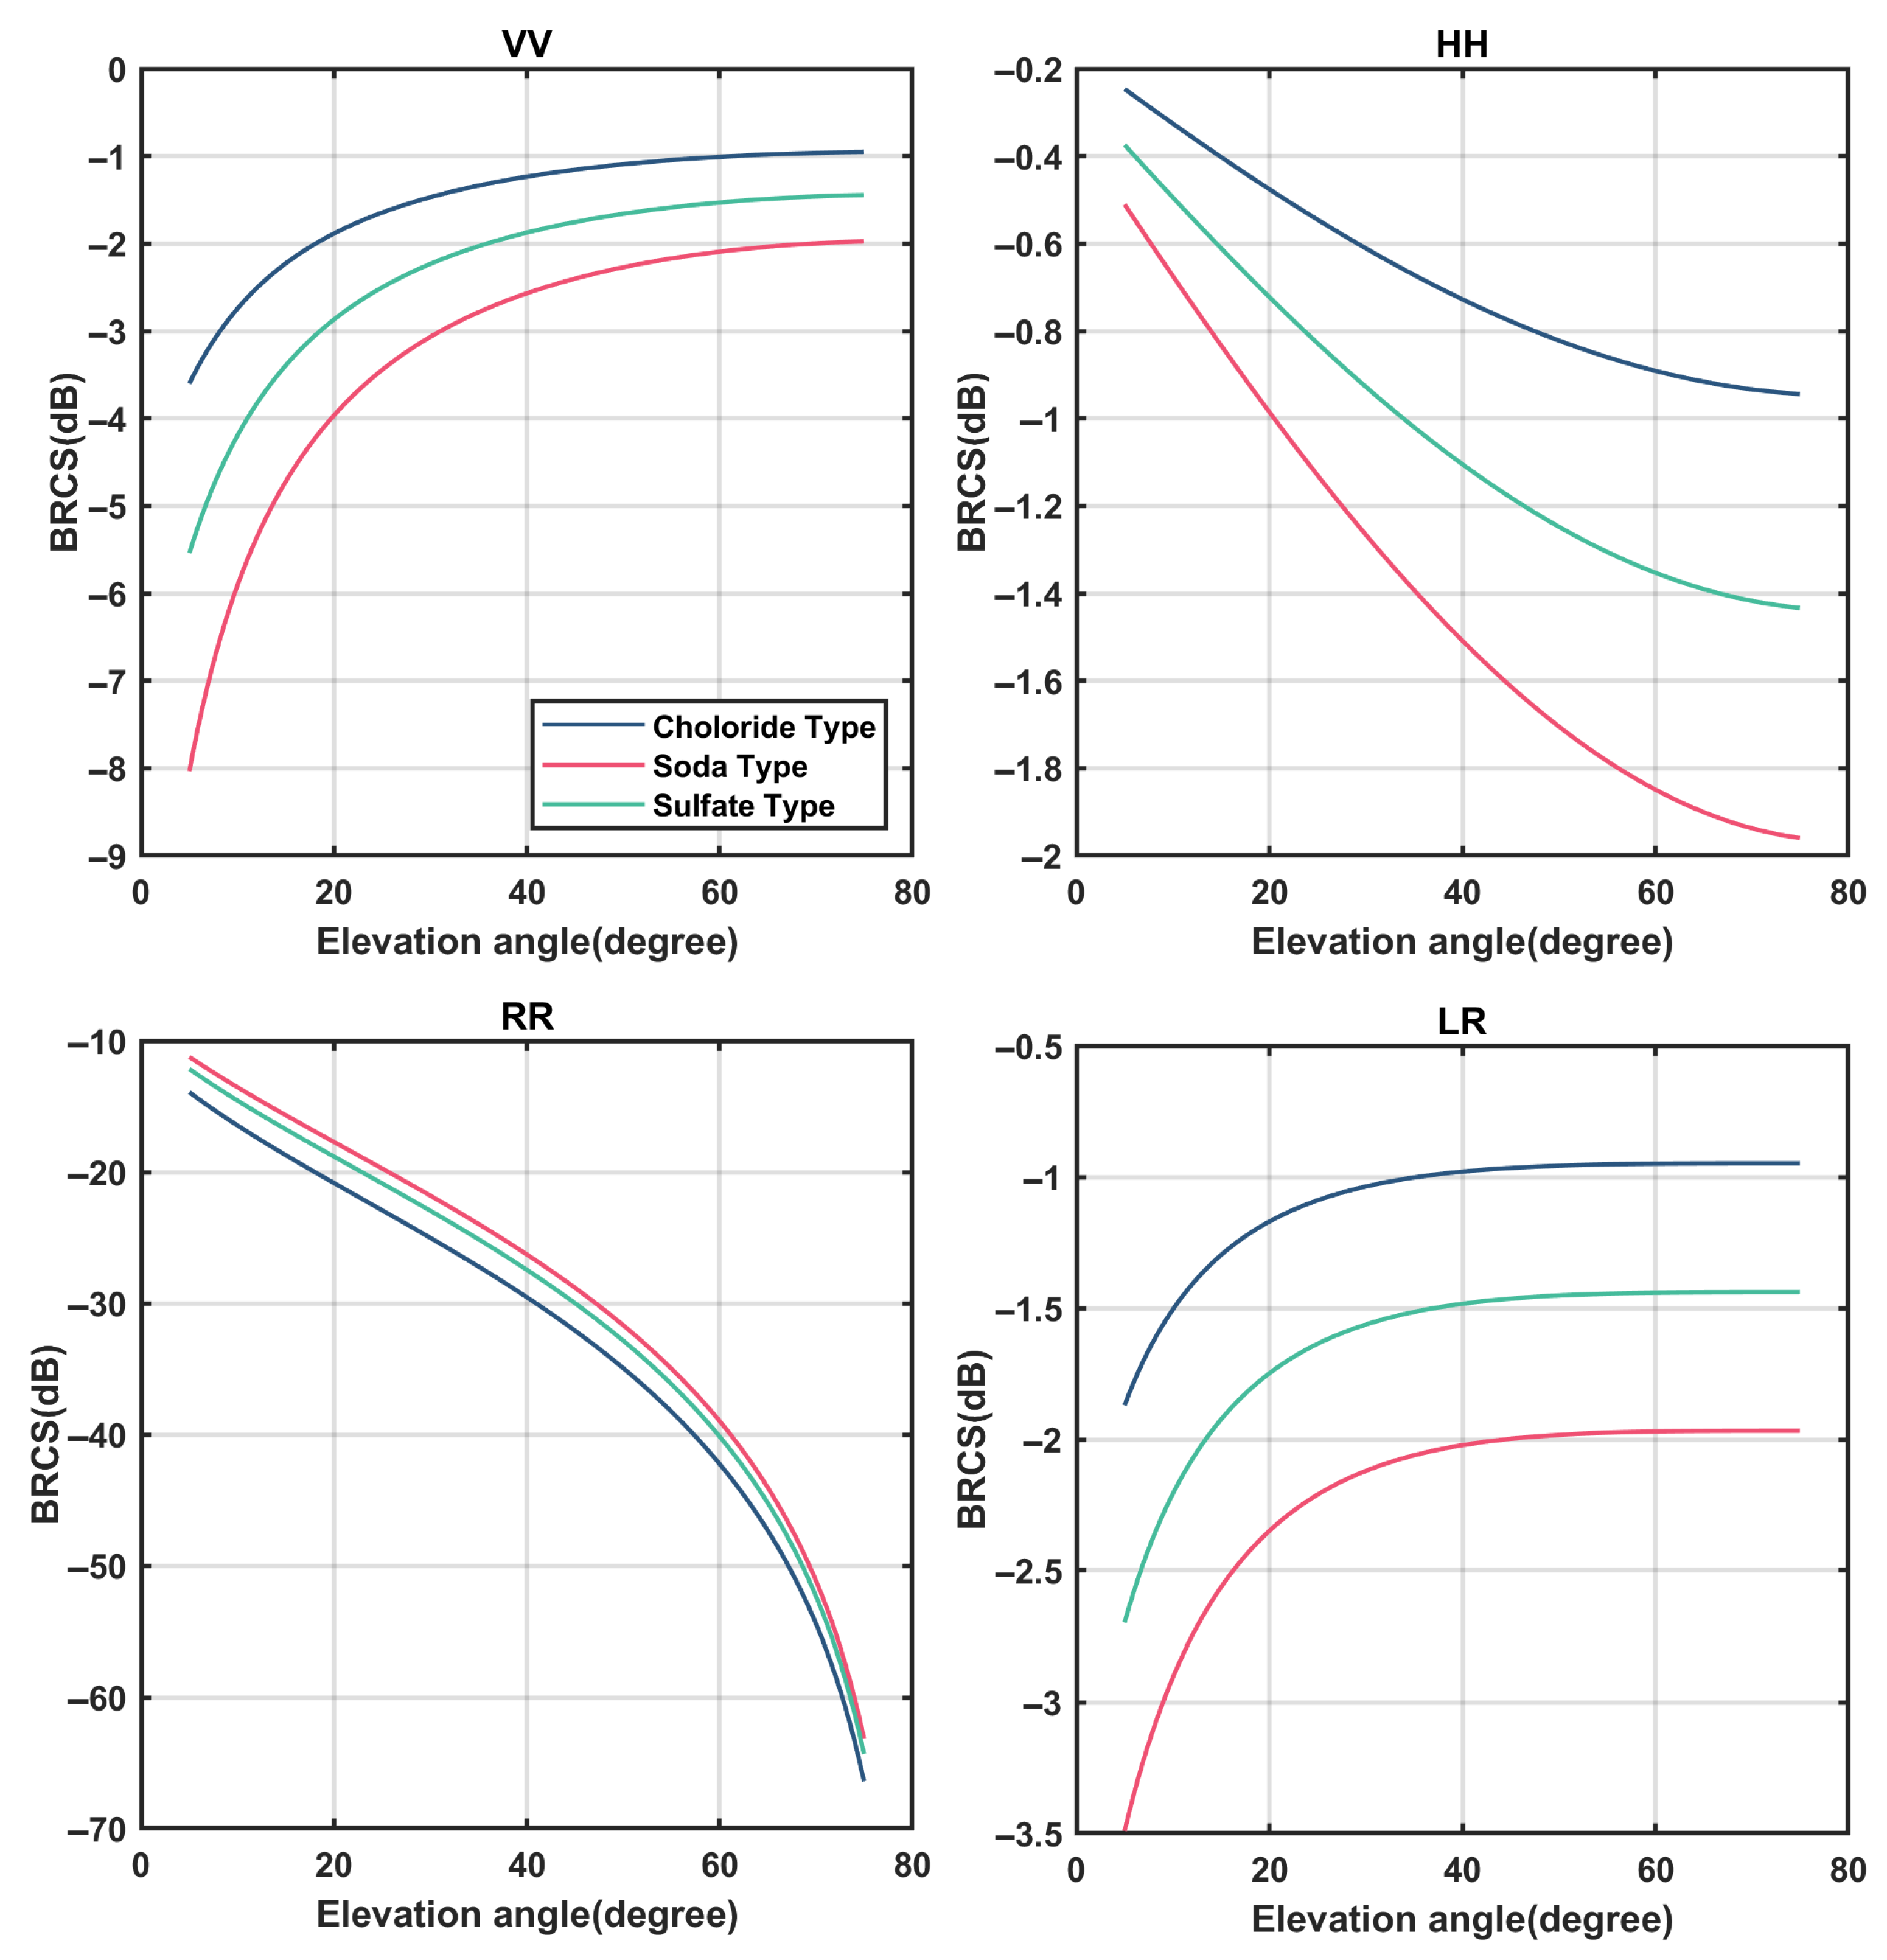
Different salt contents of three solutions are selected as representatives, and the corresponding BRCS changes under different polarizations are simulated in this section. The soluble salinity of chloride type soil solution is 13%, and the corresponding dielectric constant is 48.0 + 201i; the soluble salinity of sulfide-type soil solution is 60.8%, and the corresponding dielectric constant is 64.8 + 93.3i; the soluble salinity of soda soil solution is 4.65%, and the corresponding dielectric constant is 76.5 + 14.8i.
In Figure 7, the salinity of the three typical soil solutions varies greatly, the salinity gradually decreases, and the real and imaginary parts of the corresponding dielectric constants gradually decrease. It can be seen from the simulation in Figure 8 that the lower the salt content, the lower the BRCS for various polarizations. BRCS increases with the elevation angle at VV and LR polarizations, BRCS at HH and RR polarization decreases when the elevation angle increases.
3.4.3. Changes in Multipath Observations
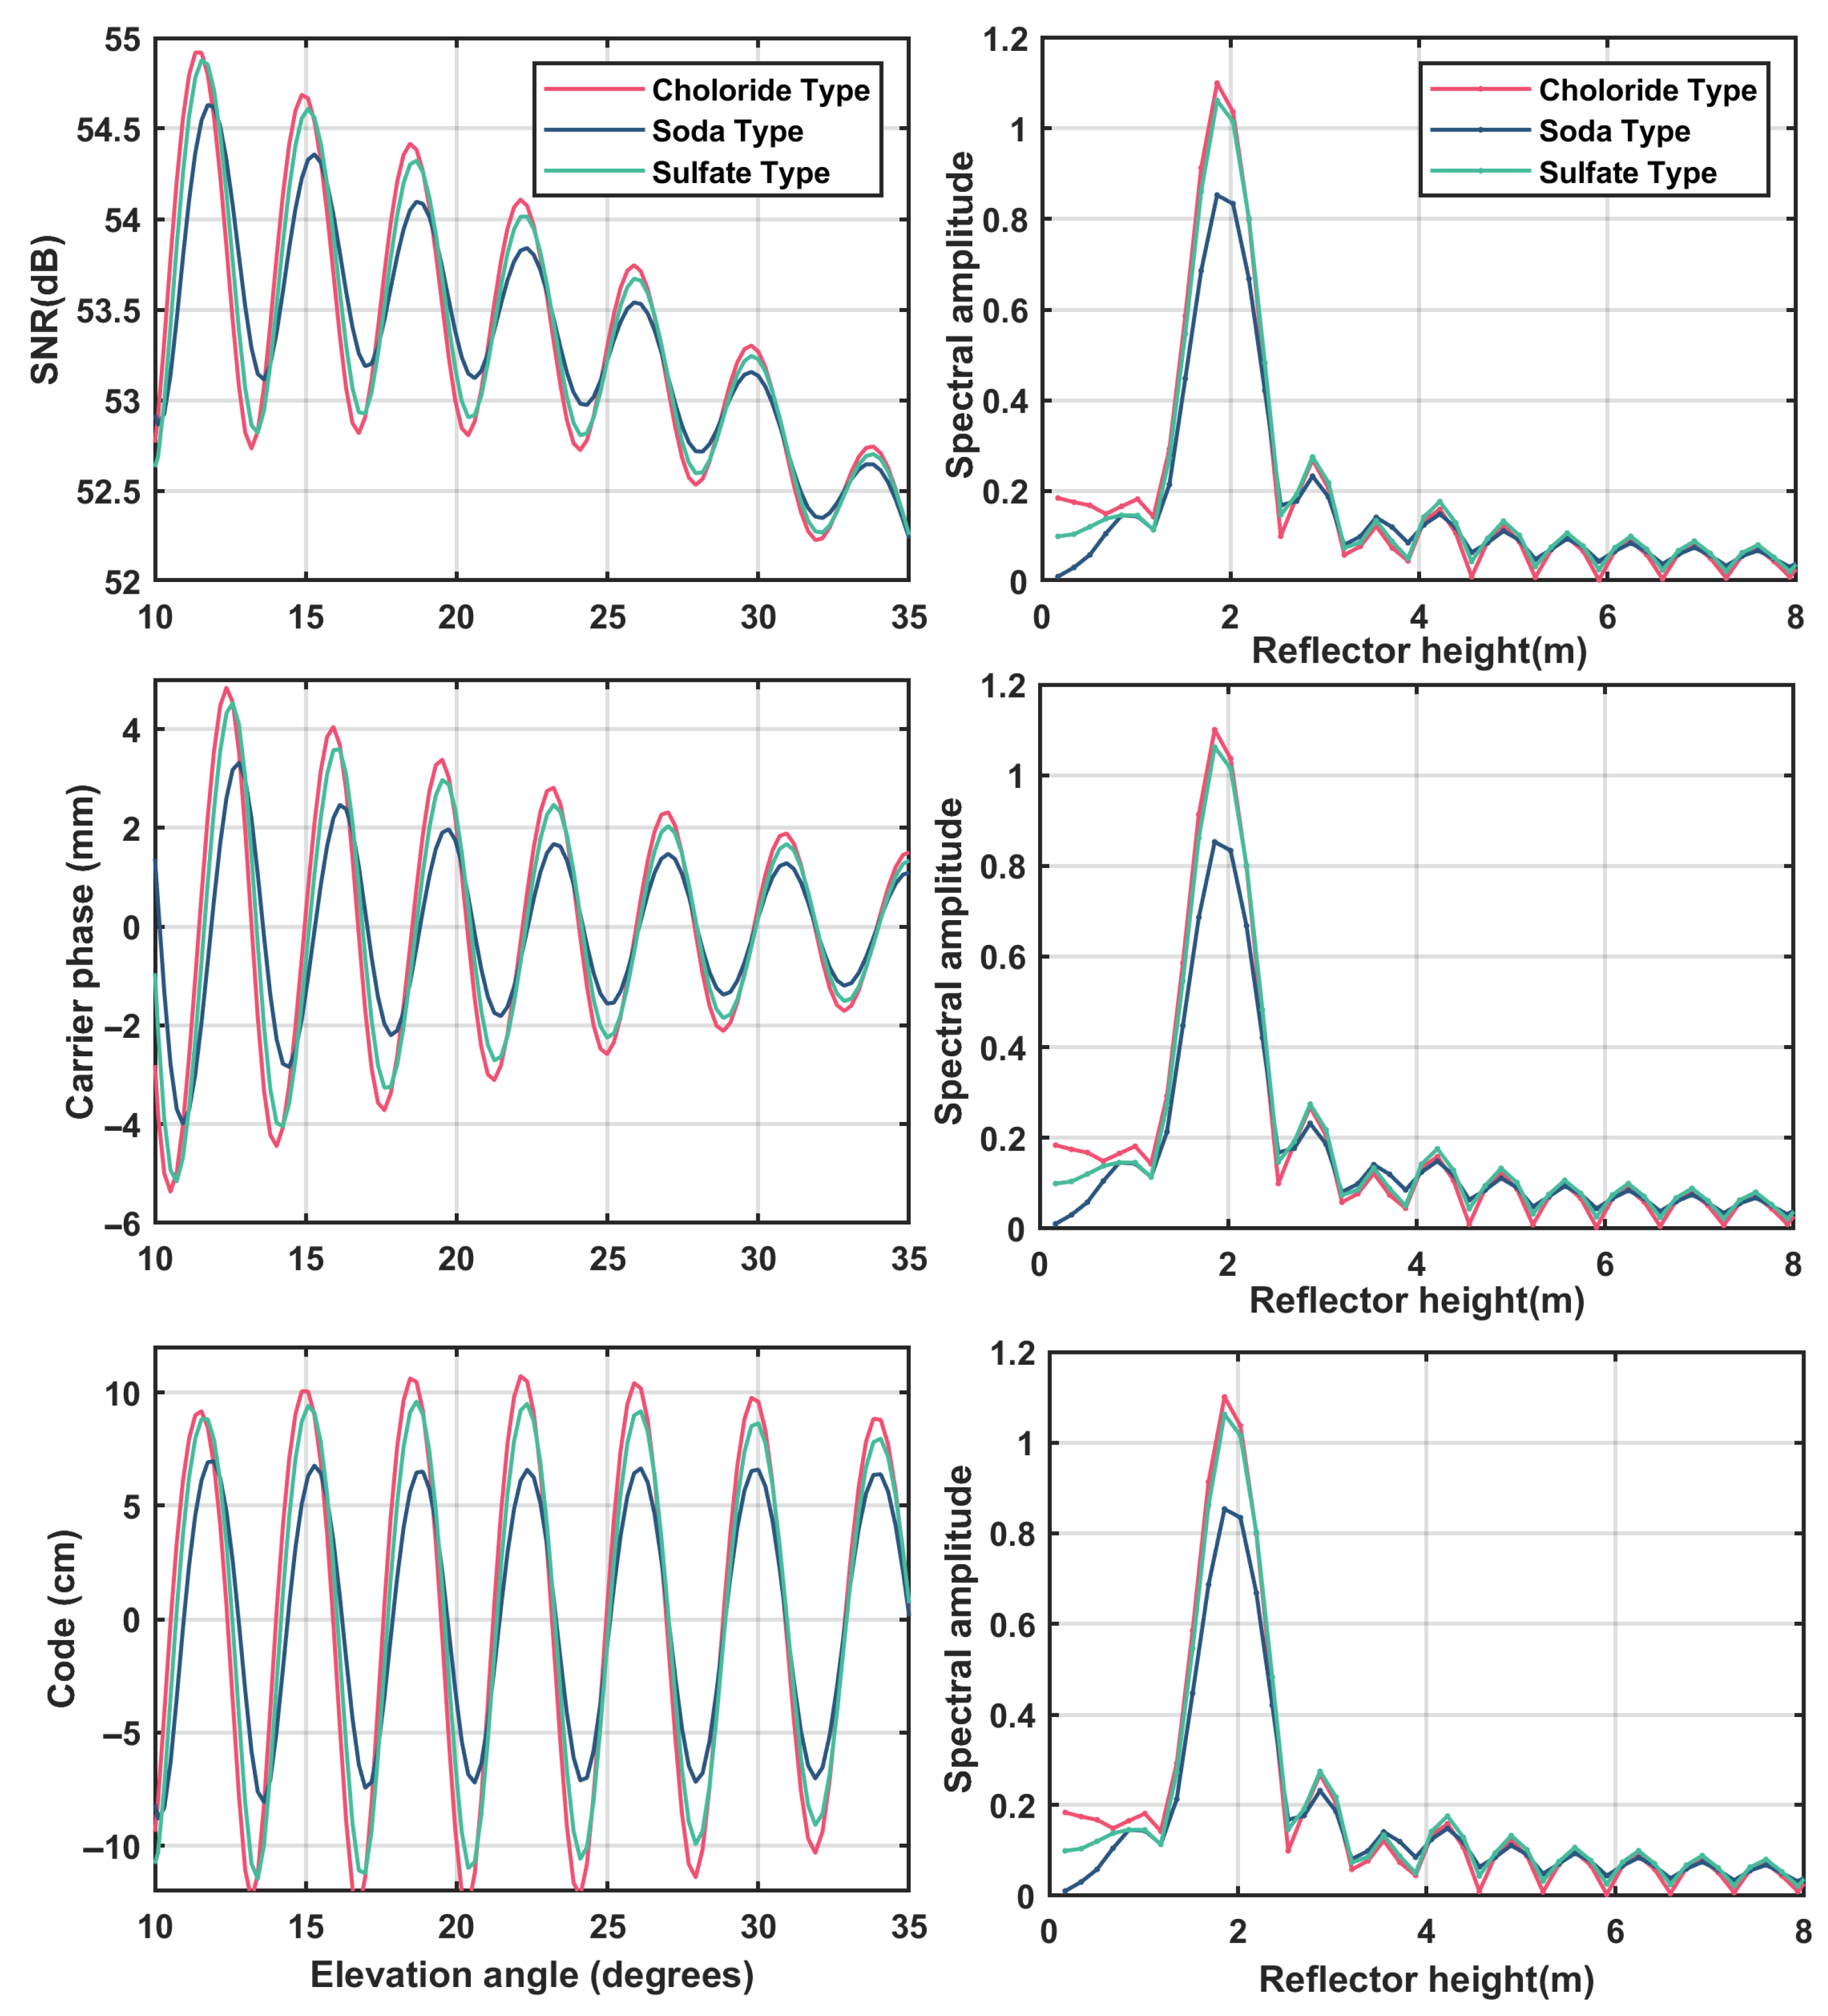
This section simulates the relationship between the GNSS multipath observations (SNR, phase, and pseudorange) and the effective reflectometer height for three different salty soil solutions.
It can be seen from Figure 8 that changes in the salt content in the soil solution will cause changes in multipath observation and effective reflectometer height. The higher the soil salt content, the higher the effective reflectometer height. This is because the increase in the salt content in the soil will lead to an increase in the dielectric constant (Figure 7), which corresponds to an increase in the BRCS (Figure 8). The combined effect of these factors results from the increase of GNSS multipath observation and effective reflectometer height amplitude (Figure 9).
3.5. Changes in BRCS and GNSS Multipath Observations Due to Snow Cover
This section simulates the changes in the corresponding BRCS and the resulting GNSS multipath observations when the frozen surface is covered with snow and the melting surface is not covered with snow.
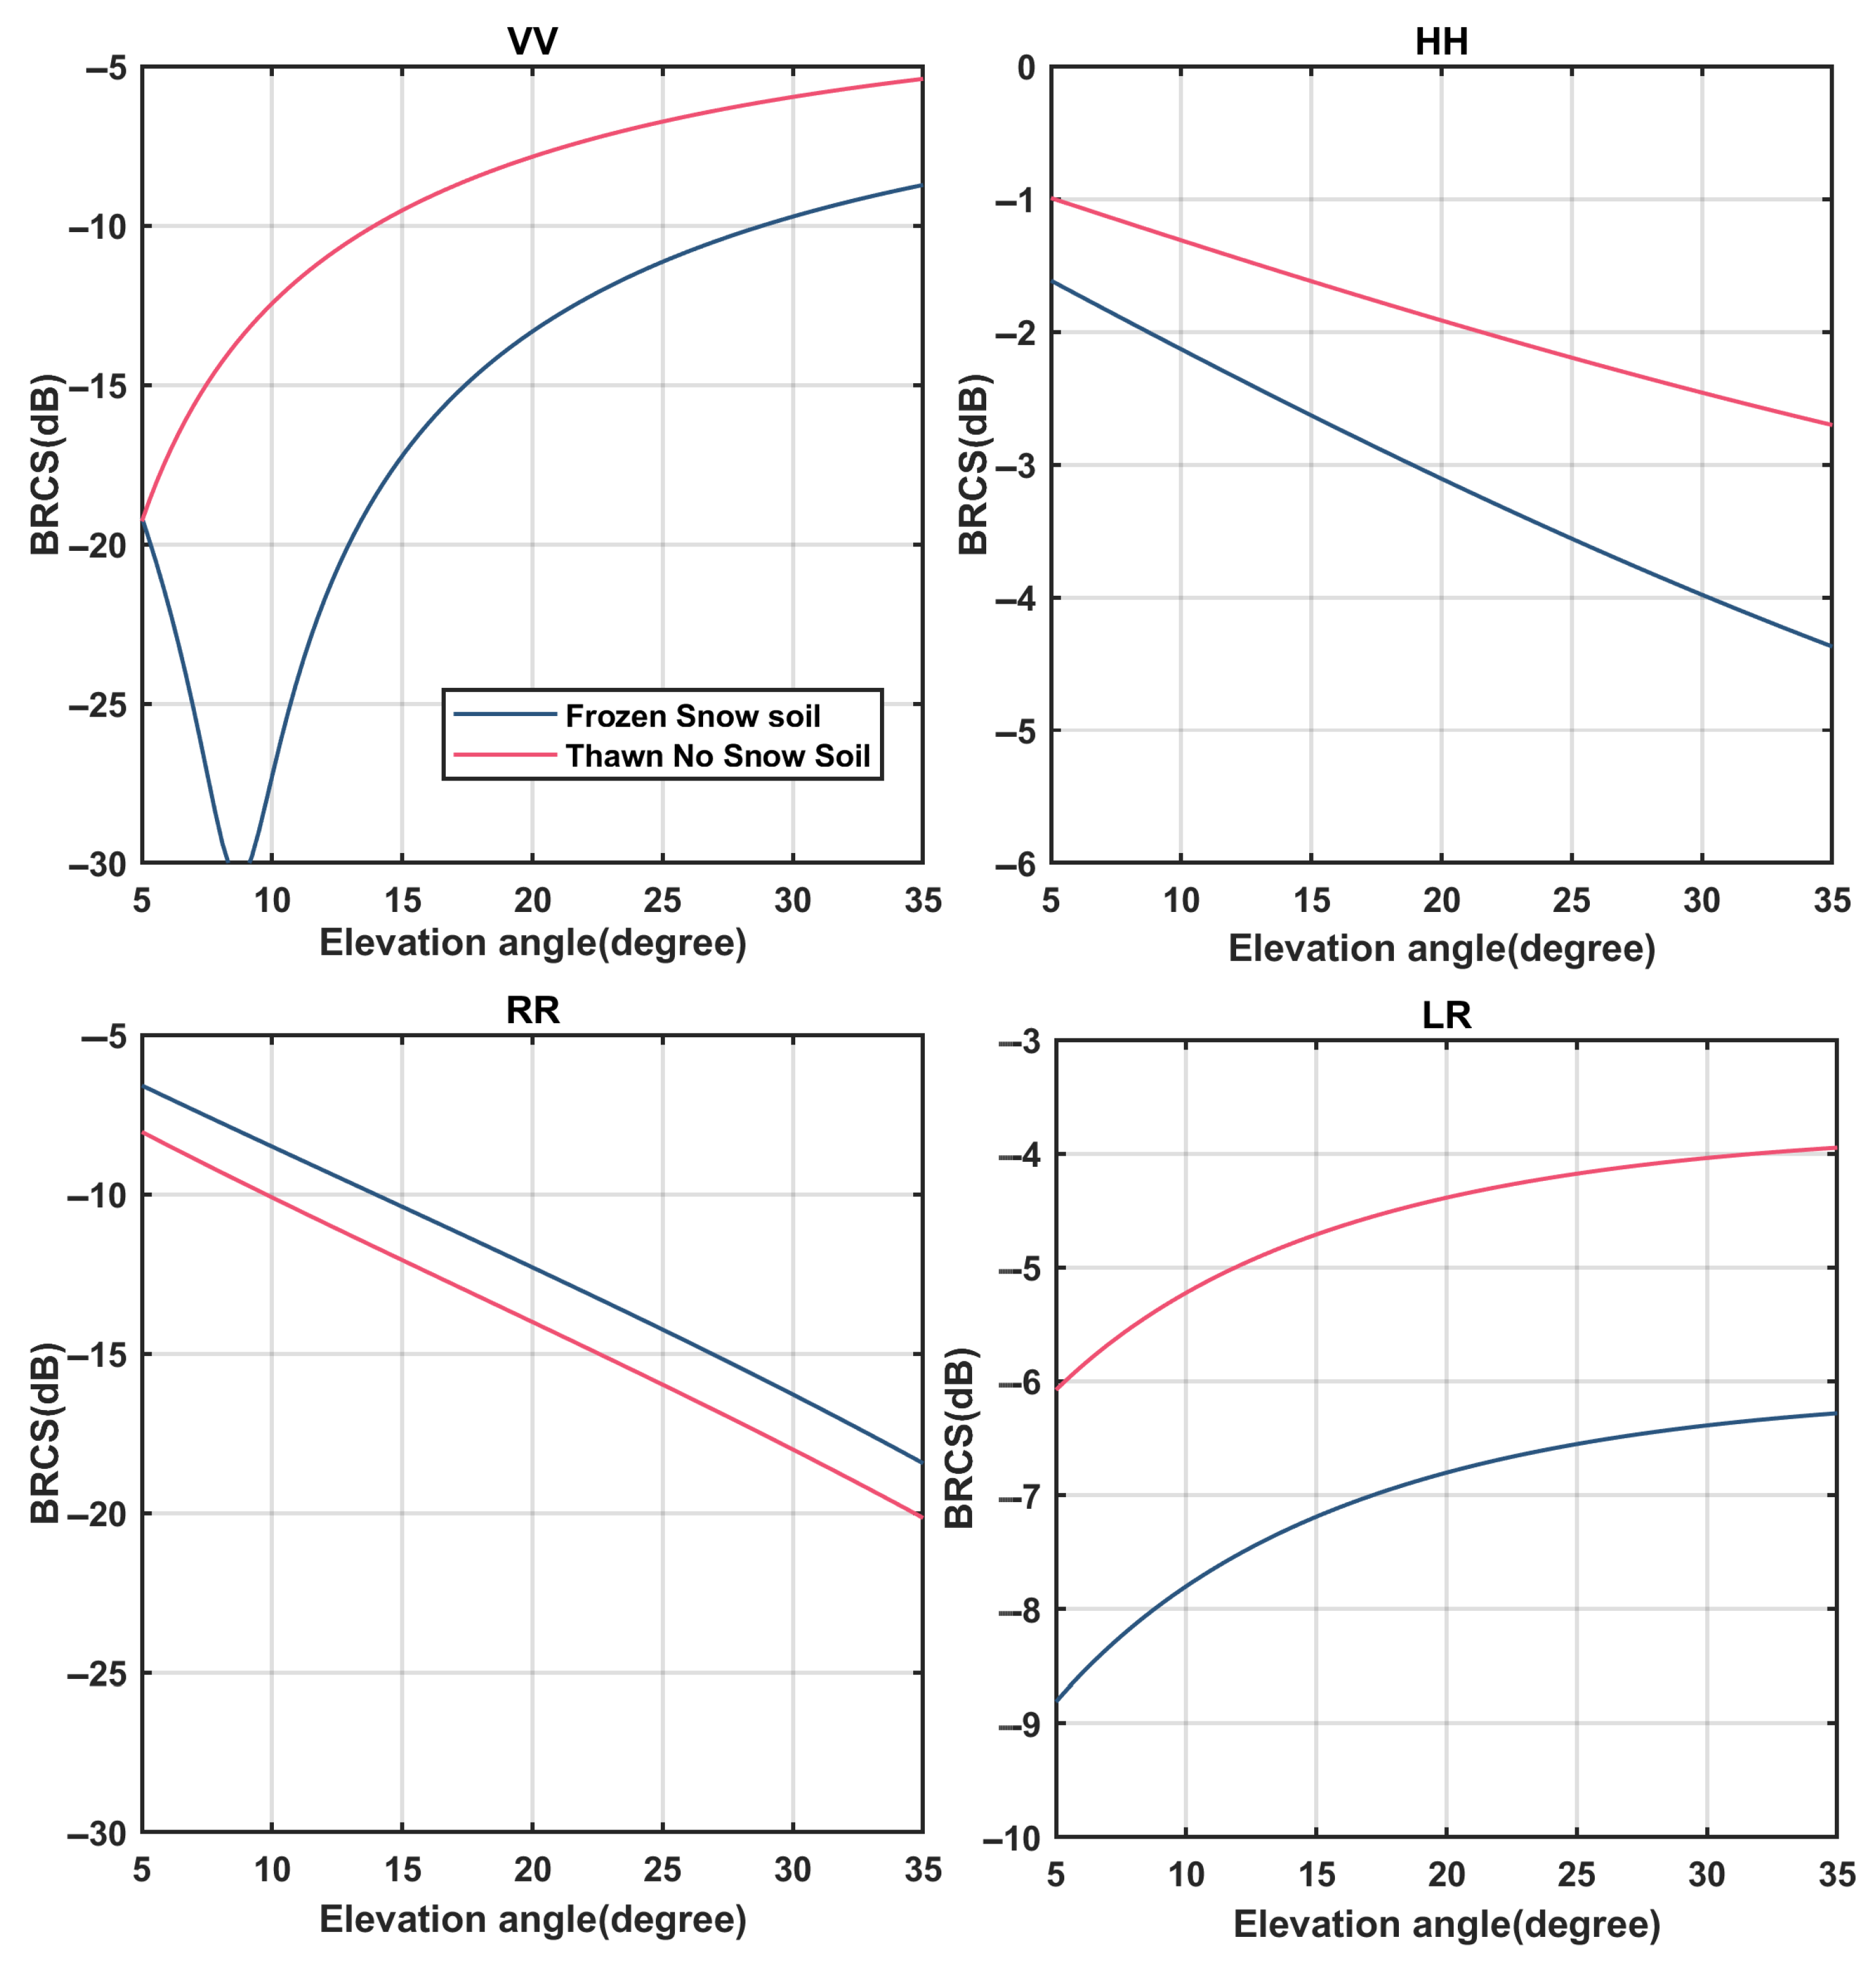
As can be seen from the simulation in Figure 9, when the frozen surface is covered with snow and the melted surface is not covered with snow, BRCS will have significant changes. Generally speaking, when the surface of the ground is covered with snow, it will cause the BRCS to decrease. This is because, on the one hand, the phase of the water in the soil changes, and on the other hand, the snow layer has an attenuation effect on the GNSS signal. The BRCS has a groove at the Brewster angle of the VV polarization. After that, as the elevation angle increases, the BRCS increases, the LR polarization increases with the elevation angle, and the BRCS at HH polarization and RR polarization decreases with the elevation angle increase.
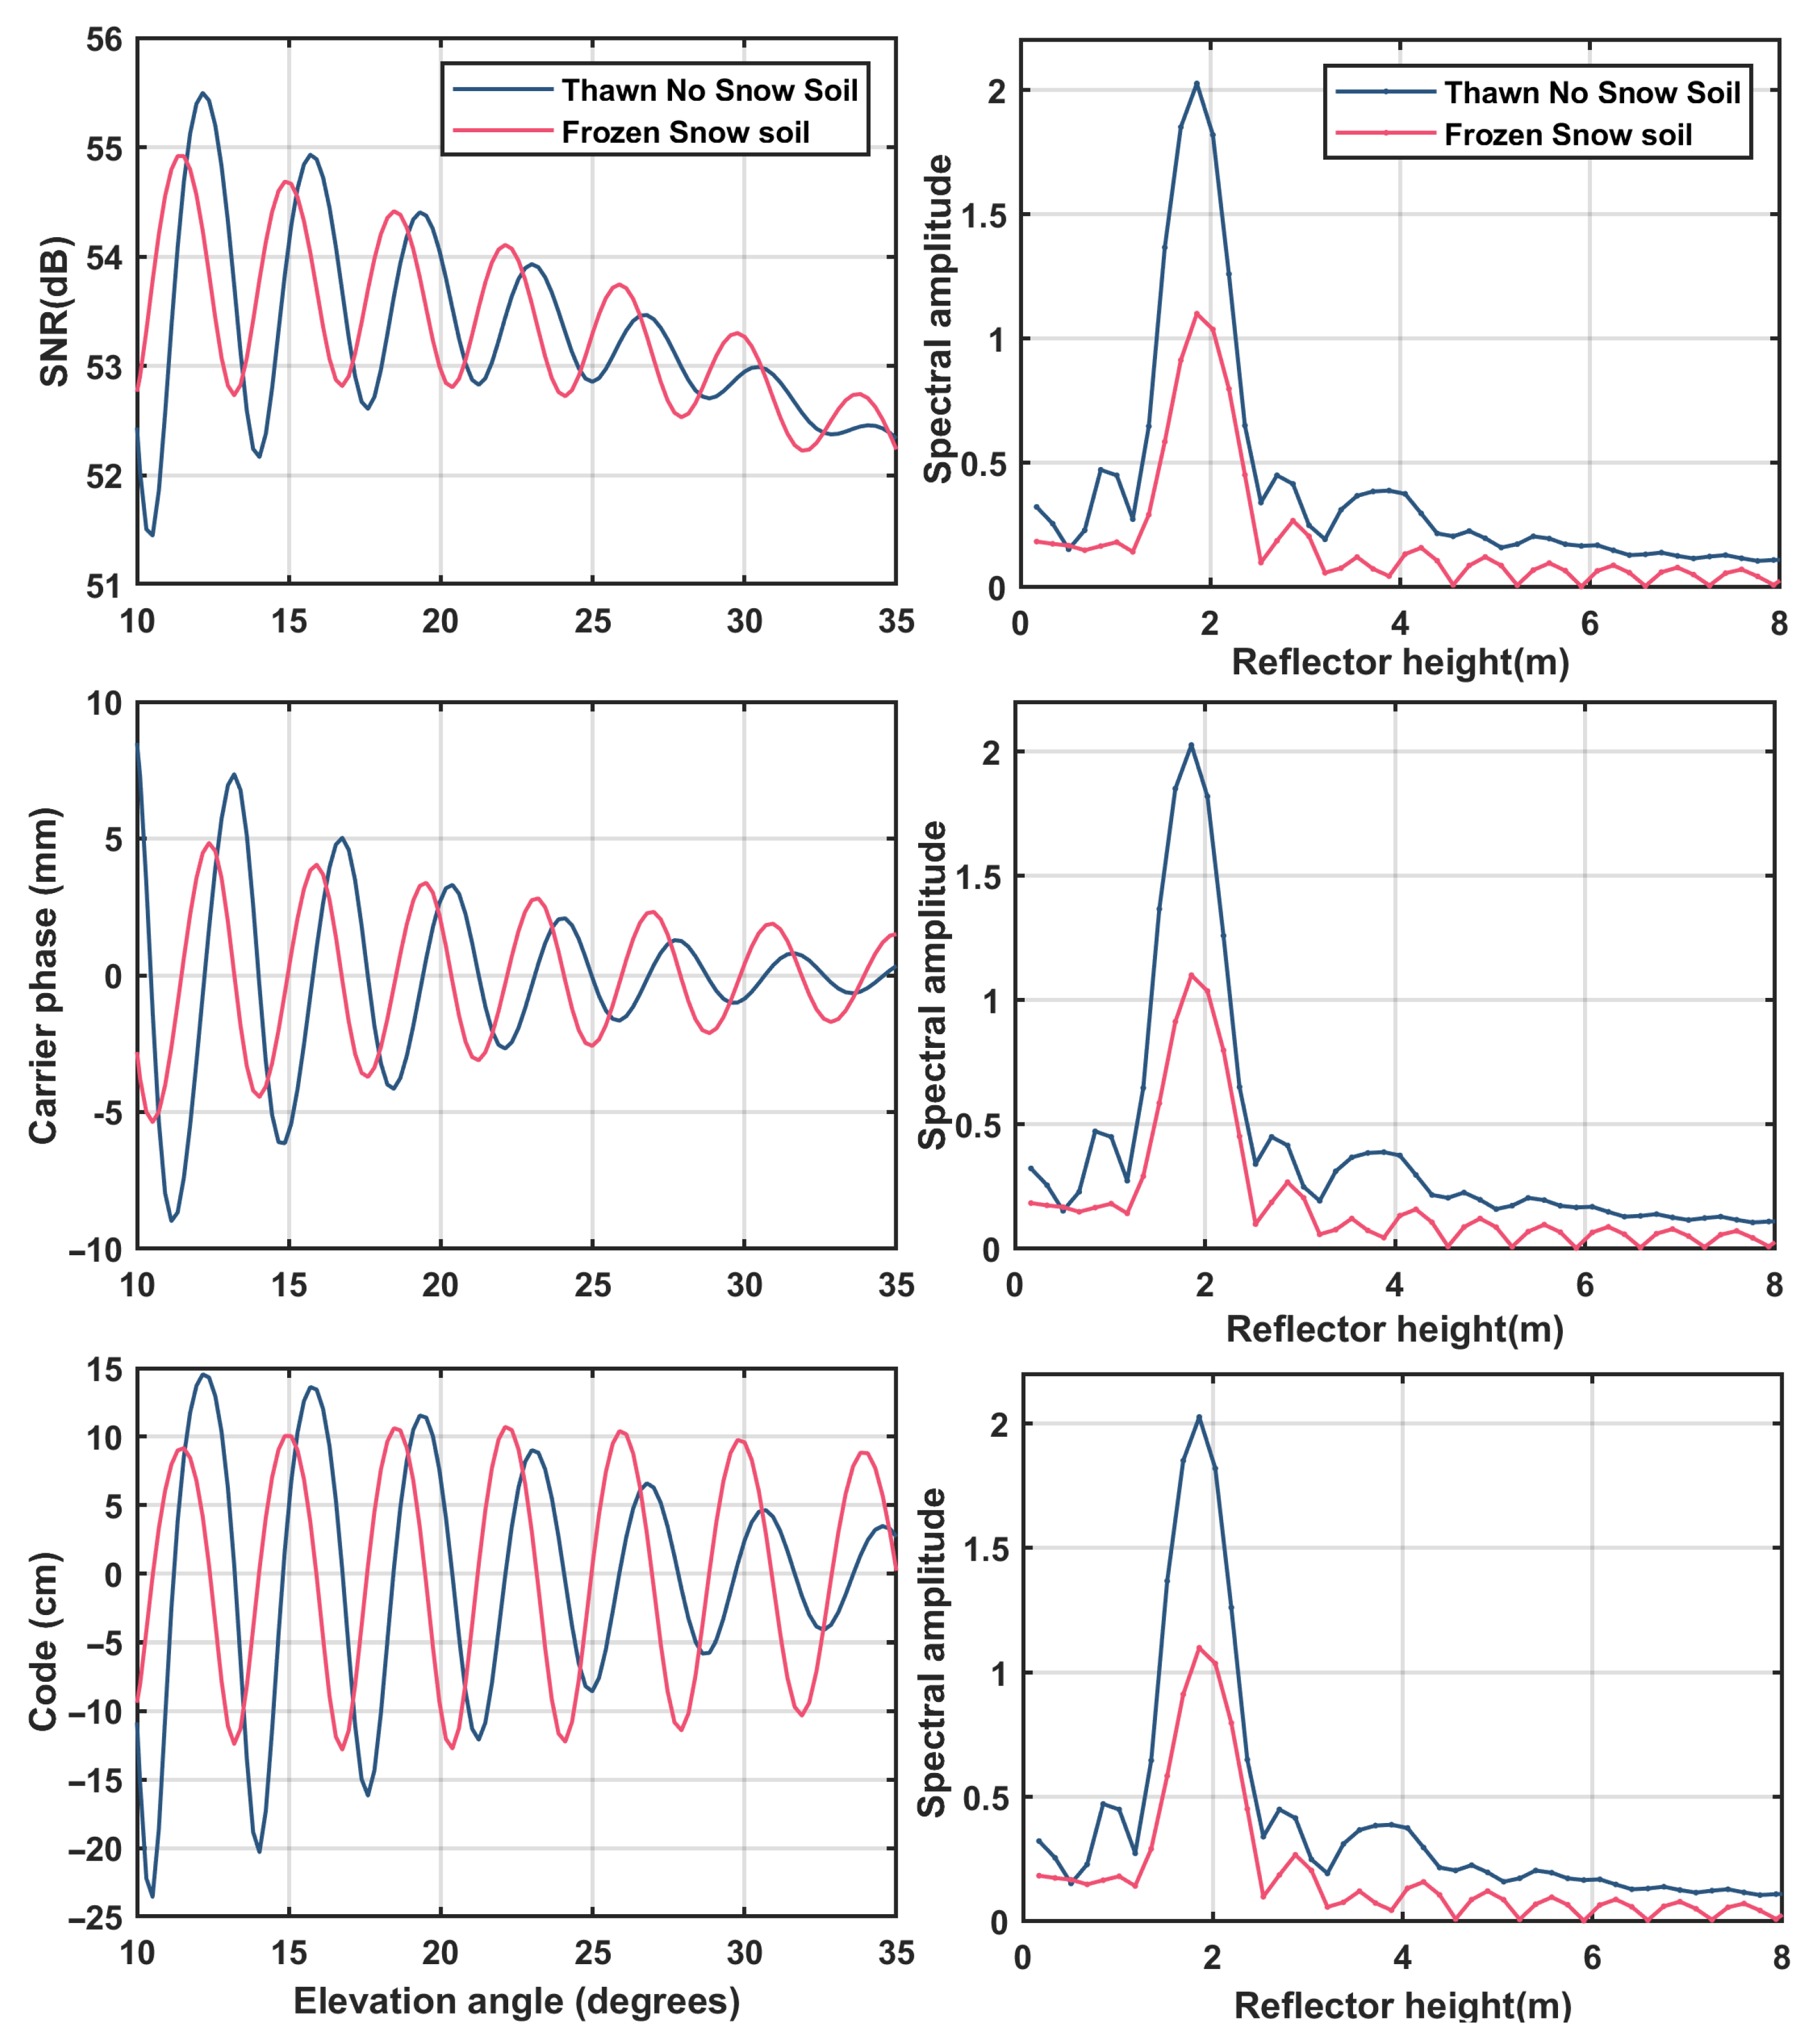
Figure 10 simulates the changes in GNSS multipath observations and effective reflectometer height when the frozen surface is covered with snow and the melted surface is not covered with snow. From the simulation in the figure, it can be seen that when the frozen surface is covered with snow, due to the change of the water phase and the attenuation of the snow layer, the BRCS will be reduced (Figure 9), so the corresponding amplitudes of GNSS multipath observation and effective reflectometer height decrease.
3.6. Changes in BRCS and GNSS Multipath Observations Caused by Vegetation Cover
This section simulates the changes in BRCS and multipath observations with and without vegetation cover.
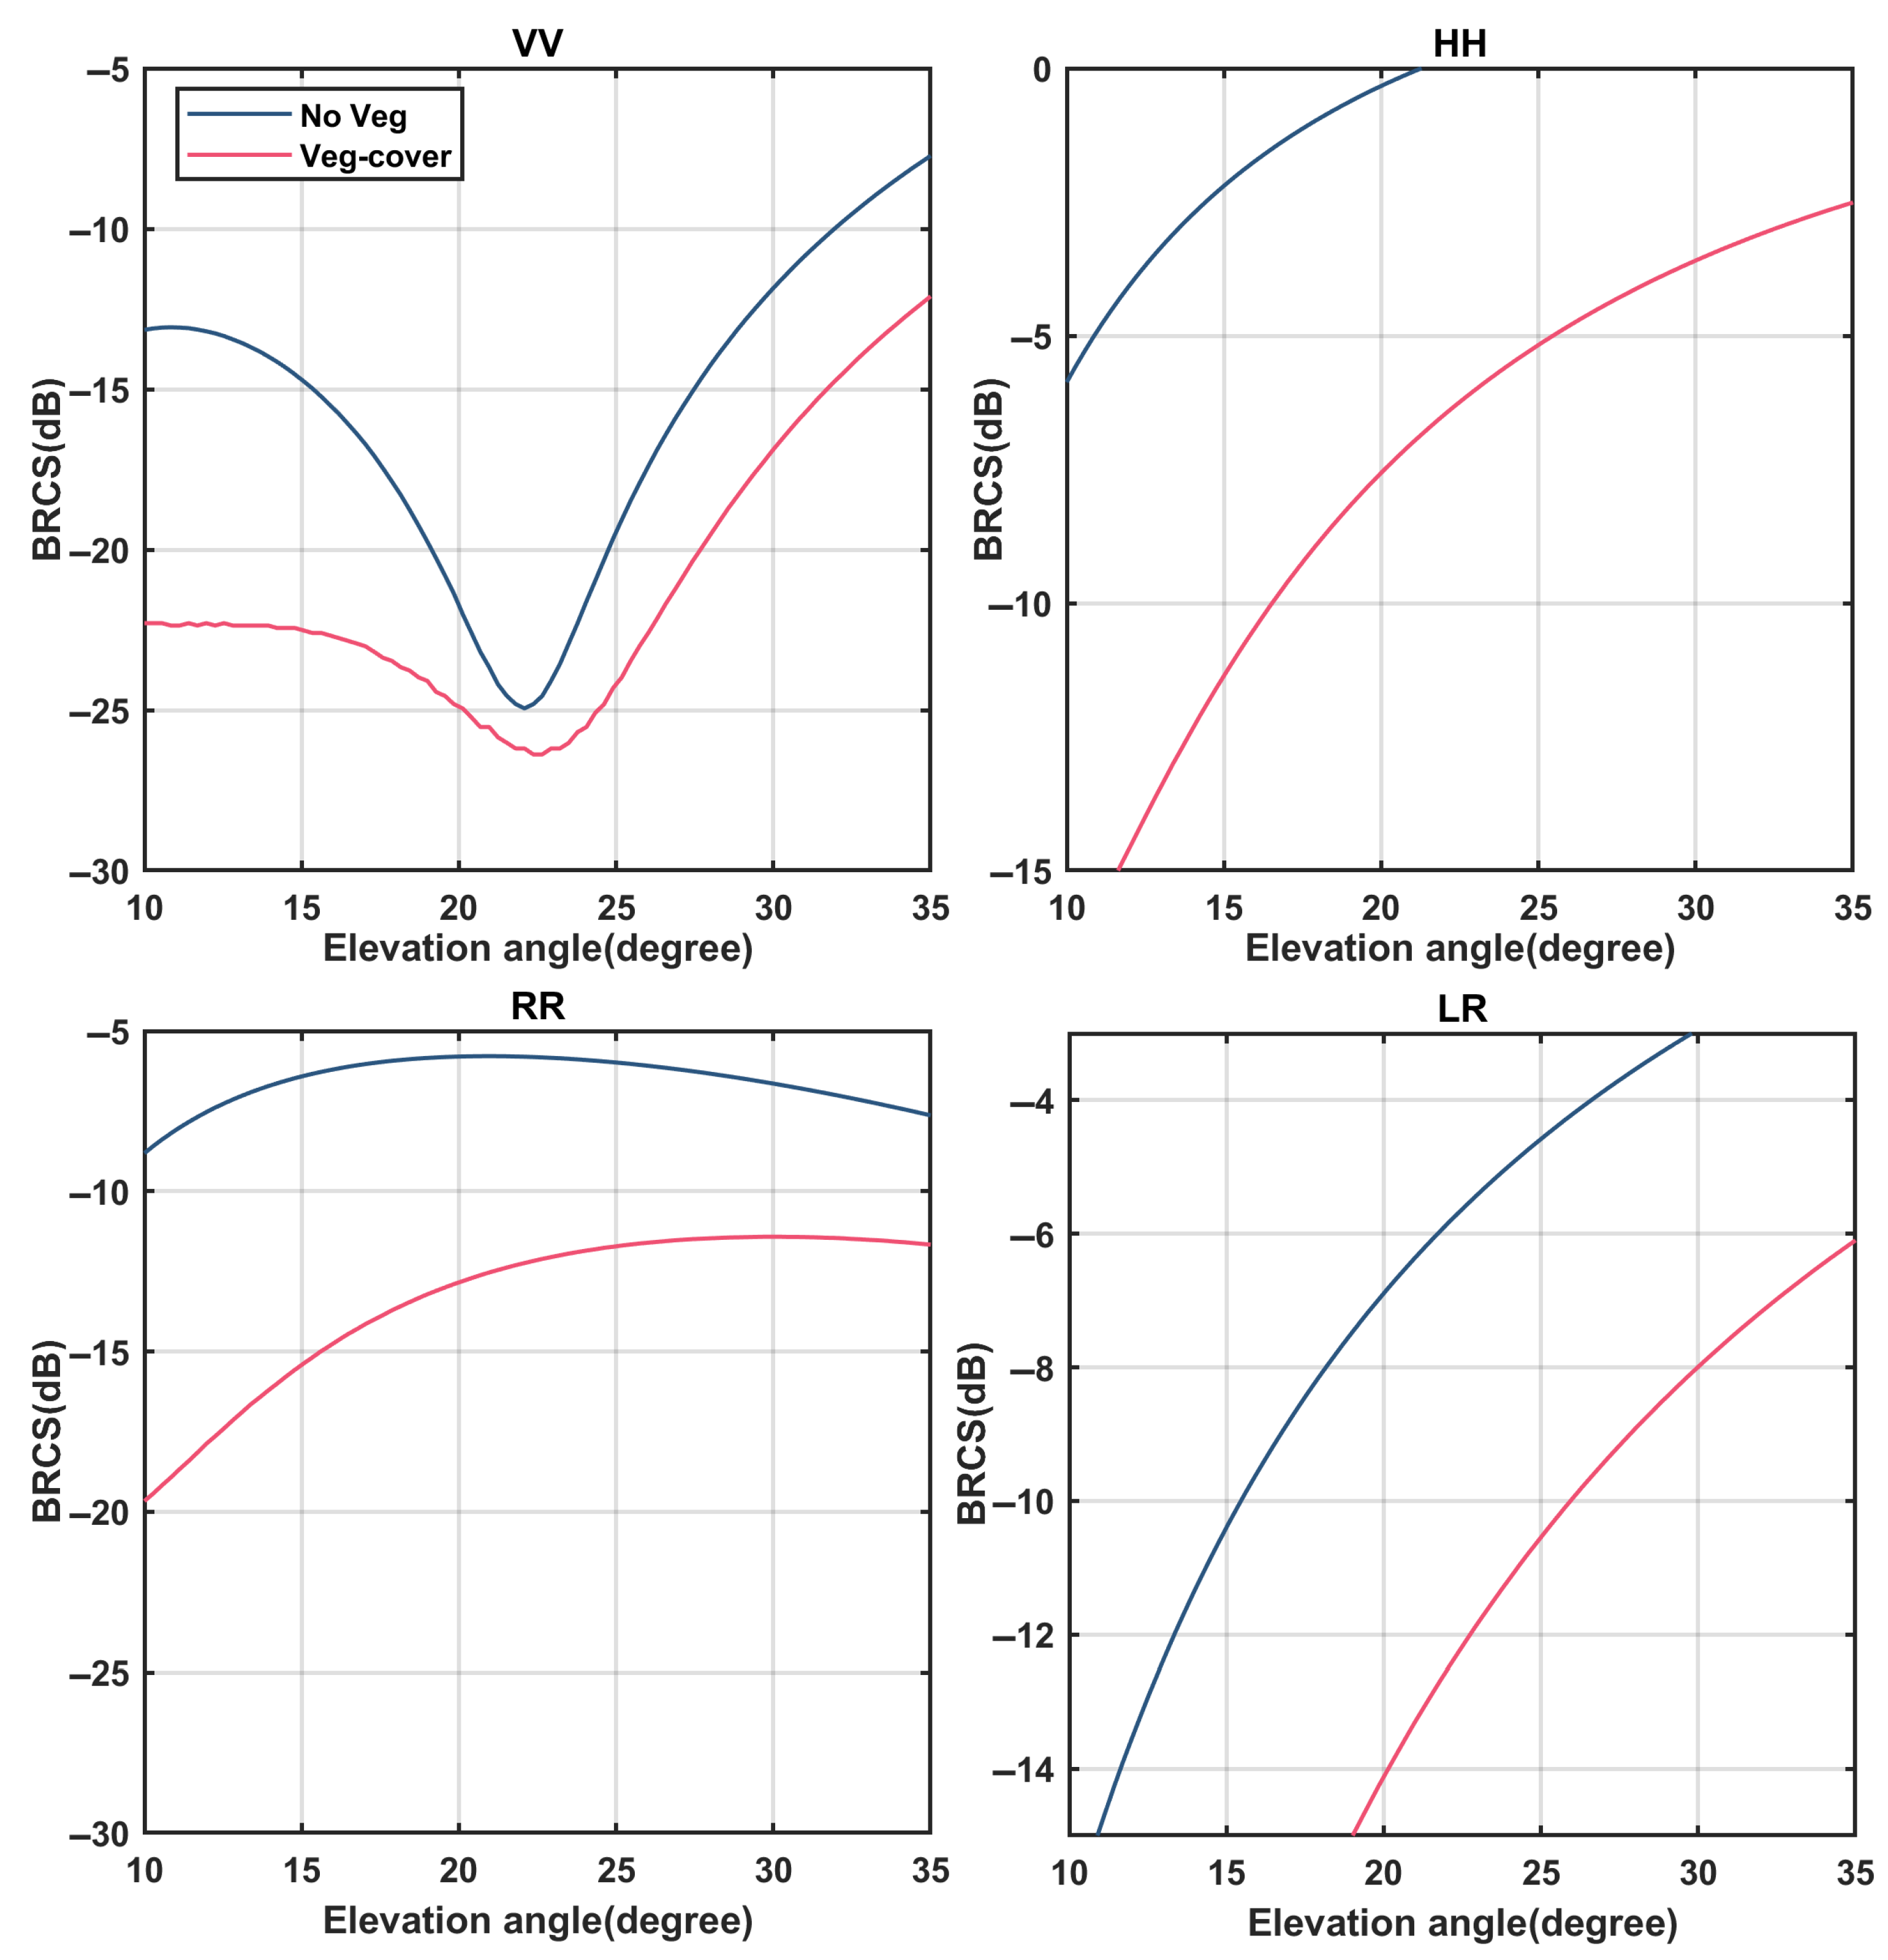
Figure 11 shows the relationship between the BRCS and elevation angle where there is vegetation cover under various polarizations. From the simulation in the figure, it can be seen that within a given elevation angle range, for VV polarization, there are scattering grooves. At the angle before the groove, BRCS decreases with the increase of the elevation angle, but for the angle after the groove, BRCS increases as the elevation angle increases. For HH polarization, RR polarization and LR polarization, as the elevation angle increases, BRCS increases. The attenuation of the vegetation layer causes the BRCS to decrease.
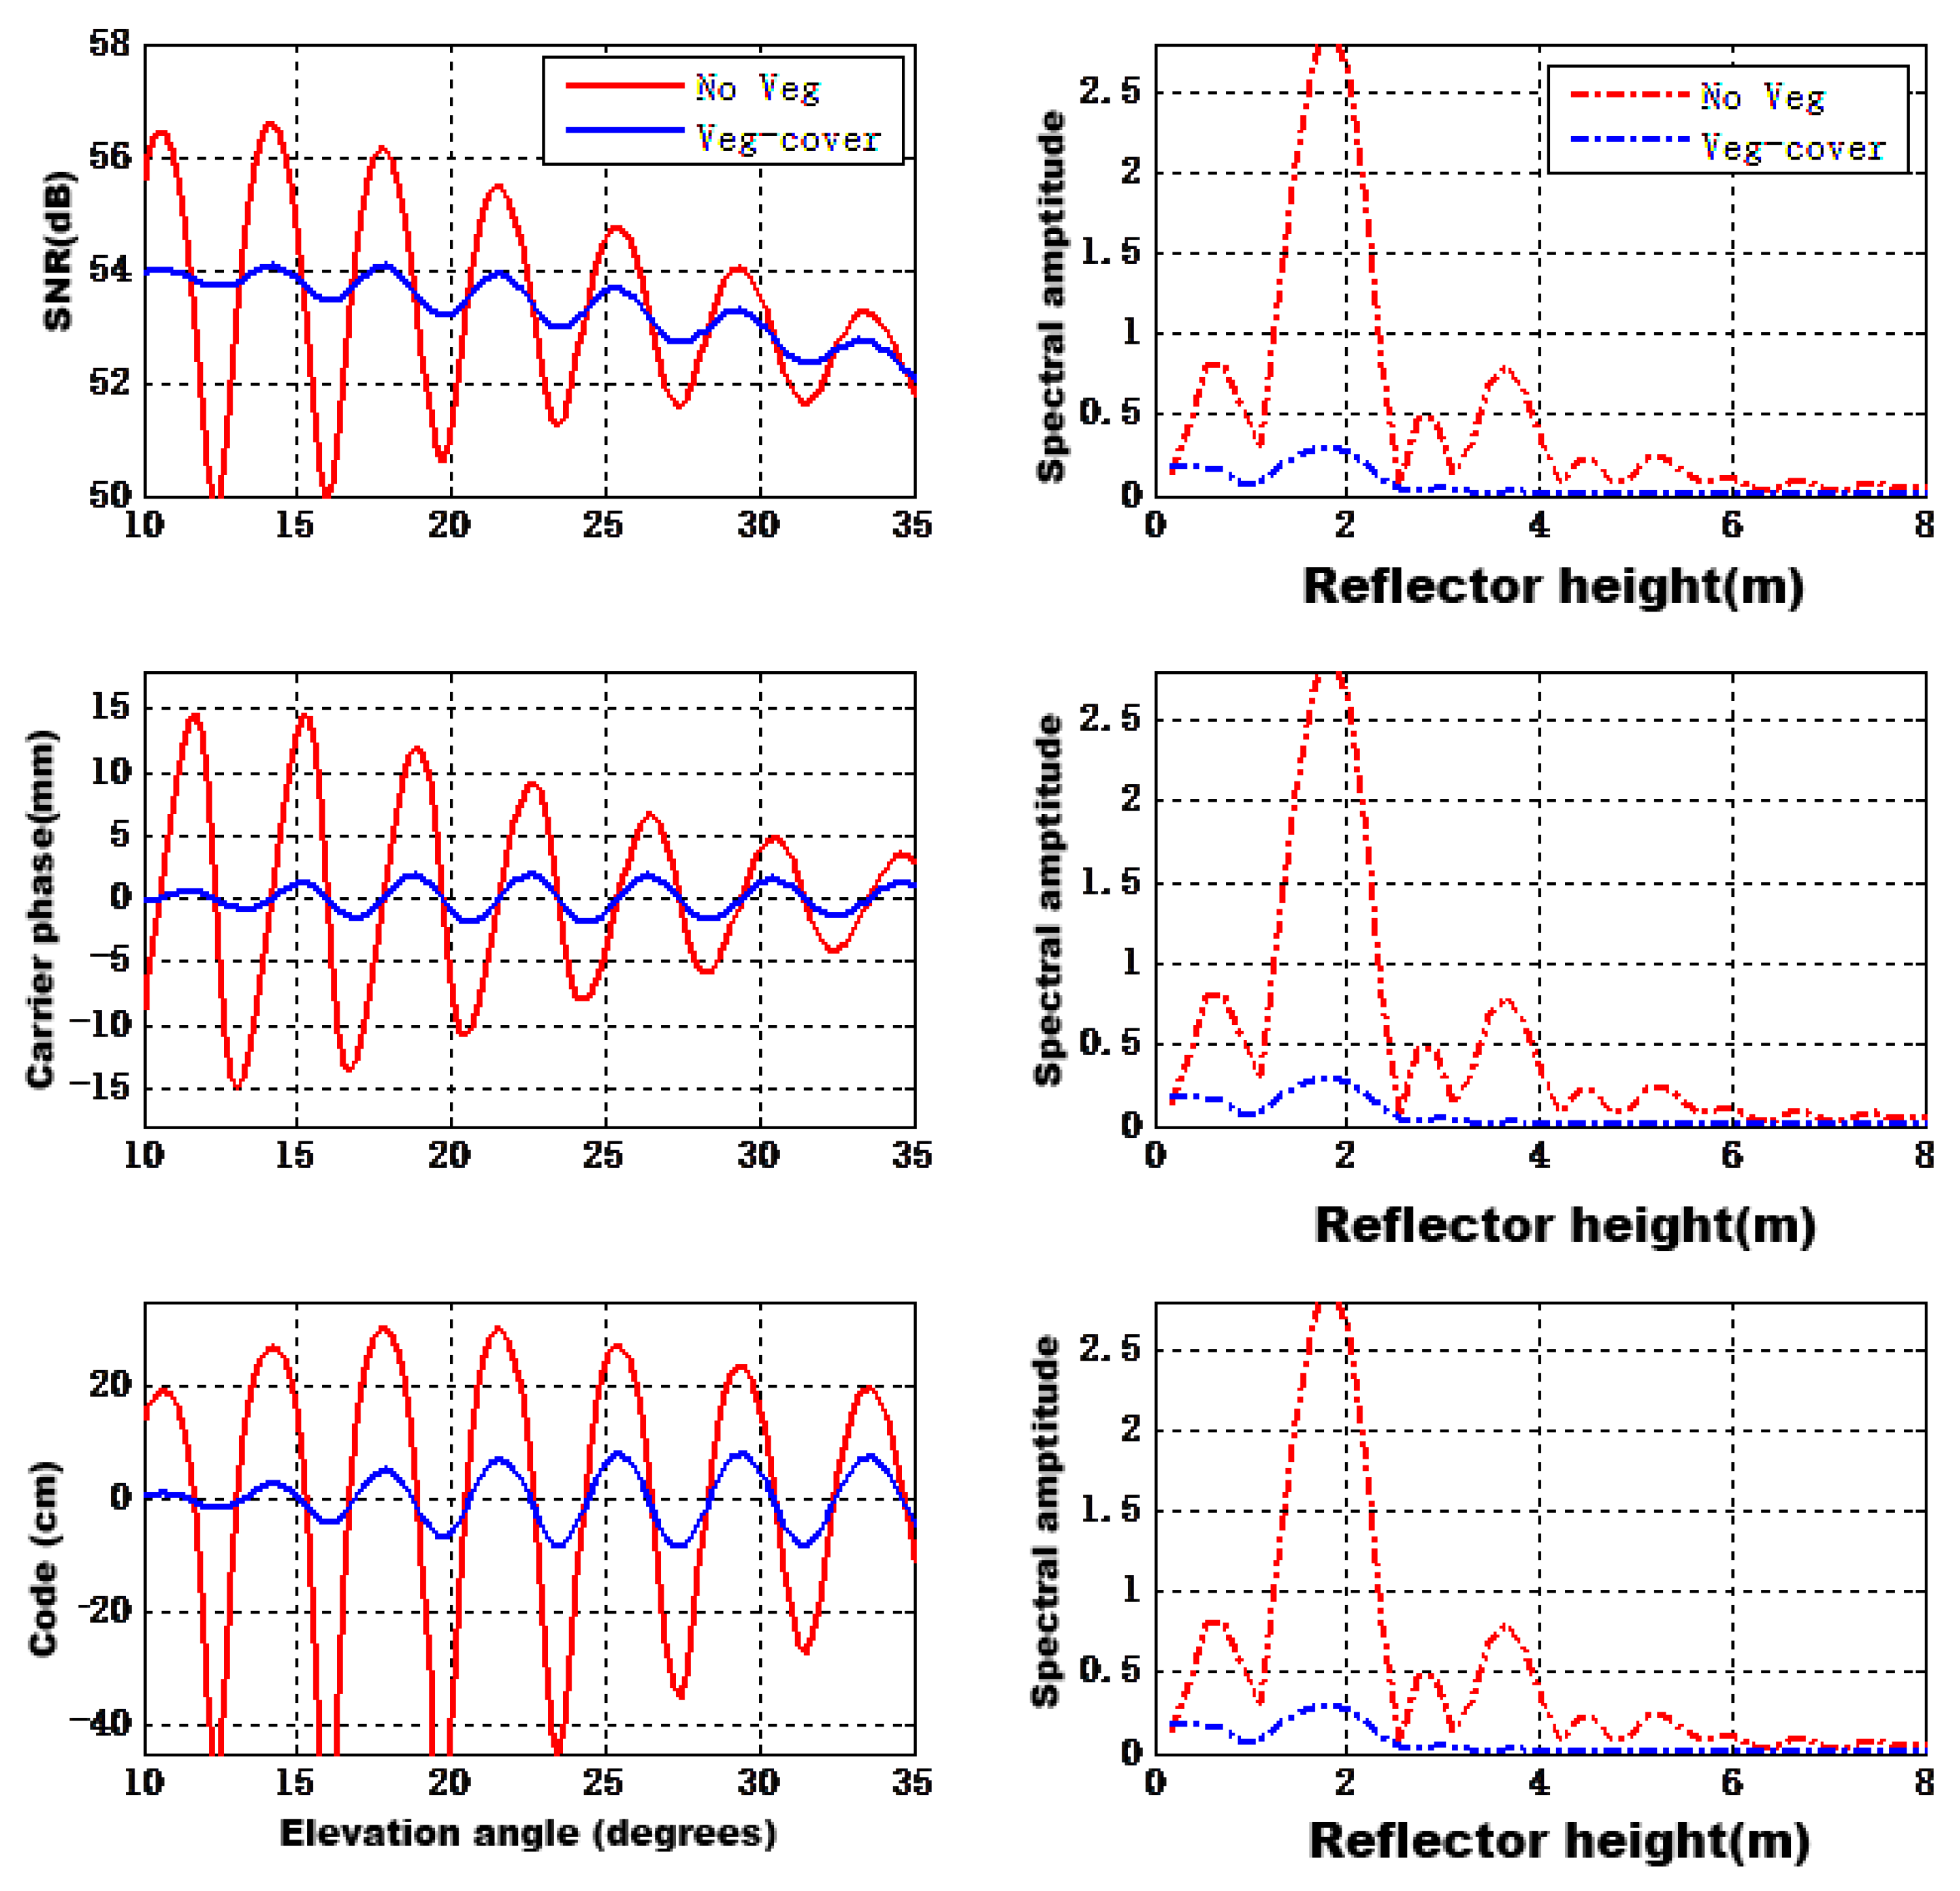
Figure 12 presents the GNSS multipath observation and effective reflectometer height when there is vegetation cover. It can be seen from the figure that the vegetation coverage will lead to a decrease in the amplitude of the SNR, phase, and pseudorange vibration, and the amplitude of the effective reflectometer height. This is because the vegetation layer will attenuate and scatter the GNSS signals; thus, it will result in a reduction in BRCS (Figure 11). In this way, it will ultimately lead to a reduction in the vibration amplitude of the GNSS multipath observation and the amplitude of the effective reflectometer height.
4. Model Validation
This paper developed a forward GNSS multipath model suitable for frozen and thawed soil under complex conditions. We compared our models with the previous physical model developed by Nievinski and Larson (N-L model). As for the N-L model, they are not oriented to the soil freeze/thaw process detection. While in our developed model, we expand the model application to a new field, i.e., soil freeze/thaw process detection under complex surface conditions. The currently applicable conditions of the model include the effects of freeze–thaw conditions on soil salinity, snow cover and vegetation cover. We have shown a very thorough illustration of various surface properties to the final GNSS multipath observables. Meanwhile, as for the N-L model, the authors employed the Fresnel reflectivity to get the surface scattering properties, while we pay more attention to the surface microwave scattering properties and have employed the radiative transfer equation model (vegetation) to get the surface scattering properties.
Since the currently applicable conditions of the model include the effects of freeze–thaw conditions on soil salinity, snow cover and vegetation cover, verification data are required to cover the more complex conditions mentioned above. Although there are hundreds of thousands of public GNSS site data worldwide, for GNSS-IR, the spatial resolution is 1 km. In the above complex surface conditions and strict spatial resolution, it is difficult to obtain the publicly available data suitable for the verification of this model.
Therefore, as for the model validation, we have employed the “model validation model” method. We assume the original N-L model is a correct reference, and we have validated our improved part by using the N-L model. The verification of this model is carried out in two parts. One part is the verification of the calculation of the surface reflection model. For this part, the angle and polarization of the model are set to the traditional single-station radar situation. We verify the correctness of the angle and polarization, and then we infer its correctness at other angles and polarization; the other part is the verification of the multipath model because the model developed in this paper is based on the original fully forward polarized GPS multipath model, based on the development of the foundation; therefore, we verify the improved surface reflection characteristic module and the original GPS multipath model, and verify the interface connection between the two. Through this method, the developed model is verified.
5. Conclusions
Thousands of GNSS station data have the potential to observe the surface freeze–thaw status in near real-time. Compared with traditional polar orbit satellite remote sensing observations, GNSS-IR technology can provide continuous observation signals, and it will be a useful complement to polar orbit satellite observations in terms of spatial and temporal resolution. At the same time, this emerging remote sensing method can also form a good complement to L-band spaceborne data products, helping to verify and calibrate spaceborne data tests.
This paper develops and establishes a forward GNSS multipath model suitable for freezing and thawing ground under complex conditions and uses this as a tool to simulate and analyze the multipath (SNR, phase and pseudorange) responses of GNSS receivers under complex conditions. The surface conditions applicable to the model include the freezing and thawing characteristics of saline soil, the freeze–thaw characteristics of unsalted soil, the characteristics of frozen and thawed soil covered with snow and the characteristics of frozen and thawed soil covered by vegetation.
Through the above combination, this model can basically analyze the forward GNSS multipath response under eight kinds of surface conditions. Using this model as a basic support tool, it can provide a key mechanism tool for the development of GNSS-IR research on the current surface freeze–thaw characteristics and can provide the theory for receiver data analysis, signal simulation, inversion algorithm development, and experimental design.
Author Contributions
Conceptualization, C.G., X.W. and W.B.; methodology, C.G.; software, J.X.; validation, W.B., Z.W. and L.L.; formal analysis, C.G.; investigation, C.G.; resources, N.D.; data curation, C.G.; writing—original draft preparation, C.G.; writing—review and editing, W.B. and X.W.; visualization, C.G.; supervision, W.B.; project administration, W.B., Z.W. and L.L.; funding acquisition, W.B. and L.L. All authors have read and agreed to the published version of the manuscript.
Funding
This research was funded by the National Natural Science Foundation of China, grant numbers 42074042, 42061057 and 41775034; and Strategic Priority Research Program of Chinese Academy of Sciences, grant number XDA15007501; Chifeng University Laboratory of National Land Space Planning and Disaster Emergency Management of Inner Mongolia under grant number of CFXYZD202006; Innovative Teams of Studying Environmental Evolution and Disaster Emergency Management of Chifeng University in China under grant number cfxykycxtd202006.
Institutional Review Board Statement
Not applicable.
Informed Consent Statement
Not applicable.
Acknowledgments
We acknowledge the support from NSSC for the technical support and materials used for experiments.
Conflicts of Interest
The authors declare no conflict of interest.
References
- Christensen, T.R. Permafrost: It’s a gas. Nat. Geosci. 2016, 9, 647–648. [Google Scholar] [CrossRef]
- Schuur, E.A.; Abbott, B. High risk of permafrost thaw. Nature 2011, 480, 32–33. [Google Scholar] [CrossRef]
- Kim, Y.; Kimball, J.S.; Glassy, J.; Du, J. An extended global Earth system data record on daily landscape freeze–thaw status determined from satellite passive microwave remote sensing. Earth Syst. Sci. Data 2017, 9, 133–147. [Google Scholar] [CrossRef] [Green Version]
- Zavorotny, V.U.; Gleason, S.; Cardellach, E.; Camps, A. Tutorial on remote sensing using GNSS bistatic radar of opportunity. IEEE Geosci. Remote Sens. Mag. 2014, 2, 8–45. [Google Scholar] [CrossRef] [Green Version]
- Wu, X.; Jin, S. Can we monitor the bare soil freeze-thaw process using GNSS-R?: A simulation study. In Earth Observing Missions and Sensors: Development, Implementation, and Characterization III; International Society for Optics and Photonics, SPIE Asia-Pacific Remote Sensing: Beijing, China, 2014; Volume 9264, p. 92640I. [Google Scholar]
- Wu, X.; Chang, L.; Jin, S.; Dong, Y.; Qian, X. Initial results for near surface soil freeze-thaw process detection using GPS-Interferometric Reflectometry. In Proceedings of the 2016 IEEE International Geoscience and Remote Sensing Symposium (IGARSS), Beijing, China, 10–15 July 2016; IEEE: Manhattan, NY, USA, 2016; pp. 1989–1992. [Google Scholar]
- Larson, K.M. GPS interferometric reflectometry: Applications to surface soil moisture, snow depth, and vegetation water content in the western United States. Wiley Interdiscip. Rev. Water 2016, 3, 775–787. [Google Scholar] [CrossRef]
- Chew, C.C.; Small, E.E.; Larson, K.M.; Zavorotny, V.U. Effects of near-surface soil moisture on GPS SNR data: Development of a retrieval algorithm for soil moisture. IEEE Trans. Geosci. Remote Sens. 2013, 52, 537–543. [Google Scholar] [CrossRef]
- Chew, C.C.; Small, E.E.; Larson, K.M.; Zavorotny, V.U. Vegetation sensing using GPS-interferometric reflectometry: Theoretical effects of canopy parameters on signal-to-noise ratio data. IEEE Trans. Geosci. Remote Sens. 2014, 53, 2755–2764. [Google Scholar] [CrossRef]
- McCreight, J.L.; Small, E.E.; Larson, K.M. Snow depth, density, and SWE estimates derived from GPS reflection data: Validation in the western US. Water Resour. Res. 2014, 50, 6892–6909. [Google Scholar] [CrossRef]
- Chew, C.; Small, E.E.; Larson, K.M. An algorithm for soil moisture estimation using GPS-interferometric reflectometry for bare and vegetated soil. GPS Solut. 2016, 20, 525–537. [Google Scholar] [CrossRef]
- Zavorotny, V.U.; Larson, K.M.; Braun, J.J.; Small, E.E.; Gutmann, E.D.; Bilich, A.L. A physical model for GPS multipath caused by land reflections: Toward bare soil moisture retrievals. IEEE J. Sel. Top. Appl. Earth Obs. Remote Sens. 2009, 3, 100–110. [Google Scholar] [CrossRef]
- Vey, S.; Güntner, A.; Wickert, J.; Blume, T.; Ramatschi, M. Long-term soil moisture dynamics derived from GNSS interferometric reflectometry: A case study for Sutherland, South Africa. GPS Solut. 2016, 20, 641–654. [Google Scholar] [CrossRef]
- Wu, X.; Jin, S.; Chang, L. Monitoring bare soil freeze–thaw process using gps-interferometric reflectometry: Simulation and validation. Remote Sens. 2018, 10, 14. [Google Scholar] [CrossRef] [Green Version]
- Chew, C.; Lowe, S.; Parazoo, N.; Esterhuizen, S.; Oveisgharan, S.; Podest, E.; Zuffada, C.; Freedman, A. SMAP radar receiver measures land surface freeze/thaw state through capture of forward-scattered L-band signals. Remote Sens. Environ. 2017, 198, 333–344. [Google Scholar] [CrossRef]
- Dobson, M.C.; Ulaby, F.T.; Hallikainen, M.T.; El-Rayes, M.A. Microwave dielectric behavior of wet soil-Part II: Dielectric mixing models. IEEE Trans. Geosci. Remote Sens. 1985, 35–46. [Google Scholar] [CrossRef]
- Hallikainen, M.T.; Ulaby, F.T.; Dobson, M.C.; El-Rayes, M.A.; Wu, L.K. Microwave dielectric behavior of wet soil-part 1: Empirical models and experimental observations. IEEE Trans. Geosci. Remote Sens. 1985, 25–34. [Google Scholar] [CrossRef]
- Peplinski, N.R.; Ulaby, F.T.; Dobson, M.C. Dielectric properties of soils in the 0.3–1.3-GHz range. IEEE Trans. Geosci. Remote Sens. 1995, 33, 803–807. [Google Scholar] [CrossRef]
- Zhang, L.; Shi, J.; Zhang, Z.; Zhao, K. The estimation of dielectric constant of frozen soil-water mixture at microwave bands. In Proceedings of the 2003 IEEE International Geoscience and Remote Sensing Symposium. Proceedings (IEEE Cat. No.03CH37477), Toulouse, France, 21–25 July 2003; Volume 4, pp. 2903–2905. [Google Scholar]
- Yang, X.Q.; Huang, K.M. The new method to calculate the complex effective permittivity of mixed aqueous electrolyte solution at microwave frequency. Dianzi Xuebao (Acta Electron. Sin.) 2006, 34, 356–360. [Google Scholar]
- Ulaby, F.T.; Moore, R.; Fung, A. Microwave Remote Sensing: Active and Passive. Volume 3—From Theory to Applications; NASA: Washington, DC, USA, 1986.
- Liang, P.; Pierce, L.E.; Moghaddam, M. Radiative transfer model for microwave bistatic scattering from forest canopies. IEEE Trans. Geosci. Remote Sens. 2005, 43, 2470–2483. [Google Scholar] [CrossRef]
- Ulaby, F.T.; Sarabandi, K.; Mcdonald, K.; Whitt, M.; Dobson, M.C. Michigan microwave canopy scattering model. Int. J. Remote Sens. 1990, 11, 1223–1253. [Google Scholar] [CrossRef]
- Nievinski, F.G.; Larson, K.M. Forward modeling of GPS multipath for near-surface reflectometry and positioning applications. GPS Solut. 2014, 18, 309–322. [Google Scholar] [CrossRef]
- Ulaby, F.T.; Elachi, C. Radar Polarimetry for Geoscience Applications; Norwood, MA, Artech House, Inc.: Norwood, MA, USA, 1990; p. 38. [Google Scholar]
- Jin, S. Satellite Positioning: Methods, Models and Applications; BoD–Books on Demand: London, UK, 2015. [Google Scholar]
Figure 1.
Real part (left) and imaginary part (right) of the dielectric constants versus the volumetric soil moisture at different GNSS frequency bands.
Figure 1.
Real part (left) and imaginary part (right) of the dielectric constants versus the volumetric soil moisture at different GNSS frequency bands.

Figure 2.
The relationship between the real part and the imaginary part of the dielectric constant with the soil moisture content under different soil textures.
Figure 2.
The relationship between the real part and the imaginary part of the dielectric constant with the soil moisture content under different soil textures.

Figure 3.
Variation of real and imaginary parts of the dielectric constant with soil temperature at different soil moisture contents.
Figure 3.
Variation of real and imaginary parts of the dielectric constant with soil temperature at different soil moisture contents.

Figure 4.
Variation of BRCS with elevation angle at different polarizations.

Figure 5.
The corresponding multipath observations (SNR, carrier phase and code pseudorange) and effective reflectometer height changes during freeze–thaw conversion.
Figure 5.
The corresponding multipath observations (SNR, carrier phase and code pseudorange) and effective reflectometer height changes during freeze–thaw conversion.

Figure 6.
Real and imaginary parts of dielectric constant as a function of soluble salt content in soil.
Figure 6.
Real and imaginary parts of dielectric constant as a function of soluble salt content in soil.

Figure 7.
Variation of BRCS with elevation angle for three soil solutions with different polarizations (VV, HH, RR, and LR).
Figure 7.
Variation of BRCS with elevation angle for three soil solutions with different polarizations (VV, HH, RR, and LR).

Figure 8.
The multipath observation and effective reflectometer height changes for three different saline soil solutions.
Figure 8.
The multipath observation and effective reflectometer height changes for three different saline soil solutions.

Figure 9.
Corresponding changes in BRCS when there is snow cover on the frozen surface and no snow cover on the melting surface under various polarizations.
Figure 9.
Corresponding changes in BRCS when there is snow cover on the frozen surface and no snow cover on the melting surface under various polarizations.

Figure 10.
Changes in GNSS multipath observation and effective reflectometer height when the frozen surface is covered with snow and the melted surface is not covered with snow.
Figure 10.
Changes in GNSS multipath observation and effective reflectometer height when the frozen surface is covered with snow and the melted surface is not covered with snow.

Figure 11.
Variation of BRCS with elevation angles with and without vegetation cover under various polarizations.
Figure 11.
Variation of BRCS with elevation angles with and without vegetation cover under various polarizations.

Figure 12.
Changes in multipath observation and effective reflectometer height corresponding to vegetation coverage.
Figure 12.
Changes in multipath observation and effective reflectometer height corresponding to vegetation coverage.


Table 1.
Summary of GNSS carrier frequencies.
| Constellation | Center Frequency | Frequency Value (Ghz) |
|---|---|---|
| GPS | L4 | 1.841 |
| L1 | 1.575 | |
| L3 | 1.381 | |
| L2 | 1.227 | |
| GLONASS | G1 | 1.6 |
| G2 | 1.246 | |
| Galileo | E1 | 1.575 |
| E6 | 1.278 | |
| E5b | 1.207 | |
| E5 | 1.191 | |
| Beidou | S | 2.484 |
| B1 | 1.561 | |
| B3 | 1.269 | |
| B2 | 1.207 | |
| IRNSS | S | 2.492 |
| L | 1.176 | |
| C | 6.7 | |
| QZSS | L1 | 1.575 |
| L2 | 1.228 |
Table 2.
Parameter settings for five soil textures.
| ID | Soil Type | Vsand (%) | Vclay (%) |
|---|---|---|---|
| field 1 | Sandy loam | 51.50 | 13.5 |
| field 2 | loam | 42.00 | 8.5 |
| field 3 | Silt loam | 30.60 | 13.5 |
| field 4 | Silt loam | 17.20 | 19 |
| field 5 | Silty clay | 5.00 | 47.4 |
Publisher’s Note: MDPI stays neutral with regard to jurisdictional claims in published maps and institutional affiliations. |
© 2021 by the authors. Licensee MDPI, Basel, Switzerland. This article is an open access article distributed under the terms and conditions of the Creative Commons Attribution (CC BY) license (https://creativecommons.org/licenses/by/4.0/).
Share and Cite
MDPI and ACS Style
Gao, C.; Bai, W.; Wang, Z.; Wu, X.; Liu, L.; Deng, N.; Xia, J. Simulations and Analysis of GNSS Multipath Observables for Frozen and Thawed Soil under Complex Surface Conditions. Water 2021, 13, 1986. https://doi.org/10.3390/w13141986
AMA Style
Gao C, Bai W, Wang Z, Wu X, Liu L, Deng N, Xia J. Simulations and Analysis of GNSS Multipath Observables for Frozen and Thawed Soil under Complex Surface Conditions. Water. 2021; 13(14):1986. https://doi.org/10.3390/w13141986
Chicago/Turabian StyleGao, Chao, Weihua Bai, Zhiqiang Wang, Xuerui Wu, Lijun Liu, Nan Deng, and Junming Xia. 2021. "Simulations and Analysis of GNSS Multipath Observables for Frozen and Thawed Soil under Complex Surface Conditions" Water 13, no. 14: 1986. https://doi.org/10.3390/w13141986
Note that from the first issue of 2016, this journal uses article numbers instead of page numbers. See further details here.