
Tomato and Watermelon Production with Mulches and Automatic Drip Irrigation in North Dakota
by
 ,
,
Uday Bhanu Prakash Vaddevolu
1, 
Justin Lester
1,
Xinhua Jia
1,*,
Thomas F. Scherer
1 and
Chiwon W. Lee
2 1
Department of Agricultural and Biosystems Engineering, North Dakota State University, Fargo, ND 58102, USA
2
Department of Plant Sciences, North Dakota State University, Fargo, ND 58102, USA
*
Author to whom correspondence should be addressed.
Water 2021, 13(14), 1991; https://doi.org/10.3390/w13141991
Submission received: 14 June 2021
/
Revised: 15 July 2021
/
Accepted: 17 July 2021
/
Published: 20 July 2021
(This article belongs to the Special Issue Application of Smart Technologies in Water Resources Management)
Abstract
:In North Dakota, agriculture contributes a large sector of the state’s economy, but vegetable production is limited due to the state’s climate condition. Inadequate soil moisture and low soil temperature are the two major factors prohibiting quality produce and high-yield vegetable production. In this study, a soil-water potential, sensor-based drip irrigation system was developed, designed, and installed to evaluate its application on tomato and watermelon productions in a two-year field experiment in 2019 and 2020. The experimental treatments were drip irrigation and no irrigation under three mulches: black plastic, clear plastic, and landscape fabric mulches. Irrigation was scheduled at 8:00 am for watermelon and 9:00 a.m. for tomato, with the ability for each irrigation event to be bypassed based on the soil moisture conditions. Due to rainfall differences in the two years, irrigation was barely needed in 2019, but in 2020, drip irrigation was applied frequently. On average, for the two-years’ field experiment, the highest yield for tomatoes was obtained from drip irrigation under black plastic drip irrigation treatment with 40.24 Mg ha−1 in 2020, whereas the highest yield for watermelon was from drip irrigation under clear plastic mulch with 165.55 Mg ha−1 in 2020. The effect of mulch, irrigation, and combined practices were analyzed based on the average fruit weight and diameter, electrical conductivity (EC), pH, and sugar content of the samples. The results showed that for watermelon, the average weight and diameter were significantly heavier and higher with irrigation treatments, but the EC and the pH values were significantly higher with mulch treatments. For tomatoes, the average weight, diameter, pH, and sugar content were all significantly higher with mulch treatment, but the EC was higher with irrigation treatment.
1. Introduction
Agriculture plays a large role in North Dakota’s (ND) economy and uses around 89 percent of the state’s land [1]. North Dakota has a warm temperature in summer, cold temperatures in winter, and strong winds throughout the year. Wheat, soybean, and corn are the major crops grown in ND, but horticulture crops, such as vegetables, can be also grown in this region though the yields and quality are limited due to low soil temperature in the root zone and lack of irrigation. Tomato and watermelon production are negligible when compared to the soybeans, wheat, corn, sunflower, and potato production. With only 63 and 30 farms for tomato and watermelon fresh market sale in 2017 and an average farm size less than 0.405 ha, the total areas were about 25 and 12 ha for tomato and watermelon productions, respectively, in North Dakota [2]. However, many people grow vegetables in their gardens for self-consumption, so currently, the extensions are on master gardens. The possibilities to improve the vegetable productions are huge.
A warmer soil temperature can advance crop growth and improve crop phenological development and therefore increase crop yield [3,4]. By adopting some management practices, such as mulching, it is possible to maintain a warm soil temperature in the root zone. Mulching is a management practice that is popular all over the world [5,6,7,8,9] and can be used in agriculture to create favorable conditions, including maintaining warm soil temperature and suppressing weeds. In arid regions, mulch has been used to conserve water through reduced evaporation while also increasing yields [8,10]. In cold and humid regions, such as in North Dakota, the mulch is applied to increase soil temperature and control weeds [11,12]. In a field experiment, [11] sweet corn was grown under different mulches and it was found that the soil temperature under clear plastic mulch was 2.31 °C warmer than that under the no mulch treatment for an entire season in Fargo, ND.
Mulches are available in different colors, thickness, and materials, which can be used for different purposes, such as earlier maturity, higher yield, reduce evaporation, control weeds, and root pruning [5,13,14,15,16]. The temperature differences on the soil surface and subsurface under different mulches depend on the thermal properties of the mulches, the energy partitions of the incoming solar radiation, and the distance between the mulch and the soil [17,18]. Clear plastic mulch exposed the surface to the incoming shortwave solar radiation but compressed the outgoing longwave infrared radiation, which causes the soil surface to be warmer due to the retained infrared radiation. Black plastic mulch completely covers the soil surface and causes fewer soil temperature changes compared to the clear mulch. However, the air temperature above the mulch can be increased and stays warmer due to the released thermal energy or longwave infrared radiation from the black mulch. Weed growth is also reduced due to the lack of sunlight under the black mulch [15,18].
For high-value crops, drip irrigation is commonly used along with plastic mulch to get high-quality production. Tomato and watermelon grown under drip irrigation and plastic mulches can increase the water use efficiency and produce increased yields with less water compared to those under no mulch treatments [19,20,21]. Ref. [22] evaluated the impact of different water tension thresholds in well-drained, clayey soil on tomato growth stages and found that the highest yield was from soil potential thresholds of 35, 12, and 15 kPa during vegetative, fruit development, and maturation stages, respectively. Ref. [23] conducted a field experiment to withhold irrigation at different stages to monitor the tomato water use efficiency and yield and concluded that withholding drip irrigation between first flower and first fruit stages can increase tomato marketable yield by 8–15% and save 20% of irrigation water compared to that with regular irrigation treatment. Ref. [21] researched to understand the combined effect of irrigation (drip or flood irrigation) and mulch (plastic or sugarcane trash mulch) on tomato yield and water savings in heavy soils. They found that the sugarcane trash mulch at 0.4 of pan evaporation level gave the highest fruit yield with 44% of irrigation water savings. Similarly, plastic mulch can be used to control weed and increase yield for watermelon. Ref. [24] evaluated the impact of deficit irrigation on watermelon yield at different stages and found that irrigation with 100% water requirement produced the highest yield, whereas irrigation with 50% of irrigation requirement at vegetative growth and fruit development stages severely reduced the watermelon numbers and yield, while watermelon at the fruit-ripening stage was less sensitive to water deficit.
Since the evaporation from the soil surface is reduced due to mulch cover, irrigation scheduling using traditional crop coefficient (Kc) and reference evapotranspiration approach becomes challenging due to the reduced or different Kc values [25,26] under different mulches. Irrigation based on crop water consumption can provide favorable conditions for higher crop production. In recent years, automatic irrigation based on soil moisture sensors and controllers has become popular in urban landscape water management and turfgrass irrigation for both sprinkler and drip irrigation methods [27]. Using the smart irrigation technology for high-value crops in agriculture is relatively new, but it has been shown with positive results of higher yields and better quality [27,28]. There are several types of irrigation controllers available on the market that can work based on evapotranspiration (ET) [29], crop coefficient [30], or soil moisture sensor (SMS) [31]. The SMS controller can start irrigation automatically with a soil moisture or a potential threshold predetermined for a specific crop and soil type. This SMS-based irrigation can only be applied depending on the soil moisture or potential status, thus can work under different mulches.
In this study, an automatic soil-water potential, sensor-controlled irrigation system was developed, designed, and installed for a two-year field experiment to test the irrigation system under different mulches. The objectives of the study were to (1) build and test the automatic soil-water potential, sensor-controlled drip irrigation system under clear plastic (CP), black plastic (BP), and landscape fabric (PF) mulches along with no mulch (NM); (2) compare the irrigation schemes for tomato and watermelon; and (3) evaluate the effect of irrigation and mulches on tomato and watermelon yield and quality. The hypothesis is that the combined automatic drip irrigation and mulch only irrigate when soil is drier than the threshold value and, at the same time, provide the best yield and highest quality of produce.
2. Materials and Methods
2.1. Experimental Site
The two-year field experiment was conducted at a research farm located on the west side of the North Dakota State University (NDSU) campus in Fargo, North Dakota. The field plot is located at 46°53′70′’ N and 96°48′66′’ W, with an elevation of 274 m above sea level. The study area has a warm, humid continental climate [32] with an average temperature of 5.98 °C, a maximal temperature of 28.04 °C in July, and a minimum temperature of −17.02 °C in January. The average annual rainfall and potential evapotranspiration are 533–635 mm and 1103–1478 mm, respectively [33].
2.2. Field Layout
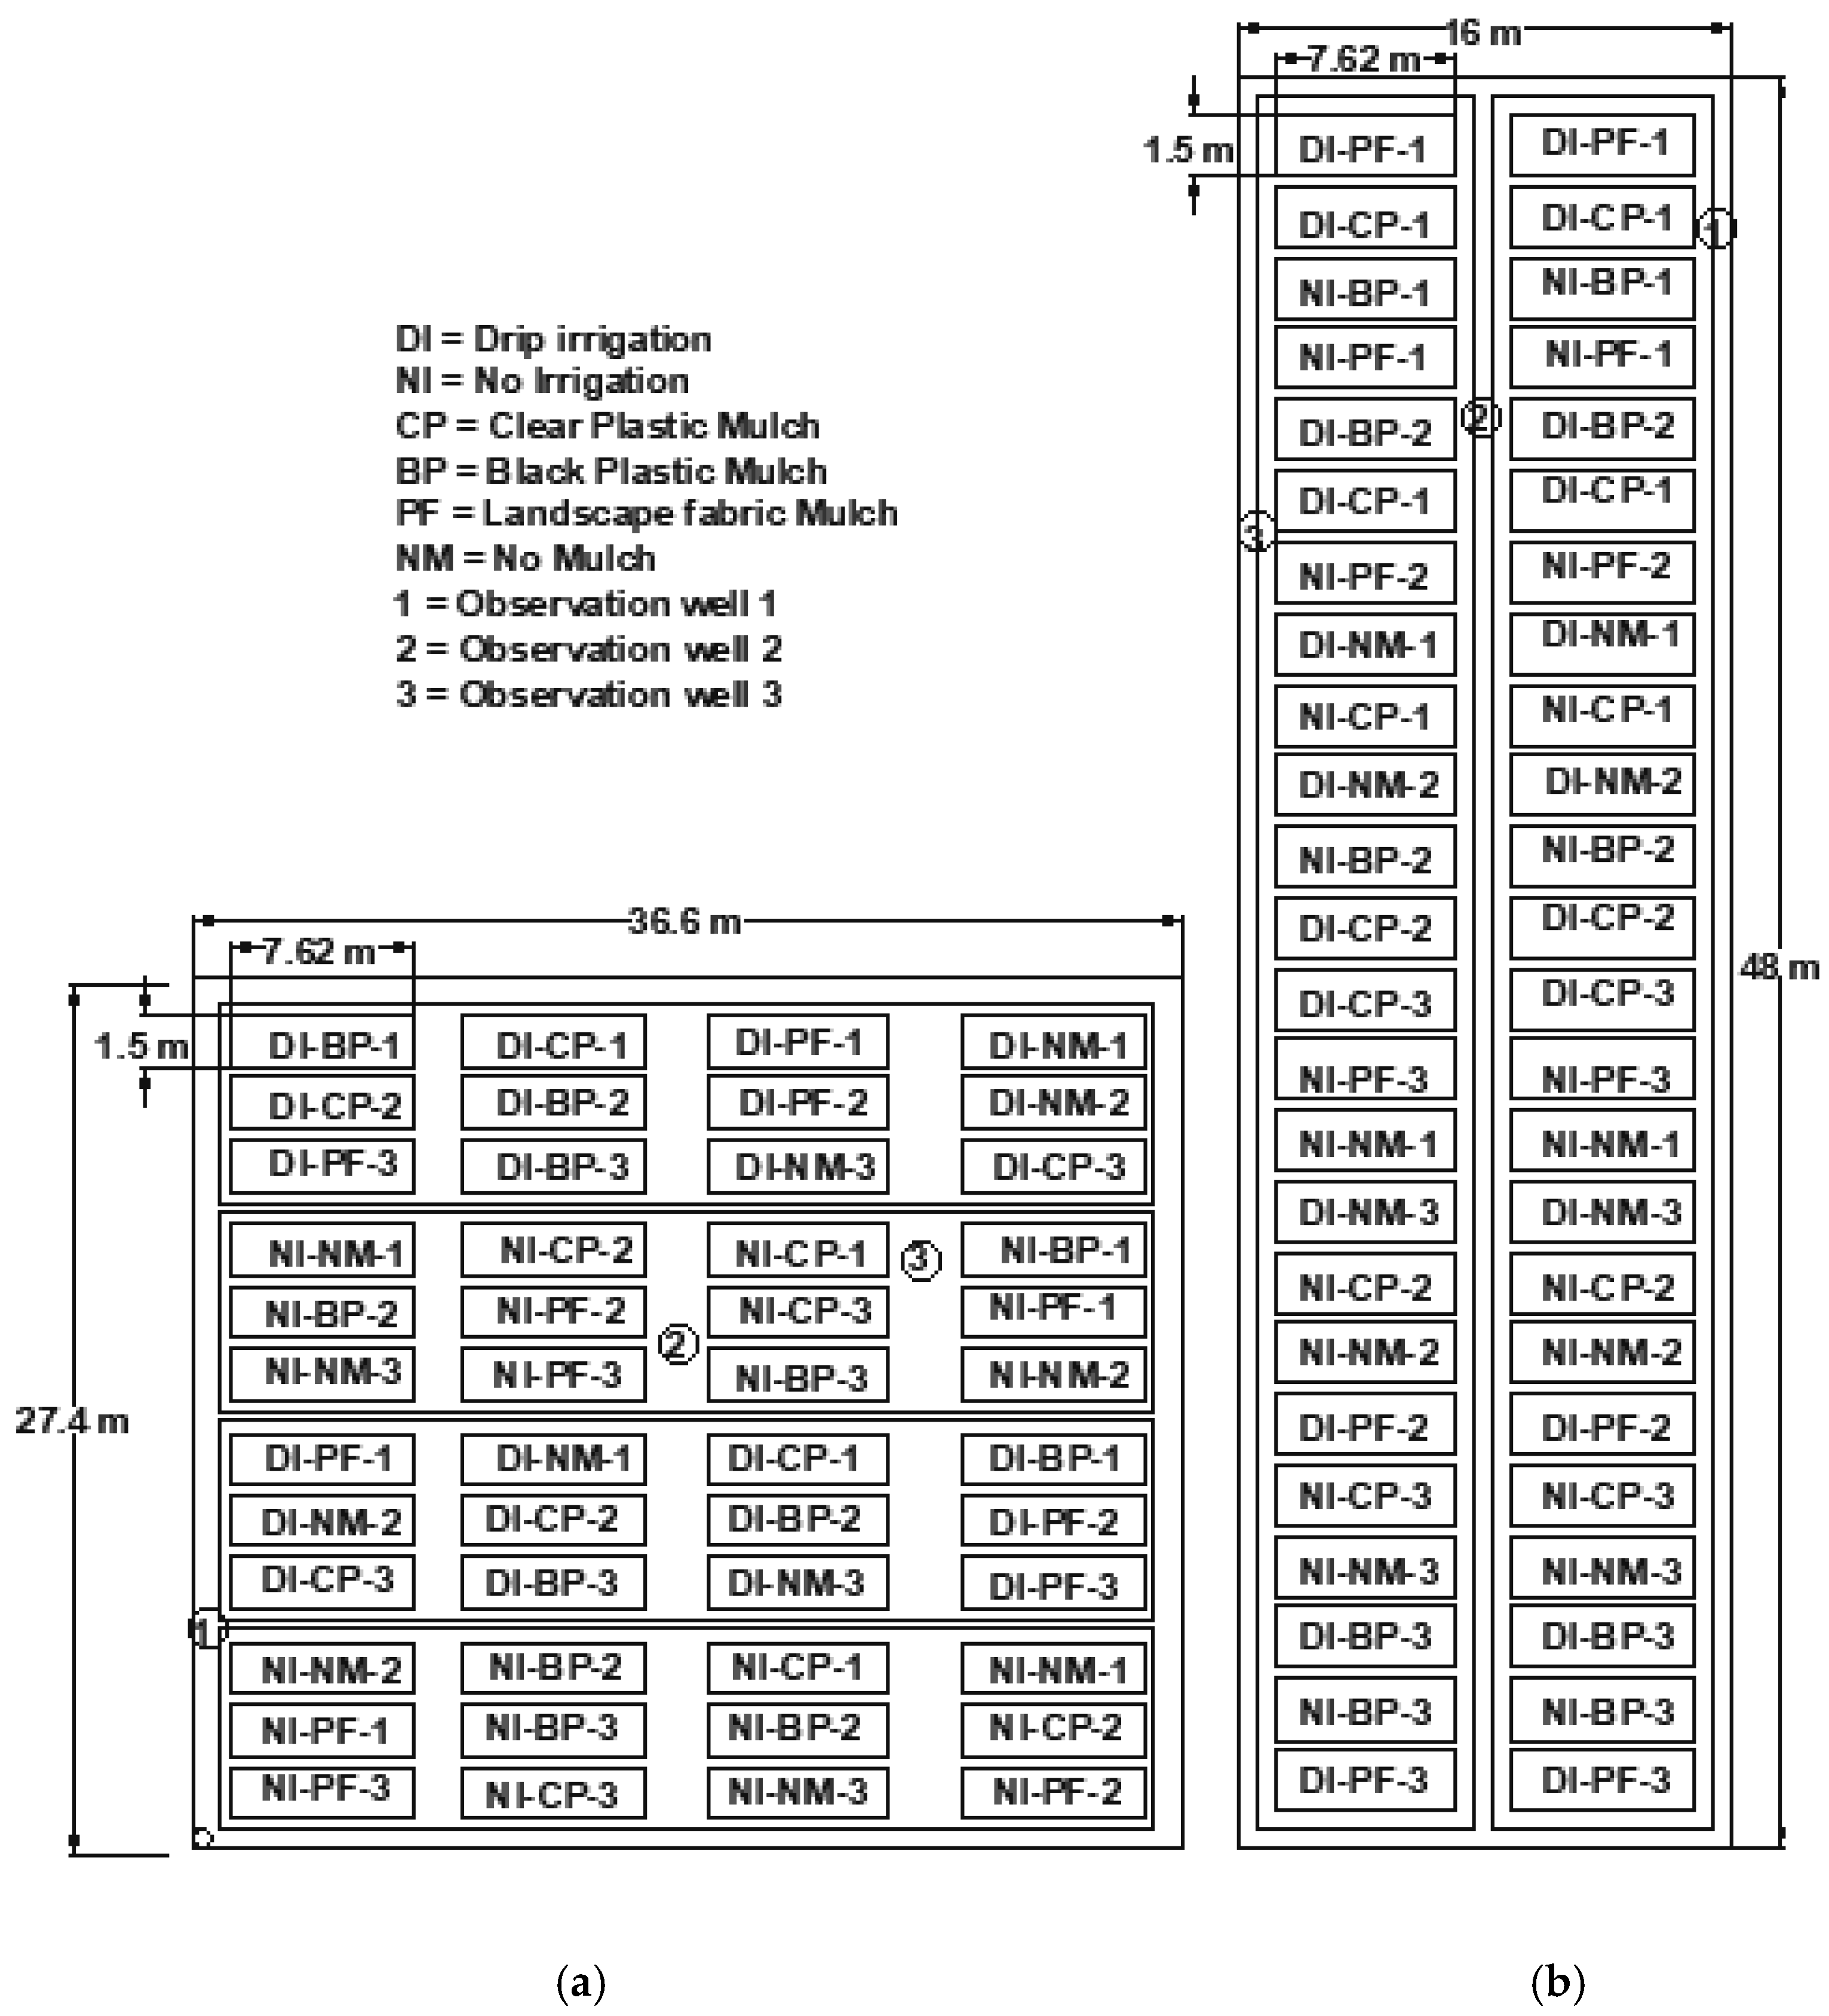
The field experiment was conducted in a 1340 m2 (36.6 × 36.6 m) area. The experiment was designed as a split-split random design in 2019, with the vegetable and irrigation as the splits and the four mulches randomly arranged (Figure 1a). The main plots were extended in the west to east direction. In July 2019, a visible soil moisture difference was observed after rainfall events, with the wetter surface in the west and drier surface in the east. It was suspected that a potential tile drainage was installed in the east side. Therefore, to avoid any potential soil moisture difference, the experiment was redesigned as a complete randomized split-plot in 2020 (Figure 1b) for an area of 740 m2 (48.7 m × 15.2 m), with the vegetable type as the only split plots. Since the two vegetables were arranged in the west-east direction, if there are were differences in soil moisture due to the location of the tile drainage system, there should have been minimal differences in each vegetable due to the field orientation.
Though the dimensions and designs of the experiments changed from 2019 to 2020, the plot size remained unchanged, with a spacing of 6 m in length and 1.5 m in width [34]. Each plot contained six tomato plants or five watermelon plants placed along the center of the plot, with a spacing of 1 m for tomatoes and 1.2 m for watermelon, respectively. The treatments also stayed as the same, with two vegetables, two irrigations, and four mulches. In general, a field layout difference is expected for crop rotation purpose.
2.3. Soil Analysis
Six soil samples were collected at different locations, with a grid pattern across the field at 0–15 cm and 15–61 cm depth before the field experiment. The soils were analyzed for nitrate-nitrogen, potassium, pH, electrical conductivity, and organic matter by the NDSU soil-testing laboratory following standard protocols. The testing results are shown in Table 1.
From the soil testing results, the amount of fertilizer can be estimated based on the recommended 168 kg N/ha for tomato and 134 kg N/ha for watermelon (Cihacek, L., ND’s soil fertility specialist, personal communication). For the experimental area, with 46% N content in urea, the urea application on the experimental plots was 31 and 21 kg for tomato and watermelon in 2019 and 22 and 16 kg for tomato and watermelon in 2020, respectively. The urea was applied using a hand-held fertilizer spreader (Marysville, OH) to maintain uniform application rate.
Soil core samples were collected at 5, 15, 30, 45, 60, 75, and 90 cm depth from the study area in spring 2019. Soil bulk density and soil release curve were measured using HYdraulic PROPerty analyzer (HYPROP) and WP4 dewpoint potentiometer method [35]. The estimated soil volumetric water content at field capacity (−33 kPa), permanent wilting point (−1500 kPa), and saturation (θs) for the top 45 cm soil layer were averaged and listed in Table 2, along with other soil physical parameters. These parameters are critical input data for irrigation scheduling.
2.4. Mulch
In this study, tomatoes and watermelons were grown under three different mulches, including CP, BP, and PF, along with NM as the control. The CP and BP (Dubois Agri. Inc., QC, Canada) are 1.22 m wide and 20.32 µm thick, while the PF (Menards, Eau Claire, WI, USA) was 1.22 m wide and 25 mm thick. A tractor that was mounted with a subcompact raised bed mulch machine (Berry Hill Irrigation. Inc, Buffalo Junction, VA, USA) was used to raise the bed height and lay the mulch on the selected plots. Two disks and deflectors available on the machine were used to raise the beds to 12.7 cm above the ground with a bed width of 1.0 m. Drip tapes were installed on the beds using drip tape guiders, and mulch was laid on top of the drip tapes using the disks and press wheels. The side of the mulch was covered with soil by the mulch machine to secure the mulch in place.
2.5. Irrigation System
2.5.1. Drip
Drip tape was categorized based on the flow rate, which is an important factor used to determine the duration of each irrigation event. For this study, drip tape (Chapin Watermatics Inc, Watertown, NY, USA) had a 0.05 m emitter space and 5.68 L/min per 30.48 m drip length (0.005 m3/min per 30.48 m) flow-rate capacity. Two drip laterals with 0.4 m space were installed in each plot, which has an estimated flow rate of 106.6 L/min. For each lateral, one end was connected to the mainline using a barbed adaptor, while the other end was folded and taped to close the flow. The three plots (or six laterals) in each treatment were connected to one mainline, which then was connected to a control unit. All mains were laid along the center between the treatments and extended to the controllers, where the irrigation water was supplied.
2.5.2. Water Supply
The water source for the drip irrigation system was a hydrant that is located around 20 m from the field. Water samples were collected in 2020 for chemical analysis and found that the salinity and sodium concentration are at acceptable levels and were satisfactory for irrigation according to ND irrigation water standards [36]. Water was diverted to the field from the hydrant through a hosepipe after it was passed through a filter (Senninger irrigation Inc., Clermont, FL, USA), pressure regulator (Agricultural products Inc., York, NE, USA), and two flow meters (Omega Engineering Inc., Norwalk, CT, USA) to monitor the flow rate to the tomato and watermelon controllers.
2.5.3. Scheduling
Irrigation scheduling is one of the most important components in water management and determines when and how long to irrigate. It can be determined based on the soil moisture content of the field, crop water requirement, and evapotranspiration rates. The amount of water to be applied per irrigation can be calculated based on soil physical properties, area irrigated, drip system characteristics, and management allowable depletion (MAD). Based on the soil properties in Table 2 for the top 45 cm root zone, the total amount of water needed to irrigate 60% of the surface area for the three plots in each treatment (16.73 m2) is 0.113 m3. With an irrigation efficiency of 100% for such a small area and a flow rate of 5.68 L/min per 30.48 m drip length, the irrigation time was estimated as 17 min for the 36.6 m drip laterals at about 10% MAD.
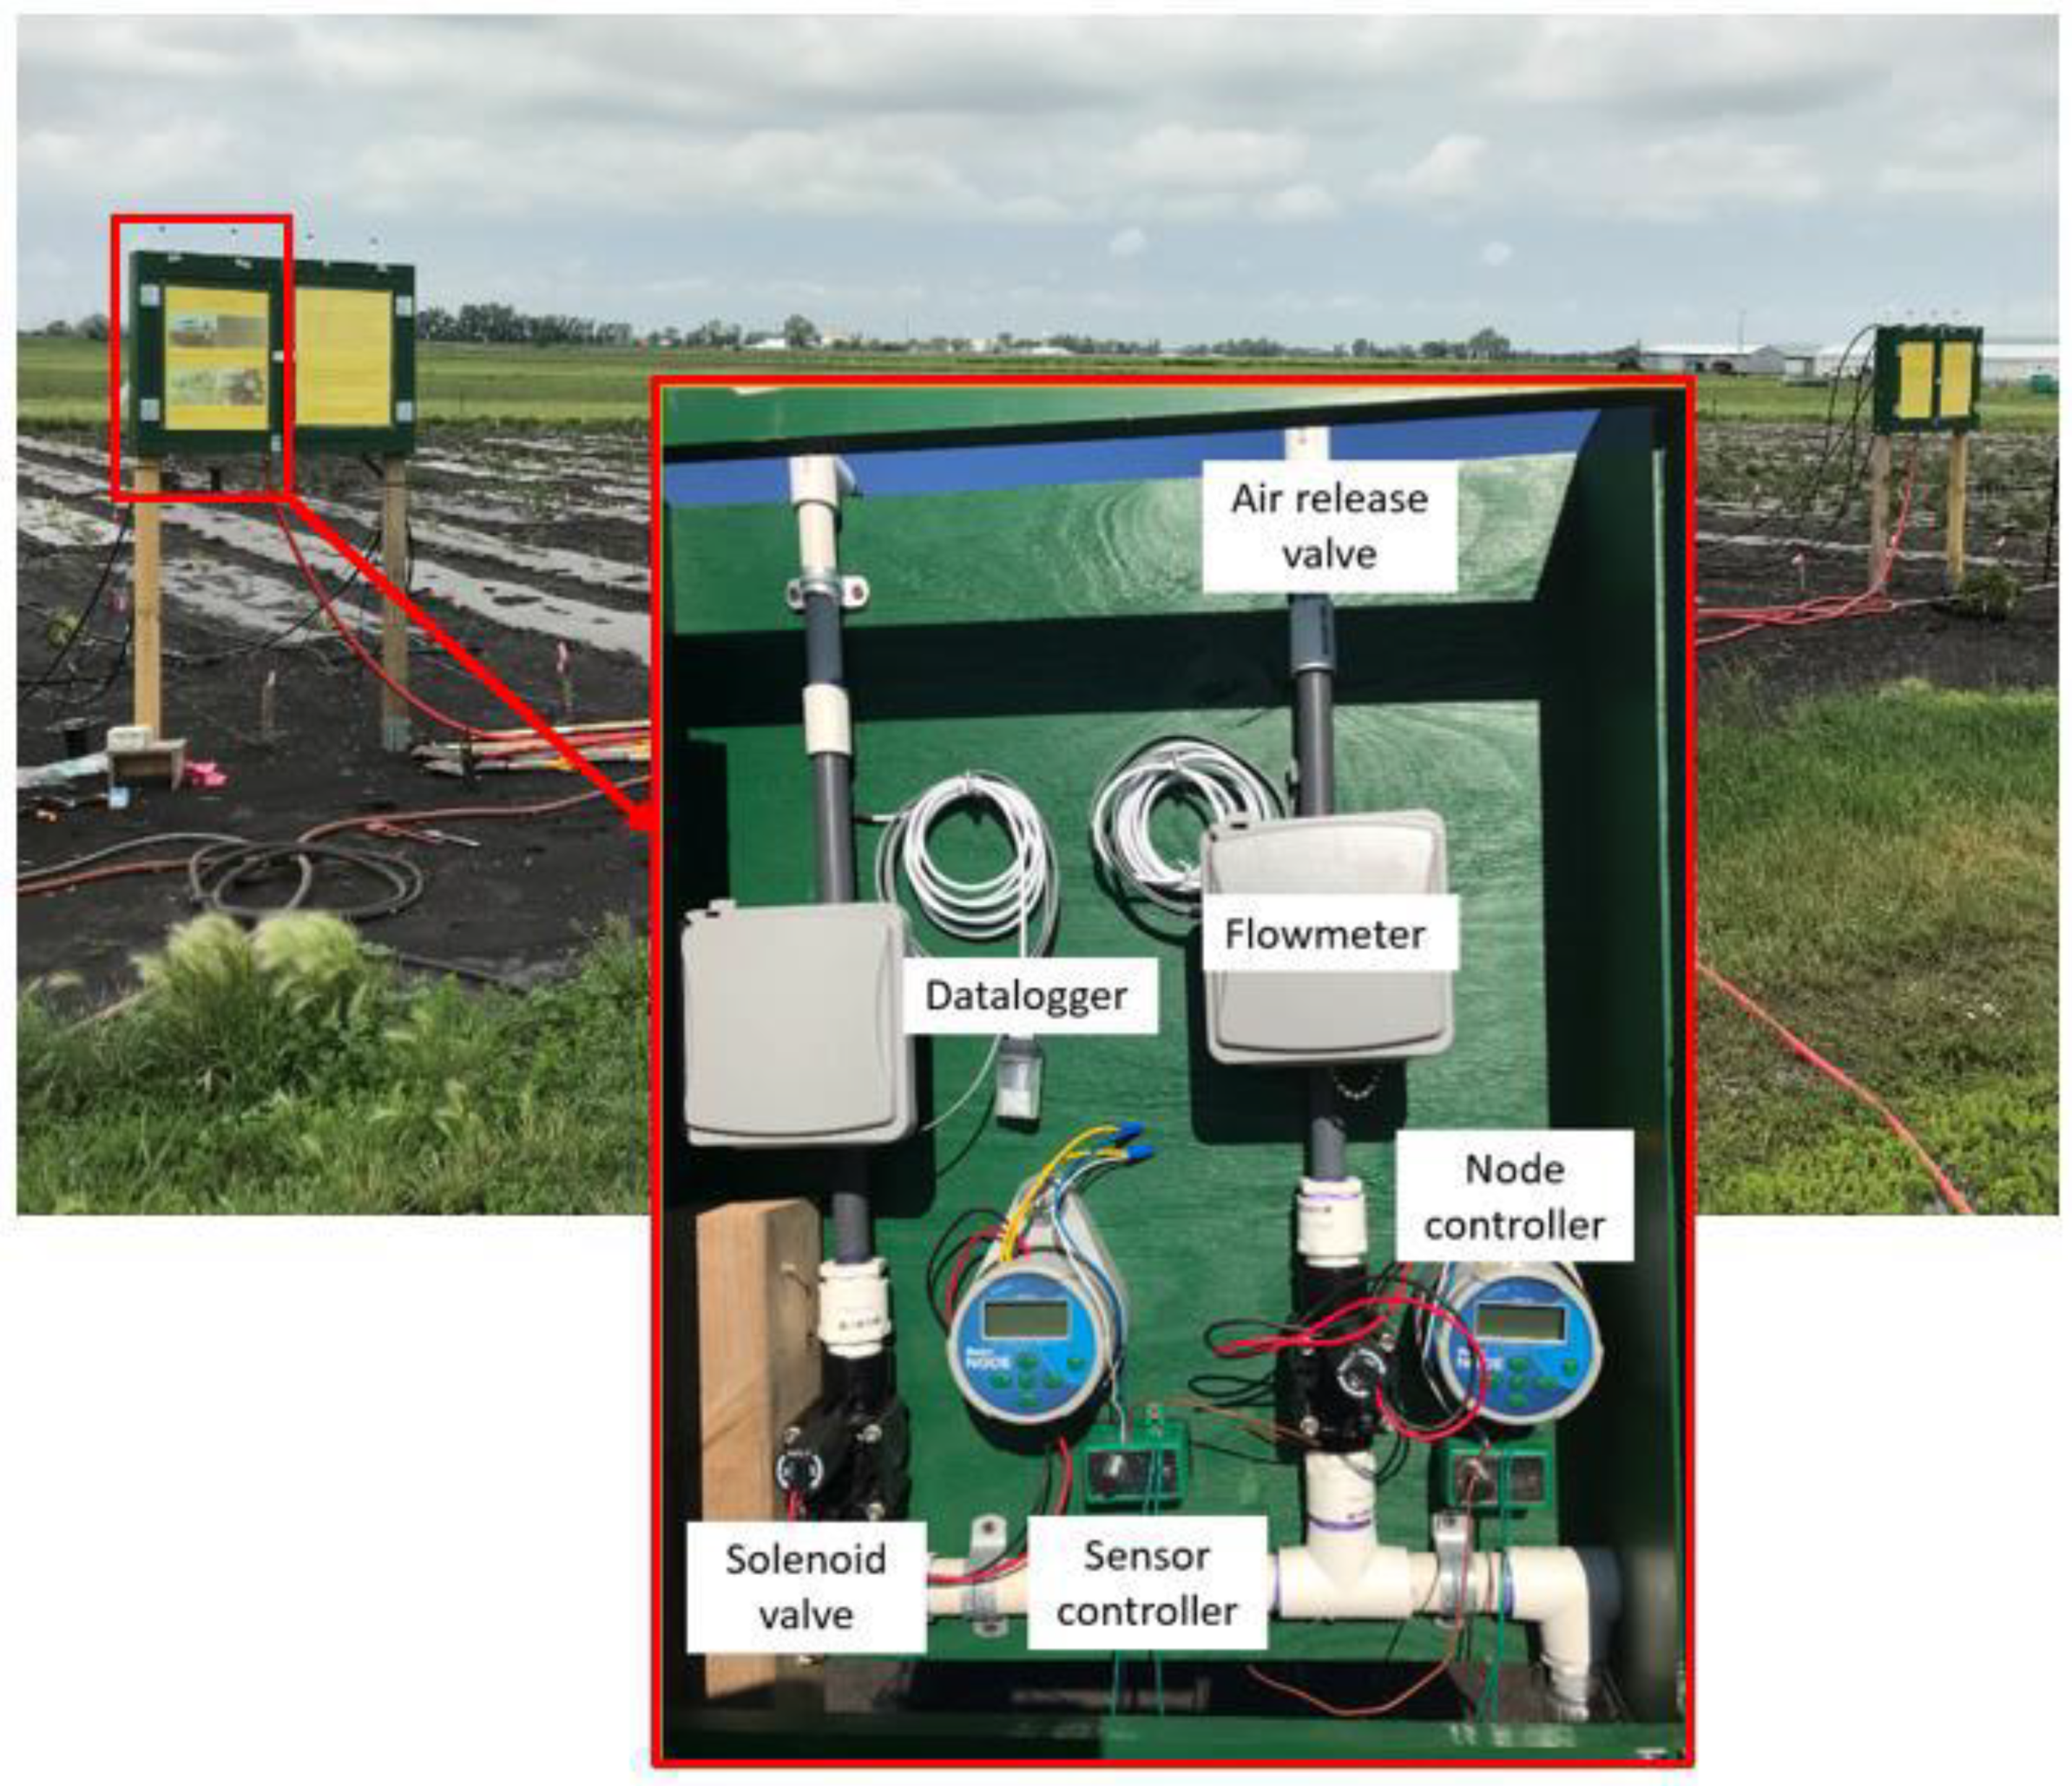
2.5.4. Controller
The automatic drip irrigation system was built using a watermark electronic module battery version (WEM-B, Irrometer Company, Riverside, CA, USA), a node controller (Hunter, San Marcos, CA, USA), and a solenoid valve to initiate an irrigation event once the pre-set potential threshold was reached. All components were arranged on two control boards, with each board consisting of four control units, as shown in Figure 2. A total of eight control systems were constructed to control each mulch treatment for each crop. In each treatment, two watermark sensors linked in series were installed in the second plot of the three plots at 15 and 30 cm depth, while an average for those two values was used to control irrigation via the controller. The threshold for the irrigation initiation was selected as 4, which kept the soil in the wet zone based on the switch position (Irrometer Company, Riverside, CA, USA). The node controller was programmed to set up the time starting at 8:00 and 9:00 am for tomato and watermelon, respectively, with a 17 min irrigation duration for each plot.
2.6. Measurements
2.6.1. Rainfall
Two pairs of rain gauges, an automatic tipping bucket rain gauge, and a manual rain gauge (Productive Alternatives Inc., Fergus Falls, MN, USA) were set up together on the west and the east sides of the field plots. Automatic rain gauges were installed to collect the rainfall data with 10 min intervals. The manual rain gauges were also set up next to the automatic rain gauges to ensure that rainfall measurements were accurate and consistent during the study period.
2.6.2. Soil Water Potential and Soil Temperature Measurements
The watermark sensor measures the soil resistance, which is related to soil matric potential. Based on the soil release curve, the soil water content can then be estimated from the measured soil matric potential. As reported by the manufacturer, there are four equations for the estimates of the soil water potential based on the measured resistance and soil temperature (Irrometer Company, Riverside, CA, USA):
where R is the resistance in kiloohms, ψ is soil water potential in kPa, and T is the temperature in °C. However, for the sensors used on the controller, a default temperature (23.9 °C) was used to estimate the potential instead of the above equations.
Thus, the soil water potential was estimated from the resistance measured by the sensor and the soil temperature measured by a soil temperature sensor, which was constructed from a Type E thermocouple (Omega Engineering Inc., Norwalk, CT, USA). The two watermark sensors were installed in the middle of the plot at 15 and 30 cm depth along with the two soil temperature sensors in each plot. The four sensors were located on the opposite side of the plant from the soil water potential sensors used to control irrigation. They were used to monitor the soil matric potential and to ensure that the three replicated plots in each treatment were all in similar soil moisture status.
A total of 96 soil water potential and 96 soil temperature sensors were connected to three CR1000 dataloggers (Campbell Scientific Inc., Logan, UT, USA) to collect the soil water potential and soil temperature data for every 15 min such that 32 watermark sensors and 32 soil temperature sensors were connected to each datalogger with the help of two AM16/32B multiplexers (Campbell Scientific Inc., Logan, UT, USA), 10 W solar panels, 12 V battery, and other accessories.
2.6.3. Groundwater
Three piezometers were installed at different locations in the field to monitor the groundwater table in the study area (Figure 1). The piezometers were installed at 1.2 m depth, while the top of the pipe was kept at about 22 cm above the ground. The water levels were measured using an absolute pressure water-level sensor (Onset computer Corp, Bourne, MA, USA), recorded in 30-min intervals. The water-level data were compensated using the barometric pressure readings recorded by the NDAWN station, located about 675 m northwest of the field.
2.6.4. Vegetables
For the field experiments, Celebrity (Johnny’s Selected Seeds, Winslow, ME, USA) variety was selected for tomato, which is disease resistant, high yield, and semi-determinate. Sangria variety (Agassiz Seed & Supply, West Fargo, ND, USA) was selected for watermelon, which was chosen due to its suitability in a cold climate. Both seeds were planted in a greenhouse and then transplanted in the field. The average management timelines in dates are listed in Table 3 though there were some differences among different treatments.
2.7. Vegetable Management
Topping, staking, fencing, weeding, and watering are some of the management techniques used for tomato plants, whereas curling, weeding, and watering are for watermelon. Irrigation was applied manually until the plants were acclimated to the field conditions after transplantation. Black plastic and landscape fabric mulches suppressed the weeds more effectively, while clear plastic mulch did not suppress the weeds until the temperatures increased, and weeds began to die due to high temperature exposure underneath the mulch. A hand weeder was used to clear the weeds between the rows, while weeds on the rows were removed manually. Chicken-wire fence was installed around the field to avoid crop damage due to small animals, such as rabbits.
In the middle of the growing season, when tomato plants grew taller and started flowering, tomato tops were manually taken off to limit the growth of non-fruit biomass. In 2019, tomato plants were left unstacked, but in 2020, due to high wind damage, small poles were used to stake and support the tomato plants from strong winds. This step greatly reduced the tomato plant/twig damages caused by the wind for the remaining growing season. Watermelons were curled at the vanes around each plant, which helped in separating the plants to ensure the accuracy of field observations for each individual plant.
2.8. Field Observations
Soil water potential, soil temperature, rainfall, the flow rate from the hydrant, flow rate from each control unit, and groundwater levels were collected every week. Once signs of fruit growth were experienced, the number of red and green tomatoes per plant and number of watermelons were counted, while their sizes were also measured on a weekly basis during the growing season. At the end of the season, after all fruits were harvested, the above-ground biomass for each plant and the maximal length for watermelon were measured in the field. Yield samples were collected from each plot for quality analysis.
2.9. Fruit Quality Analysis
Both tomato and watermelon samples were collected and blended to measure pH, electrical conductivity (EC), and sugar content using a handheld pH meter (Hanna Instruments Inc., Woonsocket, RI, USA), a pH/ISE benchtop multiparameter meter (ThermoFisher Scientific Inc., Waltham, MA, USA), and a refractometer (Spectrum Technologies Inc., Plainfield, IL, USA), respectively. The handheld refractometer measures the sugar content of the sample in percentage (%). Fruit diameter and fruit weight were also measured for tomatoes, whereas fruit length, diameter, and weight were measured for the watermelon samples.
2.10. Statistical Analysis
The statistical analysis was conducted using the Statistical Analysis System (SAS) to evaluate the impact of mulch, irrigation, and the combined effect on fruit weight, diameter, and each quality parameter. Weekly tomato yield and quality parameters were used in the analysis of the dependent variables (weight, diameter, EC, pH, and sugar content) and the independent variables (time, mulch, irrigation, and together). Two-way ANOVA analysis was used to study the impact of mulch, irrigation, and the two together on fruit weight, length, and quality parameters.
3. Results and Discussion
3.1. Weather Conditions
During the two-year experiment, the weather conditions were extremely different, with a very wet year in 2019 and a very dry year in 2020. Thus, the irrigation system was tested in both wet and dry years. Rainfall, potential evapotranspiration (PET), and air and soil temperatures are some of the major weather parameters that may have had a certain impact on this research. The different monthly average weather parameters are shown in Table 4.
Typically, tomato and watermelon require 400 to 600 mm of water to grow in the sub-humid region. Due to the frequent and large amount of rainfall in the 2019 growing season, there was a small difference (281 mm) between the rainfall (558 mm) and the PET (839 mm), and less irrigation was required to meet the plants’ water demands. Since mulches can help conserve the soil moisture in the root zone, reduce the evaporation, and increase the transpiration [37], it further eliminated the need for irrigation in 2019. In 2020, the PET (977 mm) was much higher (573 mm) than the rainfall (404 mm), which required much more frequent irrigation in all plots. The vegetables were irrigated a few times under the DI PF, DI NM, and DI CP treatment in 2019, whereas many irrigation events occurred in 2020 due to large gaps between the rainfall and the PET. This strongly represented the need for irrigation in low or variable rainfall seasons and the importance of smart irrigation to avoid over or under irrigation.
3.2. Soil Moisture and Temperature
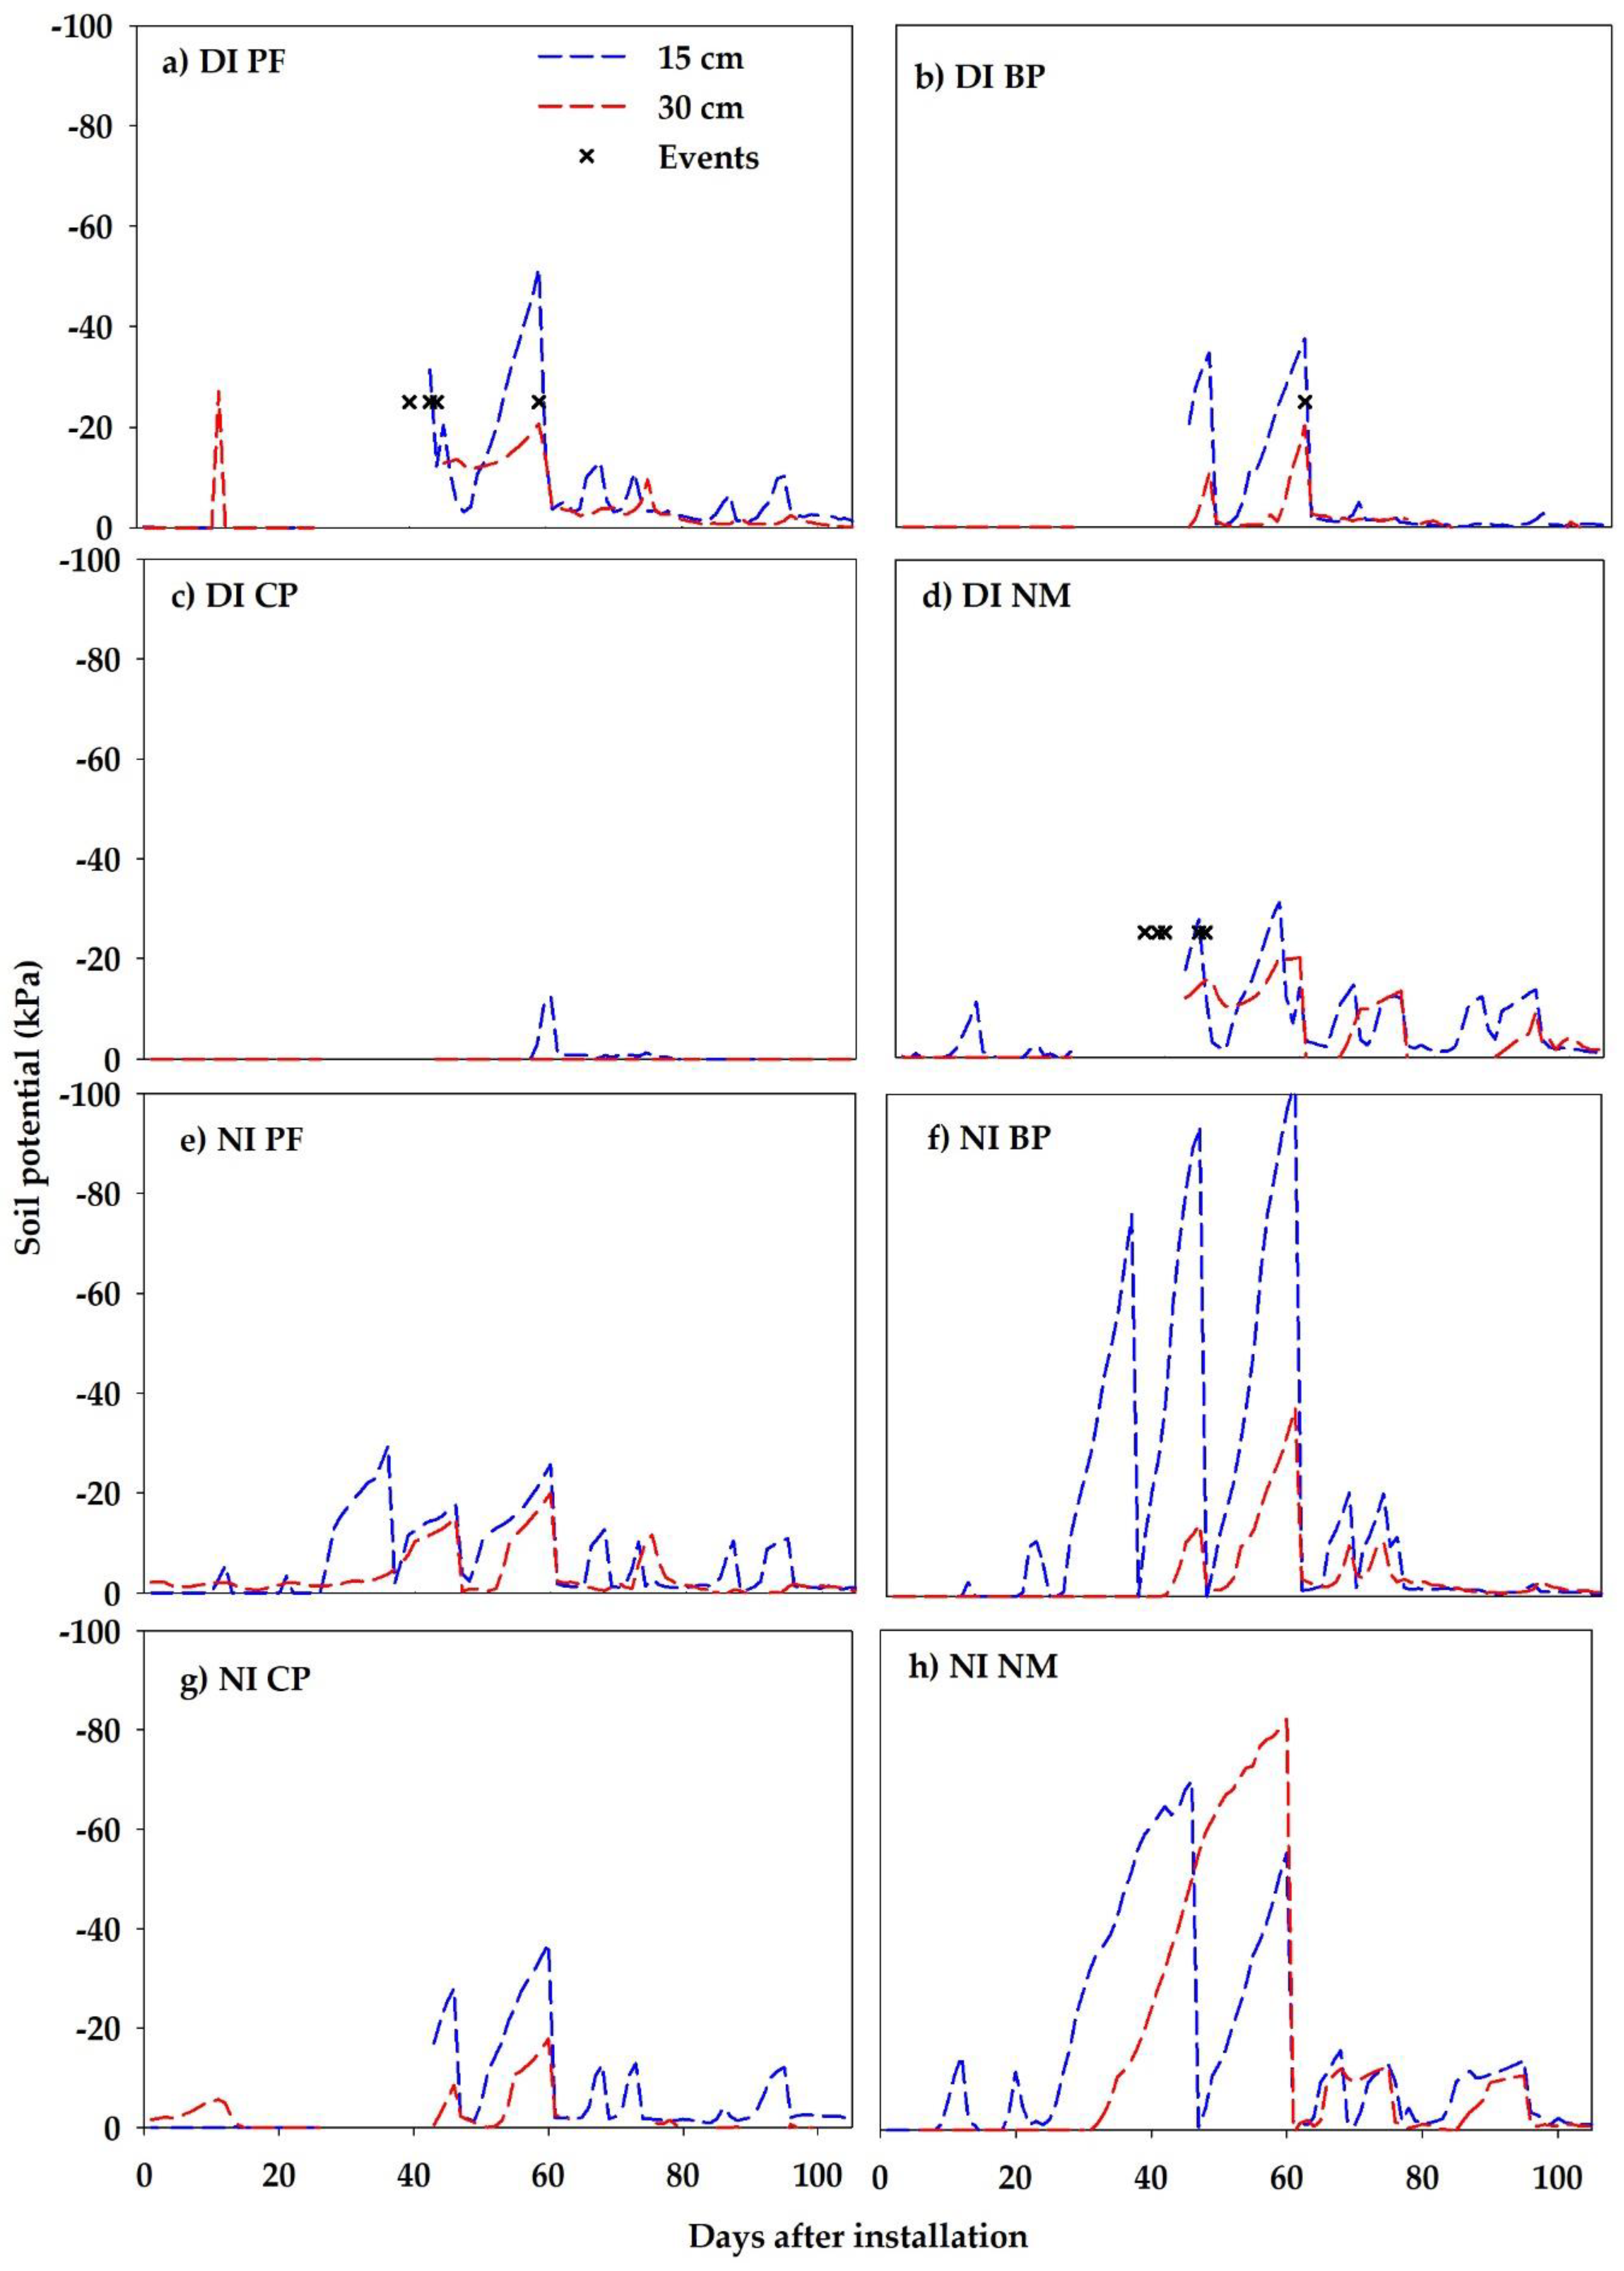
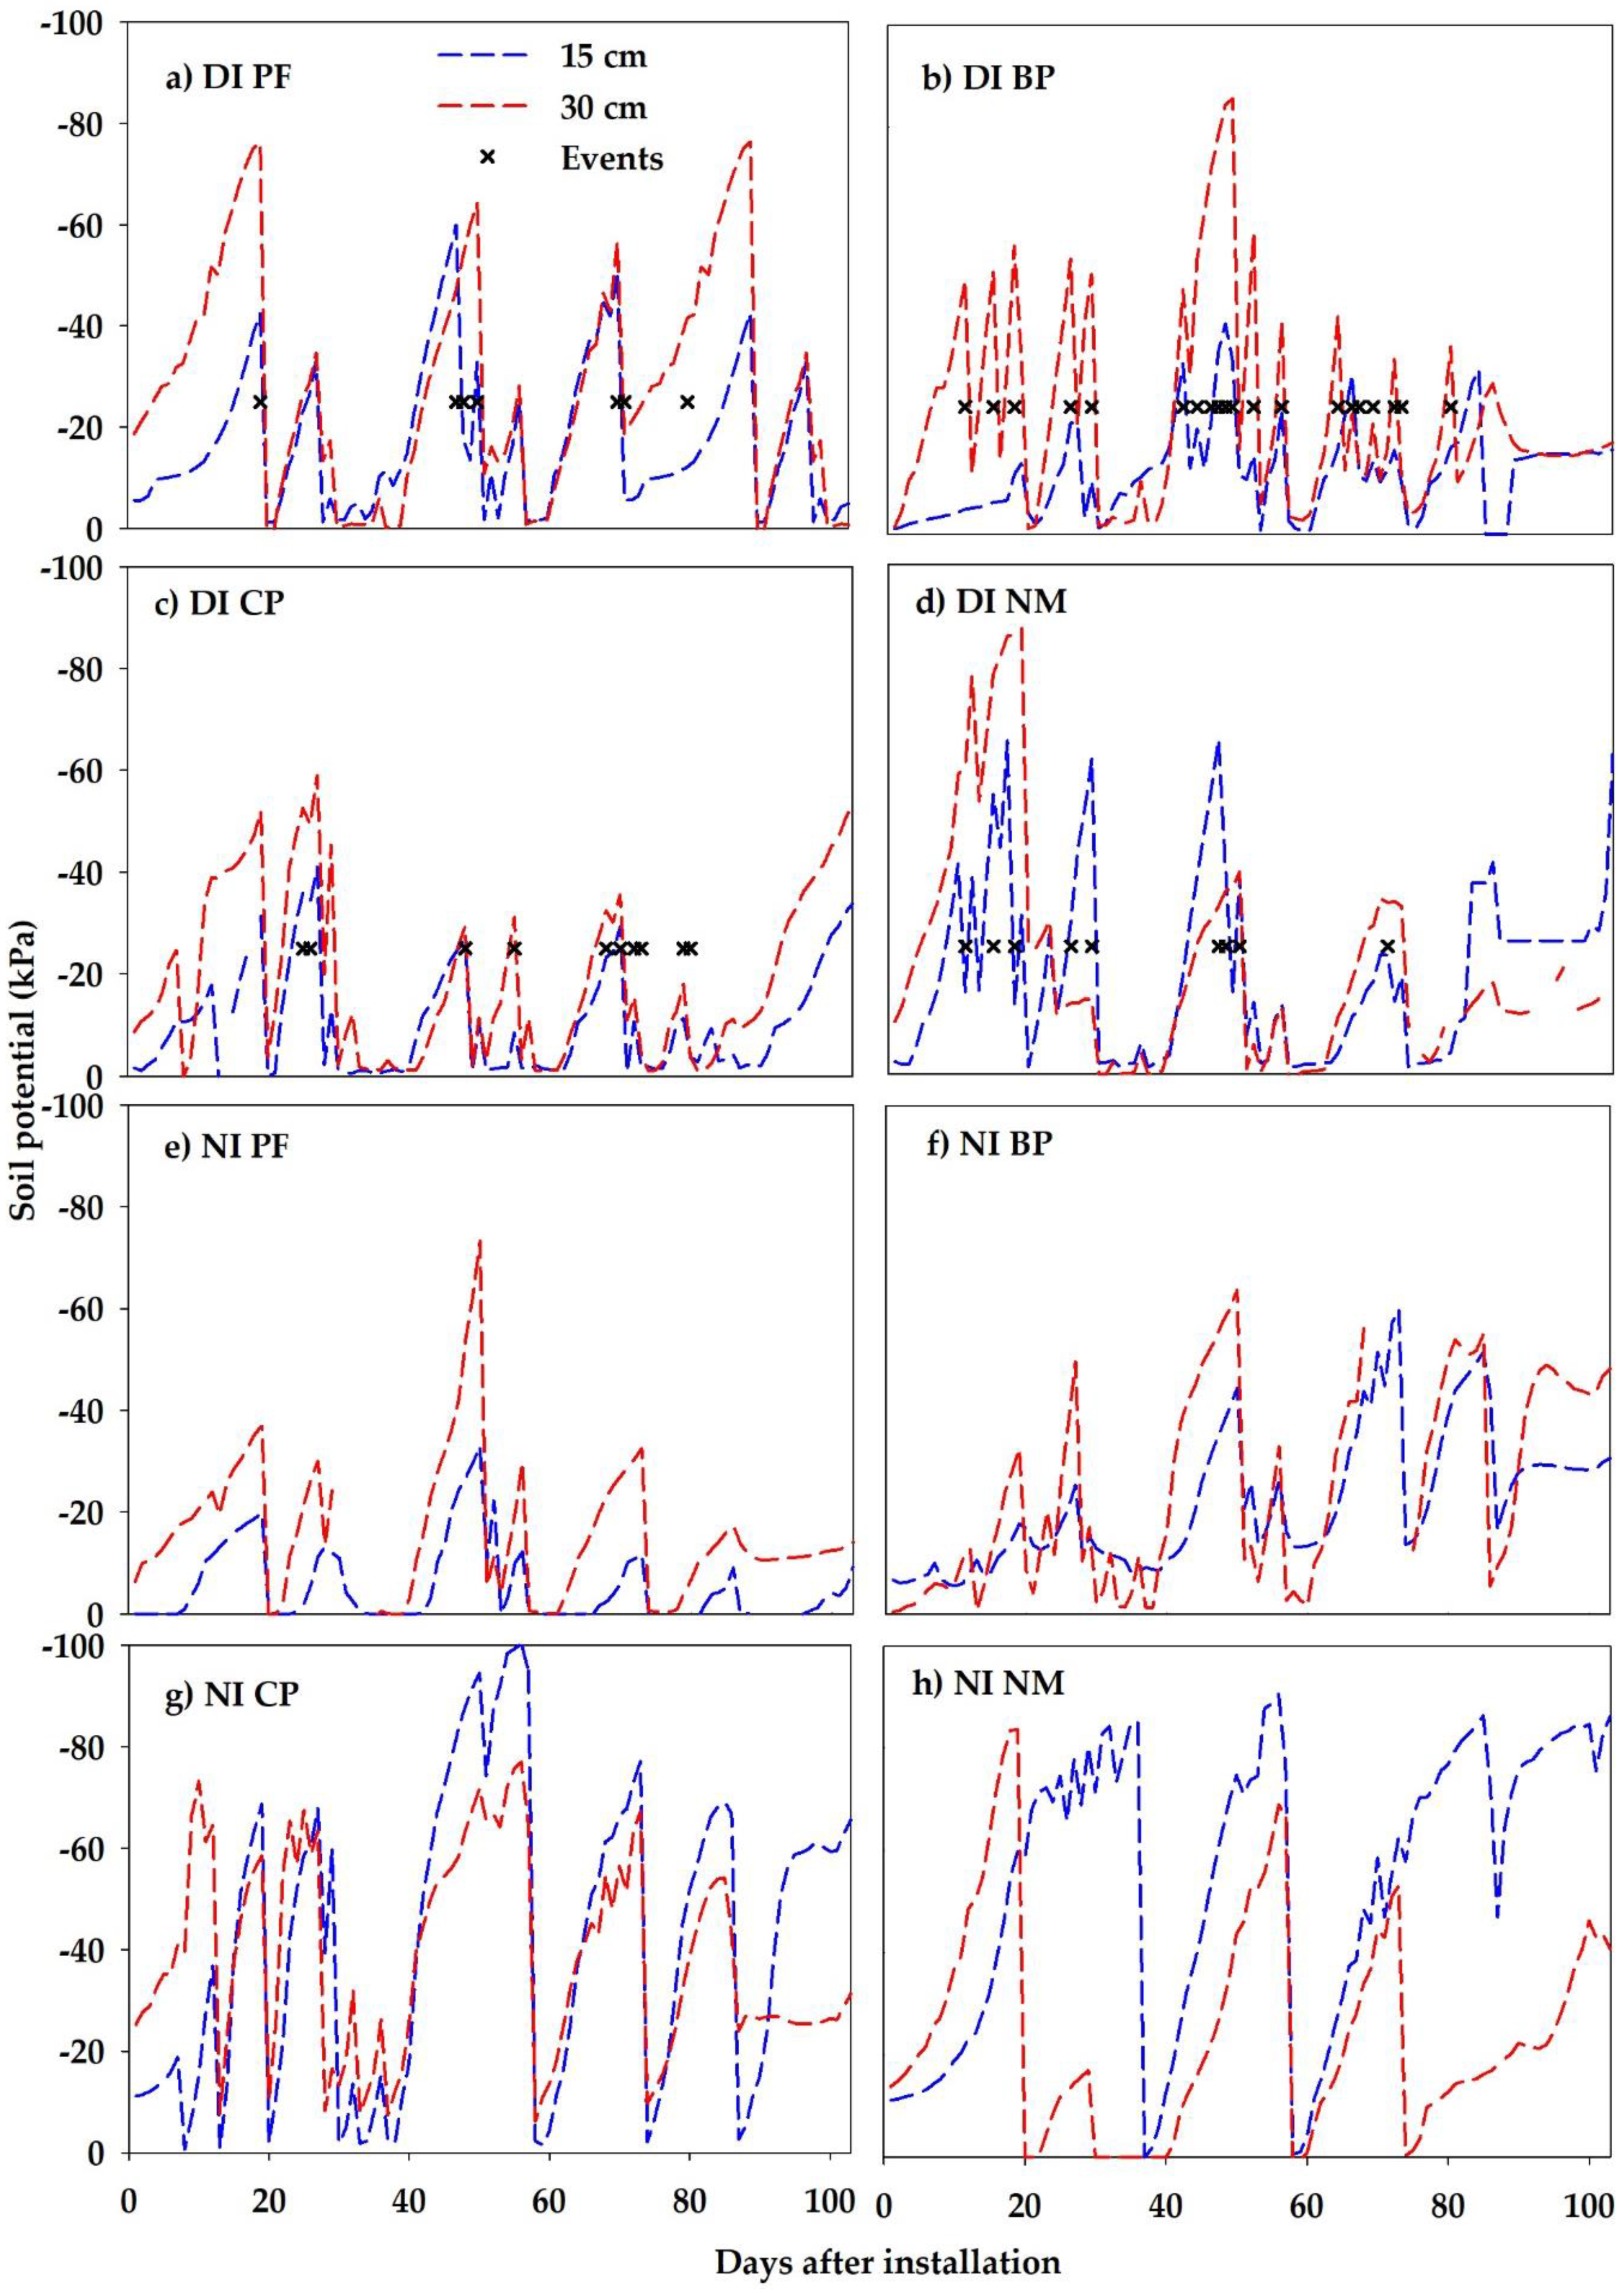
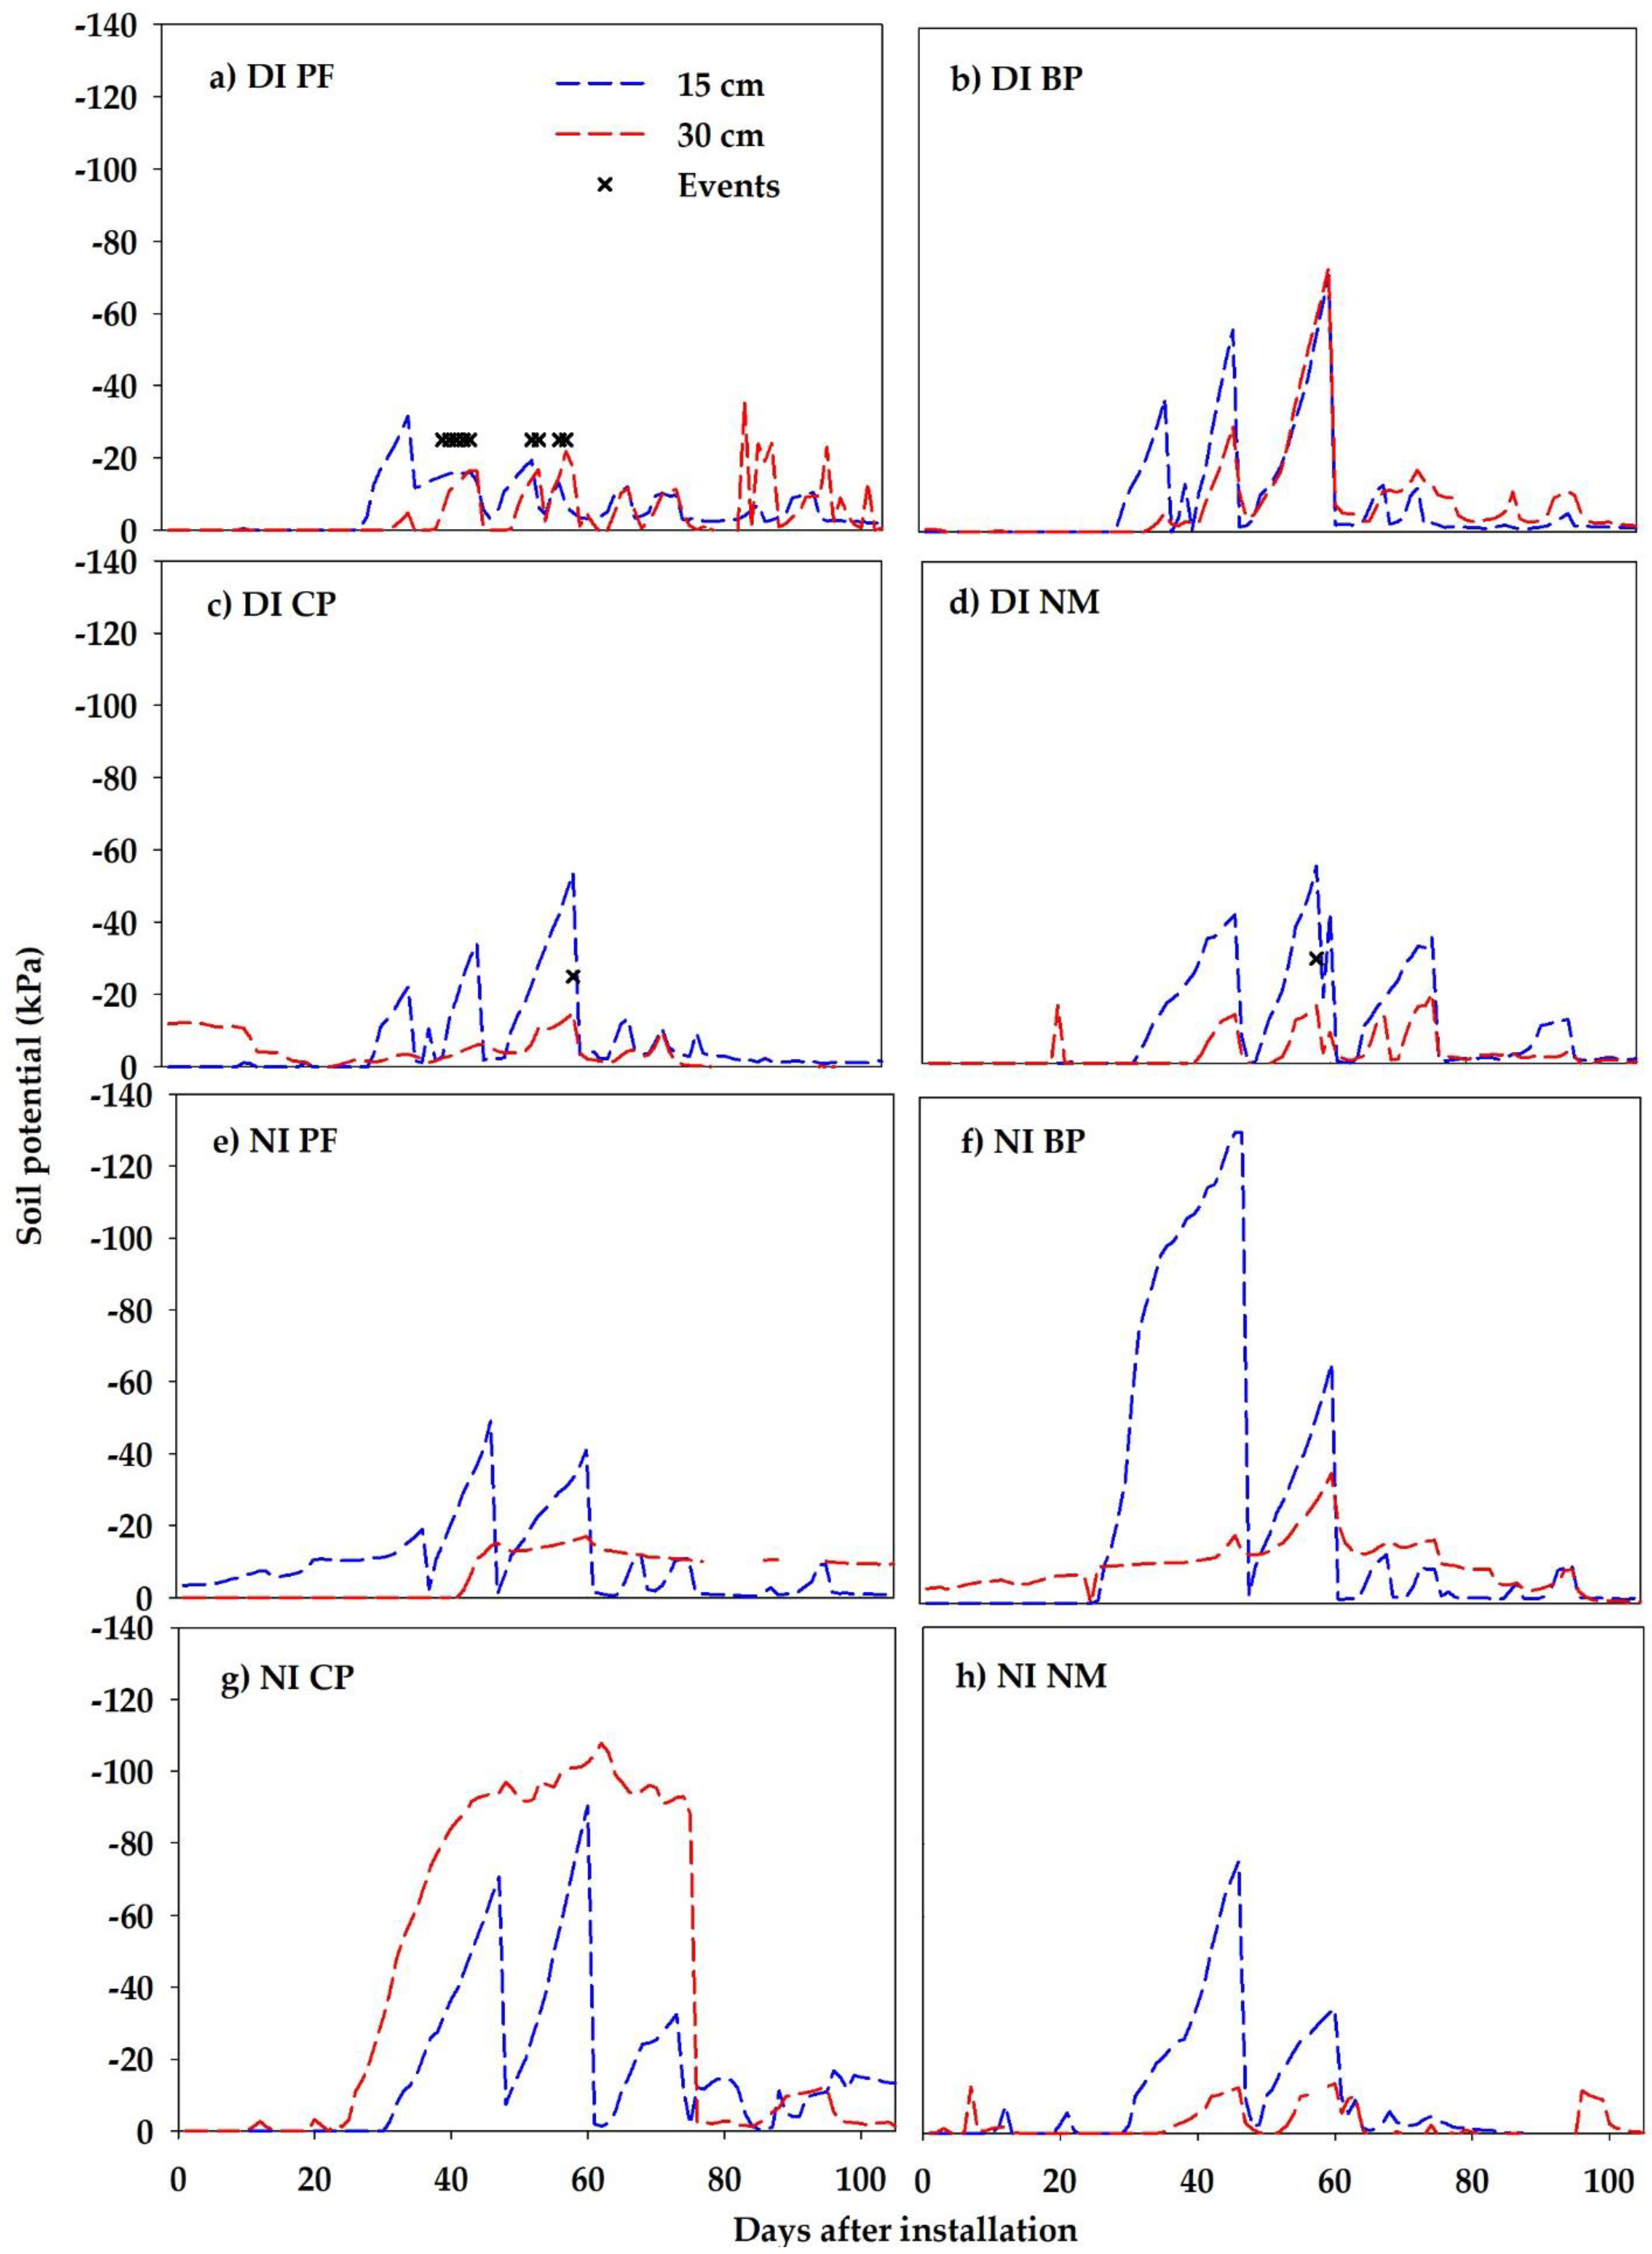
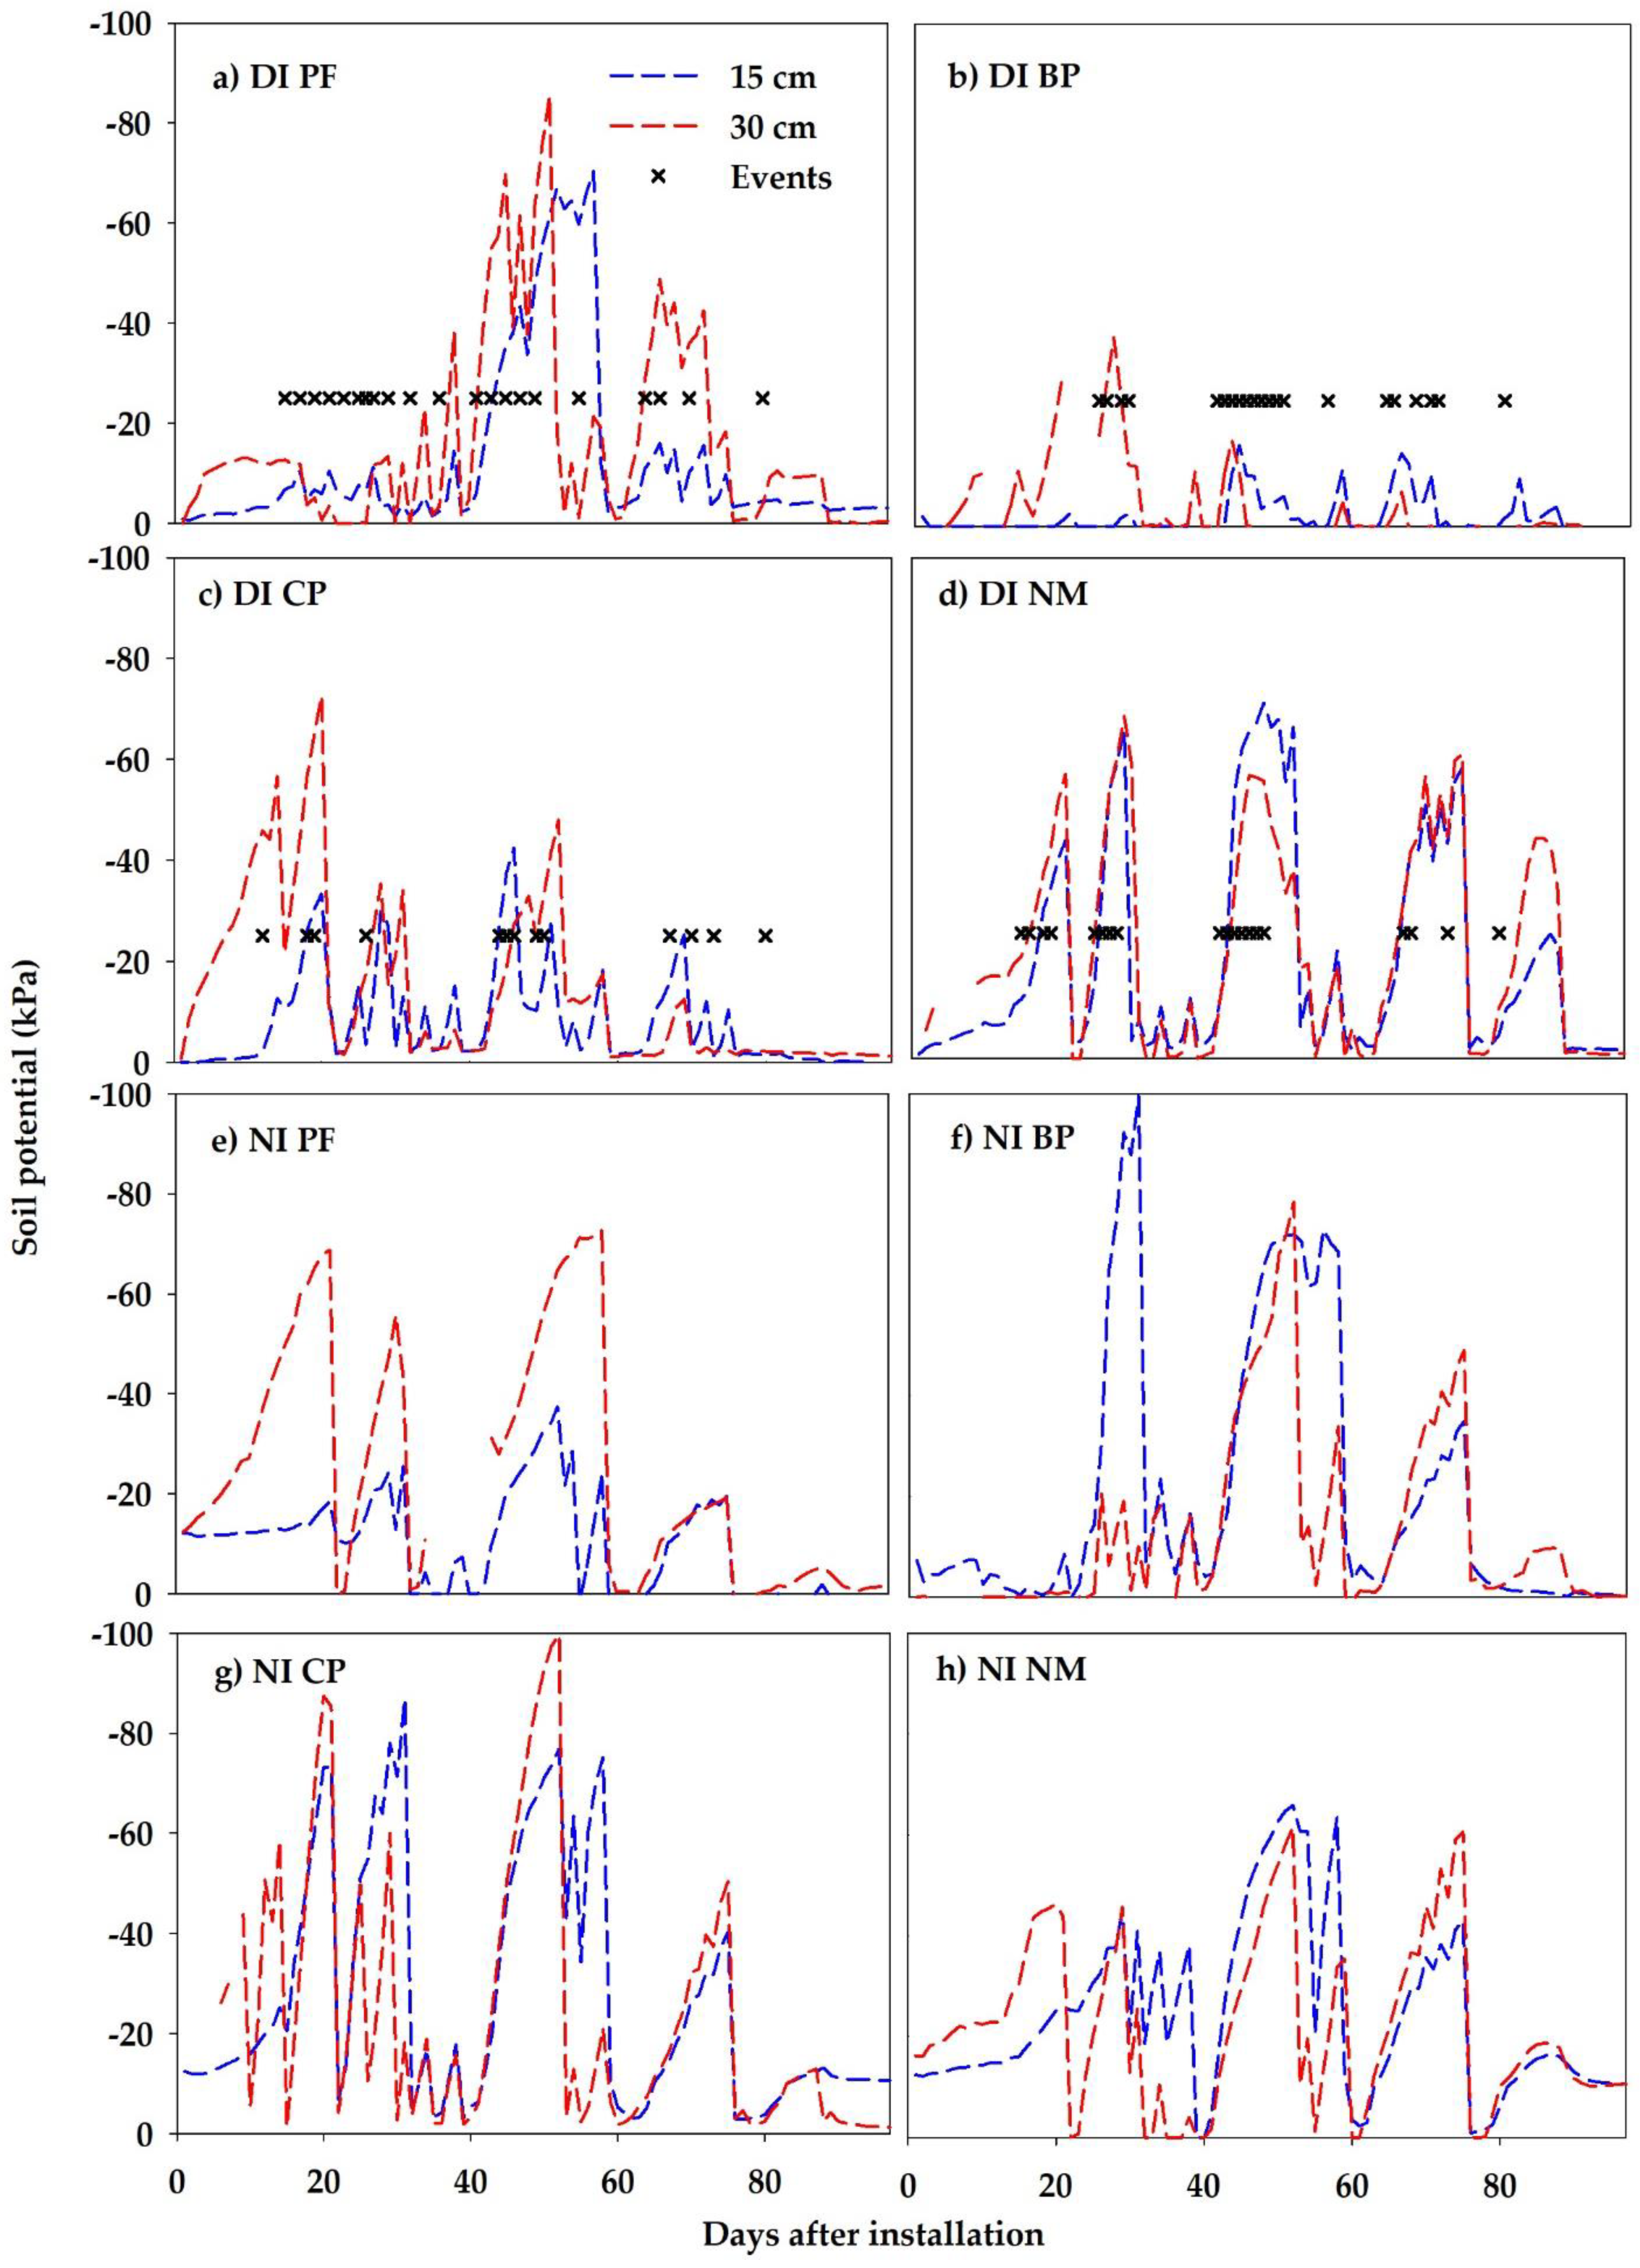
Two soil water potential sensors were used monitor the soil water status potential in each plot, and two sensors were connected to the controller to trigger the drip irrigation. They were same type of sensors and were located at the nearby locations from the plant. The average soil water potential at 15 and 30 cm from the three plots for each treatment are plotted in Figure 3 and Figure 4 for tomato plants in 2019 and 2020, respectively, whereas Figure 5 and Figure 6 are for the watermelon plots. The irrigation events are also marked on the figures.
In most cases, the soil water potential at 15 cm is smaller (drier) than that at 30 cm in 2019 for both tomato and watermelon (Figure 3 and Figure 5), while less irrigation was applied. In contrast, the soil water potential at 30 cm is smaller (drier) than that at 15 cm in 2020 when frequent irrigations were applied (Figure 4 and Figure 6). With less irrigation, the soil evaporation from the surface can dry up the surface soil, which can result in a drier surface and low soil moisture at 15 cm depth. With more irrigation, water was applied from the surface, leaving a wet surface layer; in addition, water was consumed more at the deeper layer.
The irrigation events were marked on the figures. Theoretically, irrigation system is triggered whenever the average soil water potential is less (drier) than the threshold value. However, the threshold value was not a fixed value but rather ranged from −5 kPa to −80 kPa if using the soil potential from the average of all six monitoring sensors. The variable values were probably caused by several reasons. The first would be the variabilities among the sensors, six monitoring sensors vs. two sensors, linked to the controller to trigger the irrigation. The second reason was due to the difference in irrigation and crop water requirement that caused the soil potential difference. The last reason would be a lack of soil-specific calibration between the set point on the controller and the corresponding soil potential. As reported by [38], the sensors were calibrated by the manufacture and worked as well as the on-site calibration and were sufficient for irrigation scheduling.
The soil water potential under plastic mulches (both CP and BP) are larger (wetter) than those under PF and NM treatments. In addition, the soil potential values under the PF are close to those under the NM, but the PF controlled weed growth completely. The similar water status between PF and NM is probably due to the porous feature of the PF that did not prevent any water infiltration. In both years’ field experiments, the average soil water potential was recorded the lowest (driest) in July, which was during the flowering stage, while the highest average temperature was also recorded in July.
Irrigation events in 2020 were plotted along with the average soil water potential in Figure 4 and Figure 6. For tomatoes, only the DI PF treatment was irrigated three times, and DI NM treatment two times in 2019, whereas DI BP and DI CP treatments did not irrigate a single time. This could be due to less evaporation under the plastic mulches compared to the landscape fabric and bare soil. To evaluate the evaporation from the soil surface under plastic mulches, Ref. [39] even punched holes through the mulch at different rates and found that the evaporation rate was reduced 69.26% if there were no holes in the mulch; if 7.24% of the mulch areas had holes, the evaporation was only reduced by 20.5%. This showed the impact of plastic mulch on reduction of evaporation rate. However, in 2020, DI NM treatment was irrigated four times, followed by DI PF 7 times, DI CP 13 times, and DI BP 20 times. Total number of irrigation events that occurred in 2020 for BP mulch treatment was the highest, which could be due to high crop transpiration under the mulches [36]. Additionally, heavy winds that occurred during the field experiments lead to mulch flapping, which could increase the evaporation rate whenever the soil surface was exposed [39].
Similarly, the DI PF treatment irrigated three times, and the DI CP treatment irrigated once in watermelon plots during the 2019 field experiment, whereas in 2020, the irrigation events occurred many times, with DI CP 12 times, DI NM 19 times, and DI BP and DI PF 21 times. This clearly showed that the watermelon consumed much more water than tomato in 2020. In addition, the increase in the number of irrigation events that occurred for watermelon compared to tomato is possibly due to the higher watermelon transpiration rate. Ref. [40] conducted a field experiment to study the effect of plastic mulches and wheat straw compared to bare soil on water loss through evaporation and transpiration from the soil surface and found that the water loss due to evaporation was higher under bare soil than that under plastic mulches. However, the transpiration rate was higher under plastic mulches than that under bare soil. Overall, the water loss by transpiration loss under mulch was higher than that by evaporation under bare soil, which results in a higher water loss with plastic mulch due to a much healthier plant and higher transpiration rate. Compared to 2019, the yield and quality of the produce from plastic mulches with irrigation treatment was higher in 2020.
The soil temperature variation under different mulches was compared, and the results in 2019 and 2020 with no irrigation (NI) are shown in Table 5.
During the field experiment, the highest monthly average air temperature was recorded in July with 22.47 and 23.17 °C in 2019 and 2020, respectively, while the minimum air temperature was found in October (Table 4). During the experiment, soil temperature at both depths were recorded the highest in July in both 2019 and 2020 for all treatments, which corresponded with the highest air temperature in July.
The monthly average soil temperature of each NI treatment was used to evaluate the temperature changes due to different mulches. In tomato plots, the average soil temperature under the CP treatment recorded the highest soil temperature throughout the season and among all treatments. The average soil temperature at 15 and 30 cm under the CP was 2.89 °C and 2.9 °C higher than that under the NM treatment in 2019. However, for watermelon, the highest temperature increase was in June, where the soil temperature at 15 cm depth under the CP was 4.65 and 2.34 °C higher than that under the NM field in 2019 and 2020. The soil temperature increase at 30 cm depth was only 2.91 and 2.08 °C in 2019 and 2020, respectively. Overall, it was found that the monthly average soil temperature under the CP was always higher than any other treatments in both years. Thermal properties of the material have a major impact on soil temperature variation on different mulch types. Black plastic absorbs the longwave radiation and transmits the absorbed energy to the soil through conduction, whereas clear plastic transmits 85 to 95% of the absorbed solar radiation and controls the heat loss to the atmosphere by blocking the longwave infrared radiation which keeps the surface warm [13].
3.3. Vegetable Yield
Tomato harvesting started in August and ended in October in both years and lasted for 50 and 39 days in 2019 and 2020, respectively. The short harvesting period in 2020 was possibly due to the strong winds earlier in the season that damaged some plants and twigs and delayed the fruit development. For watermelon, the fruit harvest period lasted for 26 and 35 days in 2019 and 2020, respectively. For the yield estimation, considering 9.29 m2 as the area required for each plot, the total number of plants that can be grown for a hectare was calculated, and the yield was calculated based on the total number of ripened fruits per plot, total number of plants per plot, and the average weight of a sample. The total yields for tomato and watermelon are summarized for each treatment (Table 6).
In 2019, with frequent and sufficient rainfall, it was expected that there should be no yield difference between the DI and the NI treatments. If there were any differences, it should have been caused by other factors, such as mulch covers, water level, spatial variation, etc. In 2020, however, since the irrigation was frequently applied, a higher yield difference was expected between the DI and the NI treatments. For tomato, the yield for DI treatment was around 36% higher than those with NI, while for watermelon, a 27.6% higher yield was obtained for DI treatments compared to that for NI treatments. Among the different treatments, the highest yield for tomato was from the NI NM treatment in 2019 (Table 6), probably due to fewer survival plants in the plot, which resulted in large spaces between plants. The actual plot with the highest yield was from DI BP, at 40.24 Mg ha−1. The average tomato yield was slightly higher in 2019 than that in 2020, indicating that sufficient rainfall benefited the crop yield. In addition, the tomatoes were transplanted late in 2019, when the mulches might not have been really needed. For watermelon, the highest yield was recorded under the DI CP treatment with 165.55 Mg ha−1 in 2020. The average yield was also three times higher in 2020 than that in 2019, indicating that irrigation and warmer weather were the key factors for a higher watermelon yield. However, comparing to all other treatments, the irrigation demand under the DI CP was the least though it produced the highest yield. This was similar to what [41] found: the maximum irrigation water use efficiency for watermelon was found under clear plastic mulch compared to black plastic and grey-black film mulches.
3.4. Vegetable Quality
Fruit-quality parameters, such as EC, pH, and sugar content, were measured from the tomato and watermelon samples collected during the field experiments, and the average of each parameter are shown in Table 7 and Table 8, respectively.
pH is one of the most important parameters for tomatoes as well as sugar content for watermelon. Soil temperature and soil water content are the most important factors for yield and the quality of produce. Weather parameters were completely different in 2020 when compared to 2019. Tomato yield in 2020 was heavier and juicier than that in 2019. However, watermelon yield in 2020 was heavier with a higher sugar content (%) than that in 2019. This could be due to the change in weather parameters, such as precipitation, temperature, solar radiation, wind speed, etc.
Quality parameters obtained during 2019 and 2020 field experiments were used to evaluate the effect of mulch and irrigation as well as their interactions. Results obtained from the statistical analysis are shown in Table 9. For tomatoes, in 2019, most of the quality parameters were significantly different (p < 0.05) under mulches than the irrigation and their interactions. The average fruit weight and diameter under the DI treatments are significantly higher (p < 0.05) than those under irrigation and their interactions. The EC and pH under the BP treatments are higher (p < 0.05) than those under other treatments. The pH of the samples under DI BP treatment was better than that under other treatments. Quality parameters under PF showed no significant difference than that under the NM treatments, but the BP and CP produced the best quality produce. Overall quality parameters were better under DI CP treatments, whereas soil temperature was warmer under CP, which had a positive impact on the quality.
Similarly, watermelon parameters under DI and NI plots were almost similar in 2019 (Table 9). Whereas, the average watermelon weight and diameter under the CP were significantly different from the other treatments (p < 0.01). The EC were affected (p < 0.05) by the irrigation treatment, whereas the sugar content was affected (p < 0.05) by mulch. Watermelon under DI CP is much heavier and produced the highest yield compared to all other treatments. It is worth noticing that mulch significantly affected the weight, size, and quality parameters in 2019 for both vegetables. Thus, polyethylene mulches had a positive impact on yield, weight, and other quality parameters, and these results were similar to results of other researches [11,20,42]. In 2020, when less rainfall was received in the field, irrigation played an important role for the weight, size, and quality parameters. Therefore, the combined drip and mulch is a proven practice for a successful vegetable growth in North Dakota.
3.5. Irrigation
The accumulative rainfall during the field experiments was plotted against the total amount of irrigation water under each treatment (Figure 7).
In 2019, the field received a total of 490 mm of rainfall, which was sufficient to meet the water requirement for the two vegetables. The soil water status, as shown in Figure 3 and Figure 5, also proved that the soil was kept wet and did not go beyond the soil potential threshold, which restricted the controller to trigger the irrigation. In 2020, with only 366 mm of rainfall during the experimental period and a warmer temperature (Table 4), more water was needed to meet the crop water demand, while the SMS-based controller performed the same with frequent irrigation events. For tomato, drip irrigation under the BP treatment was turned on very often and applied a larger amount of water than any other treatment, with the order of the irrigation times and amounts as BP > CP > PF > NM. Black mulch and drip irrigation performed better on tomato growth, yield, and quality, which was reported before in [25,43]. For watermelon, the irrigation times and amounts followed the order of BP > PF > NM > CP. For watermelon, the accumulative irrigation amount under the CP treatment was the least compared to all other treatments, but the CP plots produced the highest yield and best-quality watermelon (Table 6). This was because the CP thermal properties maintained the warm temperature and increased the transpiration rate, while watermelon needed the warm temperature and the optimal amount of water for its production. This finding was different from another study [20] in which the best yield was obtained from black plastic mulch and drip irrigation.
4. Conclusions
A two-year field experiment was conducted to test the automatic irrigation systems under clear plastic, black plastic, landscape fabric, and no mulch for tomato and watermelon production in North Dakota. The irrigation was scheduled based on the preset soil potential threshold at the wet zone in one of the three plots for each treatment. Two soil potential and two soil temperature sensors were installed in each plot to monitor the soil water potential status. The results showed that the irrigation was automatically triggered each time the soil potential was above the preset threshold. With frequent rainfall in 2019, the irrigation was barely applied, but the mulch effect was more evident. The soil temperature under clear plastic mulch was always higher than other mulches, with the highest increase of 4.65 °C at 15 cm in June 2019 compared to the no mulch treatment for watermelon. Tomatoes under black plastic mulch and drip irrigation had the highest yield compared to all other treatments, with 40.24 Mg ha−1. For watermelon, the highest yield was from drip irrigation under clear plastic mulch, with 54.67 and 165.55 Mg ha−1 in 2019 and 2020, respectively. The treatment under the clear plastic mulch used the least amount of irrigation (63 mm) but produced the highest yield for watermelon in 2020. Through the two-year study, the automatic sensor-controlled irrigation provided a perfect example on optimal irrigation, with no over irrigation in 2019, a wet year, and no under irrigation in 2020, a dry year. Future research should focus on testing the irrigation controller for a specific soil and crop and determining its threshold for higher yield and better quality.
Author Contributions
Conceptualization, U.B.P.V. and X.J.; methodology, U.B.P.V. and X.J.; investigation, U.B.P.V. and X.J.; resources, X.J.; writing—original draft preparation, U.B.P.V.; writing—review and editing, X.J., J.L., T.F.S. and C.W.L.; supervision, X.J.; funding acquisition, X.J. All authors have read and agreed to the published version of the manuscript.
Funding
This research was funded by North Dakota Department of Agriculture and ND Water Resources Research Institute.
Institutional Review Board Statement
Not applicable.
Informed Consent Statement
Not applicable.
Data Availability Statement
Not applicable.
Acknowledgments
This project was supported by the North Dakota Department of Agriculture (NDDA). Also, we are thankful to North Dakota Water Resources Research Institute (NDWRRI) for providing the fellowship, which allowed us to complete the experiments. We would like to thank department staff and students who helped to complete the field experiment successfully. We also want to thank the reviewers and the associate editor for their valuable comments. The authors would like to thank Dongqing Lin and Shad Mack for their technical support and help with field work.
Conflicts of Interest
The authors declare no conflict of interest.
References
- NDSU Extension. North Dakota Agriculture. Ag Statistics No. 87. 2018. Available online: https://www.nass.usda.gov/Statistics_by_State/North_Dakota/Publications/Annual_Statistical_Bulletin/2018/ND-Annual-Bulletin18.pdf (accessed on 8 July 2021).
- USDA NASS. Census of Agriculture for Tomato and Watermelon for 2012 and 2017. Available online: https://www.nass.usda.gov/Publications/AgCensus/2017/Full_Report/Volume_1,_Chapter_1_State_Level/North_Dakota/st38_1_0036_0036.pdf (accessed on 8 July 2021).
- Aguyoh, J.; Taber, H.G.; Lawson, V. Maturity of fresh market sweet corn with direct seeded plants, transplants, clear plastic mulch, and row cover combinations. HortTechnology 1999, 9, 420–425. [Google Scholar] [CrossRef]
- Kwabiah, A.B. Growth, maturity, and yield responses of silage maize (Zea mays L.) to hybrid, planting date and plastic mulch. J. New Seeds. 2005, 7, 37–59. [Google Scholar] [CrossRef]
- Dı´az-Pe´rez, J.C.; Batal, K.D. Colored plastic film mulches affect tomato growth and yield via changes in root-zone temperature. J. Amer. Soc. Hort. Sci. 2002, 127, 127–135. [Google Scholar] [CrossRef] [Green Version]
- Kara, B.; Atar, B. Effects of mulch practices on fresh ear yield and yield components of sweet corn. Turkish J. Agric. For. 2013, 37, 281–287. [Google Scholar]
- Kwabiah, A.B. Growth and yield of sweet corn (Zea mays L.) cultivars in response to planting date and plastic mulch in a short-season environment. Sci. Hortic. 2004, 102, 147–166. [Google Scholar] [CrossRef]
- Liu, C.A.; Jin, S.L.; Zhou, L.M.; Jia, Y.; Li, F.M.; Xiong, Y.C.; Li, X.G. Effects of plastic film mulch and tillage on maize productivity and soil parameters. Europe. J. Agron. 2009, 31, 241–249. [Google Scholar]
- Zhang, S.; Li, P.; Yang, X.; Wang, Z.; Chen, X. Effects of tillage and plastic mulch on soil water, growth and yield of spring-sown maize. Soil Tillage Res. 2011, 112, 92–97. [Google Scholar] [CrossRef]
- Zhou, L.M.; Li, F.M.; Jin, S.L.; Song, Y. How two ridges and the furrow mulched with plastic film affect soil water, soil temperature and yield of maize on the semiarid Loess Plateau of China. Field Crop. Res. 2009, 113, 41–47. [Google Scholar] [CrossRef]
- Bye, H.D. Sweet Corn Production with Different Mulches, Varieties, and Planting Dates in North Dakota. Master’s Thesis, Department of Agricultural and Biosystems Engineering, North Dakota State University, Fargo, ND, USA, 2016. [Google Scholar]
- Jia, X.; Ransom, J.; Roy, D. Prediction of phenological development and maturity of two corn hybrids in eastern North Dakota. In Proceedings of the 2014 ASABE Annual International Meeting, Montreal, QC, Canada, 12–16 July 2014. Paper No. 1913820. [Google Scholar]
- Lament, W.J. Plastic mulches for the production of vegetable crops. HortTechnology 1993, 3, 35–39. [Google Scholar] [CrossRef] [Green Version]
- Ibarra-Jiménez, L.; Zermeño-González, A.; Munguía-López, J.; Quezada-Martín, M.A.R.; De La Rosa-Ibarra, M. Photosynthesis, soil temperature and yield of cucumber as affected by colored plastic mulch. Acta Agric. Scand. Sect. B Soil Plant Sci. 2008, 58, 372–378. [Google Scholar] [CrossRef]
- Liakatas, A.; Clark, J.A.; Monteith, J.L. Measurements of the heat balance under plastic mulches. Part I. Radiation balance and soil heat flux. Agric. Meteorol. 1986, 36, 227–239. [Google Scholar] [CrossRef]
- Souvandouane, S.M.; Esguerra, K.H.; Heo, C.M.; Rico, S.C.L. Effects of planting dates and mulch types on the growth, yield and chemical properties of waxy corn crosses SonjajangxKNU-7 and AsanxKNU-7. Korean J. Crop Sci. 2010, 55, 91–97. [Google Scholar]
- Ham, M.; Kluitenberg, G.J.; Lamont, W.J. Optical properties of plastic mulches affect the field temperature regime. J. Am. Soc. Hort. Sci. 1993, 118, 188–193. [Google Scholar] [CrossRef] [Green Version]
- Tarara, J.M. Microclimate modification with plastic mulch. Hort Sci. 2000, 35, 169–180. [Google Scholar] [CrossRef] [Green Version]
- Biswas, S.K.; Akanda, A.R.; Rahman, M.S.; Hossain, M.A. Effect of drip irrigation and mulching on yield, water-use efficiency and economics of tomato. Plant Soil Environ. 2015, 61, 97–102. [Google Scholar]
- Romic, D.; Borosic, J.; Poljak, M.; Romic, M. Polyethylene mulches and drip irrigation increase growth and yield in watermelon (Citrullus lanatus L.). Eur. J. Hort. Sci. 2003, 68, 162–168. [Google Scholar]
- Shrivastava, P.K.; Parikh, M.M.; Sawani, N.G.; Raman, S. Effect of drip irrigation and mulching on tomato yield. Agric. Water Manag. 1994, 25, 179–184. [Google Scholar] [CrossRef]
- Marouelli, W.A.; Silva, W.L.C. Water tension thresholds for processing tomatoes under drip irrigation in Central Brazil. Irrig. Sci. 2007, 25, 411–418. [Google Scholar] [CrossRef]
- Ngouajio, M.; Wang, G.; Goldy, R. Withholding of drip irrigation between transplanting and flowering increases the yield of field-grown tomato under plastic mulch. Agric. Water Manag. 2007, 87, 285–291. [Google Scholar] [CrossRef]
- Abdelkhalik, A.; Pascual-Seva, N.; Nájera, I.; Giner, A.; Baixauli, C.; Pascual, B. Yield response of seedless watermelon to different drip irrigation strategies under Mediterranean conditions. Agric. Water Manag. 2019, 212, 99–110. [Google Scholar] [CrossRef]
- Amayreh, J.; Al-Abed, N. Developing crop coefficients for field-grown tomato (Lycopersicon esculentum Mill.) under drip irrigation with black plastic mulch. Agric. Water Manag. 2005, 73, 247–254. [Google Scholar] [CrossRef]
- Yang, P.; Hu, H.; Tian, F.; Zhang, Z.; Dai, C. Crop coefficient for cotton under plastic mulch and drip irrigation based on eddy covariance observation in an arid area of northwestern China. Agric. Water Manag. 2016, 171, 21–30. [Google Scholar] [CrossRef] [Green Version]
- Dukes, M. Two Decades of Smart Irrigation Controllers in the U.S. Landscape Irrigation. Trans. ASABE 2020, 63, 1593–1601. [Google Scholar] [CrossRef]
- Munoz-Carpena, R.; Dukes, M.D.; Li, Y.C.; Klassen, W. Field comparison of tensiometer and granular matrix sensor automatic drip irrigation on tomato. Hort. Technol. 2005, 15, 584–590. [Google Scholar] [CrossRef] [Green Version]
- Al-Ajlouni, M.G.; Vanleeuwen, D.M.; Hilaire, R.S. Performance of weather-based residential irrigation controllers in a desert environment. J. Am. Water Work. Assoc. 2012, 104, 608–621. [Google Scholar] [CrossRef]
- Gong, X.; Qiu, R.; Sun, J.; Ge, J.; Li, Y.; Wang, S. Evapotranspiration and crop coefficient of tomato grown in a solar greenhouse under full and deficit irrigation. Agric. Water Manag. 2020, 235, 106–154. [Google Scholar] [CrossRef]
- Haley, M.B.; Dukes, M.D. Validation of Landscape Irrigation Reduction with Soil Moisture Sensor Irrigation Controllers. J. Irrig. Drain. Eng. 2012, 138, 135–144. [Google Scholar] [CrossRef]
- Kottek, M.; Grieser, J.; Beck, C.; Rudolf, B.; Rubel, F. World map of the Köppen-Geiger climate classification updated. Meteorol. Z. 2006, 15, 259–263. [Google Scholar] [CrossRef]
- NDAWN. North Dakota Agricultural Weather Network. Available online: http://ndawn.ndsu.nodak.edu/ (accessed on 26 June 2021).
- Vaddevolu, U.B.P.; Jia, X.; Scherer, T.F.; Lee, C. Automatic sensor controlled drip irrigation under mulches for tomato and watermelon productions. In Proceedings of the 2020 ASABE International Meeting, Omaha, NE, USA, 12–15 July 2020; p. 2001035. [Google Scholar]
- Roy, D.; Jia, X.; Steele, D.D.; Lin, D. Development and comparison of soil water release curves for three soils in the Red River Valley. USA. Soil Sci. Soc. Am. J. 2018, 82, 568–577. [Google Scholar] [CrossRef]
- ND SWC. Standards of Quality for Waters of the State. Chapter 33.1-16-02.1. Available online: https://www.legis.nd.gov/information/acdata/pdf/33.1-16-01.1.pdf (accessed on 12 June 2021).
- Farzi, R.; Gholami, M.; Baninasab, B.; Gheysari, M. Evaluation of different mulch materials for reducing soil surface evaporation in semi-arid region. Soil Use Manag. 2017, 33, 120–128. [Google Scholar] [CrossRef]
- Miller, G.L.; Farahani, H.J.; Hassell, R.L.; Khalilian, A.; Adelberg, J.W.; Wells, C.E. Field evaluation and performance of capacitance probes for automatic drip irrigation of watermelon. Agric. Water Manag. 2014, 131, 124–134. [Google Scholar] [CrossRef]
- Li, Y.; Shao, M.; Wang, W.; Wang, Q.; Horton, R. Open-hole effects of perforated plastic mulches on soil water evaporation. Soil Sci. 2003, 168, 751–758. [Google Scholar] [CrossRef]
- Li, S.X.; Wang, Z.H.; Li, S.Q.; Gao, Y.J.; Tian, X.H. Effect of plastic sheet mulch, wheat straw mulch, and maize growth on water loss by evaporation in dryland areas of China. Agric. Water Manag. 2013, 116, 39–49. [Google Scholar] [CrossRef]
- Li, H.; Yang, X.; Chen, H.; Cui, Q.; Yuan, G.; Han, X.; Wei, C.; Zhang, Y.; Ma, J.; Zhang, X. Water requirement characteristics and the optimal irrigation schedule for the growth, yield, and fruit quality of watermelon under plastic film mulching. Sci. Hortic. 2018, 241, 74–82. [Google Scholar] [CrossRef]
- Ray, M.; Biswasi, S. Impact of mulching on crop production: A review. Trends Biosci. 2016, 9, 757–767. [Google Scholar]
- Singh, R.; Kumar, S.; Nangare, D.D.; Meena, M.S. Drip irrigation and black polyethylene mulch influence on growth, yield and water-use efficiency of tomato. Afr. J. Agric. Res. 2009, 4, 1427–1430. [Google Scholar]
Figure 1.
Randomized field layout in (a) 2019 field layout and (b) 2020 layout.

Figure 2.
Irrigation controller board with two control units.

Figure 3.
Daily average soil matric potential (09:00 am) at 15 and 30 cm deep in tomato plots during 2019 field experiment under drip irrigation (DI) treatment with (a) landscape fabric mulch (DI PF), (b) black plastic mulch (DI BP), (c) clear plastic mulch (DI CP), (d) no mulch (DI NM), and no irrigation treatment (NI) with (e) landscape fabric mulch (NI PF), (f) black plastic mulch (NI BP), (g) clear plastic mulch (NI CP), and (h) no mulch (NI NM).

Figure 4.
Daily average soil matric potential (09:00 am) at 15 and 30 cm deep in tomato plots during 2020 field experiment under drip irrigation (DI) treatment with (a) landscape fabric mulch (DI PF), (b) black plastic mulch (DI BP), (c) clear plastic mulch (DI CP), (d) no mulch (DI NM), and no irrigation treatment (NI) with (e) landscape fabric mulch (NI PF), (f) black plastic mulch (NI BP), (g) clear plastic mulch (NI CP), and (h) no mulch (NI NM).

Figure 5.
Daily average soil matric potential (08:00 am) at 15 and 30 cm deep in watermelon plots during 2019 field experiment under drip irrigation (DI) treatment with (a) landscape fabric mulch (DI PF), (b) black plastic mulch (DI BP), (c) clear plastic mulch (DI CP), (d) no mulch (DI NM), and no irrigation treatment (NI) with (e) landscape fabric mulch (NI PF), (f) black plastic mulch (NI BP), (g) clear plastic mulch (NI CP), and (h) no mulch (NI NM).

Figure 6.
Daily average soil matric potential (08:00 am) at 15 and 30 cm deep in watermelon plots during 2019 field experiment under drip irrigation (DI) treatment with (a) landscape fabric mulch (DI PF), (b) black plastic mulch (DI BP), (c) clear plastic mulch (DI CP), (d) no mulch (DI NM), and no irrigation treatment (NI) with (e) landscape fabric mulch (NI PF), (f) black plastic mulch (NI BP), (g) clear plastic mulch (NI CP), and (h) no mulch (NI NM).

Figure 7.
Monthly cumulative rainfall (mm) with cumulative irrigation amounts for fabric landscape (PF), clear plastic (CP), black plastic (BP), and no mulch (NM) during two-year field experiments with (a) 2019 tomato, (b) 2019 watermelon, (c) 2020 tomato, and (d) 2020 watermelon.
Figure 7.
Monthly cumulative rainfall (mm) with cumulative irrigation amounts for fabric landscape (PF), clear plastic (CP), black plastic (BP), and no mulch (NM) during two-year field experiments with (a) 2019 tomato, (b) 2019 watermelon, (c) 2020 tomato, and (d) 2020 watermelon.


Table 1.
Soil nutrient analysis at the experimental site, while Avg means average value at eight locations, and Std means standard deviation of values at eight locations.
Table 1.
Soil nutrient analysis at the experimental site, while Avg means average value at eight locations, and Std means standard deviation of values at eight locations.
| 2019 | 2020 | |||
|---|---|---|---|---|
| Avg | Std | Avg | Std | |
| NO3-N (kg N/ha) 0–15 cm | 18.51 | 4.51 | 6.75 | 2.15 |
| 15–61 cm | 62.24 | 8.43 | 33.95 | 11.76 |
| P (mg/L) | 21.50 | 4.81 | 26.63 | 5.95 |
| K (mg/L) | 368.13 | 35.95 | 480.63 | 31.78 |
| pH | 6.96 | 0.09 | 6.60 | 0.14 |
| EC (dS/m) | 0.41 | 0.06 | 0.39 | 0.03 |
| Organic Matter (%) | 7.74 | 0.99 | 6.31 | 0.53 |
Table 2.
Soil physical parameters at the experimental site.
| Parameters | Depth |
|---|---|
| (0–45 cm) | |
| Sand (%) | 5 |
| Silt (%) | 47 |
| Clay (%) | 48 |
| Bulk density (g/cm3) | 1.08 |
| Saturation (cm3/cm3) | 0.59 |
| Field capacity (cm3/cm3) | 0.41 |
| Permanent wilting point (cm3/cm3) | 0.26 |
Table 3.
Vegetable management timelines in 2019 and 2020.
| Tomato | Watermelon | |||
|---|---|---|---|---|
| 2019 | 2020 | 2019 | 2020 | |
| Seeded | 22 Apr | 7 Apr | 22 Apr | 20 Apr |
| Transplanted | 14 Jun | 30 May | 14 Jun | 30 May |
| Fruit growth | 28 Jun | 24 Jun | 22 Jul | 28 Jun |
| Start harvest | 19 Aug | 24 Aug | 6 Sep | 5 Aug |
| End harvest | 8 Oct | 2 Oct | 2 Oct | 9 Sep |
Table 4.
Major weather parameters (Tmax, monthly average maximal air temperature; Tmin, monthly average minimal air temperature; Tavg, monthly average air temperature; Tsoil, monthly average bare soil temperature at 10 cm depth; Uavg, monthly average wind speed; Umax, monthly average maximum wind speed; Rs, monthly average incoming shortwave radiation; PET, monthly average total daily potential evapotranspiration amount; and Rain, monthly average total rainfall) during the field experiment.
| Year | Month | Tmax (°C) | Tmin (°C) | Tavg (°C) | Tsoil (°C) | Uavg (m/s) | Umax (m/s) | Rs (MJ/m2) | PET (mm/day) | Rain (mm/mon) |
|---|---|---|---|---|---|---|---|---|---|---|
| 2019 | May | 17.57 | 5.30 | 11.43 | 11.28 | 7.18 | 21.50 | 18.79 | 5.03 | 69.65 |
| June | 25.62 | 13.71 | 19.67 | 19.45 | 7.03 | 23.47 | 20.75 | 6.41 | 82.75 | |
| July | 27.86 | 17.08 | 22.47 | 23.17 | 5.83 | 20.08 | 23.25 | 6.09 | 121.26 | |
| August | 24.77 | 14.82 | 19.80 | 20.82 | 6.03 | 19.16 | 18.91 | 4.76 | 89.69 | |
| September | 21.61 | 12.10 | 16.85 | 16.87 | 6.99 | 22.67 | 12.42 | 3.24 | 106.81 | |
| October | 9.71 | 2.28 | 5.99 | 7.55 | 8.72 | 22.60 | 7.61 | 1.84 | 87.78 | |
| Avg/Total | 21.19 | 10.88 | 16.04 | 16.52 | 6.96 | 21.58 | 16.96 | 4.56 | 557.94 | |
| 2020 | May | 18.34 | 6.95 | 12.64 | 12.52 | 8.01 | 23.32 | 21.14 | 5.80 | 37.92 |
| June | 28.29 | 15.58 | 21.94 | 20.20 | 9.00 | 27.54 | 23.63 | 7.89 | 66.75 | |
| July | 28.62 | 17.72 | 23.17 | 23.28 | 6.38 | 24.04 | 24.08 | 6.51 | 133.38 | |
| August | 26.88 | 15.46 | 21.17 | 22.30 | 5.88 | 20.90 | 18.93 | 4.93 | 122.33 | |
| September | 20.81 | 8.97 | 14.89 | 16.26 | 7.12 | 22.88 | 13.61 | 4.11 | 22.10 | |
| October | 9.17 | −1.18 | 4.00 | 7.79 | 8.03 | 23.88 | 9.44 | 2.60 | 21.49 | |
| Avg/Total | 22.02 | 10.58 | 16.30 | 17.06 | 7.40 | 23.76 | 18.47 | 5.31 | 403.97 |
Table 5.
Monthly average soil temperature (°C) under clear plastic mulch (CP), black plastic mulch (BP), landscape fabric mulch (PF), and no mulch (NM) in no-irrigation plots.
Table 5.
Monthly average soil temperature (°C) under clear plastic mulch (CP), black plastic mulch (BP), landscape fabric mulch (PF), and no mulch (NM) in no-irrigation plots.
| Crop | Year | Treatment | Depth (cm) | June | July | August | September | October | Average |
|---|---|---|---|---|---|---|---|---|---|
| Tomato | 2019 | PF | 15 | 20.74 | 23.09 | 20.50 | 16.71 | 10.24 | 18.26 |
| BP | 15 | 22.95 | 25.31 | 21.81 | 17.71 | 11.22 | 19.80 | ||
| CP | 15 | 24.05 | 27.48 | 24.90 | 19.13 | 12.30 | 21.57 | ||
| NM | 15 | 21.72 | 23.23 | 21.44 | 17.12 | 9.87 | 18.68 | ||
| PF | 30 | 18.56 | 21.40 | 20.33 | 16.93 | 11.82 | 17.81 | ||
| BP | 30 | 20.10 | 23.00 | 20.93 | 17.51 | 12.45 | 18.80 | ||
| CP | 30 | 22.93 | 26.00 | 23.68 | 18.83 | 12.78 | 20.84 | ||
| NM | 30 | 19.13 | 21.86 | 20.70 | 17.05 | 10.97 | 17.94 | ||
| 2020 | PF | 15 | 20.45 | 23.22 | 21.97 | 16.42 | - | 20.52 | |
| BP | 15 | 21.55 | 23.85 | 22.18 | 16.65 | - | 21.06 | ||
| CP | 15 | 22.71 | 24.83 | 23.10 | 17.77 | - | 22.10 | ||
| NM | 15 | 20.69 | 23.44 | 21.72 | 16.07 | - | 20.48 | ||
| PF | 30 | 21.63 | 24.50 | 22.28 | 15.81 | - | 21.05 | ||
| BP | 30 | 23.01 | 24.77 | 22.05 | 16.20 | - | 21.51 | ||
| CP | 30 | 24.17 | 25.96 | 23.49 | 17.43 | - | 22.76 | ||
| NM | 30 | 21.50 | 24.57 | 22.09 | 15.35 | - | 20.88 | ||
| Watermelon | 2019 | PF | 15 | 20.49 | 22.43 | 20.17 | 16.68 | 10.66 | 18.09 |
| BP | 15 | 23.12 | 24.20 | 20.47 | 17.16 | 11.09 | 19.21 | ||
| CP | 15 | 25.94 | 25.70 | 21.13 | 17.61 | 11.85 | 20.45 | ||
| NM | 15 | 21.29 | 22.68 | 19.87 | 16.44 | 10.00 | 18.06 | ||
| PF | 30 | 18.63 | 21.23 | 19.88 | 16.74 | 11.68 | 17.63 | ||
| BP | 30 | 20.12 | 22.45 | 20.33 | 17.44 | 12.28 | 18.53 | ||
| CP | 30 | 22.28 | 24.13 | 20.74 | 17.55 | 12.43 | 19.43 | ||
| NM | 30 | 19.37 | 21.56 | 19.72 | 16.60 | 11.02 | 17.65 | ||
| 2020 | PF | 15 | 21.05 | 22.94 | 21.64 | 16.20 | - | 20.46 | |
| BP | 15 | 21.53 | 22.98 | 21.62 | 16.77 | - | 20.73 | ||
| CP | 15 | 23.19 | 23.14 | 21.81 | 17.50 | - | 21.41 | ||
| NM | 15 | 20.85 | 22.52 | 20.81 | 16.23 | - | 20.10 | ||
| PF | 30 | 21.96 | 22.78 | 21.13 | 15.36 | - | 20.31 | ||
| BP | 30 | 23.08 | 23.92 | 21.91 | 16.05 | - | 21.24 | ||
| CP | 30 | 24.17 | 23.24 | 21.82 | 17.22 | - | 21.61 | ||
| NM | 30 | 22.09 | 22.85 | 21.08 | 15.73 | - | 20.44 |
Table 6.
Tomato and watermelon yield obtained from drip irrigation (DI) and no irrigation (NI) under clear plastic mulch (CP), black plastic mulch (BP), landscape fabric mulch (PF), and no mulch (NM) treatment in 2019 and 2020.
Table 6.
Tomato and watermelon yield obtained from drip irrigation (DI) and no irrigation (NI) under clear plastic mulch (CP), black plastic mulch (BP), landscape fabric mulch (PF), and no mulch (NM) treatment in 2019 and 2020.
| Treatment | Tomato (Mg ha−1) | Watermelon (Mg ha−1) | ||
|---|---|---|---|---|
| Year | 2019 | 2020 | 2019 | 2020 |
| DI BP | 26.38 | 40.24 | 55.11 | 144.67 |
| DI CP | 21.1 | 22.4 | 69.43 | 165.55 |
| DI PF | 23.86 | 34.31 | 35.01 | 153.95 |
| DI NM | 29.77 | 34.28 | 28.15 | 147.47 |
| NI BP | 34.32 | 27.56 | 44.75 | 132.03 |
| NI CP | 27.46 | 25.91 | 79.30 | 109.62 |
| NI PF | 29.84 | 23.91 | 30.89 | 123.54 |
| NI NM | 41.63 | 18.54 | 38.72 | 113.91 |
| Average | 29.3 | 28.4 | 47.67 | 136.34 |
Table 7.
Average quality parameters measured from tomato samples collected during 2019 and 2020.
| pH | EC (mS/cm) | Sugar Content (%) | ||||
|---|---|---|---|---|---|---|
| 2019 | 2020 | 2019 | 2020 | 2019 | 2020 | |
| DI BP | 4.1 | 4.1 | 4.1 | 4.0 | 4.9 | 5.8 |
| DI CP | 4.1 | 4.0 | 4.0 | 4.0 | 4.9 | 7.3 |
| DI PF | 4.1 | 4.0 | 4.0 | 4.0 | 4.9 | 5.6 |
| DI NM | 4.1 | 4.2 | 4.0 | 4.1 | 4.9 | 5.8 |
| NI BP | 4.2 | 4.0 | 4.0 | 4.0 | 5.4 | 8.2 |
| NI CP | 4.2 | 3.9 | 4.0 | 4.1 | 4.9 | 5.7 |
| NI PF | 4.2 | 4.0 | 4.2 | 4.0 | 4.9 | 6.0 |
| NI NM | 4.1 | 4.2 | 4.1 | 4.0 | 5.1 | 6.2 |
Table 8.
Average quality parameters measured from watermelon samples collected during 2019 and 2020.
Table 8.
Average quality parameters measured from watermelon samples collected during 2019 and 2020.
| pH | EC (dS/cm) | Sugar content (%) | ||||
|---|---|---|---|---|---|---|
| 2019 | 2020 | 2019 | 2020 | 2019 | 2020 | |
| DI BP | 5.7 | 5.2 | 3.3 | 3.6 | 9.4 | 10.3 |
| DI CP | 5.9 | 5.2 | 3.4 | 3.7 | 10.2 | 11.0 |
| DI PF | 5.4 | 5.0 | 3.2 | 3.8 | 8.2 | 10.2 |
| DI NM | 5.4 | 5.2 | 3.2 | 3.8 | 8.7 | 9.9 |
| NI BP | 5.8 | 5.3 | 2.9 | 3.3 | 10.1 | 10.2 |
| NI CP | 5.8 | 5.1 | 3.2 | 3.5 | 9.8 | 10.3 |
| NI PF | 5.5 | 5.2 | 3.1 | 3.6 | 9.1 | 9.8 |
| NI NM | 5.7 | 5.3 | 3.2 | 3.5 | 9.6 | 10.2 |
Table 9.
Tomato and watermelon quality parameter analysis on mulch, irrigation, and the interaction of mulch and irrigation in 2019 and 2020 using analysis of variance, with * at p < 0.05, ** at p < 0.01, and *** at p < 0.001.
Table 9.
Tomato and watermelon quality parameter analysis on mulch, irrigation, and the interaction of mulch and irrigation in 2019 and 2020 using analysis of variance, with * at p < 0.05, ** at p < 0.01, and *** at p < 0.001.
| Vegetable | Year | Source | Weight (g) | Diameter (mm) | EC (dS/m) | pH | Sugar (%) |
|---|---|---|---|---|---|---|---|
| Tomato | 2019 | Mulch | ** | *** | ** | ||
| Irrigation | |||||||
| Interaction | |||||||
| 2020 | Mulch | ** | * | ||||
| Irrigation | ** | *** | |||||
| Interaction | * | ||||||
| Watermelon | 2019 | Mulch | *** | * | ** | * | |
| Irrigation | |||||||
| Interaction | |||||||
| 2020 | Mulch | ** | *** | * | |||
| Irrigation | ** | ||||||
| Interaction |
Publisher’s Note: MDPI stays neutral with regard to jurisdictional claims in published maps and institutional affiliations. |
© 2021 by the authors. Licensee MDPI, Basel, Switzerland. This article is an open access article distributed under the terms and conditions of the Creative Commons Attribution (CC BY) license (https://creativecommons.org/licenses/by/4.0/).
Share and Cite
MDPI and ACS Style
Vaddevolu, U.B.P.; Lester, J.; Jia, X.; Scherer, T.F.; Lee, C.W. Tomato and Watermelon Production with Mulches and Automatic Drip Irrigation in North Dakota. Water 2021, 13, 1991. https://doi.org/10.3390/w13141991
AMA Style
Vaddevolu UBP, Lester J, Jia X, Scherer TF, Lee CW. Tomato and Watermelon Production with Mulches and Automatic Drip Irrigation in North Dakota. Water. 2021; 13(14):1991. https://doi.org/10.3390/w13141991
Chicago/Turabian StyleVaddevolu, Uday Bhanu Prakash, Justin Lester, Xinhua Jia, Thomas F. Scherer, and Chiwon W. Lee. 2021. "Tomato and Watermelon Production with Mulches and Automatic Drip Irrigation in North Dakota" Water 13, no. 14: 1991. https://doi.org/10.3390/w13141991
Note that from the first issue of 2016, this journal uses article numbers instead of page numbers. See further details here.