
A Continental Assessment of Reservoir Storage and Water Availability in South America


1
Departamento de Ingeniería Civil: Hidráulica, Energía y Medio Ambiente, Universidad Politécnica de Madrid, 28040 Madrid, Spain
2
Carrera de Ingeniería Civil, Facultad de Ingeniería Civil y Mecánica, Universidad Técnica de Ambato, Ambato 180206, Ecuador
*
Author to whom correspondence should be addressed.
Water 2021, 13(14), 1992; https://doi.org/10.3390/w13141992
Submission received: 22 June 2021
/
Revised: 15 July 2021
/
Accepted: 16 July 2021
/
Published: 20 July 2021
(This article belongs to the Special Issue Water Resources Systems in a Changing World: Planning and Adaptation)
Abstract
:This study presents the first continental assessment of water storage and its influence on the availability of water of the river systems of South America. Although hydraulic infrastructure has the potential to cause several impacts on river systems and the environment, their relevance in water resources systems is irrefutable. The human services that dams and reservoirs provide to society, e.g., hydroelectricity, water supply, irrigation, or flood control, are vital services that society requires to develop. Despite this fact, the interactions of dams and reservoirs in the river systems of South America have not been explored from a hydrological perspective. In this study, we present the first assessment of the potential effects of water storage at a basin scale in South America. For this purpose, first we present an analysis of the current conditions and the influence of water storage in the basins of the continent. Then, we estimate the potential water availability of each basin, to evaluate the role of water storage in the availability of water in the continent. Our findings indicate that the ‘Colorado’ and ‘Negro’ basins in Argentina are the most influenced by water storage in the continent. Moreover, our results suggest that reservoirs improve the potential water availability capacity, particularly in the southern basins of the continent. With this study, we expect to provide helpful insights about the current interactions of reservoirs with the river systems of the continent.
1. Introduction
Providing reliable information about the hydrodynamics of the river systems in South America at a basin scale is necessary to improve the management of water resources of the region. During the last two decades, several global, regional, and local studies have been conducted about water scarcity in different regions of South America [1,2,3,4,5,6,7,8]. While many of these studies agree that this continent has the world’s highest availability of water resources in the planet, they also emphasize that several regions face severe water scarcity conditions. For example, some coastal areas of Peru and Chile suffer from seasonal water shortages due to climatic phenomena and aridity [5,7], several southeast basins from Brazil to Argentina suffer from water stress mainly caused by intense water extraction from industries and socioeconomic activities [5], or some capitals emplaced in the Andes Mountains, which are subjected to water scarcity issues due to insufficient water infrastructure and high population density [4]. However, most of the studies regarding water scarcity in South America available to date present at least one of these limitations: (a) they have been developed only from a socio-economic perspective, and thus, do not consider the hydrodynamics of the river systems of the continent, or (b) their area of study is focused on a local scale.
Global hydrology models are useful tools for assessing current and future trends in water dynamics. In general, global hydrology models (GHMs) allow the simulation of the water cycle and the lateral transfer of water, which enables the identification of present and future problems of scarcity and water stress [9]. However, many GHM models have limitations in regard to reproducing water flow at a local level [10]. To solve this problem, authors such as Beck et al. or Zaherpour [11,12] have suggested the need for calibration and regionalization of hydrological models to improve the understanding of relevant phenomena that generally cannot be solved by global models. In South America, several GHMs have been developed on a regional scale in recent years, e.g., Siquiera [10], Pontes [13], Getirana [14], Fleischman [15], and de Paiva [16]. Although these models have proven to give reliable results, most of them highlight the pending necessity to acquire comprehensive, reliable, and updated hydrological information for most of the regions in the continent. Despite the fact that recent advances in hydrological data availability could contribute to reduce this gap of information (e.g., national datasets like CAMELS-BR [17] and CAMELS-CL [18]), most advances in this subject are focused only in local or national scales, which limits their use at a continental scale.
In general, water availability assessments require more than just water flow information. In addition to runoff, which for this assessment is considered as the difference between precipitation and evapotranspiration, other inputs like hydraulic infrastructure (e.g., dams) are as much as important for these types of analyses [19]. Overall, when considering measures related to hydraulic infrastructure in water availability assessments, policy makers and water resource systems managers usually consider two types of actions, to increase their infrastructure or to improve water management efficiency. However, in recent years, the option of building new infrastructure is no longer considered a suitable option in many countries due to high social and environmental costs [20]. Moreover, recent trends suggest that improving the efficiency of water resources systems to satisfy user demand is currently the most applied option [21,22]. Despite this trend, several countries in South America have expressed their intention to carry out projects to build hundreds of new dams in the future for different purposes [23,24,25,26,27].
Dams and reservoirs play an important role in the management of water resources. These hydraulic infrastructures alter natural hydrological regimes and are associated with several environmental impacts. In general, dams are built to provide valuable and necessary human services such as hydroelectric energy, drinking water, irrigation water, flood protection, fisheries, or navigation. However, these structures can also cause significant environmental impacts like the disruption of aquatic ecosystems, reduction of riparian biodiversity, modification of stream morphology, degradation of water quality, or alterations of seasonal hydrological events [28,29]. In South America, several studies have examined the upstream and downstream impacts of dams and reservoirs, especially on the most renowned basins like the Amazon or La Plata [30,31,32,33,34,35]. However, regional assessments about the potential impacts of dams and reservoirs and their influence on water flows for the river systems of South America are not yet available.
In this study, we aim to provide the first large-scale assessment regarding water storage and its influence on the river systems of South America. First, we provide a clear picture of the distribution of water storage in the continent, both in a geographical, hydrological, and human context. For this, we present a basin-scale compilation of South America’s hydrological characteristics. We describe characteristics such as the mean annual flow, water stored in reservoirs, runoff, catchment areas, and population. Furthermore, we include an analysis of the potential impacts of the dams at a basin scale.
In addition, we also present an analysis of the effects of reservoir storage on the availability of water in the continental area of South America. The analysis between reservoir storage and yield has been extensively studied around the world, from the basic reliability analysis of individual reservoirs to the reliability-yield analysis of multiple reservoirs [36,37,38,39,40] and the simulation of the operation of large water resources systems [41,42,43]. Although to date these models have proven useful in ensuring water in decision-making processes for water resources systems, in order to obtain reliable results for water availability assessments, it is necessary to include the analysis of different climate scenarios [44,45]. Authors such as Sordo-Ward et al. [46,47], Granados et al. [48], and Garrote et al. [49] have extensively examined water availability using different climate scenarios in current and projected time periods. Although most climate models present a certain level of uncertainty, these studies highlight the important role of climate models in evaluating the potential impacts of climate change on water availability. In the case of South America, there are several assessments which consider climate models in their water availability analysis. For example, Krol et al. [50] studied the impacts of climate change on water availability from reservoirs in northeast Brazil. Elliot et al., 2014 [51] assessed the potential impacts of climate change on freshwater availability for irrigation purposes in the continent. Álvarez-Dávila et al. [52] analyzed the effects of water availability on forest biomass in Northwest South America. Most of these assessments also highlight the fact that climate change impacts on water availability may be severe in some areas of the continent.
In this assessment, we define water availability as the amount of water demand that can be satisfied at a given point of the regulated river system, under certain reliability parameters [38,53]. For the water availability analysis, we used the model proposed by Garrote et al. [54]: ‘Water Availability and Adaptation Policy Assessment’, WAAPA, which is a specific simulation model that assesses the role of reservoirs in the availability of water for water resources systems in different climate scenarios and management policies [19,49,53,55]. First, we carried out an analysis of the potential water availability for each basin of the continent. Then, we evaluated the role of the reservoirs in the availability of water for each basin.
The findings of this study demonstrate the great diversity of the water resource systems of South America. Overall, the basins of the Colorado and Negro rivers in Argentina tend to be the areas most influenced by water storage. The basins in the north of the continent, like the Amazon, are, on the other hand, the areas that will be less ‘affected’ by the potential effects of water storage. In terms of water availability, our findings suggest that reservoir storage improves the water availability potential primarily in the south-eastern regions of the continent.
2. Materials and Methods
2.1. Area of Study
The area of study encompasses the continental area of South America and includes 13 countries: Argentina, Bolivia, Brazil, Chile, Colombia, Ecuador, French Guiana, Guyana, Paraguay, Peru, Suriname, Uruguay, and Venezuela. In addition, the continental area of South America is also mapped according to the 27 hydrological regions (HR) proposed by the Food and Agriculture Organization of the United Nations (FAO) [56], which represent the major basins in the continent (Figure 1). South America is the richest continent in terms of total water resources [57]. The diversity of South America’s geography and environment, on the other hand, creates significant disparities in water distribution across the continent. In the north, including the Amazon and the Orinoco basins, the humid and tropical climate around the equator causes large amounts of precipitation. In the southeast, most regions present semiarid conditions and highly variable climates. In the southwest, there are several arid regions with low precipitation, e.g., the Atacama Desert. The Andes mountains, which are placed alongside almost the entire Pacific coast, provide large amounts of glacier water in the north, which mostly drains east to the rainforest basins. The altiplano regions of the Andes pose a significant challenge to water resources due to their intricate topography and climate conditions [5]. Some interannual climate events like the ‘El Niño Southern Oscillation’ (ENSO), the sea surface temperature anomalies (SST) in the Atlantic Ocean, the Pacific Decadal Oscillation (PDO), the Antarctic Oscillation (AAO), or the North Atlantic Oscillation are also highly relevant in the availability of water resources in South America [23,58,59,60,61,62].
2.2. Methodology
The catchment and stream delineation for the continent was performed using the HydroSHEDS (Hydrological data and maps based on SHuttle Elevation Derivatives at multiple Scales) dataset [63], which was derived primarily from the Shuttle Radar Topography Mission (SRTM) and provides reliable hydrographic information in a 15 arc second resolution. Considering the regional scale of this study, the HydroSHEDS dataset was processed to consider only catchments of reservoirs or catchments larger than 5000 km2. Smaller catchments without reservoirs were merged into their nearest downstream catchment. The resulting catchments follow a ‘drain-to’ relationship, which run from headwater catchments to larger downstream catchments draining to the sea.
In total, the topological model for this study comprises 4661 catchments derived from the HydroSHEDS dataset. All catchments were assigned to its corresponding hydrological region. Dam and reservoir information was taken from the ‘Dataset of Georeferenced Dams in South America’ DDSA [23], which currently is the most complete database of geolocated dams in the continent, and provides reliable information about the dam’s attributes and their catchments. For this analysis, a total of 808 dams with a reservoir greater than 0.002 km3 were considered (Figure 2a). Each dam was then aligned to its corresponding stream from the HydroSHEDS dataset.
Monthly streamflow time series were obtained from the results of the forcing of the ‘PCRaster Global Water Balance’ (PCR-GLOBWB) [64] hydrological model within the ‘Inter-Sectoral Impact Model Intercomparison Project’ (ISIMIP) [65]. The PCR-GLOBWB is a global hydrological model which simulates the terrestrial hydrology at a 0.5-degree resolution and was forced using the output from five global climate models: GFDL-ESM2M (GFDL), HadGEM2-ES (HadGEM2), IPSL-CM5A-LR (IPSL), MIROC-ESM-CHEM (MIROC), and NorESM1-M (NorESM1). These five climate models were selected based on three criteria: First, because of their global coverage, they have proven useful in large-scale assessments regarding water resources [19,48]. Second, they have been used in several climate assessments in the continent [66,67,68,69,70,71,72]. Furthermore, because they can be projected in different Representative Concentration Pathways (RCPs), and cover extensive time periods (from 1960 to 2100), these models can be used for assessments of current and projected time periods. Since the focus of this analysis is to study the current conditions of water resources and the effects of reservoir storage in the continent, the time period considered for this study is from 1960 to 1999. For each of the five climate models, the forcing of the PCR-GLOBWB model produced runoff information of each of the 4661 catchments. However, since runoff information derived from climate models usually presents significant bias, the results from each climate model had to be corrected before they were accepted into this analysis.
Runoff information from the climate models was corrected for potential bias using the mean monthly runoff data provided by the ‘University of New Hampshire and Global Runoff Data Centre’ (UNH/GRDC) Composite Runoff field v1.0 [73], which has been usually regarded as one of the best large-scale runoff datasets [74]. For this, we used González-Zeas [75] bias correction methodology, which is based on the determination of a monthly correction factor. It is calculated by considering the ratio between the mean annual runoff values from the UNH/GRDC model and the mean annual values from the five historical climate models. Finally, the corrected results of monthly streamflow from each climate model were averaged for each catchment of the topological model.
Estimates of water withdrawal for consumption and irrigation were also considered for the water availability analysis. Information on water withdrawals were derived from the World Bank database [76], which details country-based annual freshwater information from 1960 to 2020. Then, these estimates were spatially distributed considering two variables: population density and irrigated area. Population data was derived from the ‘Global Rural–Urban Mapping Project’ (GRUMP) [77], which was produced by the Socioeconomic Data and Applications Center (SEDAC). This dataset offers reliable georeferenced information based on polygons at a 30-arc second resolution, which were defined by night-light imagery and approximated urban extents of settlements and provides reliable georeferenced population information at continental, regional and national scale [23,78,79]. The irrigated areas were derived from the ‘Global Map of Irrigated Areas’ dataset [80] provided by the Food and Agriculture Organization of the United Nations. This dataset provides valuable data regarding irrigated areas at a 0.5-degree resolution and was derived from the combination of FAO statistics on agriculture and irrigation with geographical information.
2.2.1. Water Storage Analysis
The main characteristics of each of the 4661 catchments of our model were calculated after the input data was compiled into the topological model. The area (A) of each catchment was determined from the HydroSHEDS dataset and is expressed in square kilometers. The mean annual flow (F) and the mean annual runoff (R) of each stream and catchment in the model were derived from the corrected mean results of the PCR-GLOBWB model and are expressed as cubic kilometers per year and millimeters per year, respectively. The number of dams (D) and the storage volume information (S) for each reservoir were taken from the DDSA database and is expressed in cubic kilometers. The population (P) of each catchment was derived from the GRUMP database and is expressed as the number of inhabitants. Then, these results were clustered into each hydrological model and are described in Table 1 and mapped in Figure 2. It should be noted that the study produced results for the 4661 catchments of the topological model, including the reservoirs. For the sake of simplicity, in the main body of the manuscript these results were averaged and clustered into their respective hydrological regions. Detailed and quantitative results for the entire topological model are presented in the Supplementary Materials Section.
Once we determined the main hydrological characteristics of each catchment, an analysis of these variables was performed to provide a perspective on the potential effects of water storage in the river systems of the continent. To accomplish this, we examined the reservoirs’ geographical locations to determine the potential effects of reservoirs on the natural processes of each catchment. In particular, our water storage assessment sought to ascertain the potential effects of water storage on mean annual flow, area of the hydrological region, and people. We determined the ratios between storage and the three variables mentioned above for each catchment of the model. In general, these ratios represent broad estimates of the potential impacts of reservoirs on the continent’s hydrological processes, the potential for ecological disruption, or the degree of hydraulic infrastructure development in each catchment. Then, the results were then clustered according to the continent’s 27 hydrological regions considered in this study. The results of the 4661 catchments are presented in the Supplementary Materials Section.
2.2.2. Water Availability Analysis
We determined the potential availability of water for all catchments in our model in order to analyze the effects of reservoir storage capacity on water availability in the South American continental area. The potential water availability (WA) is defined as the annual water demand that can be satisfied at any point of the stream network with a predetermined reliability. The WA in this analysis was estimated using the Water Availability and Adaptation Policy Analysis (WAAPA) model [49]. The methodology applied by the WAAPA model can be divided in two stages: (a) the analysis of the forcing scenarios for the hydrological model, and (b) the analysis of the model’s response to potential water availability. First, the analysis of the forcing scenarios consists in the compilation of a large cycle of runs of the hydrological model to produce monthly streamflow series for each catchment of the model for the period of this analysis. The streamflow monthly series are also corrected for bias. Then, the analysis of the hydrological model’s response consists in the assessment of the potential water availability allowed by the reservoir’s storage capacity of each catchment of the model.
The WAAPA model’s capabilities allow the user to get a clear picture of the behavior of the reservoirs in the river system. For this, the WAAPA model applies a series of predetermined instructions to operate all the reservoirs in the river system in order to satisfy any given water demand, even accounting for environmental flows, water spills, and evaporation losses. This process is then applied to each node of the model, which in turn allows the user to obtain monthly time series results of water availability for the entire topological model, including reservoirs, as well as any given node of the river network. Since the focus of this assessment is to provide an initial approximation of the influence of reservoirs in the river systems of the continent, and since there is no uniform legislation at a regional level, the environmental flow was not considered for the water availability analysis. Depending on the predetermined water demand reliability criterion adopted, the WAAPA model can determine the potential water availability through an iterative process of local demand variations until the criterion is met with a predetermined standard. The reliability performance index (RI) used for this analysis was set to satisfy a 98% of the gross volume of water. The basic methodology of the WAAPA model is described in Figure 3.
After the WAAPA model was assembled according to the defined topology, we evaluated the availability of water in the continent. First, we run the WAAPA model to determine the water availability of each catchment of our model. Then, we examined the ratios between water availability and three variables: mean annual flow, area, and people, to identify the catchments that might have the potential to be affected by water scarcity. To analyze the role of storage in the availability of water in the continent, we made a comparison of the availability of water under two different case scenarios: the ‘current’ case scenario with reservoirs (CCS), and a ‘natural’ case scenario (NCS) without reservoirs. For the NCS, we run the WAAPA model using the same topology and input data described above, except for the reservoir information. With these results, we determined the increment of water availability (ΔWA) between the two scenarios (Equation (1)). Finally, we analyzed the ratio between the increment of water availability and reservoir storage. Both analyses allow us to evaluate the potential benefits of reservoir storage to water availability across the region, and thus, provide valuable insights about the influence of reservoirs on the catchments of the continent.
3. Results
3.1. Analysis of Water Storage in South America
A total of 808 dams with a reservoir greater than 0.002 km3 in the continental area of South America, were considered in this study. The storage volume of the aforementioned reservoirs is approximately 1004 km3 of water, accounting for nearly 90% of the total storage volume identified on the continent [23]. Although dams are not as numerous in this region as they are on other continents, almost every representative catchment or river has at least one dam. Dam-related indicators are important from a hydrological standpoint because they allow us to predict the potential effects of hydraulic infrastructure. For instance, the geographical distribution of dams can provide preliminary insights into the potential effects of stream fragmentation [81]. For example, the largest reservoir in South America corresponds to ‘El Guri’ dam in Venezuela, with an estimated storage volume of 135 km3. From a national perspective, the country with the highest number of dams considered for this assessment is Brazil, with more than 500 dams. However, while this information is useful from a political and geographical perspective, it is not as useful from a hydrological perspective.
The hydrological region with the highest number of dams is the region ‘R’ which corresponds to ‘La Plata’ river, a basin which includes Argentina, Bolivia, Brazil, Paraguay, and Uruguay, with 154 dams. The region with the highest density of dams is the region ‘M’ in the east of Brazil in the South Atlantic Coast, with a density of 0.56 dams per 1000 km2, which means that dams ‘divide’ this region in average watersheds of 1790 km2. However, because reservoirs smaller than 0.002 km3 were not considered for this study, our results regarding dams are not conclusive and should be addressed in further research.
A useful indicator of the potential impacts of reservoirs in river systems is the ratio between the water storage (S) and the mean annual flow of the catchment (F) (S/F) (Figure 4a). Some authors define this ratio as ‘Residence Time’, which represents the capacity of the reservoirs in the catchment to regulate flow [23,48]. On average, reservoirs across the continent store about 10% of their mean annual flow. However, the S/F ratio varies considerably between hydrological regions. Since the reason for this fluctuation could be caused by a variety of factors, we examined how the ratios behave in relation to the hydrological variables (mean annual flow, runoff, storage volume, area, population). For this, we used the Spearman’s rank correlation coefficient (r) and p-value (p) because the relationship between the ratios and most of the hydrological variables is usually nonlinear. The correlation results indicate that the S/F ratio is most likely related to runoff (r = −0.476, p < 0.05), which indicates a significant moderate inverse relationship between S/F and R. This suggests that regions with high runoff values are most likely to present low storage volumes. Or in other words, this would suggest that low runoff regions require larger reservoirs to meet their water demands. The region with the highest S/F ratio, and therefore, the most prone to experience potential impacts in flow regulation because of water storage is the region ‘T’, which corresponds to the ‘Rio Colorado’ river basin in Argentina. The residence time in this region is over 3.5 years, which implies a potential water storage of more than 3 years of the mean annual flow of the basin. On the other hand, most regions in the north of the continent present minimum potential to be affected by flow regulation, most likely due to their high runoff values. For example, the reservoirs in region ‘I’ in the Amazon River, store less than 0.5% of the river’s mean annual flow. The regions with the highest values of runoff in the continent are located in the north of the continent. Region ‘A’, which is located between Colombia and Ecuador, presents the highest value of specific mean annual runoff, with more than 1126 mm of water per year. In both regions, the S/F ratios are very low. The results of the S/F ratio for the entire topological model, and scatterplots between S/F and each of the hydrological variables are presented in the Supplementary Materials Section.
The ratio between water storage volume and the area of its catchment (S/A) can highlight helpful indicators of potential disruptions in river flow and therefore, potential effects on downstream and upstream catchments [81] (Figure 4b). In average, the reservoirs in the continent store almost 64,000 m3 of water per km2. The S/A ratio shows a significant strong correlation with the storage volume S (r = 0.88, p < 0.01), which would be expected as the regions with higher values of water storage are more prone to be affected by the fragmentation of their catchments. The basin with the highest volume of water storage per drainage area is the region ‘U’, which corresponds to the ‘Rio Negro’ river in Argentina, with over 690,100 m3 of water storage per km2. In this case, the ratio of water storage per area is relatively large due to the small area of the basin. However, rivers with a larger basin like region ‘G’, which corresponds to the Orinoco River in Venezuela and Colombia, region ‘J’, which corresponds to ‘Tocantins’ River in Brazil, or region ‘R’ also present high ratios of water storage per unit of area, most likely due to the large number of reservoirs and the high volumes of water storage of the basins. The results of the S/A ratio for the entire topological model, and scatterplots between S/A and each of the hydrological variables are presented in the Supplementary Materials Section.
Finally, we analyzed the ratio between S and population (P) S/P (Figure 4c). On average, the reservoirs in the continent have the potential to store almost 4000 m3 of water per person. However, there are marked differences between regions. For example, the region ‘U’ has the highest ratio in the continent with more than 150,000 m3 of water per person. Other regions, like regions ‘G’, ‘J’, or ‘H’ in the northeast of the continent, also present high amounts of water storage per person, with more than 15,000 m3 of water per person. On the other hand, regions ‘S’ and ‘W’ store less than 300 m3 of water per person. We found that there is a significant strong correlation between S/P and S (r = 0.79, p < 0.01), which would indicate that the S/P ratio is related to regions with large reservoirs. This is the case of the region ‘U’ which stores the highest amount of water per unit of area in the continent, with large reservoirs mainly operated for hydroelectric generation. The results of the water storage ratios for the 27 hydrological regions are presented in Table 2. In addition, the results of the S/P ratio for the entire topological model, and scatterplots between S/P and each of the hydrological variables are presented in the Supplementary Materials Section.
3.2. Water Availability in South America
The WAAPA model was applied to simulate five hydrological scenarios for the continental area of South America from 1960 to 1999. The WAAPA model produced results for the 4661 catchments of the topological model, including the reservoirs. However, for the sake of simplicity, the results from the five hydrological scenarios were averaged for each catchment, and the results from each catchment were then clustered into their respective hydrological region.
In terms of volume of water, our WA results emphasize the relevance of the Amazon River in the continent’s water resources systems. In total, the availability of water on the continent is almost 6400 km3 of water per year, of which almost 55% correspond to region ‘I’ in the Amazon River basin. The ‘La Plata’ (region ‘R’) and ‘Orinoco’ (region ‘G’) river basins also present some of the highest amounts of water availability. Region ‘R’ has a water availability of more than 700 km3 of water and region ‘G’ has a water availability of almost 830 km3 of water, which combined represent 24% of the total amount of water availability in the continent. On the other hand, the areas with the lowest levels of water availability are found in the south of the continent, on Chile’s north coast (region ‘C’), and in the endoreic regions of north and central Argentina (regions ‘X’, ‘Y’, ‘Z’, and ‘AA’), where annual water availability is less than 2 km3 of water. Our water availability results are directly related to the mean annual flow F (r = 0.96, p < 0.01). This clearly indicates that, in addition to reservoirs, our water availability results are influenced by the abundance of water resources of some regions, especially in the north. The results of water availability for the 27 hydrological regions of the continent are presented in Table 2. On the other hand, our results on the ratio between WA and mean annual flow, area and persons enable a more in-depth understanding of the particular situation of each hydrological region. For example, the ratio of water availability per mean annual flow (WA/F) (Figure 5a) gives us an initial approximation of the management of water resources in the different hydrological regions. In this case, the regions with the highest WA/F values are located most prominently in the southeast of the continent, particularly in the regions ‘R’, ‘T’, ‘U’, ‘X’, and ‘Y’, where the availability of water is equivalent to more than 90% of their mean annual flow. On the other hand, region ‘K’ in the north of Brazil, or region ‘Z’ in the north of Argentina are the regions with the lowest WA/F ratio with less than 23% of water availability per its equivalent mean annual flow. There is a significant moderate correlation between WA/F and S/F (r = 0.63, p < 0.01), which evidences the connection with water storage. This suggests that water availability tends to be improved in regions with a larger number of dams, or high quantities of water storage. In other words, the WA/F ratio could prove useful to highlight the fact that water availability has been benefited by water resource management and the development of hydraulic infrastructure in some regions of the continent. The results of the WA/F ratio for the entire topological model, and scatterplots between WA/F and each of the hydrological variables are presented in the Supplementary Materials Section.
In the same way, the ratios between water availability and catchment area or population provide us with a clearer picture of the current state of the water resource systems in each hydrological region. The WA/A ratio (Figure 5b) allows us to observe how much water is available for each region in relation to its catchment size. In this case, the hydrological regions with the largest values of runoff, which are mainly located at the northern part of the continent, present the highest values of water availability per their respective discharge areas. We observe a significant strong correlation between WA/A and F (r = 0.91, p < 0.01) and R (r = 0.95, p < 0.01). This would suggest that because of their beneficial climatic conditions, which provide them with an abundance of water resources, the regions with a high value of their WA/A ratio are less likely to require a larger number of hydraulic infrastructures (e.g., dams or reservoirs) to meet their water needs. The regions with the highest proportion of water availability in relation to their area are region ‘A’, ‘E’, and region ‘G’ in an area that comprises Colombia, Ecuador, and Venezuela. As in the case of WA, the areas with the lowest values of WA/A are found in the south of the continent, on Chile’s north coast (region ‘C’), and in the endoreic regions of central Argentina (regions ‘X’, ‘Y’, and ‘Z’). The results of the WA/A ratio for the entire topological model, and scatterplots between WA/A and each of the hydrological variables are presented in the Supplementary Materials Section.
Finally, the water availability per person (WA/P) ratio (Figure 5c) indicates how much water is available for each region in relation to its population. Although in average, the amount of water availability per person is around 24,250 m3 of water per person per year, this value fluctuates considerably between regions. The WA/P ratio shows a significant moderate correlation with R (r = 0.65, p < 0.01), but also shows significant moderate inverse correlations with the S/F ratio (r = −0.52, p < 0.01) and population density (r = −0.41, p < 0.05). This could indicate that the WA/P ratio tends to be higher in regions with large amounts of runoff and lower density. These results suggest that the WA/P ratio might prove useful in identifying the regions whose settlements are less likely to suffer from water scarcity. The region with the highest proportion of water availability per person is the region ‘H’, which includes Guyana, Suriname, and French Guiana, with more than 250,800 m3 of water available per year and per person. On the other hand, the lowest values of WA/P are found in the north of the continent (region ‘F’), Chile’s north coast (region ‘C’), and in the endoreic regions of central Argentina (regions ‘X’, ‘Y’, and ‘Z’), with less than 2000 m3 available of water per person per year. The results of the WA/A ratio for the entire topological model, and scatterplots between WA/A and each of the hydrological variables are presented in the Supplementary Materials Section.
3.3. The Role of Storage in Water Availability in South America
In order to improve our understanding of the role of water storage in the availability of water in the continent, we compared two case studies: the availability of water in ‘current’ conditions with dams (CCS) (Figure 6a,d), and the availability of water in ‘natural’ conditions without dams (NCS) (Figure 6b,e). We found several similarities between both case studies. First, both CCS and NCS case studies are closely related (r = 0.97, p < 0.01). In addition, both case studies are related to F (r = 0.95, p < 0.01 for CCS, and r = 0.96, p < 0.01 for NCS), and to R (r = 0.87, p < 0.01 for CCS, and r = 0.89, p < 0.01). These strong relationships clearly highlight the fact that water availability is generally higher in the basins where water resources are abundant. However, our results also demonstrate the benefit of water storage. In the case of the NCS scenario, the total availability of water for the 27 hydrological regions is 4967.01 km3 of water per year. In the CCS scenario, the total availability of water is 6391.95 km3 of water per year. This indicates that, because of the presence of reservoirs, water availability on the continent has increased by 1424.94 km3, which is equivalent to an increase of nearly 28% over the NCS scenario. The results of the CCS and NCS case scenarios for the entire topological model are presented in the Supplementary Materials Section.
However, the individual results of each hydrological region better demonstrate the benefits of water storage and reservoirs on water availability. In the case of two of the largest and most representative rivers of the continent, the ‘La Plata’ and ‘Orinoco’ rivers, our results show the positive impact of reservoirs in increasing the availability of water. In the case of the ‘La Plata’ River (region ‘R’), the increment of water availability (ΔWA) due to the presence of reservoirs is 97%. Moreover, in the case of the ‘Orinoco’ River (region ‘G’), water availability is increased by almost 105% due to the presence of reservoirs. This significant increase in water availability could be directly attributed to the fact that both rivers have advanced hydraulic infrastructure, whether in the form of many dams or large reservoirs. On the other hand, although the Amazon River (region ‘I’) has the highest volume of water availability on the continent, the increase in water availability due to the presence of reservoirs in this river is less than 5%, which is one of the lowest values in the continent. In the same way as regions ‘I’ and ‘G’, this relatively low increment of water availability could be attributed to the fact that the Amazon basin has a reduced number of reservoirs and water storage capacity in comparison to its area and mean annual flow. The increment of water availability ΔWA for each hydrological region was determined using Equation (1) and is presented in Table 3 and was also mapped in Figure 6. In addition, the results of ΔWA for the entire topological model are presented in the Supplementary Materials Section.
At the continental scale, the positive impact of reservoirs on increasing water availability is better observed in the southeast of the continent. The region with the highest increment in water availability ΔWA is the region ‘Y’ in the north of Argentina, with an increase of more than 310%. In the same way, regions ‘C’, ‘J’, ‘L’, ‘N’, ‘O’, ‘P’, and ‘U’, show an increase of in water availability of more than 100% due to the presence of reservoirs. In all these regions, the common factor is the high level of development of hydraulic infrastructure. This could be attributed to different causes, either due to necessities caused by unfavorable climatic or hydrological conditions, as in the case of the regions in northern Chile (region ‘C’), or the north of Argentina (region ‘Y’), or also due to increasing human-induced demands (hydroelectricity, water supply, irrigation) as in the case of the central region of Argentina (region ‘U’) or Eastern Brazil (regions ‘J’, ‘L’, ‘N’, ‘O’, and ‘P’). With the exception of region ‘G’, most northern regions of the continent, where there are fewer reservoirs, do not experience the same increase in water availability as the southern regions. The results for all hydrological regions are presented in Table 3 and are also mapped in Figure 6. In addition, the results of ΔWA for the entire topological model are presented in the Supplementary Materials Section.
Finally, we determined the ratio of the increment of water availability per storage (ΔWA/S). This ratio allows us to observe the specific influence of reservoirs on the availability of water of each catchment. The regions that make the best use of their water storage are regions ‘C’, ‘X’, and ‘Y’ in Northern Chile and Central Argentina. In these cases, it is observed that the increase in water availability in these regions in relation to the volume of storage in their basins is significant. On the other hand, it can be observed that in the regions where water resources are more abundant (regions ‘G’, ‘I’, ‘R’), the increase in water availability in relation to water storage is the lowest in the continent. Although the increase in water availability that is caused by the presence of reservoirs or water storage can occur due to several factors (e.g., management of reservoirs, or climatological or hydrological characteristics), the ΔWA/S ratio can prove useful to help us identify the hydrological regions that make a more ‘efficient’ use of their water storage and reservoirs to meet their water resource needs. The ΔWA/S ratio is presented in Table 3 and is also mapped as quartiles in Figure 7. In addition, the results of the ΔWA/S ratio for the entire topological model are presented in the Supplementary Materials Section.
3.4. Estimates of Water Consumption and Potential Water Availability in South America
In order to provide a better understanding of the impact of reservoirs in the availability of water in South America, we examined the relationship between water availability and the estimated water consumption (WC) in the continent. Despite the fact that many authors have studied water consumption on the continent [82,83,84,85,86,87], the majority of the research conducted to date is focused on local areas within the different countries of the continent. Furthermore, estimates of water consumption vary greatly for each country in South America due to the region’s great climatic diversity, different social customs, and different levels of economic income.
For this study, the estimated water consumption of each hydrological region was determined using population and irrigated areas data. The estimates on population and equipped areas for irrigation of each hydrological region were derived from the ‘Global Rural–Urban Mapping Project’ (GRUMP) [77] and the ‘Global Map of Irrigated Areas’ dataset (GMIA) [80], respectively. We assumed a water consumption of 390 liters of water per person per day for domestic and industrial purposes, and 7250 cubic meters of water per hectare per year for agricultural purposes.
The estimates of water consumption of the continent were derived from the World Bank information on water withdrawals [76], which is presented for different years and for all the countries in the continent. First, we determined the average water withdrawals for domestic, industrial, and agricultural purposes for the time period of this analysis from the World Bank database. Then, we determined the average consumption for domestic and industrial purposes based on the population information from the GRUMP database. The average consumption for agricultural purposes was determined based on the equipped areas for irrigation data from the GMIA database. The estimates for water consumption per country and per different use are presented in the Supplementary Table S1, which is presented in the Supplementary Materials Section.
Again, the estimates of water consumption and their relationship to potential water availability show significant differences between the continent’s hydrological regions. The region with the highest needs of water is region ‘R’ in ‘La Plata’ river with 25.46 km3 of water per year. The regions with the lowest water needs are regions ‘K’, ‘S’, ‘V’, and ‘Z’ with less than 0.5 km3 of water per year. As shown in Table 4, the difference in water needs between regions is related to the number of inhabitants and the number of hectares equipped for irrigation in each region. The relationship between potential water availability and water consumption, on the other hand, suggests that some hydrological regions are better suited to meet their water needs. For example, in the region ‘R’ in ‘La Plata’ river, the potential water availability is almost 28 times higher than their estimated water needs. In the case of the region ‘I’ in the Amazon River, the potential water availability is more than 450 times higher than their estimated water needs. Region’s ‘G’, ‘H’, ‘J’, and ‘V’ also present high volumes of water availability in relation to their estimated water needs. In contrast, on regions ‘C’, ‘X’, ‘Y’, and ‘Z’ the estimated water needs represent more than the half of their potential water availability, which indicates that these regions could suffer potential problems to meet their water demands on the future, if no additional measures or water sources are considered. Results of estimations of water consumption and their relationship with potential water availability for all the hydrological regions of this analysis are presented in Table 4.
3.5. Data Limitations
Some limitations of this study should be noted. First, because the WAAPA model is designed to maximize potential water availability, the reservoir operation is highly simplified. Usually, reservoir operation is typically more complex due to additional conditions and constraints encountered during reservoir management. They are either operated individually to meet local demands, or they are operated as part of systems throughout the basin. Thus, the results of this study’s WAAPA model should be regarded as the upper bound of the water availability that could be obtained during actual reservoir operation. Second, the system performance was evaluated as gross volume reliability and the potential water availability was obtained under the hypothesis of 98% reliability.
Third, considering the continental scale of this assessment, the water availability has been estimated using a continuous monthly distribution of the water demand. Therefore, given that the actual proportion between water supply and irrigation demand is unknown for many nodes of the river system, water availability results should be carefully considered if they are intended to be used at a local scale. Fourth, our results and conclusions are inextricably linked to the uncertainty of the global climate models (GCMs) considered in this analysis. We did not consider regional climate models (RCMs), which are expected to present less associated uncertainty than GCMs since they account for more detailed and specific regional characteristics. However, it should also be noted that as mentioned by Llopart, 2020 [71], uncertainties from both GCMs and RCMs are greater in some regions of South America, such as the Andes mountains and the Patagonia region.
Fifth, groundwater storage was not considered in this study. In general, groundwater storage on the continent has not been extensively studied, and there are still regions that require more in-depth analysis of their groundwater resources [88]. Several authors have conducted various studies on the continent’s groundwater resources [88,89,90,91,92,93]. However, most of these studies are focused on a local scale. Although most studies agree on the importance of groundwater resources in the continent, owing to rising demand for both domestic and agricultural purposes, they also emphasize the need for additional research in this area and most importantly, in the necessity to promote discussion on the development on comprehensive frameworks for groundwater management [93]. Finally, it should be also noted that the environmental flow was not considered for this study. This is due the fact that there is no uniform legislation regarding environmental flow in South America. Although some countries in the region, such as Argentina, Chile, Ecuador, or Peru, establish minimum parameters for environmental flows (e.g., between 10 and 20% of the multiannual mean monthly flow) [94,95,96,97], in the rest of the continent (Bolivia, Brazil, Uruguay, or Venezuela), environmental flow legislation is still recent, and thus, no specific methods have yet been determined. [98,99,100,101,102]. Hence, we consider that additional analysis of water availability on a local scale and considering the local requirements of environmental flows, might be required to improve the results of this study.
4. Conclusions
The potential effects of reservoir storage in river systems in South America have been analyzed in this study. For this purpose, 808 dams with a reservoir volume of almost 1004 km3 were considered. The hydrological model developed for this analysis consists of 4661 water catchments, which were grouped into 27 hydrological regions covering the entire continental area of South America. Although in general, this continent is usually considered as the region with the most abundant water resources in the planet, our analysis shows the great complexity of the dynamics of the water resources systems and, above all, the great variability in the distribution of water resources throughout the continent.
For the water storage analysis, we determined relevant hydrological data: area, mean annual flow, runoff, water storage, population, and irrigated areas. In addition, the analysis of water storage was carried out based on three variables, runoff, area, and population. On average, the reservoirs in South America store almost 10% of the continent’s annual runoff, which is equivalent to 64,000 m3 of water per km2, or 4000 m3 of water per person. However, the distribution and potential effects of water storage vary substantially between hydrological regions. The potential impacts of water storage are more evident in the southeastern regions of the continent, especially in regions ‘T’ and ‘U’ in the ‘Colorado’ and ‘Negro’ rivers in Argentina, respectively. Region ‘U’ has the greatest water storage in terms of area and number of persons. On the other hand, the reservoirs in region ‘T’ store an equivalent to 3.5 years of their total runoff. These two basins stand out above the rest of the regions in the continent, and our results suggest that they are the most prone to being ‘affected’ by the potential impacts associated with dams.
In addition, the availability of water in South America was analyzed by applying the WAAPA model. The overall result indicates that the availability of water in the continent is 6391.95 km3 of water per year, which represents almost 60% of the continent’s mean annual flow. As in the case of water storage, our assessment was focused on three variables: runoff, area, and population. In general, our findings indicate that water availability is higher in the southeast of the continent, which suggests that water availability has improved in regions with a high level of development of its hydraulic infrastructure. We also carried out an assessment of the role of water storage in the availability of water in the continent. According to our findings, Region ‘Y’ in Argentina has the greatest increase in water availability due to water storage, with an increase of more than 310% due to the presence of reservoirs. Water availability is significantly increased due to the presence of reservoirs in regions ‘C’, ‘G’, ‘J’, ‘L’, ‘N’, ‘O’, ‘P’, ‘R’, and ‘U’, which are mostly located in the continent’s southeast. Because of the presence of reservoirs, water availability in these hydrological regions is increased by more than 100%. These results suggest a positive influence of water storage on the potential water availability in the river systems of the continent. On average, our results suggest that water availability in the continent has been increased by nearly 72% due to the presence of reservoirs.
Finally, although several uncertainties related to seasonal or interannual discharge variations are expected in some regions, our findings depict a very likely scenario of the current potential effects of reservoir storage in the water resources systems of South America. To the knowledge of the authors, this is the first study on a continental scale that studies water storage and its effects on water availability at a basin level. Thus, with the results derived from this study, we expect to serve as an initial approach to further research of the water resource systems of South America, both for present and future scenarios. The effects of environmental flows, the study of water withdrawal, or the assessment of the potential effects of climate change for future scenarios in the continent will be addressed by the authors in their ongoing research.
Supplementary Materials
The following are available online at https://www.mdpi.com/article/10.3390/w13141992/s1, (1) High-resolution images of Figures S1–S7. (2) Results of the hydrological variables of Figure S2 (F, R, S, A, and population density) for the entire topological model are presented as Figures S2b–f respectively). (3) Results of the storage ratios in Figure 4 for the entire topological model are presented in Figure S4a–c. (4) Results of the water availability ratios in Figure 5 for the entire topological model are presented in Figure S5b–c. (5) Results of the ΔWA/S ratios in Figure S7 for the entire topological model are presented in Figure S7.1. (6) Scatterplots for the S and WA ratios are presented in Figures S8–S13. (7) The topological model used for this assessment, including the information presented in Figures S2 and S4 for all catchments is presented in the file ‘SAModelInfo.shp’ as a shapefile (*.SHP) format. In addition, the water storage analysis results for the 808 dams considered in this study were revised and included in the ‘Dataset of Georeferenced Dams in South America (DDSA)’ [23]. Finally, Supplementary Table S1 ‘Supplementary Table S1. Water consumption estimates for South America (1960–2000)’ is also included in the Supplementary Materials Section.
Author Contributions
Conceptualization, L.G. and B.P.-B.; methodology, L.G. and B.P.-B.; data processing, B.P.-B.; software, L.G. and B.P-B.; validation, L.G., B.d-L., and A.S.-W.; writing—original draft preparation, B.P.-B.; writing—review and editing, B.P.-B., L.G., B.d.-L., and A.S.-W.; visualization, L.G. and B.P.-B.; supervision, L.G. All authors have read and agreed to the published version of the manuscript.
Funding
This research was funded by the Spanish Ministry of Science and Innovation, grant number PID2019-105852RA-I00: “Simulation of climate scenarios and adaptation in water resources systems (SECA-SRH)”. B.P-B. would like to acknowledge Universidad Técnica de Ambato for the financial support through its doctoral student mobility program (award no. 1886-CU-P-2018, Resolución HCU).
Data Availability Statement
The data presented in this study are available in www.mdpi.com/xxx/s1.
Acknowledgments
Data from the PRUDENCE and ENSEMBLES projects were used in this work. PRUDENCE was funded by the EU FP5 (EVK2-CT2001-00132) and ENSEMBLES was funded by the EU FP6 (contract No. 505539). Support from both projects is gratefully acknowledged. Moreover, the authors acknowledge the World Climate Research Programme’s Working Group on Regional Climate, and the Working Group on Coupled Modelling, former coordinating body of CORDEX and the responsible panel for CMIP5; and also thank the climate modelling groups for producing and making available their model output. Finally, the authors also acknowledge the Earth System Grid Federation infrastructure, an international effort led by the U.S. Department of Energy’s Program for Climate Model Diagnosis and Intercomparison, the European Network for Earth System Modelling and other partners in the Global Organization for Earth System Science Portals (GO-ESSP).
Conflicts of Interest
The authors declare no conflict of interest.
References
- Stikker, A. Water Today and Tomorrow. Futures 1998, 30, 43–62. [Google Scholar] [CrossRef]
- Rijsberman, F.R. Water Scarcity: Fact or Fiction? Agric. Water Manag. 2006, 80, 5–22. [Google Scholar] [CrossRef] [Green Version]
- Seo, S.N. An Analysis of Public Adaptation to Climate Change Using Agricultural Water Schemes in South America. Ecol. Econ. 2011, 70, 825–834. [Google Scholar] [CrossRef]
- Murtinho, F.; Tague, C.; de Bievre, B.; Eakin, H.; Lopez-Carr, D. Water Scarcity in the Andes: A Comparison of Local Perceptions and Observed Climate, Land Use and Socioeconomic Changes. Hum. Ecol. 2013, 41, 667–681. [Google Scholar] [CrossRef]
- Buytaert, W.; Breuer, L. Water Resources in South America: Sources and Supply, Pollutants and Perspectives. IAHS-AISH Proc. Rep. 2013, 361, 106–113. [Google Scholar]
- Schyns, J.F.; Hoekstra, A.Y.; Booij, M.J.; Hogeboom, R.J.; Mekonnen, M.M. Limits to the World’s Green Water Resources for Food, Feed, Fiber, Timber, and Bioenergy. Proc. Natl. Acad. Sci. USA 2019, 116, 4893–4898. [Google Scholar] [CrossRef] [PubMed] [Green Version]
- Oppliger, A.; Höhl, J.; Fragkou, M. Escasez de Agua: Develando Sus Orígenes Híbridos En La Cuenca Del Río Bueno, Chile. Rev. Geogr. Norte Gd. 2019, 27, 9–27. [Google Scholar] [CrossRef] [Green Version]
- Molden, D. Scarcity of Water or Scarcity of Management? Int. J. Water Resour. Dev. 2020, 36, 258–268. [Google Scholar] [CrossRef] [Green Version]
- Döll, P.; Fiedler, K.; Zhang, J. Global-Scale Analysis of River Flow Alterations Due to Water Withdrawals and Reservoirs. Hydrol. Earth Syst. Sci. 2009, 13, 2413–2432. [Google Scholar] [CrossRef] [Green Version]
- Siqueira, V.A.; Paiva, R.C.D.; Fleischmann, A.S.; Fan, F.M.; Ruhoff, A.L.; Pontes, P.R.M.; Paris, A.; Calmant, S.; Collischonn, W. Toward Continental Hydrologic-Hydrodynamic Modeling in South America. Hydrol. Earth Syst. Sci. 2018, 22, 4815–4842. [Google Scholar] [CrossRef] [Green Version]
- Beck, H.E.; Van Dijk, A.I.J.M.; De Roo, A.; Dutra, E.; Fink, G.; Orth, R.; Schellekens, J. Global Evaluation of Runoff from 10 State-of-the-Art Hydrological Models. Hydrol. Earth Syst. Sci. 2017, 21, 2881–2903. [Google Scholar] [CrossRef] [Green Version]
- Zaherpour, J.; Gosling, S.N.; Mount, N.; Schmied, H.M.; Veldkamp, T.I.E.; Dankers, R.; Eisner, S.; Gerten, D.; Gudmundsson, L.; Haddeland, I.; et al. Worldwide Evaluation of Mean and Extreme Runoff from Six Global-Scale Hydrological Models That Account for Human Impacts. Environ. Res. Lett. 2018, 13. [Google Scholar] [CrossRef]
- Pontes, P.R.M.; Fan, F.M.; Fleischmann, A.S.; de Paiva, R.C.D.; Buarque, D.C.; Siqueira, V.A.; Jardim, P.F.; Sorribas, M.V.; Collischonn, W. MGB-IPH Model for Hydrological and Hydraulic Simulation of Large Floodplain River Systems Coupled with Open Source GIS. Environ. Model. Softw. 2017, 94, 1–20. [Google Scholar] [CrossRef]
- Getirana, A.C.V.; Paiva, R.C.D. Mapping Large-Scale River Flow Hydraulics in the Amazon Basin. Water Resour. Res. 2013, 49, 2437–2445. [Google Scholar] [CrossRef]
- Fleischmann, A.; Collischonn, W.; Paiva, R.; Tucci, C.E. Modeling the Role of Reservoirs versus Floodplains on Large-Scale River Hydrodynamics. Nat. Hazards 2019, 99, 1075–1104. [Google Scholar] [CrossRef] [Green Version]
- De Paiva, R.C.D.; Buarque, D.C.; Collischonn, W.; Bonnet, M.-P.; Frappart, F.; Calmant, S.; Bulhões Mendes, C.A. Large-Scale Hydrologic and Hydrodynamic Modeling of the Amazon River Basin. Water Resour. Res. 2013, 49, 1226–1243. [Google Scholar] [CrossRef] [Green Version]
- Chagas, V.B.P.; Chaffe, P.L.B.; Addor, N.; Fan, F.M.; Fleischmann, A.S.; Paiva, R.C.D.; Siqueira, V.A. CAMELS-BR: Hydrometeorological Time Series and Landscape Attributes for 897 Catchments in Brazil. Earth Syst. Sci. Data 2020, 12, 2075–2096. [Google Scholar] [CrossRef]
- Alvarez-Garreton, C.; Mendoza, P.A.; Boisier, J.P.; Addor, N.; Galleguillos, M.; Zambrano-Bigiarini, M.; Lara, A.; Puelma, C.; Cortes, G.; Garreaud, R.; et al. The CAMELS-CL Dataset: Catchment Attributes and Meteorology for Large Sample Studies-Chile Dataset. Hydrol. Earth Syst. Sci. 2018, 22, 5817–5846. [Google Scholar] [CrossRef] [Green Version]
- Sordo-Ward, A.; Granados, I.; Iglesias, A.; Garrote, L. Blue Water in Europe: Estimates of Current and Future Availability and Analysis of Uncertainty. Water 2019, 11, 420. [Google Scholar] [CrossRef] [Green Version]
- Nilsson, C.; Reidy, C.A.; Dynesius, M.; Revenga, C. Fragmentation and Flow Regulation of the World’s Large River Systems. Science 2005, 308, 405–408. [Google Scholar] [CrossRef] [PubMed] [Green Version]
- Iglesias, A.; Garrote, L. Adaptation Strategies for Agricultural Water Management under Climate Change in Europe. Agric. Water Manag. 2015, 155, 113–124. [Google Scholar] [CrossRef] [Green Version]
- Iglesias, A.; Santillán, D.; Garrote, L. On the Barriers to Adaption to Less Water under Climate Change: Policy Choices in Mediterranean Countries. Water Resour. Manag. 2018, 32, 4819–4832. [Google Scholar] [CrossRef]
- Paredes-Beltran, B.E.; Sordo-Ward, A.; Garrote, L. Dataset of Georeferenced Dams in South America (DDSA). Earth Syst. Sci. Data 2021, 13, 213–229. [Google Scholar] [CrossRef]
- Almeida, R.M.; Shi, Q.; Gomes-Selman, J.M.; Wu, X.; Xue, Y.; Angarita, H.; Barros, N.; Forsberg, B.R.; García-Villacorta, R.; Hamilton, S.K.; et al. Reducing Greenhouse Gas Emissions of Amazon Hydropower with Strategic Dam Planning. Nat. Commun. 2019, 10. [Google Scholar] [CrossRef]
- Anderson, E.P.; Jenkins, C.N.; Heilpern, S.; Maldonado-Ocampo, J.A.; Carvajal-Vallejos, F.M.; Encalada, A.C.; Rivadeneira, J.F.; Hidalgo, M.; Cañas, C.M.; Ortega, H.; et al. Fragmentation of Andes-to-Amazon Connectivity by Hydropower Dams. Sci. Adv. 2018, 4, 1–8. [Google Scholar] [CrossRef] [PubMed] [Green Version]
- Moran, E.F.; Lopez, M.C.; Moore, N.; Müller, N.; Hyndman, D.W. Sustainable Hydropower in the 21st Century. Proc. Natl. Acad. Sci. USA 2018, 115, 11891–11898. [Google Scholar] [CrossRef] [PubMed] [Green Version]
- Zhang, X.; Li, H.-Y.; Deng, Z.D.; Ringler, C.; Gao, Y.; Hejazi, M.I.; Leung, L.R. Impacts of Climate Change, Policy and Water-Energy-Food Nexus on Hydropower Development. Renew. Energy 2018, 116, 827–834. [Google Scholar] [CrossRef]
- Zarfl, C.; Berlekamp, J.; He, F.; Jähnig, S.C.; Darwall, W.; Tockner, K. Future Large Hydropower Dams Impact Global Freshwater Megafauna. Sci. Rep. 2019, 9, 1–10. [Google Scholar] [CrossRef] [PubMed] [Green Version]
- Barbarossa, V.; Schmitt, R.J.P.; Huijbregts, M.A.J.; Zarfl, C.; King, H.; Schipper, A.M. Impacts of Current and Future Large Dams on the Geographic Range Connectivity of Freshwater Fish Worldwide. Proc. Natl. Acad. Sci. USA 2020, 117, 3648–3655. [Google Scholar] [CrossRef] [Green Version]
- Athayde, S.; Duarte, C.G.; Gallardo, A.L.C.F.; Moretto, E.M.; Sangoi, L.A.; Dibo, A.P.A.; Siqueira-Gay, J.; Sánchez, L.E. Improving Policies and Instruments to Address Cumulative Impacts of Small Hydropower in the Amazon. Energy Policy 2019, 132, 265–271. [Google Scholar] [CrossRef]
- Pestana, I.A.; Azevedo, L.S.; Bastos, W.R.; Magalhães de Souza, C.M. The Impact of Hydroelectric Dams on Mercury Dynamics in South America: A Review. Chemosphere 2019, 219, 546–556. [Google Scholar] [CrossRef]
- Van Damme, P.A.; Córdova-Clavijo, L.; Baigún, C.; Hauser, M.; da Costa Doria, C.R.; Duponchelle, F. Upstream Dam Impacts on Gilded Catfish Brachyplatystoma Rousseauxii (Siluriformes: Pimelodidae) in the Bolivian Amazon. Neotrop. Ichthyol. 2019, 17, 1–9. [Google Scholar] [CrossRef]
- dos Santos, E.A.; Medeiros, M.B.; Ferreira, E.J.L.; Simon, M.F.; Oliveira, W.L.; Costa, F.R.C. Palm Distribution Patterns in the Southwestern Brazilian Amazon: Impact of a Large Hydroelectric Dam. For. Ecol. Manag. 2020, 463, 118032. [Google Scholar] [CrossRef]
- Neiff, J.J.; Casco, S.L.; Poi, A.S.G.; Zambiasio, V.A. Influence of Yacyretá Dam on Trees Distribution in the Paraná Floodplain. Ecol. Eng. 2020, 154. [Google Scholar] [CrossRef]
- Nogueira, M.G.; Perbiche-Neves, G.; de Oliveira Naliato, D.; Caglierani Casanova, S.M.; Roberto Debastiani-Júnior, J.; Espíndola, E.G. Limnology and Water Quality in La Plata Basin (South America)—Spatial Patterns and Major Stressors. Ecol. Indic. 2021, 120, 106968. [Google Scholar] [CrossRef]
- Wurbs, R.A.; Muttiah, R.S.; Felden, F. Incorporation of Climate Change in Water Availability Modeling. J. Hydrol. Eng. 2005, 10, 375–385. [Google Scholar] [CrossRef]
- Yates, D.; Sieber, J.; Purkey, D.; Huber-Lee, A. WEAP21—A Demand-, Priority-, and Preference-Driven Water Planning Model. Part 1: Model Characteristics. Water Int. 2005, 30, 487–500. [Google Scholar] [CrossRef]
- Vogel, R.M.; Sieber, J.; Archfield, S.A.; Smith, M.P.; Apse, C.D.; Huber-Lee, A. Relations among Storage, Yield, and Instream Flow. Water Resour. Res. 2007, 43, 1–12. [Google Scholar] [CrossRef]
- White, M.; Gambone, M.; Yen, H.; Arnold, J.; Harmel, D.; Santhi, C.; Haney, R. Regional Blue and Green Water Balances and Use by Selected Crops in the U.S. JAWRA J. Am. Water Resour. Assoc. 2015, 51, 1626–1642. [Google Scholar] [CrossRef]
- Arnold, J.G.; Bieger, K.; White, M.J.; Srinivasan, R.; Dunbar, J.A.; Allen, P.M. Use of Decision Tables to Simulate Management in SWAT+. Water 2018, 10, 713. [Google Scholar] [CrossRef] [Green Version]
- Andreu, J.; Capilla, J.; Sanchis, E. AQUATOOL, a generalized decision-support system for water-resources planning and operational management. J. Hydrol. 1996, 177, 269–291. [Google Scholar] [CrossRef]
- Harou, J.J.; Pulido-Velazquez, M.; Rosenberg, D.E.; Medellín-Azuara, J.; Lund, J.R.; Howitt, R.E. Hydro-Economic Models: Concepts, Design, Applications, and Future Prospects. J. Hydrol. 2009, 375, 627–643. [Google Scholar] [CrossRef] [Green Version]
- Sordo-Ward, Á.; Granados, I.; Martín-Carrasco, F.; Garrote, L. Impact of Hydrological Uncertainty on Water Management Decisions. Water Resour. Manag. 2016, 30, 5535–5551. [Google Scholar] [CrossRef]
- Chavez-Jimenez, A.; Lama, B.; Garrote, L.; Martin-Carrasco, F.; Sordo-Ward, A.; Mediero, L. Characterisation of the Sensitivity of Water Resources Systems to Climate Change. Water Resour. Manag. 2013, 27, 4237–4258. [Google Scholar] [CrossRef]
- WWAP (World Water Assessment Programme). Managing Water under Uncertainty and Risk (UNWWD Report 4); WWAP: Perugia, Italy, 2012; Volume 1. [Google Scholar]
- Sordo-Ward, A.; Granados, A.; Iglesias, A.; Garrote, L.; Bejarano, M.D. Adaptation Effort and Performance of Water Management Strategies to Face Climate Change Impacts in Six Representative Basins of Southern Europe. Water 2019, 11, 1078. [Google Scholar] [CrossRef] [Green Version]
- Sordo-Ward, Á.; Bejarano, M.D.; Granados, I.; Garrote, L. Facing Future Water Scarcity in the Duero-Douro Basin: Comparative Effect of Policy Measures on Irrigation Water Availability. J. Water Resour. Plan. Manag. 2020, 146, 1–12. [Google Scholar] [CrossRef]
- Granados, A.; Sordo-Ward, A.; Paredes-Beltrán, B.; Garrote, L. Exploring the Role of Reservoir Storage in Enhancing Resilience to Climate Change in Southern Europe. Water 2021, 13, 85. [Google Scholar] [CrossRef]
- Garrote, L.; Iglesias, A.; Granados, A.; Mediero, L.; Martin-Carrasco, F. Quantitative Assessment of Climate Change Vulnerability of Irrigation Demands in Mediterranean Europe. Water Resour. Manag. 2015, 29, 325–338. [Google Scholar] [CrossRef]
- Krol, M.S.; De Vries, M.J.; van Oel, P.; de Araújo, J.C. Sustainability of Small Reservoirs and Large Scale Water Availability Under Current Conditions and Climate Change. Water Resour. Manag. 2011, 25, 3017–3026. [Google Scholar] [CrossRef] [Green Version]
- Elliott, J.; Deryng, D.; Müller, C.; Frieler, K.; Konzmann, M.; Gerten, D.; Glotter, M.; Flörke, M.; Wada, Y.; Best, N.; et al. Constraints and Potentials of Future Irrigation Water Availability on Agricultural Production under Climate Change. Proc. Natl. Acad. Sci. USA 2014, 111, 3239–3244. [Google Scholar] [CrossRef] [Green Version]
- Álvarez-Dávila, E.; Cayuela, L.; González-Caro, S.; Aldana, A.M.; Stevenson, P.R.; Phillips, O.; Cogollo, Á.; Peñuela, M.C.; Von Hildebrand, P.; Jiménez, E.; et al. Forest Biomass Density across Large Climate Gradients in Northern South America Is Related to Water Availability but Not with Temperature. PLoS ONE 2017, 12, 1–16. [Google Scholar] [CrossRef]
- Garrote, L. Managing Water Resources to Adapt to Climate Change: Facing Uncertainty and Scarcity in a Changing Context. Water Resour. Manag. 2017, 31, 2951–2963. [Google Scholar] [CrossRef]
- Garrote, L.; Iglesias, A.; Martin-Carrasco, F.; Mediero, L. WAAPA: A Model for Water Availability and Climate Change Adaptation Policy Analysis. In Proceedings of the EWRA Conference, Catania, Italy, 29 June–2 July 2011. [Google Scholar]
- Abbaspour, K.C.; Rouholahnejad, E.; Vaghefi, S.; Srinivasan, R.; Yang, H.; Kløve, B. A Continental-Scale Hydrology and Water Quality Model for Europe: Calibration and Uncertainty of a High-Resolution Large-Scale SWAT Model. J. Hydrol. 2015, 524, 733–752. [Google Scholar] [CrossRef] [Green Version]
- Food and Agriculture Organization of the United Nations FAO. AQUAMAPS. Available online: http://www.fao.org/land-water/databases-and-software/aquamaps/en/ (accessed on 4 December 2020).
- Food and Agriculture Organization of the United Nations FAO. Review of World Water Resources by Country. Available online: http://www.fao.org/3/y4473e/y4473e00.htm#Contents (accessed on 16 December 2020).
- Garreaud, R.D.; Vuille, M.; Compagnucci, R.; Marengo, J. Present-Day South American Climate. Palaeogeogr. Palaeoclim. Palaeoecol. 2009, 281, 180–195. [Google Scholar] [CrossRef]
- Nathan, M.; Steven, H. The Pacific Decadal Oscillation. J. Oceanogr. 2002, 58, 35–44. [Google Scholar]
- Jiménez-Muñoz, J.C.; Mattar, C.; Barichivich, J.; Santamaría-Artigas, A.; Takahashi, K.; Malhi, Y.; Sobrino, J.A.; Van Der Schrier, G. Record-Breaking Warming and Extreme Drought in the Amazon Rainforest during the Course of El Niño 2015-2016. Sci. Rep. 2016, 6, 1–7. [Google Scholar] [CrossRef] [PubMed] [Green Version]
- Cai, W.; McPhaden, M.J.; Grimm, A.M.; Rodrigues, R.R.; Taschetto, A.S.; Garreaud, R.D.; Dewitte, B.; Poveda, G.; Ham, Y.-G.; Santoso, A.; et al. Climate Impacts of the El Niño–Southern Oscillation on South America. Nat. Rev. Earth Environ. 2020, 1, 215–231. [Google Scholar] [CrossRef]
- Hao, Z.; Zhang, X.; Singh, V.P.; Hao, F. Joint Modeling of Precipitation and Temperature under Influences of El Niño Southern Oscillation for Compound Event Evaluation and Prediction. Atmos. Res. 2020, 245, 105090. [Google Scholar] [CrossRef]
- Lehner, B.; Verdin, K.; Jarvis, A. New Global Hydrography Derived from Spaceborne Elevation Data. EOS 2008, 89, 93–94. [Google Scholar] [CrossRef]
- Van Beek, L.P.H.; Wada, Y.; Bierkens, M.F.P. Global Monthly Water Stress: 1. Water Balance and Water Availability. Water Resour. Res. 2011, 47. [Google Scholar] [CrossRef]
- Warszawski, L.; Frieler, K.; Huber, V.; Piontek, F.; Serdeczny, O.; Schewe, J. The Inter-Sectoral Impact Model Intercomparison Project (ISI-MIP): Project Framework. Proc. Natl. Acad. Sci. USA 2014, 111, 3228–3232. [Google Scholar] [CrossRef] [PubMed] [Green Version]
- Yin, L.; Fu, R.; Shevliakova, E.; Dickinson, R.E. How Well Can CMIP5 Simulate Precipitation and Its Controlling Processes over Tropical South America? Clim. Dyn. 2013, 41, 3127–3143. [Google Scholar] [CrossRef] [Green Version]
- Elguindi, N.; Giorgi, F.; Turuncoglu, U. Assessment of CMIP5 Global Model Simulations over the Subset of CORDEX Domains Used in the Phase I CREMA. Clim. Chang. 2014, 125, 7–21. [Google Scholar] [CrossRef]
- Marengo, J.A.; Bernasconi, M. Regional Differences in Aridity/Drought Conditions over Northeast Brazil: Present State and Future Projections. Clim. Chang. 2015, 129, 103–115. [Google Scholar] [CrossRef]
- Chou, S.C.; Lyra, A.; Mourão, C.; Dereczynski, C.; Pilotto, I.; Gomes, J.; Bustamante, J.; Tavares, P.; Silva, A.; Rodrigues, D.; et al. Assessment of Climate Change over South America under RCP 4.5 and 8.5 Downscaling Scenarios. Am. J. Clim. Chang. 2014, 03, 512–527. [Google Scholar] [CrossRef] [Green Version]
- Llopart, M.; Coppola, E.; Giorgi, F.; da Rocha, R.P.; Cuadra, S.V. Climate Change Impact on Precipitation for the Amazon and La Plata Basins. Clim. Chang. 2014, 125, 111–125. [Google Scholar] [CrossRef] [Green Version]
- Llopart, M.; Reboita, M.S.; Da Rocha, R.P. Assessment of Multi-Model Climate Projections of Water Resources over South America CORDEX Domain. Clim. Dyn. 2020, 54, 99–116. [Google Scholar] [CrossRef]
- Cavalcanti, I.F.A.; Carril, A.F.; Penalba, O.C.; Grimm, A.M.; Menéndez, C.G.; Sanchez, E.; Cherchi, A.; Sörensson, A.; Robledo, F.; Rivera, J.; et al. Precipitation Extremes over La Plata Basin—Review and New Results from Observations and Climate Simulations. J. Hydrol. 2015, 523, 211–230. [Google Scholar] [CrossRef]
- Fekete, B.M.; Vörösmarty, C.J.; Grabs, W. High-Resolution Fields of Global Runoff Combining Observed River Discharge and Simulated Water Balances. Global Biogeochem. Cycles 2002, 16, 15-1–15-10. [Google Scholar] [CrossRef]
- Lv, M.; Lu, H.; Yang, K.; Xu, Z.; Lv, M.; Huang, X. Assessment of Runoff Components Simulated by GLDAS against UNH-GRDC Dataset at Global and Hemispheric Scales. Water 2018, 10, 969. [Google Scholar] [CrossRef] [Green Version]
- Gonzàlez-Zeas, D.; Garrote, L.; Iglesias, A.; Sordo-Ward, A. Improving Runoff Estimates from Regional Climate Models: A Performance Analysis in Spain. Hydrol. Earth Syst. Sci. 2012, 16, 1709–1723. [Google Scholar] [CrossRef] [Green Version]
- The World Bank. Renewable Internal Freshwater Resources, Total (Billion Cubic Meters). Available online: https://data.worldbank.org/indicator/ER.H2O.INTR.K3 (accessed on 14 July 2021).
- Center for International Earth Science Information Network CIESIN; Columbia University; The World Bank; Centro Internacional de Agricultura Tropical CIAT. Global Rural-Urban Mapping Project, Version 1 (GRUMPv1): Population Count Grid; NASA Socioeconomic Data and Applications Center (SEDAC): Palisades, NY, USA, 2011. [Google Scholar]
- Florczyk, A.J.; Melchiorri, M.; Zeidler, J.; Corbane, C.; Schiavina, M.; Freire, S.; Sabo, F.; Politis, P.; Esch, T.; Pesaresi, M. The Generalised Settlement Area: Mapping the Earth Surface in the Vicinity of Built-up Areas. Int. J. Digit. Earth 2020, 13, 45–60. [Google Scholar] [CrossRef]
- McDonald, R.I.; Douglas, I.; Revenga, C.; Hale, R.; Grimm, N.; Grönwall, J.; Fekete, B. Global Urban Growth and the Geography of Water Availability, Quality, and Delivery. Ambio 2011, 437–446. [Google Scholar] [CrossRef] [Green Version]
- Siebert, S.; Döll, P.; Hoogeveen, J.; Faures, J.-M.; Frenken, K.; Feick, S. Development and Validation of the Global Map of Irrigation Areas. Hydrol. Earth Syst. Sci. 2005, 9, 535–547. [Google Scholar] [CrossRef]
- Graf, W.L. Dam Nation: A Geographic Census of American Dams and Their Large-Scale Hydrologic Impacts. Water Resour. Res. 1999, 35, 1305–1311. [Google Scholar] [CrossRef]
- De Sousa, M.; Dias Fouto, N.M.M. Economic Incentives for Water Consumption Reduction: Case Study of the City of São Paulo, Brazil. Water Policy 2019, 21, 1266–1278. [Google Scholar] [CrossRef]
- Acuña, G.I.; Echeverría, C.; Godoy, A.; Vásquez, F. The Role of Climate Variability in Convergence of Residential Water Consumption across Chilean Localities. Environ. Econ. Policy Stud. 2020, 22, 89–108. [Google Scholar] [CrossRef]
- Franco-Crespo, C.; Sumpsi, J.M. The Impact of Pricing Policies on Irrigation Water for Agro-Food Farms in Ecuador. Sustain. 2017, 9, 1515. [Google Scholar] [CrossRef] [Green Version]
- Rondinel-Oviedo, D.R.; Sarmiento-Pastor, J.M. Water: Consumption, Usage Patterns, and Residential Infrastructure. A Comparative Analysis of Three Regions in the Lima Metropolitan Area. Water Int. 2020, 45, 824–846. [Google Scholar] [CrossRef]
- Alarcón, R.A.; Rodríguez, J.P.; Kua, H.W. Voluntary Management of Residential Water Demand in Low and Middle-Low Income Homes: A Pilot Study of Soacha (Colombia). Water 2019, 11, 216. [Google Scholar] [CrossRef] [Green Version]
- Garcia, J.; Salfer, L.R.; Kalbusch, A.; Henning, E. Identifying the Drivers of Water Consumption in Single-Family Households in Joinville, Southern Brazil. Water 2019, 11, 1990. [Google Scholar] [CrossRef] [Green Version]
- Parra, V.; Arumí, J.L.; Muñoz, E.; Paredes, J. Characterization of the Groundwater Storage Systems of South-Central Chile: An Approach Based on Recession Flow Analysis. Water 2019, 11, 2324. [Google Scholar] [CrossRef] [Green Version]
- Xavier, J.M.; Gagliardi, S.; Montaño, M. Recursos Hídricos Subterráneos Del Uruguay. Boletín Geológico y Min. 2006, 117, 201–222. [Google Scholar]
- Allasia, D.G.; Da Silva, B.C.; Collischonn, W.; Tucci, C.E.M. Large Basin Simulation Experience in South America. IAHS-AISH Publ. 2006, 303, 360–370. [Google Scholar]
- Fernández-Escalante, E.; Foster, S.; Navarro-Benegas, R. Evolution and Sustainability of Groundwater Use from the Ica Aquifers for the Most Profitable Agriculture in Peru. Hydrogeol. J. 2020, 28, 2601–2612. [Google Scholar] [CrossRef]
- Gonçalves, R.D.; Teramoto, E.H.; Chang, H.K. Regional Groundwater Modeling of the Guarani Aquifer System. Water 2020, 12, 2323. [Google Scholar] [CrossRef]
- Rebouças, A.D.C. Groundwater Resources in South America. Episodes 1999, 22, 232–237. [Google Scholar] [CrossRef] [Green Version]
- H. Congreso de la Nacion Argentina. Ley de Regimen de Gestion Ambiental Del Aguas de Argentina; H. Congreso de la Nacion Argentina: Buenos Aires, Argentina, 2002. [Google Scholar]
- Diario Oficial de la Republica de Chile. Decreto No 14 de 2012 Que Aprueba El Reglamento Para La Determinacion Del Caudal Ecologico Minimo de Chile; Ministerio del Medio Ambiente de Chile: Santiago, Chile, 2015; p. 1. [Google Scholar]
- Registro Oficial del Ecuador. Reglamento Ley Recursos Hidricos Usos y Aprovechamiento Del Agua; Presidencia de la Republica: Quito, Ecuador, 2015; pp. 1–45.
- Aurotidad Nacional del Agua. Ley de Los Recursos Hidricos; Ministerio de Agricultura y Riego: Lima, Peru, 2019; p. 145.
- Saavedra, R.G. Determinacion Del Caudal Ecológico Del Lago Poopo; Universidad Técnica de Oruro: Oruro, Bolivia, 2017. [Google Scholar]
- Domínguez, G.J.; Finotti, A.R. Evaluación Del Instrumento Caudal Ecológico, Panorama Legal e Institucional En Chile y Brasil. Rega 2005, 2, 83–96. [Google Scholar]
- Santacruz, M.L.I.; Palacios, S.M.M. Regimen de Caudal Ecologico, Herramienta de Gestion Para Conservar La Biota Acuatica. Univ. Mil. Nueva Granada Cienc. E Ing. Neogranadina 2014, 23, 77–94. [Google Scholar] [CrossRef] [Green Version]
- Ministerio de Vivienda Ordenamiento Territorial y Medioambiente de Uruguay. Plan. Nacional de Agua de Uruguay, 1st ed.; Ministerio de Vivienda Ordenamiento Territorial y Medioambiente de Uruguay: Montevideo, Uruguay, 2017.
- Gaceta Oficial de la Republica Bolivariana de Venezuela. Reglamento de La Ley de Aguas; Presidencia de la Republica: Caracas, Venezuela, 2018; p. Decreto 3367.
Figure 1.
Area of study. The 13 countries considered for this study are represented with colors. The 27 hydrological regions defined by FAO [56] are represented with letters.
Figure 1.
Area of study. The 13 countries considered for this study are represented with colors. The 27 hydrological regions defined by FAO [56] are represented with letters.

Figure 2.
Inputs and main characteristics considered for this study mapped by hydrological region: (a) Inputs: the blue lines represent the rivers derived from the HydroSHEDS dataset [63], the grey lines represent the major hydrological regions of South America determined by FAO [56], and the green triangles represent the reservoirs from the DDSA database [23] pare, (b) mean annual flow (km3/yr.), (c) runoff (mm/yr.), (d) total water storage (km3), (e) area of the hydrological region (×1000 km2), and (f) population density (per/km2).

Figure 3.
Diagram of the methodology applied to determine water availability with the WAAPA model [19].
Figure 3.
Diagram of the methodology applied to determine water availability with the WAAPA model [19].

Figure 4.
Store ratios per hydrological region mapped as quartiles (a) reservoir storage per runoff; (b) reservoir storage per area; and (c) reservoir storage per person. See Table 2 for specific values for each hydrological region.
Figure 4.
Store ratios per hydrological region mapped as quartiles (a) reservoir storage per runoff; (b) reservoir storage per area; and (c) reservoir storage per person. See Table 2 for specific values for each hydrological region.

Figure 5.
Water availability ratios per hydrological region mapped as quartiles (a) water availability per runoff; (b) water availability per area; and (c) water availability per person. See Table 2 for specific values.
Figure 5.
Water availability ratios per hydrological region mapped as quartiles (a) water availability per runoff; (b) water availability per area; and (c) water availability per person. See Table 2 for specific values.

Figure 6.
Effects of reservoirs on the availability of water of the hydrological regions in South America. The CCS scenario represents the case scenario of water availability with reservoirs, and the NCS scenario represents the ‘natural’ conditions without reservoirs. Figures (a–c) are mapped as flow values and represent water availability in the CCS scenario, water availability in the NCS scenario, and the increment in water availability Δ, respectively. Figures (d–f) represent the water availability values mapped as quartiles. See Table 3 for specific values.

Figure 7.
Relationship between the increment of water availability and storage (ΔWA/S) mapped as quartiles. See Table 3 for specific values.
Figure 7.
Relationship between the increment of water availability and storage (ΔWA/S) mapped as quartiles. See Table 3 for specific values.


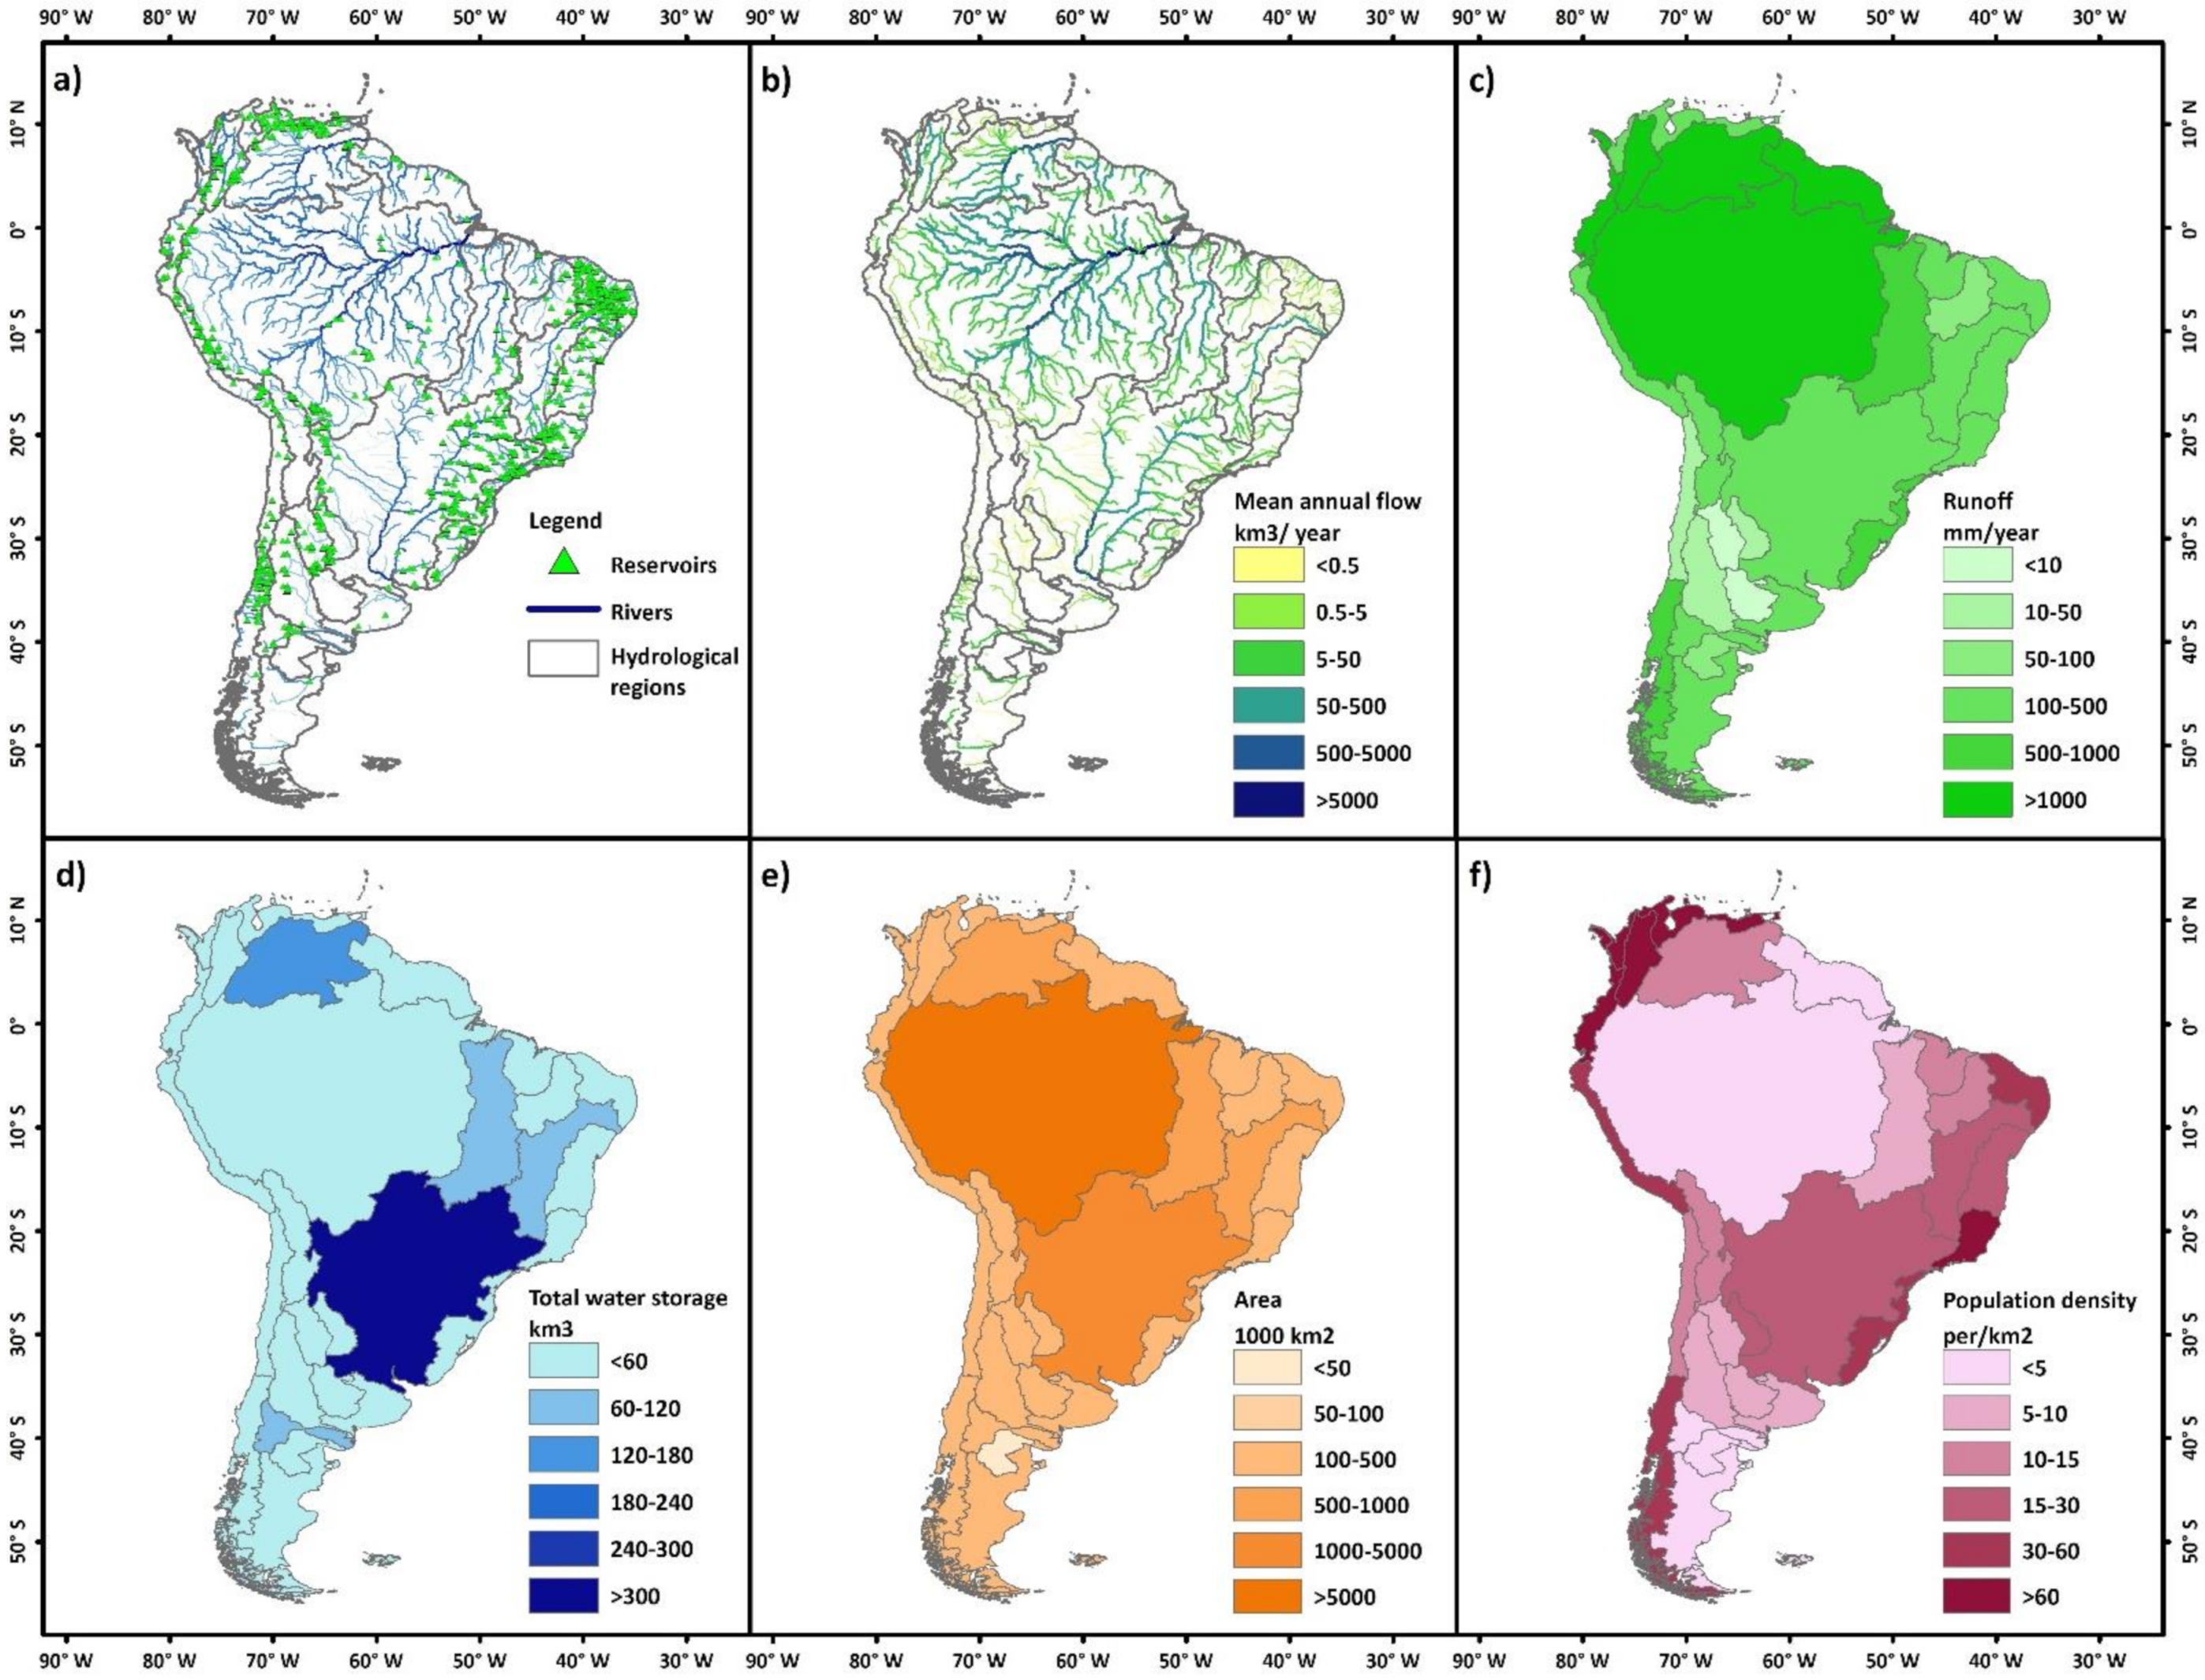
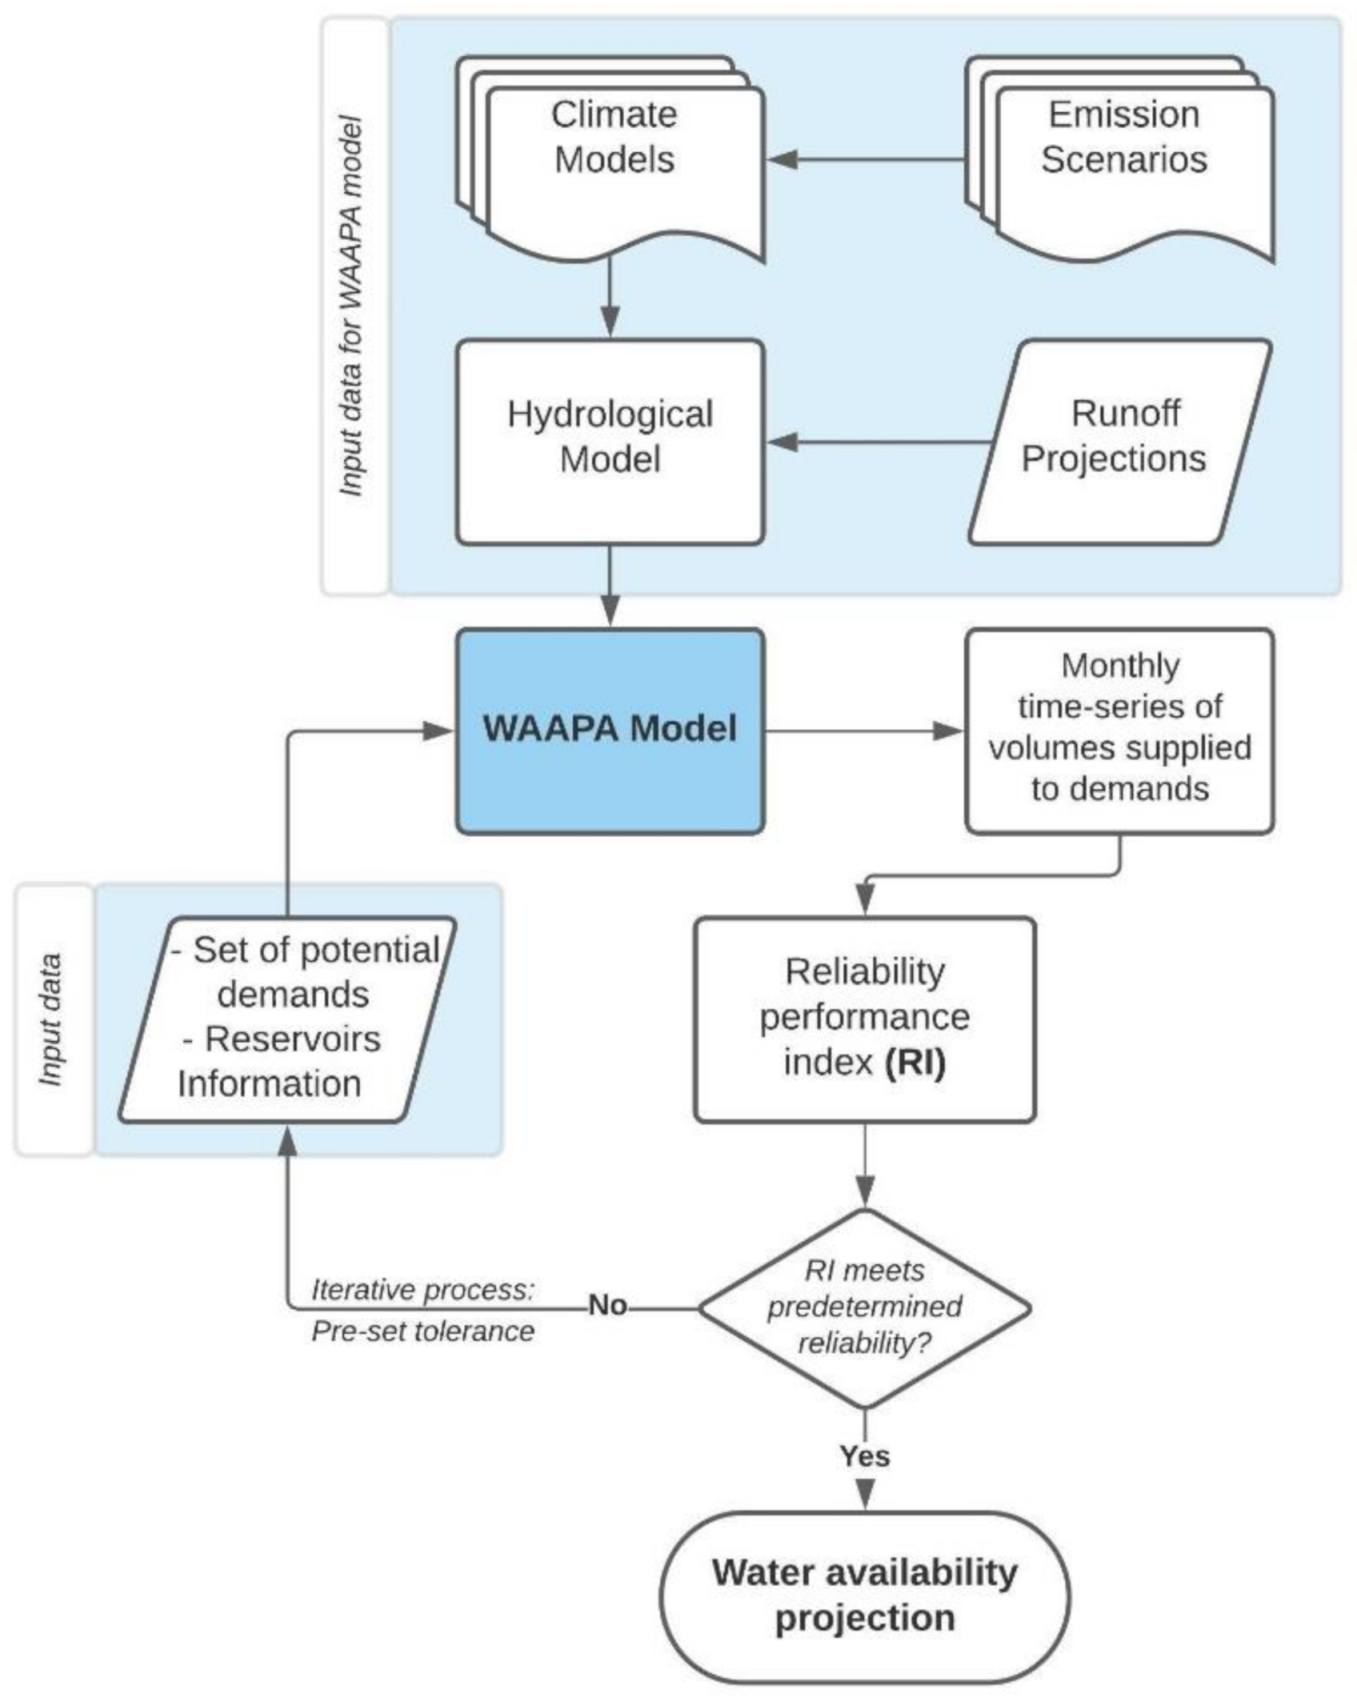
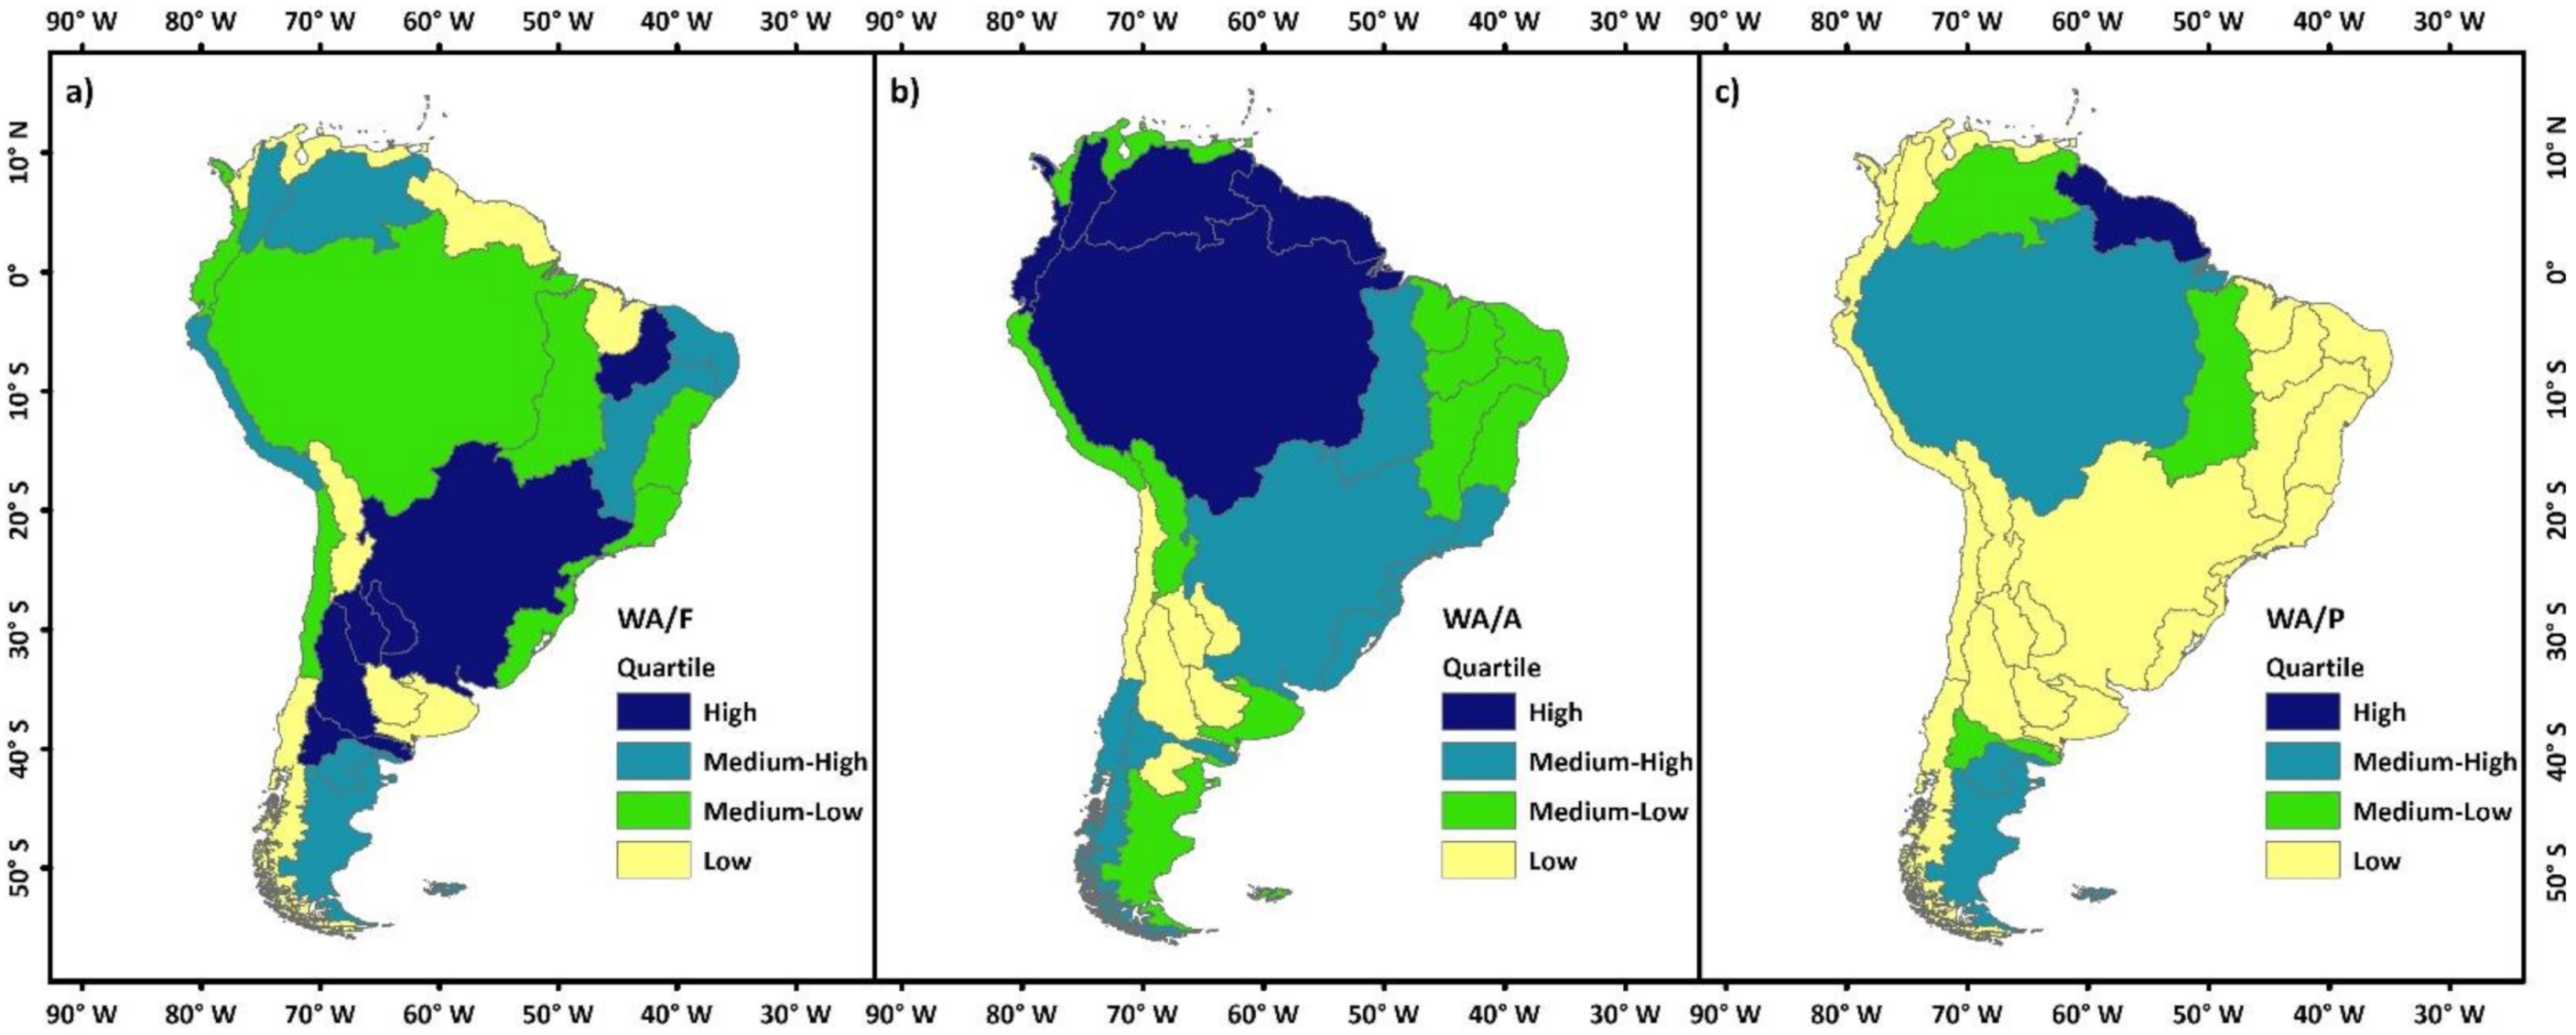
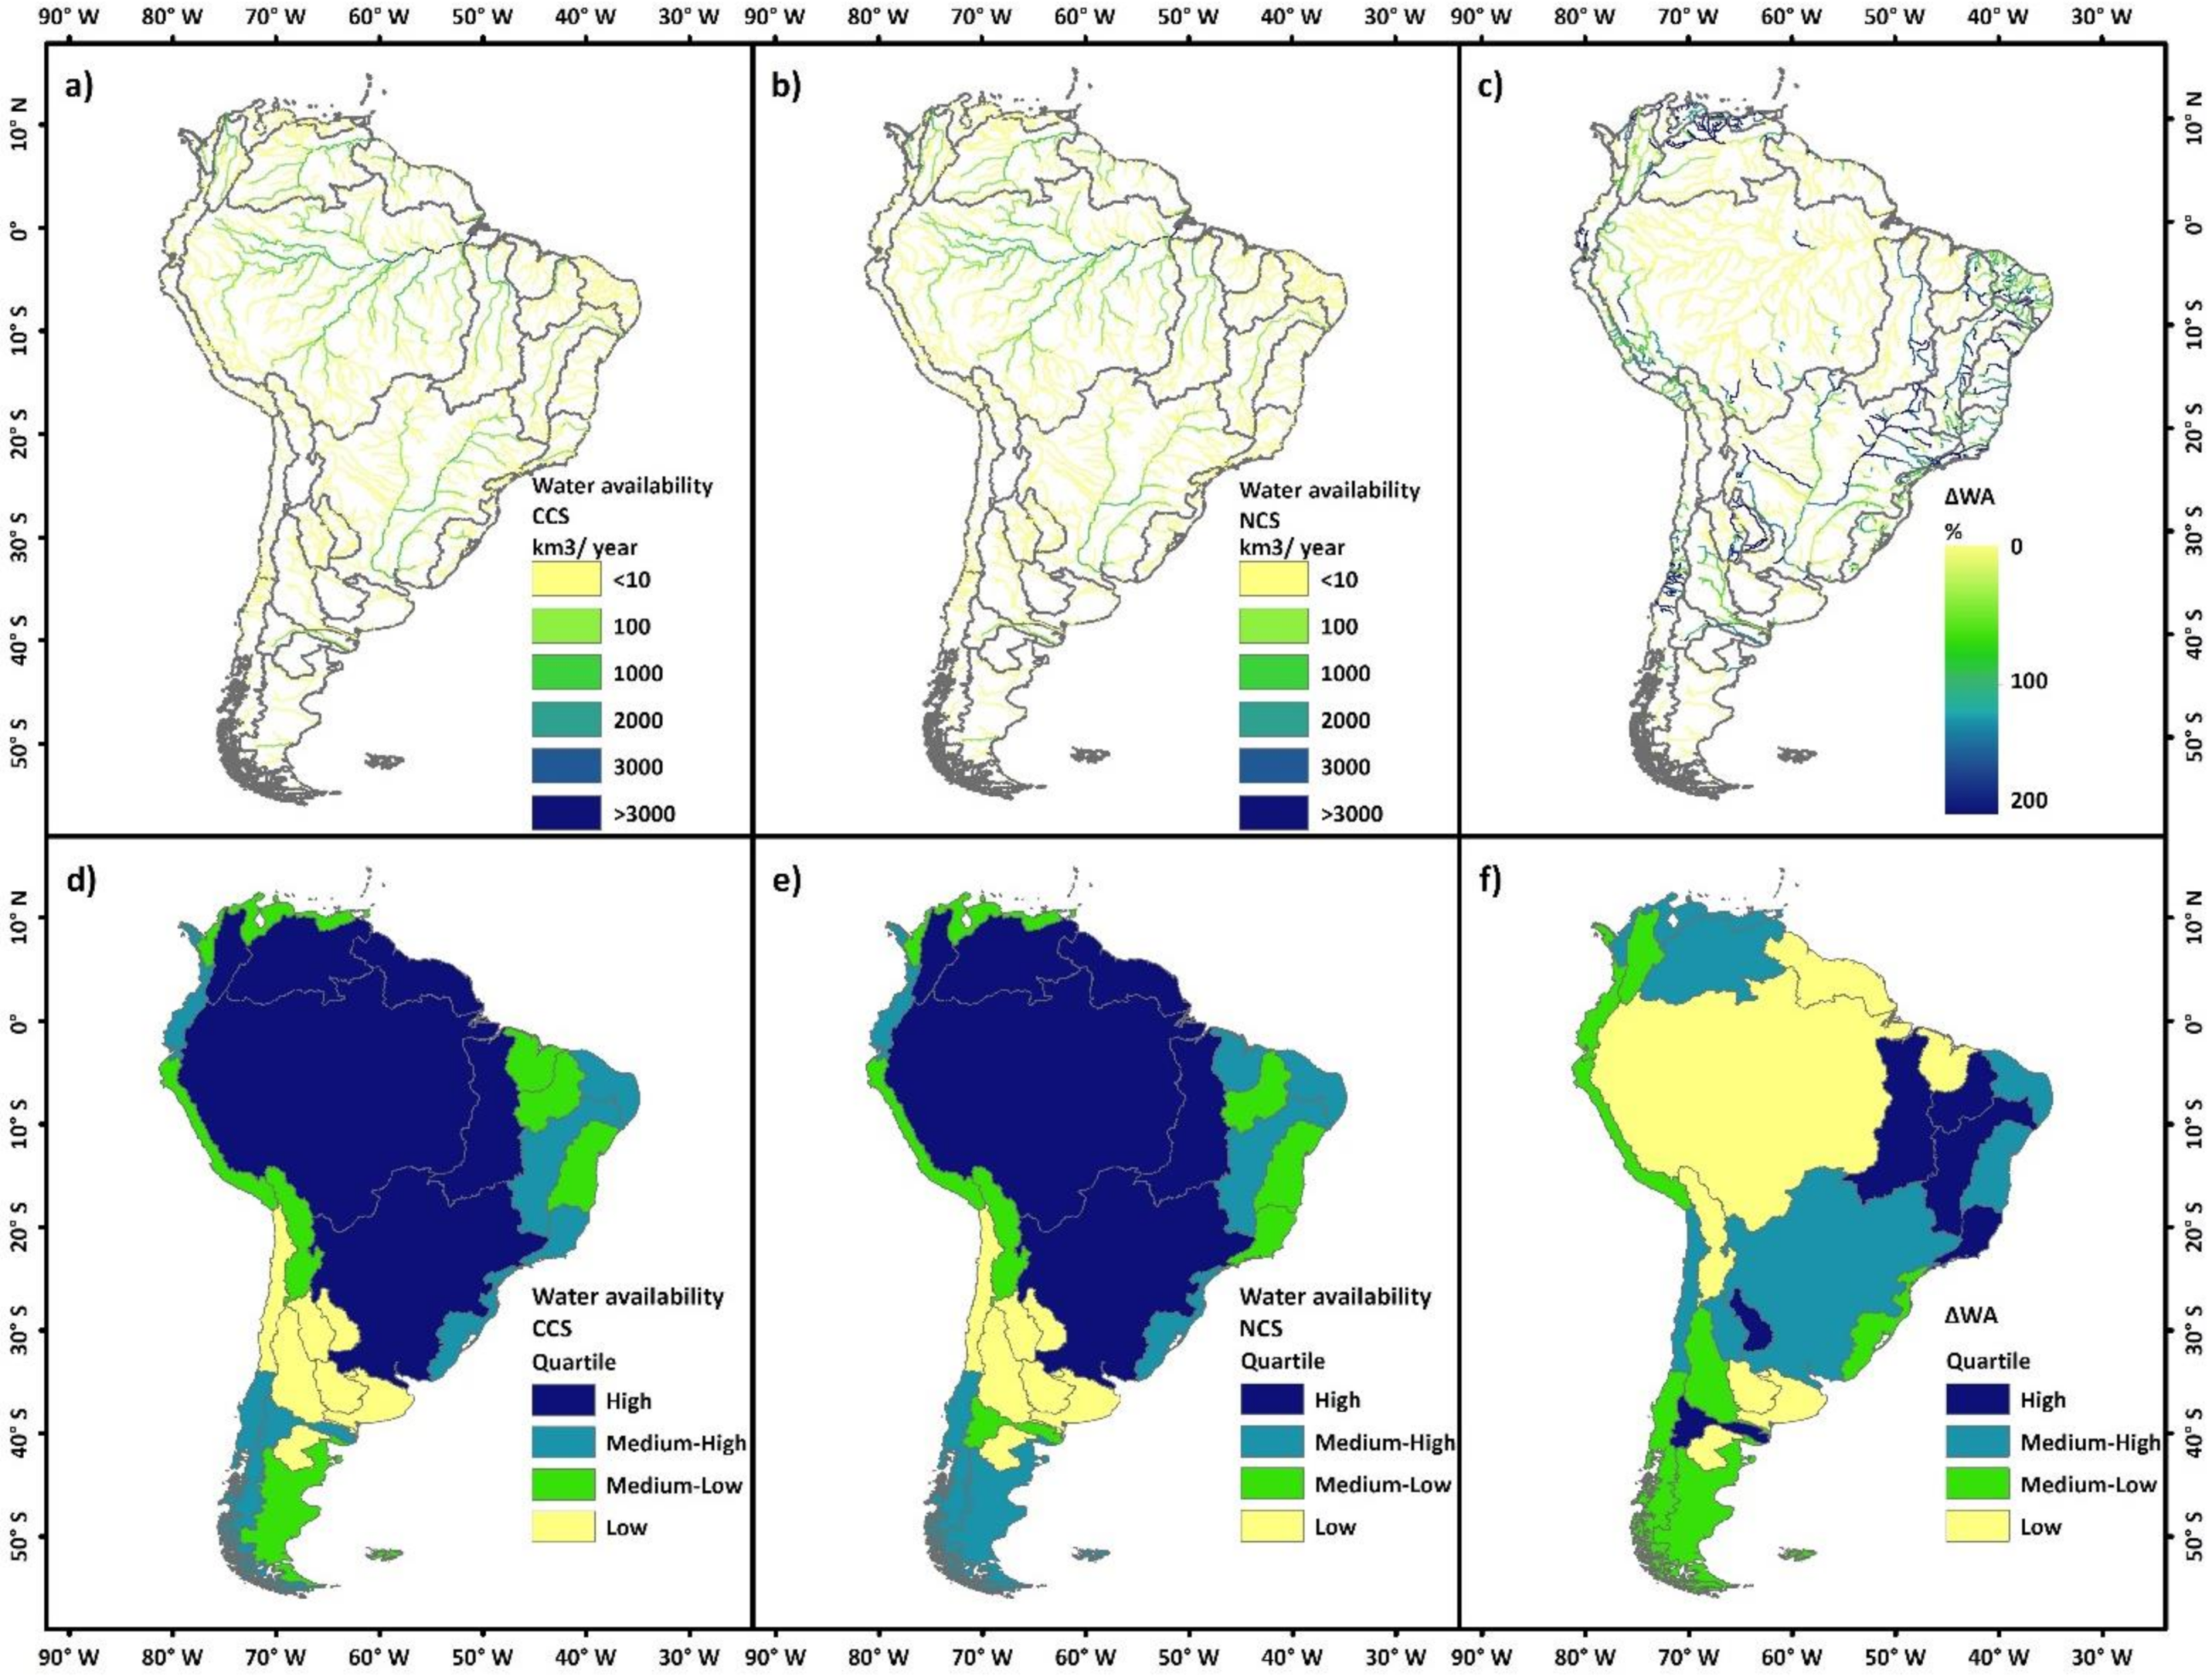
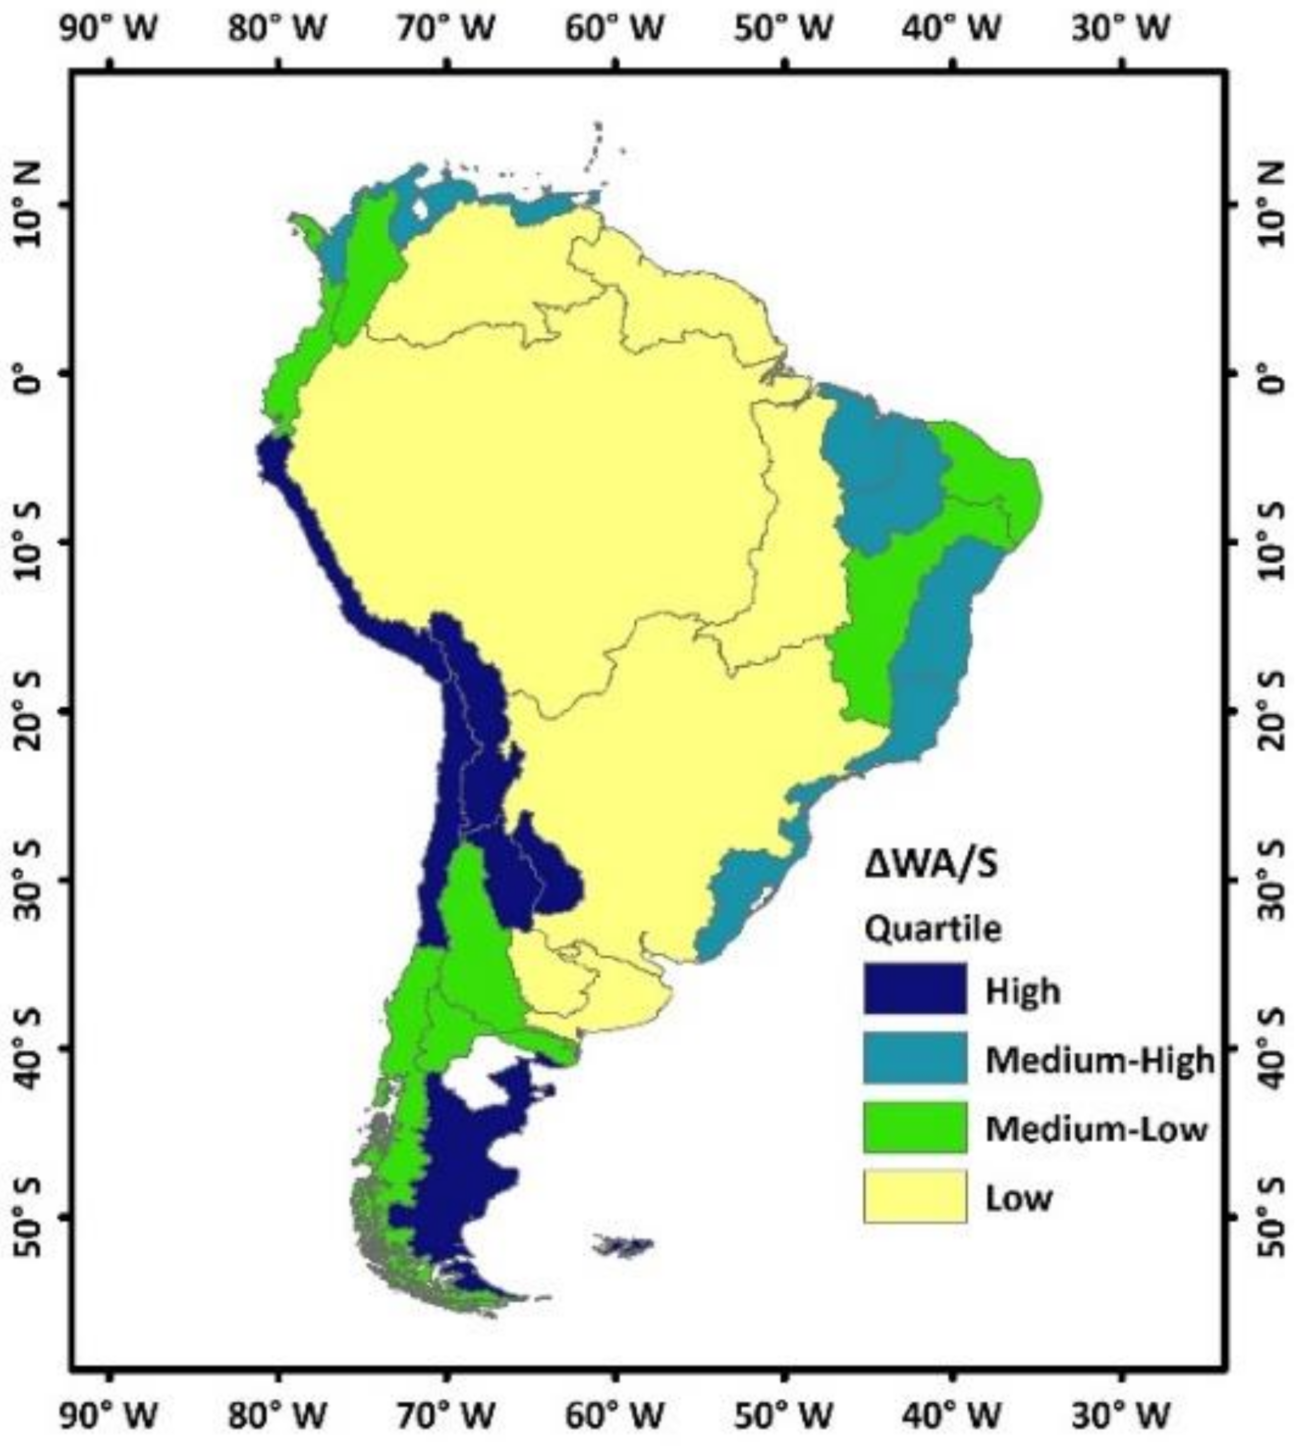
Table 1.
Main characteristics of the Hydrological Regions (HR) considered for this study.
| Code | Major Basin Name (FAO) | Countries | Area of the HR 103 km2 | Mean Annual Flow km3 × yr−1 | Storage Volume km3 | Runoff mm × yr−1 | Population 106 per | Dams |
|---|---|---|---|---|---|---|---|---|
| A—Col-Ecu | Colombia—Ecuador, Pacific Coast | Colombia, Ecuador | 127.37 | 143.47 | 7.73 | 1126.39 | 9.27 | 12 |
| B—Per | Peru, Pacific Coast | Perú | 161.2 | 19.62 | 2.72 | 121.73 | 6.2 | 31 |
| C—NChi | North Chile, Pacific Coast | Chile | 142.51 | 3.33 | 1.96 | 23.4 | 1.54 | 23 |
| D—SChi | South Chile, Pacific Coast | Chile | 235.29 | 206.76 | 15.6 | 878.76 | 10.19 | 27 |
| E—Magdalena | Magdalena | Colombia, | 313.86 | 320.31 | 15.17 | 1020.57 | 29.91 | 31 |
| F—CarCoast | Caribbean Coast | Colombia, Venezuela | 167.07 | 41.02 | 6.44 | 245.52 | 11.92 | 49 |
| G—Orinoco | Orinoco | Venezuela | 938.76 | 1051.81 | 159.27 | 1120.42 | 9.88 | 25 |
| H—NESA | Northeast South America, South Atlantic Coast | French Guiana, Guyana, Suriname, Venezuela | 467.31 | 511.83 | 28.58 | 1095.26 | 1 | 8 |
| I—Amazon | Amazon | Bolivia, Brazil, Colombia, Ecuador, Perú, Venezuela | 5912.92 | 6521.88 | 32.41 | 1102.99 | 26.04 | 56 |
| J—Tocantins | Tocantins | Brazil | 901.36 | 494.75 | 119.49 | 548.89 | 5.8 | 19 |
| K—NBra | North Brazil, South Atlantic Coast | Brazil | 213.57 | 82.44 | 0.04 | 386.03 | 3.05 | 1 |
| L—Parnaiba | Parnaiba | Brazil | 332.83 | 23.97 | 13.86 | 72.01 | 3.71 | 14 |
| M—NEBra | East Brazil, South Atlantic Coast | Brazil | 222.11 | 41.59 | 25.91 | 187.25 | 10.93 | 124 |
| N—SaoFrancisco | Sao Francisco | Brazil | 637.4 | 109.66 | 73.74 | 172.04 | 13.29 | 54 |
| O—EBra | East Brazil | Brazil | 288.39 | 43.05 | 16.95 | 149.3 | 6.54 | 28 |
| P—SEBra | Southeast Brazil | Brazil | 168.44 | 71.28 | 14.5 | 423.18 | 14.01 | 40 |
| Q—SBra | South Brazil | Brazil | 197.91 | 127.57 | 9.63 | 644.59 | 7.04 | 44 |
| R—LaPlata | La Plata | Argentina, Bolivia, Brazil, Paraguay, Uruguay | 2948.04 | 776.61 | 352.81 | 263.43 | 81.4 | 154 |
| S—NArg | North Argentina, South Atlantic Coast | Argentina | 136.39 | 20.3 | 0.33 | 148.83 | 1.23 | 1 |
| T—Colorado | South America, Colorado | Argentina | 294.59 | 6.18 | 22.04 | 20.98 | 2.4 | 13 |
| U—Negro | Negro | Argentina | 112.93 | 36.37 | 77.93 | 322.11 | 0.52 | 10 |
| V—SArg | South Argentina, South Atlantic Coast | Argentina | 199.59 | 31.22 | 1.86 | 156.4 | 0.24 | 1 |
| W—LaPuna | La Puna Region | Argentina, Bolivia, Chile, Perú | 212.38 | 37.3 | 0.64 | 175.64 | 2.15 | 10 |
| X—SalinasGrandes | Salinas Grandes | Argentina | 171.77 | 1.55 | 1.22 | 9.03 | 0.86 | 16 |
| Y—MarChiquita | Mar Chiquita | Argentina | 129.9 | 1.95 | 2.81 | 15 | 3.85 | 10 |
| Z—Pampas | Pampas Region | Argentina | 108.72 | 1.06 | 0.28 | 9.73 | 0.65 | 7 |
| AA—CPatagonia | Central Patagonia Highlands | Argentina | 36.37 | 2.83 | 0 | 77.7 | 0.01 | 0 |
Table 2.
Storage and water availability ratios for the hydrological regions of South America.
| Hydrological Region (HR) | Storage Ratios | WA km3 × yr−1 | Water Availability (WA) Ratios | ||||
|---|---|---|---|---|---|---|---|
| S/F yr | S/A 103 m3 × km−2 | S/P 103 m3 × per | WA/F | WA/A mm. | WA/P 103 m3 × per−1.yr−1 | ||
| A—Col-Ecu | 0.05 | 60.71 | 0.83 | 83.40 | 0.58 | 655 | 9.00 |
| B—Per | 0.14 | 16.88 | 0.44 | 12.90 | 0.66 | 80 | 2.08 |
| C—NChi | 0.59 | 13.73 | 1.27 | 2.08 | 0.62 | 15 | 1.35 |
| D—SChi | 0.08 | 66.31 | 1.53 | 96.58 | 0.47 | 410 | 9.48 |
| E—Magdalena | 0.05 | 48.34 | 0.51 | 218.04 | 0.68 | 695 | 7.29 |
| F—CarCoast | 0.16 | 38.53 | 0.54 | 12.87 | 0.31 | 77 | 1.08 |
| G—Orinoco | 0.15 | 169.66 | 16.12 | 829.55 | 0.79 | 884 | 83.98 |
| H—NESA | 0.06 | 61.16 | 28.64 | 250.28 | 0.49 | 536 | 250.80 |
| I—Amazon | 0.005 | 5.48 | 1.24 | 3455.69 | 0.53 | 584 | 132.73 |
| J—Tocantins | 0.24 | 132.56 | 20.59 | 310.89 | 0.63 | 345 | 53.56 |
| K—NBra | 0 | 0.18 | 0.01 | 18.76 | 0.23 | 88 | 6.14 |
| L—Parnaiba | 0.58 | 41.63 | 3.74 | 20.42 | 0.85 | 61 | 5.51 |
| M—NEBra | 0.62 | 116.66 | 2.37 | 30.17 | 0.73 | 136 | 2.76 |
| N—SaoFrancisco | 0.67 | 115.69 | 5.55 | 89.26 | 0.81 | 140 | 6.71 |
| O—EBra | 0.39 | 58.77 | 2.59 | 25.54 | 0.59 | 89 | 3.91 |
| P—SEBra | 0.2 | 86.07 | 1.04 | 42.21 | 0.59 | 251 | 3.01 |
| Q—SBra | 0.08 | 48.65 | 1.37 | 81.52 | 0.64 | 412 | 11.59 |
| R—LaPlata | 0.45 | 119.68 | 4.33 | 709.95 | 0.91 | 241 | 8.72 |
| S—NArg | 0.02 | 2.4 | 0.27 | 8.21 | 0.40 | 60 | 6.69 |
| T—Colorado | 3.57 | 74.83 | 9.19 | 6.50 | 1.05 | 22 | 2.71 |
| U—Negro | 2.14 | 690.1 | 150.23 | 36.56 | 1.01 | 324 | 70.48 |
| V—SArg | 0.06 | 9.29 | 7.6 | 25.77 | 0.83 | 129 | 105.57 |
| W—LaPuna | 0.02 | 3 | 0.3 | 19.23 | 0.52 | 91 | 8.94 |
| X—SalinasGrandes | 0.79 | 7.1 | 1.42 | 1.47 | 0.95 | 9 | 1.71 |
| Y—MarChiquita | 1.44 | 21.63 | 0.73 | 1.92 | 0.98 | 15 | 0.50 |
| Z—Pampas | 0.26 | 2.57 | 0.43 | 0.24 | 0.23 | 2 | 0.37 |
| AA—CPatagonia | 0 | 0 | 0 | 1.97 | 0.70 | 54 | 136.91 |
Table 3.
Water availability scenarios considered for this study.
| Hydrological Region (HR) | Water Availability (WA) | ΔWA | ΔWA/S | ||
|---|---|---|---|---|---|
| CCS (with Dams) km3 × yr−1 | NCS (without Dams) km3 × yr−1 | WAS (CCS-NCS) km3 × yr−1 | |||
| A—Col-Ecu | 83.40 | 65.22 | 18.18 | 0.28 | 0.036 |
| B—Per | 12.90 | 9.51 | 3.40 | 0.36 | 0.131 |
| C—NChi | 2.08 | 0.99 | 1.09 | 1.10 | 0.561 |
| D—SChi | 96.58 | 69.14 | 27.44 | 0.40 | 0.025 |
| E—Magdalena | 218.04 | 159.85 | 58.19 | 0.36 | 0.024 |
| F—CarCoast | 12.87 | 8.21 | 4.65 | 0.57 | 0.088 |
| G—Orinoco | 829.55 | 405.72 | 423.83 | 1.04 | 0.007 |
| H—NESA | 250.28 | 234.27 | 16.01 | 0.07 | 0.002 |
| I—Amazon | 3455.69 | 3293.25 | 162.44 | 0.05 | 0.002 |
| J—Tocantins | 310.89 | 124.55 | 186.33 | 1.50 | 0.013 |
| K—NBra | 18.76 | 18.70 | 0.06 | 0.00 | 0.081 |
| L—Parnaiba | 20.42 | 9.48 | 10.94 | 1.15 | 0.083 |
| M—NEBra | 30.17 | 17.84 | 12.33 | 0.69 | 0.027 |
| N—SaoFrancisco | 89.26 | 33.24 | 56.02 | 1.69 | 0.023 |
| O—EBra | 25.54 | 11.91 | 13.63 | 1.14 | 0.068 |
| P—SEBra | 42.21 | 17.04 | 25.17 | 1.48 | 0.102 |
| Q—SBra | 81.52 | 58.95 | 22.57 | 0.38 | 0.040 |
| R—LaPlata | 709.95 | 359.52 | 350.42 | 0.97 | 0.003 |
| S—NArg | 8.21 | 8.17 | 0.04 | 0.00 | 0.015 |
| T—Colorado | 6.50 | 4.21 | 2.28 | 0.54 | 0.025 |
| U—Negro | 36.56 | 14.94 | 21.62 | 1.45 | 0.019 |
| V—SArg | 25.77 | 20.98 | 4.79 | 0.23 | 0.123 |
| W—LaPuna | 19.23 | 17.79 | 1.44 | 0.08 | 0.127 |
| X—SalinasGrandes | 1.47 | 0.85 | 0.61 | 0.72 | 0.591 |
| Y—MarChiquita | 1.92 | 0.46 | 1.45 | 3.12 | 1.112 |
| Z—Pampas | 0.24 | 0.24 | 0.00 | 0.00 | 0.000 |
| AA—CPatagonia | 1.97 | 1.97 | - | - | - |
Table 4.
Estimates of water consumption in the hydrological regions of South America.
| HR | Population 106 per | Equipped Areas for Irrigation km2 | WA km3 × yr−1 | WC a km3 × yr−1 | WA/WC |
|---|---|---|---|---|---|
| A—Col-Ecu | 9.27 | 3414.89 | 83.40 | 3.79 | 22.0 |
| B—Per | 6.20 | 3683.78 | 12.90 | 3.55 | 3.6 |
| C—NChi | 1.54 | 1292.36 | 2.08 | 1.16 | 1.8 |
| D—SChi | 10.19 | 8237.91 | 96.58 | 7.42 | 13.0 |
| E—Magdalena | 29.91 | 5947.51 | 218.04 | 8.57 | 25.4 |
| F—CarCoast | 11.92 | 1840.84 | 12.87 | 3.03 | 4.2 |
| G—Orinoco | 9.88 | 3461.02 | 829.55 | 3.92 | 211.9 |
| H—NESA | 1.00 | 833.67 | 250.28 | 0.75 | 335.3 |
| I—Amazon | 26.04 | 5052.27 | 3455.69 | 7.37 | 468.9 |
| J—Tocantins | 5.80 | 1800.35 | 310.89 | 2.13 | 145.9 |
| K—NBra | 3.05 | 88.58 | 18.76 | 0.50 | 37.6 |
| L—Parnaiba | 3.71 | 267.23 | 20.42 | 0.72 | 28.3 |
| M—NEBra | 10.93 | 1672.81 | 30.17 | 2.77 | 10.9 |
| N—SaoFrancisco | 13.29 | 2490.71 | 89.26 | 3.70 | 24.1 |
| O—EBra | 6.54 | 1500.41 | 25.54 | 2.02 | 12.7 |
| P—SEBra | 14.01 | 2562.99 | 42.21 | 3.85 | 11.0 |
| Q—SBra | 7.04 | 5123.93 | 81.52 | 4.72 | 17.3 |
| R—LaPlata | 81.40 | 19,134.04 | 709.95 | 25.46 | 27.9 |
| S—NArg | 1.23 | 75.94 | 8.21 | 0.23 | 35.7 |
| T—Colorado | 2.40 | 3110.33 | 6.50 | 2.60 | 2.5 |
| U—Negro | 0.52 | 745.69 | 36.56 | 0.61 | 59.5 |
| V—SArg | 0.24 | 190.31 | 25.77 | 0.17 | 149.2 |
| W—LaPuna | 2.15 | 537.78 | 19.23 | 0.70 | 27.6 |
| X—SalinasGrandes | 0.86 | 997.99 | 1.47 | 0.85 | 1.7 |
| Y—MarChiquita | 3.85 | 1209.07 | 1.92 | 1.42 | 1.3 |
| Z—Pampas | 0.65 | 84.72 | 0.24 | 0.15 | 1.6 |
| AA—CPatagonia | 0.01 | 0.50 | 1.97 | 0.002 | 816.6 |
Note: HR = Hydrological region, WA = Potential Water Availability, WC = Estimated Water Consumption. a Information on water consumption was obtained from the World Bank database on water withdrawals [76].
Publisher’s Note: MDPI stays neutral with regard to jurisdictional claims in published maps and institutional affiliations. |
© 2021 by the authors. Licensee MDPI, Basel, Switzerland. This article is an open access article distributed under the terms and conditions of the Creative Commons Attribution (CC BY) license (https://creativecommons.org/licenses/by/4.0/).
Share and Cite
MDPI and ACS Style
Paredes-Beltran, B.; Sordo-Ward, A.; de-Lama, B.; Garrote, L. A Continental Assessment of Reservoir Storage and Water Availability in South America. Water 2021, 13, 1992. https://doi.org/10.3390/w13141992
AMA Style
Paredes-Beltran B, Sordo-Ward A, de-Lama B, Garrote L. A Continental Assessment of Reservoir Storage and Water Availability in South America. Water. 2021; 13(14):1992. https://doi.org/10.3390/w13141992
Chicago/Turabian StyleParedes-Beltran, Bolivar, Alvaro Sordo-Ward, B. de-Lama, and Luis Garrote. 2021. "A Continental Assessment of Reservoir Storage and Water Availability in South America" Water 13, no. 14: 1992. https://doi.org/10.3390/w13141992
Note that from the first issue of 2016, this journal uses article numbers instead of page numbers. See further details here.