Article

Performance of a Pilot-Scale Constructed Wetland and Medium-Term Effects of Treated Wastewater Irrigation of Arundo donax L. on Soil and Plant Parameters

1
Department of Agricultural, Food and Forest Sciences, Università degli Studi di Palermo, Viale delle Scienze 13, Building 4, 90128 Palermo, Italy
2
Department of Agricultural and Forest Sciences, Università degli Studi della Tuscia, 01100 Viterbo, Italy
3
Research Consortium for the Development of Innovative Agro-Environmental Systems (Corissia), Via della Libertà 203, 90143 Palermo, Italy
*
Author to whom correspondence should be addressed.
These authors are equally contributed.
Water 2021, 13(15), 1994; https://doi.org/10.3390/w13151994
Submission received: 25 June 2021 / Revised: 17 July 2021 / Accepted: 19 July 2021 / Published: 21 July 2021

Abstract

:
On marginal lands in the Mediterranean basin, giant reed (Arundo donax L.) represents one of the most interesting perennial crops due to high levels of biomass production. Considering periodic water shortage during the summer months in this area, the reuse of treated wastewater (TWW) would seem to be a good opportunity for the growth of the species. The aim of this study was to assess the medium-term effects of irrigation using freshwater (FW) and TWW on soil characteristics and growth in giant reed plants. TWW was obtained from a pilot-scale horizontal subsurface flow constructed wetland system (HSSF CWs) with a total surface area of 100 m2. A split-plot design for a two-factor experiment was used with three replications. Medium-term TWW irrigation increased organic matter and plant nutrients in the soil; however, pH was not affected. Plants irrigated with TWW showed greater growth (+10.49% in height, +12.75% in stem diameter, +11.51% in above-ground biomass) than those irrigated with FW. The higher heating value of crop residues ranged between 16.83 (FW-irrigated plants) and 17.00 MJ kg−1 (TWW-irrigated plants). Results show that HSSF CWs produces TWW, which can be an alternative source of water for growing giant reed with high biomass performance.

1. Introduction

In recent years, non-food energy crops for biomass production have gained high interest around the world mainly due to agronomic, economic, and environmental reasons. These crops can help the agricultural sector to prevent the occurrence of marginal lands, reduce soil degradation, and solve the problem of surplus food crops [1,2]. They represent an element of increasing income for farmers, as biomass feedstocks can be used to create various types of energy to consume directly on-farm or sell to third parties [3]. Furthermore, the utilization of crop residues for energy purposes in agricultural and forestry areas can create new, sustainable developments [4]. At the same time, the environmental impact of biomass is low since the balance of carbon dioxide (CO2) from non-food energy crops is estimated to be zero. This is because the quantity of carbon (C) released by combusting biomass is equal to an equivalent amount sequestered by the photosynthesis process [5,6]. This provides significant benefits to the environment by reducing greenhouse gas emissions from agricultural lands and contributes to decreasing the Earth’s dependence on fossil fuels as required by the objectives of the European Union and international agreements on climate change [7,8].
On marginal lands and cultivated fields in the Mediterranean, non-food perennial energy species, such as giant reed (Arundo donax L.), giant miscanthus (Miscanthus x giganteus Greef et Deu.), kans grass (Saccharum spontaneum L.), switchgrass (Panicum virgatum L.), and cardoon (Cynara cardunculus L.), have been investigated in recent times. Poor adaptation results were found when using low-input cultivation practices in contrast to high production levels when agricultural inputs were maximized [2,9,10,11,12,13,14,15,16,17]. Thus, cultivation practices with high inputs, such as fertilization and irrigation, are required to achieve significant production levels in perennial species, as sustained by many authors [12,16,17,18].
A number of studies have recognized giant reed as one of the most promising biomass crops due to good adaptation capacity to different climate and soil conditions and high biomass production levels under different cultivation inputs [10,11,12,13,17,18,19,20]. This species is a C3 carbon-fixation plant naturalised in the Mediterranean environment [8,11], and it is characterized by high photosynthetic activity and CO2 assimilation rates similar to those of C4 carbon-fixation plants [21]. Studies carried out in the Mediterranean region have confirmed that giant reed requires good nutrient and water availability to achieve high biomass production levels both in the medium- and long-term periods [2,8,12,17,22,23]. Irrigation seems to be fundamental for the cultivation of this species. However, in environments characterised by prolonged water shortage in the summer, water can be a limited resource, and often the use of deficit irrigation rather than full irrigation can represent an on-farm strategy to maximize the use of water for many open-field crops. Despite the fact that giant reed can survive under dry conditions for long periods due to characteristics of the root system [9,22], it is not possible to consider high biomass levels without full irrigation.
In this scenario, the reuse of treated wastewater (TWW) for irrigation purposes could be useful for various reasons. It would contribute to a reduction in cultivation costs, in freshwater (FW) demand, the consumption of drinking water, and in the discharge of wastewater (WW) into soils and water bodies [8,24,25,26]. As reported in several studies [3,8,27,28,29,30], TWW is a source of mineral and organic nutrients, and its application leads to good soil fertility and productivity levels in the long-term. This increases crop yields with farmers subsequently benefiting financially from a reduction in the use of chemical fertilisers [3,25,26,30,31]. However, despite the many benefits to crop production, the use of TWW for irrigation may significantly affect the chemical characteristics of the soil in the medium- and long-term. In arid and semi-arid regions, for example, continuous use of TWW can determine an increase in the levels of organic and mineral nutrients in the surface soil layer with negative impacts on the productivity of the soil-plant system [27,32]. It has been found that increases in exchangeable sodium in the exchange complex at the expense of exchangeable calcium (Ca), magnesium (Mg), and potassium (K) cause salinity and sodicity in soils [33]. TWW can change soil pH levels depending on the period of application and chemical characteristics of the soil [27]. Furthermore, TWW can also contain low levels of trace elements, such as heavy metals, which can accumulate in soil layers, causing severe soil pollution [27,29]. Finally, TWW can be a source of pathogens that can determine negative health impacts. As a consequence, efficient treatment of wastewater together with the assurance of adequate management of TWW irrigation would safeguard the environment and, at the same time, provide benefits to the agricultural sector.
For farmers, the successful reuse of TWW mainly depends on the cost of the wastewater treatment and pollutant removal efficiency (RE) of the treatment plant. Constructed wetlands (CW) represent an example of a nature-based solution and viable alternative to conventional treatment systems and can combine low costs of wastewater treatment with high efficiency [30,34,35]. As shown in literature, constructed wetlands (CWs) play a fundamental role in the treatment and reuse of wastewater for irrigation purposes and are highly recommended by national and international organizations concerning the sustainable treatment of wastewater.
Literature regarding the impact of TWW irrigation in the short- and long-term on plant and soil characteristics is extensive. Most studies on perennial biomass crops tend to focus on how TWW affects yield components, awarding limited importance to energy-related aspects. A novelty of this paper is, thus, the assessment of the effect of TWW irrigation on some physical and energy characteristics of giant reed crop residues and pellets obtained from using shredded residues.
The specific aims of this study were: (i) to evaluate the performance of a pilot-scale horizontal subsurface flow system (HSSFs) CW in removing pollutants from urban wastewater (WW); (ii) to assess the effects of TWW irrigation on the chemical-soil characteristics compared to FW irrigation; to assess the effects of TWW irrigation on morphological and production characteristics of giant reed compared to FW irrigation; and (iii) to assess the effects of TWW irrigation on physical and energy characteristics of crop residues of giant reed and pellets compared to FW irrigation.

2. Materials and Methods

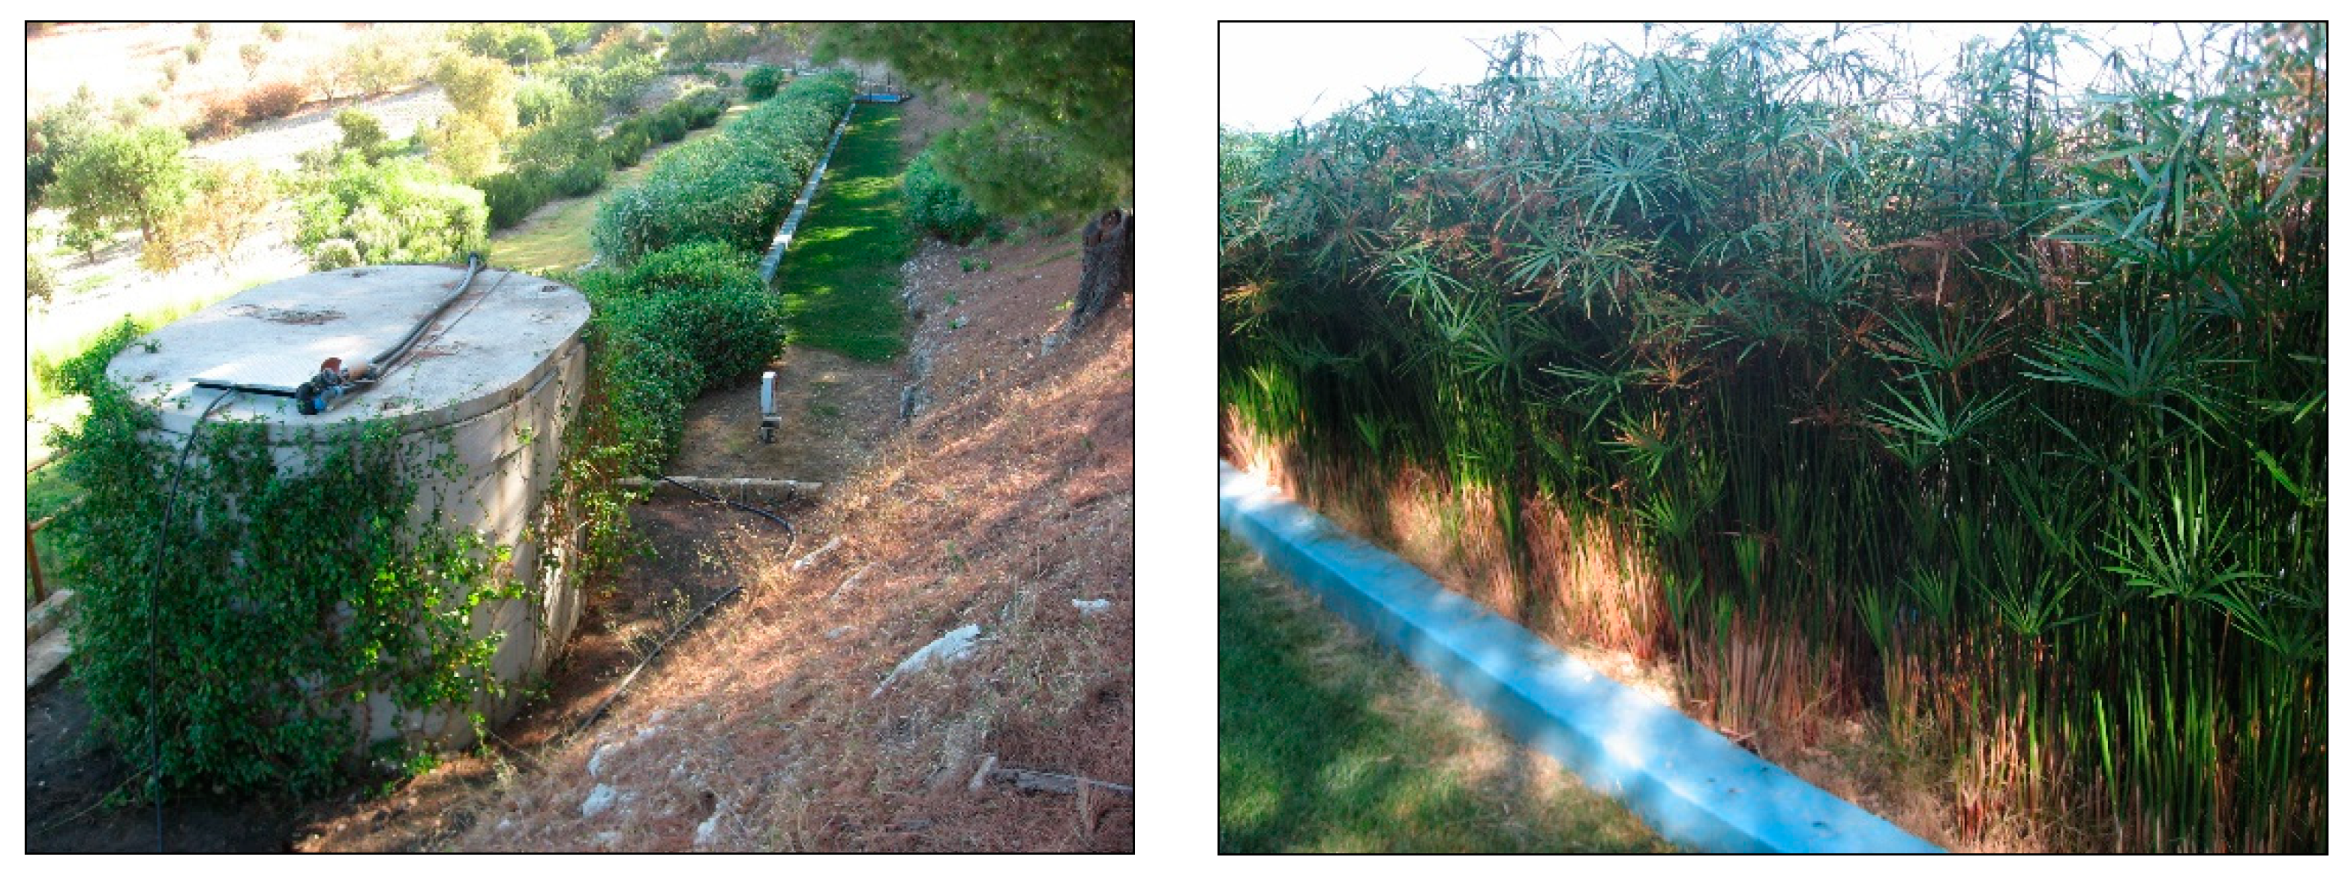
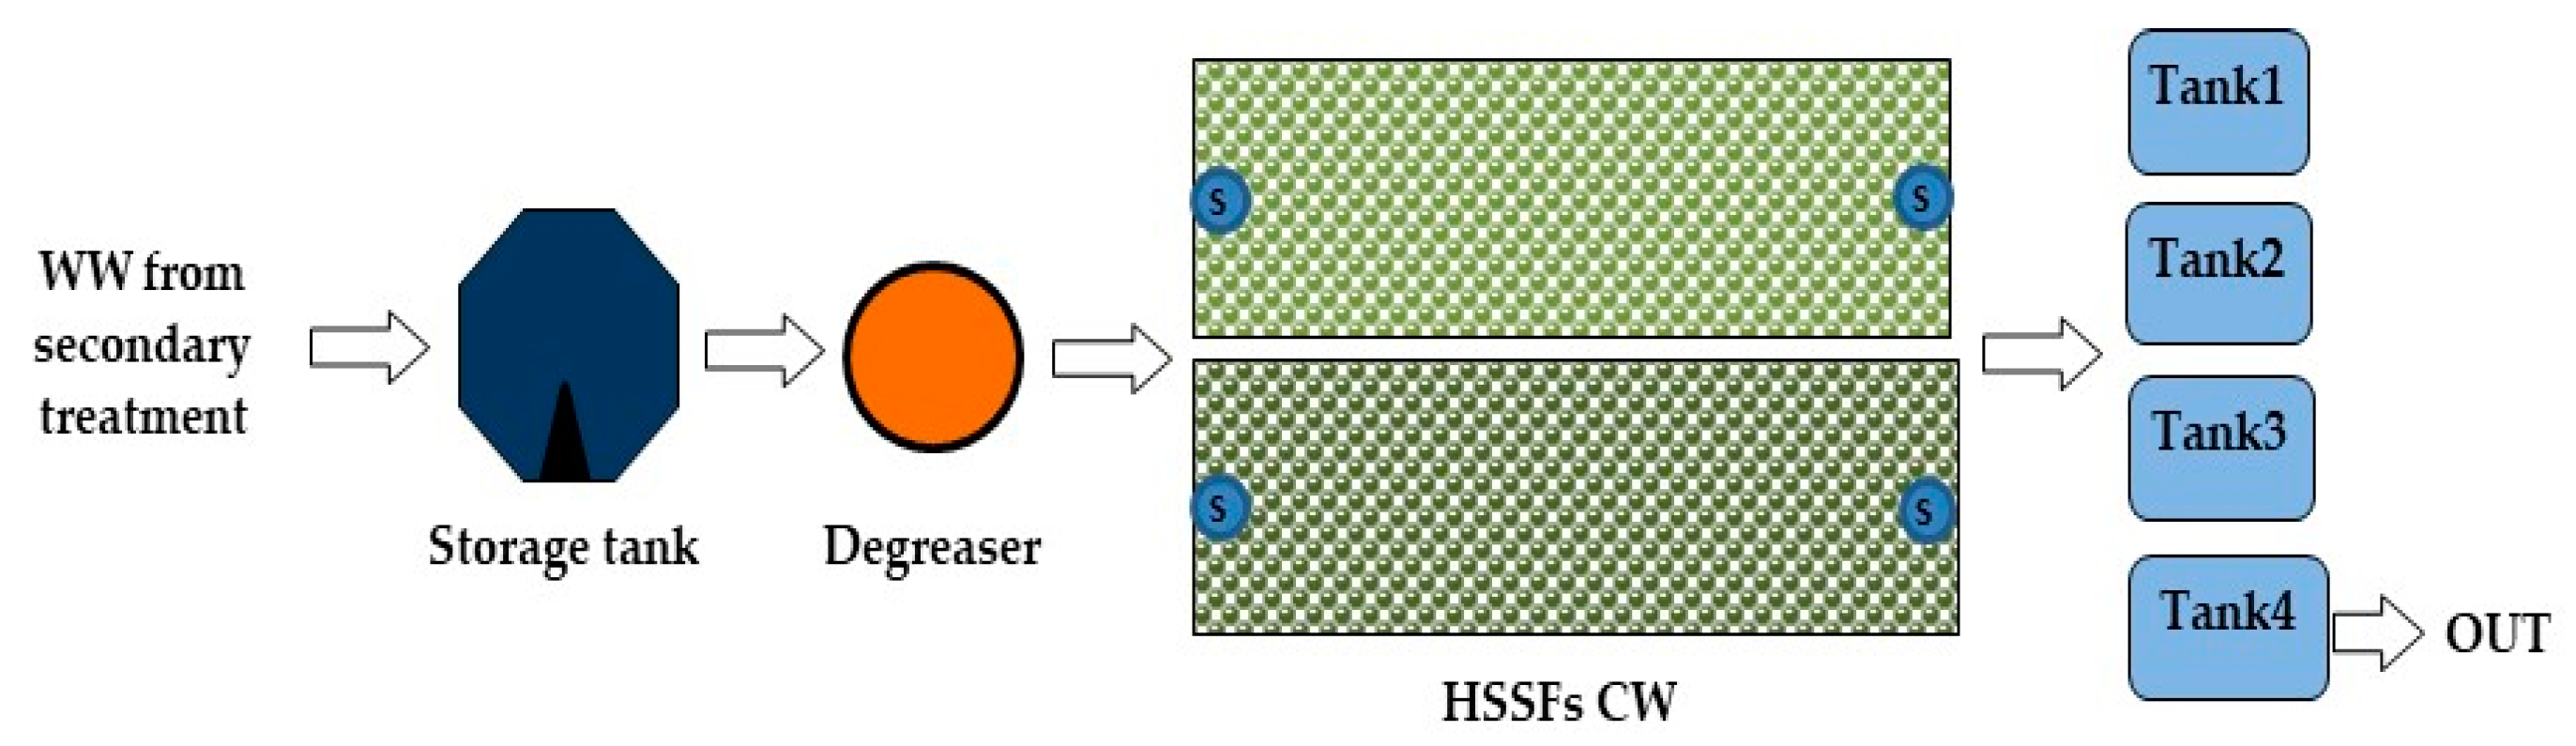
2.1. Test Site and HSSFs CW

The study was carried out over the five years, from 2014–2018, in the experimental area surrounding and including the pilot HSSFs CW in Raffadali, located in western Sicily (Italy—37°24′ N–1°05′ E, 446 m a.s.l.). The CW system (Figure 1) was used to treat urban WW produced by a municipal treatment plant.
The CW had a total area of 100 m2 and included two separated units (Figure 2). The floor and walls of the units were made of concrete and lined with sheets of high-density polyethylene geomembrane, which were covered with a layer of nonwoven fabric. Each unit was filled to a depth of 0.50 m with 30 mm silica quartz river gravel (0.30–0.40 porosity). The slope was 2%, necessary to obtain regular flow. The two beds worked in parallel and were separately planted with giant reed (Arundo donax L.) and umbrella sedge (Cyperus alternifolius L.), described as well in a previous study [36].
The HSSFs CW was fed with pre-treated urban WW from the sewage treatment system that carried out primary and secondary treatment. WW was fed initially into a 15 m3 waterproofed, vibrated cement storage tank. The tank was equipped with a litre gauge and an outlet valve for the periodic cleaning of solid sediments. It was also equipped with a submerged electric pump and timer in order to regulate times and duration of WW flow into the two units. WW was fed into a static degreaser to separate fats and pumped through a perforated polyvinylchloride pipe into the two HSSFs CW units. Homogeneous distribution of WW within each unit was ensured through a timer-controlled pumping system. In each unit, the pipe was placed 10.00 cm from the surface of the substrate. TWW was collected using a perforated drainage pipe system placed at the bottom of the filter bed and then conducted downhill into a system of four interconnected tanks of 5.00 m3 each. The last of these tanks was used to supply water for irrigation purpose.
The two units were tested using a hydraulic loading rate (HLR) of 6.00 cm day−1 and hydraulic retention time (HRT) of 8.30 days.

2.2. Urban Wastewater Analysis

WW samples were taken monthly at the inlet and outlet pipes from March to October of each year. Sampling events amounted to a total of 160 times (80 per planted-unit). A total of 1.00 litre (L) of WW was collected at each sampling point, and this operation was always carried out approximately at the same time for each event. The influent sample was taken close to the pipe, while the effluent sample was collected at the mouth of the outflow pipe. The influent and effluent samples were instantaneous samples. Samples were collected using high polyethylene density (HDPE) bottles. The pH value, electrical conductivity of water (ECW), temperature (T), and dissolved oxygen (DO) levels were determined directly on site using a portable universal meter (Multiline WTW P4). Total suspended solids (TSS), biochemical oxygen demand (BOD5), chemical oxygen demand (COD), total nitrogen (TN), ammonia nitrogen (NH4-N), and total phosphorus (TP) levels were determined according to Italian water analytical methods [37]. Total coliforms (TC), faecal coliforms (FC), faecal streptococci (FS), Escherichia coli (E. coli), and Salmonella spp. levels were determined according to standard methods for water testing [38].
For each planted unit, pollutant RE was based on pollutant concentration and calculated in accordance with International Water Association [39]:
RE   ( C i   C 0 ) C i
where Ci and C0 are the mean concentration of the pollutant in the influent and effluent.
TWW was then applied for irrigation of giant reed plants in an experimental field close to the HSSFs CW.

2.3. Giant Reed Experimental Field

A giant reed one-year-old ecotype was used for the tests. This ecotype had been previously harvested from a natural wetland close to the pilot HSSFs CW. Planting was carried out in March 2013 using rhizomes. The rhizomes were planted at a depth of 0.10–0.20 m (4 plants m−2) in plots of 9 m2, which were spaced 100 cm apart.
In the experimental field, the soil was clay loam (40% sand, 21% silt, and 39% clay) and was classified as brown soil and regosols (World Reference Base for Soil Resources). In particular, the soil had a pH value of 7.6, a cation exchange capacity of 33.80 meq 100 g−1, a total CaCO3 of 1.30 g kg−1, a total N of 1.20 g kg−1, and a K content of 530 ppm ± 1 on average.
A split-plot design for a two-factor experiment was adopted with three replications. The main plot factor was year (Y), with five treatment levels: Y1 (2014), Y2 (2015), Y3 (2016), Y4 (2017), and Y5 (2018). The sub-plot factor was irrigation water (IW), with three treatment levels: IW1 (FW); IW2 (TWW from giant reed-planted unit); and IW3 (TWW from umbrella sedge-planted unit).
The experimental field was equipped with three drip irrigation systems, one for each source of irrigation water used in the study. Self-compensating drippers were used for the test. The drippers were periodically maintained and cleaned, and no cloggings by biosolids or undecomposed vegetation were observed during the test period. Furthermore, the use of self-compensating drippers guaranteed a constant flow rate and the distribution of a precise amount of water throughout each plot. Irrigation events were scheduled during intense plant growth in the summer months (June–September) both with FW and TWW. Irrigation water quantities fully replaced maximum crop evapotranspiration (ETc), which was calculated [40] using the equation:
ETc = ET0 × Kc
where ET0 is the reference evapotranspiration, and Kc is the crop coefficient.
The irrigation volume was calculated in accordance with the following equation:
V = 10000 × ( FC WP ) × ϕ × H
where 10,000 is the area of 1 hectare, FC is the soil water content at field capacity, WP is the soil water content at wilting point, ϕ is the bulk density of soil, and H is the height of the soil layer to wet, equivalent to rooting depth of giant reed.
In 2013, plots received 120 kg N ha−1, 130 kg P2O5 ha−1, and 100 kg K2O ha−1. Nitrogen fertiliser was applied as 50% at pre-plant and 50% when plants were 0.40–0.50 m tall. In 2014–2018, phosphorus fertiliser was applied in winter (January–February), while N (80 kg ha−1) was partly applied in spring and partly at the beginning of stem elongation. In particular, an increase in N and P2O5 occurred in the TWW-irrigated plots due to their content.
Weed control was performed by manual hoeing once a year (March). No crop diseases were observed during the test period. The above-ground parts were manually harvested in December when dormancy stage started, and vegetation was cut back to a height of 0.10–0.15 m above soil surface.

2.4. Plant Measurements

For each treatment, the main morphological and production parameters were determined to assess plant growth and biomass yield.
Plant height and stem diameter were measured monthly by sampling plants in random areas of 2 m2. At harvest, plants were weighed to determine the fresh weight of above-ground parts (leaves and stems). Dry weight was subsequently calculated by drying the collected plant material in an oven at 60 °C for 72 h.

2.5. Energy Analysis of Crop Residues

To evaluate physical and energetic characteristics of crop residues, 10 samples were prepared after harvesting for each treatment.
The moisture content of the ash was determined in accordance with Italian standards [41]. The higher heating value (HHV) was measured using homogenized, moisture-free samples placed in a Berthelot–Mahler bomb calorimeter, according to Italian standards [42]. The ash content was determined based on Italian standards [43]. Dry and homogeneous 500 mg samples were placed in a porcelain crucible (previously weighed and oven-dried at 105 °C) and then placed in a muffle furnace at 500 °C for 2 h, with a temperature gradient of 4 °C min−1. The samples were left to cool in the drier before weighing.
The crop residues were subsequently tested for pellet-making, in accordance with Italian standards [44]. Pellets were obtained using shredded residues, which were fed directly into a pellet machine through a rotating die-hole press. The pellets were then cut into 5-cm lengths. The bulk density and mechanical durability of the pellets were then determined. Bulk density allows us to assess the compatibility of the biomass with combustion, transport, and storage systems. The mechanical durability (DU) is the difference in pellet weight before and after a cycle of stress which, for example, simulates transport conditions. A Lignotester New Holmen Tester TekPro was used to determine this parameter, which was calculated by the equation:
DU = MA ME × 100
where MA is the pellet weight after treatment, and ME is the pellet weight before treatment.

2.6. Soil Sampling and Analysis

Before planting, three sampling spots per plot were randomly combined for the plot sample and analysed. Three soil samples were taken at a depth of 0–30 cm from each plot. Undisturbed soil samples were collected using hand augers from a vertical boring, mixed, placed in clean polyethylene bags, and labelled. The same procedure was carried out after each irrigation period. Soil samples were air dried, ground, and sieved to pass through a 2-mm sieve screen and analysed for chemical and physical characteristics.
The following chemical parameters were measured: pH and electrical conductivity (EC) (in the ratio of 1:2 dry soil:water extract), total organic carbon (TOC) of soil [45], total Kjeldahl nitrogen (TKN) [46], assimilable phosphorus (P) [47], assimilable potassium (K), and total calcium carbonate (CaCO3) [48]. K, magnesium (Mg), and sodium (Na) contents were determined by atomic absorption spectrophotometer. All the analyses were carried out at the Corissia Research Center in Palermo (Italy).

2.7. Weather Data

A weather station belonging to a centralized agrometeorological information service [49] was used to collect meteorological data. It was situated close to the pilot HSSFs CW.
The station was equipped with a MTX datalogger (model WST1800, Padova, Italy) and various sensors: wind speed sensor MTX (model Robinson cup VDI with an optoelectronic transducer), global radiation sensor (model Philipp Schenk—8102 thermopile pyranometer), temperature sensor MTX (model TAM platinum PT100 thermoresistance with anti-radiation screen), relative humidity sensor—MTX (model UAM with capacitive transducer with hygroscopic polymer films and antiradiation screen), rainfall sensor MTX (model PPR with a tipping bucket rain gauge), and leaf-wetness sensor MTX (model BFO with PCB). In particular, some sensors provided data on daily minimum and maximum air temperatures and total 10-day rainfall and allowed us to calculate the ET0 by the Penman–Monteith equation.

2.8. Statistical Analysis

Statistical analyses were performed using the package MINITAB 17 for Windows. A paired t-test was used to compare the mean levels of each chemical and microbiological parameter at the inlet and outlet. A level of p < 0.01 was used for all comparisons. For WW composition, all the representative values were shown using mean ± standard deviation calculations. For plant and soil parameters, analysis of variance (two-way ANOVA) was carried out, and the difference between means was investigated out using the Tukey test.

3. Results and Discussion

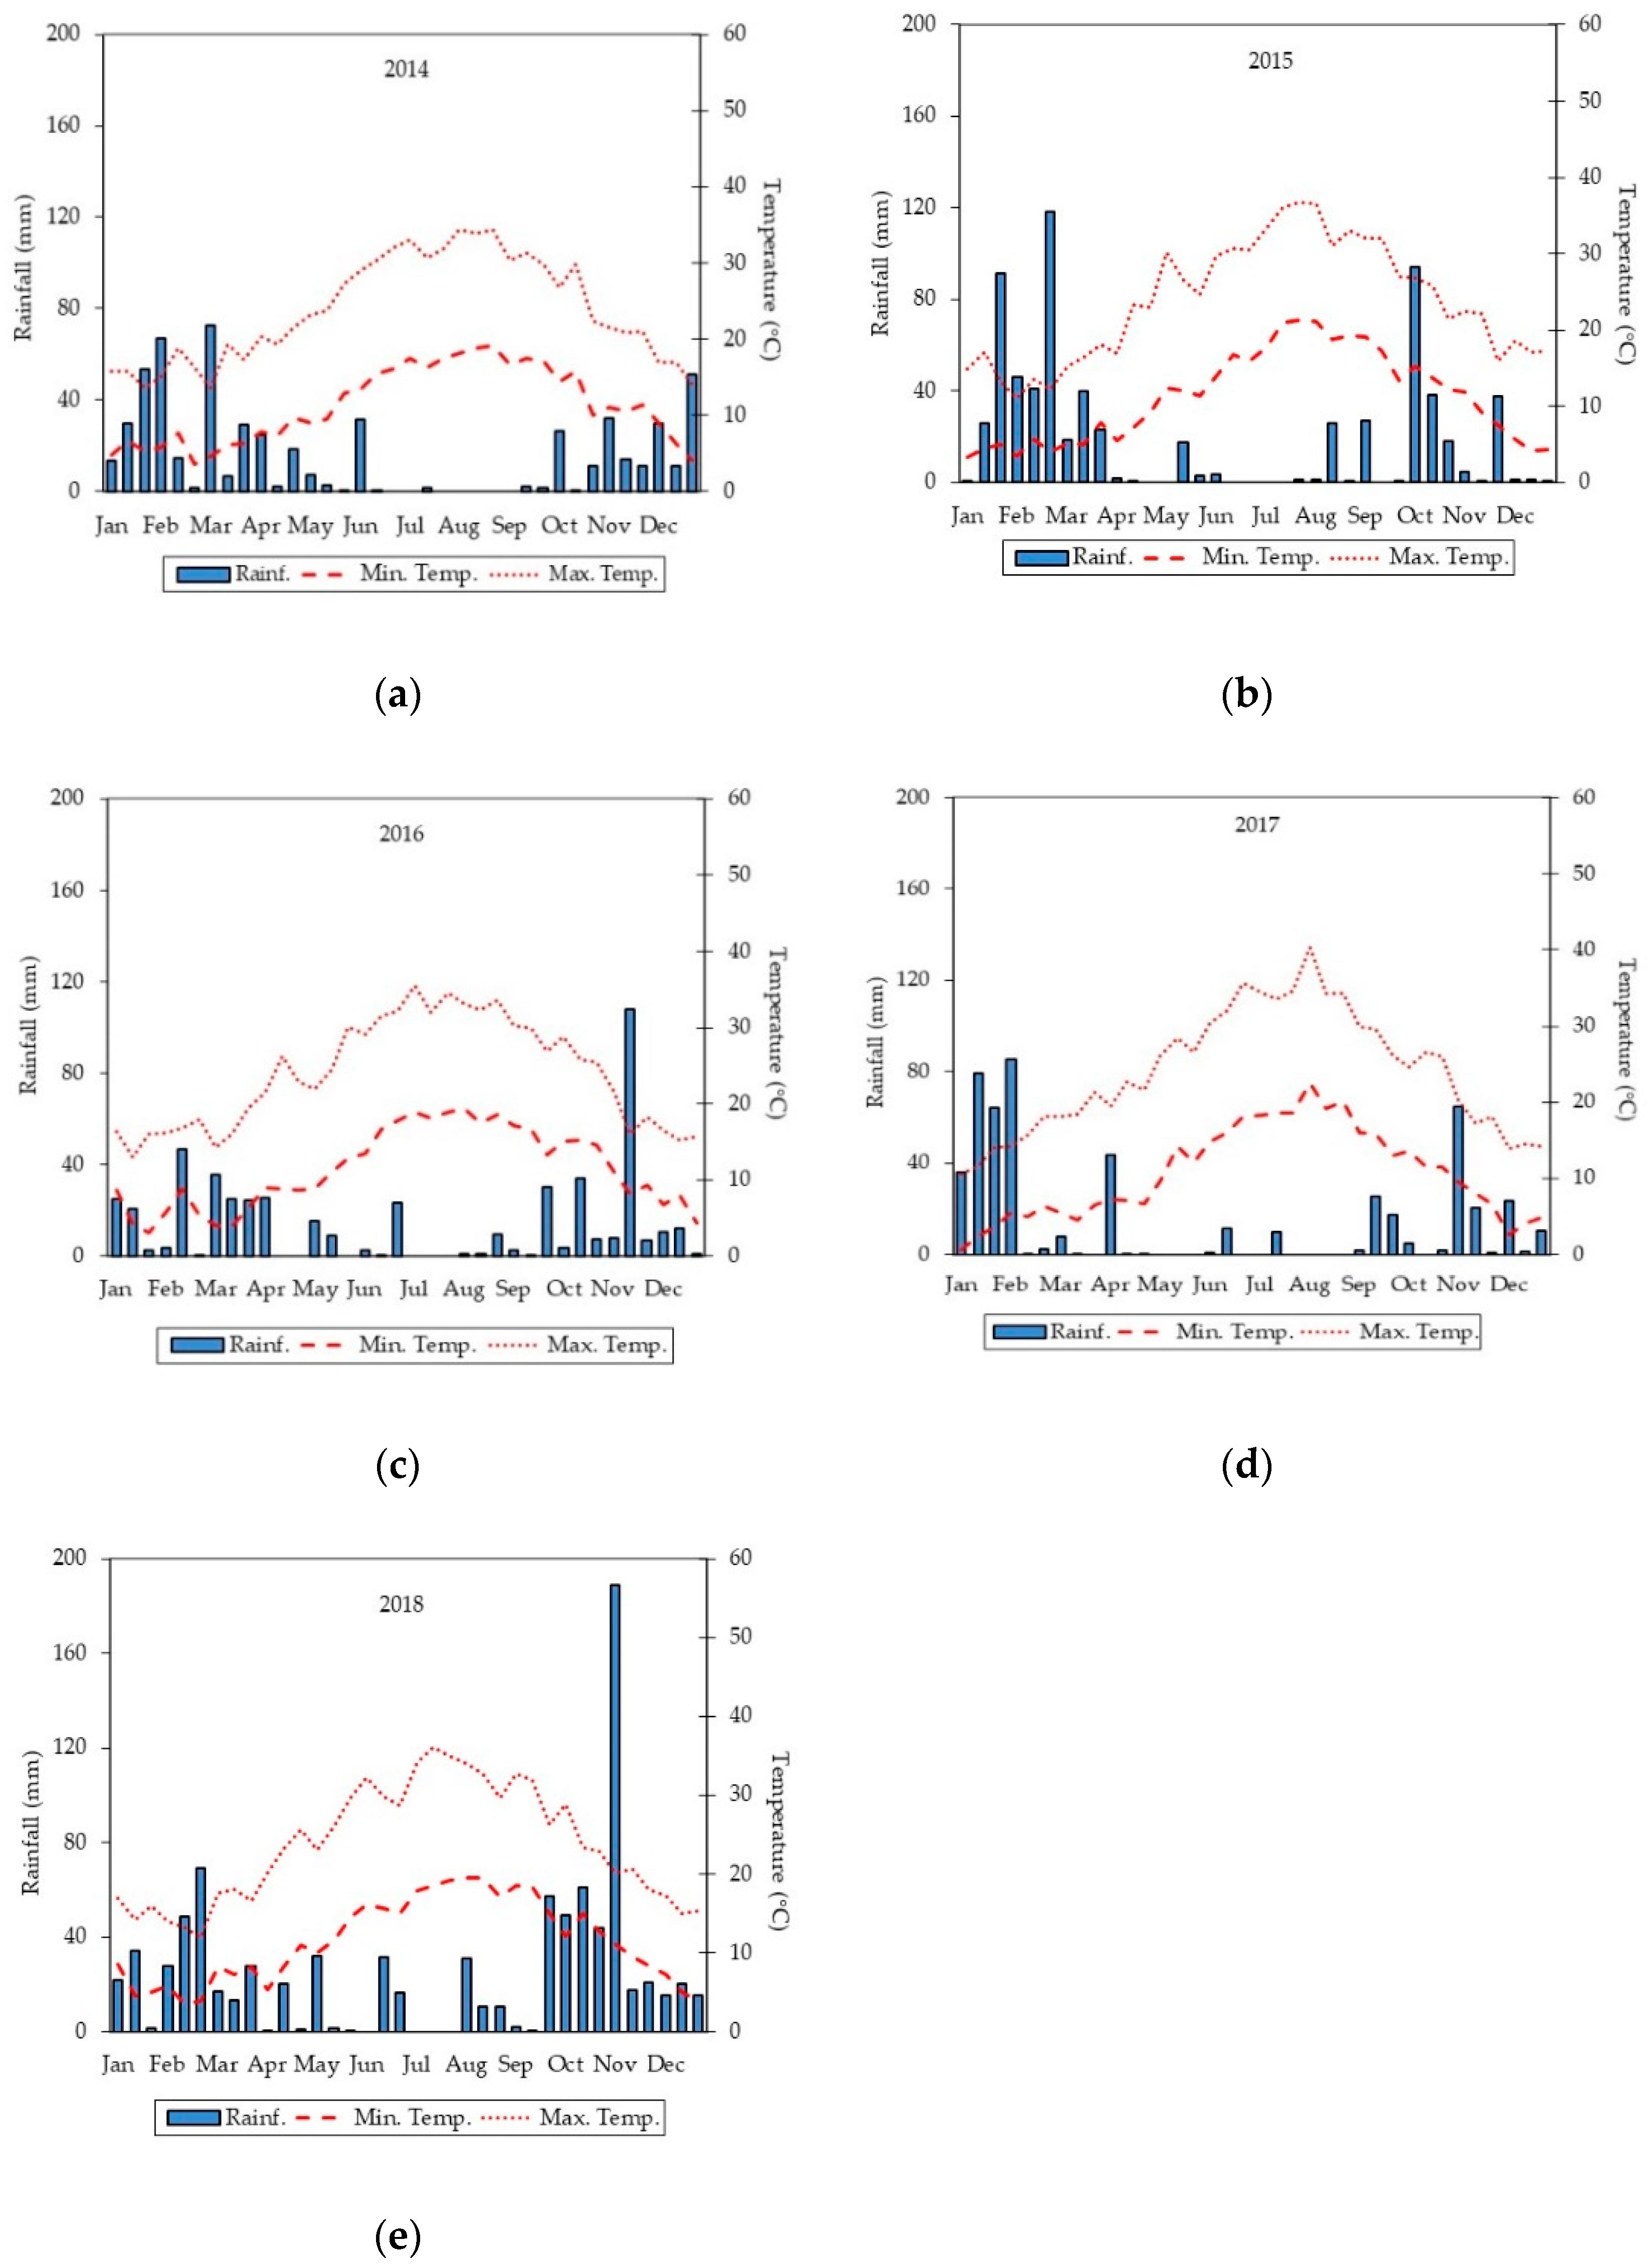
3.1. Rainfall and Air Temperature Trends in the Experimental Area

Figure 3 shows the trends of average maximum and minimum air temperature and total rainfall during the 2014–2018.

3.1.1. Air Temperature

The average maximum air temperature was 23.67 °C, while the average minimum air temperature was 11.13 °C. In each year, maximum and minimum air temperatures increased from March to August and decreased up to the end of December. The highest maximum air temperature values were recorded in July and August, while the lowest values were recorded in January and February.

3.1.2. Rainfall

Total rainfall ranged from 494.60 mm (2016) to 904.91 mm (2018). The average rainfall during the five-year period was 632.86 mm. The highest rainfall levels occurred during the autumn and winter months. In summer, the highest values total rainfall (101.60 mm) was recorded in 2018, while the lowest (4.20 mm) in 2014. The average five-year rainfall level in summer was 49.48 mm.
In particular, observing the growth season of giant reed plants (from March to October), average air temperatures, and rainfall levels were slightly different from one year to the next. This generated different ETc values (data not shown). Consequently, the applied irrigation volumes were different over the five years.

3.2. HSSFs CW Performance

The specific aim of this experiment was to evaluate the performance of a pilot-scale HSSFs CW in removing chemical and microbiological pollutants from urban WW over a five-year period. In this experiment, periodic analyses of WW at inlet and outlet of the two planted CW units were carried out in accordance with Italian and international procedures. The pollutant RE of the HSSFs CW was calculated monthly and based on pollutant concentration. Finally, the chemical and microbiological characteristics of TWW obtained from HSSFs CW were compared with threshold values for Italian Decree 152/2006 concerning the TWW reuse in irrigation.
Table 1 and Table 2 summarise the chemical characteristics of WW at the inlet and outlet during 2014–2018 and the corresponding RE values of the HSSFs CW.

3.2.1. pH

In both CW units, the influent values of pH were found to be alkaline and were significantly higher than effluent values. At outflow, average pH values ranged from 6.12 to 7.81 during the study period.

3.2.2. Electrical Conductivity

Influent values of EC were significantly lower than effluent values. This was due to the evapotranspiration process, which was different in the two CW planted-units and depended upon the specific morphological characteristics of giant reed and umbrella sedge plants. Literature confirmed this statement [50,51,52,53,54].

3.2.3. Total Suspended Solids

TSS values showed significant differences between influent and effluent. Average levels in the CW influent ranged between 65.51 and 24.01 mg L−1 during the five-year period. Average TSS effluent concentrations in the umbrella sedge-planted unit were higher than in the giant reed-planted unit and were not always within the legal limits of the Italian Decree for TWW irrigation reuse. Differences in RE values between the two CW planted units highlight the effect of plant type on TSS removal and can be explained by a differing root-length density of the species, time of contact between WW, and roots and plant-microorganism interactions [39,55].

3.2.4. Biochemical Oxygen Demand (Five Days) and Chemical Oxygen Demand

BOD5 and COD values were found to differ significantly between influent and effluent. In both effluents, BOD5 and COD concentrations were recorded below the limits imposed by Italian law regarding TWW irrigation reuse. In contrast, BOD5 RE values for the giant-reed and umbrella sedge-planted units (67 and 64.81%, respectively) were found to be similar throughout the five test years. Furthermore, no substantial differences were recorded between the two planted units for COD RE varying between 66.21 (giant reed-unit) and 62.35% (umbrella sedge-unit). In general, BOD5 and COD RE stayed within a range consistent with previous HSSFs CW studies treating urban WW [39,55]. In this study, at the inlet of the HSSFs CW, the ratio between COD and BOD5 was found to be 1.90 on average. This indicates high WW biodegradability and simple treatment using biological methods.

3.2.5. Nitrogen

Significant differences were found between influent and effluent concerning total and ammonia nitrogen, however. Average TN effluent concentrations were identical in the two planted units and were found to be always within the legal limits of the Italian Decree 152/2006. TN RE values were consistent with those of previous studies carried out in HSSFs CW [39,55].

3.2.6. Phosphorus

Significant differences were recorded between influent and effluent for TP. In both effluents, TP concentration was found to be above the threshold values for Italian Decree 156/2006. TP RE average values were approximately 40% and thus lower than those of TSS, BOD5, COD, and TN. As reported in scientific literature, the low TP RE values were due to a range of factors, such as the gradual filling of the sorption sites by the plant root systems over time, the presence of undecomposed plant parts around the substrate surface, and the adsorption properties intrinsic to the substrate itself [3].

3.2.7. Temporal Variations of the Main Chemical Parameters of Wastewater

Average TSS, BOD5, COD, TN, and TP concentrations on different dates in the two planted CW units are shown in Supplementary Figure S1. Observing the trend of concentration values of each chemical parameter at the outlet of the two units, it was found that, in general for each year, lowest values were obtained during the summer months and highest values during autumn.
Therefore, seasonal variations in concentrations of nutrient and organic compounds were detected, and these could be explained by a number of factors. However, the effect of vegetation seems to be the most important, as reported in previous studies [3,25,26,30,31]. Vegetation, in fact, affects the removal of pollutants in a CW due to the presence of growth stages that tend to differ with the seasons depending on climate conditions.

3.2.8. Total Coliforms, Faecal Coliforms, Faecal Streptococci, and Escherichia coli

In the case of microbiological parameters, significant differences were found between influent and effluent levels for TC, FS, and E. coli (Table 3). Average TC, FC, FS, and E. coli concentrations on different dates in the two planted CW units are shown in Supplementary Figure S2.
In both planted units, RE levels were found to be above 80.00%, in accordance with the findings of other studies conducted under similar operating conditions at the HSSFs CW. In 2014–2018, the microbiological data obtained for Escherichia coli in the two planted-units were not always found to be within the Italian legislative limits, highlighting the need to find alternative solutions.

3.2.9. TWW Qualitative Characteristics

Analysis of the main biological and chemical characteristics of TWW used for irrigation showed an average pH value of 7.05 and low salt content (Table 4).
Average levels of TSS (10.64 mg L−1) were low due to primary and secondary treatment in the wastewater treatment plant. Organic matter content (BOD5 equal to 10.72 mg L−1 and COD equal to 19.12 mg L−1 on average) and macroelements, such as NO3-N, TP, CA, K, and Mg, were not high but indicated a potential source of nutrients useful for improving plant growth and increasing soil fertility levels. At the same time, the concentration of trace elements was found to be very low and highly compatible with Italian standards for irrigation reuse.
The biological and chemical characteristics of the TWW did not vary over the years of application. Uniform composition of TWW was detected throughout the study period, and this was due to low variations in the amount of organic and mineral compounds in the pre-treated urban WW and to high pollutant-removal rates of the HSSFs CW. When comparing FW and TWW average levels, differences were found mainly during winter and spring months (data not shown). In summer, no large variations were observed between FW and TWW concentrations due to the fact that plant growth was intense, and this affected the removal rate of pollutants in both planted units significantly. It led to a reduction in the chemical and microbiological parameter levels at the outlet of the HSSFs CW. Finally, water quality for the irrigation of giant reed was assessed using international guidelines based on the findings of Westcot and Ayers [56]. The main restrictions on use for irrigation using FW and TWW were taken into consideration in accordance with literature [29], as shown in Table 5.
The results highlight that average nitrogen levels were within recommended limits, whilst sodium levels dictated a moderate restriction on use for irrigation. In the FW- and TWW-irrigated plots, average values for parameters regarding salinity and infiltration required no degree of limitation on use for irrigation.

3.3. Effects of the Main Factors on Soil Characteristics

The specific aim of this experiment was to assess the effects of irrigation with TWW on the chemical soil characteristics compared to irrigation with FW over a five-year period. In this experiment, soil samples were taken at a depth of 0–30 cm from each plot after each irrigation period and, subsequently, air dried, ground, and sieved and analysed for chemical and physical characteristics in accordance with international protocols.
Soil chemical characteristics as affected by year and irrigation water are shown in Table 6. The main factors did not determine significant changes for all soil parameters. Results of analysis of variance revealed that year-by-irrigation water interaction was significant for pH, EC, TOC, TKN, P, and Na.

3.3.1. Soil pH

Given the quality of FW and TWW and the physical characteristics of soil, no significant variations in topsoil pH of the FW- and TWW-irrigated plots were recorded. Soil pH varied very little between the IW treatments during the five-year period. This finding was confirmed by previous studies [3,8,25,27,30,57,58] that demonstrated the inconsistent effect of TWW irrigation on soil pH in both the short- and medium-term. A convincing explanation for this phenomenon has been given by a number of authors [8] who consider the buffering action of the soil as a tool to prevent variations in soil pH. In the long-term period, however, the application of TWW could significantly affect soil pH for various reasons, which have been amply reported in literature [59,60,61].

3.3.2. Soil Salinity

Soil salinity, measured by EC, increased over the years and was found to be higher on average in the TWW-irrigated soil (+5.32%) compared to the FW-irrigated soil. As stated by some studies [27,59], this increase in EC in the TWW-irrigated soil was probably due to original salt levels in the WW. In our study, the higher amount of total dissolved salts in TWW determined higher EC values in the TWW-irrigated plots and significantly contributed to the accumulation of salts in the soil in the medium-term. A number of authors have observed an increase in soil salinity following irrigation with TWW both in the short and long-term [27,57,62]. However, better explanation for possible increases in soil salinity due to TWW irrigation should take soil physical properties and TWW irrigation management into consideration. In particular, irrigation with TWW should also be carried out to allowing leaching of dissolved salts below the root system to avoid any risk to plant growth and soil fertility [27].

3.3.3. Total Organic Carbon of Soil

Concerning TOC, TWW-irrigated soil had a higher average values of TOC with respect to FW-irrigated soil. This was mainly due to higher nutrient content and organic compounds in TWW. Furthermore, as regards the average values of soil organic matter content over the five years, TOC increased as the length of application increased. A number of authors [3,25,26,27,28,29,30,57,58] confirm our findings, highlighting increases in soil TOC following WW irrigation in the medium- and long-term. One study [8] reported that various factors, such as soil water content and nutrient uptake by plants, may play a role in differences found in organic matter content between FW- and TWW-irrigated soils. However, the effect of these factors may only be significant in the short-term, when the accumulation of organic matter in the soil from TWW irrigation is not significant compared to that of FW irrigation.

3.3.4. Mineral Nutrients of Soil

In the case of mineral nutrients, TWW irrigation increased N, P, K, and Mg levels significantly. A higher accumulation of macronutrients in TWW-irrigated soil was probably due to original nutrient content in the TWW, as previously reported [27]. Regarding N in particular, differences between the FW- and TWW-irrigated soil were probably due to the fact that, in the medium-term, the effect of leaching and plant uptake on N content was not significant.
In our study, TWW-irrigated soil had higher Na content compared to FW-irrigated soil. It was observed that Na content increased during the five years. In accordance with other studies, in the medium- and long-term, the continuous use of TWW irrigation could increase the accumulation of Na in soils. Consequently, to avoid any risk to the soil structure in the long-term, periodic applications of good-quality irrigation water seems necessary.

3.4. Effects of the Main Factors on Morphological and Production Characteristics of Giant Reed

The specific aim of this experiment was to assess the effects of irrigation with TWW on morphological and production characteristics of giant reed compared to irrigation with FW over a five-year period. In this experiment, plant height and stem diameter were measured monthly after irrigation period. Above-ground dry weight was also calculated.
Year and irrigation water had significant effects on plant height, plant diameter, and above-ground dry weight (Table 7). The year-by-irrigation water interaction was significant for plant height and above-ground dry weight.

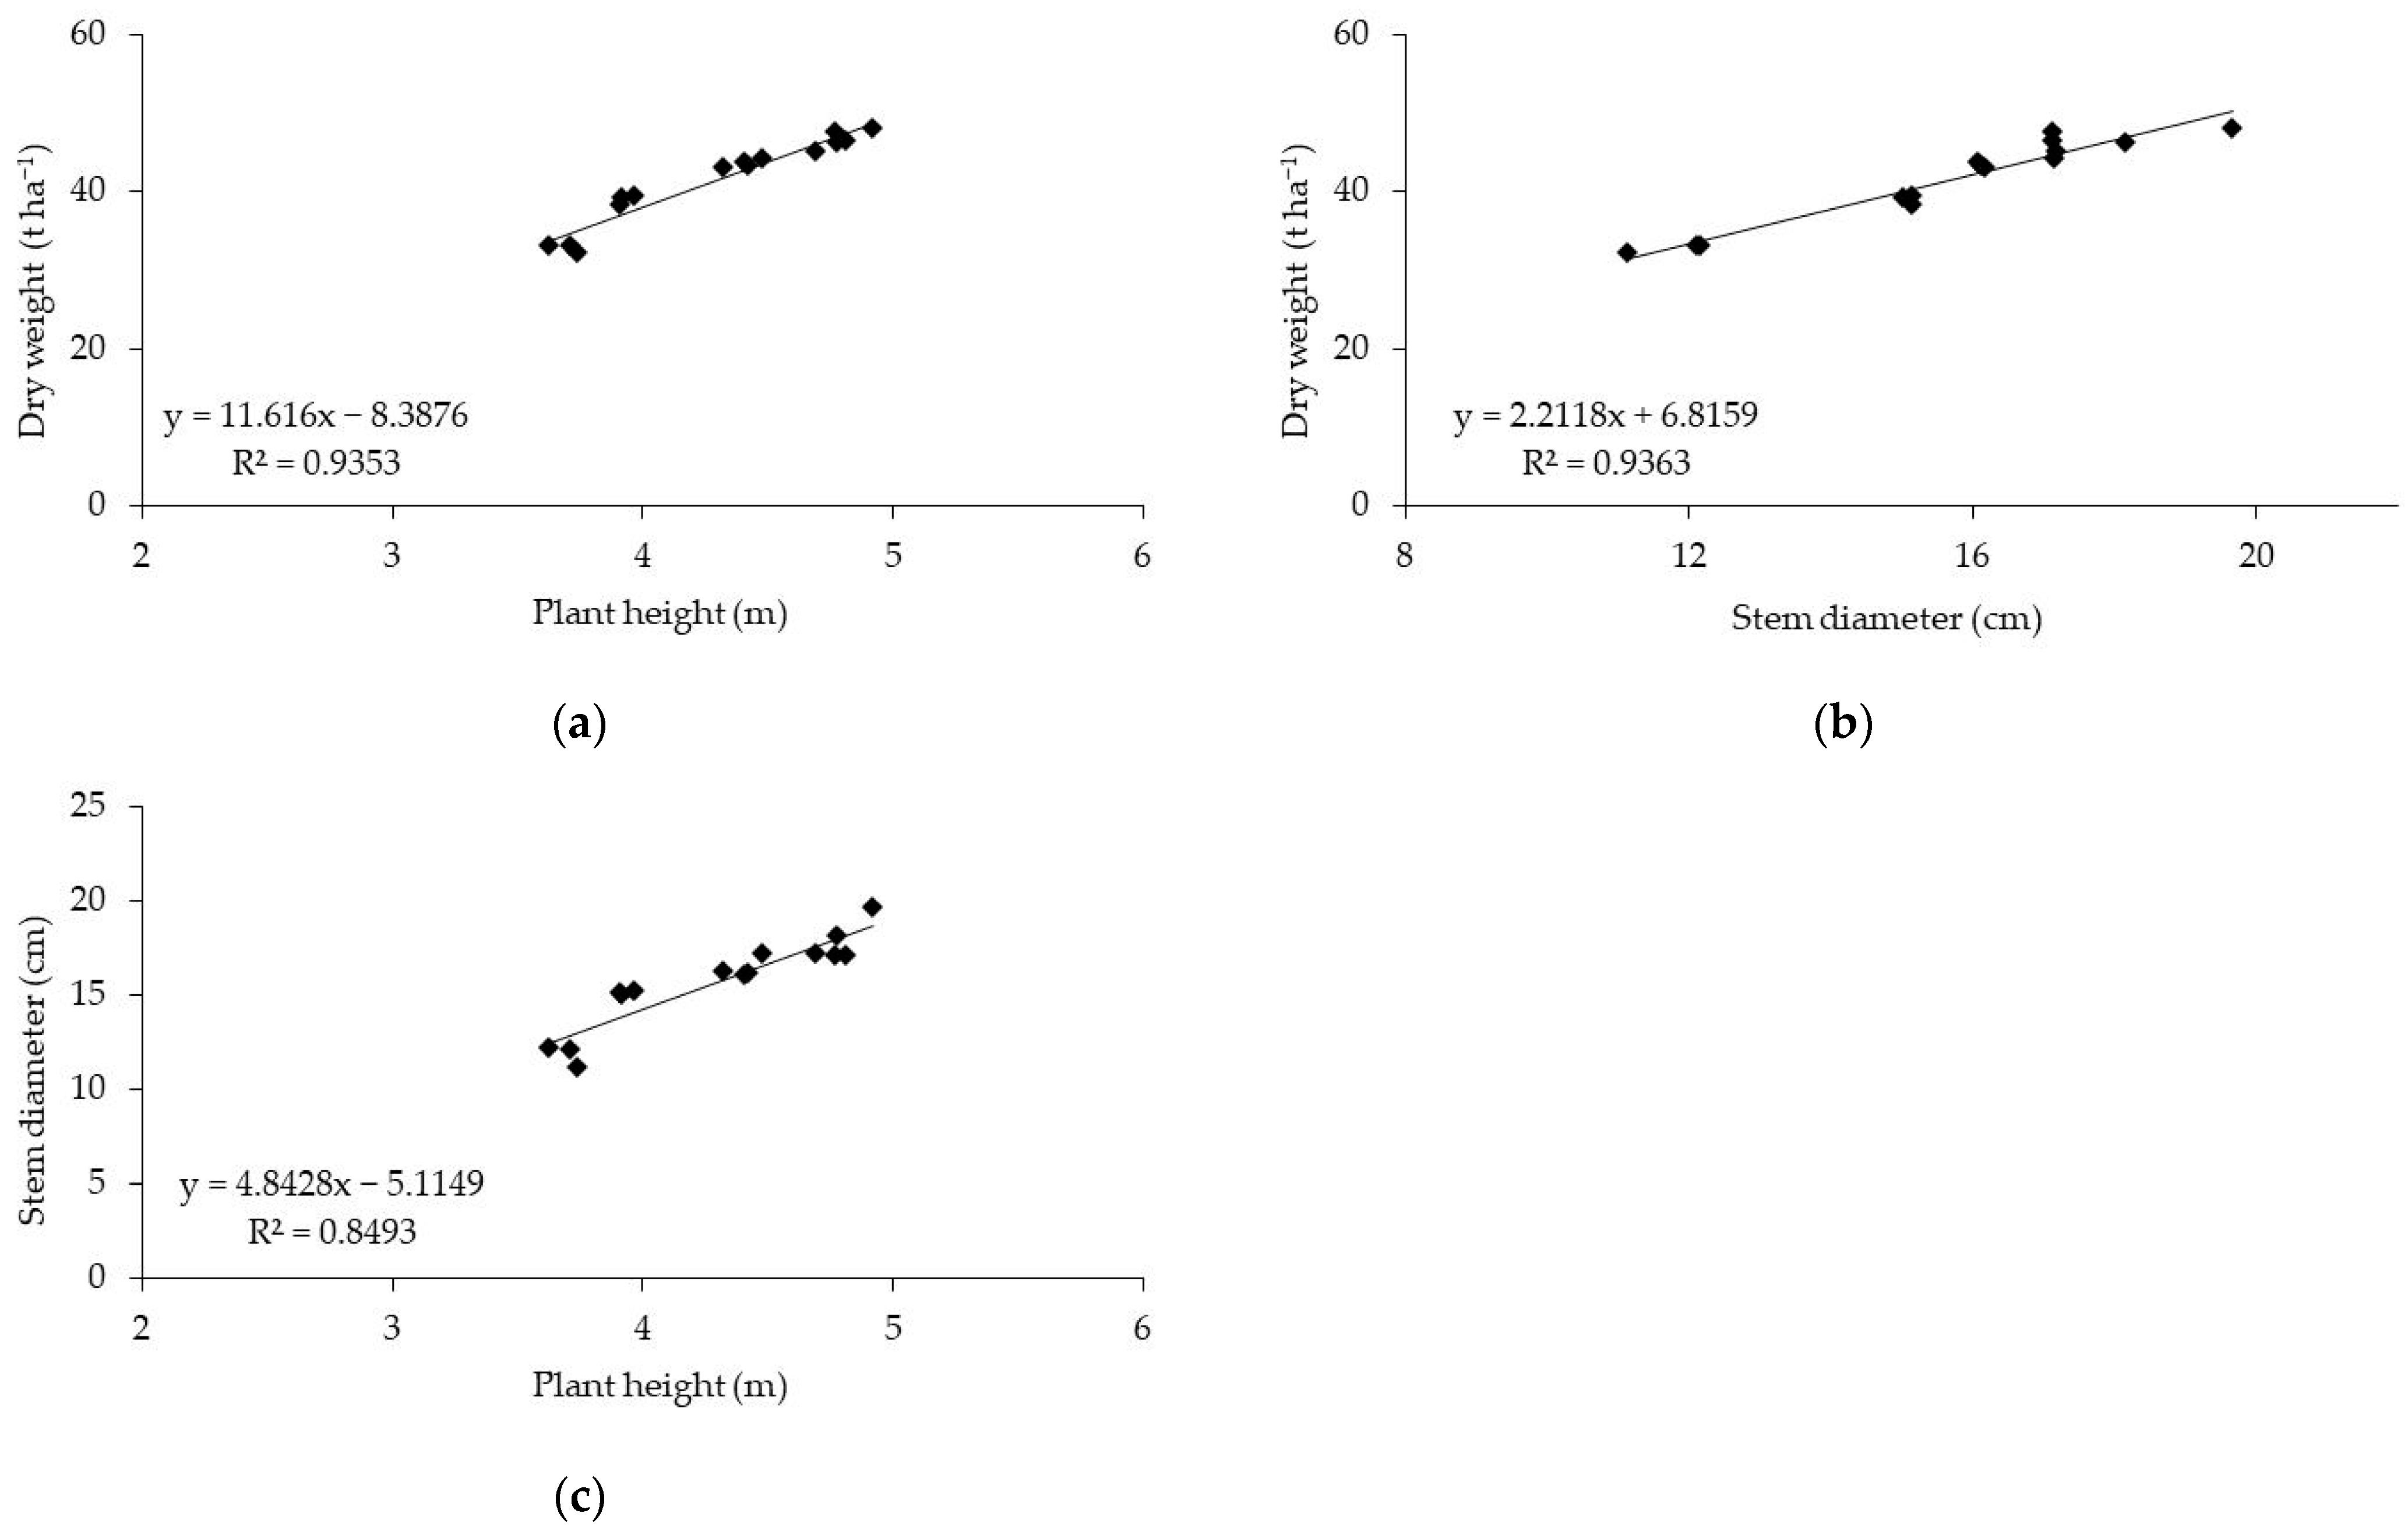
3.4.1. Plant Height, Stem Diameter, and Above-Ground Biomass

Plants irrigated with TWW showed greater growth (+10.49% in height, +12.75% in stem diameter) than those irrigated with FW. Consequently, the above-ground dry weight was lower in the case of irrigation with FW ( " 10.31%”). When considering the year, the highest average values regarding plant height, stem diameter, and above-ground biomass were recorded in 2017 and 2018 for the plants irrigated with TWW; the lowest average values were, instead, found in the first year of the study. As reported in previous studies [10,11,18], the average value of above-ground biomass was lowest in the first year and highest in the fifth year; from the first to the fifth year, in fact, it increased by 35.92% (from 32.96 to 44.80 t ha−1 year−1). No significant differences in above-ground dry weight were found between the fourth and fifth year, however.
To highlight the relationship between above-ground dry weight and morphological characteristics of giant reed, a regression analysis was performed (Figure 4).
Results showed that dry biomass yield increased linearly with plant height and stem diameter with a highly significant coefficient of determination (R2 = 0.93). Furthermore, plant height was positively related to stalk diameter (R2 = 0.84). These relationships indicate that above-ground biomass yield is due largely to plant growth and stem diameter.

3.4.2. Above-Ground Dry Weight

In this study, the source of IW significantly affected the above-ground dry weight of giant reed. TWW-irrigated plants had higher average values for biomass than FW-irrigated plants in each year. This means that irrigation with TWW positively influenced the biomass yield of giant reed more than irrigation with FW due to higher levels of mineral and organic compounds and salts. As the crop fertilisation program was similar in both TWW- and FW-irrigated plots, we can suppose that the amount of nutrients contained in the TWW led to an increase in soil mineral and organic fertility to a greater degree than in FW-irrigated plots, resulting in a greater increase in plant growth.
Concerning the effects of various sources of IW on growth and biomass yield of giant reed, there seems to be disagreement amongst researchers on how to interpret results. A number of studies confirm our findings [3,58,59]; on the contrary, some authors [8,11,17] did not find any benefits from the use of TWW with respect to FW. For example, in a study [8] carried out in Southern Calabria (Italy), it was found that plants irrigated with conventional water had higher growth and productivity than plants irrigated with TWW. These findings highlight that the effects of type of IW on production parameters can vary depending on various factors, such as initial soil fertility, plant density, plant phenological stage, crop fertilisation regime, and nutrient content in WW. Consequently, irrigation with TWW should be assessed by taking the above-mentioned factors into consideration.
Comparing our results with those of previous studies carried out in the Mediterranean area, both differences and similarities were observed regarding levels of above-ground biomass. The average level of productivity of giant reed (42.30 t ha−1) obtained with the use of TWW in a medium-term period (five years) was lower than that recorded by some authors [8,10]; however, it was also similar to average yields reported in other studies [9,11]. As stated in literature [10,11,12,17,18,20,23,63,64,65,66], these differences in biomass production can be explained by considering the physical and chemical characteristics of the soil (e.g., structure, texture, soil water availability, water retention, etc.), cultivation practices (e.g., plant density, fertilisation and irrigation levels, etc.), and genetic characteristics of giant reed plants. In particular, lower average values for above-ground biomass found in this study with respect to that of other studies could be due to a lower plant density used and different N fertilisation rates.

3.5. Effects of the Main Factors on Crop Residues of Giant Reed

The specific aim of this experiment was to assess the effects of irrigation with TWW on physical and energy characteristics of crop residues of giant reed and pellets compared to irrigation with FW over a five-year period. In this experiment, a number of samples were prepared after harvesting for each treatment in the study. The main energy and physical characteristics of giant reed crop residues were analysed after irrigation period. Furthermore, the crop residues were also tested for pellet-making, in accordance with Italian standards.
Year and irrigation water produced non-significant differences for all physical and energy characteristics of the crop residues and pellet (Table 8). Results of analysis of variance indicated that the year-by-irrigation water interaction was significant for moisture, higher heating value, and mechanical durability.

3.5.1. Moisture

At harvest time, during the five-year tests, the moisture content of crop residues ranged between 59.09 and 60.53%, in accordance with findings of some studies carried out in the Mediterranean area. Higher average moisture content values were found in crop residues from plants irrigated with TWW.

3.5.2. Ash

Ash content was determined in the range of 5.85–6.01% over the years. Very similar percentage values were found between the various IW treatments. In a previous study [60], it was shown that ash content could be greatly influenced by fertilisation levels and tends to decrease when fertilisation rates increase. In another study [2], the authors stated that air temperature levels, rainfall distribution, and soil water availability could affect the ash content of crop residues. In our research, the influence of climate factors on ash content was not noted, probably due to constant soil water availability during the growth season of giant reed plants.

3.5.3. Higher Heating Value

HHV ranged from 16.83 (FW-irrigated plants) to 17.00 MJ kg−1 (TWW-irrigated plants). No correlations between heating values of the above-ground biomass and harvest times were found (data not shown). Average HHV values were close to results in scientific literature [9,10], which reported values ranging from 16 to 19 MJ kg−1 for giant reed. As stated by a number of researchers, HHV could be affected by various factors, such as harvest time and plant density [10,18]. However, in our study, no differences were observed between the various treatments due to the fact that harvest occurred at the same time throughout the test periods, and plant density did not vary in the FW- and TWW-irrigated plots.

3.5.4. Bulk Density of Pellet

Concerning the physical characteristics of the pellet, average bulk density was found to be 116.02 kg m−3 over the years. A similar result was recorded by some authors [67] who assessed the combustion characteristics of giant reed, switchgrass, miscanthus, and cardoon. In our study, no significant differences in bulk density were recorded between the years and the various IW treatments.

3.5.5. Mechanical Durability of Pellet

Mechanical durability of the pellet was not affected by IW, similar to the bulk density results. Mechanical durability was found to be extremely very high during the five years, in the range of 92.55% to 93.12%. The high value found in this study reflected the quality of the pellet.

4. Conclusions

This paper investigated the performance of a pilot-scale horizontal subsurface flow system constructed wetland applied to urban wastewater treatment and the effects of treated wastewater irrigation of giant reed on soil and plant parameters in the medium-term. In five-year tests, most chemical parameters of wastewater were found to be highly compatible with Italian standards for irrigation reuse. However, data obtained for Escherichia coli were not always found to be within the legislative limits, highlighting the need to find alternative solutions, such as a hybrid-constructed wetland system. In general, biomass yields of giant reed increased following irrigation with treated wastewater compared to irrigation with freshwater. This was due to higher levels of mineral and organic compounds and salts. Physical and energy characteristics of giant reed crop residues and pellets were not affected significantly by source of irrigation water except concerning moisture content. Soils chemical characteristics increased over the years and were found to be higher in the treated wastewater-irrigated soil due to original salt level, nutrient content, and organic compounds.
It was demonstrated, therefore, that treated wastewater produced from constructed wetland system can be a source of water for the irrigation of giant reed on marginal lands and leads to higher plant biomass yields. However, it is reasonable to say that continuous irrigation with treated wastewater over time could lead to excessive accumulation of nutrients, organic matter, and salts in soils, which can be negative for soil productivity and plant growth. Consequently, we can say that, in the medium- and long-term, irrigation with treated wastewater requires careful management and periodic monitoring of soil fertility and plant production in order to reduce potential risks and ensure only the benefits of this type of irrigation water.

Supplementary Materials

The following are available online at https://www.mdpi.com/article/10.3390/w13151994/s1, Figure S1: total suspended solids, biochemical oxygen demand (five days), chemical oxygen demand, total nitrogen and total phosphorus concentrations at different dates (2014–2018); Figure S2: total coliforms, faecal coliforms, faecal streptococci and Escherichia coli concentrations at different dates (2014–2018).

Author Contributions

Conceptualization, M.L. and N.I.; methodology, M.L. and F.R.; software, R.R. and D.F.; validation, F.R., R.R. and N.I.; formal analysis, F.R., G.V. and D.F.; investigation, M.L. and N.I.; resources, M.L. and F.R.; data curation, G.V., R.R., D.F. and N.I.; writing—original draft preparation, M.L.; writing—review and editing, M.L. and D.F.; visualization, G.V. and N.I.; supervision, M.L. and F.R.; project administration, M.L., G.V. and N.I. All authors have read and agreed to the published version of the manuscript.

Funding

This research received no external funding.

Institutional Review Board Statement

Not applicable.

Informed Consent Statement

Not applicable.

Data Availability Statement

Data are available by contacting the authors.

Acknowledgments

Special thanks go to Lucie Branwen Hornsby for her linguistic assistance.

Conflicts of Interest

The authors declare no conflict of interest.

References

  1. McKendry, P. Energy production from biomass (part 1): Overview of biomass. Bioresour. Technol. 2002, 83, 37–46. [Google Scholar] [CrossRef]
  2. Nassi o Di Nasso, N.; Rocucci, N.; Triana, F.; Tozzini, C.; Bonari, E. Productivity of giant reed (Arundo donax L.) and miscanthus (Miscanthus x giganteus Greef et Deuter) as energy crops: Growth analysis. Ital. J. Agron. 2011, 6. [Google Scholar] [CrossRef] [Green Version]
  3. La Bella, S.; Tuttolomondo, T.; Leto, C.; Bonsangue, G.; Leone, R.; Virga, G.; Licata, M. Pollutant removal efficiency of a pilot-scale Horizontal Subsurface Flow in Sicily (Italy) planted with Cyperus alternifolius L. and Typha latifolia L. and reuse of treated wastewater for irrigation of Arundo donax L. for pellet production—Results of two-year tests under Mediterranean climatic conditions. Desalination Water Treat. 2016, 57, 22743–22763. [Google Scholar]
  4. Tziolas, E.; Manos, B.; Bournaris, T. Planning of agro-energy districts for optimum farm income and biomass energy from crops residues. Oper. Res. 2017, 17, 535–546. [Google Scholar] [CrossRef]
  5. Lewandowski, I.; Kicherer, A.; Vonier, P. CO2-balance for the cultivation and combustion of Miscanthus. Biomass Bioenergy 1995, 8, 81–90. [Google Scholar] [CrossRef]
  6. Hanegraaf, M.C.; Biewinga, E.E.; van der Bijl, G. Assessing the ecological and economic sustainability of energy crops. Biomass Bioenergy 1998, 15, 345–355. [Google Scholar] [CrossRef]
  7. Heaton, E.A.; Clifton-Brown, J.; Voigt, T.B.; Jones, M.B.; Long, S.P. Miscanthus for renewable energy generation: European Union experience and projections for Illinois. Mitig. Adapt. Strateg. Glob. Chang. 2003, 9, 433–451. [Google Scholar] [CrossRef]
  8. Zema, D.A.; Bombino, G.; Andiloro, S.; Zimbone, S.M. Irrigation of energy crops with urban wastewater: Effects on biomass yields, soils and heating values. Agric. Water Manag. 2012, 115, 55–65. [Google Scholar] [CrossRef]
  9. Lewandowski, I.; Scurlock, J.M.O.; Lindvall, E.; Christou, M. The development and current status of perennial rhizomatous grasses as energy crops in the US and Europe. Biomass Bioenergy 2003, 25, 335–361. [Google Scholar] [CrossRef]
  10. Angelini, L.G.; Ceccarini, L.; Nassi o Di Nasso, N.; Bonari, E. Comparison of Arundo donax L. and Miscanthus x giganteus in a long-term field experiment in Central Italy: Analysis of productive characteristics and energy balance. Biomass Bioenergy 2009, 33, 635–643. [Google Scholar] [CrossRef]
  11. Mantineo, M.; D’Agosta, G.M.; Copani, V.; Patanè, C.; Cosentino, S.L. Biomass yield and energy balance of three perennial crops for energy use in the semi-arid Mediterranean environment. Field Crop. Res. 2009, 114, 204–213. [Google Scholar] [CrossRef]
  12. Borin, M.; Barbera, A.C.; Milani, M.; Molari, G.; Zimbone, S.M.; Toscano, A. Biomass production and N balance of giant reed (Arundo donax L.) under high water and N input in Mediterranean environments. Eur. J. Agron. 2013, 51, 117–119. [Google Scholar] [CrossRef]
  13. Alexopolou, E.; Zanetti, F.; Scordia, D.; Zegada-Lizarazu, W.; Christou, M.; Testa, G.; Cosentino, S.L.; Monti, A. Long-term yields of switchgrass, giant reed, and miscanthus in the Mediterranean basin. Bioenergy Res. 2015, 8, 1492–1499. [Google Scholar] [CrossRef]
  14. Ierna, A.; Sortino, O.; Mauromicale, G. Biomass, seed and energy yield of Cynara cardunculus L. as affected by environment and season. Agronomy 2020, 10, 1548. [Google Scholar] [CrossRef]
  15. Cosentino, S.L.; Copani, V.; Testa, G.; Scordia, D. Saccharum spontaneum L. ssp. aegyptiacum (Willd.) Hack. a potential perennial grass for biomass production in marginal land in semi-arid Mediterranean environment. Ind. Crop. Prod. 2015, 75, 93–102. [Google Scholar] [CrossRef]
  16. Ercoli, L.; Mariotti, M.; Masoni, A.; Bonari, E. Effect of irrigation and nitrogen fertilization on biomass yield and efficiency of energy use in crop production of Miscanthus. Field Crop. Res. 1999, 63, 3–11. [Google Scholar] [CrossRef]
  17. Christou, M.; Mardikis, M.; Alexopoulou, E. Research on the effect of irrigation and nitrogen upon growth and yields of Arundo donax L. in Greece. Asp. Appl. Biol. 2001, 65, 47–55. [Google Scholar]
  18. Angelini, L.; Ceccarini, L.; Bonari, E. Biomass yield and energy balance of giant reed (Arundo donax L.) cropped in central Italy as related to different management practices. Eur. J. Agron. 2005, 22, 375–389. [Google Scholar] [CrossRef]
  19. Cano-Ruiz, J.; Sanz, M.; Curt, M.D.; Plaza, A.; Lobo, M.C.; Mauri, P.V. Fertigation of Arundo donax L. with different nitrogen rates for biomass production. Biomass Bioenergy 2020, 133, 105451. [Google Scholar] [CrossRef]
  20. Monti, A.; Zegada-Lizarazu, W. Sixteen-year biomass yield and soil carbon storage of giant reed (Arundo donax L.) grown under variable nitrogen fertilization rates. Bioenergy Res. 2016, 9, 248–256. [Google Scholar] [CrossRef]
  21. Nackley, L.L.; Vogt, K.A.; Kim, S.H. Arundo donax water use and photosynthetic responses to drought and elevated CO2. Agric. Water Manag. 2014, 136, 13–22. [Google Scholar] [CrossRef]
  22. Triana, F.; Nassi o Di Nasso, N.; Ragaglini, G.; Roncucci, N.; Bonari, E. Evapotranspiration, crop coefficient and water use efficiency of giant reed (Arundo donax L.) and miscanthus (Miscanthus x giganteus Geef et Deu.) in a Mediterranean environment. GBC Bioenergy 2015, 7, 811–819. [Google Scholar]
  23. Cosentino, S.L.; Scordia, D.; Sanzone, E.; Testa, G.; Copani, V. Response of giant reed (Arundo donax L.) to nitrogen fertilization and soil water availability in semi-arid Mediterranean environment. Eur. J. Agron. 2014, 60, 22–32. [Google Scholar] [CrossRef]
  24. Pedrero, F.; Kalavrouziotis, I.; Alarcón, J.J.; Koukoulakis, P.; Asano, T. Use of treated municipal wastewater in irrigated agriculture—Review of some practices in Spain and Greece. Agric. Water Manag. 2010, 97, 1233–1241. [Google Scholar] [CrossRef]
  25. Licata, M.; Tuttolomondo, T.; Leto, C.; La Bella, S.; Virga, G. The use of constructed wetlands for the treatment and reuse of urban wastewater for the irrigation of two warm-season turfgrass species under Mediterranean climatic conditions. Water Sci. Technol. 2017, 76, 459–469. [Google Scholar] [CrossRef] [Green Version]
  26. Licata, M.; Gennaro, M.C.; Tuttolomondo, T.; Leto, C.; La Bella, S. Research focusing on plant performance in constructed wetlands and agronomic application of treated wastewater—A set of experimental studies in Sicily (Italy). PLoS ONE 2019, 14, e0219445. [Google Scholar] [CrossRef] [PubMed]
  27. Rusan, M.J.M.; Hinnawi, S.; Rousan, L. Long-term effect of wastewater irrigation of forage crops on soil and plant quality parameters. Desalination 2007, 215, 143–152. [Google Scholar] [CrossRef]
  28. Bedbabis, S.; Ferrara, G.; Ben Rouina, B.; Boukhris, M. Effects of irrigation with treated wastewater on olive tree growth, yield and leaf mineral elements at short term. Sci. Hortic. 2010, 126, 345–350. [Google Scholar] [CrossRef]
  29. Castro, E.; Mañas, M.P.; De Las Heras, J. Effects of wastewater irrigation on soil properties and turfgrass growth. Water Sci. Technol. 2011, 638, 1678–1688. [Google Scholar] [CrossRef]
  30. Licata, M.; La Bella, S.; Leto, C.; Virga, G.; Leone, R.; Bonsangue, G.; Tuttolomondo, T. Reuse of urban-treated wastewater from a pilot-scale horizontal subsurface flow system in Sicily (Italy) for irrigation of Bermudagrass (Cynodon dactylon (l.) Pers.) turf under Mediterranean climatic conditions. Desalination Water Treat. 2016, 57, 23343–23364. [Google Scholar] [CrossRef]
  31. Licata, M.; La Bella, S.; Virga, G.; Leto, C.; Tuttolomondo, T. Management of irrigation water and nutrient demands of tomato (Lycopersicon esculentum Mill.) using urban treated wastewater from a pilot-scale horizontal subsurface flow system constructed wetland in Sicily (Italy). Desalination Water Treat. 2017, 73, 422–439. [Google Scholar] [CrossRef]
  32. Vazquezmontiel, O.; Horan, N.J.; Mara, D.D. Management of domestic wastewater for reuse in irrigation. Water Sci. Technol. 1996, 33, 355–362. [Google Scholar] [CrossRef]
  33. Angin, I.; Vahap, A.Y.; Turan, M. Effects of long-term wastewater irrigation on soil properties. J. Sustain. Agric. 2005, 26, 31–42. [Google Scholar] [CrossRef]
  34. Stefanakis, A.I. The role of constructed wetlands as green infrastructure for sustainable urban water management. Sustainability 2019, 11, 6981. [Google Scholar] [CrossRef] [Green Version]
  35. Boano, F.; Caruso, A.; Costamagna, E.; Ridolfi, L.; Fiore, S.; Demichelis, F.; Galvão, A.; Pisoeiro, J.; Rizzo, A.; Masi, F. A review of nature-based solutions for greywater treatment: Applications, hydraulic design, and environmental benefits. Sci. Total Environ. 2020, 711, 134731. [Google Scholar] [CrossRef]
  36. Leto, C.; Tuttolomondo, T.; La Bella, S.; Leone, R.; Licata, M. Growth of Arundo donax L. and Cyperus alternifolius L. in a horizontal subsurface flow constructed wetland using pre-treated urban wastewater—A case study in Sicily (Italy). Desalination Water Treat. 2013, 251, 7447–7459. [Google Scholar] [CrossRef]
  37. APAT; CNR-IRSA. Metodi Analitici Per le Acque, 1st ed.; Agenzia per la Protezione dell’Ambiente e per i Servizi Tecnici, Consiglio Nazionale delle Ricerche—Istituto di Ricerca sulle Acque: Rome, Italy, 2004; pp. 1–1149. [Google Scholar]
  38. APHA. Standard Methods for the Examination of Water and Wastewater, 20th ed.; American Public Health Association, American Water Works Association and Water Environmental Federation: Washington, DC, USA, 1998; pp. 1–75. [Google Scholar]
  39. Kadlec, R.H.; Knight, R.L.; Vymazal, J.; Brix, H.; Cooper, P.; Haberl, R. Constructed Wetlands for Pollution Control: Processes, Performance, Design and Operation, 1st ed.; International Water Association Publishing: London, UK, 2000; pp. 17–90. [Google Scholar]
  40. Doorenbos, J.; Pruitt, W.O. Guidelines for Predicting Crop Water Requirements; FAO Irrigation and Drainage Paper 24; FAO: Rome, Italy, 1984. [Google Scholar]
  41. UNI EN 14774-2:2010. Solid Biofuels, Methods for the Determination of Moisture Content, Oven Dry Method. Part 2: Total Moisture-Simplified Method; Ente Nazionale Italiano di Unificazione: Rome, Italy, 2010. [Google Scholar]
  42. UNI EN 14918:2010. Solid Biofuels, Method for the Determination of Calorific Value; Ente Nazionale Italiano di Unificazione: Rome, Italy, 2010. [Google Scholar]
  43. UNI EN 14775:2010. Solid Biofuels, Method for the Determination of Ash Content; Ente Nazionale Italiano di Unificazione: Rome, Italy, 2010. [Google Scholar]
  44. UNI EN 15103:2010. Solid Biofuels, Method for the Determination of Bulk Density; Ente Nazionale Italiano di Unificazione: Rome, Italy, 2010. [Google Scholar]
  45. Nelson, D.W.; Sommers, L.E. Total carbon, organic carbon, and organic matter. In Methods of Soil Analysis Part 3—Chemical Methods, 2nd ed.; Sparks, D.L., Page, A.L., Helmke, P.A., Loeppert, R.H., Eds.; Agronomy, American Society of Agronomy, Inc., Soil Science Society of America, Inc.: Madison, WI, USA, 1996; pp. 961–1010. [Google Scholar]
  46. Nelson, D.W.; Sommers, L.E. Total nitrogen analysis for soil and plant tissues. J. Assoc. Off. Anal. Chem. 1998, 63, 770–778. [Google Scholar] [CrossRef]
  47. Olsen, R.L.; Sommers, L.E. Phosphorus. In Methods of Soil Analysis Part 2, 2nd ed.; Page, A.L., Miller, R.H., Keeney, D.R., Eds.; Agronomy, American Society of Agronomy, Inc., Soil Science Society of America, Inc.: Madison, WI, USA, 1982; pp. 403–430. [Google Scholar]
  48. Pansu, M.; Gautheyrou, J. Carbonates. In Handbook of Soil Analysis, 1st ed.; Pansu, M., Gautheyrou, J., Eds.; Springer: Berlin, Germany, 2006; pp. 593–604. [Google Scholar]
  49. Servizio Informativo Agrometeorologico Siciliano. Available online: www.sias.regione.sicilia.it (accessed on 24 January 2021).
  50. Beebe, D.A.; Castle, J.W.; Molz, F.J.; Rodgers, J.H., Jr. Effects of evapotranspiration on treatment performance in constructed wetlands: Experimental studies and modeling. Ecol. Eng. 2014, 71, 394–400. [Google Scholar] [CrossRef] [Green Version]
  51. Pedescoll, A.; Sidrach-Cardona, R.; Sánchez, J.; Bécares, E. Evapotranspiration affecting redox conditions in horizontal constructed wetlands under Mediterranean climate: Influence of plant species. Ecol. Eng. 2013, 58, 335–343. [Google Scholar] [CrossRef]
  52. Headley, T.; Davison, L.; Huett, D.; Müller, R. Evapotranspiration from subsurface horizontal flow wetlands planted with Phragmites australis in sub-tropical Australia. Water Res. 2012, 46, 345–354. [Google Scholar] [CrossRef] [PubMed]
  53. Tuttolomondo, T.; Licata, M.; Leto, C.; Leone, R.; La Bella, S. Effect of plant species on water balance in a pilot-scale horizontal subsurface flow constructed wetland planted with Arundo donax L. and Cyperus alternifolius L.—Two-year tests in a Mediterranean environment in the West of Sicily (Italy). Ecol. Eng. 2015, 74, 79–92. [Google Scholar] [CrossRef]
  54. Shelef, O.; Gross, A.; Rachmilevitch, S. Role of plants in constructed wetland: Current and new perspectives. Water 2013, 5, 405–419. [Google Scholar] [CrossRef]
  55. Vymazal, J. The use constructed wetlands with horizontal sub-surface flow for various types of wastewater. Ecol. Eng. 2009, 35, 1–17. [Google Scholar] [CrossRef]
  56. Ayers, R.S.; Westcot, D.W. Water Quality for Agriculture; Irrigation and Drainage Paper 29; Food and Agriculture Organization (FAO) of the United Nations: Rome, Italy, 1985. [Google Scholar]
  57. Heidarpour, M.; Mostafazadeh-Fard, B.; Abedi Koupai, J.; Malekian, R. The effects of treated wastewater on soil chemical properties using subsurface and surface irrigation methods. Agric. Water Manag. 2007, 90, 87–94. [Google Scholar] [CrossRef]
  58. Virga, G.; Sabatino, L.; Licata, M.; Tuttolomondo, T.; Leto, C.; La Bella, S. Effects of irrigation with different sources of water on growth, yield and essential oil compounds in oregano. Plants 2020, 9, 1618. [Google Scholar] [CrossRef] [PubMed]
  59. Mohammad, M.J.; Mazahreh, N. Changes in soil fertility parameters in response to irrigation of forage crops with secondary treated wastewater. Commun. Soil Sci. Plant Anal. 2003, 34, 1281–1294. [Google Scholar] [CrossRef]
  60. Adrover, M.; Farrús, E.; Moyà, G.; Vadell, J. Chemical properties and biological activity in soils of Mallorca following twenty years of treated wastewater irrigation. J. Environ. Manag. 2012, 95, 188–192. [Google Scholar] [CrossRef] [PubMed]
  61. Schipper, L.A.; Williamson, J.C.; Kettles, H.A.; Speir, T.W. Impact of land-applied tertiary-treated effluent on soil biochemical properties. J. Environ. Qual. 1996, 25, 1073–1077. [Google Scholar] [CrossRef]
  62. Qian, Y.L.; Mecham, B. Long-term effects of recycled wastewater irrigation on soil chemical properties on golf course fairways. Agron. J. 2005, 97, 717–721. [Google Scholar] [CrossRef]
  63. Williams, C.M.J.; Biswas, T.K.; Harris, P.L.; Heading, S. Use of giant reed to treat wastewater for resource recycling in south Australia. Acta Hortic. 2008, 792, 701–707. [Google Scholar] [CrossRef]
  64. Barbagallo, S.; Barbera, A.C.; Cirelli, G.L.; Milani, M.; Toscano, A. Reuse of constructed wetland effluents for irrigation of energy crops. Water Sci. Technol. 2014, 70, 1465–1472. [Google Scholar] [CrossRef] [PubMed]
  65. Zegada-Lizarazu, W.; Salvi, S.; Monti, A. Assessment of mutagenized giant reed clones for yield, drought resistance and biomass quality. Biomass Bioenergy 2020, 134, 105501. [Google Scholar] [CrossRef]
  66. Nassi o Di Nasso, N.; Angelini, L.G.; Bonari, E. Influence of fertilisation and harvest time on fuel quality of giant reed (Arundo donax L.) in central Italy. Eur. J. Agron. 2010, 32, 219–227. [Google Scholar] [CrossRef]
  67. Dahl, J.; Obernberger, I. Evaluation of the combustion characteristics of four perennial energy crops (Arundo donax, Cynara cardunculus, Miscanthus x Giganteus and Panicum virgatum). In Proceedings of the 2nd World Conference on Biomass for Energy, Industry and Climate Protection, Rome, Italy, 10–14 May 2004; ETA-Florence: Florence, Italy, 2004; pp. 1265–1270. [Google Scholar]
Figure 1. A view of the HSSFs CW.
Water 13 01994 g001
Figure 2. Layout of the WW treatment system based on HSSFs CW.
Water 13 01994 g002
Figure 3. Rainfall and air temperature trends during the study period in the experimental area. Graph (a) refers to 2014, graph (b) refers to 2015, graph (c) refers to 2016, graph (d) refers to 2017, and graph (e) refers to 2018.
Water 13 01994 g003
Figure 4. Relationships between morphological and production characteristics taking into consideration giant reed plants irrigated with TWW1. (a) Refers to relationship between plant height and above-ground dry weight; (b) refers to relationship between stem diameter and above-ground dry weight; and (c) refers to relationship between plant height and stem diameter.
Water 13 01994 g004
Table 1. Variation (VA) of pH and electrical conductivity (EC) in the two HSSFs CW units from March to October 2014/2018. For each unit, five-year average values (±standard deviation) are shown (n = 80).
ParameterInfluentEffluent 1Effluent 2VA (%) 1VA (%) 2TWW Reuse in Irrigation 3t-Test 4
pH7.41 ± 0.507.10 ± 0.107.01 ± 0.425.105.456–9.5**
EC (mS cm−1)0.51 ± 22.100.58 ± 21.100.56 ± 22.1216.2212.993**
1 giant reed-planted unit; 2 umbrella sedge-planted unit.; 3 threshold values for Italian Decree 156/2006.; 4 significant differences between influent and effluent values; ** level of statistical significance (p < 0.01).
Table 2. Main chemical composition of the treated wastewater (TWW) from inlet to outlet of the HSSFs CW. Removal efficiency (RE) from March to October 2014/2018. For each unit, five-year average values (±standard deviation) are shown (n = 80).
ParameterInfluentEffluent 1Effluent 2RE (%) 1RE (%) 2TWW Reuse in Irrigation 3t-Test 4
TSS (mg L−1)39.41 ± 1.709.97 ± 0.4511.31 ± 0.4273.7269.9110**
BOD5 (mg L−1)30.81 ± 4.6610.32 ± 3.3011.12 ± 3.2267.0064.8120**
COD (mg L−1)57.11 ± 10.1218.43 ± 2.7619.81 ± 3.7966.2162.35100**
TN (mg L−1)20.41 ± 3.4910.11 ± 2.2610.32 ± 2.3350.3349.1115**
N–NH4 (mg L−1)14.45 ± 1.166.56 ± 2.117.17 ± 1.8854.1150.38-**
TP (mg L−1)8.11 ± 1.184.78 ± 0.115.02 ± 1.1241.1138.022**
1 giant reed-planted unit; 2 umbrella sedge-planted unit; 3 threshold values for Italian Decree 156/2006; 4 significant differences between influent and effluent values; ** level of statistical significance (p < 0.01).
Table 3. Main microbiological composition of the treated wastewater (TWW) from inlet to outlet of the HSSFs CW. Removal efficiency (RE) from March to October 2014/2018. For each unit, five-year average values (±standard deviation) are shown (n = 80).
ParameterInfluentEffluent 1Effluent 2RE 1RE 2TWW Reuse in Irrigation 3t-Test 4
TC (CFUs 100 mL–1)4.43 ± 1.51 53.43 ± 0.903.49 ± 1.0189.6088.22-**
FC (CFUs 100 mL–1)4.27 ± 1.123.35 ± 1.633.39 ± 2.0188.0186.73-**
FS (CFUs 100 mL−1)3.97 ± 0.893.21 ± 1.013.20 ± 1.1483.1280.11-**
Escherichia coli (CFUs 100 mL−1)3.10 ± 0.342.12 ± 0.102.16 ± 0.1587.6785.1510 and 100 6**
Salmonella spp. (CFUs 100 mL−1)AbsentAbsentAbsent -
1 giant reed-planted unit; 2 umbrella sedge-planted unit; 3 threshold values for Italian Decree 156/2006; 4 significant differences between influent and effluent values; 5 the average concentration values are shown as units of Log10; 6 10 CFUs 100 mL−1 (80% of samples) and 100 CFUs 100 mL−1 as maximum value point; ** level of statistical significance (p < 0.01).
Table 4. Biological and chemical composition of freshwater (FW) and treated wastewater (TWW) which were applied for irrigation of giant reed. Average (±standard deviation) values of five-year-tests are shown.
ParameterFWTWW 1TWW 2TWW Reuse in Irrigation 3
pH7.06 ± 0.037.10 ± 0.107.09 ± 0.426–9.5
EC (μS cm−1)210 ± 1.01580 ± 21.10560 ± 22.123000
TSS (mg L−1)Not detected9.97 ± 0.4511.31 ± 0.4210
BOD5 (mg L−1)1.30 ± 0.0110.32 ± 3.3011.12 ± 3.2220
COD (mg L−1)1.70 ± 0.1118.43 ± 2.7619.81 ± 3.79100
NO3-N (mg N L−1)0.32 ± 0.523.56 ± 1.233.91 ± 1.77-
TP (mg L−1)0.35 ± 0.274.78 ± 0.115.02 ± 1.122
Ca (mg L−1)25.12 ± 0.6776.11 ± 0.2172.11 ± 0.45-
K (mg L−1)2.21 ± 1.1872.01 ± 0.3575.13 ± 0.83-
Mg (mg L−1)15.10 ± 0.7716.34 ± 0.1121.34 ± 0.25-
Na (mg L−1)11.62 ± 0.35156.11 ± 0.56161.23 ± 0.34-
SAR (meq L−1)0.45 ± 0.214.23 ± 0.404.35 ± 0.3310
1 TWW from giant reed-planted unit; 2 TWW from umbrella sedge-planted unit; 3 threshold values for Italian Decree 156/2006.
Table 5. Restrictions on use for irrigation with freshwater (FW) and urban treated wastewater (TWW) from HSSFs CW.
ItemFWTWW 1TWW 2
Salinity (EC)NoneNoneNone
Infiltration (SAR)NoneNoneNone
Specific ion toxicity:
NaNoneModerateModerate
Miscellaneous effects:
NO3-NNoneNoneNone
1 TWW from giant reed-planted unit; 2 TWW from umbrella sedge-planted unit.
Table 6. Chemical characteristics of soil in response to year and irrigation water during the study period. Average values of 5-year tests are shown.
pHEC
(μS cm−1)
TOC
(g kg−1)
TKN
(g kg−1)
P
(mg kg−1)
Total
CaCO3
(g kg−1)
K
(ppm)
Mg
(ppm)
Na
(ppm)
Main factor
Year (Y)
Y17.64 b180.62 d7.82 b1.21 e30.86 c1.30 c554.55 b637.57 a91.17 c
Y27.65 a187.34 c7.83 b1.24 d31.66 b1.33 b555.95 b642.48 a93.09 b
Y37.66 a191.32 b7.78 b1.27 c31.69 b1.33 b555.95 b639.14 a93.65 b
Y47.64 b200.53 a7.82 b1.30 b31.47 b1.34 b560.93 ab637.47 a92.87 b
Y57.65 a200.42 a7.97 a1.35 a32.40 a1.38 a563.94 a644.14 a97.24 a
Irrigation water (IW)
IW17.65 a186.18 c7.70 b1.25 c31.18 b1.32 b542.10 b633.73 b90.42 b
IW27.65 a195.21 b7.91 a1.28 b32.11 a1.34 a566.04 a641.43 a95.21 a
IW37.64 a 196.97 a7.92 a1.30 a31.96 a1.34 a566.65 a645.25 a95.19 a
Interaction
Y × IW**********n.sn.s.n.s.**
Means followed by the same letter in the same column are not significantly different according to Tukey’s test (p ≤ 0.01). ** significant at p ≤ 0.01; n.s. = not significant.
Table 7. Morphological and production characteristics of giant reed plants in response to year and irrigation water during the study period. Average values of 5-year tests are shown.
Plant Height (cm)Stem Diameter (mm)Above-Ground Dry Weight (t ha−1)
Main factor
Year (Y)
Y1365.97 d11.50 d32.96 d
Y2387.23 c14.32 c37.96 c
Y3424.24 b15.56 b41.65 b
Y4454.33 a17.13 a44.42 a
Y5457.57 a17.18 a44.80 a
Irrigation water (IW)
IW1390.56 b13.95 b37.46 b
IW2429.88 a15.70 a41.54 a
IW3433.20 a15.76 a42.01 a
Interaction
Y × IW**n.s.**
Means followed by the same letter in the same column are not significantly different according to Tukey’s test (p ≤ 0.01). ** significant at p ≤ 0.01; n.s. = not significant.
Table 8. Physical and energy characteristics of crop residues of giant reed plants and physical parameters of pellet in response to year and irrigation water during the study period. Average values of 5-year tests are shown.
Moisture
Content (%)
Ash Content (%)Higher Heating Value (MJ kg−1)Bulk Density (kg m−3)Mechanical Durability of Pellet (%)
Main factor
Year (Y)
Y159.09 b5.85 a16.74 a115.69 b93.12 a
Y259.57 b5.93 a16.85 a116.37 ab92.87 a
Y360.41 a5.94 a16.97 a116.72 a92.55 a
Y460.53 a6.01 a17.01 a115.71 b92.88 a
Y560.17 ab5.91 a17.10 a116.65 ab92.75 a
Irrigation water (IW)
IW159.36 b5.89 a16.83 a116.18 a92.58 a
IW259.84 ab5.92 a16.92 a116.04 a92.91 a
IW360.67 a5.97 a17.05 a 116.47 a93.01 a
Interaction
Y × IW**n.s**n.s.**
Means followed by the same letter in the same column are not significantly different according to Tukey’s test (p ≤ 0.01). ** significant at p ≤ 0.01; n.s. = not significant.
Publisher’s Note: MDPI stays neutral with regard to jurisdictional claims in published maps and institutional affiliations.

