1. Introduction
Global projections indicate that by 2025, 1.8 billion people will live in countries or regions with absolute water shortage, and two-thirds of the world population could be under conditions of acute water stress [
1,
2]. Water is at the center of socio-economic development and its management is critical to achieving the Sustainable Development Goal 6 “Ensure availability and sustainable management of water and sanitation for all” [
3]. Uncertainty about future conditions is becoming even more acute because of climate change and shifting economies. According to [
4] water allocation for domestic use, agriculture, hydro-power, tourism and other water demands while maintaining environmental integrity remains a major challenge to water managers, mostly in developing countries. Exploring adaptation pathways into an uncertain future can support decision making in achieving sustainable water management in an unpredictable environment [
5,
6,
7]. Sustainable water allocation in this study is defined according to [
8] as the use of water that supports the ability of human society to endure and flourish into the indefinite future without undermining the integrity of the hydrological cycle or the ecological systems that depend on it.
The literature describes attempts to develop water allocation models that support ecological balance. Wang et al. [
9] developed and applied an Optimal Water Allocation Model centered on water resources security assessment to improve the water use benefits in Zhangjiakou Region of northern China in 2020. A Resource Allocation Model was used to build the water allocation tool to analyze alternate policy scenarios and investigate possible water allocation options in the Malaprabha catchment, India [
10]. Water Allocation Models was developed for the Umbeluzi River Basin in Mozambique based on the Water Evaluation and Planning framework [
11].
According to Droogers and Bauman [
12], no single best model for water alocation exists, because it is a function of the questions to be answered. A common approach of model selection is to look at the spatial scale to cover and the amount of physical detail to be included but also taking into consideration other factors such as resource (time and money) availability, access to data, knowledge level, and support among others. Although catchment approach in water allocation for present and future demands has been emphasized, there is glaring gap on matching water availability with demand [
13]. Limited studies in East Africa and particularly in Uganda have been carried out to determine and map water use and demands. Questions remain on the impact of management options to support decision making on sustainable water allocation amidst the changing climate. It is imperative to develop a harmonized approach to the exploitation of water resources at an integrated watershed management level.
This study therefore, assessed the impact of management options to support decision making on sustainable water allocation. River Mubuku-Sebwe Sub-Catchments of Lake Edward-George Basin, Western Uganda was used a case study. Sustainability was hinged on reliability of water allocation, minimum deficits and meeting ecosystem demand with 2040 as the planning horizon in conformity to Uganda’s vision 2040. The information generated will enable water managers to effectively plan to meet present and future water demands with the potentially available resource.
2. Materials and Methods
2.1. Study Area
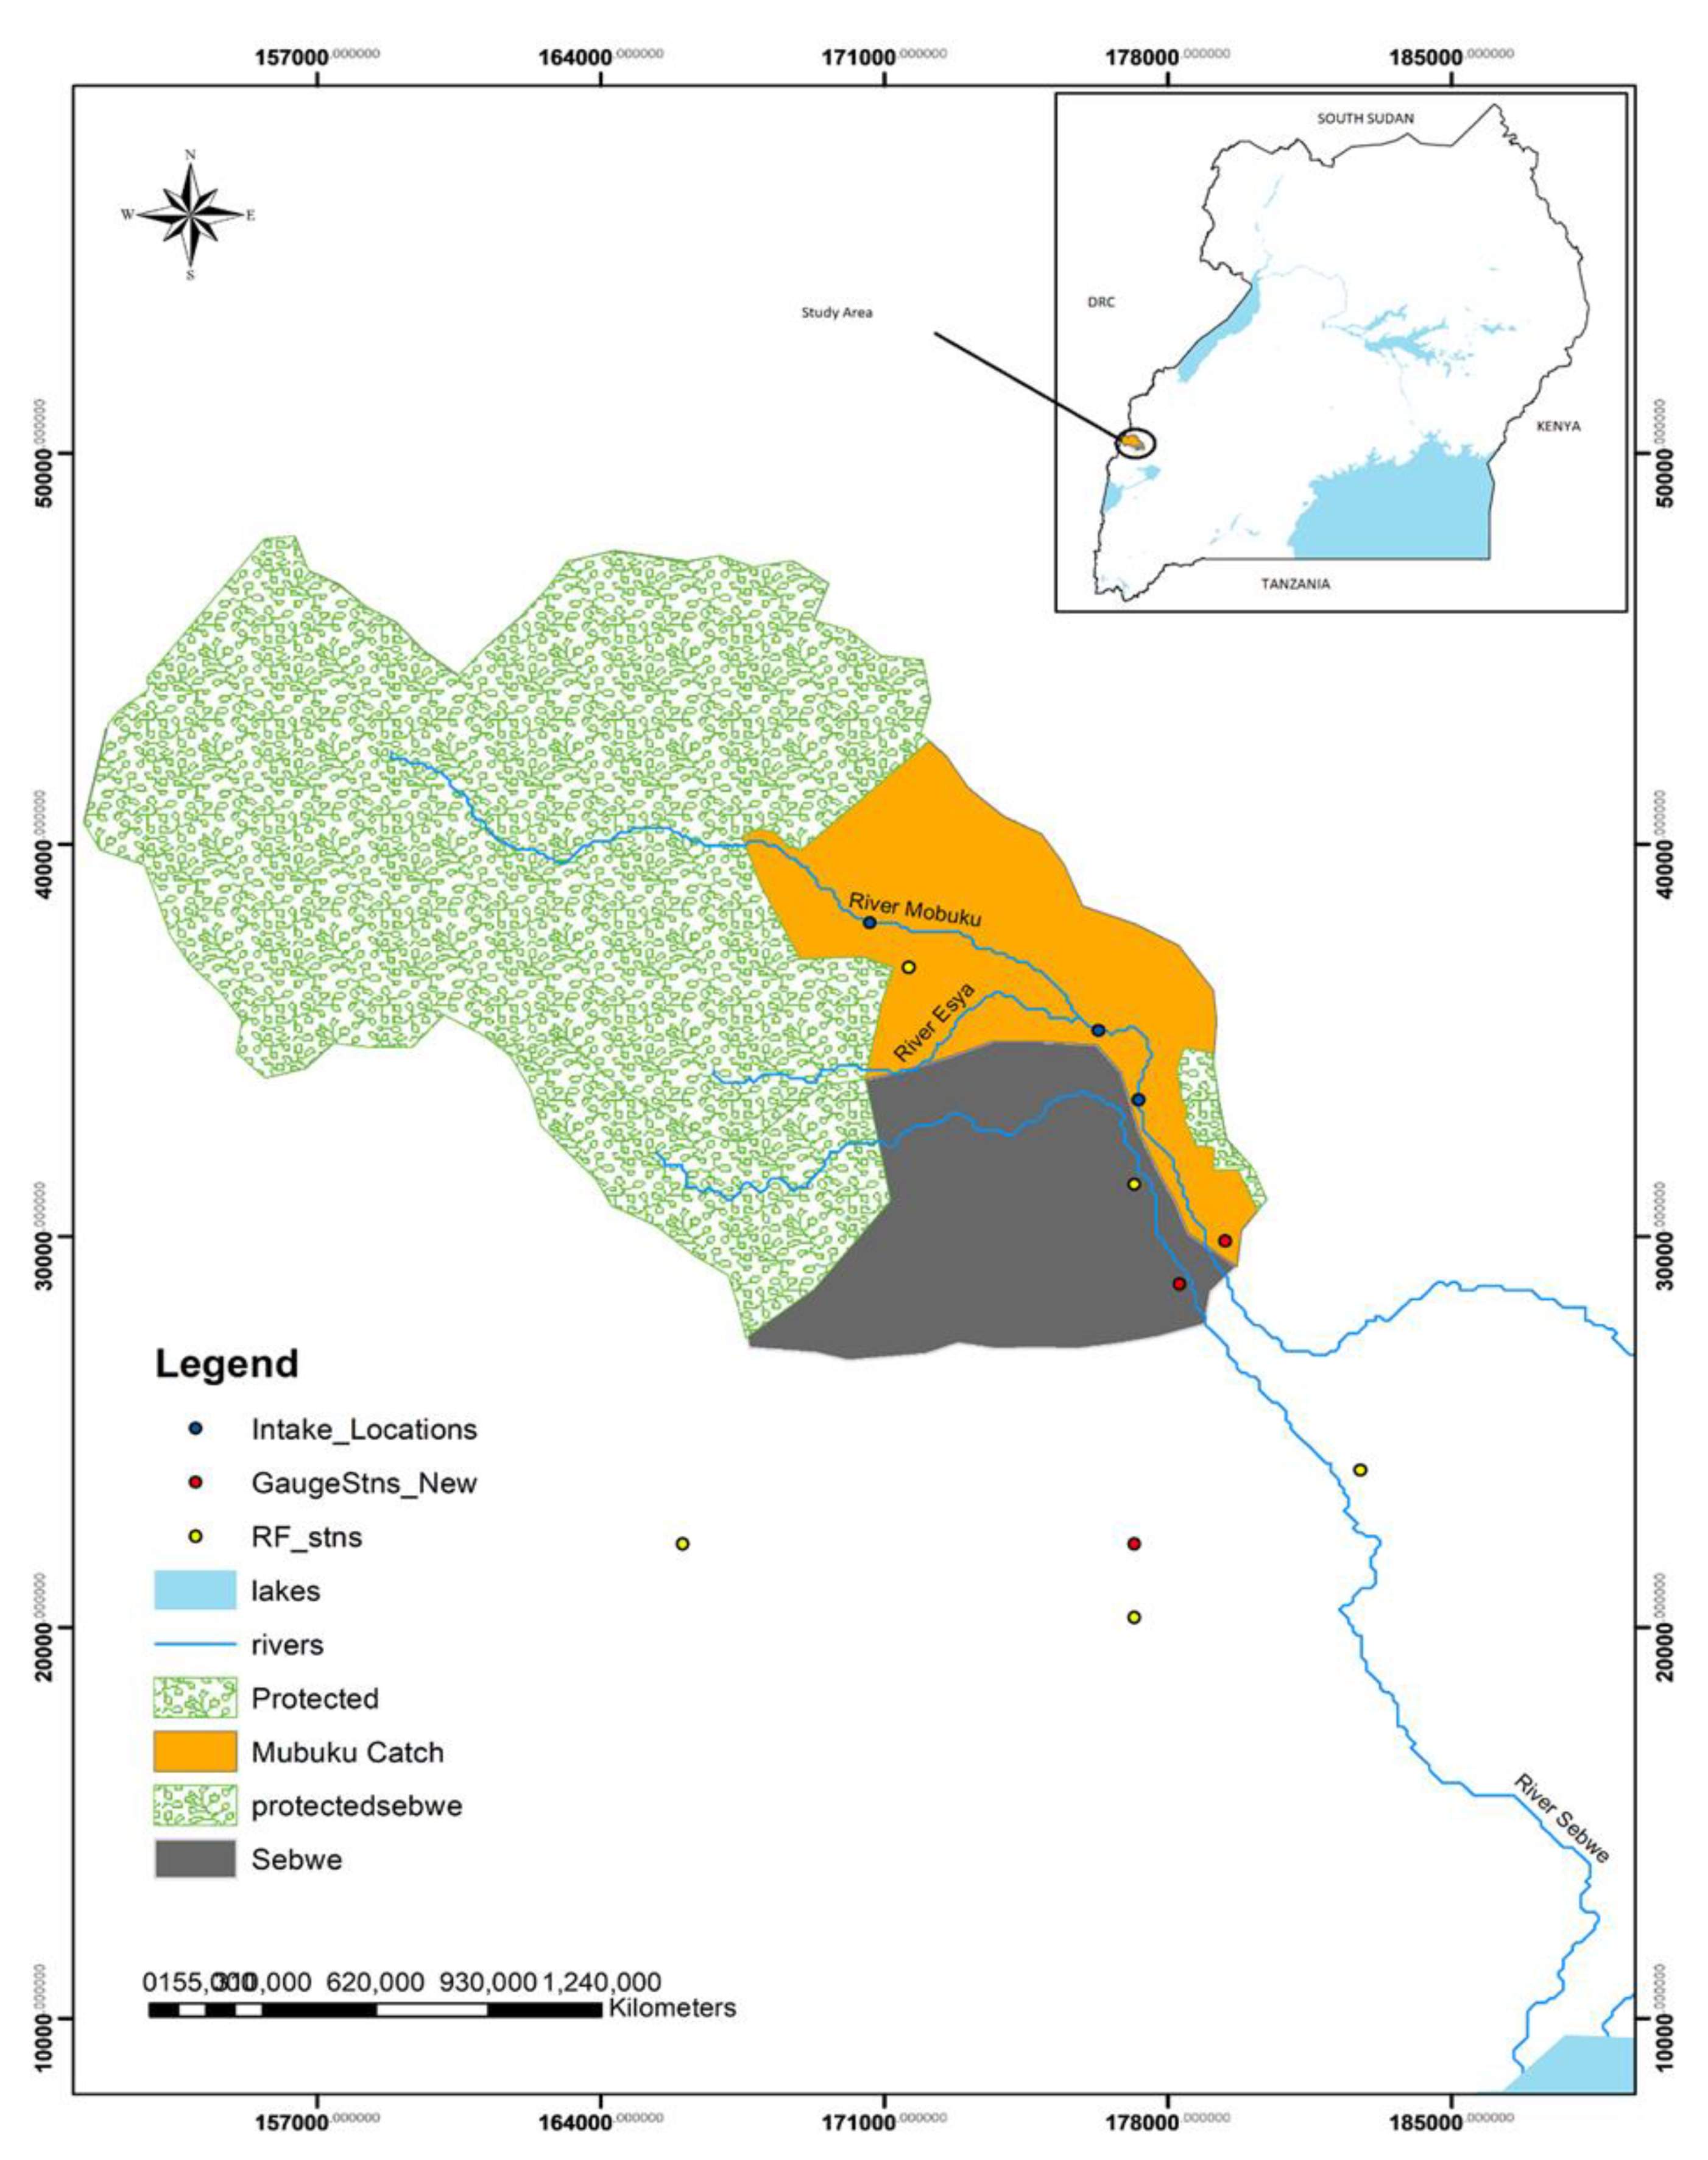
The study area of River Mubuku-Sebwe Sub-Catchments of Lake Edward-George Basin is located in Kasese district, western Uganda. The area lies between latitude 10,000; 50,000 and longitude 157,000; 185,000 (
Figure 1). The catchment area of the study area is about 346 km
2 with the altitude ranging 1074 m to 5109 m above sea level. The highest altitude is formed by the tops of Mountain Rwenzori while, the lowest altitude is in the valley bottom in which the Mubuku and Sebwe Rivers discharge. The main streams of Mubuku and Sebwe Rivers drain into Lake George which is a Ramsar site of international importance and apportionment of water ought to recognize the peculiar requirements of these important ecosystems.
The area has a bimodal rainfall pattern with the first rains during March to May, and the longer rains from August to November. Annual rainfall ranges from less than 800 mm to 1600 mm and is greatly influenced by altitude. Air temperature ranges from 13–35 °C exhibiting very low monthly variation.
Approximately 91% of the catchment area is underlain by metamorphic rocks while 9% is underlain by sediments [
14]. The major soils are brown and reddish brown sandy loams, from a quartzite and granite parent rock [
15].
The sub-catchments have some protected areas including the Rwenzori Mountain National Park, Mubuku Forest Reserve, and part of Queen Elizabeth National Park. The sub-catchments are habitat to several endangered and rare species living in the Albertine Rift and an important bird area. Whilst this represents only a moderate level of species richness, the forest harbors many rare, threatened and endemic species.
2.2. Hydrological Modelling
2.2.1. Rainfall-Runoff Modelling
The hydrological modeller in sub-Saharan Africa is faced with challenges of data scarcity which limits the application of physically based models to simulate water resources in most of the catchments in the region. Local water authorities lack access to discharge stations and data especially during the rainy seasons. They have limited staff and insufficient measurement equipment because of limited funds [
16]. River Mubuku-Sebwe Sub-Catchments also lacked data for. We had to fill some gaps to facilitate modelling.
The NAM (Nedbør-Afstrømnings) Rainfall-Runoff model was applied to gap fill and extend discharge data for the Mubuku and Sebwe sub catchments. NAM is a deterministic, lumped and conceptual model capable of imitating the runoff from the rainfall. The model divides the flow into overland flow (surface flow), interflow (subsurface flow) and base flow. It has a set of linked mathematical statements describing the behavior of the land phase of the hydrological cycle [
17]. The model was found sensible to parameters like, coefficient of overland flow (CQOF), Lmax and CK1K2. The CQOF is an important parameter in modeling since it significantly affects both peaks and low flows [
18]. To estimate the final parameters, the model was calibrated against a time series of hydrological observations which is usually a matter of discharge observations versus runoff model results [
19].
2.2.2. Water Allocation Modelling
Other researchers have studied water allocation with models such as Soil and Water Assessment Tool, Water Evaluation and Allocation Program, REsource ALlocation Model. We selected the basin module of Mike Hydro because it contains a hydropower production component which was key in this study [
20]. The model provides a mathematical representation of the river basin encompassing the configuration of the main rivers and their tributaries, the hydrology of the basin in space and time, reservoirs, existing as well as potential major schemes and their various demands of water [
21]. It has an inbuilt rainfall-runoff model (Mike NAM) and a scenario evaluation tool Nile Basin Decision Support System (NBDSS) and therefore, offers access to data analysis tools, scenario creation and evaluation capabilities [
22].
2.3. Model Input Data
2.3.1. NAM Model Input Data
We acquired historical discharge data for Rivers Sebwe and Mubuku from the Ministry of Water and Environment (MWE)’s Directorate of Water Resources Management, and daily rainfall data for the sub-catchments from Uganda National Meteorological Authority. We gap filled five rainfall stations of Kilembe, Mubuku HEP, Mubuku Prison Farm, Bugoye and Kasese to generate a time series from 1956 to 2015 using Double Mass Curve homogeneity tests and with this continuous data we gap filled and extend discharge data using the model [
18]. Daily evapotranspiration data was obtained from Princeton global dataset (
https://hydrology.princeton.edu/data.metdata_africa.php (accessed on 18 July 2021)). The physical information about the study area such as location, river network, sub-catchments, existing infrastructure, existing water users, and proposed infrastructure were obtained from the MWE offices or captured during the field visits.
Table 1 shows the input data used for this study.
2.3.2. Mike Hydro Model Inputs
The model inputs included climate data (daily rainfall), gap filled daily discharge from NAM model, hydraulic structures data), water demand, reservoir data, and catchment characteristics derived from A 30 m spatial resolution DEM from the Shuttle Radar Topography Mission (SRTM) (data available from the U.S. Geological
Survey-earthexplorer.usgs.gov (accessed on 18 July 2021)) (
Table 2). The continuous discharge for Mubuku and Sebwe, generated from the NAM model, together with daily Potential Evapotranspiration, soil properties, water demands and environmental flow constrained at the most downstream node were used as inputs to evaluate water allocation within the catchments.
2.3.3. Water Demand
The 2015 water demands for irrigation, hydropower, domestic use, industry, livestock, and the environment were computed based on “Water Supply Design Manual” from the Ministry of Water and Environment in Uganda [
23].
Population data from the 2014 population census report [
24] were used to estimate the water demand for domestic use and the livestock population census of 2009 for livestock in Uganda [
25]. Water demand for ecosystem services was provided for as 10% of mean annual flow [
26]. The data about area under irrigation (Ha) and produced power in Megawatts was used to compute water demand for irrigation and hydropower, respectively. Water demand for domestic and livestock populations was projected using the geometric progression method.
Industrial water demand was based on provision for 5.7% and irrigation demand by allowing for expansion of the area under irrigation for Mubuku irrigation scheme from 516 Ha (Phase 1 and 2A) to 996 Ha (Phase 1, 2A, 2B and III). Water demand for hydropower was projected by allowing for expansion of existing plants and incorporating proposed plants developed in 2010.
2.4. Model Set Ups
2.4.1. NAM Model Set Up, Calibration and Evaluation
The NAM model was manually calibrated (1956–1960) and validated (1961–1968) using daily discharge data obtained at the outlet of each sub-catchment. We maintained the fixed model parameters used for calibration period to simulate runoff in the validation period.
Model performance during calibration and validation was evaluated based on four statistical indices, specifically, (a) the Nash-Sutcliffe efficiency (NSE; Nash and Sutcliffe, 1970); (b) observations standard deviation ratio (RSR); and (c) the Percent bias (PBIAS). NSE compares the relative magnitude of squared residuals to the variance of the observed flow. RSR is used to examine the square root of the mean squared difference between the observed and simulated flows. RSR standardizes RMSE using the standard deviation in the observations and PBIAS is to assess the values of residuals to the observed flow from the gauging stations. NSE ranges from 0.0 to 1.0, with 1.0 being the perfect fit between simulated and observed variable. The optimal value of PBIAS is 0.0, with low-magnitude values indicating accurate model simulation. The lower RSR, the lower the RMSE, and the better the model simulation performance. The optimum value for RSR is 0 indicating zero RMSE or residual variation and therefore, perfect model simulation.
2.4.2. Mike Hydro Set Up
The model builds on a network model constituted by three basic elements; catchments, reaches and nodes. Users input demand nodes, supply infrastructure, and natural water availability to model water availability at the catchment level. Water is allocated across competing demands based on a defined prioritization level. The output of the model includes spatially defined water shortage estimates by demand [
21]. A schematic diagram (
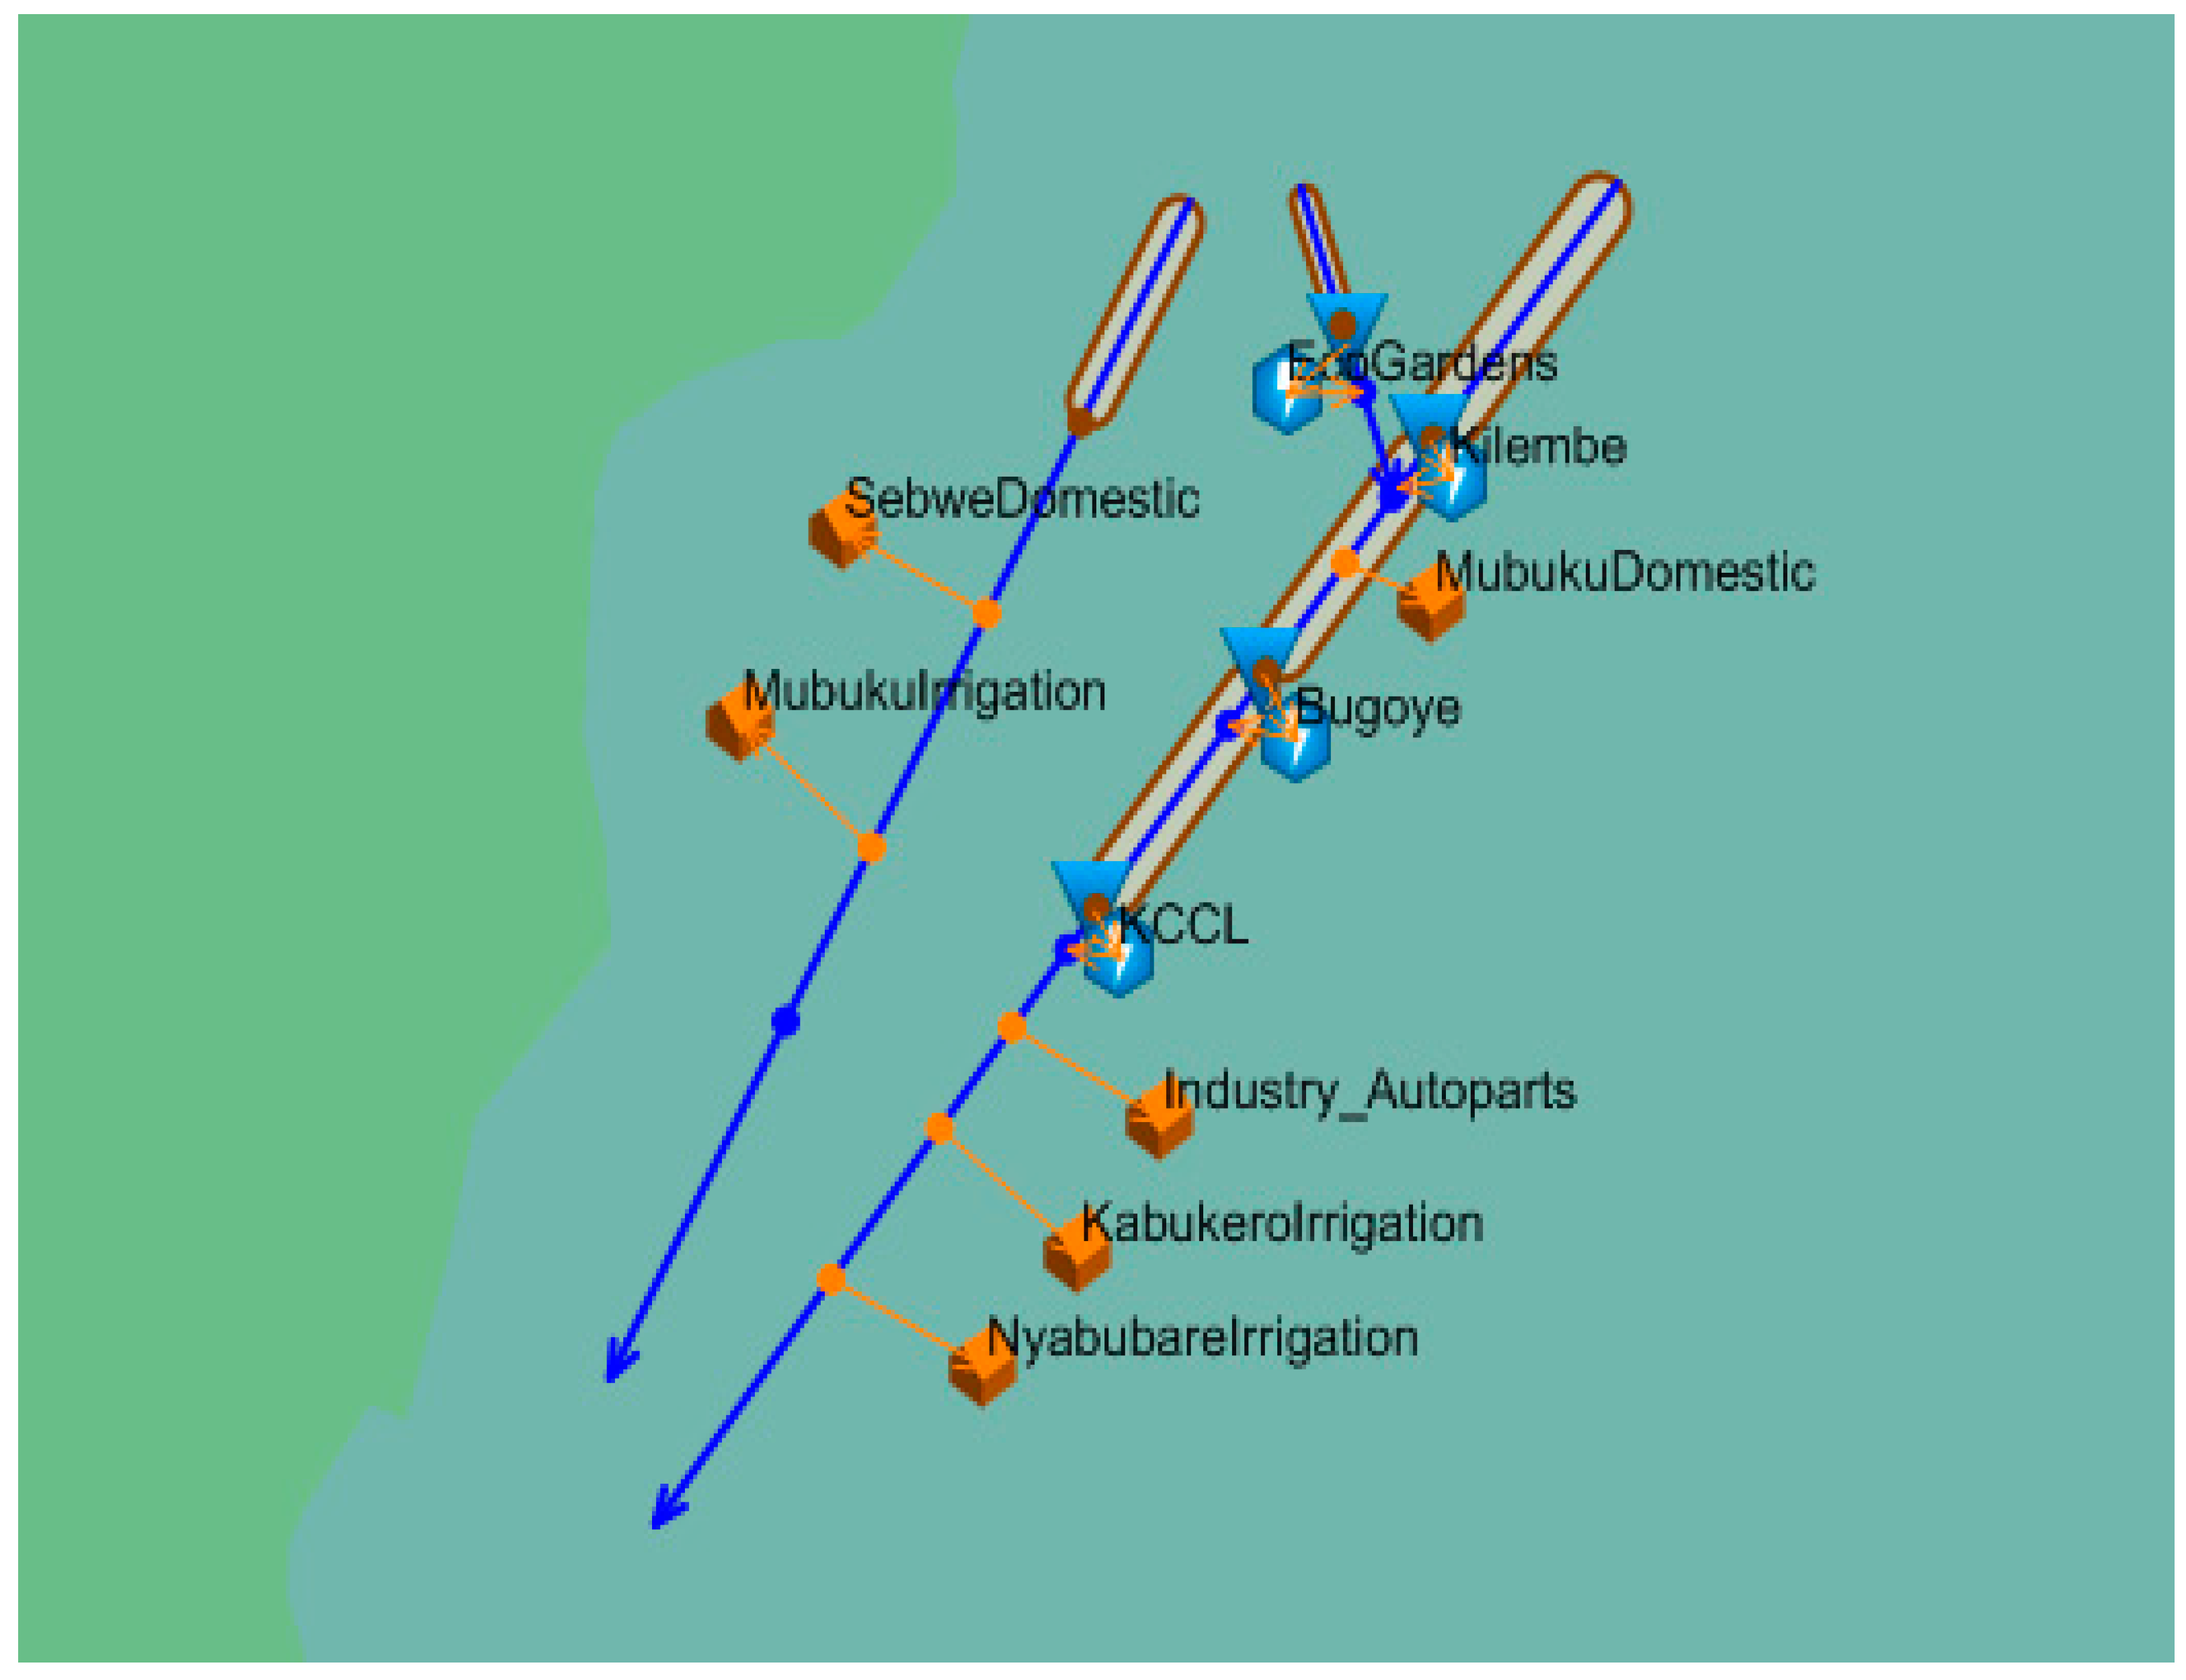
Figure 2) was developed with the river network, reservoirs and abstractions for regular and irrigation users. This was populated with the Mubuku-Sebwe catchment characteristics and hydro-meteorological data as time series or tables. There was no need to calibrate this model since input data was from an already calibrated NAM. The model was then simulated for the three (baseline, future at full capacity and future with management) scenarios and the results analyzed for seasonal or whole time deficits or surplus.
2.4.3. Water Allocation Scenarios
Three water allocation management scenarios (i) Baseline Scenario (Sc00) based on computed water demands for the year 2015 (ii) Future scenarios (Sc01) based on projected water demands for the year 2040 and hinges on Uganda Vision 2040 [
27] and (iii) Reliable water allocation (Sc02) based on prioritization [
21] were analyzed and evaluated in the Nile Basin Decision Support System (NBDSS) to identify the option that presented highest reliability and minimum deficits. In this study, reliability is defined as the percentage of demand met.
2.4.4. Future Water Availability in the Study Area
The calibrated and validated NAM model was run to generate continuous daily discharge time series for Mubuku and Sebwe from 1956 to 2015. The projected water availability in the study area was computed for the period of 2016–2040 using the projected daily rainfall for the study area. An ensemble mean of 29 downscaled GCM was obtained from the AgMIP team in Uganda to make projection of available water in the study area for 2040. This provided the projected weather data for Kasese which was used to project the Mubuku and Sebwe rainfall up to 2040 using DMCs. With the potential rainfall time series, the model was employed to generate the potential discharge in the study area for the projection period.
Only near- future (2016–2040) was considered in this study and the 1985–2015 period was taken as a reference period (baseline). The near-future climate scenario of precipitation and temperatures was generated from 29 GCMs using the procedures described in the Guide for Running AgMIP Climate Scenario Generation Tools with R [
28]. These GCMs were sourced from the Coupled Model Intercomparison Project 5 (CMIP5). The Simple Delta Method was used for statistical downscaling of the GCMs since it preserves the historical patterns of the gridded observations [
29]. The near-future climate scenarios were analyzed for one Representative Concentration Pathways (RCPs) greenhouse gas (GHG) emission scenarios: RCP 8.5, a catastrophic scenario representing high GHG concentration levels [
30]. An ensemble mean of the rainfall and temperature were generated from the 29 models to simulate the projected water availability in the study areas.
3. Results
3.1. Model Calibration and Validation
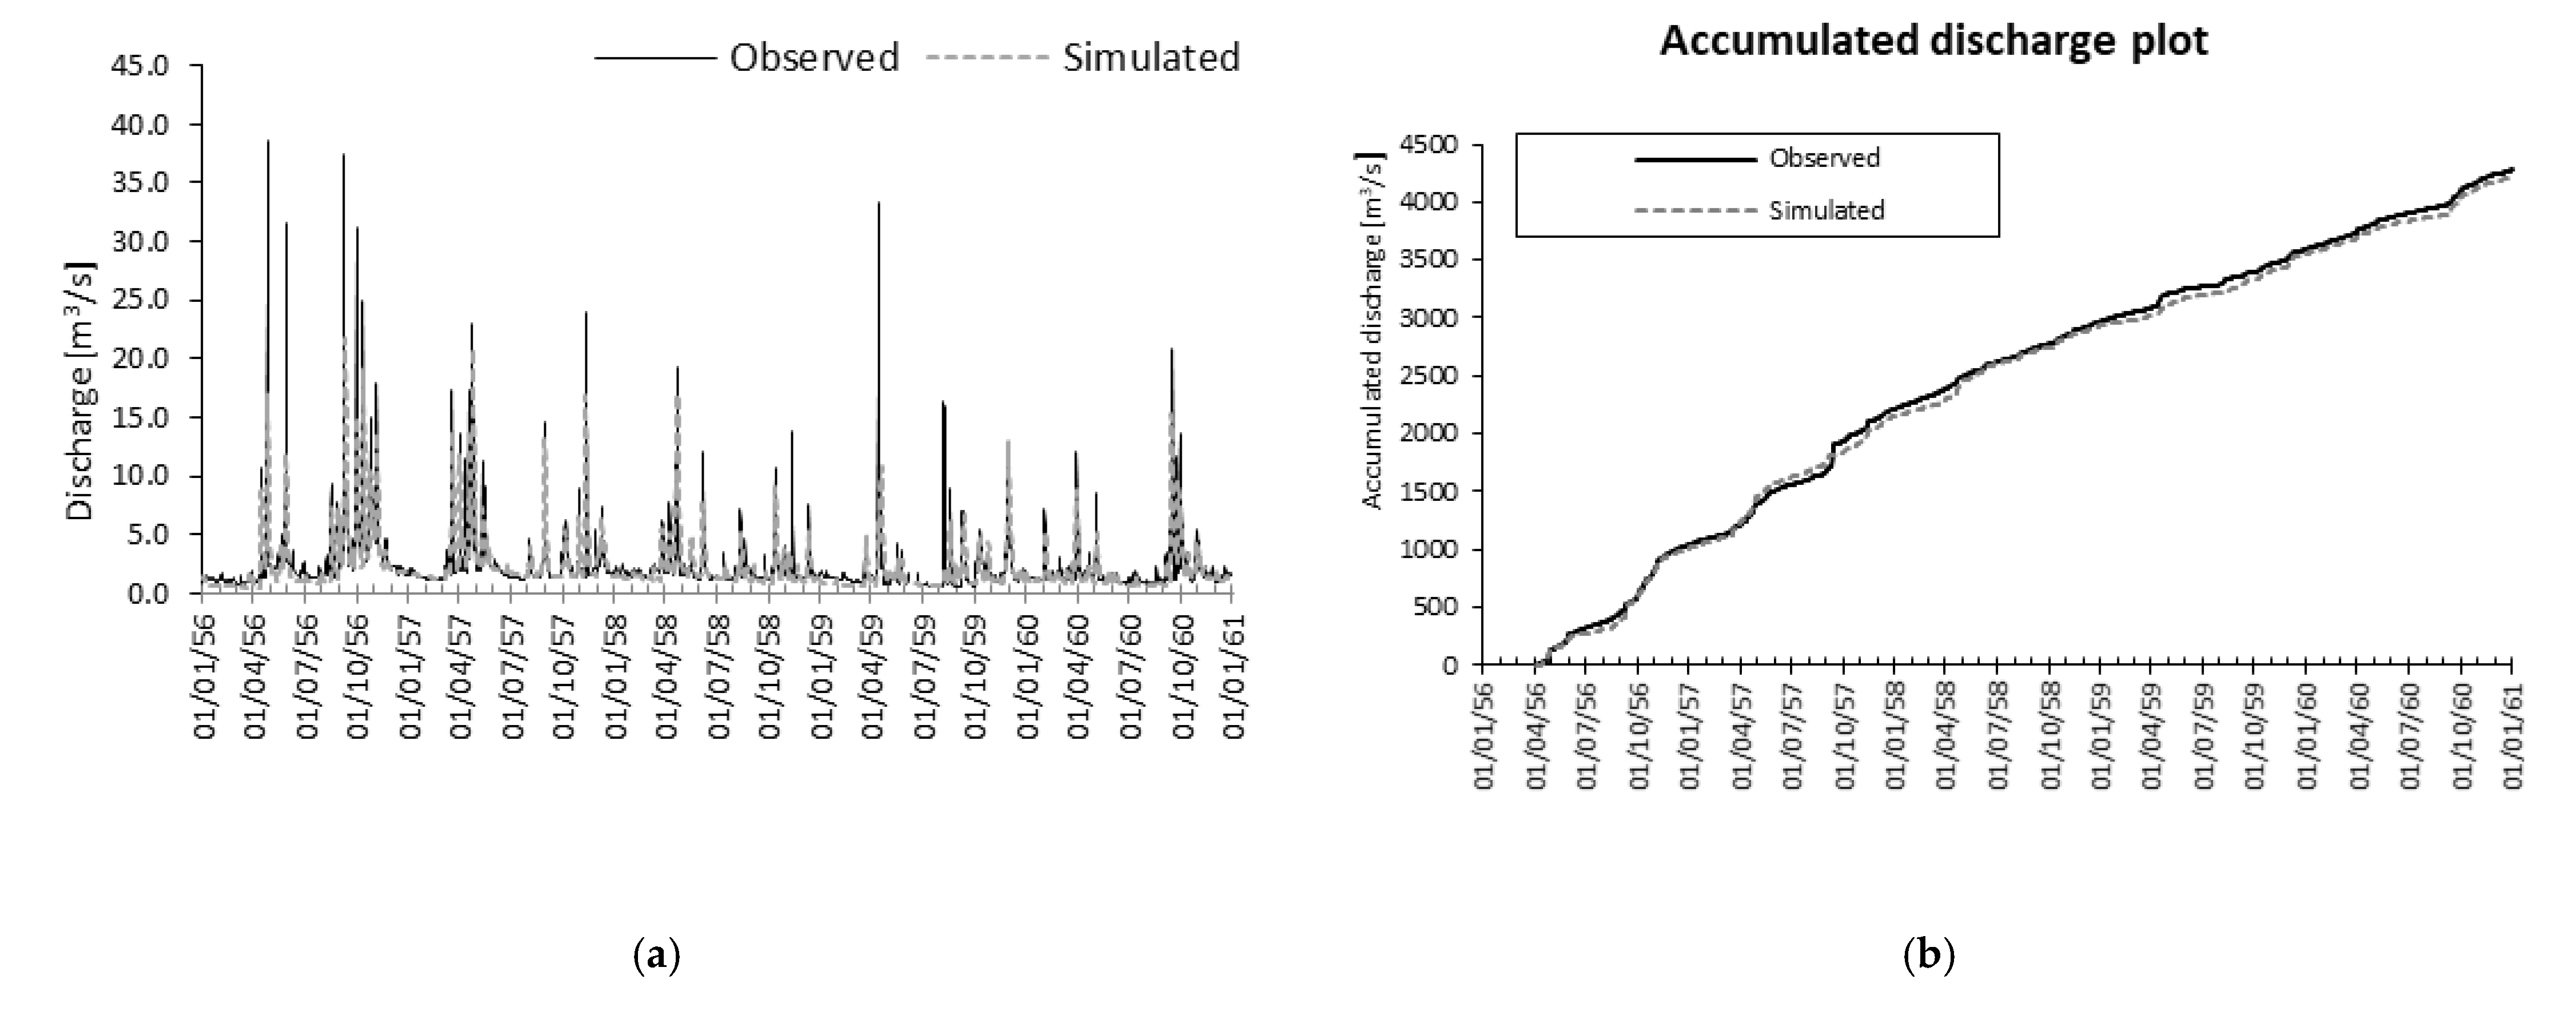
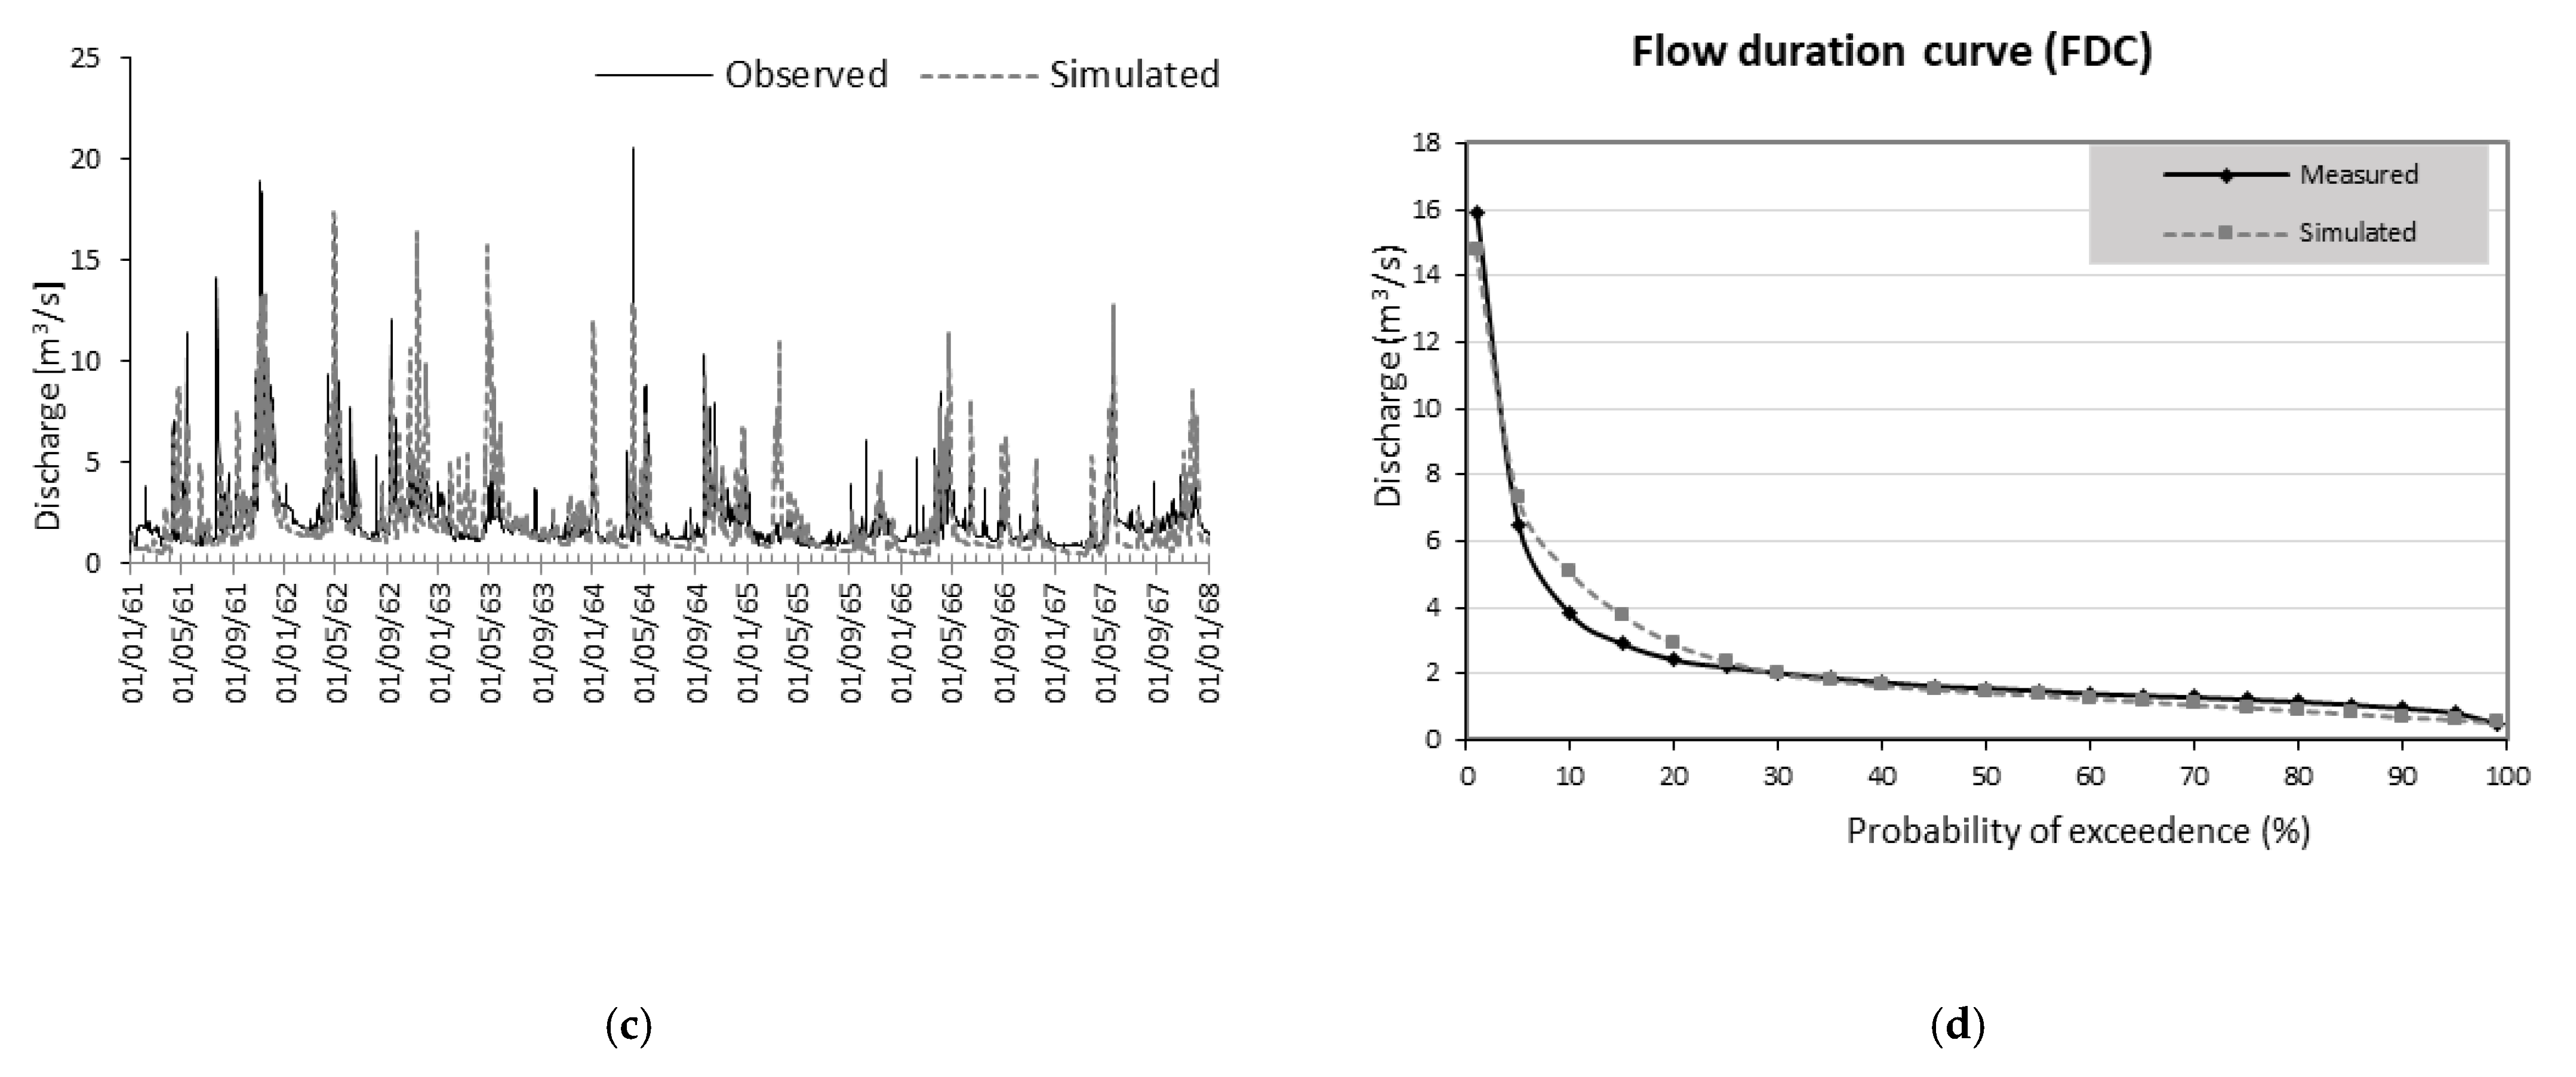
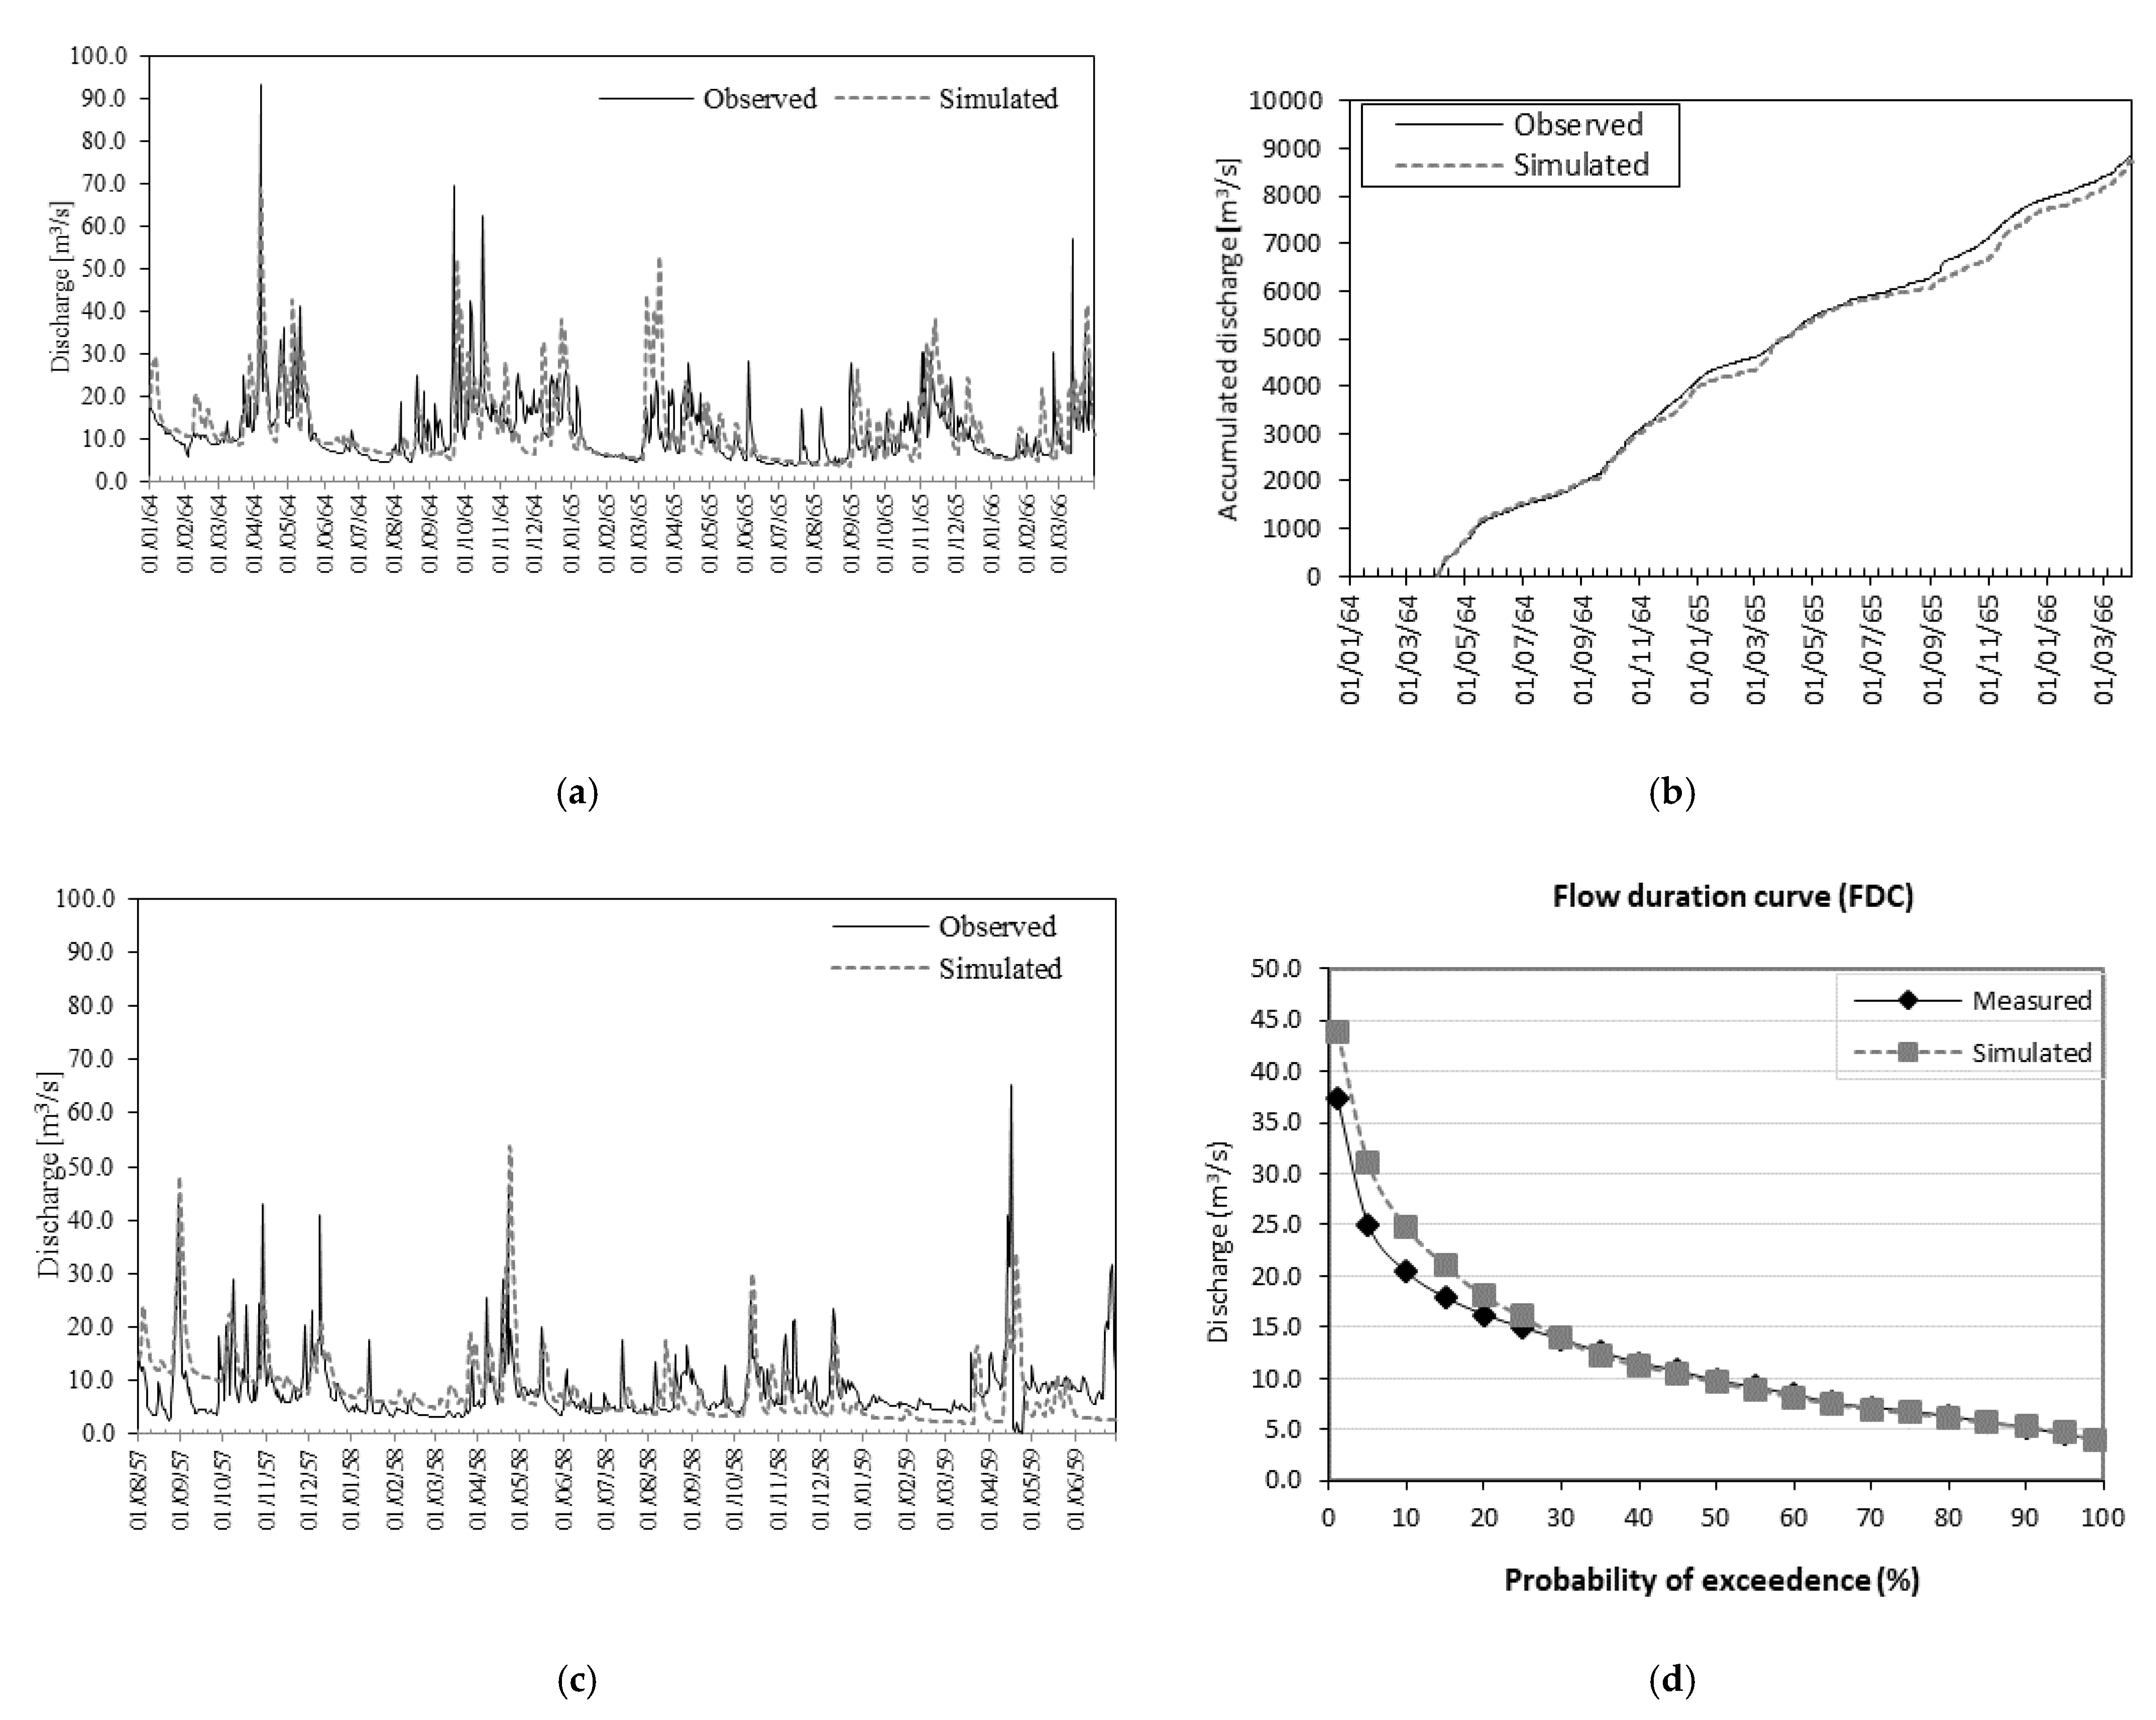
Table 3 shows the model quality measures obtained from calibration and validation at daily time steps for stream flow for all the gauging sites for the two sub catchments.
Figure 3 and
Figure 4 present the comparisons between the simulated and observed stream flows. The predictive performance of the model is considered to be satisfactory for stream flow calibration and validation for Mubuku sub catchment, with NSE values greater than 0.5. Despite the fact that the predictive values at the outlet of the Sebwe sub catchment were slightly lower than 0.5 during calibration and validation period, the model produced acceptable simulation results. The positive values obtained for the PBIAS indicator for all the sub catchments indicate that the model underestimated the stream flow. Therefore, the calibrated and validated model was fit to simulate future stream flow under climate and different water allocation management scenarios for the two sub catchments.
3.2. Projected Climate Change
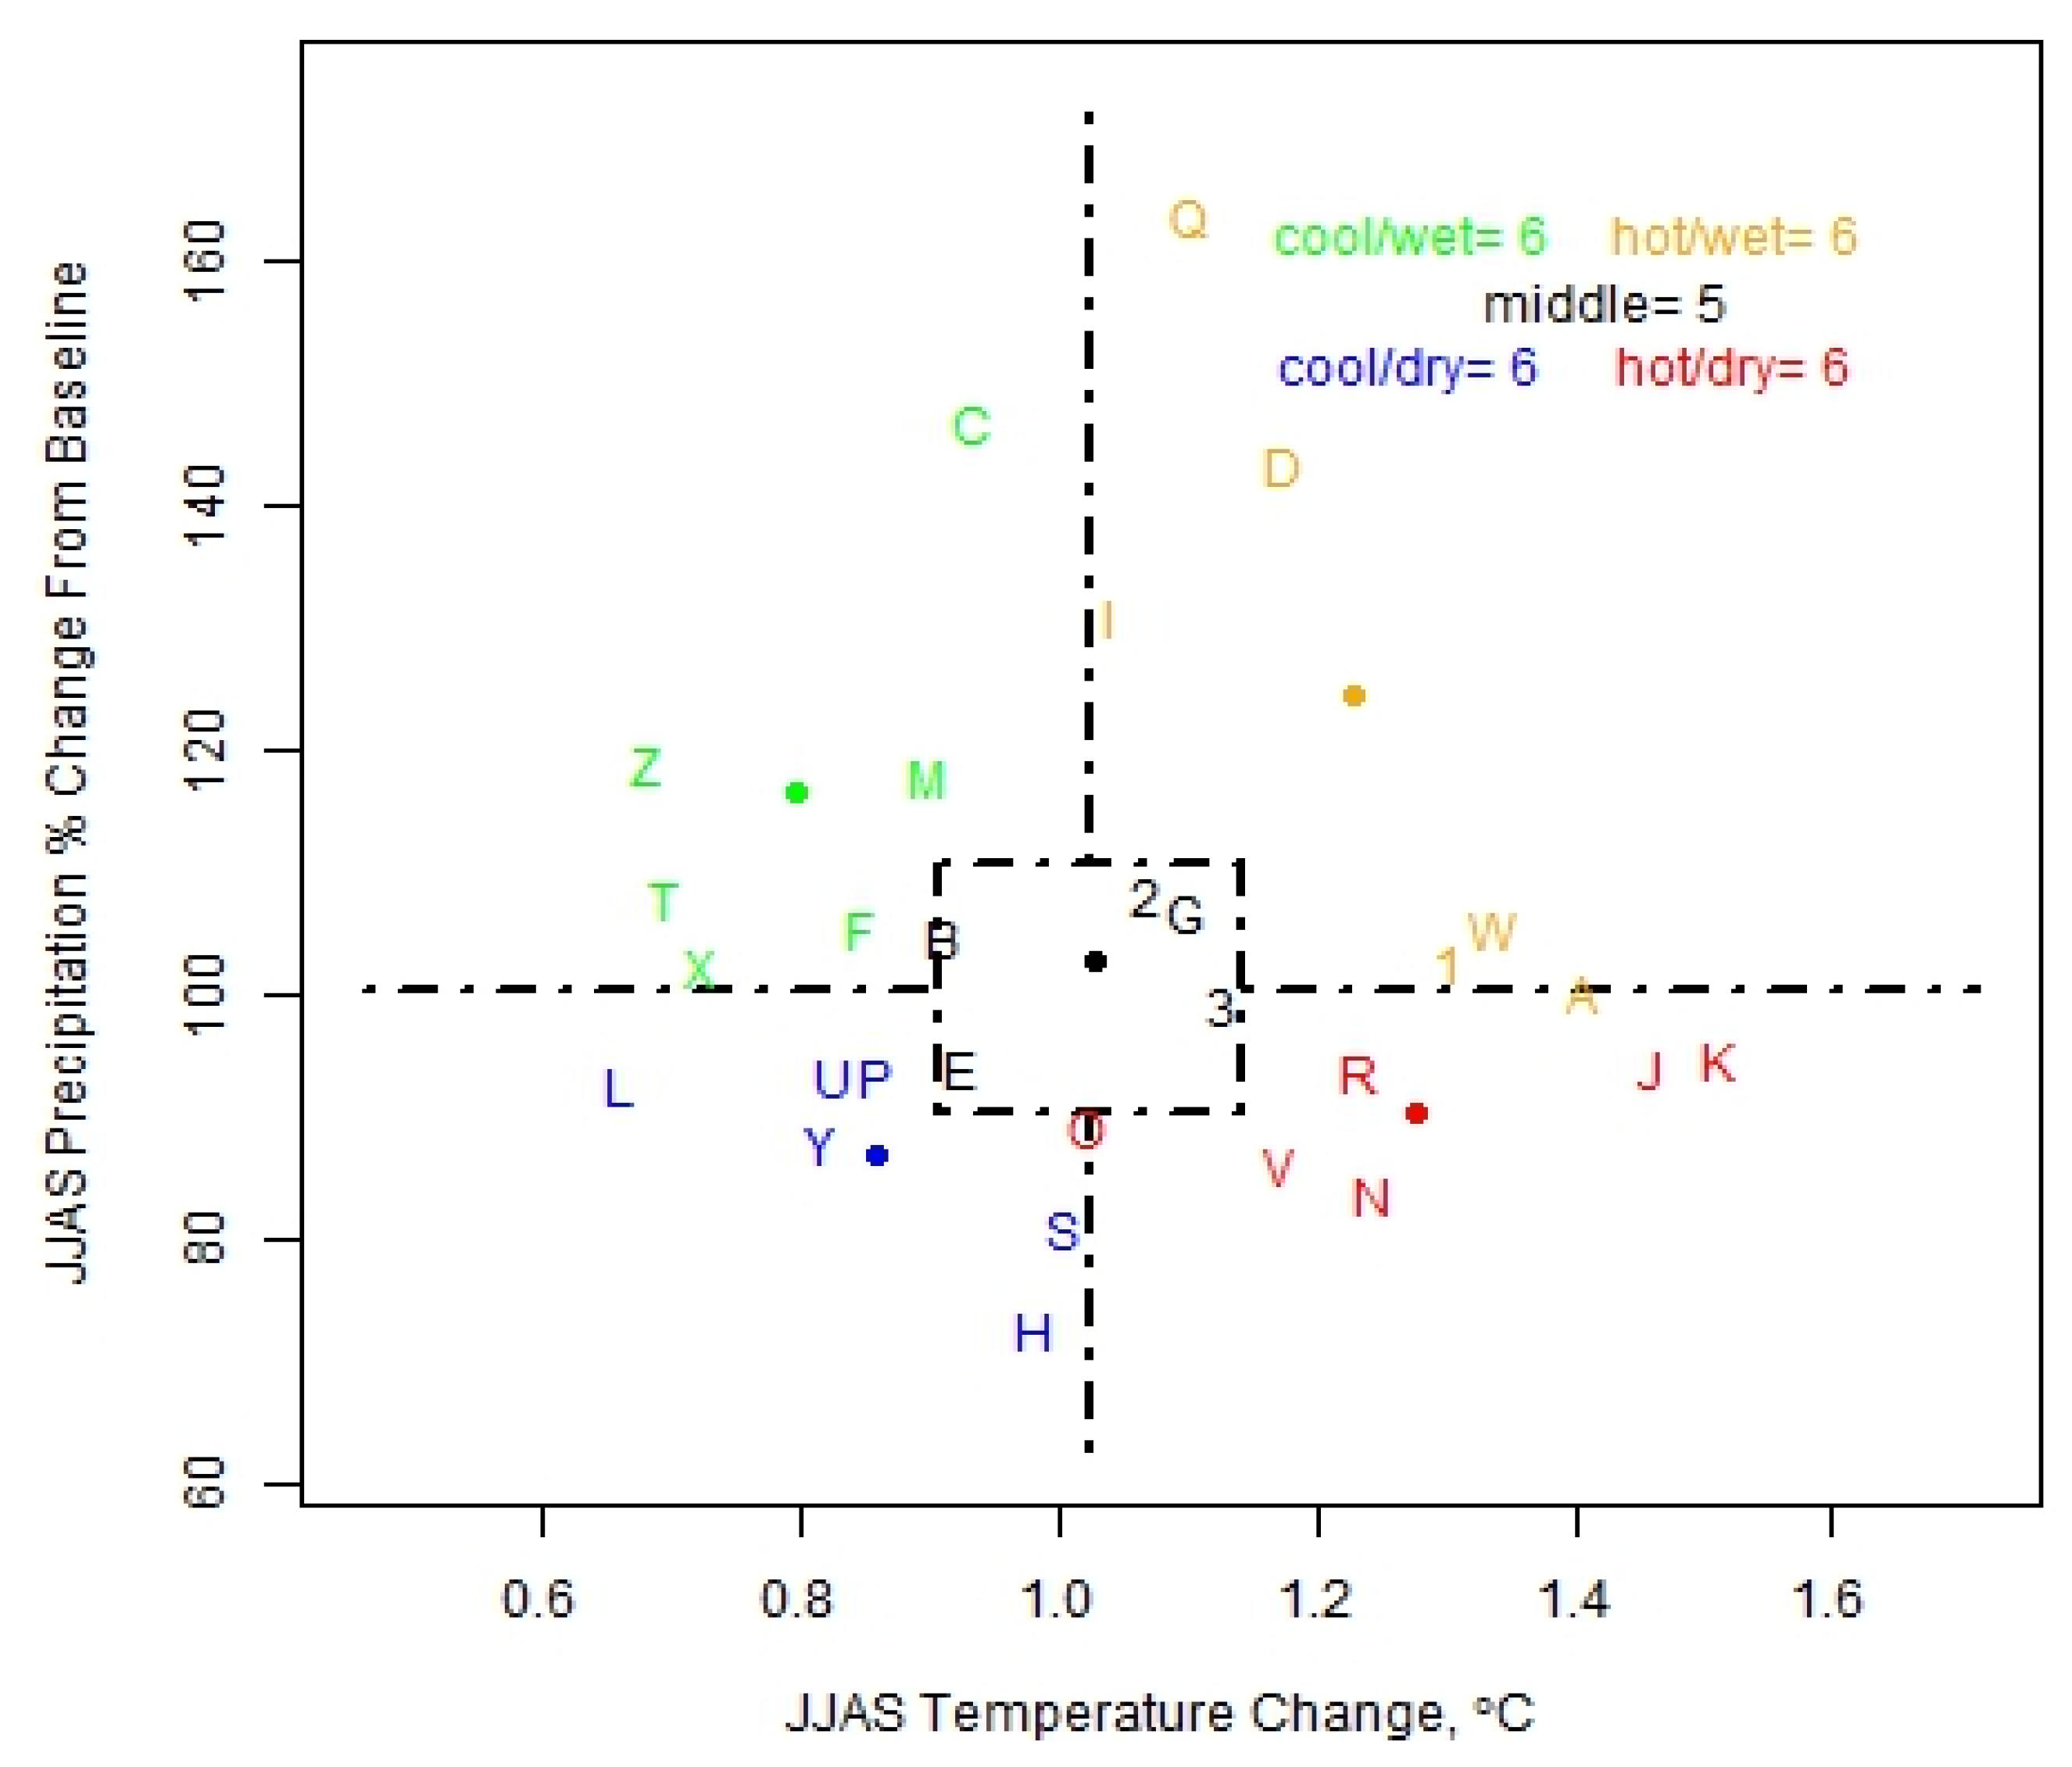
Figure 5 shows the percentage precipitation and temperature changes for the 29 downscaled GCMs for RCP 8.5 in the near future (2010–2039). Most of the models predict slightly high variation in precipitation for the different temperature changes. The majority of the GCMs are relatively close to the ensemble mean; 40.0% for RCP 8.5.
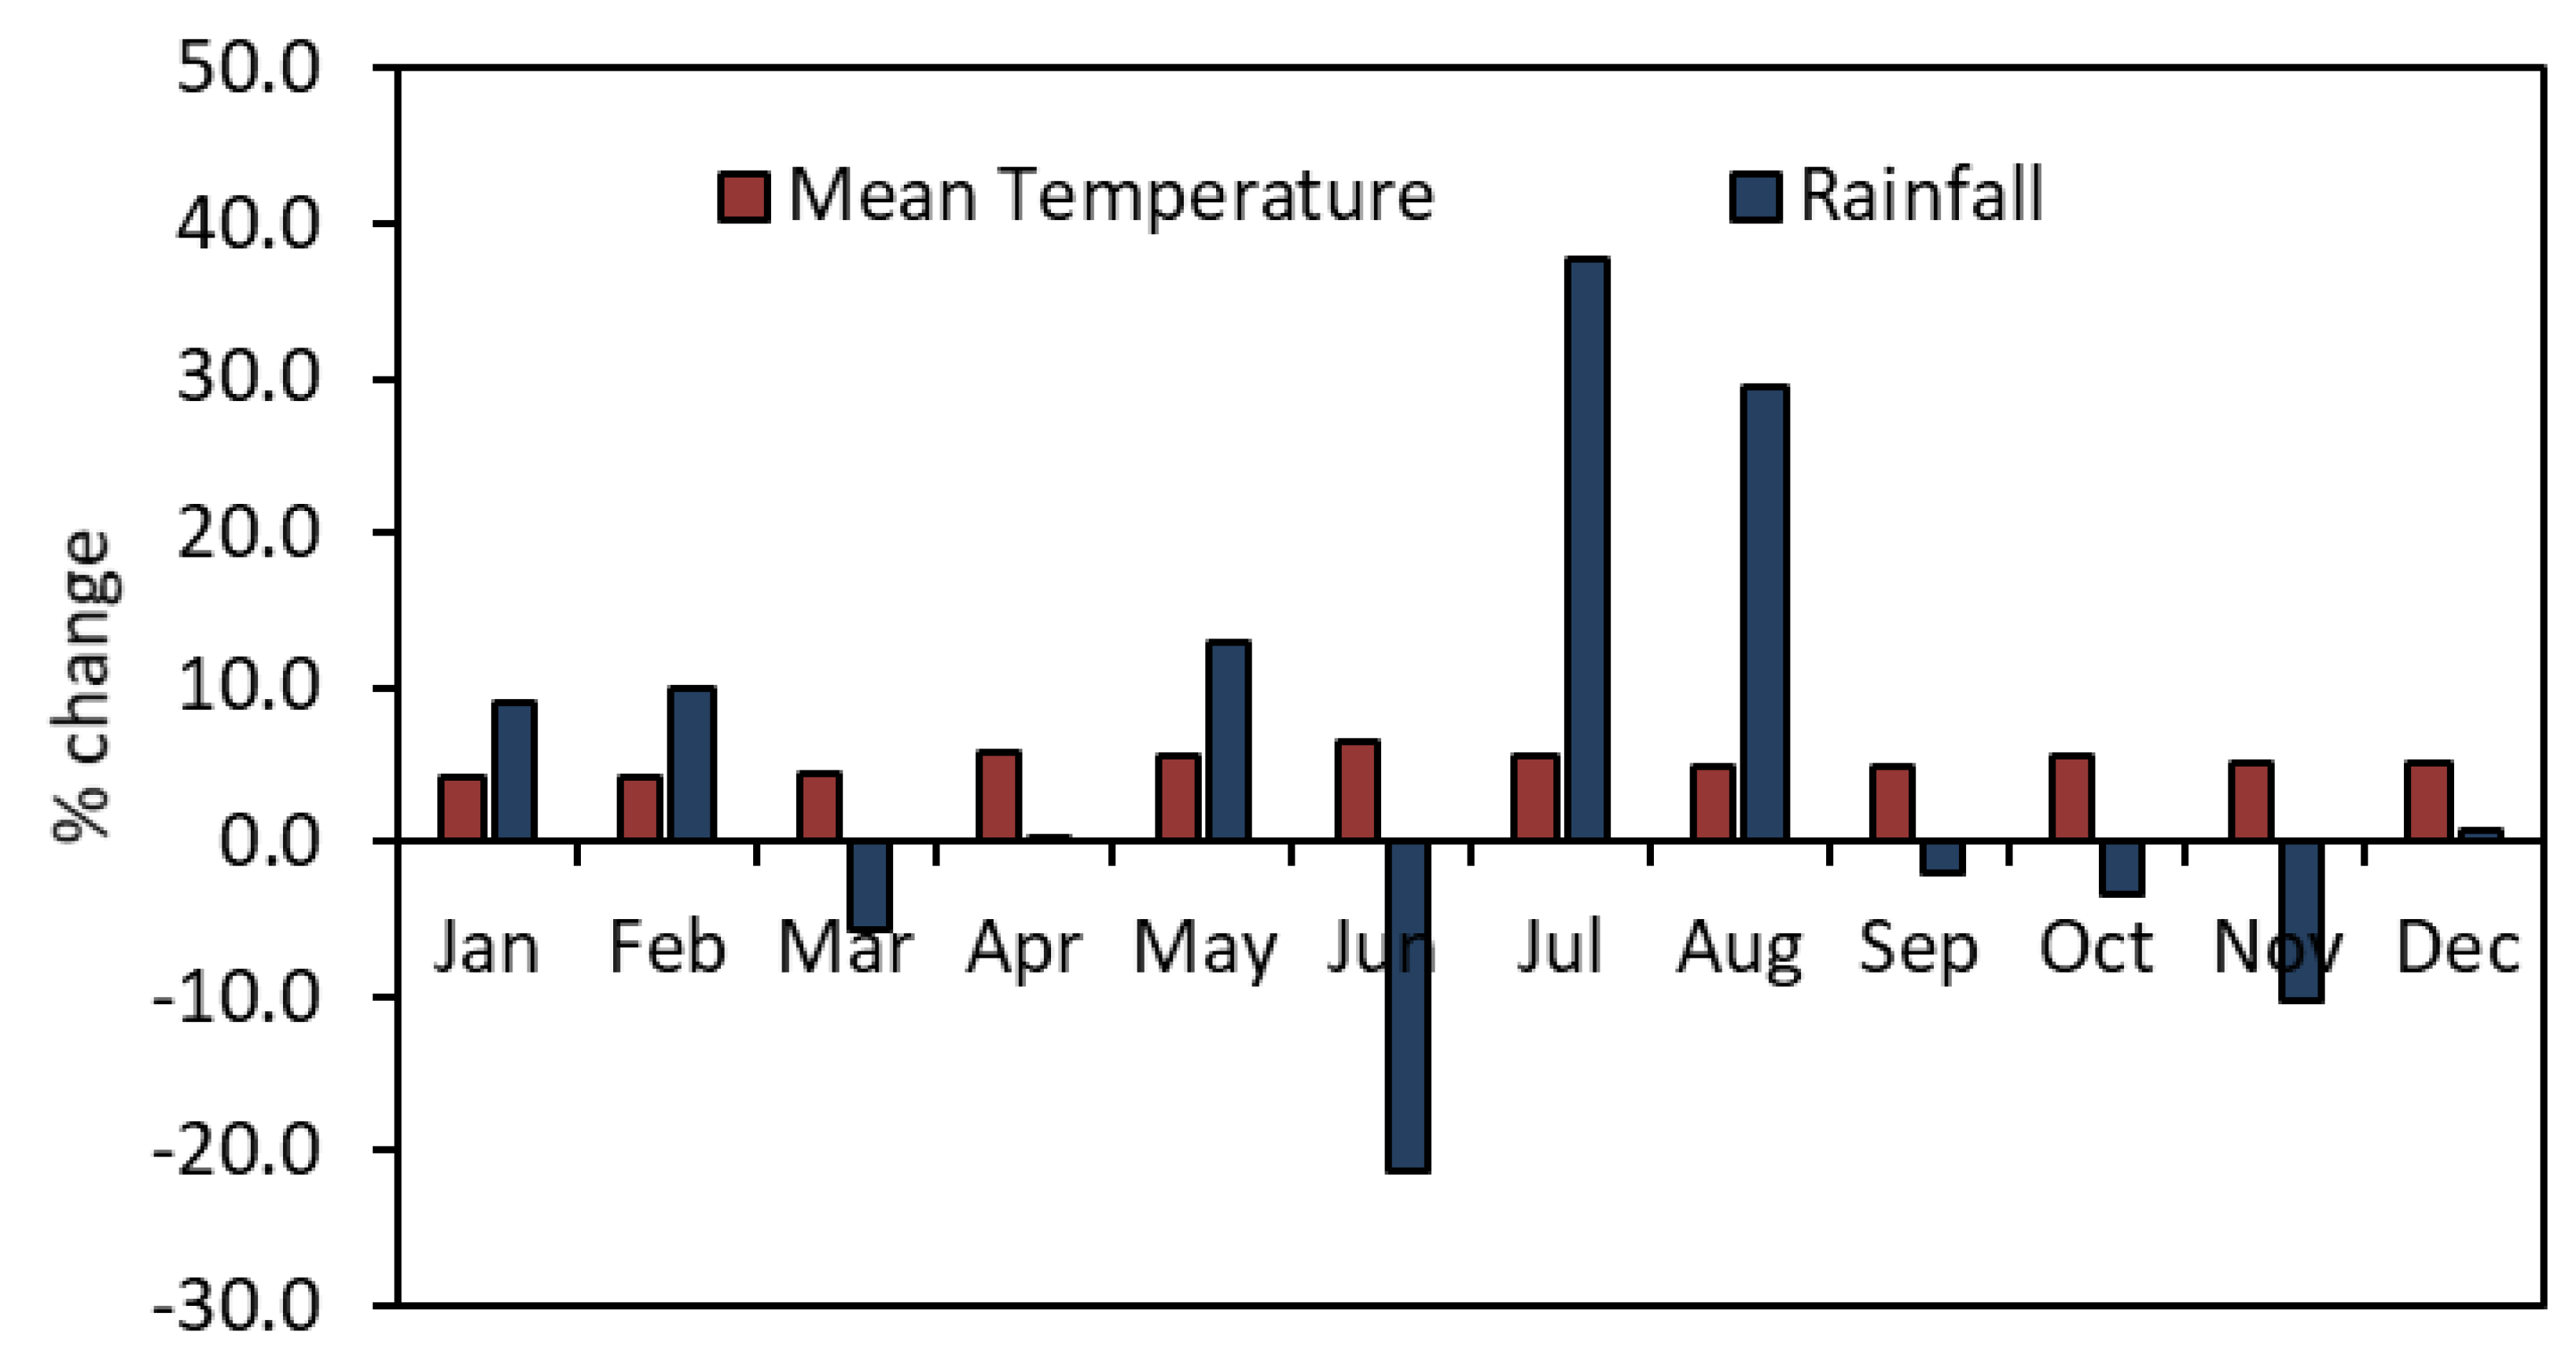
Figure 6 displays the climate change signal of temperature and rainfall for the models ensemble mean by comparing the historical runs with projections based on RCP8.5 scenarios in a monthly time resolution. The change in temperature generally shows a clear trend of rising temperatures between 4.1% and 6.4%, with the highest increase in April, June and October. Precipitation shows both positive and negative change throughout the year. The highest increase in precipitation occurs in July with 37.7% (13.3 mm) and the highest decrease is −21.3% (−9.8 mm) in June. Therefore, unlike temperature which show a clear trend in change, precipitation shows a complex trend especially in the dry months of June, July and August. Annually, precipitation is projected to increase by 1.6% (17.2 mm) and mean temperature is also expected to rise by 5.1% (1.1 °C) by 2040 compared to the reference period in the study area.
3.3. Projected Water Availability
Table 4 shows average monthly flow for Sebwe and Mubuku in 2015. The mean annual water volume available in the Mubuku and Sebwe sub catchments was 365 and 60 MCM per annum, respectively. For Sebwe, the lowest average flow was 0.95 ± 0.41 m
3/s occurring in February and the highest 3.07 ± 1.97 m
3/s in April. This represents approximately 2.29 and 7.94 MCM per annum, respectively. Like Sebwe, the lowest mean flow for Mubuku occurs in February and the highest in April with 6.46 ± 2.65 m
3/s and 17.60 ± 8.91 m
3/s respectively. This flow translates to approximately 15.64 and 45.61 MCM per annum.
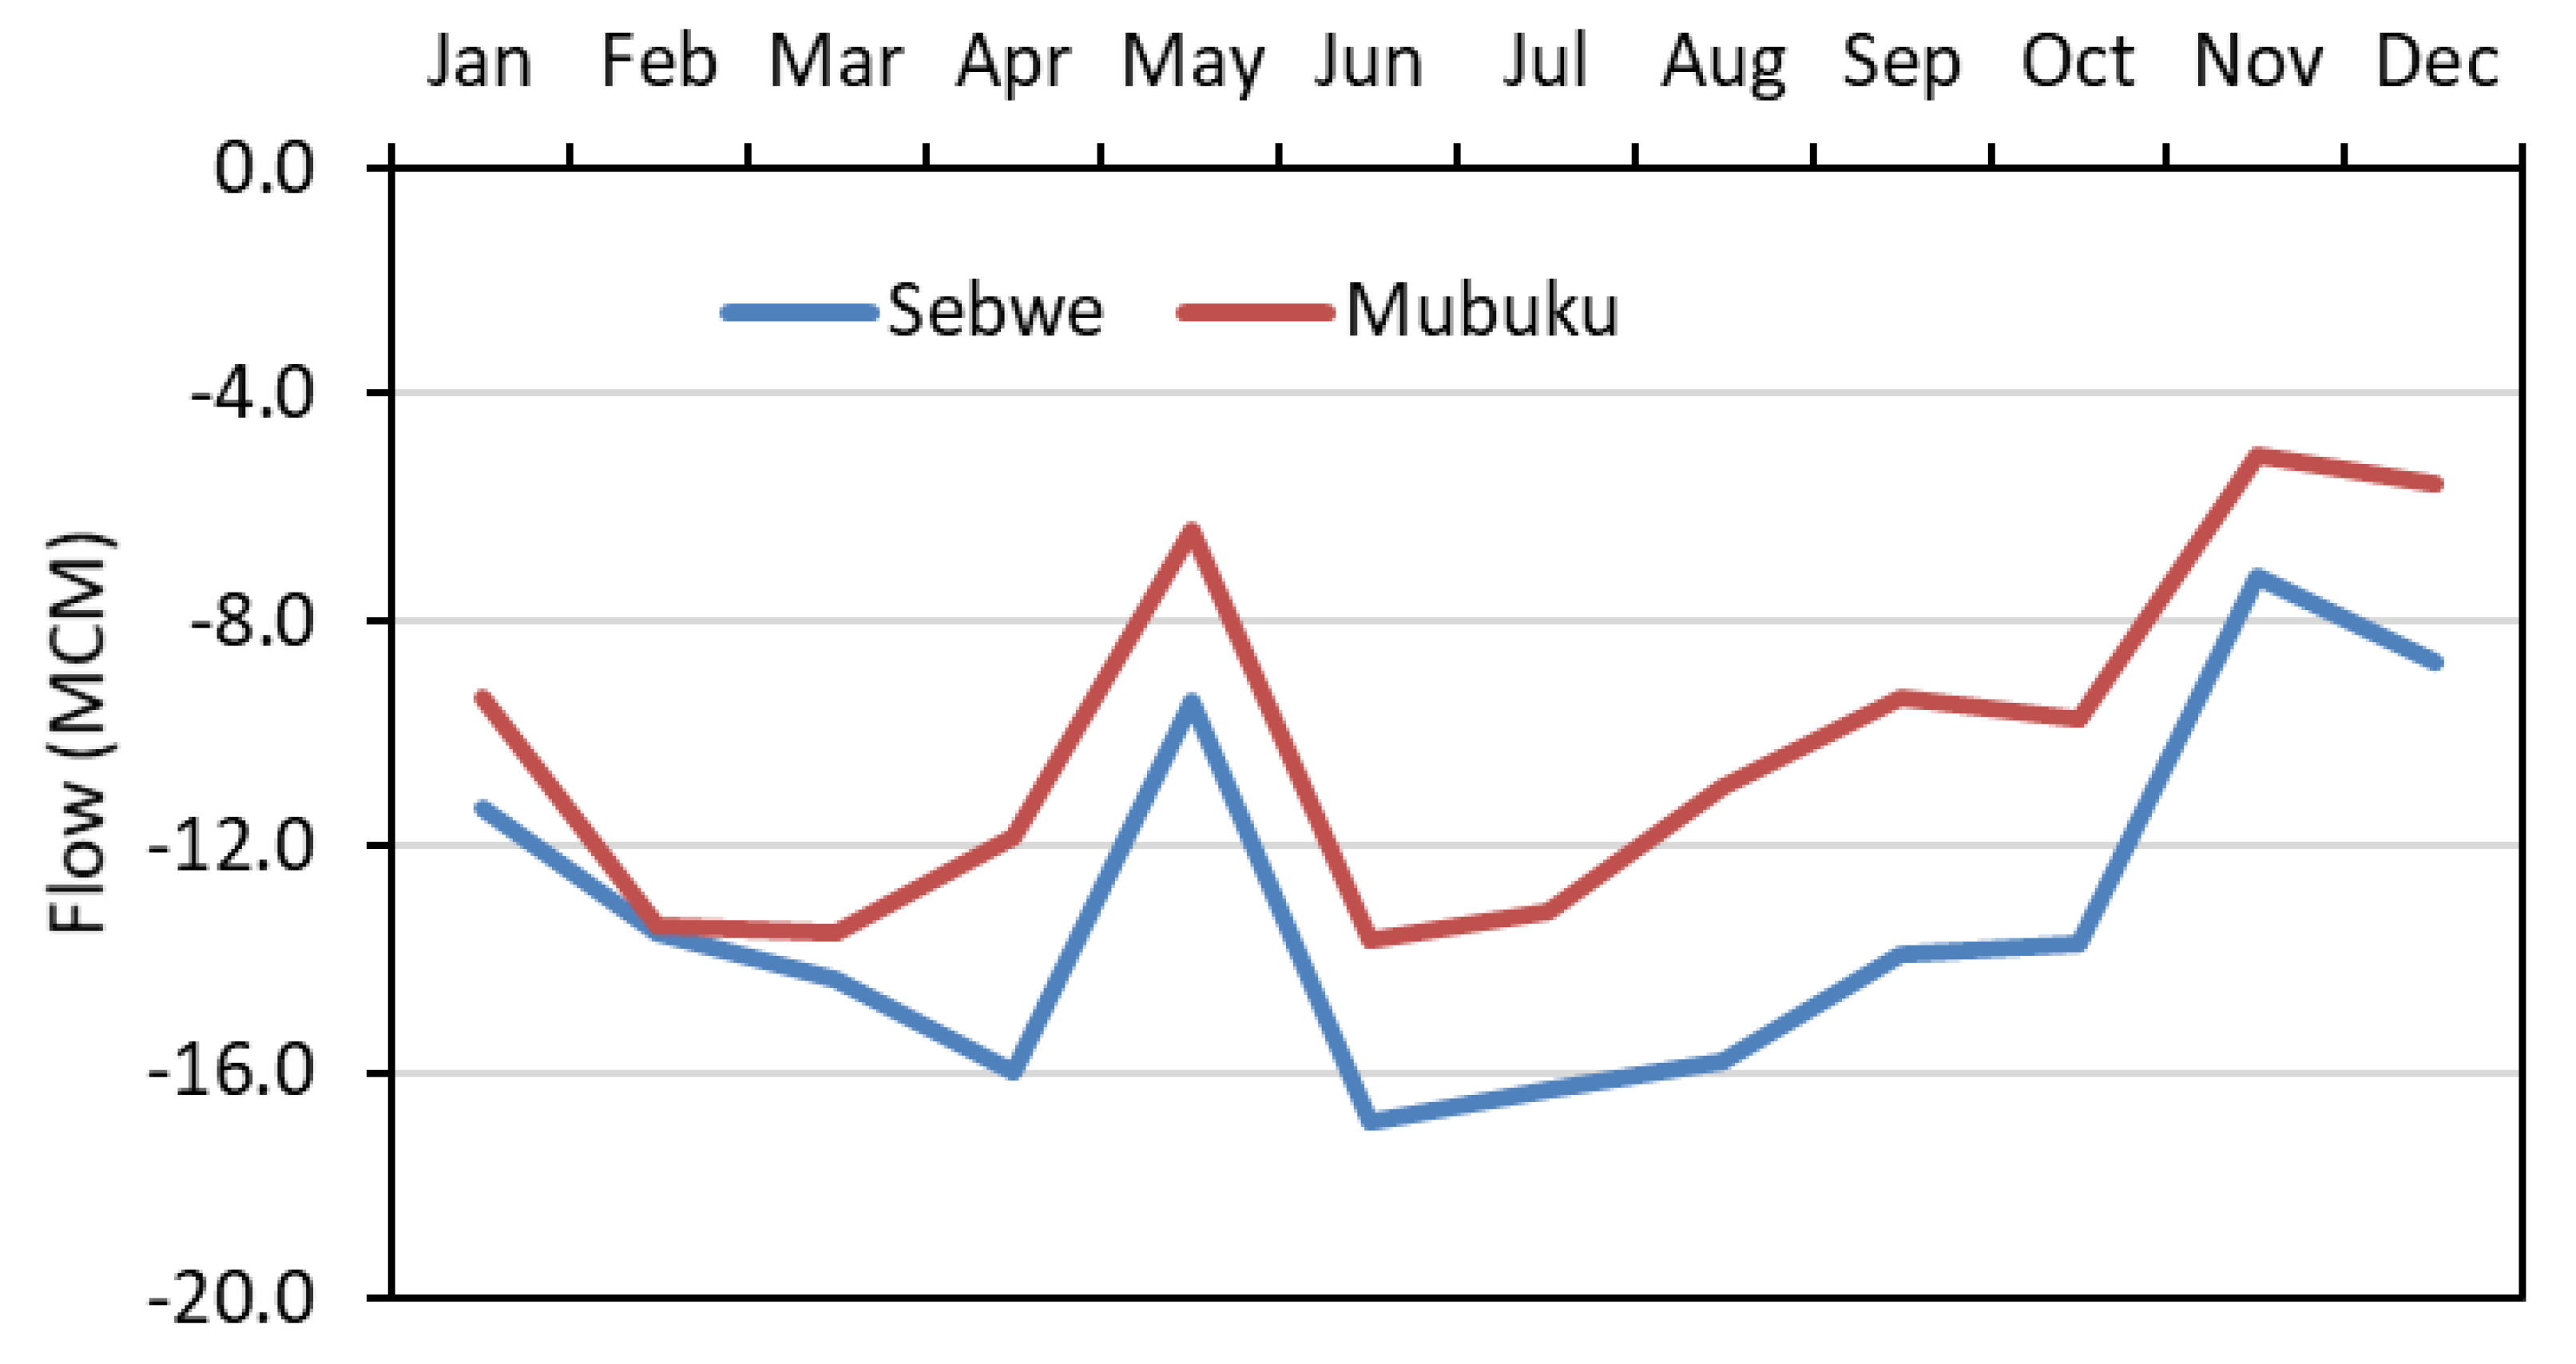
Mubuku water demand increases from 5.2 to 10.7 MCM in 2015 to 2040, respectively. Sebwe water demand increases from 9.7 to 22.1 MCM in 2015 to 2040, respectively. However, the available water falls from 364.8 to 329.8 MCM for Mubuku and from 60.0 to 52.4 MCM in Sebwe in 2015 and 2040, respectively (
Table 5). The highest projected decline in available water will be expected in the months of April, June and July for both sub catchments (
Figure 7).
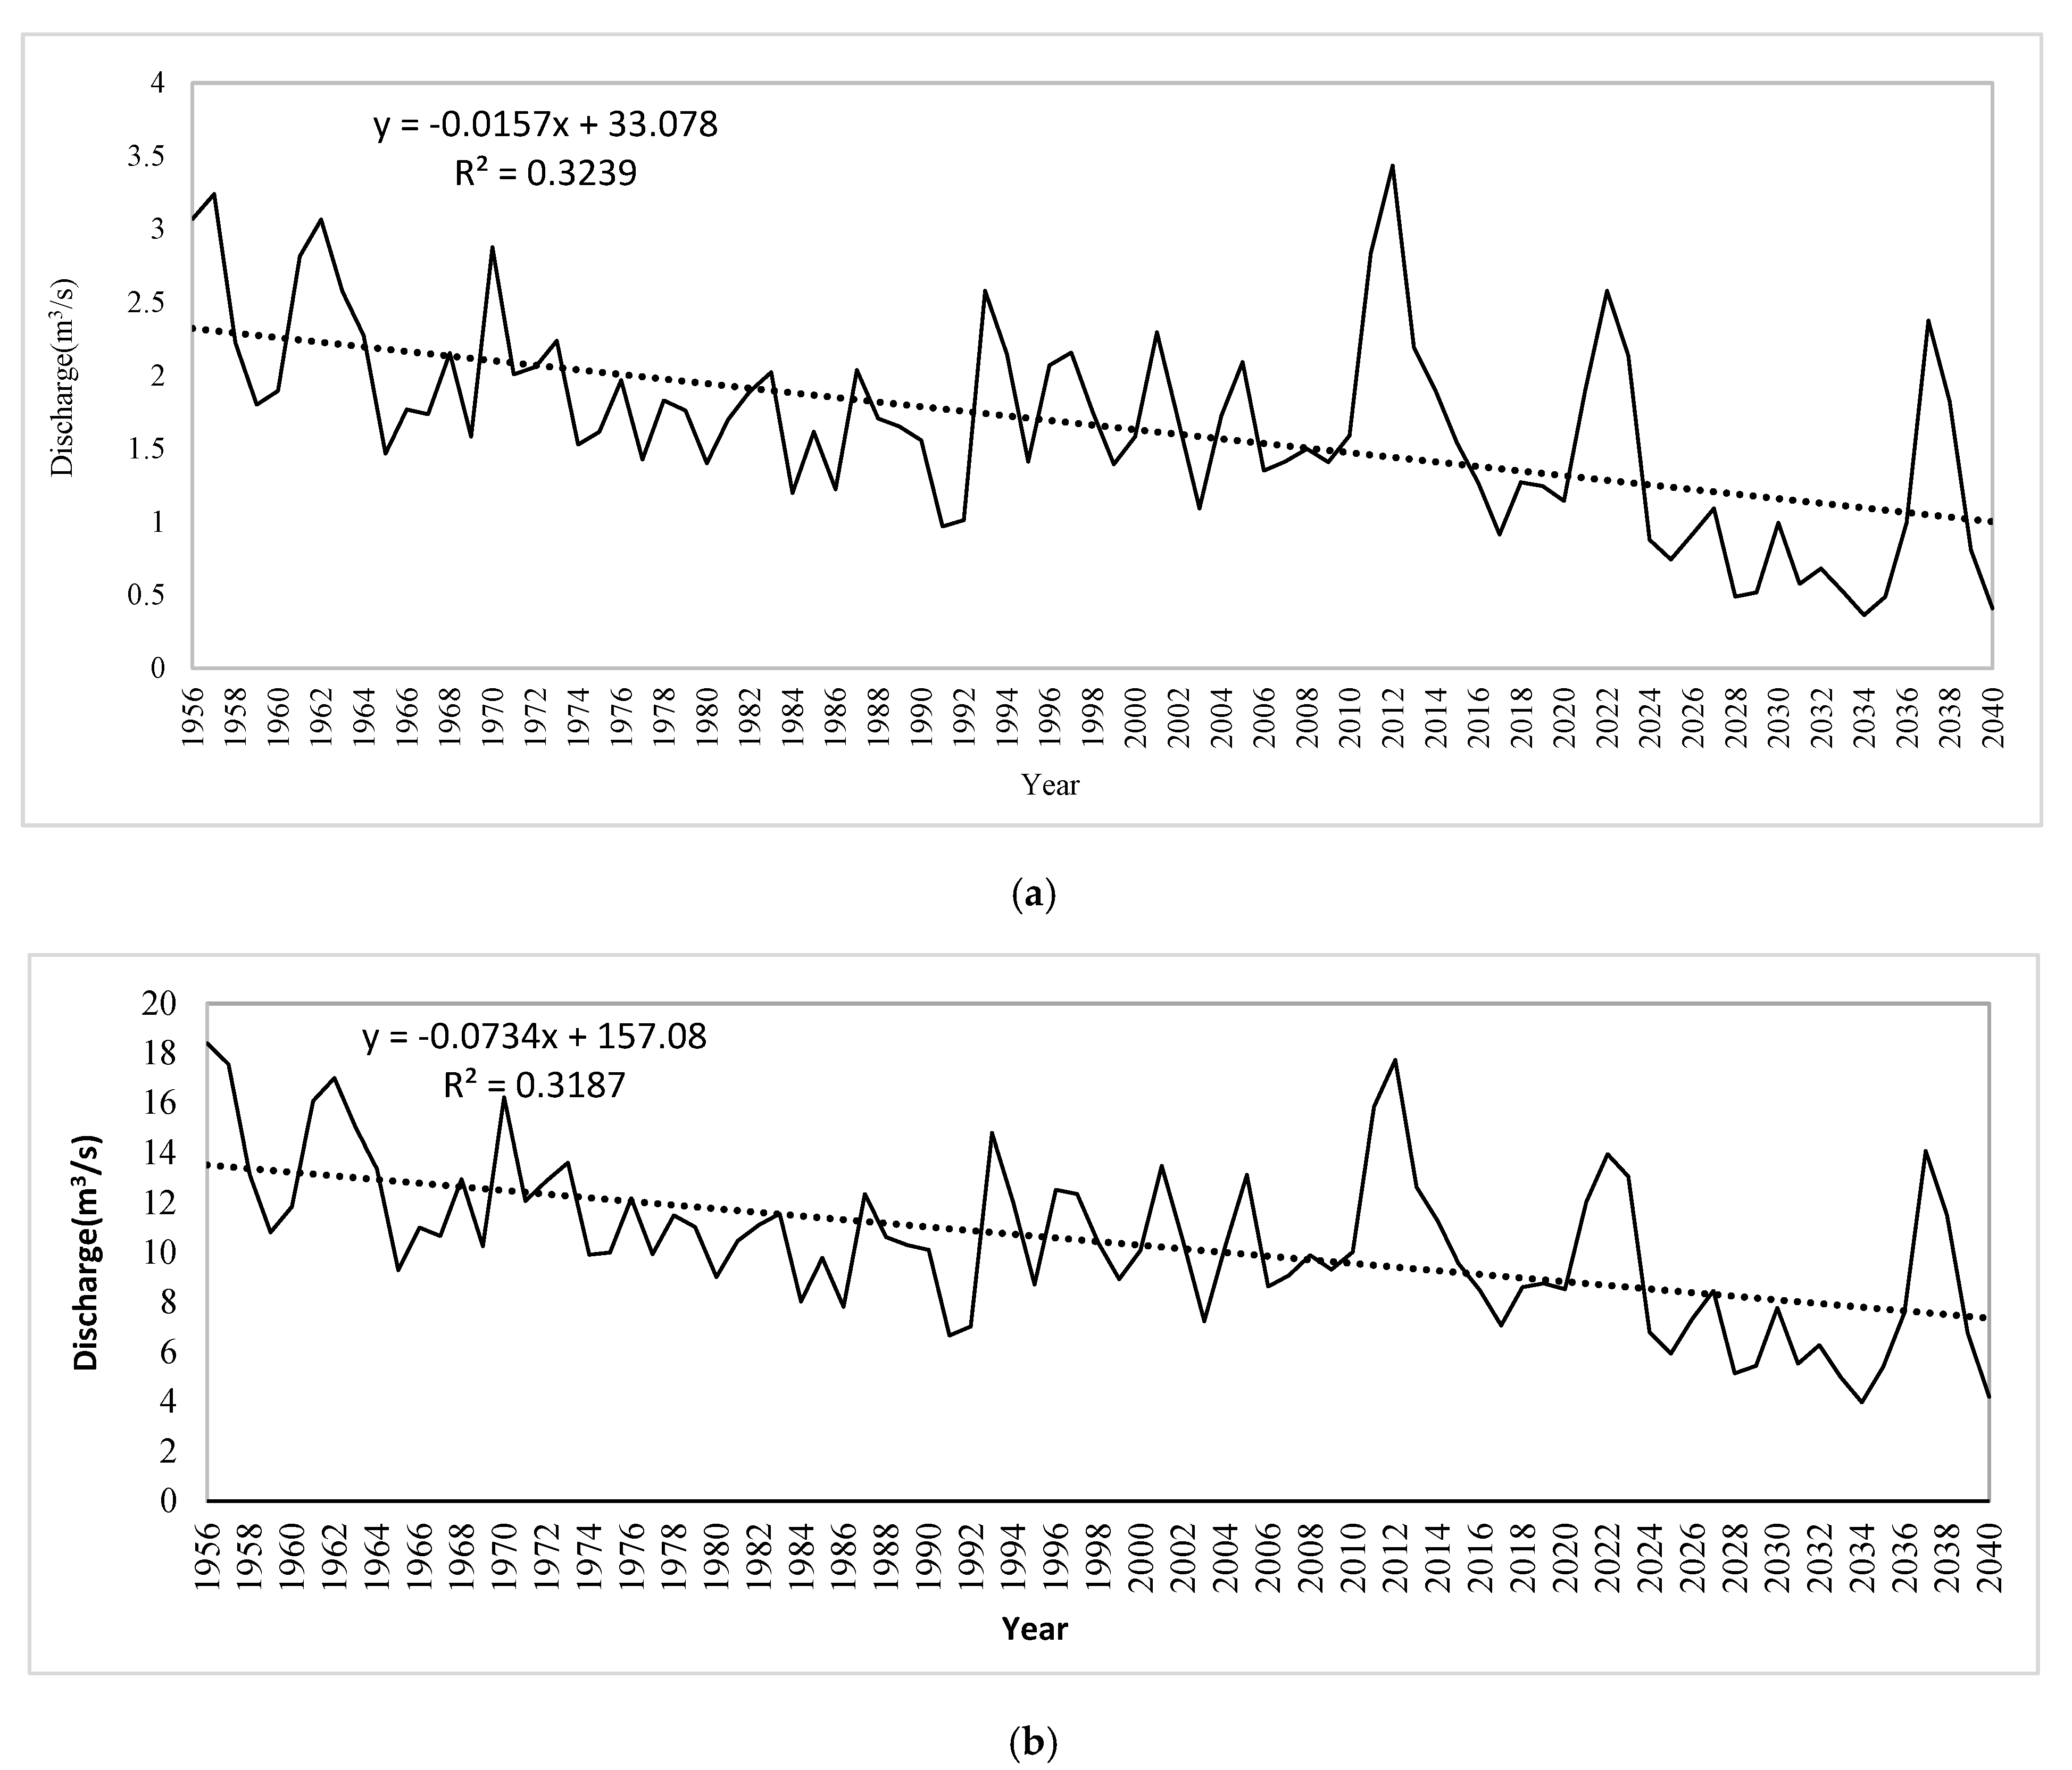
Figure 8a shows a declining trend of flow up to 2040 for Sebwe sub catchment (q = 33.08–0.02t, R
2 = 0.32). However, the projected flow from 2016 is expected to remain constant (R
2 = 0.07,
p > 0.05). The lowest mean annual flow of 0.82 ± 0.43 m
3/s still occurs in February although less than in 2015 and the highest flow of 2.57 ± 1.97 m
3/s also less than 2015 occurs in the same month of April. The lowest is projected to be 5.60 ± 2.67 m
3/s and the highest 15.51 ± 8.93 m
3/s representing 13.54 and 40.20 MCM per annum respectively.
3.4. Water Demand in 2015 and 2040
Table 6 shows that the annual domestic water demand was about 400,000 litres and 2,000,000 litres for Sebwe and Mubuku respectively in 2015. In the same year, the annual water demand for livestock was about 1,000,000 litres and 20,000 litres for industry in Mubuku since Sebwe did not have significant water demand for livestock or industry. Generally, domestic water demand is expected to increase by 64% for both irrigation schemes, livestock by 44% and industry by 400% in Mubuku irrigation scheme by 2040.
Table 7 presents the water demand in the base year and future for hydropower in the study area. Whereas hydropower demand is expected to remain constant for Bugoye and KCCL. Eco Gardens and Kilembe, hydropower demand is projected to increase by 300% and 256% in 2040.
The model has the capability to convert target power (MW) into power demand as flow (m
3/s) and area under irrigation (Ha) as irrigation water demand (m
3/s With regard to irrigation, water demand for Mubuku irrigation scheme will increase by 93% in 2040 while that for Kabukero and Nyabubaare will remain constant as seen in
Table 8.
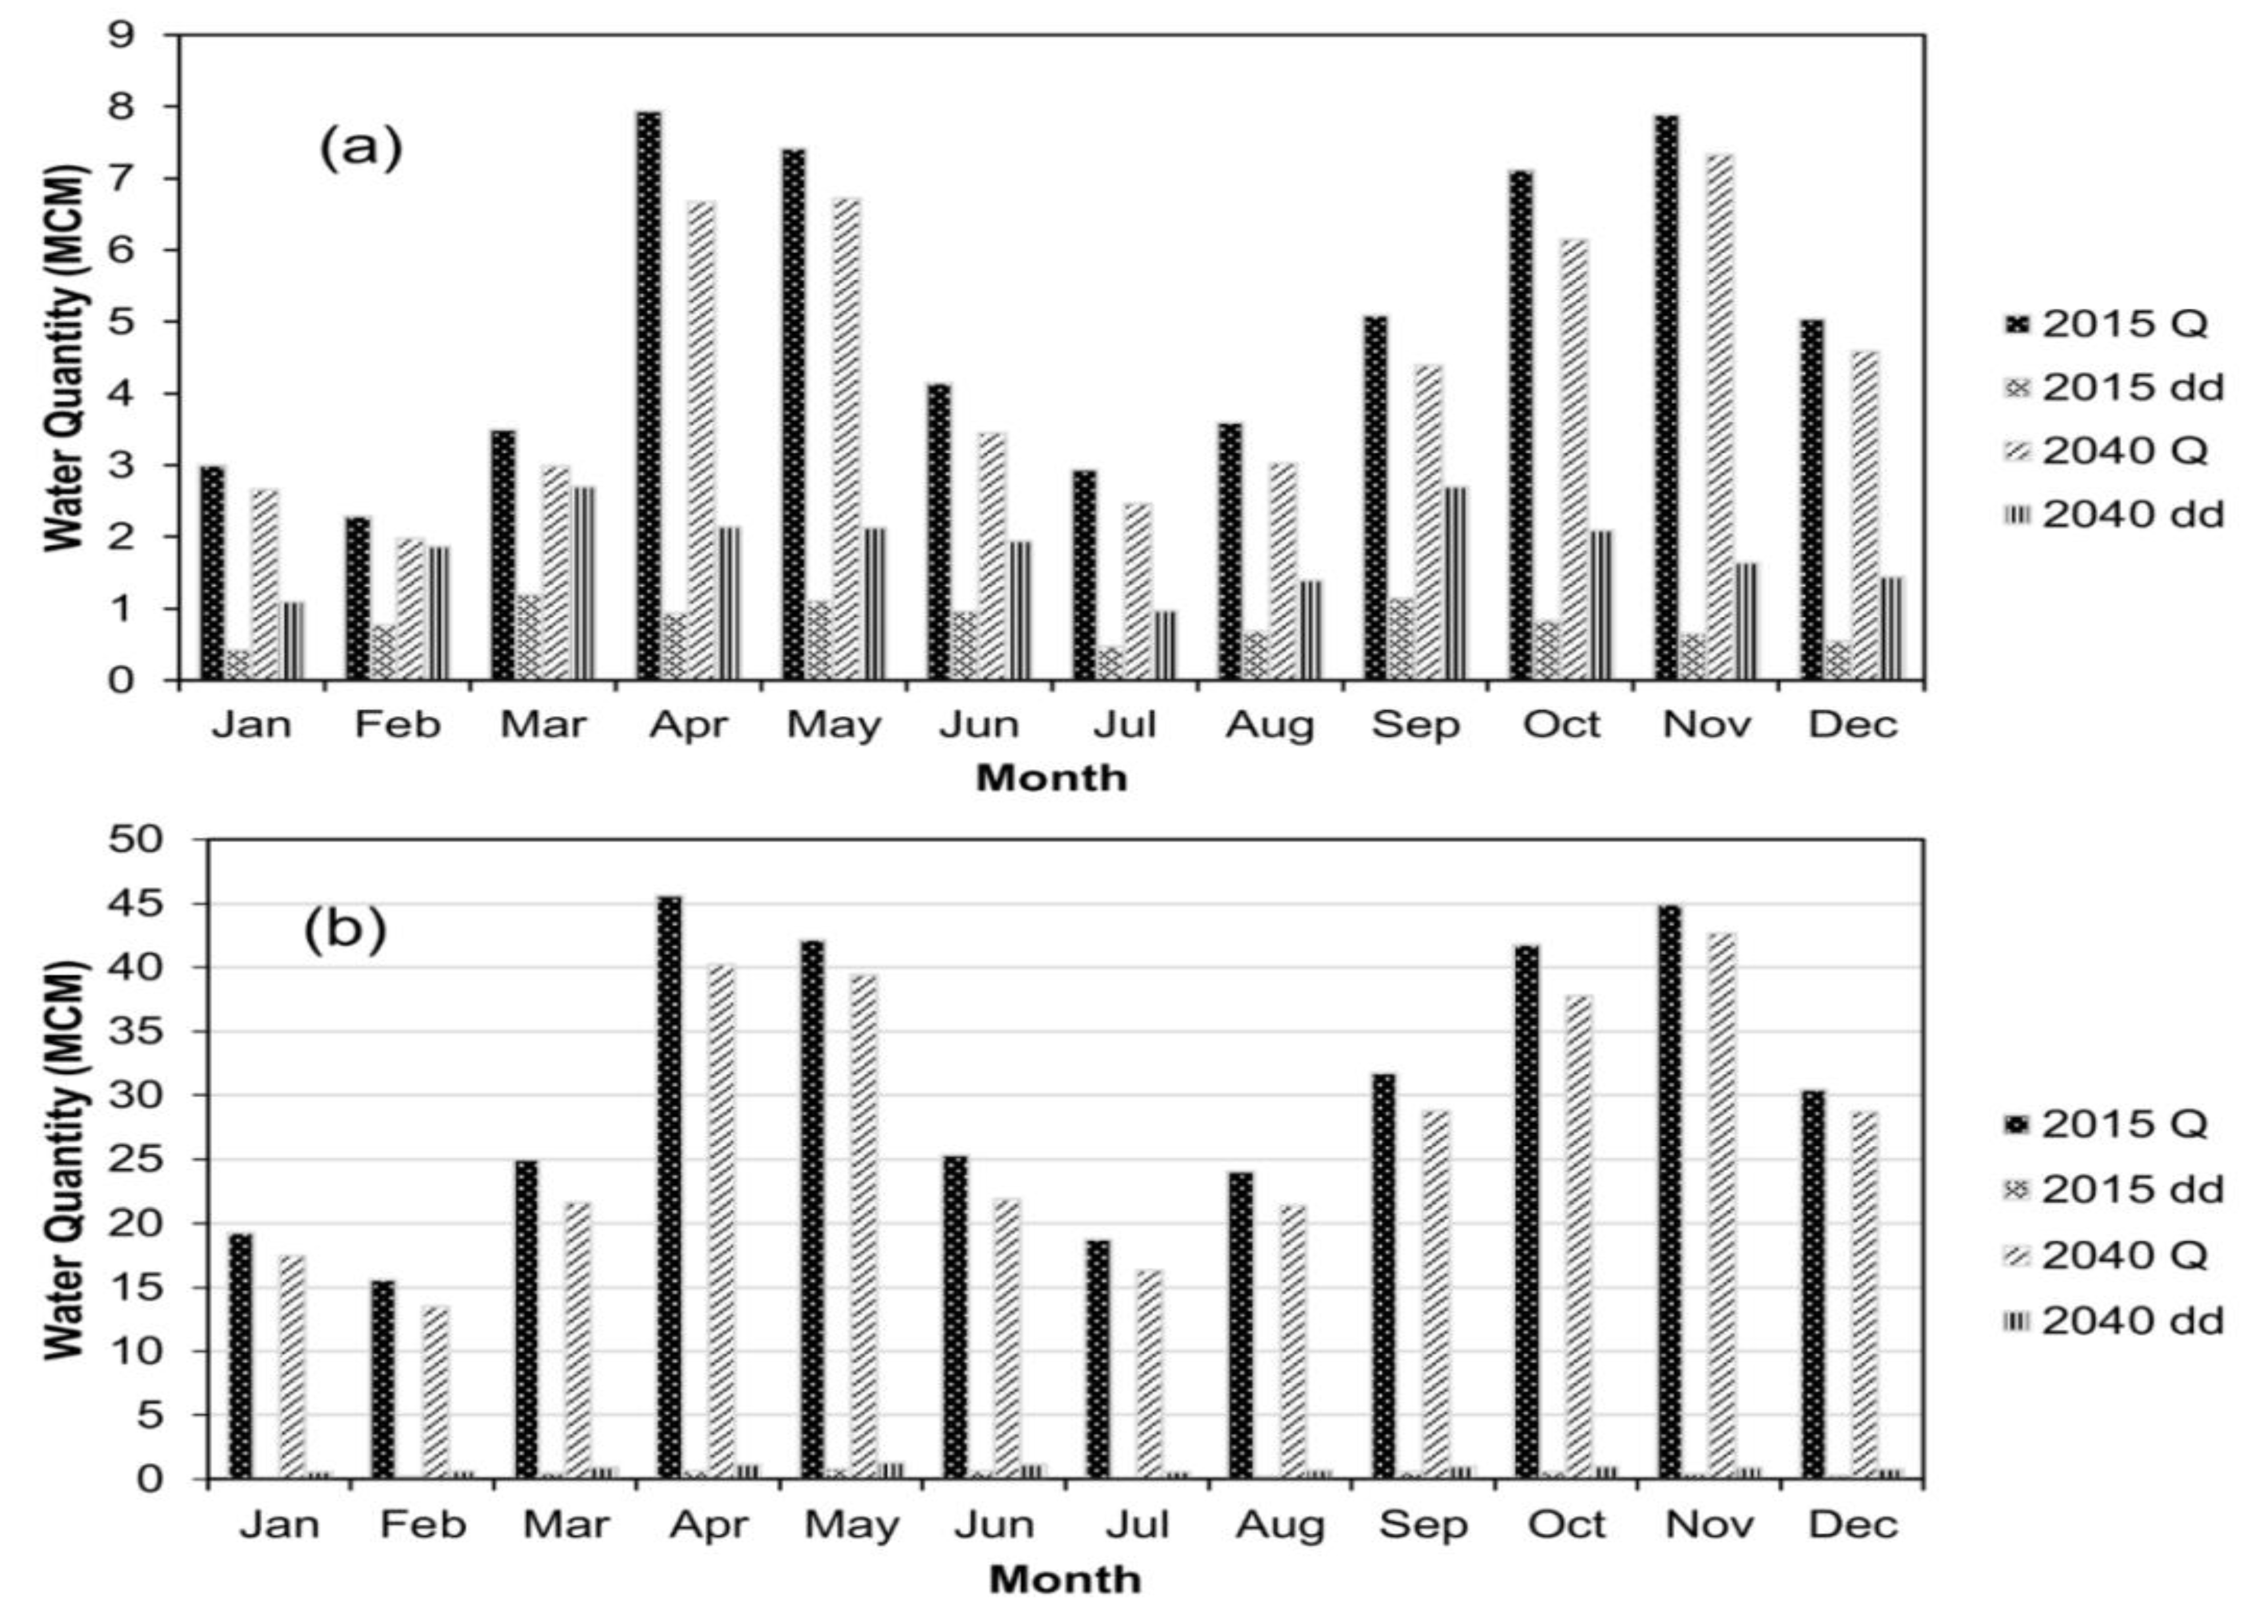
The reliability analysis for Sebwe in
Table 9 shows that reliability is highest during the dry months of January and July. The water availability plot in
Figure 9a on the other hand shows January and July as having low flow with February having the least water volumes.
Figure 9a further shows that despite the continuous increase in demand for water, its monthly volumes will continue to reduce. Important to note though is that the water available in the two sub catchments will still meet the demand in both the base and planning years. The deficits are therefore related to spatial and temporal water availability in the catchment.
For Mubuku, reliability is 100% throughout the year as shown in
Table 10 and
Figure 9b. For Mubuku generally, the water available in the base and planning years meets the total water demand. However, it should be noted that although hydropower is a non-consumptive water use thereby taking no water out of the system, abstracted water is not available for different uses from the point of abstraction to the tail race inflow back into the river hence some seasonal deficits along such sections in the river reach. Sebwe on the other hand, has a water deficit of 0.83 MCM in 2015, which will increase to about 10.04 MCM by 2040 as shown in
Table 11.
3.5. Water Allocation under Different Scenarios
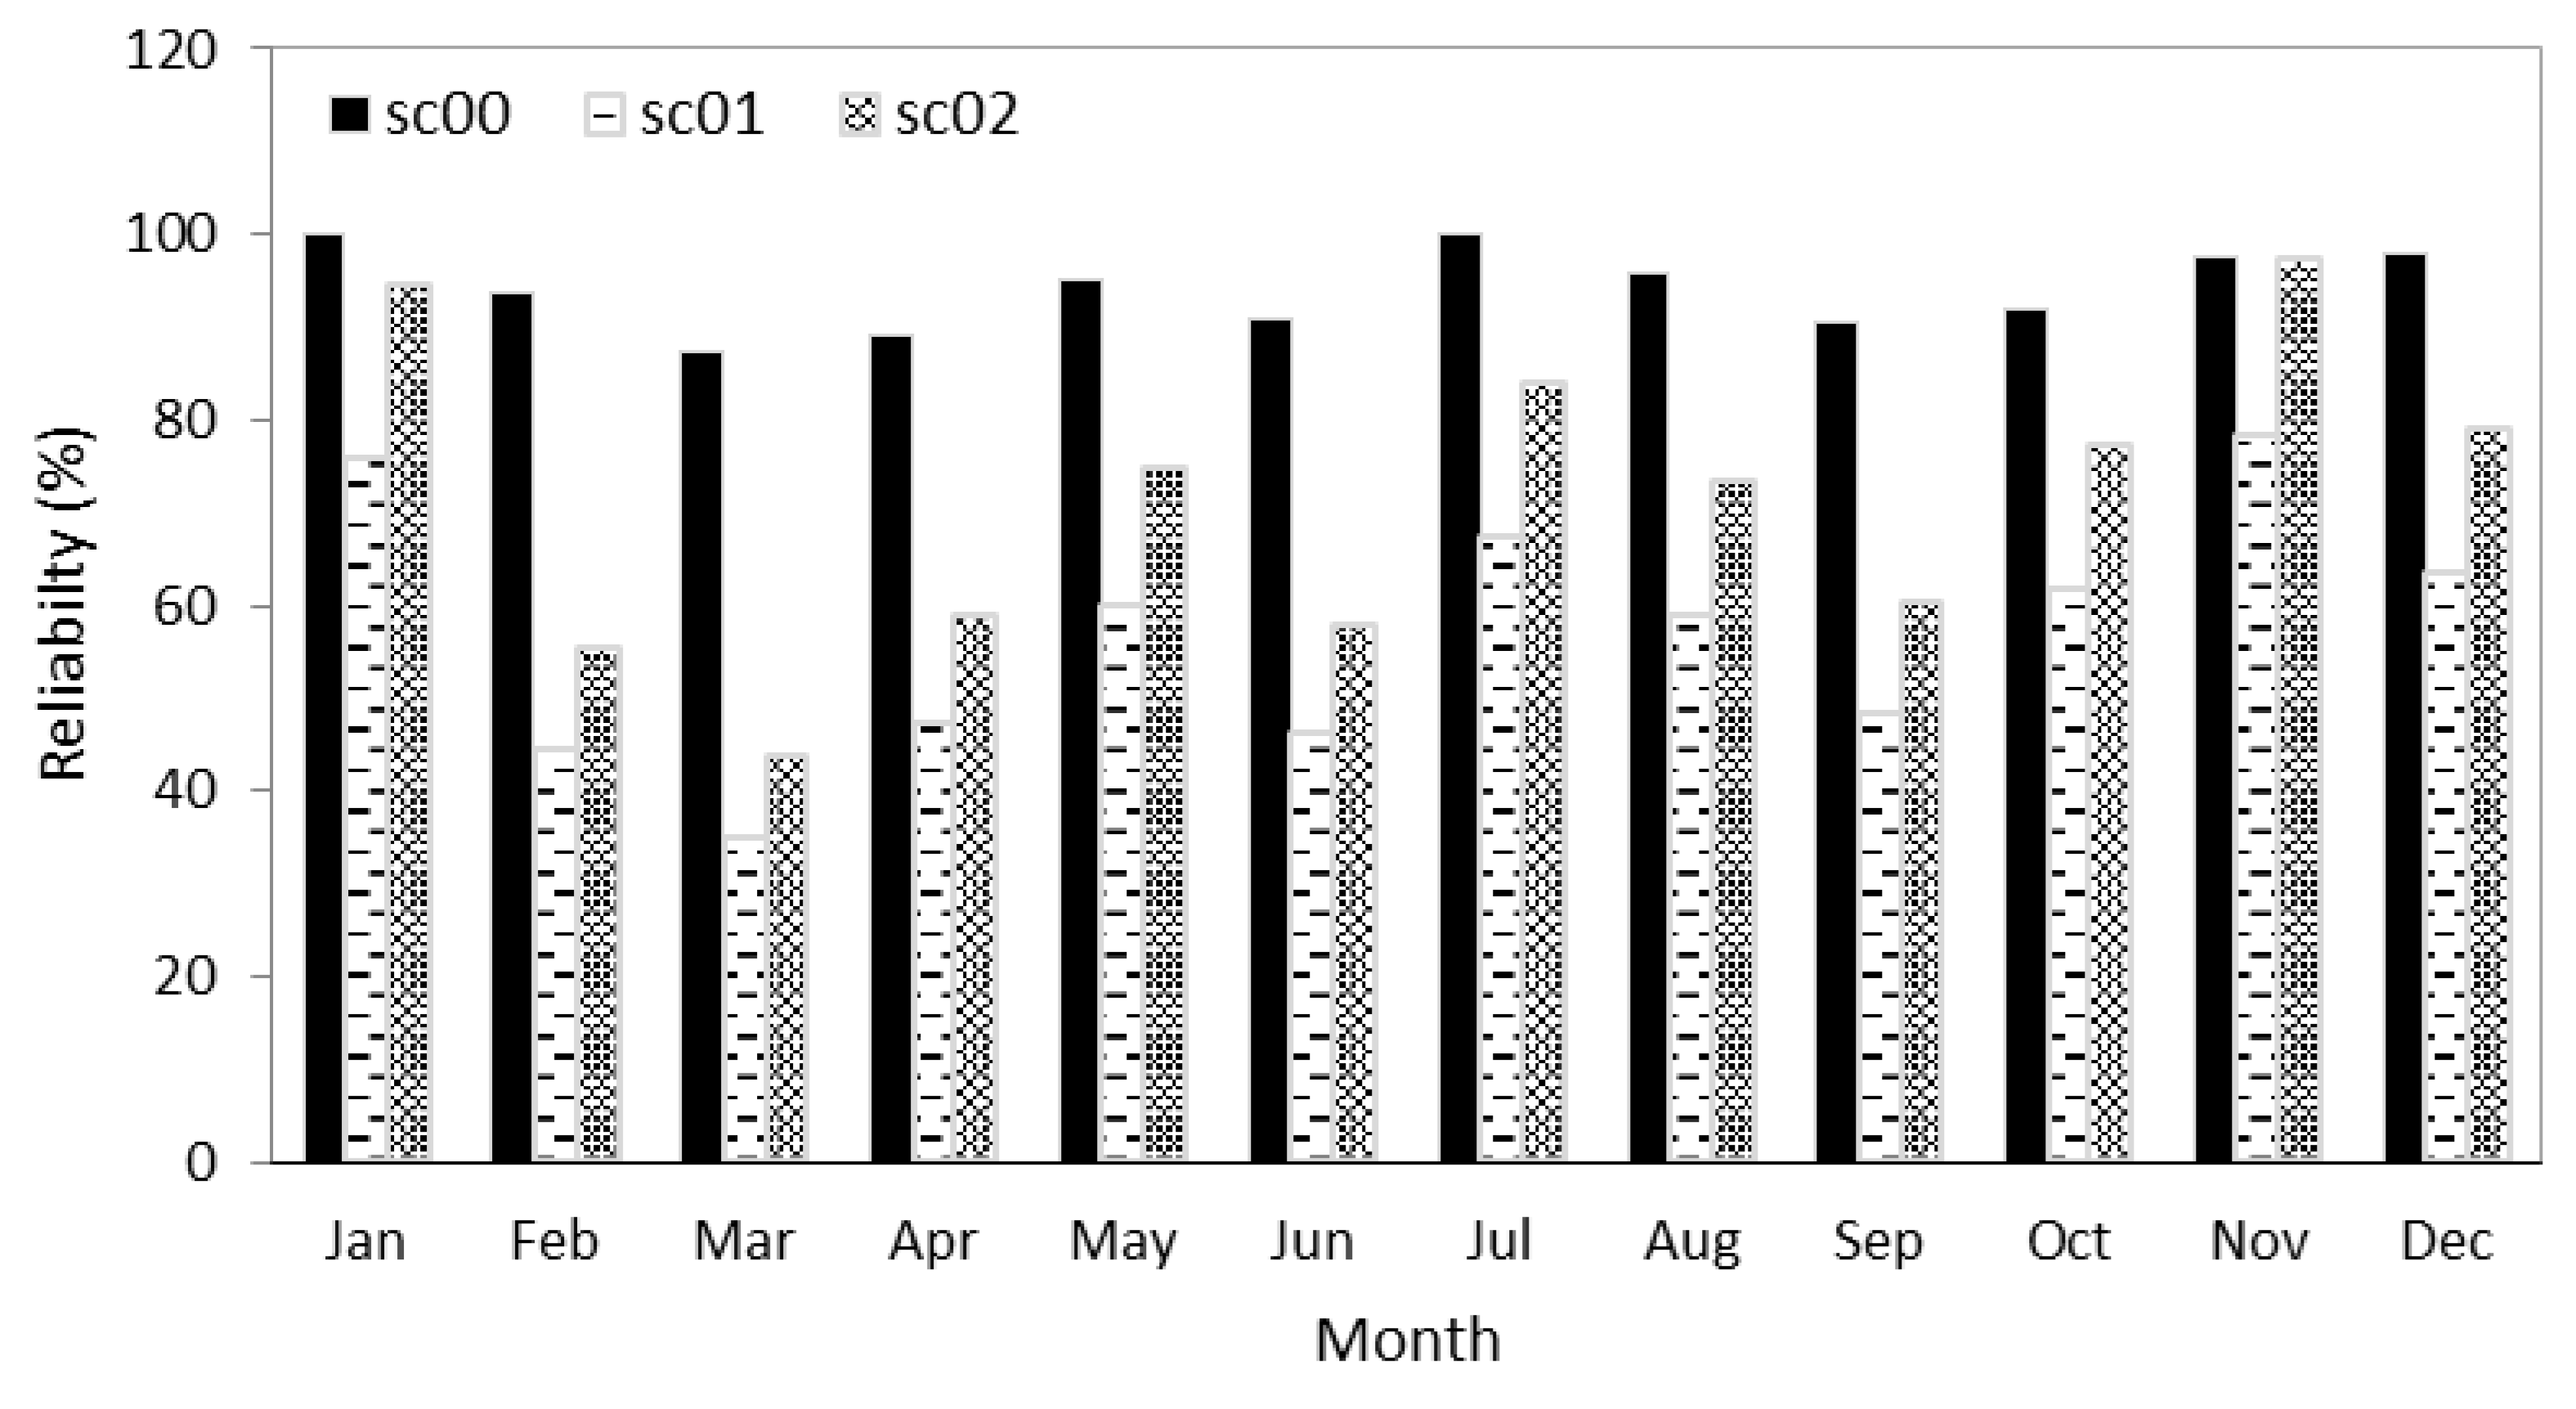
For Sebwe under Sc00, March and January have the highest and lowest demand of 1.20 and 0.42 MCM, respectively; with reliability ranging from 87% in March to 100% in January (
Figure 10). In Sc01, the monthly water demand for Sebwe sub catchment shows that March and September have the highest demand of over 2.70 MCM and July the lowest of only 0.99 MCM with reliability ranging from 76% in January to 35% in March. For Sebwe under Sc02, the highest water demand was over 2.16 MCM observed in the months of March and September while the lowest of 0.71 MCM was observed in May with reliability highest in November at 98% and lowest in March at 44%.
For Mubuku sub catchment under Sc00, the highest demand occurs in May. Under Sc01, the highest water demand rises to 1.28 MCM again in May while the lowest of 0.56 MCM occurs in January and July. On the other hand, the highest monthly water demand in the Mubuku sub catchment under scenario Sc02 was observed in May and the lowest in January and July. The reliability analysis shows that all the water demand is met all year round under all three scenarios.
Comparing the three scenarios for Mubuku and Sebwe, Sc02 presents the highest reliability and least deficit.
4. Discussion
4.1. Hydrological Modelling
Prior studies have noted that difficulties in obtaining data represent genuine barriers to research on climate change, water, or biodiversity protection and therefore incomplete hydrological and climatic data records coupled with data gaps impact on the results of the study and cannot be ignored [
31]. The inadequacy of quantitative and qualitative information for planning and decision-making has often resulted in over-estimation of water resources potential and the development of agricultural and industrial projects that were constrained by water scarcity. It has also allowed complacency, and consequential wastage, in the use of water resources. Gap filling and extrapolation was inevitable. The quality challenges were reflected in the fit of the simulated and observed discharge which was rather difficult especially for Mubuku high flows. In addition, the Mike Hydro and NAM are global tools and calibrating them to local conditions was challenging considering that certain conditions are really different at a local scale. Important to note though is that data quality control was carried out to sufficient standards for modeling, reflected in the model performance analysis.
4.2. Projected Water Availability and Demand in the Study Area
The results of this study show that although there are some seasonal deficits, the flow available in the Mubuku-Sebwe sub catchments will meet the demand by the year 2040. This can be enhanced by putting in place mechanisms to store surplus water at the different nodes as and when it occurs to meet the seasonal deficits.
The finding that the available water in the study area will reduce by 2040 corroborate with [
32] that precipitation in the study area will generally decrease while temperatures will increase with 1–4 °C in the dry periods and [
33] that runoff in the mid-latitudes and most sub-tropical regions will reduce. These changes will have significant impact on the river discharge by reducing the flows in the dry periods especially between May and September, while heavy floods were simulated for the wet months of November and March.
Another important finding was that by 2040, water demand will double and deficit will increase. Although deficits occur in all the three scenarios, they were found to be higher in Sebwe sub catchment under Sc01 implying that if development continues without applying management options, the deficits will eventually put a halt on development. These findings concur with [
34] that emphasizes the need for sustainable water allocation and management in the Mubuku-Sebwe sub catchments cannot be over emphasized. Interestingly, there are some seasonal water surpluses within the system as indicated by the “outflow to node” in the water allocation model. These may be due to increase in rainfall in certain wet seasons aggravated by climate change as reported by previous researchers [
35].
Although the reliability analysis for Mubuku was 100%, there are seasonal deficits at some nodes within the system shown in the model. This should be interpreted with caution because the reliability computation did not include hydropower since it is non-consumptive and at the same time, all the plants in the study area are “run of the river” technology with no storage. It should be noted that downstream the point of abstraction, the water is not available for other uses until it returns in the system at the tail race. The results show that 90% of the time, Kilembe, Bugoye, and KCCL hydropower plants will be operating below 50% by the planning year. Already, some very expensive equipment in KCCL is out of use due to low water flow and this has led to loss of revenue to the county. The seemingly high reliability of Sebwe in January and July is attributed to Mubuku irrigation scheme which is the major water user in this sub catchment. January and July coincide with harvesting periods when water demand for irrigation is minimal.
4.3. Impact of Water Allocation Management Scenarios on Water Demand and Allocation
The study found that introducing management options in Sc02 reduced the water deficit by 50% and increased the average annual reliability by 25%. This finding suggests that it is possible to triple the reliability by introducing additional management options to meet the country’s 2040 economic target. Future research to explore introduction of structural investment options in the scenarios and their impact on deficits is recommended.
5. Conclusions
This paper has investigated sustainable water allocation in a mountainous catchment in western Uganda. The study set out to determine the most sustainable water allocation option in the Mubuku-Sebwe sub-catchments. To achieve this goal, Rainfall-Runoff model (NAM) was built and a node based water allocation was applied in Mike Hydro to simulate the catchment processes. Overall, a good representation of daily discharge dynamics and allocation was achieved by the two models with a realistic water balance. The impact of water allocation on the catchment was studied using three different scenarios for the simulation period 2040. Mubuku water demand is projected to increase from 5.2 MCM in 2015 to 10.7 MCM in 2040. Mubuku available water is projected to fall from 364.8 to 329.8 MCM per annum. Sebwe water demand is projected to increase from 9.7 MCM in 2015 to 22.2 MCM in 2040 and its available water is projected to fall from 60 to 52 MCM per annum by the year 2040 from 2015.
The findings show a general reduction in the available water in the study area and suggest that allocation of water in any catchment should be based on the management options presented in Sc02 which prioritizes domestic and environmental water demands, allocates 90% to industry, 70% to irrigation and 60% to livestock. It is recommended therefore that more efficient water use techniques be employed in order to ensure high reliability. The study should be adopted as an initial guide for sustainable water allocation in the catchment and results may be improved further as additional accurate data becomes available.
With this tool, new water user applications will only be required to give information on the abstraction point and the quantity of water required. This information, when entered into the tool as a new water user node, is simulated and the effect on all other water users and the catchment as a whole can be studied before a decision on allocation is made. This will significantly reduce the permit application assessment time and improve water resources management of the catchment as an hydrological unit since alternative scenarios can be constructed, trends and interactions of the complex water system analyzed, strategies to solve water allocation conflicts evaluated and necessary infrastructure interventions can be planned in advance to meet water needs in a sustainable manner. Therefore, future efforts should focus on understanding the combined impact from storage of surplus water at the nodes where it’s available and introducing structural investment scenarios within the sub-catchments.
Author Contributions
Conceptualization, C.E.M., J.-G.M.M. and J.W.; methodology, C.E.M., J.-G.M.M., J.W. and G.G.; software, C.E.M., J.-G.M.M. and J.W.; validation, C.E.M., J.-G.M.M. and J.W.; formal analysis, C.E.M., J.-G.M.M. and J.W.; investigation, C.E.M., J.-G.M.M. and J.W.; resources, C.E.M. and J.-G.M.M.; data curation, C.E.M., J.-G.M.M. and J.W.; writing—original draft preparation, C.E.M., J.-G.M.M. and J.W.; writing—review and editing, C.E.M., J.-G.M.M., J.W. and G.G.; visualization, C.E.M., J.-G.M.M., J.W. and G.G.; supervision C.E.M., J.-G.M.M. and J.W.; project administration, C.E.M., funding acquisition, C.E.M. and J.-G.M.M. All authors have read and agreed to the published version of the manuscript.
Funding
This work was supported by the Ministry of Water and Environment, Uganda; and the World Wildlife Fund’s Russell E. Train Education for Nature Program [Agreement #SZ38].
Institutional Review Board Statement
Notapplicable.
Informed Consent Statement
Not applicable.
Data Availability Statement
All data and models that support the findings of this study are available from the corresponding author upon reasonable request. (Hydrological, climatic, catchment characteristics, water use data and NAM, Mike Hydro, NBDSS models).
Acknowledgments
The ideas and concepts in this paper have been developed by the authors in discussion with colleagues both within the Makerere University and at other institutions. The authors wish to thank MWE, Uganda and WWF, Washington DC for co-funding this work. Sincere gratitude also goes to the DAAD’s DDT program and Ing Jackson Roehrig of the Technical University of Cologne, Germany for the immense guidance in dealing with data quality assurance and analysis. We are grateful to MWE staff for their invaluable support in acquisition and analysis of hydro-meteorological data used for this study. Special thanks go to Callist Tindimugaya, Joseph Epitu, Caroline Nakalyango, Charles Kiwalabye, Frank Kigozi, Jackson Kitamirike of MWE (RIP) and Benjamin Sekamuli and Sowed Wamala of the Nile Basin Initiative.
Conflicts of Interest
The authors declare no conflict of interest.
References
- Mekonnen, M.M.; Hoekstra, A.Y. Four billion people facing severe water scarcity. Sci. Adv. 2016, 2, e1500323. [Google Scholar] [CrossRef] [PubMed] [Green Version]
- Kummu, M.; Guillaume, J.H.A.; de Moel, H.; Eisner, S.; Flörke, M.; Porkka, M. The world’s road to water scarcity: Shortage and stress in the 20th century and pathways towards sustainability. Sci. Rep. 2016, 6, 1–16. [Google Scholar] [CrossRef] [PubMed] [Green Version]
- Mapani, B.; Meck, M.; Makurira, H.; Magole, L.; Mashauri, D.; Mul, M. Water: The conveyor belt for sustainable livelihoods and economic development. Phys. Chem. Earth 2016, 92, 1–2. [Google Scholar] [CrossRef]
- Njigua, J. Development of Water Allocation Framework for Sustainable Water Resources Management in Mara River Basin in Kenya. Master’s Thesis, University of Zimbabwe, Harare, Zimbabwe, 2006. [Google Scholar]
- Haasnoot, M.; Middelkoop, H.; Offermans, A.; Van Beek, E.; Van Deursen, W.P. Exploring pathways for sustainable water management in river deltas in a changing environment. Clim. Chang. 2012, 115, 795–819. [Google Scholar] [CrossRef] [Green Version]
- Poff, N.L.; Brown, C.M.; Grantham, T.E.; Matthews, J.H.; Palmer, M.A.; Spence, C.M.; Wilby, L.R.; Haasnoot, M.; Mendoza, F.G.; Dominique, C.K.; et al. Sustainable water management under future uncertainty with eco-engineering decision scaling. Nat. Clim. Chang. 2015, 6, 25–34. [Google Scholar] [CrossRef] [Green Version]
- Roozbahani, R.; Schreider, S.; Abbasi, B. Environmental Modelling & Software Optimal water allocation through a multi-objective compromise between environmental, social, and economic preferences. Environ. Model. Softw. 2015, 64, 18–30. [Google Scholar]
- Gleick, P.H. Water in crisis: Paths to sustainable water use. Ecol. Appl. 1998, 8, 571–579. [Google Scholar] [CrossRef]
- Wang, Z.; Yang, J.; Deng, X.; Lan, X. Optimal Water Resources Allocation under the Constraint of Land Use in the Heihe River Basin of China. Sustainability 2015, 7, 1558–1575. [Google Scholar] [CrossRef] [Green Version]
- George, B.; Malano, M.H.; Davidson, B. Water Resource Allocation Modelling to Harmonise Supply and Demand in the Malaprabha Catchment, India. 2008. Available online: https://www.iwra.org/congress/2008/resource/authors/abs429_article.pdf (accessed on 16 May 2021).
- Droogers, P.; Boer, F.; Terink, W. Water Allocation Models for the Umbeluzi River Basin, Mozambique. Rep. Future Water 2016, 132, 69. [Google Scholar]
- Droogers, P.; Bouma, J. Simulation modelling for water governance in basins. Int. J. Water Resour. Dev. 2014, 30, 475–494. [Google Scholar] [CrossRef]
- MWE. Uganda Catchment Management Planning Guidelines. Ministry of Water and Environment (MWE). 2014. Available online: https://www.mwe.go.ug/sites/default/files/library/Uganda%20Catchment%20Management%20Planning%20Guidelines%20-%20Final.pdf (accessed on 30 November 2018).
- WWF. Rivers Mubuku / Nyamwamba Sub-catchment Management Plan. World Wildlife Fund. 2012. Available online: https://docplayer.net/96095420-Rivers-mubuku-nyamwamba-sub-catchment-management-plan.html (accessed on 25 November 2016).
- Mugume, E. Methods for assessing soil degradation in East Africa. United Nations University Land Restoration Training Programme. 2014. Available online: http://www.unulrt.is/static/fellows/document/Mugume2014 (accessed on 27 November 2016).
- Munishi-Kongo, S. Ground and Satellite-Based Assessment of Hydrological Responses to Land Cover Change in the Kilombero River Basin, Tanzania. Ph.D. Thesis, University of KwaZulu-Natal, Pietermaritzburg, South Africa, 2013. [Google Scholar]
- Agrawal, N.; Desmukh, T.S. Rainfall Runoff Modeling using MIKE 11 Nam—A Review. Int. J. Innov. Sci. Eng. Technol. 2016, 3, 659–667. [Google Scholar]
- Shamsudin, S.; Hashim, N.; Water, S.; Using, R.; Pivot, C. Rainfall runoff simulation using MIKE11 NAM. J. Civil. Eng. 2002, 15, 1–13. [Google Scholar]
- Doulgeris, C.; Georgiou, P.; Papadimos, D.; Papamichail, D. Ecosystem approach to water resources management using the MIKE 11 modeling system in the Strymonas River and Lake Kerkini. J. Environ. Manag. 2012, 94, 132–143. [Google Scholar] [CrossRef] [PubMed]
- Government of Uganda. Uganda Vision 2040. 2007. Available online: http://www.npa.go.ug/uganda-vision-2040/ (accessed on 21 November 2016).
- Strzepek, K.; Boehlert, B.; Neumann, J.; Economics, I. The Contribution of Water Resources Development and Environmental Management to Uganda’s Economy Final Report. Prepared for the Ministry of Water and Environment Republic of Uganda Kampala, Uganda. 2016. Available online: https://www.mwe.go.ug/sites/default/files/library/Economic%20Study%202016-Contribution%20of%20Water%20Dev%27t.pdf (accessed on 20 November 2016).
- DHI. Mike hydro Basin User Guide. 2017. Available online: http://manuals.mikepoweredbydhi.help/2017/Water_Resources/MIKEHydro_Basin_UserGuide.pdf (accessed on 20 November 2016).
- MWE. Water Supply Design Manual. Ministry of Water and Environment (MWE). 2013. Available online: https://www.mwe.go.ug/sites/default/files/library/Water Supply Design Manual v.v1.1.pdf (accessed on 21 October 2016).
- Uganda Bureau of Statistics. The National Population and Housing Census 2014—National Analytical Report, Kampala, Uganda. 2017. Available online: https://www.ubos.org/wp-content/uploads/publications/03_20182014_National_Census_Main_Report.pdf (accessed on 22 October 2016).
- Ministry of Agriculture, Animal Industry and Fisheries and Uganda Bureau of Statistics 2008 Livestock Census Report. 2009. Available online: https://www.ubos.org/wp-content/uploads/publications/05_2019THE_NATIONAL_LIVESTOCK_CENSUS_REPORT_2008.pdf (accessed on 25 March 2021).
- World Commission on Dams. Dams and Development: A New Framework for Decision-Making. 2001. Available online: https://www.internationalrivers.org/sites/default/files/attached-files/world_commission_on_dams_final_report.pdf (accessed on 29 November 2018).
- Government of Uganda. Uganda Vision 2040. A Transformed Ugandan Society from a Peasant to a Modern and Prosperous Country within 30 Years. 2007; pp. 1–100. Available online: http://npa.ug/wpcontent/themes/npatheme/documents/vision2040.pdf (accessed on 22 October 2016).
- Hudson, N.I.; Ruane, A.C. Appendix 2. Guide for Running AgMIP Climate Scenario Generation Tools with R in Windows, Version 2.3. In Handbook of Climate Change and Agroecosystems: The Agricultural Model Intercomparison and Improvement Project (AgMIP) Integrated Crop and Economic Assessments, Rosenzweig; Hillel, D., Ed.; Imperial College Press: London, UK, 2015; Volume 3, pp. 387–440. [Google Scholar]
- Hamlet, F.A.; Elsner, M.M.; Mauger, S.G.; Lee, S.; Tohver, I.; Norheim, A.R. An Overview of the Columbia Basin Climate Change Scenarios Project: Approach, Methods, and Summary of Key Results. Atmos. Ocean. 2013, 51, 392–415. [Google Scholar] [CrossRef]
- Chaturvedi, R.K.; Joshi, J.; Jayaraman, M.; Bala, G.; Ravindranath, N.H. Multi-model climate change projections for India under representative concentration pathways. Curr. Sci. 2012, 791–802. [Google Scholar]
- Beniston, M.; Stoffel, M.; Harding, R.; Kernan, M.; Ludwig, R.; Moors, E.; Samuels P Tockner, K. Obstacles to data access for research related to climate and water: Implications for science and EU policy-making. Environ. Sci. Policy. 2012, 17, 41–48. [Google Scholar] [CrossRef] [Green Version]
- Nyenje, P.M.; Batelaan, O. Estimating the effect of climate change on the hydrology of ssezibwa catchment. Hydrol. Sci. J. 2009, 54, 713–726. [Google Scholar] [CrossRef]
- Vo, C.J.; Green, P. Global Water Resources: Vulnerability from Climate Change and Population Growth. Science 2000, 289, 284–289. [Google Scholar]
- Taylor, R.G.; Rose, N.L.; Mackay, A.W.; Mileham, L.; Ssemmanda, I.; Tindimugaya, C.; Nakileza, B.; Muwanga, A.; Hau, J. Climate Change and the Aquatic Ecosystems of the Rwenzori Mountains, Uganda: Final Report to the Royal Geographical Society. ECRC Research Report No. 113. 2007. Available online: https://www.researchgate.net/publication/344853069_Climate_change_and_the_aquatic_ecosystems_of_the_Rwenzori_Mountains_Uganda (accessed on 19 April 2020).
- Conway, G. The Science of Climate Change in Africa: Impacts and Adaptation. Imperial College London Grantham Institute for Climate Change Discussion. 2009, p. 1. Available online: https://www.mamopanel.org/media/uploads/files/science_of_climate_change_in_africa-_impacts_and_adaption_2009.pdf (accessed on 19 April 2020).
Figure 1.
Location of Mubuku-Sebwe Sub-catchments.
Figure 1.
Location of Mubuku-Sebwe Sub-catchments.
Figure 2.
Schematic diagram for Mubuku-Sebwe sub-catchments.
Figure 2.
Schematic diagram for Mubuku-Sebwe sub-catchments.
Figure 3.
Sebwe calibration plot (a), accumulated discharge plot (b), Validation plot (c) and Flow Duration Curve (d).
Figure 3.
Sebwe calibration plot (a), accumulated discharge plot (b), Validation plot (c) and Flow Duration Curve (d).
Figure 4.
Mubuku calibration plot (a), accumulated discharge plot (b), Validation plot (c) and Flow Duration Curve (d).
Figure 4.
Mubuku calibration plot (a), accumulated discharge plot (b), Validation plot (c) and Flow Duration Curve (d).
Figure 5.
Percentage rainfall change vs. temperature change for Sebwe and Mubuku sub catchment under RCP8.5 climate scenario.
Figure 5.
Percentage rainfall change vs. temperature change for Sebwe and Mubuku sub catchment under RCP8.5 climate scenario.
Figure 6.
Projected change in monthly rainfall and mean temperature by 2040.
Figure 6.
Projected change in monthly rainfall and mean temperature by 2040.
Figure 7.
Projected change in water availability in Sebwe and Mubuku sub catchments between 2015 and 2040.
Figure 7.
Projected change in water availability in Sebwe and Mubuku sub catchments between 2015 and 2040.
Figure 8.
Long term average flow (1956–2040) (m3/s) for Sebwe (a) and Mubuku (b).
Figure 8.
Long term average flow (1956–2040) (m3/s) for Sebwe (a) and Mubuku (b).
Figure 9.
Monthly water demand and availability analysis for Sebwe (a) and Mubuku (b).
Figure 9.
Monthly water demand and availability analysis for Sebwe (a) and Mubuku (b).
Figure 10.
Water use reliability for the three scenarios for Sebwe.
Figure 10.
Water use reliability for the three scenarios for Sebwe.
Table 1.
NAM model input data.
Table 1.
NAM model input data.
| Required Data | Resolution | Data Source |
|---|
| Rainfall | Daily (1956–2015) | Uganda National Meteorological Authority |
| Discharge | Daily (1956–2015) | Department of Water Resources Management-Ministry of Water and Environment |
| Potential Evapotranspiration | Daily | CROPWAT 8.0 simulations |
| Catchment Area | Sq. Kms | USGS ASTER DEM |
| Slope | | USGS ASTER DEM |
Table 2.
Mike Hydro input data.
Table 2.
Mike Hydro input data.
| Data Type | Resolution | Source | Description |
|---|
| Discharge | Daily, 1956–2015 | NAM filled discharge | |
| Water demand (livestock, domestic, Hydropower, industry and Irrigation) | Daily | Uganda Bureau of Statistics, 2009 | Computed livestock, domestic, hydropower, industry and irrigation demand |
| Climatic data | Daily, 5 weather stations, 1956–2015 | Uganda National Meteorological Authority | Rainfall, temperature, solar radiation, wind speed and relative humidity |
| Dam characteristics | | Department of Water Production, Ministry of Water and Environment | Design drawings, Flood control time series, Level area volume, Losses and gains, spill capacity, spillway bottom levels, water supply fraction, bottom outlet capacity, characteristic levels time series. |
| Catchment characteristics | | SRTM-30 m DEM | slope, maximum water content in surface storage, Overland flow runoff coefficent, time constant for routing interflow, time constant for routing baseflow, root |
Table 3.
NAM model performance during calibration and validation.
Table 3.
NAM model performance during calibration and validation.
| Sub-Catchment | Calibration | Validation |
|---|
| NSE | RSR | PBIAS | NSE | RSR | PBIAS |
|---|
| Sebwe | 0.57 | 0.43 | 25 | 0.51 | 0.42 | 29 |
| Mubuku | 0.49 | 0.62 | 31 | 0.47 | 0.58 | 37 |
Table 4.
Average monthly flow for Sebwe and Mubuku in 2015.
Table 4.
Average monthly flow for Sebwe and Mubuku in 2015.
| | Sebwe | Mubuku |
|---|
| Month | Mean Flow (m3/s) | Volume (MCM) | STDEV
(m3/s) | Mean Flow (m3/s) | Volume (MCM) | STDEV
(m3/s) |
|---|
| Jan | 1.1 | 3.0 | 0.6 | 7.2 | 19.3 | 3.1 |
| Feb | 0.9 | 2.3 | 0.4 | 6.5 | 15.6 | 2.7 |
| Mar | 1.3 | 3.5 | 0.7 | 9.3 | 24.9 | 4.4 |
| Apr | 3.1 | 7.9 | 2.0 | 17.6 | 45.6 | 8.9 |
| May | 2.8 | 7.4 | 1.5 | 15.7 | 42.2 | 6.7 |
| Jun | 1.6 | 4.2 | 0.8 | 9.8 | 25.3 | 4.4 |
| Jul | 1.1 | 2.9 | 0.7 | 7.0 | 18.8 | 3.4 |
| Aug | 1.4 | 3.6 | 0.8 | 8.1 | 24.0 | 4.4 |
| Sept | 2.0 | 5.1 | 1.3 | 12.2 | 31.7 | 6.3 |
| Oct | 2.7 | 7.1 | 1.8 | 15.6 | 41.8 | 8.2 |
| Nov | 3.1 | 7.9 | 1.7 | 17.4 | 44.1 | 7.5 |
| Dec | 1.9 | 5.0 | 0.9 | 11.4 | 30.4 | 4.6 |
| Total | | 60.0 | | | 364.8 | |
Table 5.
Projected average monthly flow for Sebwe and Mubuku by 2040.
Table 5.
Projected average monthly flow for Sebwe and Mubuku by 2040.
| | Sebwe | Mubuku |
|---|
| Month | Flow (m3/s) | Volume (MCM) | STDEV (m3/s) | Flow (m3/s) | Volume (MCM) | STDEV (m3/s) |
|---|
| Jan | 1.0 | 2.7 | 0.6 | 6.5 | 17.5 | 3.2 |
| Feb | 0.8 | 2.0 | 0.4 | 5.6 | 13.5 | 2.7 |
| Mar | 1.1 | 3.0 | 0.8 | 8.1 | 21.6 | 4.7 |
| Apr | 2.6 | 6.7 | 2.0 | 15.5 | 40.2 | 8.9 |
| May | 2.5 | 6.7 | 1.5 | 14.7 | 39.4 | 7.1 |
| Jun | 1.3 | 3.5 | 0.9 | 8.4 | 21.9 | 4.5 |
| Jul | 0.9 | 2.5 | 0.6 | 6.1 | 16.3 | 3.3 |
| Aug | 1.1 | 3.0 | 0.8 | 8.0 | 21.4 | 4.3 |
| Sep | 1.7 | 4.4 | 1.3 | 11.1 | 28.8 | 6.1 |
| Oct | 2.3 | 6.2 | 1.7 | 14.1 | 37.8 | 7.8 |
| Nov | 2.8 | 7.3 | 1.7 | 16.5 | 42.7 | 7.6 |
| Dec | 1.7 | 4.6 | 1.1 | 10.7 | 28.7 | 5.0 |
| Total | | 52.4 | | | 329.8 | |
Table 6.
Domestic, Livestock, Industry and Environmental water demand.
Table 6.
Domestic, Livestock, Industry and Environmental water demand.
| Water Use | 2015 | 2040 | Change |
|---|
| Sebwe | Mubuku | Sebwe | Mubuku | Sebwe | Mubuku |
|---|
| (m3/day) | % |
|---|
| Domestic | 442 | 1976 | 725 | 3243 | 64.0 | 64.1 |
| Livestock | NA | 976 | NA | 1405 | NA | 44.0 |
| Industry | NA | 18 | NA | 90 | NA | 400 |
| Environment | 10% MAF * | 10% of MAF | 10% MAF | 10% MAF | | |
Table 7.
2015 and 2040 Hydropower water demand (MW) in Mubuku sub catchment.
Table 7.
2015 and 2040 Hydropower water demand (MW) in Mubuku sub catchment.
| Station Details | 2015 | 2040 | Change (%) |
|---|
| Bugoye | 13 | 13 | 0 |
| Eco-Gardens | 0.002 | 0.008 | 300 |
| KCCL | 10 | 10 | 0 |
| Kilembe | 5 | 17.8 | 256 |
Table 8.
Projected irrigation area (Ha) in Sebwe and Mubuku sub catchment.
Table 8.
Projected irrigation area (Ha) in Sebwe and Mubuku sub catchment.
| Station Details | 2015 | 2040 | Change |
|---|
| Sebwe | Mubuku | Sebwe | Mubuku | Sebwe | Mubuku |
|---|
| Mubuku | NA | 516 | NA | 996 | NA | 93.0 |
| Kabukero | NA | 202 | NA | 202 | NA | 0.0 |
| Nyabubaare | NA | 13 | NA | 13 | NA | 0.0 |
Table 9.
Sebwe water use reliability for the three scenarios.
Table 9.
Sebwe water use reliability for the three scenarios.
| Month | Sc00 (Baseline 2015) | Sc01 (Future 2040 with No Management Options) | Sc02 (Future 2040 with Management Options) |
|---|
| Demand | Demand Met | Reliability (%) | Demand | Demand Met | Reliability (%) | Demand | Demand Met | Reliability (%) |
|---|
| | MCM | | MCM | | MCM | |
|---|
| Jan | 0.4 | 0.4 | 100 | 1.1 | 0.8 | 76 | 0.9 | 0.8 | 94 |
| Feb | 0.8 | 0.7 | 94 | 1.9 | 0.8 | 45 | 1.5 | 0.8 | 56 |
| Mar | 1.2 | 1.0 | 87 | 2.7 | 0.9 | 35 | 2.2 | 0.9 | 44 |
| Apr | 0.9 | 0.8 | 89 | 2.1 | 1.0 | 47 | 1.7 | 1.0 | 59 |
| May | 1.1 | 1.0 | 95 | 2.1 | 1.3 | 60 | 1.7 | 1.3 | 75 |
| Jun | 1.0 | 0.9 | 91 | 1.9 | 0.9 | 46 | 1.6 | 0.9 | 58 |
| Jul | 0.5 | 0.5 | 100 | 1.0 | 0.7 | 68 | 0.8 | 0.7 | 84 |
| Aug | 0.7 | 0.7 | 96 | 1.4 | 0.8 | 59 | 1.1 | 0.8 | 73 |
| Sep | 1.2 | 1.0 | 90 | 2.7 | 1.3 | 48 | 2.2 | 1.3 | 60 |
| Oct | 0.8 | 0.8 | 92 | 2.1 | 1.3 | 62 | 1.7 | 1.3 | 77 |
| Nov | 0.7 | 0.6 | 98 | 1.6 | 1.3 | 78 | 1.3 | 1.3 | 98 |
| Dec | 0.5 | 0.5 | 98 | 1.5 | 0.9 | 63 | 1.2 | 0.9 | 79 |
Table 10.
Mubuku water use reliability for the three scenarios.
Table 10.
Mubuku water use reliability for the three scenarios.
| | Sc00 (Baseline 2015) | Sc01 (Future 2040 with No Management Options) | Sc02 (Future 2040 with Management Options) |
|---|
| Month | Demand | Demand Met | Reliability (%) | Demand | Demand Met | Reliability (%) | Demand | Demand Met | Reliability (%) |
|---|
| | MCM | | MCM | | MCM | |
|---|
| Jan | 0.1 | 0.1 | 100 | 0.6 | 0.6 | 100 | 0.6 | 0.6 | 100 |
| Feb | 0.2 | 0.2 | 100 | 0.6 | 0.6 | 100 | 0.6 | 0.6 | 100 |
| Mar | 0.5 | 0.5 | 100 | 1.0 | 1.0 | 100 | 0.9 | 0.9 | 100 |
| Apr | 0.7 | 0.7 | 100 | 1.1 | 1.1 | 100 | 1.0 | 1.0 | 100 |
| May | 0.8 | 0.8 | 100 | 1.3 | 1.3 | 100 | 1.1 | 1.1 | 100 |
| Jun | 0.7 | 0.7 | 100 | 1.1 | 1.1 | 100 | 1.0 | 1.0 | 100 |
| Jul | 0.1 | 0.1 | 100 | 0.6 | 0.6 | 100 | 0.6 | 0.6 | 100 |
| Aug | 0.2 | 0.2 | 100 | 0.7 | 0.7 | 100 | 0.7 | 0.7 | 100 |
| Sep | 0.6 | 0.6 | 100 | 1.0 | 1.0 | 100 | 0.9 | 0.9 | 100 |
| Oct | 0.6 | 0.6 | 100 | 1.0 | 1.0 | 100 | 0.9 | 0.9 | 100 |
| Nov | 0.5 | 0.5 | 100 | 0.9 | 0.9 | 100 | 0.8 | 0.8 | 100 |
| Dec | 0.3 | 0.3 | 100 | 0.8 | 0.8 | 100 | 0.7 | 0.7 | 100 |
Table 11.
Annual water demand deficit.
Table 11.
Annual water demand deficit.
| | Scenarios |
|---|
| sc00 (Baseline 2015) | sc01 (Future 2040 with No Management Options) | sc02 (Future 2040 with Management Options) |
|---|
| Mubuku | Sebwe | Mubuku | Sebwe | Mubuku | Sebwe |
|---|
| Total Demand (MCM) | 5.2 | 9.7 | 10.7 | 22.1 | 9.9 | 17.8 |
| Met Demand (MCM) | 5.2 | 8.9 | 10.7 | 12.1 | 9.9 | 12.1 |
| Deficit (MCM) | 0.0 | 0.8 | 0.0 | 10.0 | 0.0 | 5.7 |
| Publisher’s Note: MDPI stays neutral with regard to jurisdictional claims in published maps and institutional affiliations. |
© 2021 by the authors. Licensee MDPI, Basel, Switzerland. This article is an open access article distributed under the terms and conditions of the Creative Commons Attribution (CC BY) license (https://creativecommons.org/licenses/by/4.0/).


 ,
, 


