Article

Environmental Antimicrobial Resistance in a Small Urban Mediterranean River: A Focus on Endemic Beta-Lactamases in Clinically Relevant Bacteria

1
HSM University Montpellier, CNRS, IRD, 34000 Montpellier, France
2
HSM University Montpellier, CNRS, IRD, CHU de Montpellier, 34000 Montpellier, France
*
Author to whom correspondence should be addressed.
These authors contributed equally.
Water 2021, 13(15), 2010; https://doi.org/10.3390/w13152010
Submission received: 8 June 2021 / Revised: 15 July 2021 / Accepted: 17 July 2021 / Published: 22 July 2021

Abstract

:
Aquatic ecosystems subjected to anthropic pressures are likely hotspots for emergence or dissemination of antimicrobial resistant bacteria. The city of Montpellier is located on a Mediterranean climate watershed that undergoes strong demographic pressures. The aim of the study is to explore antimicrobial resistance, particularly those of clinical concern, in urban rivers flowing in this urban area. The method developed herein to explore antimicrobial resistance is based on cultural and molecular approaches completed by hydrological, hydrogeological, climatic, and physico-chemical data. Hospital vicinity and urbanization density significantly increase cultivable bacterial community, fecal bacteria from human origin, and prevalence of β-lactamases and extended-spectrum β-lactamases encoding-genes without an increase in 16S rDNA gene abundance. A total of 22 multidrug Enterobacterales have been isolated. All Escherichia coli (n = 10) and Klebsiella pneumoniae (n = 6) isolated on a made-house media carried β-lactamases genes, blaCTX-M being the most prevalent (87%), followed by blaTEM (56%) and blaSHV (37%), 56% of these strains carrying two or three of these genes. In urban settings, water quality and infectious risk are generally linked to wastewater treatment plants effluents. This study shows that running waters in urbanized area contribute to the dissemination of antimicrobial resistance, making these environments a reservoir for resistant bacteria with important consideration.

Graphical Abstract

1. Introduction

Antimicrobial resistance (AMR) is a major problem of public health because of the current increase of resistant bacteria involved in both hospital- and community-acquired infections. Among all classes of antibiotics, β-lactam remains the major class because of the number of commercialized molecules, their massive usage worldwide, and their indications in both first and last resort to treat both minor and severe infections. Thereby, the Word Health Organization (WHO) priority list of pathogens, against which it is urgent to develop new antibiotics, includes mainly pathogens that display resistance to β-lactams. Gram-negative bacteria resistant to third-generation cephalosporins or to carbapenems are on the top of this list underlying the public health-impact of these resistant bacteria [1]. Resistance to third-generation cephalosporins caused by the production of extended spectrum β-lactamases (ESBL) are currently considered as endemic while carbapenemase-producing bacteria still emerging. ESBL production is a major problem because it confers resistance to most of β-lactams, and it causes multidrug resistances (MDR) when combined with resistance to other classes such as fluoroquinolones, another class under the close surveillance of WHO [2]. In France, 3.6% of invasive isolates of Escherichia coli and 29.8% of invasive isolates of Klebsiella pneumoniae (2015–2018 mean values) are resistant to third-generation cephalosporins [3].
The national action plan for AMR control and prevention is based on an extensive surveillance system for clinical AMR and on a monitoring of the consumption of antibiotics in human and veterinary medicine. Moreover, in respect with the “One World-One Health” concept [4], one of the objectives of this plan is to improve knowledge on AMR in the environmental sector, based on the determination of new tools and new indicators shared between clinical, veterinary, and environmental sectors. One of the proposed indicator is the quantification of E. coli resistant to third-generation cephalosporins or ESBL-producer E. coli, using cultural methods [5,6]. WHO proposes the same indicator to ensure an integrated multisectoral surveillance including human samples and water bodies [7].
Among aquatic environments, wastewater effluents from humans and livestock have been widely investigated for the presence of antibiotic compounds, antimicrobial resistant bacteria (ARB), and antimicrobial resistance genes (ARGs). Beside these hydrosystems, urban hydrosystems subjected to anthropogenic pressures are likely hotspots for selection and emergence of ARB [8] and are increasingly considered in AMR studies. Recent studies reported carbapenemase- or ESBL-producing gram-negative bacteria in European [9,10,11] and Asian [12,13] urban environments, but studies mainly focus on urban contaminated effluents, like wastewater treatment plants (WWTP), or anthropic activities [14,15] and their impacts on water quality. On the other hand, there are still sparse data on ESBL-producing bacteria in clinically relevant bacterial species at an urban river scale [10]. Moreover, the influence of physical, chemical, hydrologic, and climatic conditions are generally not considered.
This study focuses on the watershed of a small urban French Mediterranean river that displayed sites and tributaries impacted by diverse levels of urbanization. The aim was to study AMR to β-lactams. Secondarily, AMR to fluoroquinolone, a resistance frequently associated to β-lactams resistance in MDR bacteria, was also measured. Data were interpreted regarding climatic, hydrologic, chemical parameters and fecal contamination at 3 sampling dates. For one campaign, the characterization of ARBs and ARGs was deepen by the determination of the origin of fecal contamination, by the quantification of 3 β-lactamases encoding genes in the bacterial community, and by the characterization on some clinically relevant MDR-enterobacteria. This study suggests that urban environment influences ARB and ARG in surface waters.

2. Materials and Methods
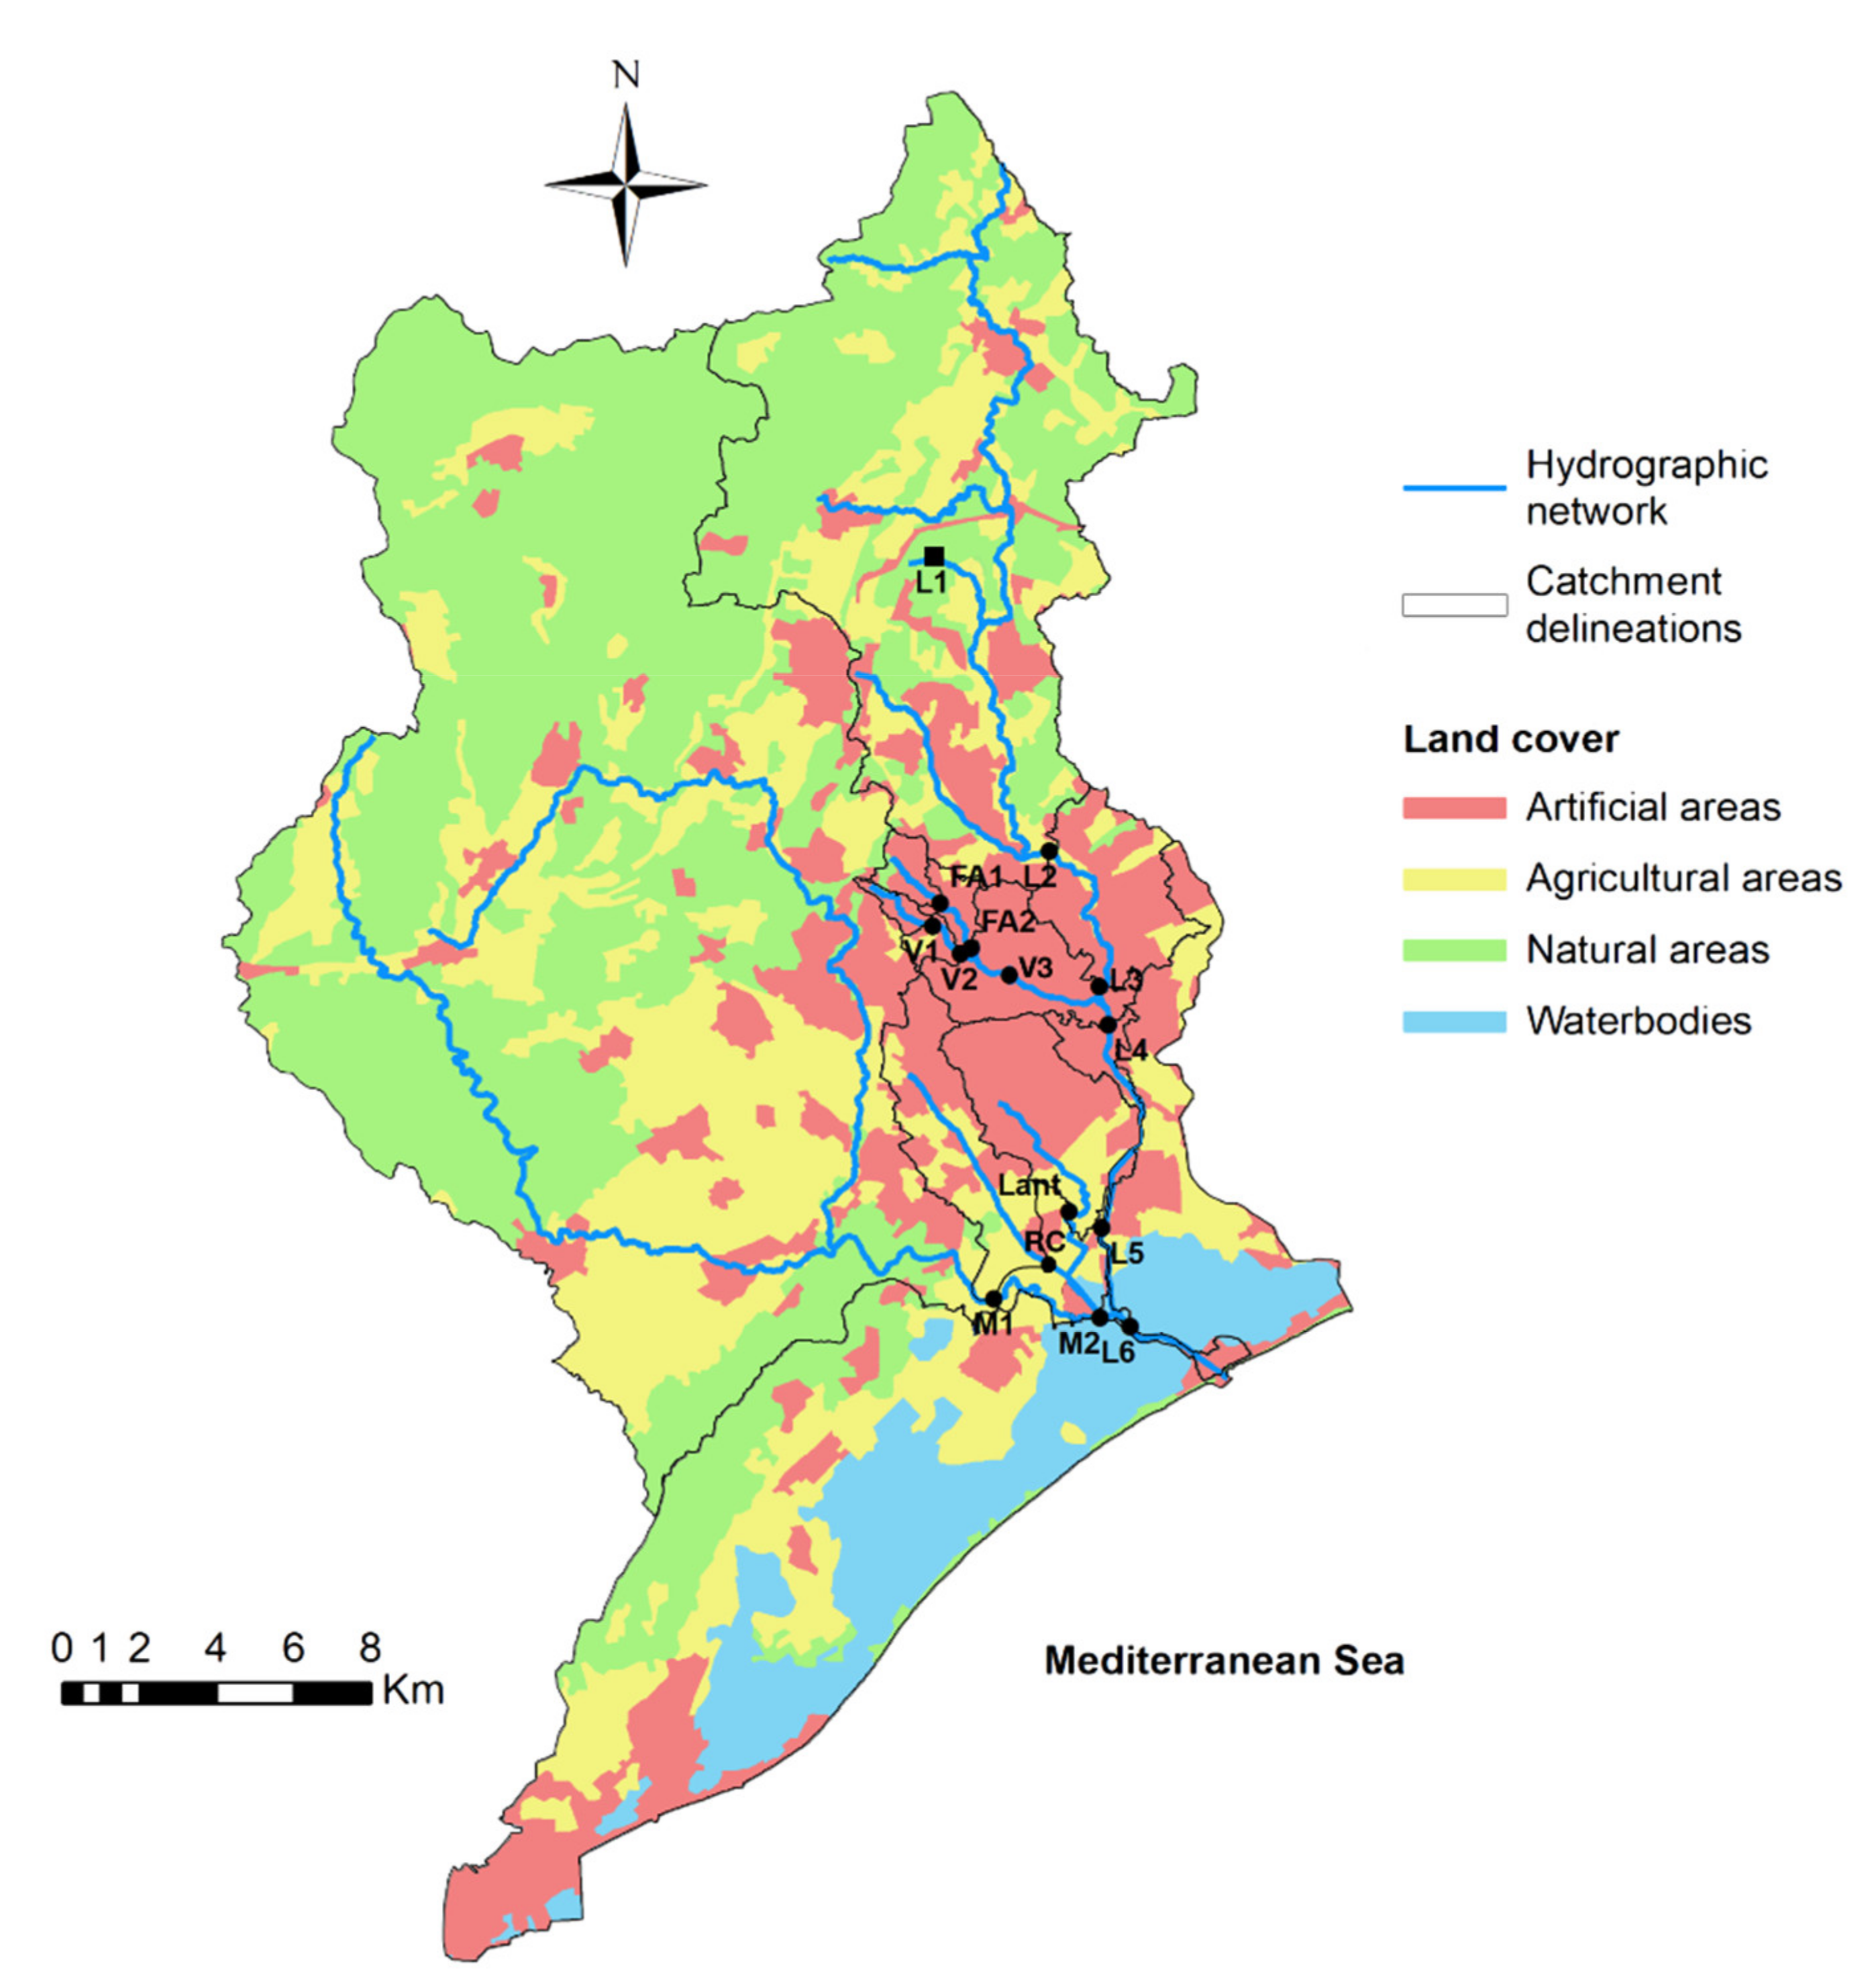
2.1. Study Area

Located in the South of France and fed by a karstic spring, the Lez River (L) is a 29.5 km long coastal river crossing the densely urbanized area of Montpellier and the coastal lagoons of Mauguio before flowing into the Mediterranean Sea (Figure 1). Its two main tributaries are (i) the Verdanson River (V), a 7.5 km long watercourse that drains an entirely urbanized catchment area, itself fed by Font d’Aurelle (FA) tributary, and (ii) downstream the Mosson River (M) (35 km long) that flows to the lagoons, itself fed by two peri-urban tributaries the Lantissargues (Lant) and Rieu-Coulon (RC). The Terrieu and Lirou, secondary tributaries, located in the upper end of the Lez karst spring are ephemeral rivers which are flowing mainly under heavy rainfall conditions. The Lez catchment (709 km2) has a density of 804 inhabitants per km2 that mainly regroup in Montpellier agglomeration. It shares urban, agricultural, and natural land use (Figure 1). The Mediterranean climate presents semi-arid conditions with an annual rainfall average of 672 mm/year with main rainfall events in autumn, and a temperature range from 2.8 °C to 29.3 °C. This territorial area has been identified as site for antimicrobial study (http://rablez.msem.univ-montp2.fr/, accessed on 19 July 2021).

2.2. Sampling Strategy

Within the Lez River and its tributaries, a network of 15 sampling sites was designed for assessing urban impacts on water quality and antimicrobial resistance (Figure 1). The Lez watershed presents contrasted land cover including artificial urban area (Figure 1). Six sampling sites were located along the Lez River, the baseline of the river water downstream to the karst spring (L1), the entrance of the urban area (L2), and the sites L3 to L5 gradually located down to the urban and the peri-urban zones, up to L6 close to the mouth in the Mediterranean Sea. In the fully urbanized sub-catchment tributaries, the sampling sites on Verdanson River assessed the influence of residential areas (V1 and V2 sites), whereas hospital influence was assessed at the FA1 and FA2 sites located on Font d’Aurelle River which is channeled under the hospital area. FA1 and FA2 were respectively upstream and downstream of hospital infrastructure. Then, waters collected in the V3 site downstream the confluence of Verdanson and Font d’Aurelle Rivers were exposed to both residential and hospital pressures. Water quality and environmental AMR were also assessed in the largest and least urbanized tributary: the Mosson River (M1 and M2 sampling sites), and its tributaries which are flowing through urban and peri-urban areas, the RC and the Lant watercourses.
The main characteristics of the upstream subcatchments for the 15 measurements sites are given in Figure 1. The drained areas range from 1.1 km2 (V1 site) to 520 km2 (L6 sites). Anthropogenic area account for 12% (M sites) to 95% (V sites) of the catchments area. The sites along the tributaries can be gathered according to the percentage of artificialized surface. First, the sites for which the drained area is at least 75% urbanized (FA1, FA2, V2, V3, Lant) and, secondly, the sites M1 and M2 downstream of an area of dominant natural land use. The land use of the RC site, equally divided between urbanization and agriculture, form a third group.
Because of Mediterranean climate, this area undergoes intense rainfall episodes and long periods of drought. This leads to the planification of sampling campaigns over a hydrological year, each campaign including the fifteen sites. This study reports on three sampling campaigns driven in low flow conditions: two in spring (campaign 1, C1, 9 May 2016 and campaign 3, C3, 12 June 2017) and one in winter (campaign 2, C2, 12 December 2016). C1 took place during rainy weather in spring while C2 and C3 sampling occurred during dry and sunny days.
For each sampling site, a velocity profiler (electromagnetic current meter or Acoustic Doppler Current Profiler) was used to assess the flow discharge. Daily rainfall data come from the Montpellier-Frejorgues weather station and were provided by Météo-France.
Samples for trace element analyzes were filtered from sampling sites through 0.22 µm acetate cellulose filters and stored by acidification to 1‰ with nitric acid (Merck Suprapur). A volume of 30 mL was filtered from sampling sites through Whatman GF/F. Samples were collected in pre-combusted (450 °C, overnight) amber glass tubes, sealed with a Teflon lined cap, and preserved with 36 µL of 85% phosphoric acid (H3PO4) for dissolved organic carbon concentration (DOC) determination. Samples were stored at ambient temperature in the dark until measurement. For microbial analysis, 2 L of water samples were collected at a depth of 5 cm below the surface in sterilized bottles and stored at 4 °C. Laboratory analysis was performed within the day.

2.3. Physico-Chemical and Chemical Characterization of Water

2.3.1. Physico-Chemical Parameters

In situ parameters including water temperature, pH, conductivity, and dissolved oxygen concentrations were measured using a portable calibrated multimeter HACH (Hq40d) equipped with LDO101, pHC301 and CDC40101 probes.

2.3.2. Major Ions Analysis

Major ions Cl, NO3, SO42−, Ca2+, Mg2+, Na+, K+ were determined by ion chromatography on filtered samples. HCO3- concentrations were determined by acid titration.

2.3.3. Metals and Organotin Analysis

Dissolved trace element concentrations, including rare earth element (REE) were measured using inductively coupled plasma mass spectrometry (ICP-MS-Q, iCAP-Q, Thermo Fisher Scientific®, Bremen, Germany).
Indium (In) and bismuth (Bi) were used as internal standards to correct for changes in peak intensities due to instrumental drift. The accuracy and the precision of the methods have been tested using a natural river water reference material SLRS-6 certified by the Canadian National Research Council (CNRC). Measured concentrations for certified elements agreed with recommended values (±10%).
For analysis of organotin compounds (monobutyltin (MBT), dibutyltin (DBT), and tributyltin (TBT)), total concentrations (dissolved and particulate phases) were measured using a gas chromatograph (Focus GC Thermo Fisher Scientific®) coupled with an inductively coupled plasma mass spectrometer (ICP-MS X Series II-Thermo Fisher Scientific ®). After derivatization and liquid extraction, quantification was done by standard additions. The accuracy of this methodology was evaluated by analysis of the sediment standard reference material, PACS-2 (National Research Council, Canada).
The gadolinium (Gd) anomaly (Gd*), i.e., the excess Gd in water, has been interpolated from the shale-normalized concentrations of its two neighboring REE, Samarium (Sm) and terbium (Tb) [16].

2.3.4. Dissolved Organic Carbon

Dissolved organic carbon concentration (DOC) was measured using a Shimadzu TOC VCPH analyzer.

2.4. Bacterial Enumeration

2.4.1. Fecal Indicator Bacteria (FIB) Quantification

To enumerate fecal indicator bacteria (thermotolerant coliforms (TTC) and intestinal enterococci (IE)), water samples were processed at the laboratory using the reference methods ISO 9308-1:2014 and ISO 7899-2:2000, respectively. Water volumes (0.1, 1, 10, and 100 mL) were filtered on 0.45 µm cellulose nitrate membrane (Sartorius). TTC were quantified on Lactose Triphenyl Tetrazolium Chloride Tergitol-7 agar (Biokar) incubated for 24 h at 44 °C, and IE were enumerated on Slanetz-Bartley agar (Biokar) incubated for 48 h at 37 °C. The results are expressed as Colony Forming Units (CFU) per liter.

2.4.2. Heterotrophic Cultivable Bacteria and Antimicrobial Resistant Bacteria Enumeration

For every water sample, 100 µL of non-diluted and diluted (10- and 100-fold) sampled water were spread on Trypticase Soy Agar plates (TSA, Difco laboratories) supplemented or not with each following antibiotic: amoxicillin (AMX, 8 mg/L), ceftazidime (CAZ, 4 mg/L), and ofloxacin (OFL, 1 mg/L). AMX and OFL were chosen because of their massive clinical use and CAZ, a third-generation cephalosporin, was chosen as a marker for acquired multidrug resistance in major human pathogens like Pseudomonas aeruginosa and Enterobacterales. E. coli ATCC8731 strain has been used to validate the selective activity of each medium-type. Then, plates were incubated during 72 h at 22 °C. Enumeration of bacterial colonies (CFU) grown on media with and without antibiotic allows us to define cultivable bacteria concentration (CFU/L) and the percentage of antimicrobial resistant bacteria among total cultivable bacterial community.

2.4.3. Multidrug Resistant Gram-Negative Bacteria Enumeration

A volume of 100 µL of sampled water was spread on Drigalski agar media (Bio-Rad laboratories) supplemented with CAZ (4 mg/L), OFL (1 mg/L), and tetracycline (TET, 8 mg/L), called multi-ATB medium, enabling the isolation of multidrug resistant Gram-negative bacteria. E. coli ATCC8731 strain was used to validate the selective activity of this medium. Colonies were enumerated after an incubation of 24 h at 37 °C, conditions chosen to promote the growth of potential human pathogen bacteria.

2.5. Isolation and Characterization of Multidrug Resistant Bacteria

Isolated colonies growing on multi-ATB medium were selected based on their morphology to attempt the diversity of bacteria that resist simultaneously to these 3 antibiotics. Species identification of selected isolates was performed by Matrix Assisted Laser Desorption/Ionization Time-Of-Flight mass spectrometry (MALDI-TOF, Bruker) [17]. Molecular typing of Enterobacterales isolates was performed with multiplex rep-PCR as previously described [18,19,20]. Antimicrobial susceptibility tests were performed by disk diffusion assay method on Mueller-Hinton agar, according to the Antibiogram Committee of the French Society of Microbiology [21] or the Clinical and Laboratory Standards Institute (CLSI). The Multiple Antibiotic Resistance (MAR) index was determined by following the procedure described by Krumperman [22]. MAR index is the ratio of number of antibiotics to which organism is resistant to total number of antibiotics tested, here 28 antibiotics. When ESBL production was detected with the double-disc synergy test on antibiogram [23], the genes encoding the widely encountered β-lactamase-types TEM, SHV, and CTX-M (blaTEM, blaSHV, and blaCTX-M, respectively) were researched by PCR, as already described [24,25].

2.6. Gene Quantification by Real-Time PCR (qPCR) in Water Samples

2.6.1. DNA Extraction from Water Samples

A volume of 200 to 500 mL of each water sample was filtered through 0.2 µm pore size cellulose acetate filters (Sartorius). Total genomic DNA was isolated using the DNeasy PowerWater kit (Qiagen) according to the manufacturer’s instructions. DNA concentration and quality were verified using NanoDrop One spectrophotometer (Thermo Scientific).

2.6.2. Quantifications

qPCR was used to quantify a conserved region of the 16S rRNA encoding gene, representative of the total bacterial load (cultivable and non-cultivable) [26] and 3 ARGs, encoding β-lactamase enzymes: blaSHV, blaTEM, and blaCTX-M genes [27,28]. In order to discriminate the origins of the fecal contamination, 3 host-associated molecular markers were also quantified by targeting 16S rRNA genes from host specific fecal bacteria: the human-specific HF183 Bacteroides-related [29,30,31], the dog-specific DF475 Bacteroides-related [32], and the gull/seagull-specific bacteria Catellicoccus marimammalium [33,34]. As previously described [35], for each gene, specific amplicons obtained by end-point PCR were sequenced to ensure their identity and cloned using the TOPO® TA cloning® kit (Invitrogen) with pCR™4-TOPO® cloning vector, according to the manufacturer’s instructions. After cloning, plasmids were purified using the NucleoSpin Plasmid kit (Marcherey-Nagel), linearized by enzymatic digestion using PstI (New England Biolabs), purified using the Monarch PCR and DNA Cleanup Kit (New England BioLabs), and quantified on NanoDrop One spectrophotometer (Thermo Scientific) in order to calculate the plasmids’ copy number per microliter. Several 10-fold serial dilutions of each plasmid were done and dilutions were used in qPCR to determine the standard curves.
Absolute quantities of genes were determined by real-time PCR (qPCR) in 96-wells plates using a LightCycler® 480 (Roche). Each qPCR reaction using SYBRGreen chemistry was run in technical duplicates and contained 1X Luna® Universal qPCR Master Mix (New England BioLabs), 0.4 µM of each specific primer (Table S1), 1 µL of sample DNA or standard plasmid, and sterile water to a final volume of 10 µL. After a first heating for 10 min at 95 °C, reactions were carried out for 45 cycles of 95 °C for 10 s, 56 to 62 °C for 10 s (depending on the primers), and 72 °C for 10 s. Finally, qPCR products were gradually heated from 65 °C to 95 °C in order to determine the melting temperature of the amplicons and to verify specificity of the amplification. Quantification results were transformed in gene copy number (CN) per mL of water sample. All the qPCR experiments were done according to The MIQE Guidelines: Minimum Information for Publication of Quantitative Real-Time PCR Experiments [36].

2.7. Statistical Analysis

The normality of data distribution was tested by using a Shapiro–Wilk test, and equality of variances tested by using a Fisher test. To test differences between 2 variables, a t-test was applied on data following a normal distribution, or a Mann–Whitney test for non-normally distributed data. For comparisons of multiple variables, a one-way ANOVA with Tuckey’s post-hoc test or a Kruskal–Wallis test with Dunn’s post-hoc test was used depending on the normality of data. In order to determine correlations between variables, Spearman’s rank correlation coefficients (rs) were calculated and their nullity tested. All statistics were made using the GraphPad Prism software V 5.03. Test results were considered as significant when the associated p-value was at least ≤0.05.

3. Results

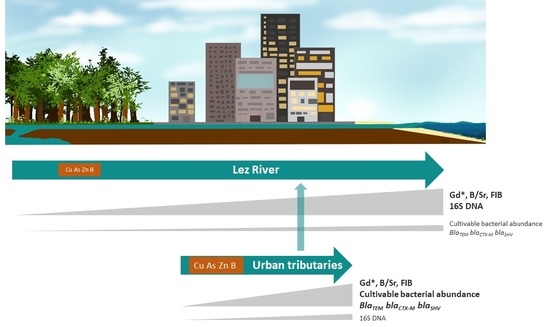
3.1. Description of the System

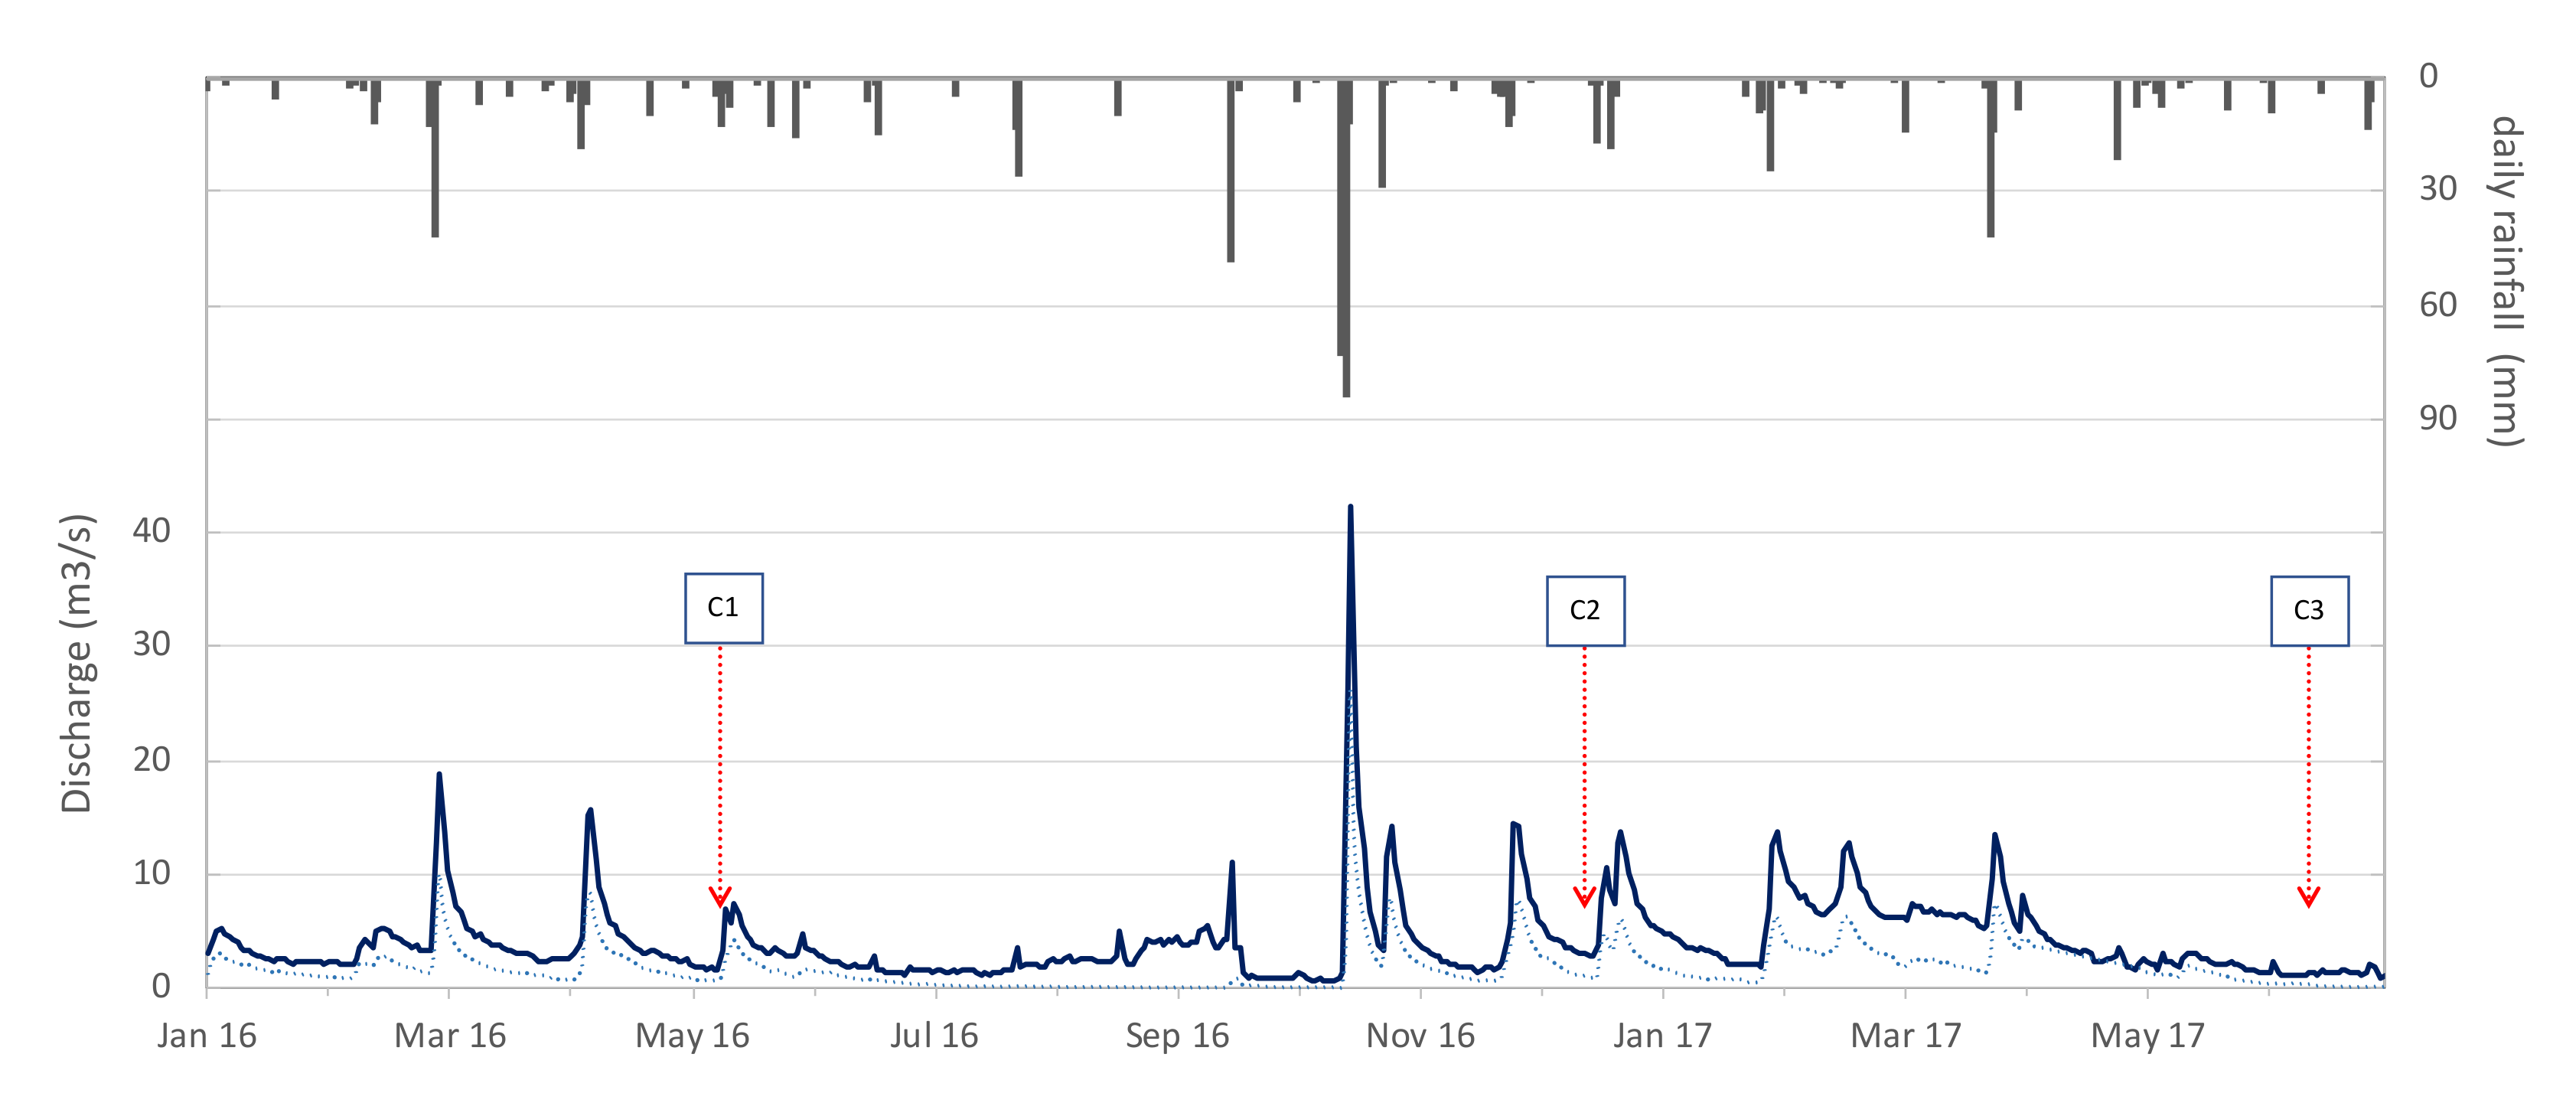
3.1.1. Hydrological Characteristics

The three campaigns were conducted over the course of a year, with one campaign every six months. The first one took place in late spring 2016 (C1), followed by the second one in winter 2016 (C2) and in spring 2017 (C3). The discharge in the Lez River and rainfall between 1 January 2016 and 30 June 2017 are illustrated Figure 2. The average daily flows at sampling points L2 and L5 of the Lez River are reported with the daily rainfall.
The three campaigns have been driven in low-flow conditions. The discharges observed along the main courses (Lez and Mosson rivers) were nearly two order of magnitude larger than tributaries discharges. For all the sites, during the C3 campaign the flows were very low and closed to the low-water or dry level, suggested that anthropogenic releases should significantly contribute to the flow regime [37].
The winter leading up to the C1 campaign was relatively dry: the observed rainfall was about 50% of the interannual average. Rain amount for the 10 days prior to C1 campaign was 7.4 mm, but two-thirds occurred just the day before. Showers happened throughout the day of the C1 sampling for a total daily rainfall amount of 12.7 mm. Then, the summer of 2016 was very dry, and the 2016 autumn rainfall occurred mainly in October. The second campaign C2 ran on a very clear and sunny day typical of early winter. The most significant rain event (10.4 mm depth) was 15 days ago. Common rainfall occurred in the winter and spring before C3 campaign with a total rainfall of 280 mm during this period. The C3 sampling campaign was done during a hot and sunny day in late spring with almost 27 °C average temperature. No significant rain event occurred in the last ten days before the C3 sampling.
Temperature, pH, and oxygen saturation rate, measured during the three campaigns at the 15 sampling sites, are presented in Supplementary Table S2. Conductivity range from 385 to 1313 µS/cm, except higher values for the sites L6 (7980 µS/cm (C1) and 9700 µS/cm (C3)) and M2 (7710 µS/cm (C1)). The L6 and M2 sampling sites are near-sea located at the mouth of the watershed, where high conductivity values correlate with high major ion concentrations (Cl, Na+, SO42−, Mg2+). This indicate a brackish water zone with saltwater inflows at L6.

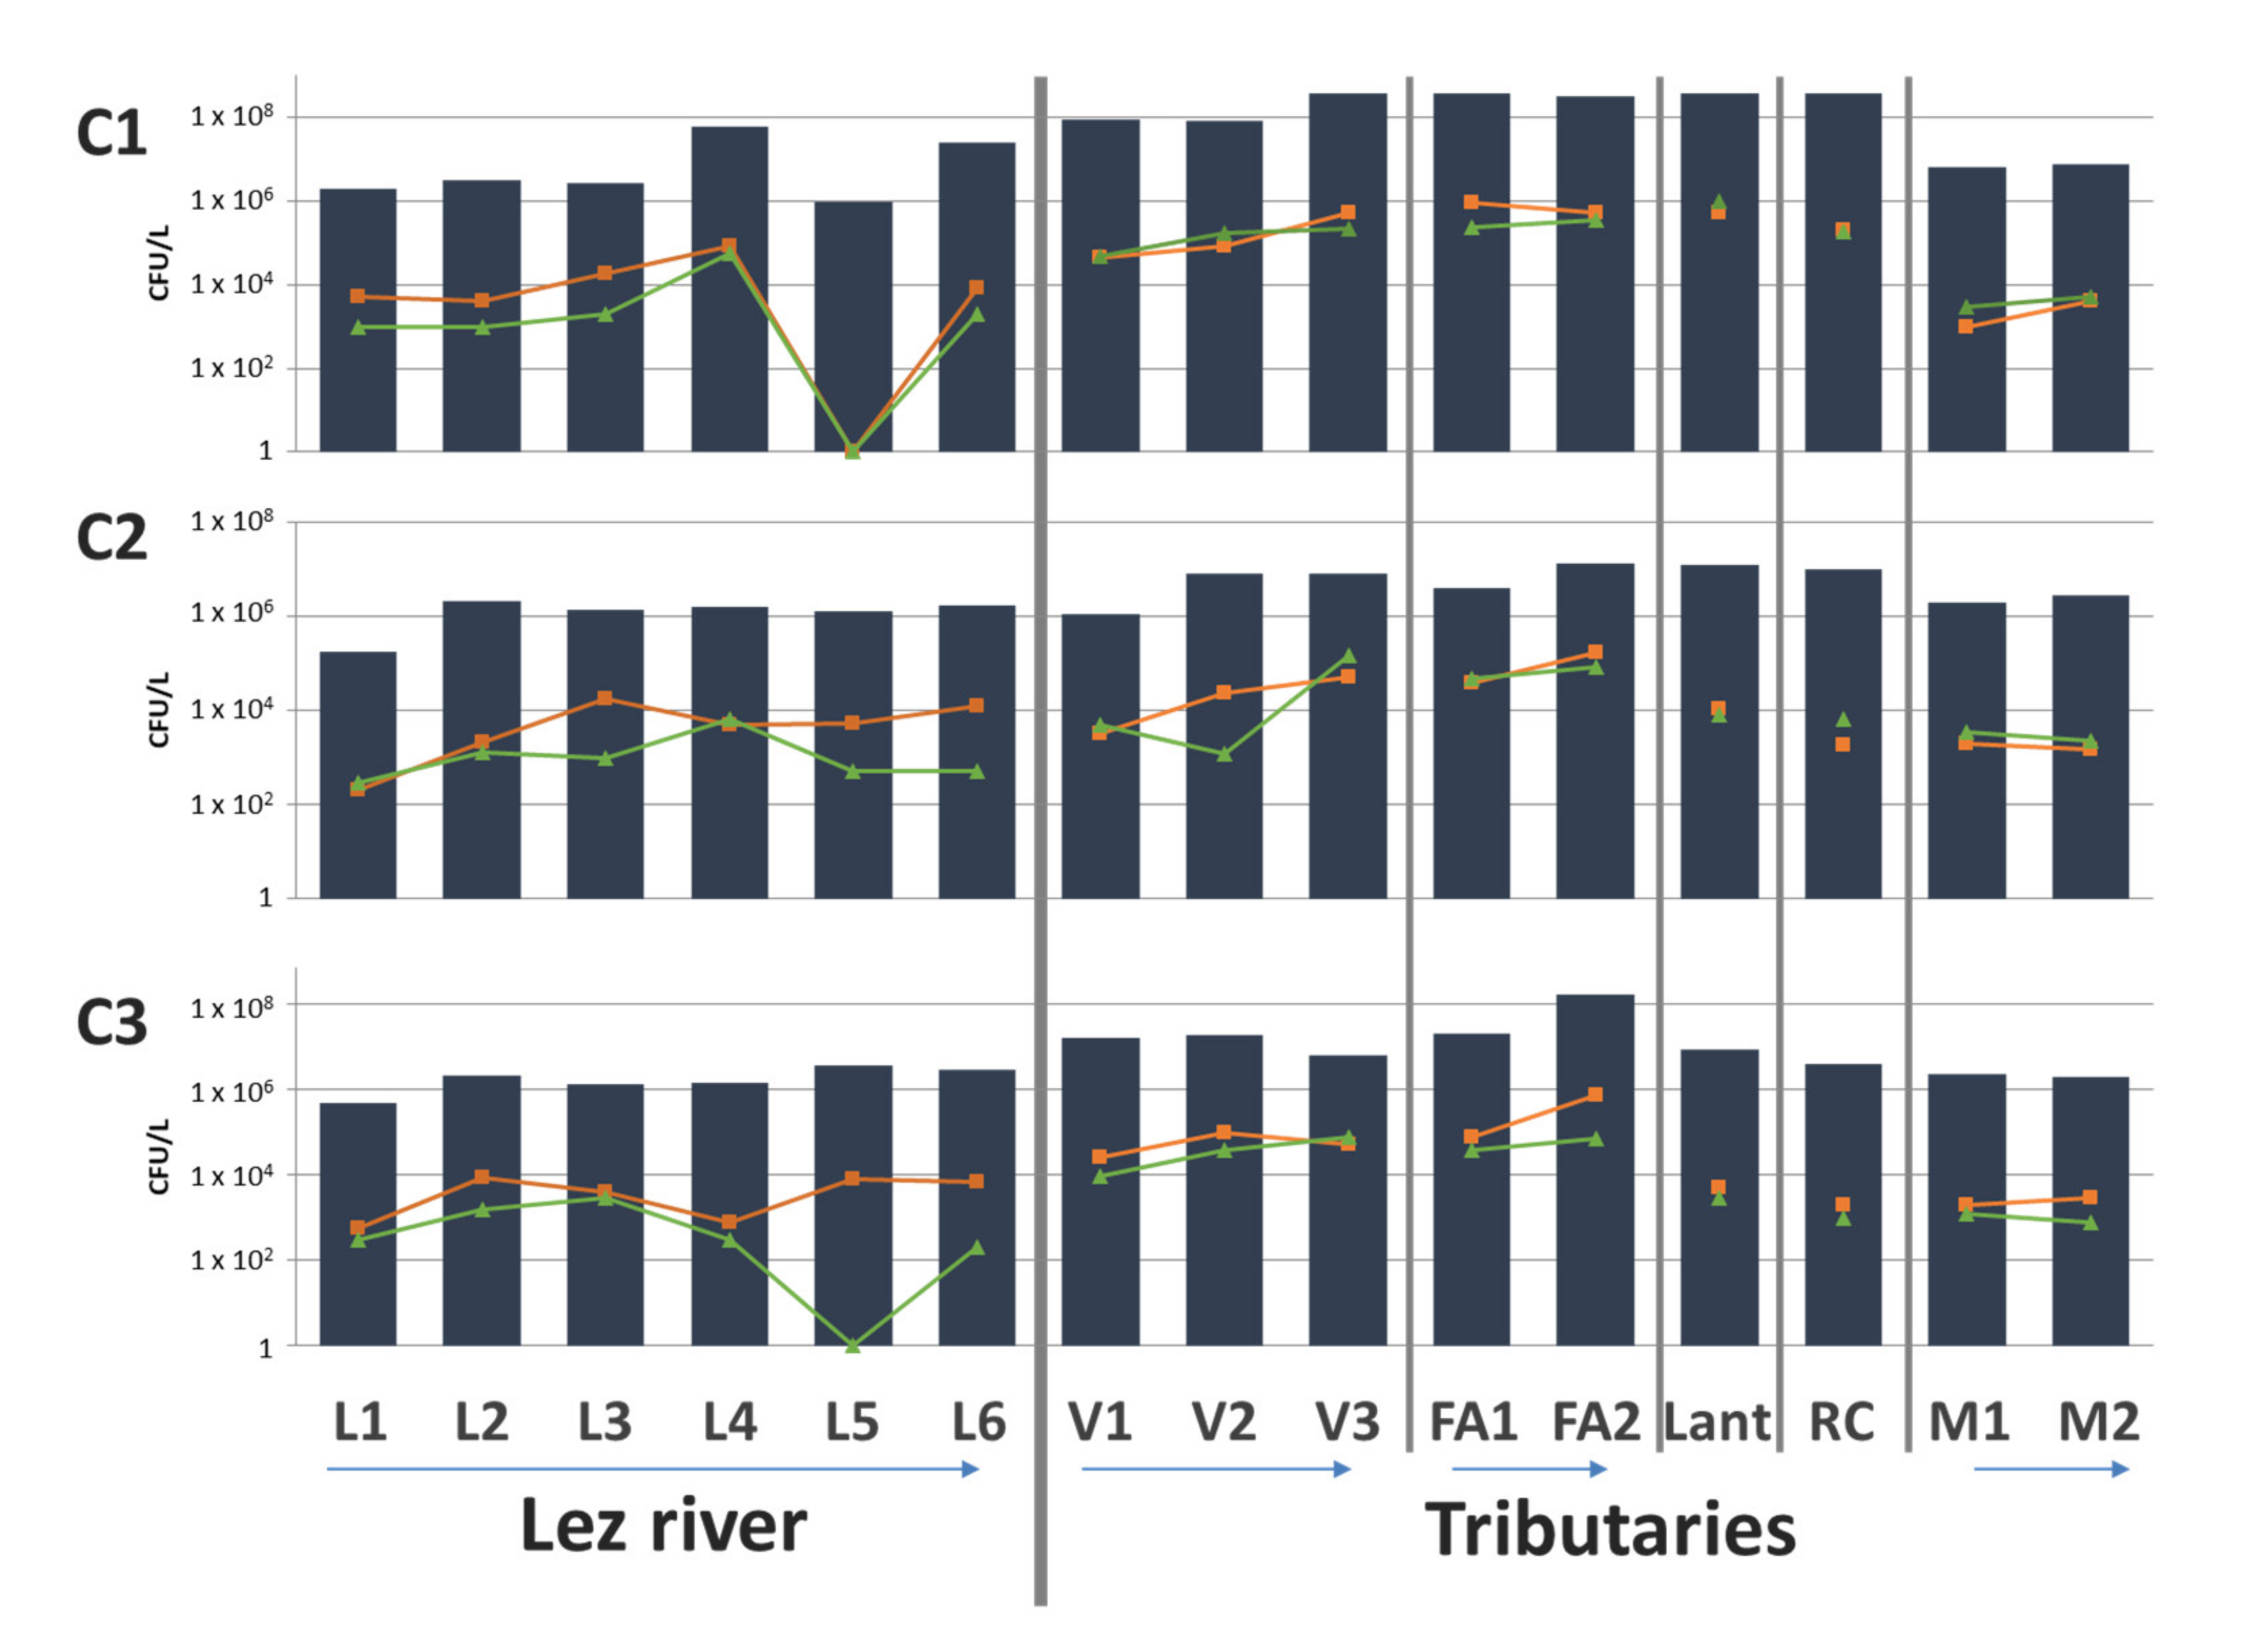
3.1.2. Bacterial Counts

Cultivable communities, estimated by enumeration on TSA, ranged from 1.7 × 10⁵ to 3.7 × 10⁸ CFU/L depending on spatio-temporal variations (Table S2, Figure 3). Except for L2 and L3, the abundance of cultivable bacteria on a given site was systematically significantly higher in C1 campaign compared to C2 and C3 campaigns (p < 0.01 and 0.05, respectively). Except for Mosson River samples, overall cultivable abundances in tributaries were significantly higher than in Lez River for all campaigns (p < 0.05 to p < 0.01), particularly for FA2 site (from 107 to 3 × 10⁸ CFU/L).

3.1.3. Human Source Contamination

Human source of contamination was identified by both chemical and bacteriological parameters. The occurrence of significant positive Gd anomalies (Gd* > 1.4) was observed in 90% of the samples, reflecting anthropogenic gadolinium contamination by wastewater inflow [16]. Considering C1 sampling, 45% of the samples showed Gd anomalies with values higher than 1.5 (from 2.3 to 7.8), which was significantly lower compared to C2 and C3 sampling (p < 0.05 and 0.01). For these last two campaigns C2 and C3, 87% and 93% of samples had extreme positive Gd anomalies. From upstream to downstream of the Lez River watershed, these anomalies were increasing from 3.9 to 19.5 for C2, and from 2.6 to 19 for C3. Highest Gd anomalies were measured in Lez tributaries: 40 in Mosson River, 20 to 50 in Font d’Aurelle, and up to 80 in the Verdanson (Table S2).
Several ratios of chemical tracers such as boron to strontium (B/Sr) can be used to highlight wastewater inflows in the environment. Dynamics of these ratios (µmol/µmol) in the Lez watershed vary depending on the rivers. In the Lez River, the B/Sr ratio increased from 0.3 to 0.88 from the source to the mouth respectively, which was significantly lower than tributaries B/Sr ratio during the three campaigns (p < 0.05 to 0.01). This result argued for a contamination by wastewater (values between 0.77 and 2.66, L6 for C1 and C3 and M2 for C1, were not considered due to seawater intrusion) especially for RC (2.66, 1.80, and 1.91, respectively, for C1, C2, and C3 campaigns).
Abundances of Fecal Indicator Bacteria (FIB) followed similar trend to cultivable heterotrophic bacteria with highest concentrations detected near the hospital at V2, V3, FA1, and FA2, in all campaigns (Figure 3). Abundances of IE were significantly higher in tributaries than in Lez River (p < 0.05 to p < 0.01, depending on the campaign). Among fecal indicator bacteria, 72% of TTC concentrations and 95% of IE concentrations were less than 104 CFU/L. Interestingly for L5 site, a very low concentration of IE was detected in C1 and C3 campaign, also as TTC concentration during C1 campaign.
Concerning Lez continuum, FIB increased from L1 (Lez spring) to the other Lez sites (through urban area), indicating an irregular input of wastewater. However, chemical indicators (Gd* and B/Sr ratio) measurements suggested a gradual input. In regards to the urban tributaries (FA and V), CTT and EI concentrations were systematically upper than 104 CFU/L. These results are in accordance with Gd* anomalies and B/Sr ratios measurements, respectively detected in all samples (except V1 for C1 campaign) and consistently higher in these urban tributaries than the highest value in Lez. These data suggested anthropic pressure by wastewater input in these tributaries. In downstream tributaries (Lant, RC, and M), sampled after urban area, Gd* was detected in 66% of samples and B/Sr mean ratio was about 3.5-times higher than in Lez samples (mean value: 0.48). These results supposed wastewater contamination in this area, whereas FIB concentrations are lower in downstream tributaries than in urban ones.

3.1.4. Chemical Contamination

For trace metal elements (Table S2), copper (Cu) and zinc (Zn) measured concentrations were agreed with Environmental Quality Standards (EQS, [38]) in 33% and 40% of analyzed samples, respectively. For all three campaign, Cu and Zn concentrations in the urban tributaries are significantly higher than in Lez (p < 0.05 to 0.001). Alternatively, Boron (B) and arsenic (As) levels exhibit similar results for C2 and C3 campaigns, and C1 and C2 campaigns, respectively.
Moreover, organotin compounds were systematically detected in water samples. Total concentrations, i.e., sum of all butyltin compound forms, measured in the dissolved and particulate phases were below 14 ng(Sn).L−1 (Table S2). TBT concentrations ranged from 0.08 to 8.92 ng(Sn.L−1); and in 69% of the samples the Maximum Allowable Concentration of Environmental Quality Standard (MAC-EQS) was exceeded (MAC-EQS = 0.61 ng(Sn).L−1 expressed as total concentrations in the whole water sample). During C1 campaign, levels were significantly lower than in the two other campaigns in which all sites had concentrations 2 to 15 times greater than the environmental quality standard.

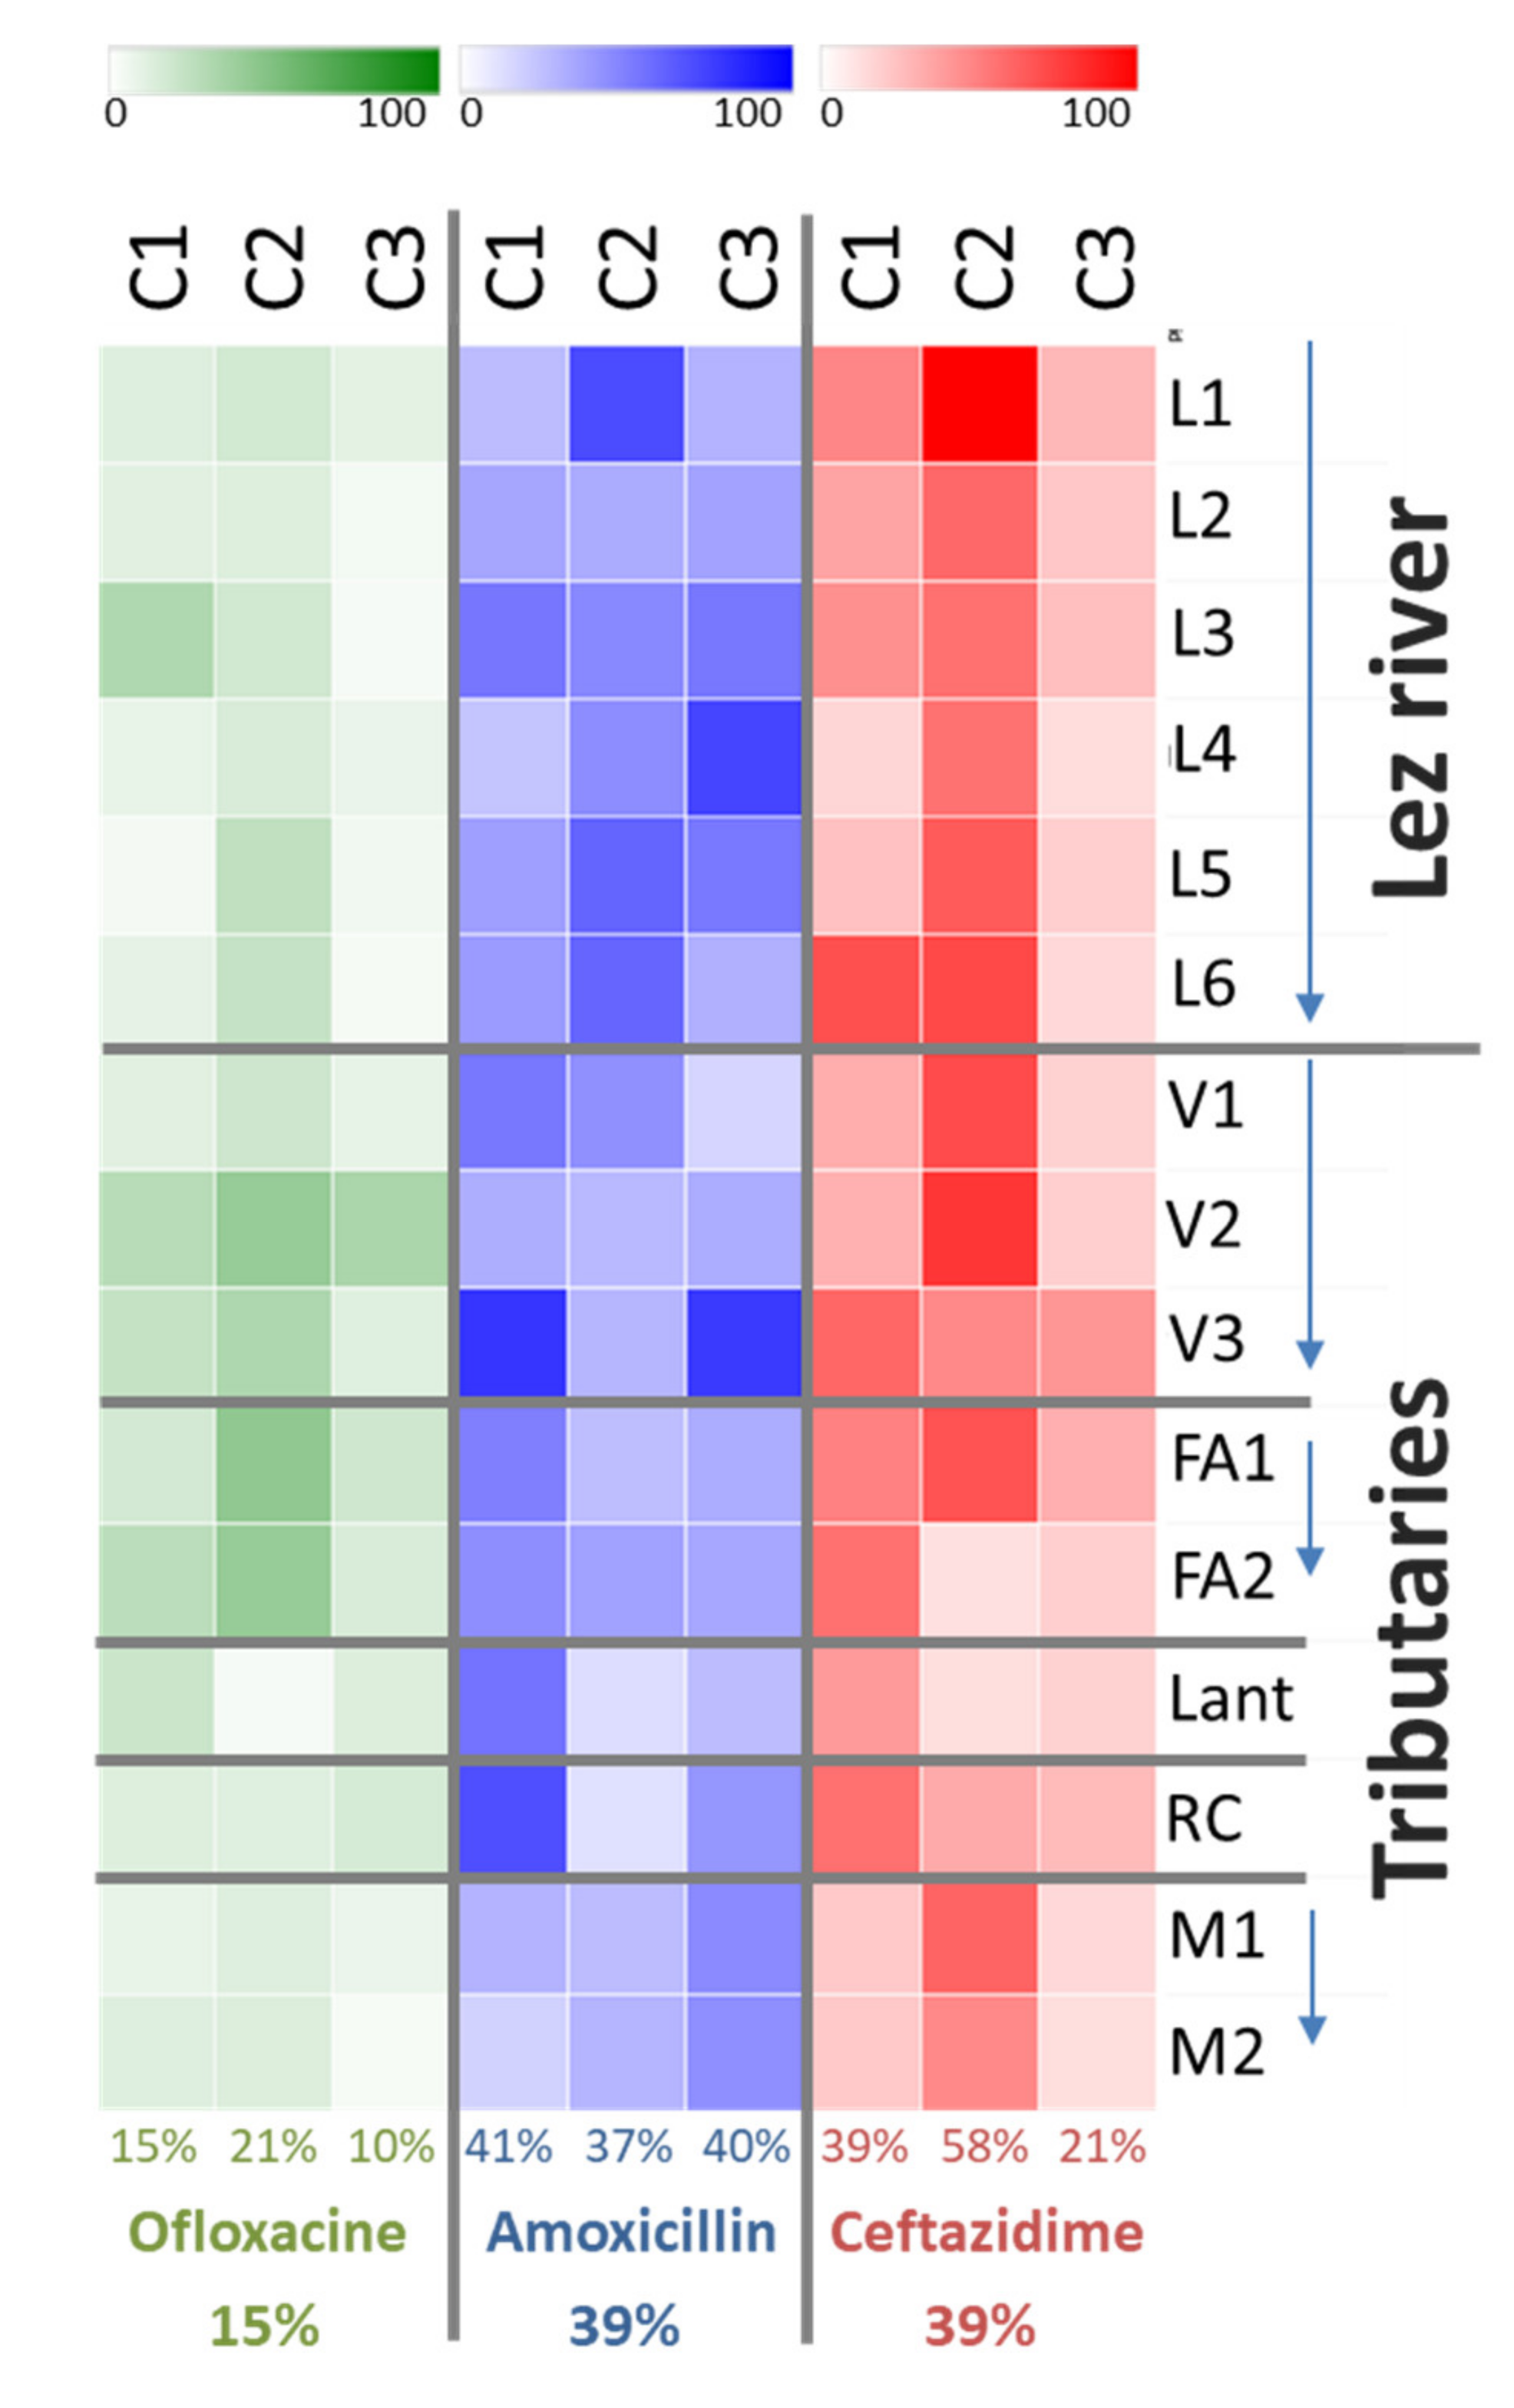
3.2. Characteristics of Environmental AMR with Cultural Approach

To explore antimicrobial resistance in heterotrophic bacterial community, TSA medium was used without antibiotics and with each of the studied antibiotics at the concentration corresponding to the cut-off concentration used in clinical context to categorize strains as resistant ones [21]. Like the cultivable communities and FIB, the percentages of resistance to AMX, OFL, and CAZ varied over time and space. Overall, OFL was the antibiotic for which the percentages of resistant communities were significantly the lowest and ranged from 3% to 43% of resistant communities (p < 0.001, 15% on average across all sampling points and during all campaigns) (Figure 4, Table S2). Along Lez River, different resistance profiles to OFL were observed depending on the campaign. While C2 campaign showed a gradual increase along the continuum, a maximum resistance was demonstrated for L3 in C1 campaign. OFL resistance was always lower in Lez River compared to its tributaries during all the campaigns (significant for C3, p < 0.05), with higher values in V and FA (significantly different during C2, p < 0.05).
Although all sampling sites and campaigns showed a similar resistance rate to AMX and CAZ (39% in average), resistance level in bacterial community depend on time and geographical distribution. While resistance to AMX was relatively stable during the different campaigns (41%, 37%, and 40% for C1, C2, and C3 campaigns), the resistance level to CAZ was significantly different between campaigns (p < 0.05 to 0.001), ranging from 21% (C3 campaign) to 58% (C2 campaign). Like resistance to OFL, resistance to AMX and CAZ showed different profiles along Lez River depending on the campaign. During C2 campaign, the percentage of resistance to these two antibiotics were higher in Lez River (significant for AMX, p < 0.01) compared to the tributaries, while almost no differences were observed during the two other campaigns. A considerable fact is, 100% of the L1 cultivable community was resistant to CAZ during C2 campaign and the five downstream points L2 to L6 also showed strong proportion of CAZ resistance (as did V1, V2, and FA1). Regarding the tributaries, the levels of resistance to AMX and CAZ also varied depending on the campaign but they were overall higher in the urban tributaries Verdanson River and Font d’Aurelle River than in the other tributaries (peri-urban).

3.3. Focus on Clinically Relevant Resistance during the Winter Campaign (C2)

Genetic quantification and characterization of multidrug resistant enterobacteria were performed only for samples from C2 campaign because C2 corresponds to basal conditions: no rainfall (as in C1) and no drought (as in C3). Moreover, the rate of resistance, mainly to CAZ, was higher in C2 samples.

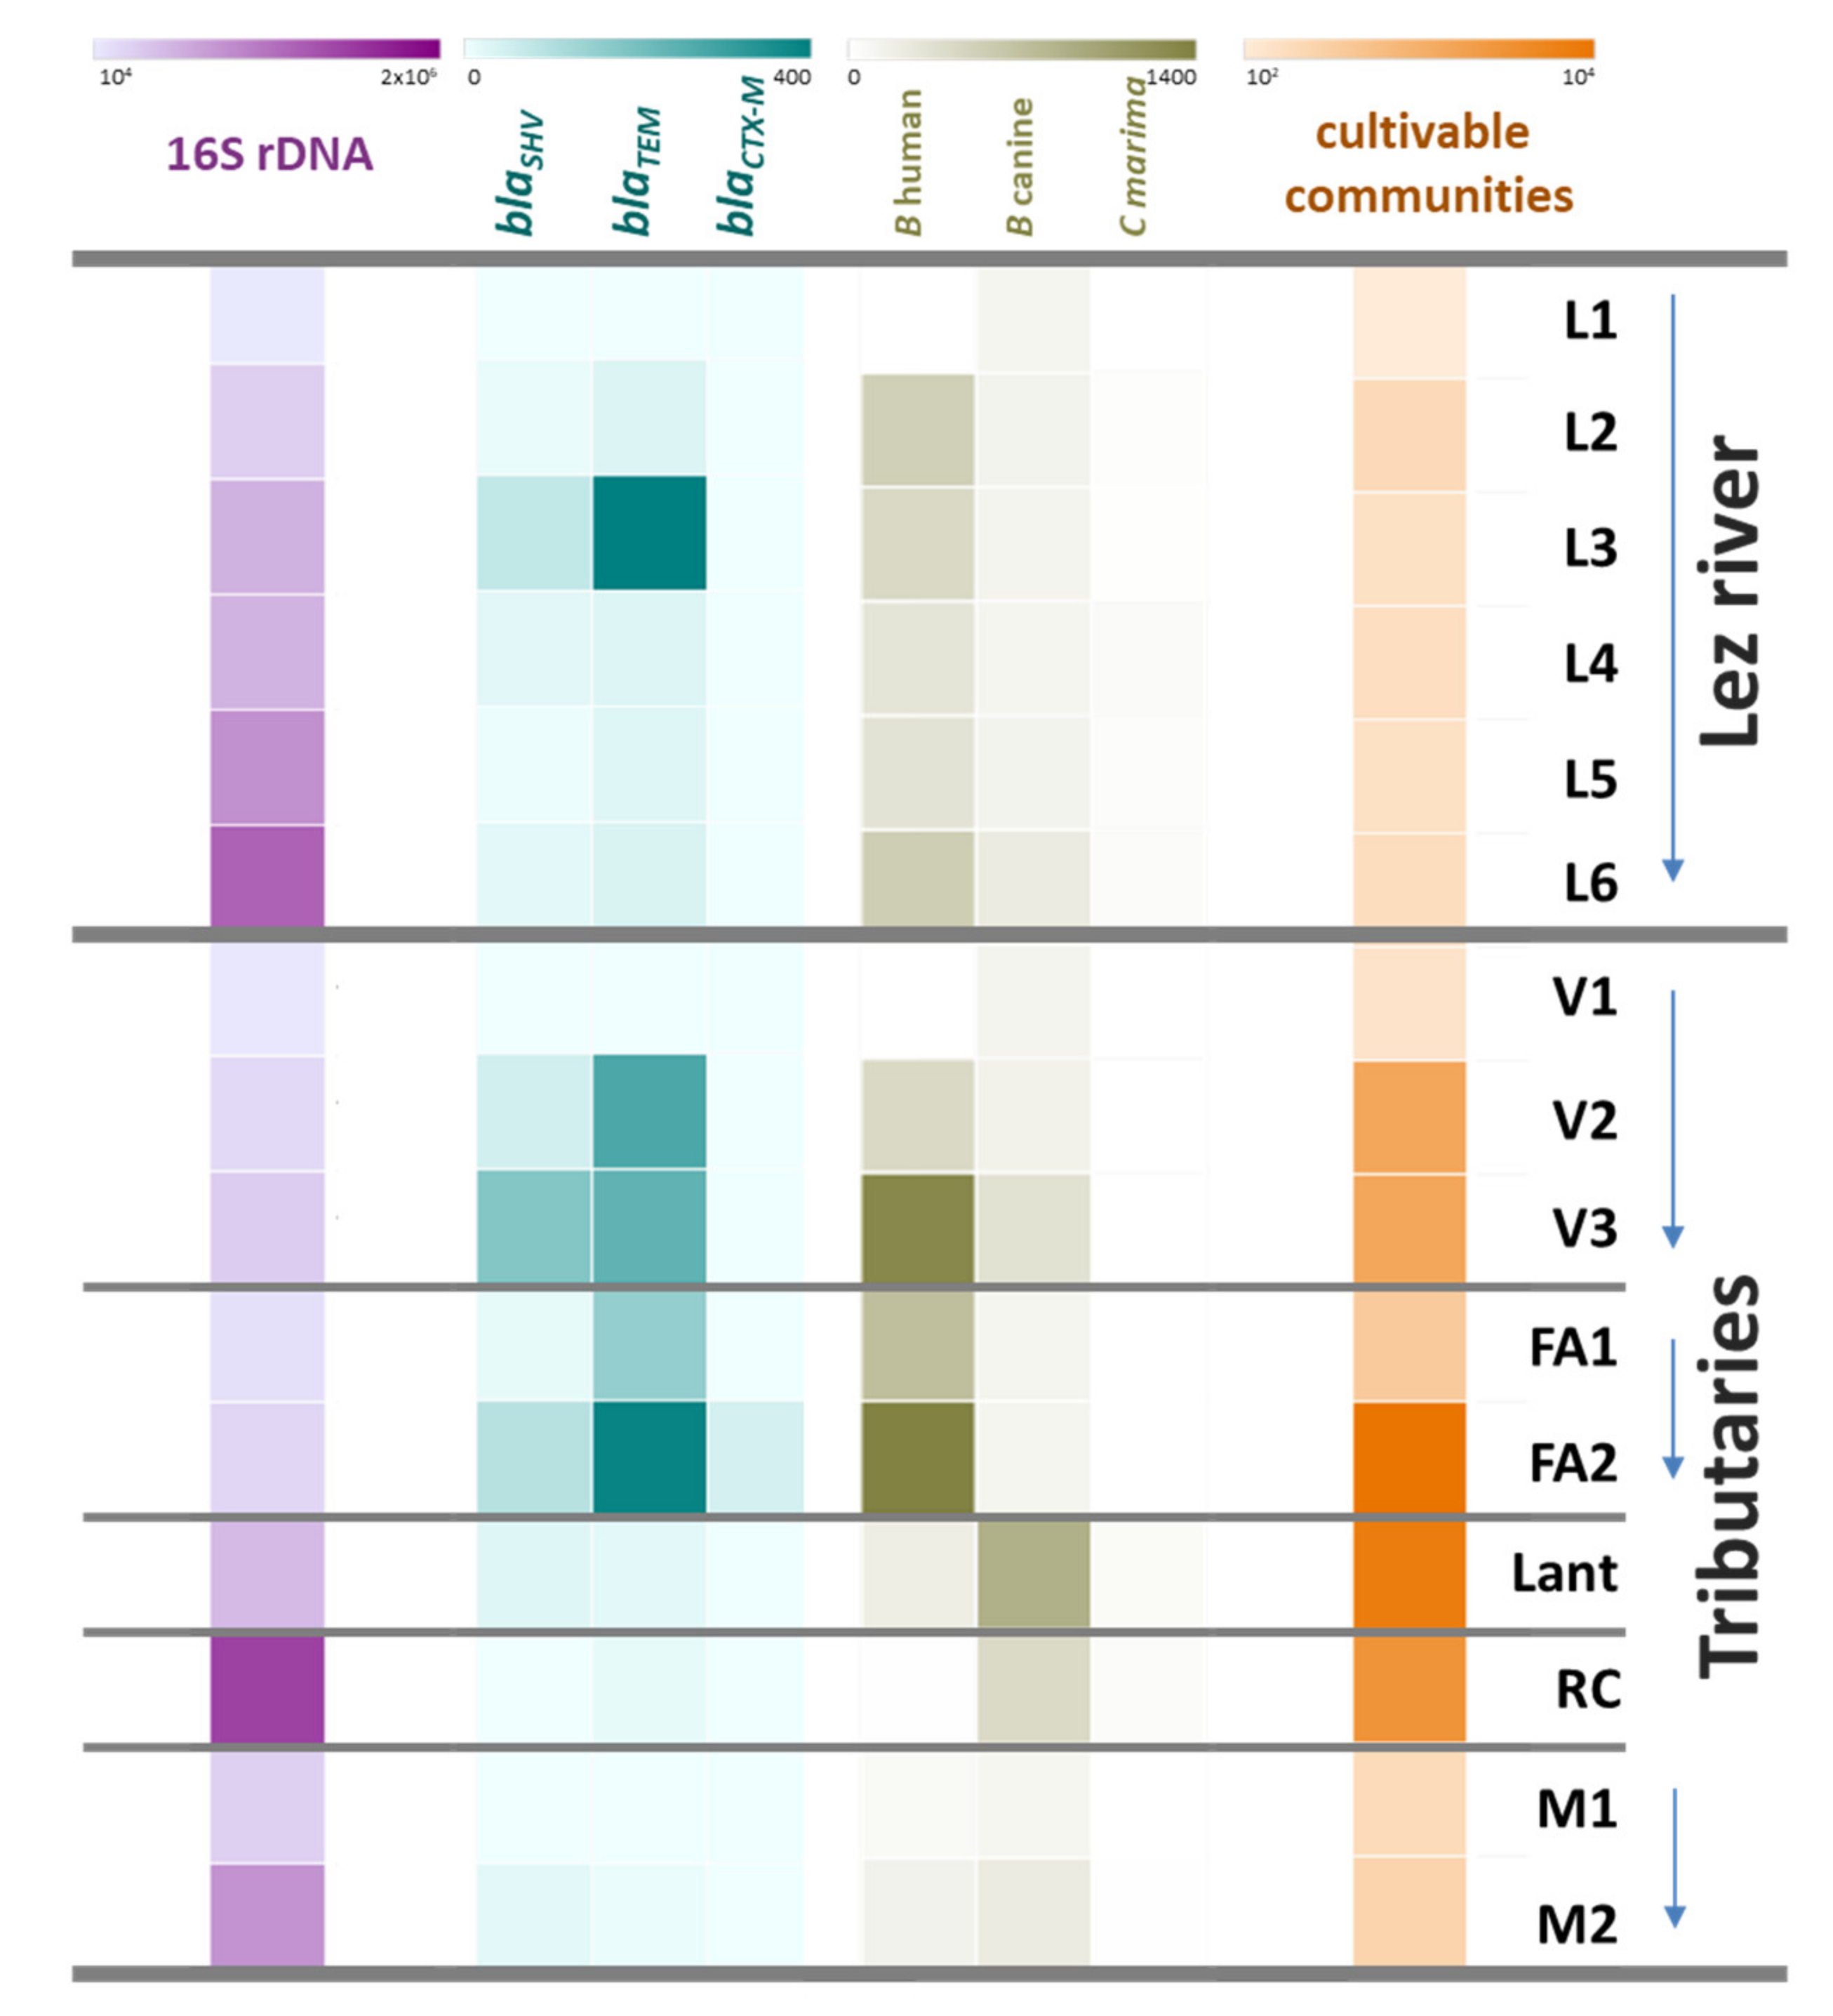
3.3.1. Genetic Quantification

First, abundance of the total community was estimated by quantification of the 16S rRNA encoding gene. A constant increase of the 16S rRNA copy number (CN) was observed along the Lez River (from 2.6 × 10⁴ to 1.7 × 10⁶ CN/mL) (Figure 5). The urban tributaries Verdanson River and Font d’Aurelle River presented the lowest abundances among the tributaries (from 4.6 × 10⁴ to 3.9 × 10⁵ CN/mL) while the greatest abundance was observed for Lantissargues River (2.2 × 10⁶ CN/mL). Comparison of 16S rRNA gene quantification with cultivable abundances revealed that the increase of the 16S DNA copy number along the Lez River was associated with relatively stable abundances of cultivable communities (Figure 5). Comparable situation was observed for the Mosson River. On the contrary, the slight increase of the 16S rRNA gene quantity along Font d’Aurelle River was associated with a notable increase of cultivable communities (Figure 5). The 16S rRNA gene quantification (2.7 × 10⁵ CN/mL) and enumeration of cultivable community (1.3 × 10⁴ CFU/mL) for FA2 suggested a high proportion of cultivable community among the total community. Verdanson River gave similar profiles than Font d’Aurelle River.
The origins of the fecal contamination were identified using the quantification of three host-specific associated molecular markers. On the Lez River continuum, the contamination was mainly from human origin, with a decreasing from L2 to L4, followed by an increasing up to L6 (min: 300 CN/mL, max: 547 CN/mL). A part of the contamination of Lez River was also detected as being from animals: from dogs with the same variations as for the human maker, but in lower quantities (117 to 228 CN/mL), and in very little quantities from gulls with maximum values in the sites closer to the sea (L4 to L6, 37 to 59 CN/mL). The dog maker was the only one detected in L1. On the tributaries, the results were more contrasted: the levels of the human-associated marker were the highest in the Verdanson and Font d’Aurelle rivers, with an increase from V1 to V3 (0 to 1315 CN/mL) and from FA1 to FA2 (713 to 1375 CN/mL). The levels of this marker on the peri-urban tributaries were lower (15 to 194 CN/mL), with a small increase in Mosson River (77 to 147 CN/mL). At the contrary, contamination due to dogs were the highest in Lantissargues and RC rivers (865 and 415 CN/mL). A small increase was also observed in Verdanson River (132 to 325 CN/mL), and Mosson River (108 to 225 CN/mL), but not in Font d’Aurelle. Finally, small quantities of gull marker were detected in the sites closer to the sea (Lant, RC and M2 sites, 15 to 63 CN/mL). Even if the levels of fecal contamination due to human and dogs on the Lez River continuum were correlated (rs = 0.94, p < 0.05), it is not the case for the quantities of the three markers in Lez River and its tributaries. The levels of fecal contamination from human origin were correlated to TTC number (rs = 0.85, p < 0.001), to the number of bacteria resistant to OFL and AMX (rs = 0.66 and 0.64, p < 0.01) but not to 16S rDNA copy number. This suggested that a high proportion of resistant bacteria were due to fecal contamination from human origin, especially in the Verdanson and Font d’Aurelle Rivers.
Quantification of three β-lactamase genes (bla) was also performed on these samples (Figure 5, Table S2). When present, bla genes concentrations were very different along Lez River and its tributaries: blaCTX-M gene quantities (mean 3 CN/mL with a maximum reaching 46 CN/mL) were significantly lower (p < 0.05 to 0.01) compared to blaSHV (mean 35 CN/mL, ranging from 6 to 180) and blaTEM (mean 109 CN/mL, ranging from 8 to 412). The quantities of this last gene were the highest and the most often detected (80% of samples, compared to 73% for blaSHV and 66% for blaCTX-M genes). However, absolute concentrations of these three studied genes were significantly correlated with each other (rs = 0.65 to 0.82, p ≤ 0.01 to 0.001). The concentrations of these genes were higher in urban tributaries (V and FA) compared with Lez and peri-urban tributaries (Rieu Coulon, Lantissargues and Mosson Rivers). The only exception was L3.
No notable gradient of concentration had been noticed along Lez River whereas an increase of the three studied ARGs was driven along Font d’Aurelle (FA1 and FA2) and Verdanson (V1, V2, and V3) tributaries.
Quantification of bla genes did not followed the 16S rRNA gene CN (p > 0.05). However, concentrations of ARGs were correlated with TTC levels (rs = 0.77 to 0.9, p ≤ 0.001) and the human specific marker (rs = 0.65 to 0.86, p < 0.01 to 0.001) but not with IE levels (p > 0.05). They were also correlated with the number of bacteria resistant to OFL and AMX (rs = 0.54 to 0.61, p < 0.05 and 0.58 to 0.73, p < 0.05 to 0.01, respectively). The number of bacteria resistant to CAZ was only correlated to blaSHV (rs = 0.53, p ≤ 0.05) and blaCTX-M (rs = 0.52, p ≤ 0.05) genes concentrations.

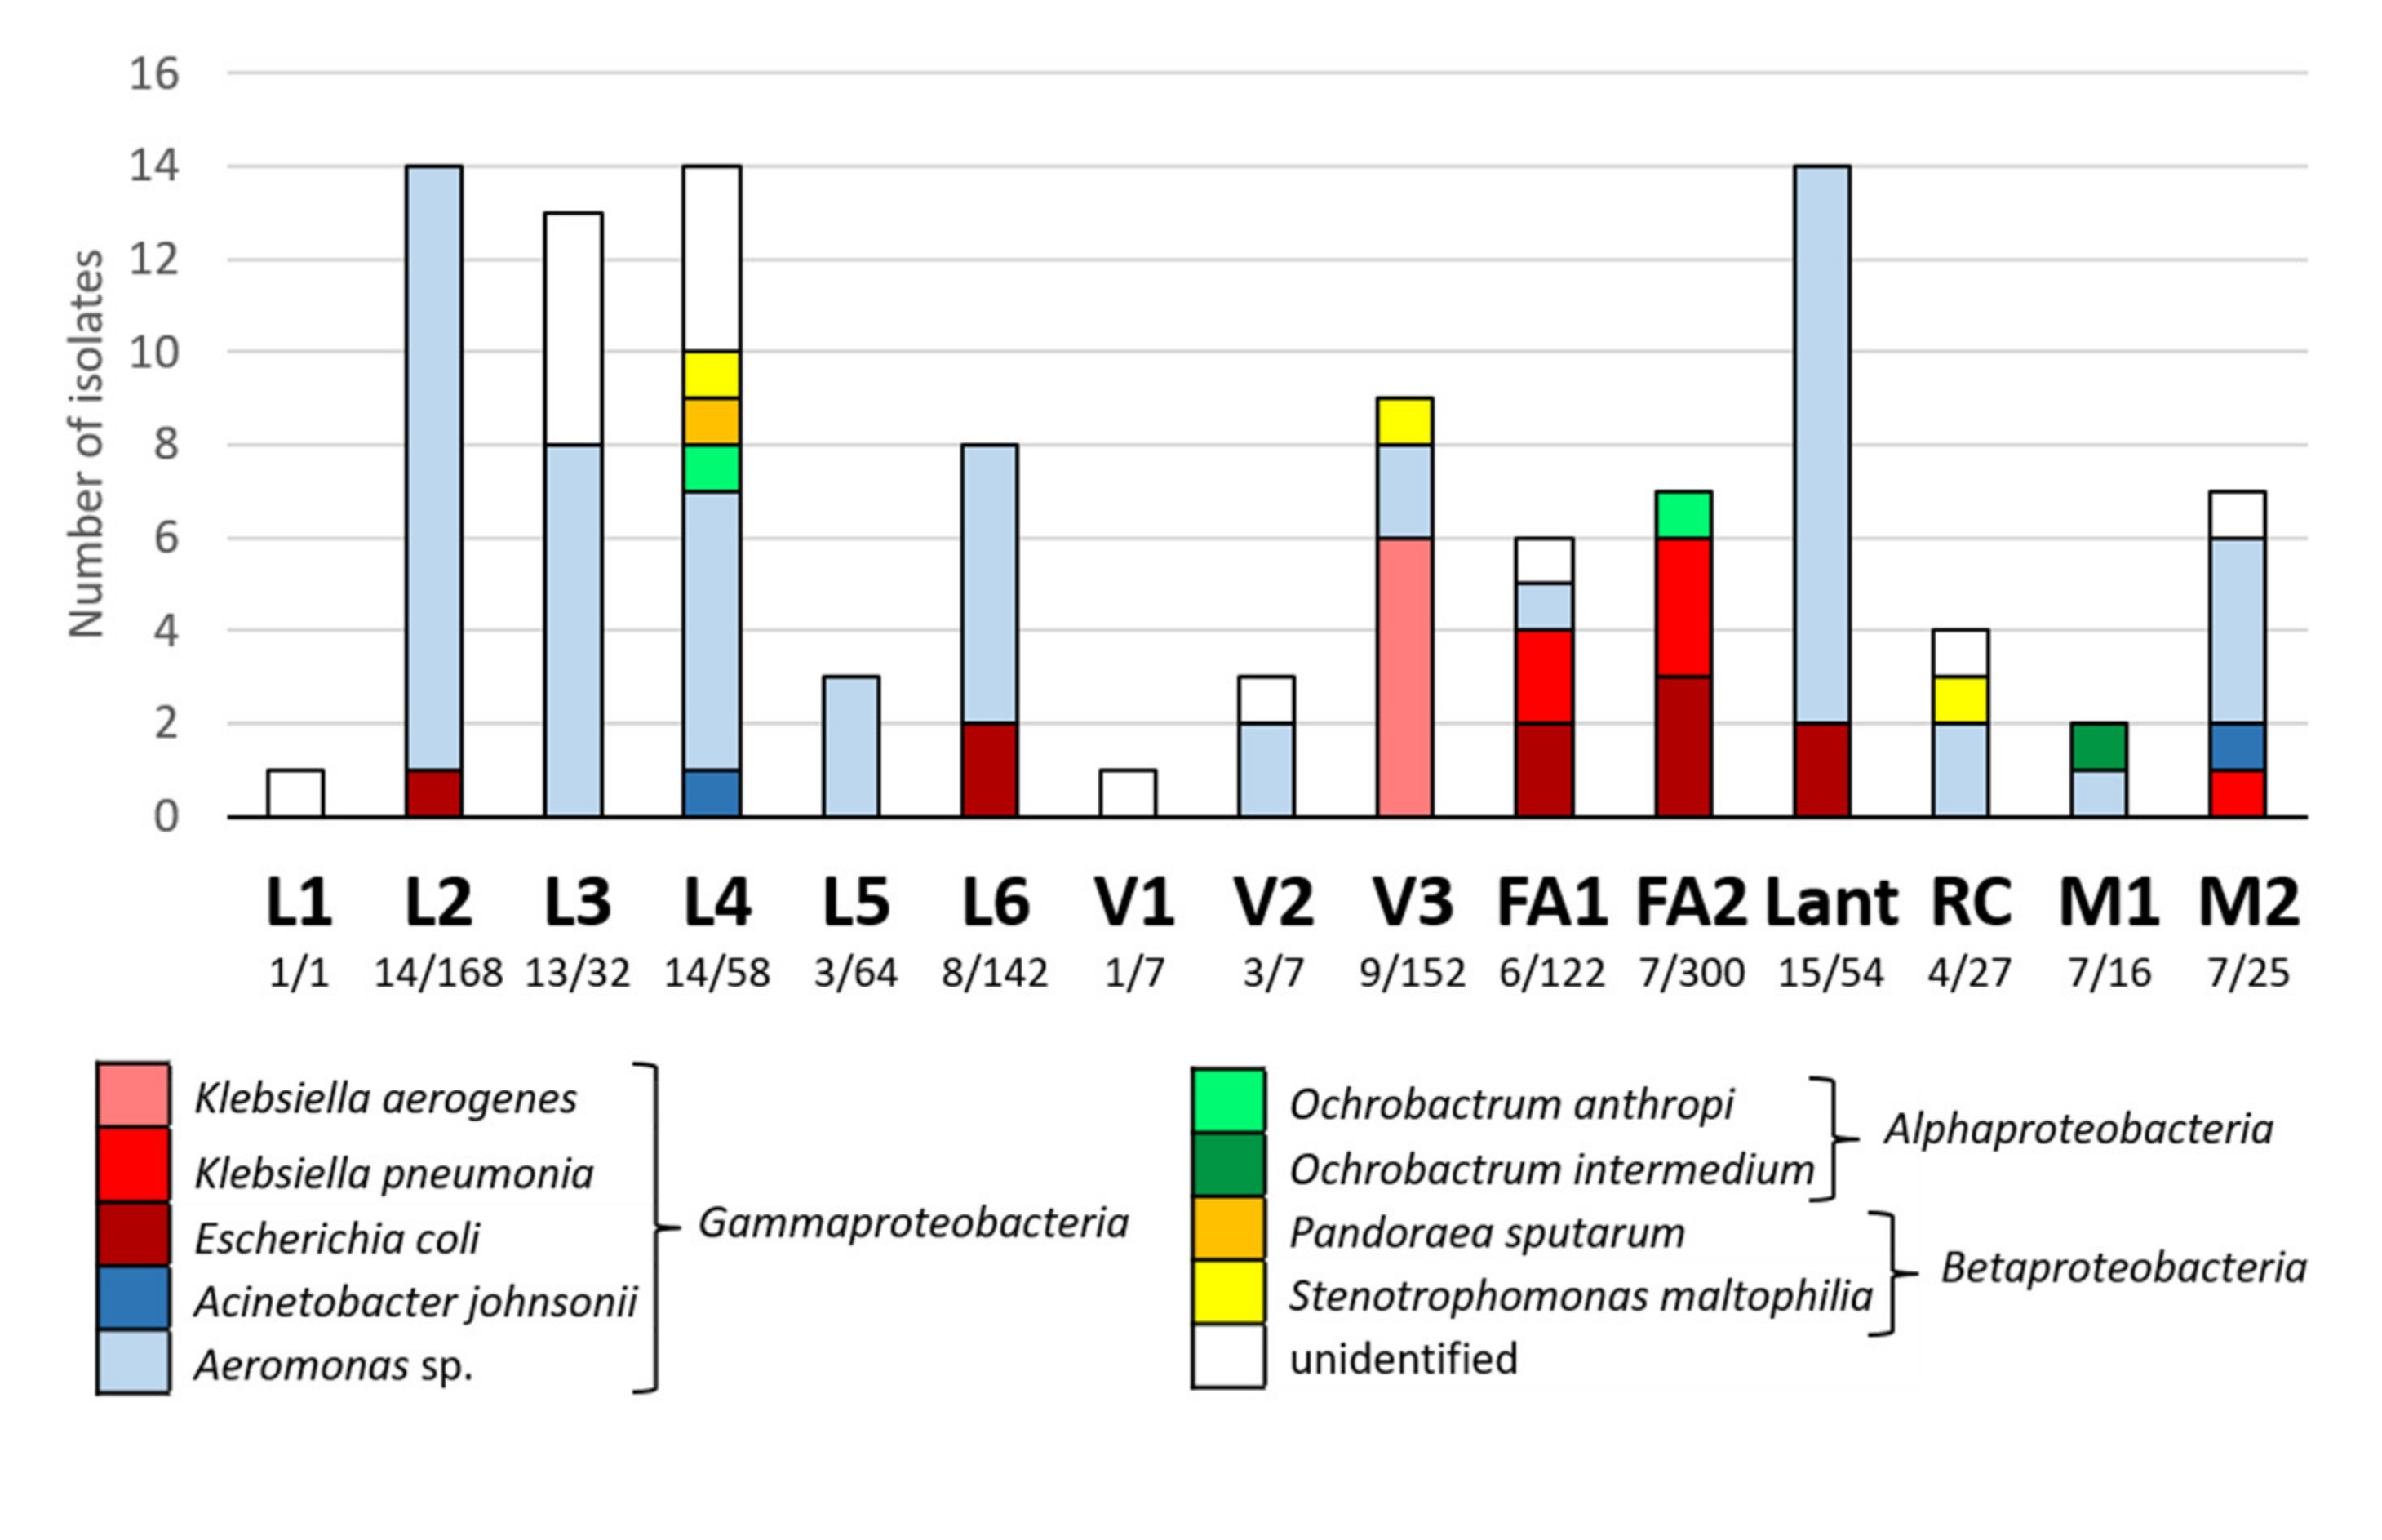
3.3.2. Characterization of Multidrug Resistant Enterobacteria

Samples from the C2 campaign were cultivated on multi-ATB medium. Abundances of cultivable multidrug resistant Gram-negative bacteria ranged from 10 to 3 × 10³ CFU/L (Table S2 and Figure 6) and were correlated with ARGs levels (rs = 0.52 to 0.61, p ≤ 0.05). Higher values were observed for L2, L6, V3, FA1, and FA2 (from 1 to 3 × 10³ CFU/L). Abundances appeared variable along Lez River while they increased along the Verdanson and Font d’Aurelle tributaries and were lower for the peri-urban tributaries (ranging from 160 to 540 CFU/L).
Based on colony morphology, 106 isolated colonies of the 1175 colonies growing on this selective media have been selected for identification. A total of 91 isolates successfully identified belonged to the phylum Proteobacteria (Figure 6). Moreover, 15 isolates remained unidentified by MALDI-TOF, probably corresponding to species not referred in the database (clinical oriented). Aeromonas was the most frequent genus (60 isolates) and was isolated in 12 of the 15 samples. Enterobacterales, including Escherichia coli (10 strains), Klebsiella pneumoniae (six strains) and Klebsiella aerogenes (formerly Enterobacter aerogenes, six strains), were mainly isolated from V3, FA1, and FA2 (16 of the 22 Enterobacterales strains). Other genera were punctually isolated from some sampling sites only (Figure 6).
Enterobacterales were further characterized. The 10 E. coli strains (from five sampling sites) presented six distinct multiplex rep-PCR profiles (Table 1). Ec2 and Ec6 profiles grouped pairs of strains isolated from the same sampling site (L6 and Lant, respectively), while Ec3 profile was shared by three strains isolated along the Font d’Aurelle River, from FA1 (two strains) and FA2 (one strain). Through the antibiograms, the observation of a characteristic shape-zone referred to as ‘champagne-cork’ revealed ESBL production for the 10 E. coli strains. Antibiotic resistance profiles (Table S3) showed resistance from two to four antibiotic class/family (MAR index from 0.38 (L6) to 0.71 (FA1 and FA2)). Ec3 profile strains were the most E. coli resistant strain (Table 1). β-lactamase-type CTX-M and TEM were detected for eight and four E. coli strains, respectively. Three E. coli strains harbored both blaCTX-M and blaTEM and were isolated from FA2 (Ec5 profile) and Lant (Ec6 profile). On the contrary, these two types of bla-genes were not detected for the E. coli strain isolated from L2, nor was the SHV type which had not been detected for any E. coli strain. K. pneumoniae strains were mainly isolated along Font d’Aurelle River (two and three strains for FA1 and FA2, respectively). A strain was also isolated from M2. These six strains appeared unrelated since they each presented a unique rep-PCR profile (Table 1). Like for E. coli, ESBL production was detected for all K. pneumoniae strains and resistance to 4 antibiotic class/family (MAR index from 0.58 (FA2) to 0.71 (FA1)) was observed (Table S3). The three BLSE-type investigated were detected for the six K. pneumoniae strains, except type TEM for strain two FA1 E5. Finally, the six K. aerogenes strains, all isolated from V3 sampling site, presented four distinct multiplex rep-PCR profiles (Table 1), three of them were resistant to ertapenem (carbapenem) without producing carbapenemase (data not shown). ESBL production was not detected and MAR index ranged from 0.58 to 0.63. Bacteria with the higher MAR indexes (>0.65) were determined in FA1 and FA2 (Table 1).

4. Discussion

Among major sources of diffuse pollution in surface waters, urban activities do not have to be neglected. Indeed, various urban activities produce chemical and biological pollutants that are deposited in urban areas and are mobilized during rainfall events. These pollutants are very diverse in view of the huge diversity of activities occurring in urban areas. One can cite atmospheric deposition particularly due to road traffic, construction works and surface structures, maintenance of parks and gardens, urban runoff, misconnection of sewer pipes, pets, and wildlife (for a review, see [39]). Recurring contamination of organotins and trace metal elements (copper, zinc, arsenic, or boron) was found particularly on totally urban slow-flowing tributaries, indicating the impact of anthropic activities on surface water in densely urbanized areas. The fluctuation of contaminations depends not only on anthropic activities but also on hydrologic conditions. Indeed, water collected during this study shows high fluctuations both in terms of chemical and microbiological parameters. This time-dependent variability of chemical and bacteriological quality of surface water is expected to decrease statistical power when differences between geographical sites are studied. In order to exclude this bias, experimental sampling design consisted in three campaigns each including 15 sites sampled the same day, allowing the comparison of Lez River to its main tributaries.
When considering bacterial load, previous studies along rivers consider only the influence of WWTP or industrial effluents, and not the influence of urbanization [15,40,41,42,43]. For example, in a Chinese river impacted by antibiotics and other pollutants, Ouyang and colleagues show a 100-fold increase of both cultivable bacteria and 16S rDNA quantification for the urban points compared with pristine water [42]. In our study, several urban rivers were not affected in the same way by the passage through the city with inputs of wastewater not clearly localized but diffused. While a continued increase in 16S rDNA quantification along the Lez is associated with a relative stability of abundance of culturable bacteria, urban tributaries V and FA show a moderate increase in 16S rDNA gene quantification associated with a large increase in culturable bacteria. This indicates that along urban tributaries, exposure to anthropic pressures leads to an enrichment of the bacterial community in cultivable bacteria. Even these rivers are contaminated by wastewater (indicated by Gd*, B/Sr, FIB, human-specific markers), this enrichment is not exclusively caused by FIB. In fact, FIB represents less than 3% of the increase of cultivable bacterial community between FA1 and FA2. One hypothesis is that environmental conditions, as chemical contaminations, disturb hydric bacterial communities. Indeed, compared with the pristine site (L1), sites with higher cultivable bacterial concentrations are the more polluted ones in terms of trace elements (copper, zinc, lead, antimony), butylins, chemical indicators of fecal contamination and FIB.
Moreover, an enrichment in ARBs and ARGs has already been described in waters which quality is impacted by effluents WWTP or industrial effluents [42,43]. In this study, in urban context without source of contamination clearly identified, we show that the increase of ARBs is not observed in several campaigns and all tested antibiotics. Urban water goes enriching in bacteria that resist to amoxicillin or ofloxacin along its course. In contrast, levels of resistance against ceftazidime were high all along Lez River, probably due to the presence and persistence of autochthonous bacteria naturally resistant. Although, the input of bacterial cultivable communities along V and FA corresponds to communities—partially from fecal origin—that are not constantly resistant. Nevertheless, even if mechanisms responsive of this enrichment in ARBs are not clearly elucidated, it could be caused by the presence of selective agents like antibiotics, biocides, metals, antifouling agents, that can have direct effect of selection/co-selection or indirect effect by disturbing bacterial community and favoring antimicrobial-resistant bacteria. The allochthonous communities are composed by a minority of enterobacteria, some of them carrying resistances of public health concern (ESBL genes). In contrast, MDR bacteria isolated in other sites are mainly autochthonous bacteria, already described as naturally resistant, like Aeromonas, Stenotrophomonas, Acinetobacter, Ochrobactrum, or Pandoraea. Unlike ARBs, ARGs increased with more cultivable bacterial concentration, and statistically positively correlated to TTC levels, to the human-specific Bacteroides-related marker indicating that the fecal contamination is from human origin, and to amoxicillin- and ofloxacin-resistant bacterial counts. Finally, in term of clinically relevant parameters, proportion of resistant bacteria can give information on resistance level but it is less informative than ARGs quantification or MDR-bacteria characterization because of the presence of naturally resistant autochthonous bacteria.

5. Conclusions

Combining bacterial cultural approach with genetic investigations, this study provided insights into the environmental epidemiology of AMR and MDR while considering hydrological and physico-chemical measures. However, metabarcoding data should help to understand phenomenon observed like the dynamics of resistant bacterial communities along the considered rivers.
Moreover, our study highlights distinct results between urban rivers and Lez River, in terms of both bacterial community behaviors and chemical pollutants impact. It underlines the pertinence between the bacteriological parameters and the flow rate of the river. Indeed, the slow flow urban tributaries (100 m in magnitude between two sampling points) is more bacteriologically impacted than the fast flow urban integrator river. It is still unclear the influence of environment on the evolution of ARBs and ARGs. Further research on dynamic persistence of ARBs and ARGs need to be conducted to understand their dissemination in the environment.

Supplementary Materials

The following are available online at https://www.mdpi.com/article/10.3390/w13152010/s1, Table S1: primers information, Table S2: Flows and chemical composition of the different waters observed during the three campaigns of sampling, Table S3: Antibiogram results (expressed in mm) for the 22 Enterobacterales isolated on multi-ATB medium during C2 campaign.

Author Contributions

M.-G.T., E.J.-B., F.A., P.M. (Patrick Monfort)., and P.L.-F. led on conceptualization of the study and participated in the sampling scheme. P.M. (Pierre Marchand), M.R., and C.S. carried out the in situ-measures in field. R.R., F.A., M.T., and A.M. carried out the microbiological and molecular biology analyses; C.B.-M. and S.D. carried out the chemical analyses. All authors discussed the results. F.A., M.T., E.J.-B., and P.L.-F. built the plan of the manuscript with inputs from all authors. All authors provided critical feedback, helped shape the research, analysis, and manuscript and approved the submitted version. All authors have read and agreed to the published version of the manuscript.

Funding

This research was funded by the LabEx DRIIHM, French Programme “Investissements d’Avenir” (ANR-11-LABX-0010) which is managed by the French ANR, under the Human-Environment Observatory “Mediterranean coast” (OHM Littoral Méditerranéen).

Institutional Review Board Statement

Not applicable.

Informed Consent Statement

Not applicable.

Data Availability Statement

Data are contained with the article and supplementary materials.

Acknowledgments

The authors would like to thank Isabelle Zorgniotti and Stefaniya Hantova who contributed to the microbiological analyzes and Philippe Clair, the manager of the qPCR facility of Université de Montpellier/MGX for his technical advice and for lending a LightCycler 480 during the study period.

Conflicts of Interest

The authors declare no conflict of interest.

References

  1. WHO | Global Priority List of Antibiotic-Resistant Bacteria to Guide Research, Discovery, and Development of New Antibiotics. Available online: http://www.who.int/medicines/publications/global-priority-list-antibiotic-resistant-bacteria/en/ (accessed on 22 February 2021).
  2. Magiorakos, A.-P.; Srinivasan, A.; Carey, R.B.; Carmeli, Y.; Falagas, M.E.; Giske, C.G.; Harbarth, S.; Hindler, J.F.; Kahlmeter, G.; Olsson-Liljequist, B.; et al. Multidrug-Resistant, Extensively Drug-Resistant and Pandrug-Resistant Bacteria: An International Expert Proposal for Interim Standard Definitions for Acquired Resistance. Clin. Microbiol. Infect. 2012, 18, 268–281. [Google Scholar] [CrossRef] [Green Version]
  3. European Centre for Disease Prevention and Control. Surveillance of antimicrobial resistance in Europe 2018; ECDC: Stockholm, Sweden, 2019. [Google Scholar]
  4. McEwen, S.A.; Collignon, P.J. Antimicrobial Resistance: A One Health Perspective. Microbiol. Spectr. 2018, 6. [Google Scholar] [CrossRef] [Green Version]
  5. Un Premier État Des Connaissances Sur l’antibiorésistance et Les Antibiotiques Dans l’environnement | Anses - Agence Nationale de Sécurité Sanitaire de l’alimentation, de l’environnement et Du Travail. Available online: https://www.anses.fr/fr/content/un-premier-%C3%A9tat-des-connaissances-sur-l%E2%80%99antibior%C3%A9sistance-et-les-antibiotiques-dans-l (accessed on 22 February 2021).
  6. Antibiorésistance et Environnement - État et Causes Possibles de La Contamination Des Milieux En France Par Les Antibiotiques et Par Les Bactéries Résistantes Aux Antibiotiques et Supports Génétiques de La Résistance | Anses - Agence Nationale de Sécurité Sanitaire de l’alimentation, de l’environnement et Du Travail. Available online: https://www.anses.fr/fr/content/antibior%C3%A9sistance-et-environnement-%C3%A9tat-et-causes-possibles-de-la-contamination-des-milieu-0 (accessed on 22 February 2021).
  7. Matheu, J.; Aidara-Kane, A.; Andremont, A. The ESBL Tricycle AMR Surveillance Porject: A Simple, One Health Approach to Global Surveillance. Available online: http://resistancecontrol.info/2017/the-esbl-tricycleamr-surveillance-project-a-simple-one-health-approach-toglobal-surveillance/ (accessed on 19 July 2021).
  8. Almakki, A.; Jumas-Bilak, E.; Marchandin, H.; Licznar-Fajardo, P. Antibiotic Resistance in Urban Runoff. Sci. Total. Environ. 2019. [Google Scholar] [CrossRef]
  9. Almakki, A.; Maure, A.; Pantel, A.; Romano-Bertrand, S.; Masnou, A.; Marchandin, H.; Jumas-Bilak, E.; Licznar-Fajardo, P. NDM-5-Producing Escherichia Coli in an Urban River in Montpellier, France. Int. J. Antimicrob. Agents 2017, 50, 123–124. [Google Scholar] [CrossRef]
  10. Girlich, D.; Bonnin, R.A.; Naas, T. Occurrence and Diversity of CTX-M-Producing Escherichia Coli From the Seine River. Front. Microbiol. 2020, 11, 603578. [Google Scholar] [CrossRef] [PubMed]
  11. Laroche, E.; Pawlak, B.; Berthe, T.; Skurnik, D.; Petit, F. Occurrence of Antibiotic Resistance and Class 1, 2 and 3 Integrons in Escherichia Coli Isolated from a Densely Populated Estuary (Seine, France). FEMS Microbiol. Ecol. 2009, 68, 118–130. [Google Scholar] [CrossRef] [PubMed]
  12. Kim, J.; Kang, H.Y.; Lee, Y. The Identification of CTX-M-14, TEM-52, and CMY-1 Enzymes in Escherichia Coli Isolated from the Han River in Korea. J. Microbiol. 2008, 46, 478–481. [Google Scholar] [CrossRef]
  13. Dhanji, H.; Murphy, N.M.; Akhigbe, C.; Doumith, M.; Hope, R.; Livermore, D.M.; Woodford, N. Isolation of Fluoroquinolone-Resistant O25b:H4-ST131 Escherichia Coli with CTX-M-14 Extended-Spectrum β-Lactamase from UK River Water. J. Antimicrob. Chemother. 2011, 66, 512–516. [Google Scholar] [CrossRef] [PubMed] [Green Version]
  14. Pantanella, F.; Lekunberri, I.; Gagliardi, A.; Venuto, G.; Sànchez-Melsió, A.; Fabiani, M.; Balcázar, J.L.; Schippa, S.; De Giusti, M.; Borrego, C.; et al. Effect of Urban Wastewater Discharge on the Abundance of Antibiotic Resistance Genes and Antibiotic-Resistant Escherichia Coli in Two Italian Rivers. Int. J. Environ. Res. Public Health. 2020, 17. [Google Scholar] [CrossRef]
  15. Thakali, O.; Tandukar, S.; Brooks, J.P.; Sherchan, S.P.; Sherchand, J.B.; Haramoto, E. The Occurrence of Antibiotic Resistance Genes in an Urban River in Nepal. Water 2020, 12, 450. [Google Scholar] [CrossRef] [Green Version]
  16. Rabiet, M.; Brissaud, F.; Seidel, J.L.; Pistre, S.; Elbaz-Poulichet, F. Positive Gadolinium Anomalies in Wastewater Treatment Plant Effluents and Aquatic Environment in the Hérault Watershed (South France). Chemosphere 2009, 75, 1057–1064. [Google Scholar] [CrossRef]
  17. Rahi, P.; Vaishampayan, P. Editorial: MALDI-TOF MS Application in Microbial Ecology Studies. Front. Microbiol. 2019, 10, 2954. [Google Scholar] [CrossRef]
  18. Abdouchakour, F.; Dupont, C.; Grau, D.; Aujoulat, F.; Mournetas, P.; Marchandin, H.; Parer, S.; Gibert, P.; Valcarcel, J.; Jumas-Bilak, E. Pseudomonas Aeruginosa and Achromobacter Sp. Clonal Selection Leads to Successive Waves of Contamination of Water in Dental Care Units. Appl. Environ. Microbiol. 2015, 81, 7509–7524. [Google Scholar] [CrossRef] [Green Version]
  19. Koeuth, T.; Versalovic, J.; Lupski, J.R. Differential Subsequence Conservation of Interspersed Repetitive Streptococcus Pneumoniae BOX Elements in Diverse Bacteria. Genome Res. 1995, 5, 408–418. [Google Scholar] [CrossRef] [Green Version]
  20. Mercier, E.; Jumas-Bilak, E.; Allardet-Servent, A.; O’Callaghan, D.; Ramuz, M. Polymorphism in Brucella Strains Detected by Studying Distribution of Two Short Repetitive DNA Elements. J. Clin. Microbiol. 1996, 34, 1299–1302. [Google Scholar] [CrossRef] [PubMed] [Green Version]
  21. CA-SFM CA-SFM - EUCAST, Comité de l’antibiogramme de la Société Française de Microbiologie. In: CASFM / EUCAST: Société Française de Microbiologie Ed. 2016. Available online: https://www.sfm-microbiologie.org/wp-content/uploads/2019/02/CASFM2016_V1.0_FEVRIER.pdf (accessed on 19 July 2021).
  22. Krumperman, P.H. Multiple Antibiotic Resistance Indexing of Escherichia Coli to Identify High-Risk Sources of Fecal Contamination of Foods. Appl. Environ. Microbiol. 1983, 46, 165–170. [Google Scholar] [CrossRef] [PubMed] [Green Version]
  23. Drieux, L.; Brossier, F.; Sougakoff, W.; Jarlier, V. Phenotypic Detection of Extended-Spectrum Beta-Lactamase Production in Enterobacteriaceae: Review and Bench Guide. Clin. Microbiol. Infect. 2008, 14 (Suppl S1), 90–103. [Google Scholar] [CrossRef] [PubMed] [Green Version]
  24. Lartigue, M.-F.; Zinsius, C.; Wenger, A.; Bille, J.; Poirel, L.; Nordmann, P. Extended-Spectrum β-Lactamases of the CTX-M Type Now in Switzerland. Antimicrob. Agents Chemother. 2007, 51, 2855–2860. [Google Scholar] [CrossRef] [PubMed] [Green Version]
  25. El-Shazly, S.; Dashti, A.; Vali, L.; Bolaris, M.; Ibrahim, A.S. Molecular Epidemiology and Characterization of Multiple Drug-Resistant (MDR) Clinical Isolates of Acinetobacter Baumannii. Int. J. Infect. Dis. 2015, 41, 42–49. [Google Scholar] [CrossRef] [Green Version]
  26. Maeda, H.; Fujimoto, C.; Haruki, Y.; Maeda, T.; Kokeguchi, S.; Petelin, M.; Arai, H.; Tanimoto, I.; Nishimura, F.; Takashiba, S. Quantitative Real-Time PCR Using TaqMan and SYBR Green for Actinobacillus Actinomycetemcomitans, Porphyromonas Gingivalis, Prevotella Intermedia, TetQ Gene and Total Bacteria. FEMS Immunol. Med. Microbiol. 2003, 39, 81–86. [Google Scholar] [CrossRef] [Green Version]
  27. Xi, C.; Zhang, Y.; Marrs, C.F.; Ye, W.; Simon, C.; Foxman, B.; Nriagu, J. Prevalence of Antibiotic Resistance in Drinking Water Treatment and Distribution Systems. Appl. Environ. Microbiol. 2009, 75, 5714–5718. [Google Scholar] [CrossRef] [Green Version]
  28. Marti, E.; Jofre, J.; Balcazar, J.L. Prevalence of Antibiotic Resistance Genes and Bacterial Community Composition in a River Influenced by a Wastewater Treatment Plant. PLoS ONE 2013, 8, e78906. [Google Scholar] [CrossRef]
  29. Bernhard, A.E.; Field, K.G. A PCR Assay To Discriminate Human and Ruminant Feces on the Basis of Host Differences in Bacteroides-Prevotella Genes Encoding 16S RRNA. Appl. Environ. Microbiol. 2000, 66, 4571–4574. [Google Scholar] [CrossRef] [PubMed] [Green Version]
  30. Bernhard, A.E.; Field, K.G. Identification of Nonpoint Sources of Fecal Pollution in Coastal Waters by Using Host-Specific 16S Ribosomal DNA Genetic Markers from Fecal Anaerobes. Appl. Environ. Microbiol. 2000, 66, 1587–1594. [Google Scholar] [CrossRef] [PubMed] [Green Version]
  31. Seurinck, S.; Defoirdt, T.; Verstraete, W.; Siciliano, S.D. Detection and Quantification of the Human-Specific HF183 Bacteroides 16S RRNA Genetic Marker with Real-Time PCR for Assessment of Human Faecal Pollution in Freshwater. Environ. Microbiol. 2005, 7, 249–259. [Google Scholar] [CrossRef] [PubMed]
  32. Dick, L.K.; Simonich, M.T.; Field, K.G. Microplate Subtractive Hybridization to Enrich for Bacteroidales Genetic Markers for Fecal Source Identification. Appl. Environ. Microbiol. 2005, 71, 3179–3183. [Google Scholar] [CrossRef] [PubMed] [Green Version]
  33. Lu, J.; Santo Domingo, J.W.; Lamendella, R.; Edge, T.; Hill, S. Phylogenetic Diversity and Molecular Detection of Bacteria in Gull Feces. Appl. Environ. Microbiol. 2008, 74, 3969–3976. [Google Scholar] [CrossRef] [PubMed] [Green Version]
  34. Wu, B.; Wang, X.C.; Dzakpasu, M. Genetic Characterization of Fecal Impacts of Seagull Migration on an Urban Scenery Lake. Water Res. 2017, 117, 27–36. [Google Scholar] [CrossRef]
  35. Toubiana, M.; Salles, C.; Tournoud, M.-G.; Licznar-Fajardo, P.; Zorgniotti, I.; Tremelo, M.-L.; Jumas-Bilak, E.; Robert, S.; Monfort, P. Monitoring Urban Beach Quality on a Summer Day: Determination of the Origin of Fecal Indicator Bacteria and Antimicrobial Resistance at Prophète Beach, Marseille (France). Front. Microbiol. 2021. Submitted. [Google Scholar]
  36. Bustin, S.A.; Benes, V.; Garson, J.A.; Hellemans, J.; Huggett, J.; Kubista, M.; Mueller, R.; Nolan, T.; Pfaffl, M.W.; Shipley, G.L.; et al. The MIQE Guidelines: Minimum Information for Publication of Quantitative Real-Time PCR Experiments. Clin. Chem. 2009, 55, 611–622. [Google Scholar] [CrossRef] [PubMed] [Green Version]
  37. Luthy, R.G.; Sedlak, D.L.; Plumlee, M.H.; Austin, D.; Resh, V.H. Wastewater-Effluent-Dominated Streams as Ecosystem-Management Tools in a Drier Climate. Front. Ecol. Environ. 2015, 13, 477–485. [Google Scholar] [CrossRef] [Green Version]
  38. Arrêté Du 27 Juillet 2015 Modifiant l’arrêté Du 25 Janvier 2010 Relatif Aux Méthodes et Critères d’évaluation de l’état Écologique, de l’état Chimique et Du Potentiel Écologique Des Eaux de Surface Pris En Application Des Articles R. 212-10, R. 212-11 et R. 212-18 Du Code de l’environnement – Légifrance. Available online: https://www.legifrance.gouv.fr/jorf/id/JORFTEXT000031107256 (accessed on 23 March 2021).
  39. Müller, A.; Österlund, H.; Marsalek, J.; Viklander, M. The Pollution Conveyed by Urban Runoff: A Review of Sources. Sci. Total Environ. 2020, 709, 136125. [Google Scholar] [CrossRef] [PubMed]
  40. Proia, L.; Anzil, A.; Subirats, J.; Borrego, C.; Farrè, M.; Llorca, M.; Balcázar, J.L.; Servais, P. Antibiotic Resistance along an Urban River Impacted by Treated Wastewaters. Sci. Total Environ. 2018, 628–629, 453–466. [Google Scholar] [CrossRef]
  41. Guan, Y.; Jia, J.; Wu, L.; Xue, X.; Zhang, G.; Wang, Z. Analysis of Bacterial Community Characteristics, Abundance of Antibiotics and Antibiotic Resistance Genes Along a Pollution Gradient of Ba River in Xi’an, China. Front. Microbiol. 2018, 9, 3191. [Google Scholar] [CrossRef] [PubMed] [Green Version]
  42. Ouyang, W.-Y.; Huang, F.-Y.; Zhao, Y.; Li, H.; Su, J.-Q. Increased Levels of Antibiotic Resistance in Urban Stream of Jiulongjiang River, China. Appl. Microbiol. Biotechnol. 2015, 99, 5697–5707. [Google Scholar] [CrossRef] [PubMed]
  43. Gothwal, R.; Thatikonda, S. Role of Environmental Pollution in Prevalence of Antibiotic Resistant Bacteria in Aquatic Environment of River: Case of Musi River, South India. Water Environ. J. 2017, 31, 456–462. [Google Scholar] [CrossRef]
Figure 1. Watershed of the Lez river and locations of the sampling sites (L1 to L6: sampling sites on Lez River; M1 and M2: sampling sites on Mosson River; V1 to V3: sampling sites on Verdanson River; FA1 and FA2: sampling sites on Font d’Aurelle River; RC: sampling site on Rieu Coulon River; Lant: sampling site on Lantissargues River).
Water 13 02010 g001
Figure 2. Hydrological conditions in Lez River (dashed line, L2 site, and line, L5 site): Hydrographs and hyetograph from 1 January 2016 to 30 June 2017. Rainfall data (vertical bar) were provided by the Frejorgues Meteo-France weather station and discharges are from DREAL Hydro-database.
Water 13 02010 g002
Figure 3. Enumerations of cultivable communities (black bars), thermotolerant coliforms (orange line), and intestinal enterococci (green line). Campaigns were indicated on the left (C1, C2, and C3) while sampling site were noted on the bottom. Arrows represent water flow direction. L1 to L6: Lez River; V1 to V3: Verdanson River; FA1 and FA2: Font d’Aurelle River; Lant: Lantissargues River; RC: Rieu Coulon River; M1 and M2: Mosson River.
Water 13 02010 g003
Figure 4. Heatmap showing the percentages of cultivable communities resistant to ofloxacin, amoxicillin and ceftazidime at every sampling site and campaign. Each line corresponds to a sampling site. Campaign numbers (C1, C2, and C3) are indicated on the top while antibiotics are noted at the bottom. Percentages under the heatmap correspond to the mean rate of resistance. Percentages in bold correspond to the mean resistance of the 3 campaigns. Arrows represent water flow direction. L1 to L6: Lez River; V1 to V3: Verdanson River; FA1 and FA2: Font d’Aurelle River; Lant: Lantissargues River; RC: Rieu Coulon River; M1 and M2: Mosson River.
Water 13 02010 g004
Figure 5. Absolute abundances of total 16S rDNA, of β-lactamase encoding genes (blaTEM, blaSHV, and blaCTX-M) and of host-associated molecular fecal markers (human and canine-specific Bacteroides and gull-specific C. marimammalium) during the C2 campaign. Results are expressed in copy number/mL. Cultivable community abundances, expressed in CFU/mL, are included for comparison. L1 to L6: Lez River; V1 to V3: Verdanson River; FA1 and FA2: Font d’Aurelle River; Lant: Lantissargues River; RC: Rieu Coulon River; M1 and M2: Mosson River. Arrows represent water flow direction.
Water 13 02010 g005
Figure 6. Identification of strains isolated on multi-ATB medium during C2 campaign. Number of strains selected for identification and total number of strains enumerate on multi-ATB media are indicated under sampling site name. L1 to L6: Lez River; V1 to V3: Verdanson River; FA1 and FA2: Font d’Aurelle River; Lant: Lantissargues River; RC: Rieu Coulon River; M1 and M2: Mosson River.
Water 13 02010 g006
Table 1. Characterization of the Enterobacterales strains isolated during C2 campaign. Multiplex rep-PCR (M-rep PCR) profiles are numbered for each species. ESBL: extended spectrum β-lactamases production detected with the double-disc synergy test. MAR index: Multiple antibiotic resistance index. ND: not determined.
SiteStrainSpeciesM-rep-PCR
Profile
Antibiotic’s Family ResistanceMAR IndexESBLblaSHVblaTEMblaCTX-M
L22 L2E 14E. coliEc1β-lactams/quinolones/aminoglycosides0.42+---
L62 L6 E5 E. coliEc2β-lactams/quinolones0.38+--+
2 L6 E7E. coliEc2β-lactams/quinolones0.38+--+
FA12 FA1 E1AK. pneumoniaeKp1β-lactams/quinolones/aminoglycosides/ sulfamides0.67++++
2FA1 E5K. pneumoniaeKp2β-lactams/quinolones/aminoglycosides/ sulfamides0.71++-+
2FA1 E1BE. coliEc3β-lactams/quinolones/aminoglycosides/ sulfamides0.71+--+
2 FA1 E2E. coliEc3β-lactams/quinolones/aminoglycosides/ sulfamides0.63+--+
FA22 FA2 E1K. pneumoniaeKp3β-lactams/quinolones/aminoglycosides/ sulfamides0.58++++
2 FA2 E4bBK. pneumoniaeKp4β-lactams/quinolones/aminoglycosides/ sulfamides0.63++++
2 FA2 E6K. pneumoniaeKp5β-lactams/quinolones/aminoglycosides/ sulfamides0.67++++
2 FA2 E3E. coliEc3β-lactams/quinolones/aminoglycosides/ sulfamides0.71+--+
2 FA2 E4aE. coliEc4β-lactams/sulfamides/amphenicols0.38+-+-
2 FA2 E5E. coliEc5β-lactams/aminoglycosides/sulfamides/ amphenicols0.46+-++
V32 V3 E1K. aerogenesKa1β-lactams0.58-NDNDND
2 V3 E7K. aerogenesKa1β-lactams/amphenicols0.63-NDNDND
2 V3 E4K. aerogenesKa2β-lactams/amphenicols0.63-NDNDND
2 V3 E8K. aerogenesKa2β-lactams/amphenicols0.63-NDNDND
2 V3 E5K. aerogenesKa3β-lactams/amphenicols0.63-NDNDND
2 V3 E6K. aerogenesKa4β-lactams0.58-NDNDND
Lant2 Lant E4E. coliEc6β-lactams/quinolones0.50+-++
2 Lant E10E. coliEc6β-lactams/quinolones0.50+-++
M22 M2 E5K. pneumoniaeKp6β-lactams/quinolones/aminoglycosides/ amphenicols0.63++++
Publisher’s Note: MDPI stays neutral with regard to jurisdictional claims in published maps and institutional affiliations.

