
Research on Design of the Safety Supervision System for Desalinated Seawater Entering Urban Water Supply Network

1
Department of Irrigation and Drainage, China Institute of Water Resources and Hydropower Research, Beijing 100048, China
2
National Center for Efficient Irrigation Engineering and Technology Research, Beijing 100048, China
3
State Key Laboratory of Simulation and Regulation of Water Cycle in River Basin, China Institute of Water Resources and Hydropower Research, Beijing 100048, China
4
Rural Drinking Water Management Station of Anhui Province, Hefei 230022, China
*
Author to whom correspondence should be addressed.
†
Co-first author.
Water 2021, 13(15), 2017; https://doi.org/10.3390/w13152017
Submission received: 19 May 2021
/
Revised: 13 July 2021
/
Accepted: 21 July 2021
/
Published: 23 July 2021
(This article belongs to the Special Issue Water Quality Management in Water Distribution Networks)
Abstract
:Desalinated seawater enters the urban water supply network on a large scale, which brings new challenges to water quality assurance. In order to strengthen the safety supervision of the pipeline network, ensure the stability of water quality, prevent pipeline corrosion, and avoid the “red water” problem, this study constructed a safety supervision system for desalinated seawater entering the urban water supply pipeline network. In this system, the on-line monitoring system can monitor water quality, water quantity, water pressure and the corrosion of pipeline network in real-time. Early warning system can quickly identify problems and initiate based on the threshold exceeding, statistical analysis, and model prediction. The safety regulation system (including water source regulation system, water quality adjustment system and operation management system) is used to regulate and control water quality problems in the urban water supply network. The application of this safety supervision system is conducive to improving regulation efficiency and ensuring water supply safety.
1. Introduction
In recent years, the shortage of drinking water resources caused by environmental pollution has become a major problem for urban development in China [1,2]. Many cities have actively developed various water treatment technologies to utilize multiple water sources [3,4,5]. Among them, seawater desalination has attracted social attention because of its mature technology and wider application [6,7,8,9]. Desalinated seawater gradually enters the urban water supply network on a large scale, which will become the development trend of multiple water sources comprehensive utilization in many cities (especially in coastal cities) [10]. However, the direct entry of desalinated seawater into the water supply network can easily cause the “red water” problem [11,12] and iron pipeline corrosion in the long term, because of its lower pH, alkalinity and hardness, as well as stronger corrosiveness [13,14,15,16]. Mi et al. (2016) showed that “red water” could be controlled by adjusting the pH, alkalinity, and hardness of desalinated seawater [17]. When desalinated seawater entered the cast iron pipeline network, the water quality included maintaining the pH > 7.7, alkalinity > 80 mg/L, hardness > 80 mg/L, and adding 0.25–0.50 mg/L blended phosphate inhibitor [17]. Further, remineralization is an important treatment of desalinated water. Lesimple et al. (2020) compared the existing remineralization methods with new technologies, and suggested an energy efficient method of demineralization, which decreased the use of external source chemicals and thus reduced the environmental effects [18]. In brief, to ensure the water quality safety and protect the water pipelines, it is necessary to improve the desalinated seawater’s chemical stability by adding chemical agents and corrosion inhibitors, mixing multiple water sources, and improving operation management [19]. However, there is still a lack of corresponding technical measures in China regarding how to monitor and manage the change of desalinated seawater in the pipeline network and the corrosion condition of the pipeline in real-time. This makes it urgent to strengthen safety supervision through information technologies [20].
In Israel, desalinated seawater has been supplied widely, and the “red water” problem and pipeline corrosion caused by unstable water quality is usually restricted to small diameter pipelines in urban and household systems. Lahav et al. (2009) developed a simulation tool linking a hydraulic water quantity and quality water distribution system simulation model EPANET with STASOFT4, for calculating the calcium carbonate precipitation potential (CCPP) in a multi-water source system (mixing desalinated seawater with surface and ground water). The results indicated that increasing the alkalinity (from 50 to 100 mg/L as CaCO3) was a method which can lead to positive CCPP value and alleviate corrosion of the pipeline [21]. Ostfeld et al. (2011) proposed a model linking a genetic algorithm, a hydraulic and water quality extended period simulator, which provided a new tool for optimizing the operation of blended desalinated water system, and reduced the cost [22]. To sum up, the development of models played a significant role in improving the supervision of water quality stability in the desalination pipeline network.
In recent decades, water distribution systems have transformed from traditional physical infrastructure to cyber-physical systems, which combine physical processes with computing and networks. With the rapid development of computer and information technology, water quality online monitoring system and early warning system have been widely studied and applied [23,24]. The drinking water source monitoring and assurance system applied by Zhangjiagang City in 2006 combined the four subsystems of water source quality monitoring, emergency monitoring, laboratory monitoring, and emergency response plans, making contributions to reducing water pollution [25]. The on-line water quality monitoring system of the urban water supply network has changed the extensive management, which provided technical support for guiding water supply decision-making, supervising enterprise sewage discharge [26], and improving testing efficiency of offshore oilfield [27]. Furthermore, in order to improve the system’s abilities of events detection, early warning and real-time response, many studies have been carried out [28,29]. More than 30 water quality parameters were analyzed by the Environmental Protection Agency (EPA) to provide early alerts of potential pollution [30]. The CANARY software of the EPA was a great tool for events detection and early warning [31]. Meanwhile, the application of the artificial neural networks [28] and a dynamic thresholds scheme [29] improved the event detection ability in water distribution system. An adaptive-noisy-multi-objective-messy genetic algorithm [32], an augmented messy genetic algorithm [33], and inline mobile sensors based on the Bayesian framework [34] were used to enhance the positioning accuracy of a contamination event. Lifshitz and Ostfeld (2019) developed a coupled district metered areas and infection delay time method (DMA-IDT) for the real-time response to abnormal events in water supply network [35]. Although there are so many researches on event detection and supervision in drinking water systems, the current systems mostly focus on monitoring and early warning. There are few reports on emergency response and safety regulation functions after emergency events.
In conclusion, there are fewer researches on water quality safety supervision of desalinated seawater entering the urban water supply network in China. The water quality models and safety regulation functions are rarely used in desalinated seawater supply network. These led to problems such as lack of real-time monitoring data, a slow emergency response, low informatization level, and insufficient use of monitoring data [36], which posed a huge challenge to ensuring the stability of desalinated seawater quality and the safety of water supply network. Therefore, in this study, the safety supervision system for desalinated seawater entering urban water supply network was constructed through the development, integration, and application of key technologies. The system does not only monitor the quality, quantity, and pressure of desalinated seawater in the network, but also adds the corrosion monitoring function. Therefore, when the water quality of the pipeline network is abnormal or exceeds the standard, the system will give an alarm and activate the safety regulation system. The construction of the system provides technical support for the safety guarantee of desalinated seawater entering the urban water supply network.
2. Function of the Safety Supervision System for Desalinated Seawater Entering Urban Water Supply
2.1. Online Monitoring
Online monitoring system is used to collect and manage water and pipeline network data. These data are obtained through various monitoring sensors, transmitted to a remote computer through a signal transmission system, and processed through remote control equipment. According to the factors that may cause “red water” problems when desalinated seawater is incorporated into the urban water supply network, water quality parameters are detected in real-time, including turbidity, chromaticity, pH, redox potential, conductivity, residual chlorine, etc.
Furthermore, pipeline corrosion is monitored through CorrTran technology, which adopts three automated corrosion monitoring methods: linear polarization resistance (LPR), harmonic distortion analysis (HAD), and electro-chemical noise (ECN) method to monitor general corrosion and localized corrosion [37,38]. The CorrTran from Pepperl + Fuchs consists of three components, i.e., transmitter, probe, and electrodes. The electrodes must be chosen with the same metal properties as the pipe being investigated, and be immersed in the corrosive solution at all times. The general corrosion rate (icorr) is measured by LRP, which is based on the relationship between icorr and polarization resistance (R). The R is the ratio of the applied voltage (ΔE) to the resulting current (ΔI). A Stern-Geary voltage (B) was calculated by HDA. Finally, the LPR corrosion rate is calculated using the equation icorr = B/R. In addition, the localized corrosion is measured by ECN, which is the method of monitoring spontaneous fluctuations generated at the interface of the corroding metal and process solution. The fluctuations increase as localized corrosion occurs. The CorrTran monitors these fluctuations on the electrode surfaces, and then performs a statistical analysis resulting in a unitless pitting factor value between 0 and 1. In the end, at the completion of each measurement cycle (20 min), the respective corrosion rate and pitting value is produced and provided to managers in the form of a 4–20 mA signal. The general corrosion rate range is between 0 and 1000 mpy. As far as the localized corrosion, nearly 0 represents no localized corrosion activity and 1 represents high localized corrosion activity. Managers should pay attention to the pipeline corrosion when the sustained pitting factor is greater than 0.3 [38]. In addition, real-time monitoring of the pressure, flow and volume of desalinated seawater is achieved through pressure sensor and electromagnetic flowmeter, which can determine the ratio of desalinated seawater to conventional fresh water.
2.2. Early Warning and Forecasting
Early warning and forecasting include risk assessment of water quality and pipeline network corrosion, warnings, and plan activation. Based on the online monitoring data, technologies such as geographic information system, database, SCADA, expert system, pipeline network hydraulic water quality model, alarm function, etc., are used to monitor and predict the trend of water quality and pipeline corrosion. The limits of the on-line water quality parameters (i.e., turbidity, chromaticity, pH, redox potential, conductivity, residual chlorine) and pipeline corrosion rates are set. Other water quality indicators that cannot be monitored by sensors in real-time can be simulated and predicted by using advanced machine learning models (e.g., artificial neural network model) based on the above online monitoring data and laboratory measurement data. These water quality indicators are important to reflect the water quality safety and stability of this pipeline network, including boron, total iron, chloride and sulfate concentration, alkalinity, calcium carbonate precipitation potential (CCPP), and Langelier saturation index (LSI).
The system is monitored according to the set warning and alarm method. Common methods are as follows: (1) Over-limit warning, immediate warning after the real-time index value exceeds the set warning line; (2) statistical early warning, analyzing the accumulated water quality monitoring data using the statistical analysis method for early warning; and (3) model warning, giving early warning to the future trend of water quality through the simulation of the mathematical and neural network models. The application of various early warning methods and artificial intelligence algorithms can reduce the system false alarms. When the system operation is abnormal, the early warning system is activated to notify staff through a sound alarm, flashing indicator lights, and message notifications. According to the actual situation, the corresponding emergency treatment measures are activated manually or automatically. In addition, it is necessary to use attack detection algorithms and technologies, such as artificial neural network model, principal component analysis, random forests, to disclose the ongoing attack in a short time, avoid issuing false alarms, and identify compromised components of the system.
2.3. Safety Regulation
2.3.1. Regulation of Water Sources
Due to the large difference in water quality between desalinated seawater and raw water, the change in the water chemical composition may trigger the release of iron in the pipeline network during the water source switching process. Therefore, it is necessary to formulate scientific and reasonable multi-source dispatching alternatives (such as the mixing measure and ratio of local surface water, local groundwater, external water, and desalinated seawater). To make the water resource dispatching scheme, the information of water supply and current situation of water use, the condition of water sources, pipeline network and water plant, as well as water quality data should be collected in advance, and advanced technologies such as information monitoring, cloud computing, Internet of Things, big data, and hydraulic models can be applied. Furthermore, the proportion of each water source is strictly controlled based on the monitoring results of water quality and volume. This is conducive to ensuring the stability of water quality after the desalinated seawater enters the pipeline network.
2.3.2. Adjustment of Water Quality
- (1)
- Acid-Base Adjustment
After the desalinated seawater enters the water supply network, the balance between the pipeline scale on the inner wall and water quality is destroyed, which is likely to cause “red water” problems. The acid-base condition (pH value and alkalinity) of the water supply network is one of the important factors affecting the iron release of the pipeline network. Increasing pH and alkalinity can inhibit the release of iron in pipeline scale [39]. Therefore, the system should include the acid-base adjustment function to deal with warning alarms caused by abnormal pH and alkalinity.
- (2)
- Redox Adjustment
The redox conditions of the water supply network are one of the important factors affecting the release of iron from the pipeline network. The redox potential (ORP) is positively correlated with the residual chlorine concentration, and negatively correlated with the turbidity and total iron concentration. Therefore, based on the ORP online monitoring data, the system should be equipped with an oxidation-reduction adjustment function to solve the low ORP value and residual chlorine in the desalinated seawater supply network.
- (3)
- Dosing of corrosion inhibitor
Corrosion inhibitors are commonly used chemical products in the water treatment industry, including orthophosphate, polyphosphate, and silicate. Orthophosphate inhibits the release of iron by generating precipitation, polyphosphate by bonding or dispersion, and silicate by forming a protective film. Therefore, it is possible to install the corrosion inhibitor dosing system to regulate the water turbidity and chromaticity in the desalinated seawater network.
2.3.3. Operation Management
The flow rate of water in the water supply pipeline network affects the diffusion rate of dissolved oxygen and the thickness of the diffusion layer, which indirectly affects the corrosion of the inner wall of the iron pipeline network. In addition, the corrosion of the pipeline is intensified, and the water quality gradually deteriorates with the prolonged residence time of the desalinated water in the pipeline. Therefore, it is necessary to formulate reasonable operation management plans based on the actual pipeline network system, such as flow rate and residence time, so as to ensure the water chemical stability in the desalinated seawater network.
3. Design of the Safety Supervision System for Desalinated Seawater Entering the Urban Water Supply Network
3.1. System Framework
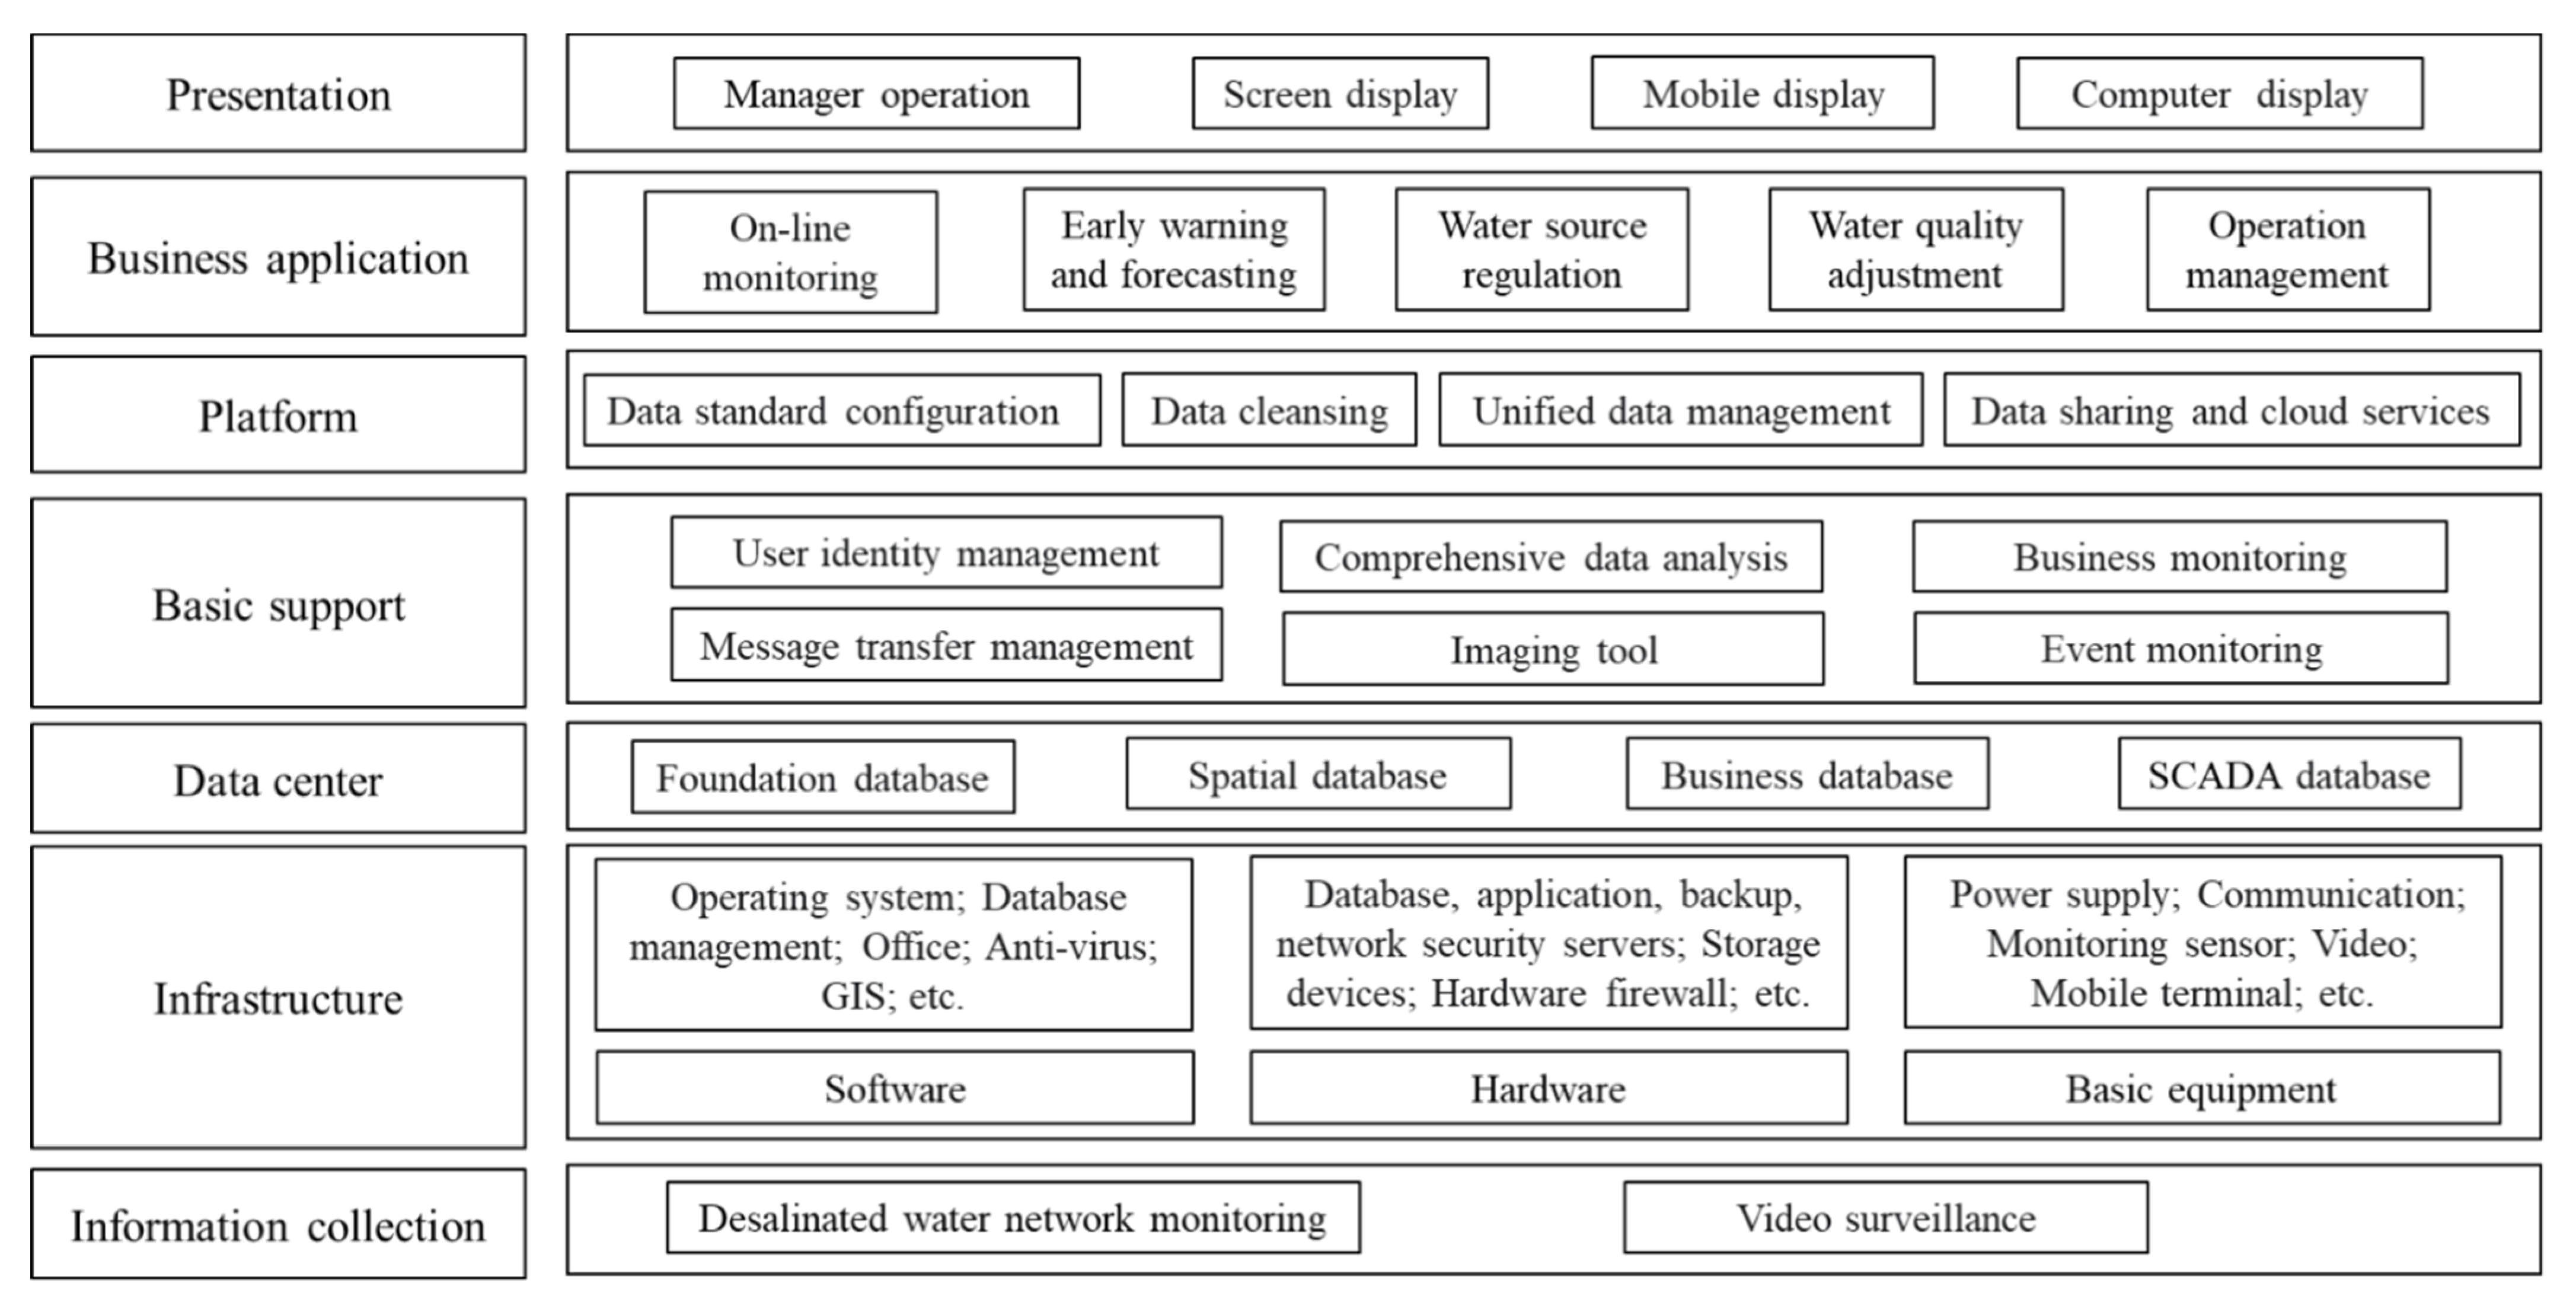
The system has a total of seven layers: information collection, infrastructure, data center, basic support, platform, business application, and presentation (Figure 1).
The information collection layer collects water’s data such as quality, pressure, flow rate, and corrosion rate in the pipeline network using monitoring sensors, and video surveillance is used to monitor the water quality laboratory, safety control equipment room, system operation room, and other external environment. These data are stored uniformly after a series of professional processing, and are shared by application platforms through the data interface. The infrastructure layer is mainly composed of various software, hardware, and other equipment for the realization of system development and supervision functions. The software includes the operating system, GIS system, database management, office, and anti-virus software. The hardware mainly refers to the computer’s various servers, storage equipment, firewalls, and switches, while the basic equipment includes power supply, communication, data, and video acquisition equipment, which is something other than the computer. The data center layer is used to store the geographic location of the network monitoring points, as well as basic and dynamic information such as water quality, quantity, pipeline corrosion, etc., collected by sensors. The data center layer consists of a basic database, business database, spatial database, and SCADA database. The basic database mainly refers to the data needed for system construction, including historical numbers, text, images, etc. The spatial database refers to a data collection of certain geographic element characteristics. It is the sum of application-related geographic spatial data stored in the computer physical storage medium of the geographic information system, including geographic information of water sources, water plants, pipeline networks, and monitoring points. The business database is an operation-oriented collection of data designed according to business services and management. The SCADA database is the data collected by the data acquisition and monitoring control system. The source is the on-site DCS system and PLC system. The system transmits the data collected on-site to the monitoring hall for scheduling, monitoring, and remote control. After real-time display, the field data is stored in the real-time database, which provides an information basis for on-site production and dispatching room scheduling. The basic support layer is composed of various software, including user identity management, message transfer management, comprehensive data analysis, imaging tool software, business monitoring management, and event monitoring management. It can realize the management of user login authority, visualization of water quality data, and control of desalinated seawater network operation. The platform layer is the core of the supervision system, including standard configuration management, unified management, sharing and cloud services of monitoring data to build a complete operation data supervision center and water supply business application management system information platform. A complete operation data supervision center and water supply application management platform is built to promote the realization of the information and integration of water supply and supervision of the desalinated seawater network. The business application layer is the concrete manifestation of the supervision system functions, including online monitoring, early warning and forecasting, water source regulation, water quality adjustment and operation management of the desalination seawater network. The presentation layer is used by managers to operate through the virtual system and display through screen, mobile, and computer.
3.2. Technical Means
- (1)
- Realize remote monitoring based on B/S mode
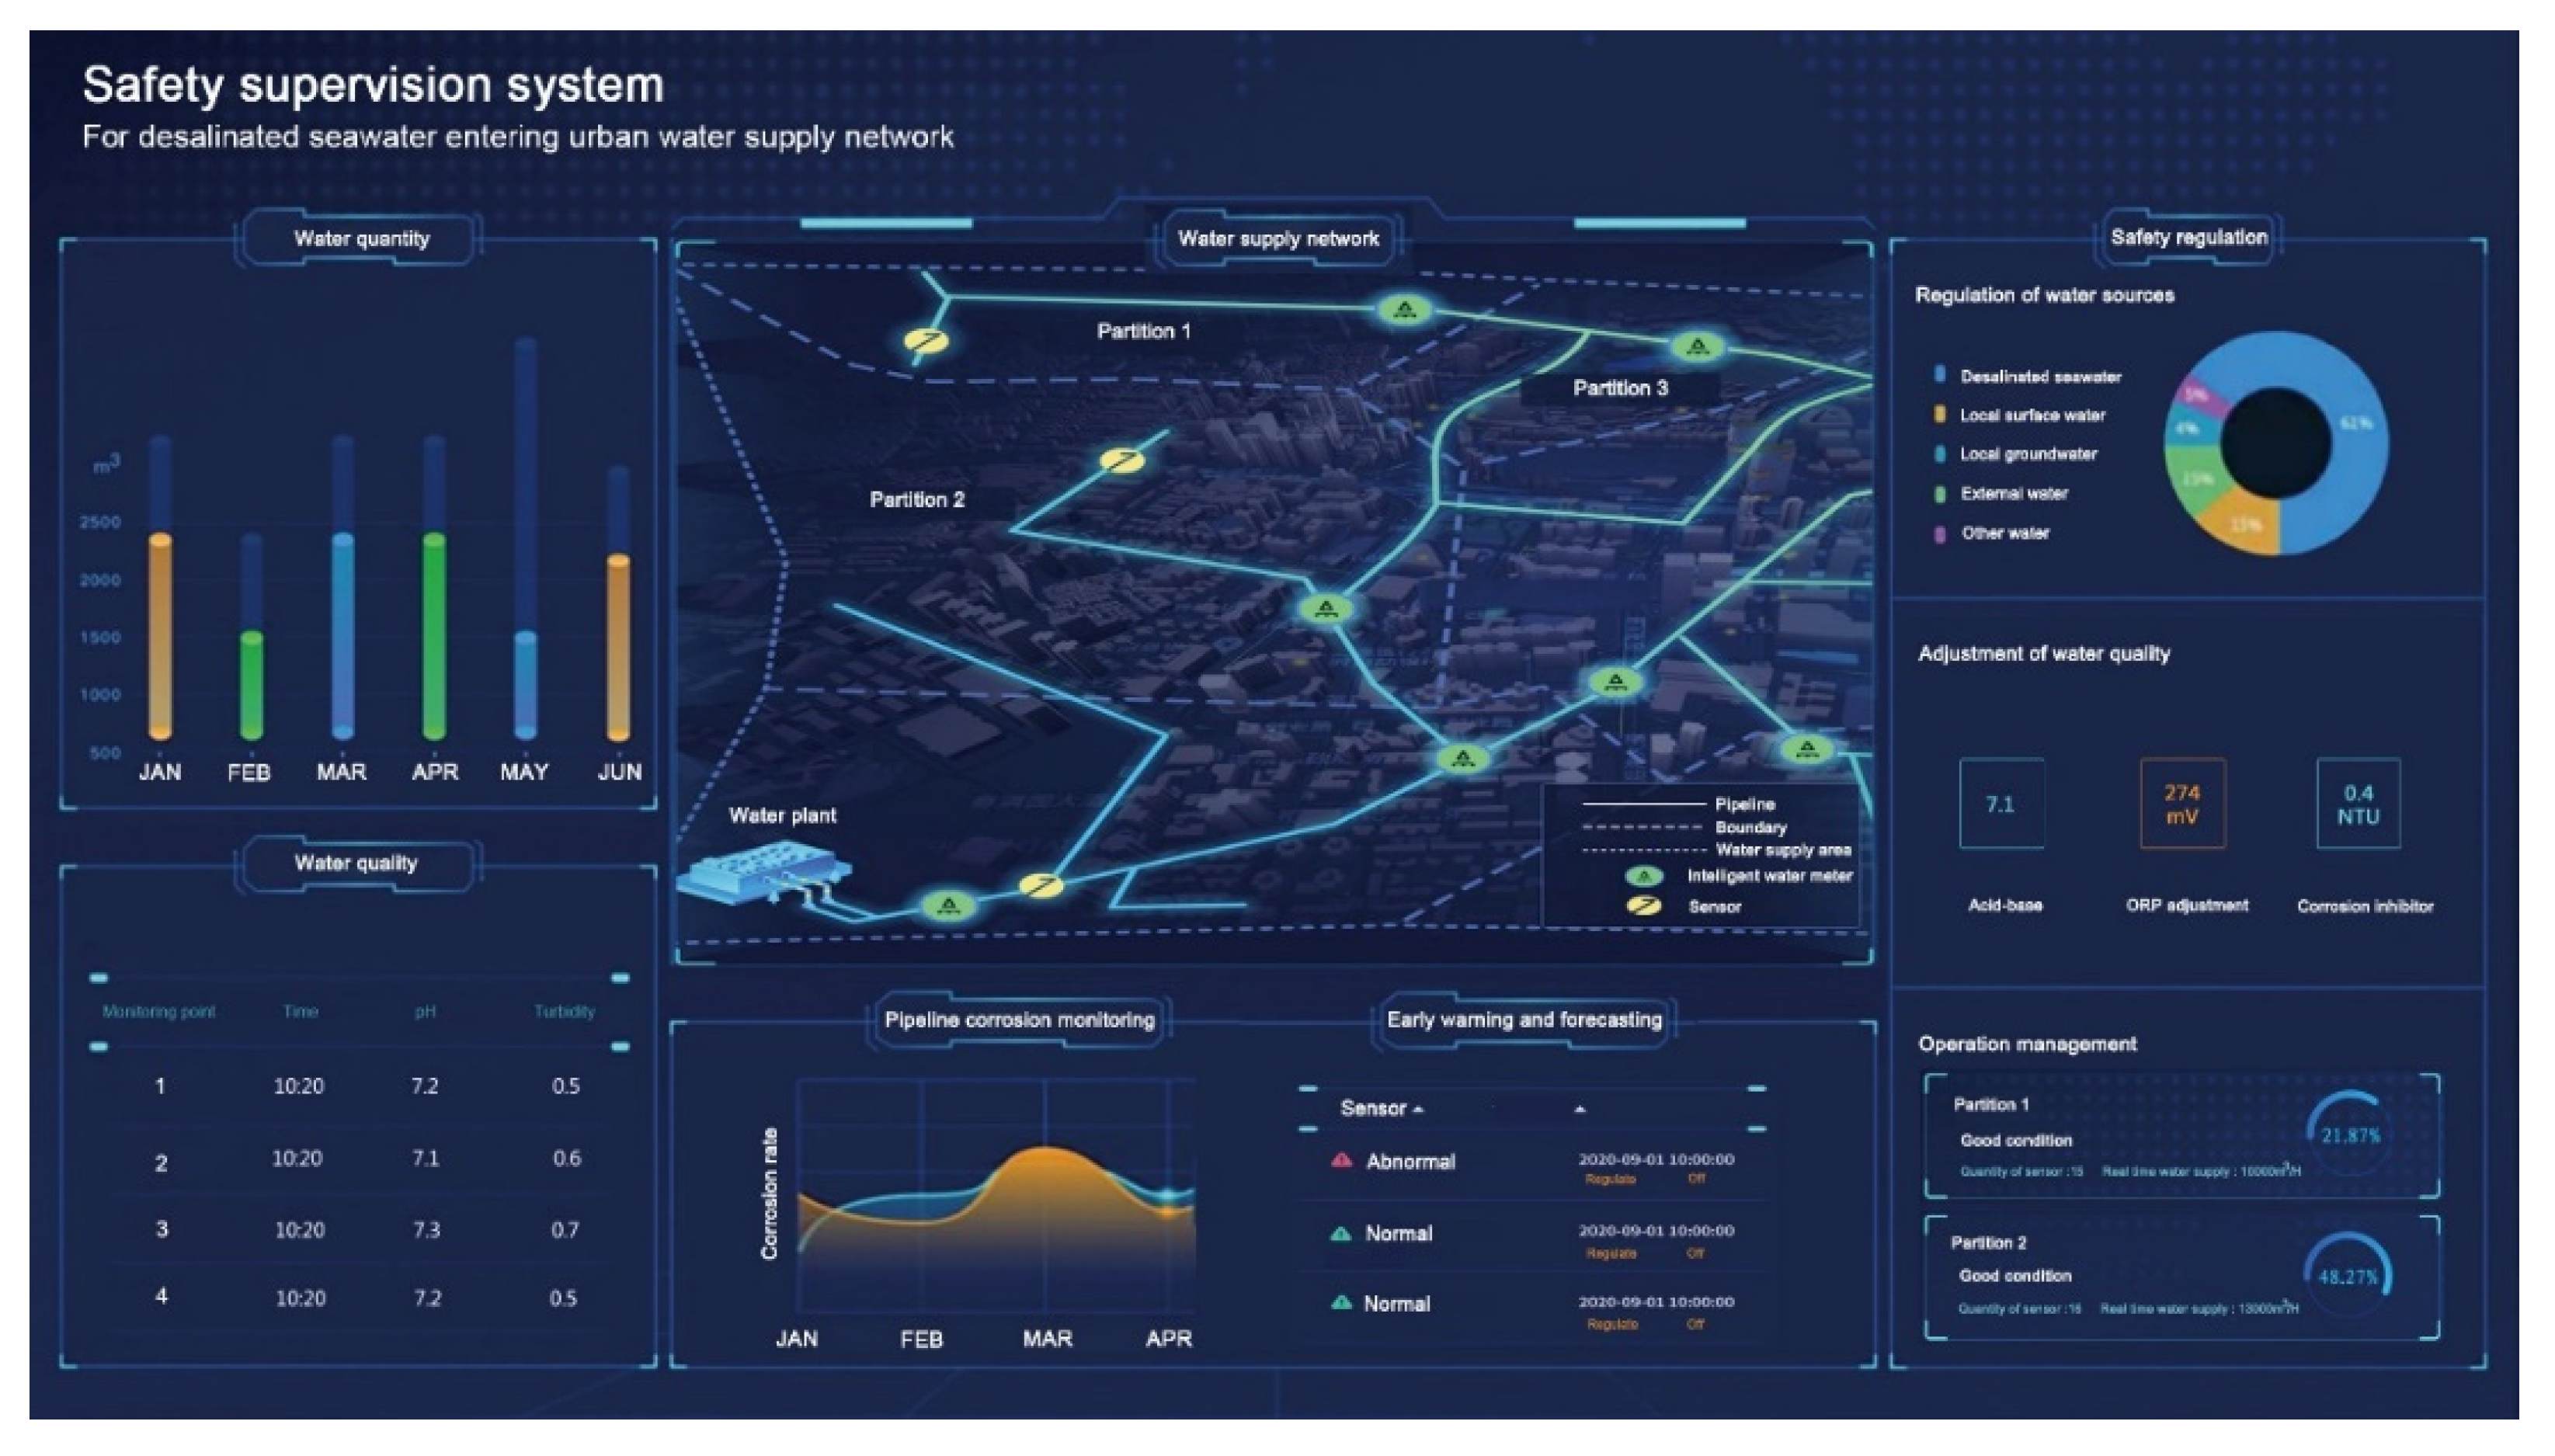
The Browser/Server model (B/S) has many advantages, such as low system cost, easy maintenance and upgrade, simple user operation, and the ability to implement cross-platform applications. The changes in the desalinated seawater quality can be remotely monitored and controlled in real-time on the browser. This structure includes a data layer, business logic layer, and presentation layer [40]. The data layer contains data storage and components interacting with it, used to execute data logic and complete data storage. The business logic layer is used to execute business logic and send requests to the database. The presentation layer (Figure 2) is the WEB browser, which is responsible for interacting with the user (i.e., the administrator). The server accepts, responds, and feeds back the user’s request, and then displays the result in the form of graphics on the client browser.
- (2)
- Realize data display based on GIS one map technology
The GIS system integrates basic geographic graphic information and network water data, and queries, locates, counts, and analyzes the data of each water supply pipeline, to provide accurate, fast, and scientific information for the operation supervision, water source regulation, and emergency management in the desalinated seawater network.
- (3)
- System integration based on SOA architecture
Service-oriented architecture (SOA) is an enterprise generic architecture that separates different functional units of an application (called services) and connects them through well-defined interfaces and protocols between those services. This allows the services in the system to interact in a unified and universal way. The functional modules required by each system application are integrated in a service manner. This can minimize the degree of system coupling, improve the scalability of the system, and make the system design clearer and simpler, thus facilitating the interconnection of various business components and the development of platform integration.
3.3. System Operation
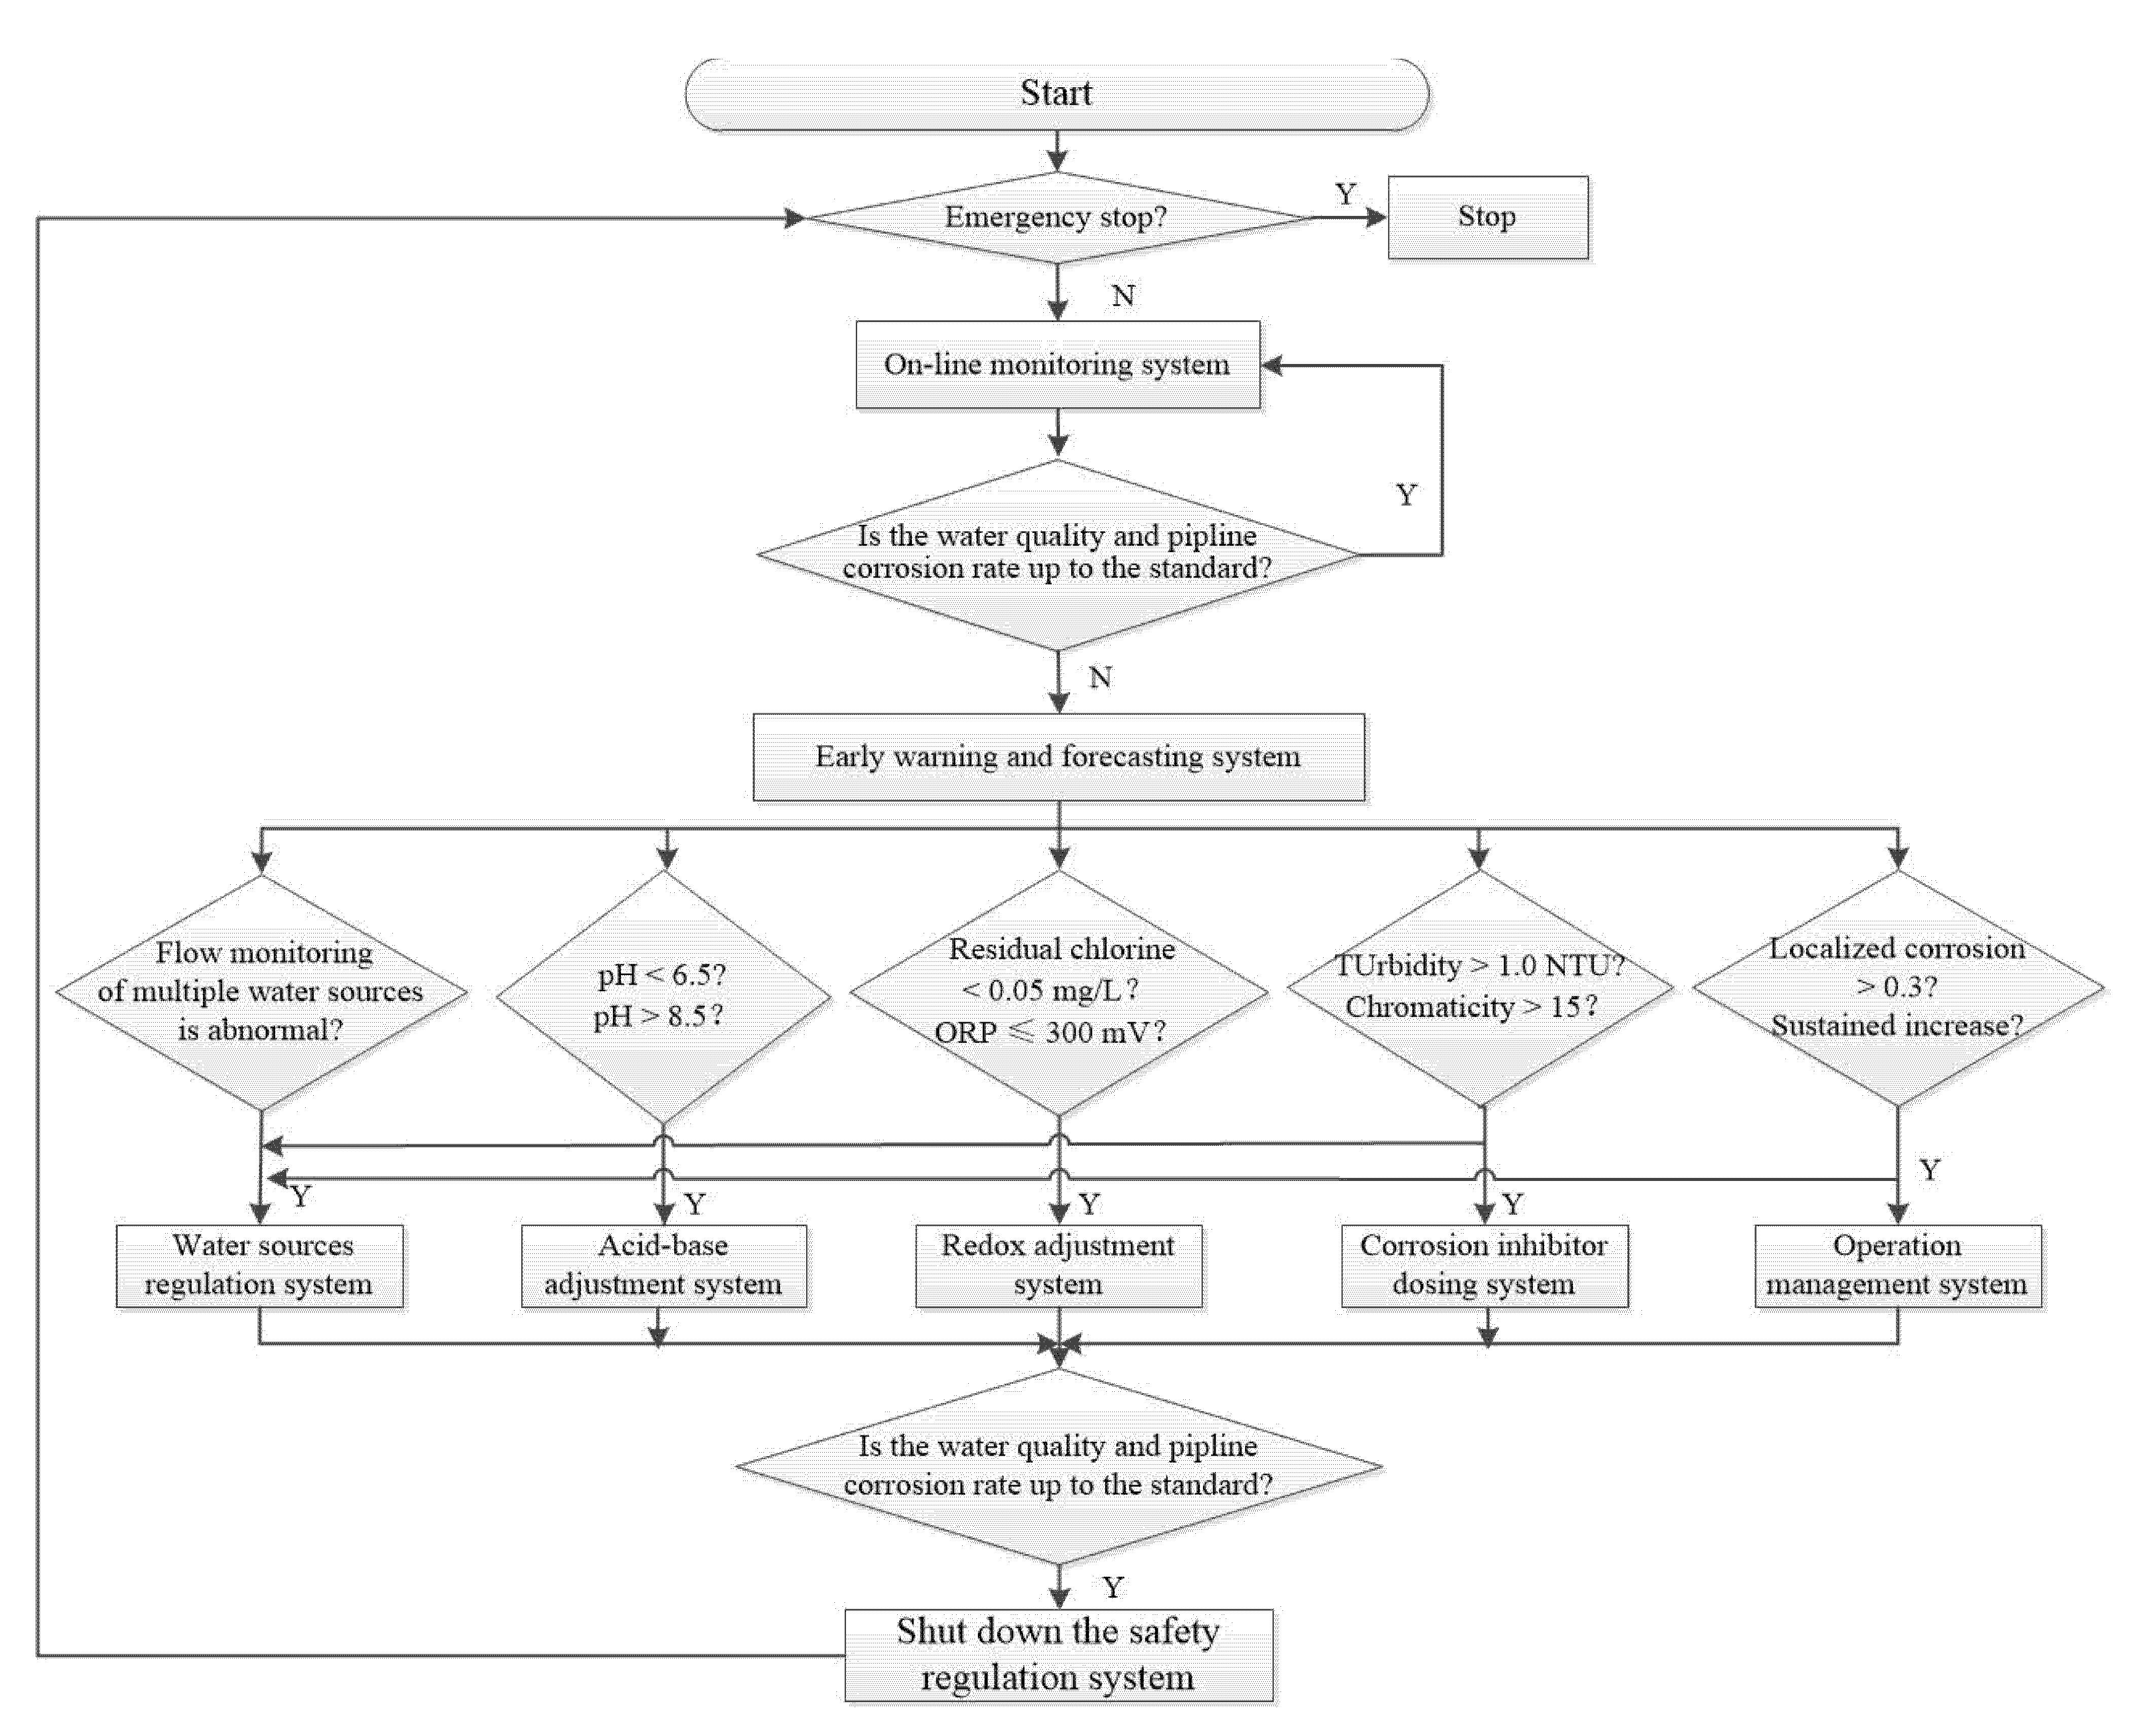
In this system, the monitoring indicators include pH, turbidity, chromaticity, redox potential (i.e., oxidation reduction potential, ORP), electrical conductivity, residual chlorine, and pipeline corrosion rate. The online monitoring system obtains the average monitoring data every 2 h. Importantly, the flow (water consumption) is the second criterion for the frequency of data collection, which will be increased when the flow (water consumption) is at its peak. The early warning and forecasting system will initiate an alarm when the water quality parameters exceed the standard for three consecutive times (see Table 1) or when the change trend is abnormal, based on the prediction by advanced estimation models, activating the safety control system according to the specific situation (see Figure 3 for the process).
Based on the online monitoring data, the flow monitoring is abnormal when the mixing ratio of multiple water sources does not conform to the water source scheduling plan. The water source regulation system is activated to make the mixing ratio of the desalinated seawater and other water sources in the pipeline network conform to the scheduling plan.
The water quality adjustment system is activated when the water quality exceeds the standard and causes a warning alarm in the desalinated seawater supply network. When the pH value is lower than the limit, the acid-base adjustment system is activated. The supervisory system adjusts the pH value by adding NaOH solution and adjusts the alkalinity by NaHCO3 and CO2 until the water quality reaches the standard. The redox control system is started because of the low ORP value and residual chlorine. After the weak current signal is transmitted to the control electric box, free chlorine (NaClO) or monochloramine (NH2Cl) is injected at a certain flow rate with a syringe pump. When the ORP value reaches the highest limit, the syringe pump is automatically turned off, and the change of residual chlorine is continuously monitored. In the case of excessive turbidity, chromaticity, and corrosion rate in the pipeline network, in addition to the water source regulation system, acid-base adjustment and redox adjustment system, the corrosion inhibitor dosing system can also be activated to dose orthophosphate, polyphosphate or silicate in stages. On the other hand, the operation management system adjusts the water flow rate and residence time of the pipeline network through flow meters and pump. Within a certain range, water quality control does not need to stop the water supply, unless the water quality is seriously bad and affects the health of residents. In this case, the water supply must be stopped, and the water supply can only be restored after the water quality reaches the drinking water standard and the pipe network is flushed. In short, whether the water is cut off during safety control needs to be confirmed by the manager through on-site confirmation and water quality monitoring results.
3.4. Application Effects
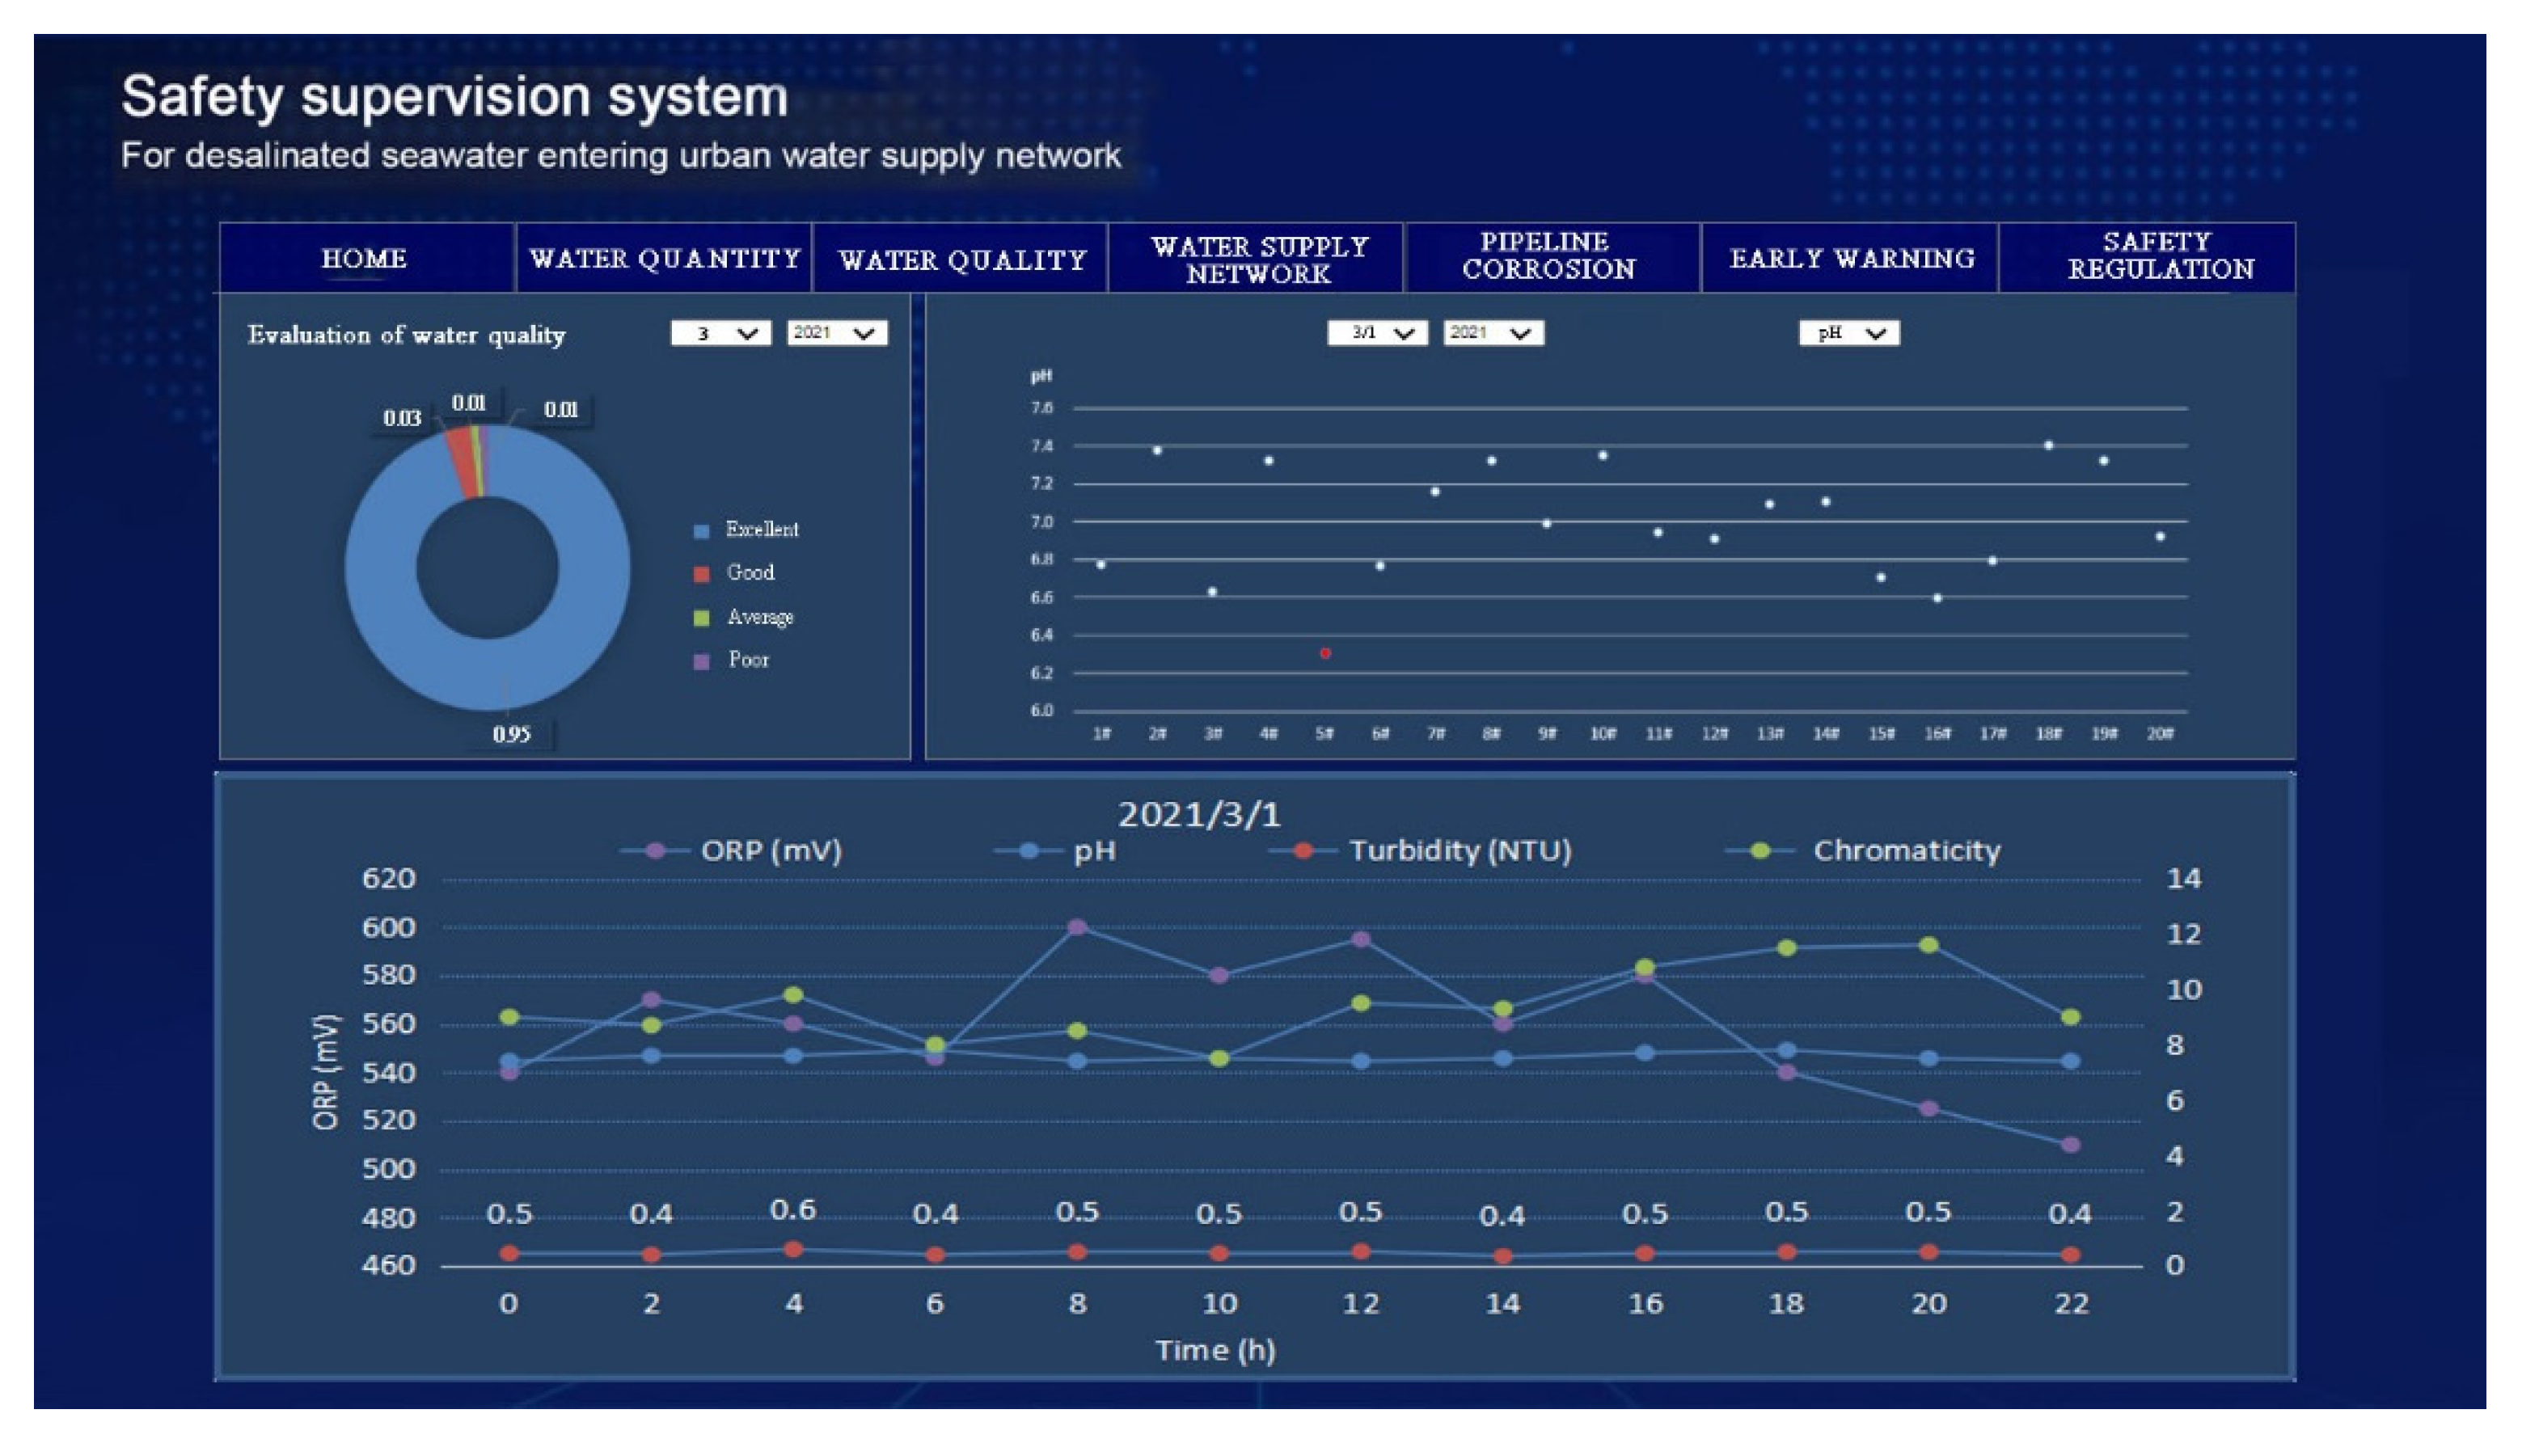
The proposed supervision system has been applied preliminary at the test site. The site is a fragment of the real network, and the experiment did not affect the normal water supply. The interface is shown in Figure 2. Data of water quantity, water quality and corrosion rate, monitoring point distribution and operation status are clearly displayed. At the test site, desalinated seawater entered the monitored water supply network after mixing with 60% local groundwater. The mixing proportion of water source was determined according to the preliminary test in the laboratory. As shown in Figure 4, pH, turbidity, chromaticity, and ORP trend over time was recorded at a monitoring point. The data showed that all the water quality indicators did not exceed the limit and fluctuated slightly. This indicated that the water supply system was functioning well.
In order to verify that the system monitors water quality parameters in a timely and accurate manner, and obtains information such as pH, turbidity, chromaticity, and oxidation-reduction potential (ORP) more efficiently, we have selected different dates (1 March 2021 and 2 March 2021) and different times (0:00, 8:00, 14:00, 20:00) for data monitoring. The data collected from the sensors (measured values) were compared with the data measured in the laboratory (standard values) (Table 2). Among them, the pH control accuracy was maintained at ±0.13, and the relative error was 0.62%. The control accuracy of turbidity was maintained at ±0.02 NTU, and the relative error was 0.25%. The control accuracy of turbidity was maintained at ±0.02, and the relative error was 0.23%. The ORP control accuracy was maintained at ±12.68 mV, and the relative error was 0.51%. In short, compared with the standard values, the relative errors of the measured water quality parameters are small. The system operated stably under real-time on-site monitoring and realized accurate monitoring and control of water quality parameters such as pH, turbidity, chroma, and ORP value. It meets the demand for water quality monitoring in the desalination seawater pipeline network.
Further, to test the warning and safety regulation functions of the system, a hydrochloric acid (HCl) solution was added to reduce the pH to 6.5. After 4 h, the alarm system was activated. The safety regulation system started after manual confirmation. The acid-base adjustment system added the NaOH solution slowly until the pH returned to the normal range (about pH 7.5). The pH change trend during acid-base adjustment was monitored in real-time (Figure 5). It can be seen that this safety supervision system can quickly find problems and take measures, because of its water quality monitoring, early warning, and safety regulation functions.
It should be pointed out that because the system is only a preliminary test, the water quality data of the pipeline network are limited. In the future, we will use more advanced technologies, such as artificial neural network models, to improve the system’s early warning, prediction capabilities, and the accuracy of safety regulation.
4. Conclusions
With the development of seawater desalination technology, the utilization of desalinated seawater has gradually become the trend of multiple water sources in many cities, especially in coastal cities. In order to ensure the stability of water transmission and the safety of the pipeline network, it is necessary not only to study post-processing technologies to improve the stability of water quality, but also to strengthen related safety supervision. Aiming at the “red water” problem in the desalinated seawater supply network, this study constructed a safety supervision system for desalinated seawater entering the urban water supply network based on the B/S structure, GIS system, and SOA architecture. The system includes the online monitoring system and the early warning and forecasting system to monitor the desalinated seawater supply network; it also includes the water source control, water quality adjustment, and operation management systems to manage the desalinated seawater supply network. The application of this system provides technical support to ensure the stable transmission of desalinated seawater and the safety of the pipelines, and to improve the supervision efficiency of the desalinated seawater supply network.
Author Contributions
Conceptualization, C.Z. and Q.G.; methodology, J.S.; software, F.S.; validation, C.Z. and Y.W.; formal analysis, Q.G.; investigation, J.S.; resources, C.Z.; data curation, Y.W.; writing—original draft preparation, Q.G. and C.Z.; writing—review and editing, Q.G., J.S. and F.S.; visualization, F.S.; supervision, Y.W.; project administration, C.Z.; funding acquisition, C.Z. All authors have read and agreed to the published version of the manuscript.
Funding
This research was funded by The National Key Research and Development Program of China, grant number No. 2018YFC0408000, 2018YFC0408004 and No. 2018YFC0408100, 2018YFC0408102, National Natural Science Foundation of China, grant number No. 51809285, and Technology Demonstration Program of Ministry of Water Resources, China, grant number No. SF-202106. The APC was funded by Technology Demonstration Program of Ministry of Water Resources, China (No. SF-202106).
Institutional Review Board Statement
Not applicable.
Informed Consent Statement
Not applicable.
Data Availability Statement
Data is contained within the article.
Conflicts of Interest
The authors declare no conflict of interest.
References
- Cao, G.; Yang, L.; Liu, L.; Ma, Z.; Wang, J.; Bi, J. Environmental incidents in China: Lessons from 2006 to 2015. Sci. Total. Environ. 2018, 633, 1165–1172. [Google Scholar] [CrossRef] [Green Version]
- Guo, X.; Lv, X.; Zhang, A.; Yan, Z.; Chen, S.; Wang, N. Antibiotic contamination in a typical water-rich city in southeast China: A concern for drinking water resource safety. J. Environ. Sci. Health 2020, 55, 193–209. [Google Scholar] [CrossRef]
- Hu, Y.; Yang, S.H.; He, H.Z.; Chen, H.; Zheng, S.G.; Zhang, D. Modeling and simulation analysis of multi-point hydraulic wave energy desalination system. Ocean. Eng. 2019, 37, 134–141. (In Chinese) [Google Scholar]
- Ma, Y.; Chang, J.; Guo, A.; Wu, L.; Yang, J.; Chen, L. Optimizing Inter-basin water transfers from multiple sources among interconnected River basins. J. Hydrol. 2020, 590, 125461. [Google Scholar] [CrossRef]
- Zhang, Z.; Wang, W. Managing aquifer recharge with multi-source water to realize sustainable management of groundwater resources in Jinan, China. Environ. Sci. Pollut. Res. Int. 2021, 28, 10872–10888. [Google Scholar] [CrossRef]
- Feria-Díaz, J.J.; Correa-Mahecha, F.; López-Méndez, M.C.; Rodríguez-Miranda, J.P.; Barrera-Rojas, J. Recent desalination technologies by hybridization and integration with reverse osmosis: A review. Water 2021, 13, 1369. [Google Scholar] [CrossRef]
- Lim, Y.J.; Goh, K.; Kurihara, M.; Wang, R. Seawater desalination by reverse osmosis: Current development and future challenges in membrane fabrication-a review. J. Membr. Sci. 2021, 629, 119292. [Google Scholar] [CrossRef]
- Wang, Z.; Zhang, Y.; Wang, T.; Zhang, B.; Ma, H. Design and energy consumption analysis of small reverse osmosis seawater desalination equipment. Energies 2021, 14, 2275. [Google Scholar] [CrossRef]
- Saavedra, A.; Valdés, H.; Mahn, A.; Acosta, O. Comparative analysis of conventional and emerging technologies for seawater desalination: Northern Chile as a case study. Membranes 2021, 11, 180. [Google Scholar] [CrossRef]
- Ge, Y.H.; Liu, Y.H.; Zhao, H.L.; Su, L.Y.; Ruan, G.L. Considerations on introduction of desalinated seawater to municipal water distribution system. China Water Wastewater 2009, 25, 84–87. (In Chinese) [Google Scholar]
- Birnhack, L.; Penn, R.; Lahav, O. Quality criteria for desalinated water and introduction of a novel, cost effective and advantageous post treatment process. Desalination 2008, 221, 70–83. [Google Scholar] [CrossRef]
- Mi, Z.L.; Zhang, X.J.; Chen, C.; Wang, J. Iron stability in desalinated seawater in municipal drinking water distribution systems. J. Tsinghua Univ. (Sci. Technol.) 2014, 54, 1333–1338. (In Chinese) [Google Scholar]
- Greenlee, L.F.; Lawler, D.F.; Freeman, B.D.; Marrot, B.; Moulin, P. Reverse osmosis desalination: Water sources, technology, and today′s challenges. Water Res. 2009, 43, 2317–2348. [Google Scholar] [CrossRef]
- Shams El Din, A.M. Three strategies for combating the corrosion of steel pipes carrying desalinated potable water. Desalination 2009, 238, 166–173. [Google Scholar] [CrossRef]
- Deng, A.; Xie, R.; Gomez, M.; Adin, A.; Ong, C.N.; Hu, J. Impact of pH level and magnesium addition on corrosion of re-mineralized seawater reverse osmosis membrane (SWRO) product water on pipeline materials. Desalination 2014, 351, 171–183. [Google Scholar] [CrossRef]
- Liang, J.; Deng, A.; Xie, R.; Gomez, M.; Hu, J.; Zhang, J.; Ong, C.N.; Adin, A. Impact of elevated Ca2+/Mg2+ concentrations of reverse osmosis membrane desalinated seawater on the stability of water pipe materials. J. Water Health 2014, 12, 24–33. [Google Scholar] [CrossRef]
- Mi, Z.; Zhang, X.; Chen, C. Iron release in drinking water distribution systems by feeding desalinated seawater: Characteristics and control. Desalination Water Treat. 2016, 57, 9728–9735. [Google Scholar] [CrossRef]
- Lesimple, A.; Ahmed, F.E.; Hilal, N. Remineralization of desalinated water: Methods and environmental impact. Desalination 2020, 496, 114692. [Google Scholar] [CrossRef]
- Fan, J.; Li, H.B.; Wang, W.Q.; Wang, S.J.; Zheng, B. Research on chemical stability of water quality in municipal distribution system using desalinated water. Water Technol. 2016, 10, 1–5. (In Chinese) [Google Scholar]
- Li, L.X.; Li, K.H.; Wang, H.T.; Sun, H.; Xu, N.N.; Bao, Y.F. Strengthening monitoring and supervision of water supply utilities in rural areas: Research and practices. China Water Resour. 2020, 5, 15–17. (In Chinese) [Google Scholar]
- Lahav, O.; Salomons, E.; Ostfeld, A. Chemical stability of inline blends of desalinated, surface and ground waters: The need for higher alkalinity values in desalinated water. Desalination 2009, 239, 334–345. [Google Scholar] [CrossRef]
- Ostfeld, A.; Salomons, E.; Lahav, O. Chemical water stability in optimal operation of water distribution systems with blended desalinated water. J. Water Resour. Plan. Manag. 2011, 137, 531–541. [Google Scholar] [CrossRef] [Green Version]
- Dai, Z.W.; Liao, H.Y. An on-line water quality monitoring system for the reservoirs based on Android. Adv. Mater. Res. 2014, 3227, 2199–2202. [Google Scholar] [CrossRef]
- Hossain, S.M.Z.; Mansour, N. Biosensors for on-line water quality monitoring—A review. Arab. J. Basic Appl. Sci. 2019, 26, 502–518. [Google Scholar] [CrossRef]
- Zhou, M.; Wang, Q.; Lv, S.Q. Research on water quality monitoring and safeguard system of drinking water-sources on the Yangtze river. Yangtze River 2006, 37, 12–14, 127. (In Chinese) [Google Scholar]
- Li, Y.J. Design of online water quality monitoring system for a wastewater network in Hangzhou. China Water Wastewater 2009, 25, 49–52. (In Chinese) [Google Scholar]
- Cui, J.G.; Ma, X.H.; Zheng, X.L.; Zheng, X.J.; Yang, D.W.; Wang, F. Implementation and application of online water quality monitoring system for Marine sewage reinjection pipeline network. China Pet. Chem. Stand. Qual. 2018, 38, 37–38. (In Chinese) [Google Scholar]
- Perelman, L.; Arad, J.; Housh, M.; Ostfeld, A. Event detection in water distribution systems from multivariate water quality time series. Environ. Sci. Technol. 2012, 46, 8212–8219. [Google Scholar] [CrossRef]
- Arad, J.; Housh, M.; Perelman, L.; Ostfeld, A. A dynamic thresholds scheme for contaminant event detection in water distribution systems. Water Res. 2013, 47, 1899–1908. [Google Scholar] [CrossRef]
- USEPA. WaterSentinel: Online Water Quality Monitoring as an Indicator of Drinking Water Contamination; For Official Use Only; USEPA: Washington, DC, USA, 2005.
- Leow, A.; Burkhardt, J.; Platten, W.E., III; Zimmerman, B.; Brinkman, N.E.; Turner, A.; Murray, R.; Sorial, G.; Garland, J. Application of the CANARY event detection software for real-time performance monitoring of decentralized water reuse systems. Environ. Sci. Water Res. 2017, 3, 224–234. [Google Scholar] [CrossRef]
- Sankary, N.; Ostfeld, A. Multiobjective optimization of inline mobile and fixed wireless sensor networks under conditions of demand uncertainty. J. Water Resour. Plan. Manag. 2018, 144, 4018043. [Google Scholar] [CrossRef]
- Sankary, N.; Ostfeld, A. Scaled multiobjective optimization of an intensive early warning system for water distribution system security. J. Hydraul. Eng. 2017, 143, 4017025. [Google Scholar] [CrossRef]
- Sankary, N.; Ostfeld, A. Bayesian localization of water distribution system contamination intrusion events using inline mobile sensor data. J. Water Resour. Plan. Manag. 2019, 145, 4019029. [Google Scholar] [CrossRef]
- Lifshitz, R.; Ostfeld, A. Clustering for real-time response to water distribution system contamination event intrusions. J. Water Resour. Plan. Manag. 2019, 145, 4018091. [Google Scholar] [CrossRef]
- Yu, X.; Zhang, Z.G.; An, Y.M.; Tao, X.W.; Li, L.; Dai, X.Q.; Ma, Z.Y.; Chen, F.; Zhou, W.Q. Exploration and practice on supervision of urban water supply in the big data era. Water Wastewater Eng. 2020, 46, 168–171. (In Chinese) [Google Scholar]
- Liu, G.X. Desalination is used as the circulating cooling water corrosion monitoring system development. Total. Corros. Control 2017, 31, 55–58. (In Chinese) [Google Scholar]
- Innovations in corrosion monitoring. World Pumps 2005, 2005, 20–24. [CrossRef]
- Wen, R.; Liu, W.J. Control effect of regulating desalinated seawater quality parameters on iron release in drinking water distribution system. Water Wastewater Eng. 2016, 52, 110–115. (In Chinese) [Google Scholar]
- Zhang, B. Design and implementation of B/S-mode-based SWRO remote monitoring system. Master′s Thesis, Hangzhou Dianzi University, Hangzhou, China, 2015. (In Chinese). [Google Scholar]
Figure 1.
Framework of the safety supervision system for desalinated seawater entering urban water supply network.
Figure 1.
Framework of the safety supervision system for desalinated seawater entering urban water supply network.

Figure 2.
Interface of the supervision system.

Figure 3.
Operation process of the supervision system.

Figure 4.
On-line monitoring data of ORP, pH, turbidity, and chromaticity.

Figure 5.
The pH change trend during acid-base adjustment.


Table 1.
Limits of water quality parameters for desalination seawater incorporated into urban water supply network.
Table 1.
Limits of water quality parameters for desalination seawater incorporated into urban water supply network.
| Parameter | Unit | Limit |
|---|---|---|
| pH value (25 ℃) | - | 6.5~8.5 |
| Turbidity | NTU | ≤1.0 |
| Chromaticity | Degree | ≤15 |
| Residual chlorine | mg/L | ≥0.05 |
| Oxidation reduction potential (ORP) | mV | >300 |
| Alkalinity | mg/L | ≥50 |
| Localized corrosion | - | ≤0.3 |
| Langelier saturation index (LSI) | - | −0.5~0.5 |
Table 2.
Comparison of measured and standard value of water quality parameters.
| Date | Parameters | Time | Standard Value | Measured Value | Relative Error % |
|---|---|---|---|---|---|
| 1 March 2021 | pH value | 00:00 | 7.58 | 7.45 | −1.72 |
| 08:00 | 7.54 | 7.43 | −1.46 | ||
| 14:00 | 7.62 | 7.55 | −0.92 | ||
| 20:00 | 7.55 | 7.59 | +0.53 | ||
| Turbidity (NTU) | 00:00 | 0.46 | 0.48 | +4.35 | |
| 08:00 | 0.41 | 0.40 | −2.44 | ||
| 14:00 | 0.37 | 0.35 | −5.41 | ||
| 20:00 | 0.50 | 0.50 | +0.00 | ||
| Chromaticity | 00:00 | 8.9 | 9.2 | +3.37 | |
| 08:00 | 8.1 | 8.0 | −1.23 | ||
| 14:00 | 9.6 | 9.4 | −2.08 | ||
| 20:00 | 12.1 | 11.8 | −2.48 | ||
| ORP (mV) | 00:00 | 545 | 540 | −0.92 | |
| 08:00 | 551 | 546 | −0.91 | ||
| 14:00 | 563 | 560 | −0.53 | ||
| 20:00 | 522 | 525 | +0.57 | ||
| 2 March 2021 | pH value | 00:00 | 7.58 | 7.53 | −0.69 |
| 08:00 | 7.84 | 7.88 | +0.49 | ||
| 14:00 | 7.82 | 7.83 | +0.17 | ||
| 20:00 | 7.45 | 7.35 | −1.37 | ||
| Turbidity (NTU) | 00:00 | 0.86 | 0.85 | −0.63 | |
| 08:00 | 0.63 | 0.65 | +3.58 | ||
| 14:00 | 0.40 | 0.41 | +3.30 | ||
| 20:00 | 0.70 | 0.69 | −0.75 | ||
| Chromaticity | 00:00 | 9.5 | 9.3 | −1.77 | |
| 08:00 | 9.2 | 9.5 | +2.84 | ||
| 14:00 | 13.2 | 13.0 | −1.52 | ||
| 20:00 | 9.7 | 9.8 | +1.05 | ||
| ORP (mV) | 00:00 | 673 | 670 | −0.37 | |
| 08:00 | 556 | 561 | +0.90 | ||
| 14:00 | 553 | 540 | −2.29 | ||
| 20:00 | 680 | 676 | −0.55 |
Publisher’s Note: MDPI stays neutral with regard to jurisdictional claims in published maps and institutional affiliations. |
© 2021 by the authors. Licensee MDPI, Basel, Switzerland. This article is an open access article distributed under the terms and conditions of the Creative Commons Attribution (CC BY) license (https://creativecommons.org/licenses/by/4.0/).
Share and Cite
MDPI and ACS Style
Zhao, C.; Gao, Q.; Song, J.; Wang, Y.; Sun, F. Research on Design of the Safety Supervision System for Desalinated Seawater Entering Urban Water Supply Network. Water 2021, 13, 2017. https://doi.org/10.3390/w13152017
AMA Style
Zhao C, Gao Q, Song J, Wang Y, Sun F. Research on Design of the Safety Supervision System for Desalinated Seawater Entering Urban Water Supply Network. Water. 2021; 13(15):2017. https://doi.org/10.3390/w13152017
Chicago/Turabian StyleZhao, Cui, Qiqi Gao, Jiajun Song, Yueguo Wang, and Fuzeng Sun. 2021. "Research on Design of the Safety Supervision System for Desalinated Seawater Entering Urban Water Supply Network" Water 13, no. 15: 2017. https://doi.org/10.3390/w13152017
Note that from the first issue of 2016, this journal uses article numbers instead of page numbers. See further details here.