Article

Nature-Based Coastal Protection by Large Woody Debris as Compared to Seawalls: A Physical Model Study of Beach Morphology and Wave Reflection

1
Leichtweiß-Institute for Hydraulic Engineering and Water Resources, Technische Universität Braunschweig, 38106 Braunschweig, Germany
2
INROS LACKNER SE, 28359 Bremen, Germany
3
Department of Civil Engineering, University of Ottawa, Ottawa, ON K1N 6N5, Canada
4
Northwest Hydraulic Consultants, Nanaimo, BC V9R 6B9, Canada
5
Coastal Research Center, Joint Research Facility of Technische Universität Braunschweig and Leibniz University Hannover, 30419 Hannover, Germany
6
Ocean, Coastal, and River Engineering (OCRE), National Research Council of Canada, Ottawa, ON K1N 6N5, Canada
*
Author to whom correspondence should be addressed.
Water 2021, 13(15), 2020; https://doi.org/10.3390/w13152020
Submission received: 28 June 2021 / Revised: 20 July 2021 / Accepted: 21 July 2021 / Published: 23 July 2021
(This article belongs to the Special Issue Advances in Coastal and Ocean Engineering)

Abstract

:
Anchored Large Woody Debris (LWD) is increasingly being used as one of several nature-based coastal protection strategies along the north-western coasts of Canada and the US. As an alternative to conventional hard armoring (e.g., seawalls), its usage is widely considered to be less harmful to the coastal ecosystem while maintaining the ability to protect the beaches against wave attack and erosion. The effects of seawalls on beaches have been extensively studied; however, the performance and efficacy of LWD and its potential as a suitable alternative to seawalls (and other shoreline protection structures) are still understudied in current research. This paper presents and compares the effects of a conventional vertical seawall with two different LWD structures on beach morphology and wave reflection through large-scale physical modeling in a wave flume at a 1:5 scale. An assessment of techniques used to measure beach morphology and an assessment of model effects were included in the study. It was found that the wave reflection could be reduced by using a single log instead of a wall structure, while changes in the beach morphology response largely depended on the type of the LWD structure. A stacked log wall showed near-identical behavior as a conventional seawall. Visible model effects from the experiments, including the effect of the flume sidewalls on the beach morphology, were quantified and analyzed to inform future research.

1. Introduction

Over past decades, concerns about potential adverse environmental effects of conventional shoreline armoring (e.g., seawalls) and its suitability to mitigate the potential effects of climate change (e.g., sea-level rise and increasing storm intensity) are growing in many coastal communities [1,2]. Seawalls are sometimes associated with adversely influencing natural sedimentation processes [1,3,4]; hence, they are “compromising the natural adaptive capacity of shorelines” [1]. In contrast to unmanaged shorelines, seawall-protected beaches have recently been shown to reduce in coastal biodiversity and abundance of organisms [5]. Shoreline armoring has been linked to lower amounts of vegetation, driftwood, and beach wrack [6]. As a consequence, a paradigm shift towards using natural and nature-based coastal protection methods can be observed at a global level [7,8], and conventional “hard“ structures now undergo scrutiny as to whether their protective benefits can be achieved through more natural methods of coastal protection [9]. Following the definition of the US Army Corps of Engineers, nature-based coastal protection is defined as an imitation of natural coastal features intentionally built and designed by humans [10]. Active topics in the field of nature-based solutions cover the effectiveness of vegetation on wave attenuation over shallow slopes [11], the biomechanical properties of salt marsh vegetation [12], dune evolution when stabilized by sand fences [13], the flow resistance of coastal wooden fences [14], and the erosion management through permeable wooden dams [15].
One example of frequently used natural and nature-based methods for shoreline protection on the north-western coasts is anchored LWD. To protect the coastline against erosion and wave run-up, LWD structures have been anchored into the beach with the aim of mimicking the natural accumulation of logs and woody debris. The technique dates back to at least the late 1990s, with anecdotal evidence suggesting use as early as the mid 1900s [4,16,17]. LWD is typically held in place within the swash zone by chains, cables, steel pins, or other low-tech means. In the more unmanaged past, natural accumulations of LWD were abundant along coastlines and in coastal streams [18,19], forming an integral part of local ecosystems [20]. Existing research demonstrates that natural accumulations of LWD function to add surface roughness to sand beaches and, hence serve as a trap for aeolian sediment [19,21,22]. A field study in New Zealand [23] found that natural LWD facilitated a steeper beach face and a higher berm on a gravel beach under storm conditions, thus providing additional protection against wave impact. Buried logs may have the potential to help stabilize beaches [24] and provide additional substrate for coastal vegetation to grow [25,26].
In contrast to natural accumulations of LWD, anchored LWD coastal protection structures have, until recently, not been scientifically investigated to determine their efficacy and performance, despite their past and growing implementation along the north-western coasts. Recently, some existing anchored LWD projects have been documented and reviewed in non-peer-reviewed literature [4,27]. A need for systematic assessment of projects and further development of science-based design guidance was identified [1,4], and, as a consequence, local guidelines were published to advise property owners, engineers, and policymakers on how to best implement LWD structures among other nature-based solutions [16,28].
For example, [16] recommended placing anchored LWD on the beach berm to reduce wave energy and erosion and actively encourages the removal of bulkheads and the replacement with LWD as one possible alternative. Despite actively recommending LWD placement, Ref. [16] also concluded that knowledge about interaction processes around LWD structures is still limited, and further research is needed to better understand their performance. Generally, existing guidelines on nature-based solutions, including LWD usage, have often been published as “grey” literature with remaining uncertainty on whether the information has been peer-reviewed on a scientific base [29].
Recently, the first systematic investigation on the performance and design of anchored LWD under wave action was undertaken [17] with the aim to address this knowledge gap by fieldwork and experimental modeling. In the first stage of the project, a field investigation of 15 project sites with existing LWD placements in Washington State and British Columbia included the measurement of the beach slope and surficial sediment sizes, as well as the determination of LWD elevation, log dimension, type of installation, and anchoring mechanism [17]. Observations were also made for the durability aspects of the LWD structures. The study found that there were six primary installation methods, including single shore parallel, multiple (two or three) shore parallel, benched, stacked, matrix-style, and groyne-style. Installations varied significantly in position and elevation on the beach face. Installations were also observed to have significant performance and durability issues, leaving questions as to their design and efficacy as coastal protection in comparison to more conventional structures.
Based on their dimensions, structure configurations, and site conditions determined in the field study, Ref. [17] conducted 2D physical modeling of LWD structures on a 1:5 scale to determine their effect on morphological changes and wave run-up in comparison to a plain beach with no structures. Five different structure configurations (Single, Double, Triple, Benched, Matrix) were tested with a 1:8 (V:H) sloping gravel beach with a mean grain diameter of D50 = 7.9 mm under various irregular and regular wave conditions. In [17], it was found that LWD placement elevation in relation to the still water level (SWL) was the predominant factor for morphological changes of the beach, with structures built below the SWL showing the largest effect on beach stabilization. They also found a small increase in wave run-up from the anchored LWD in comparison to a plain beach without structures. The authors also found that LWD structures with a higher number of installed logs (i.e., triple configuration) resulted in higher wave run-up than LWD structures with fewer logs (i.e., single configuration). The results of these studies, and specifically the beach morphology tests, provide new information for understanding the performance and design of anchored LWD. Despite this, the studies did not provide direct information or conclusions related to the suitability of anchored LWD as an alternative to more traditional coastal protection structures, such as seawalls.
In contrast to anchored LWD, seawalls have been studied extensively over past decades [3,30], with some contradictious results, however. Seawalls are shore-parallel structures built to protect the landward side from flooding, wave impact, and beach erosion [3]. Seawalls are usually considered to be vertical structures built below the high tide line, while bulkheads are built landward of the high water mark. This work uses the term seawall to encompass both variations in design. Due to their rigid structure, their ability to adjust to natural shoreline changes is limited, and their interaction with the beach and incident waves can be in conflict with other coastal processes. For example, reflection from seawalls can adversely influence the wave climate for ship navigation or sedimentation processes [31,32]. Wave reflection from seawalls has been addressed in several studies [31,33,34], but often not as the main research purpose. Existing research has mainly been performed to investigate their effect on beach profile changes [33,34,35,36], toe scouring [37,38,39], sediment transport [36], or swash dynamics [40], among others. Two papers, [3] and [30], have presented extensive reviews of seawall-related works to which readers are referred. Despite a large number of studies on seawalls’ influence on beach morphology, results are still inconclusive as to which effects are directly caused by the walls themselves [41,42]. This is particularly obvious with respect to their contribution to shoreline erosion. Active erosion generated by the seawall and passive erosion (erosion processes already present before the implementation of the wall) have often not clearly been separated [3,43], thus leading to confusion and controversy in the ongoing discussion about possible (negative) effects of seawalls [42,43]. From their review [3], however, concluded that seawall-backed beaches and natural beaches have not shown significant differences in their overall profile shape under storm conditions. Beach profiles in front of seawalls were generally moved seawards but still retained the same volume of material as natural beaches. Research on the beach morphology changes of seawall-backed beaches has predominantly focussed on sandy beaches, while research remained surprisingly scarce for gravel beaches as those typically present along the north-western coasts of Canada and the US.
For gravel beaches, only a few studies have specifically addressed their morphological response under the influence of seawalls. In 1994, Powell and Lowe, see [44], conducted 2D experiments of different seawall positions and water depths on a 1:17 sloping gravel beach (D50 = 12 mm). These authors found beach accretion in front of the structure for a wall close to SWL under swell waves, but toe scouring for a wall located significantly further seawards. Their results showed a strong dependency of the beach profile changes on the relative position of the wall and the wave steepness, as well as both the possible existence of erosion or accretion in front of the wall [44]. Recently, [45] studied the effect of beach permeability as well as the effect of a seawall on a 1:8 gravel beach with 2D experimental testing. Their results showed accretion of sediment in front of the wall. In comparison to a natural beach, the beach profile was moved seawards with the wall positioned closer to the SWL, but maintained an identical shape. Authors of [46] conducted small-scale experiments, including seawalls on a gravel beach, finding both accretion and erosion in front of the wall, depending on the incoming wave steepness. In accordance with the results of Powell and Lowe, they identified the relative water depth and surf similarity parameter to predominantly influence the morphological response of the beach in front of the wall.
Motivated by the need to better understand the efficacy of anchored LWD as coastal protection, this study aims to compare the effects of anchored LWD in comparison to conventional seawalls for the case of a gravel beach. This study analyses changes in beach morphology and the effect of each structure on beach reflectivity by using large-scale physical wave modeling and Structure from Motion (SfM) photogrammetry. It specifically aims to provide information related to the following research questions: (1) How do model effects in the wave flume affect the beach morphology measurement? (2) What are the benefits of LWD in stabilizing a gravel beach as compared to a vertical seawall? Additionally, (3) can the placement of LWD favorably influence the reflectivity of the beach in comparison to a vertical seawall?

2. Materials and Methods

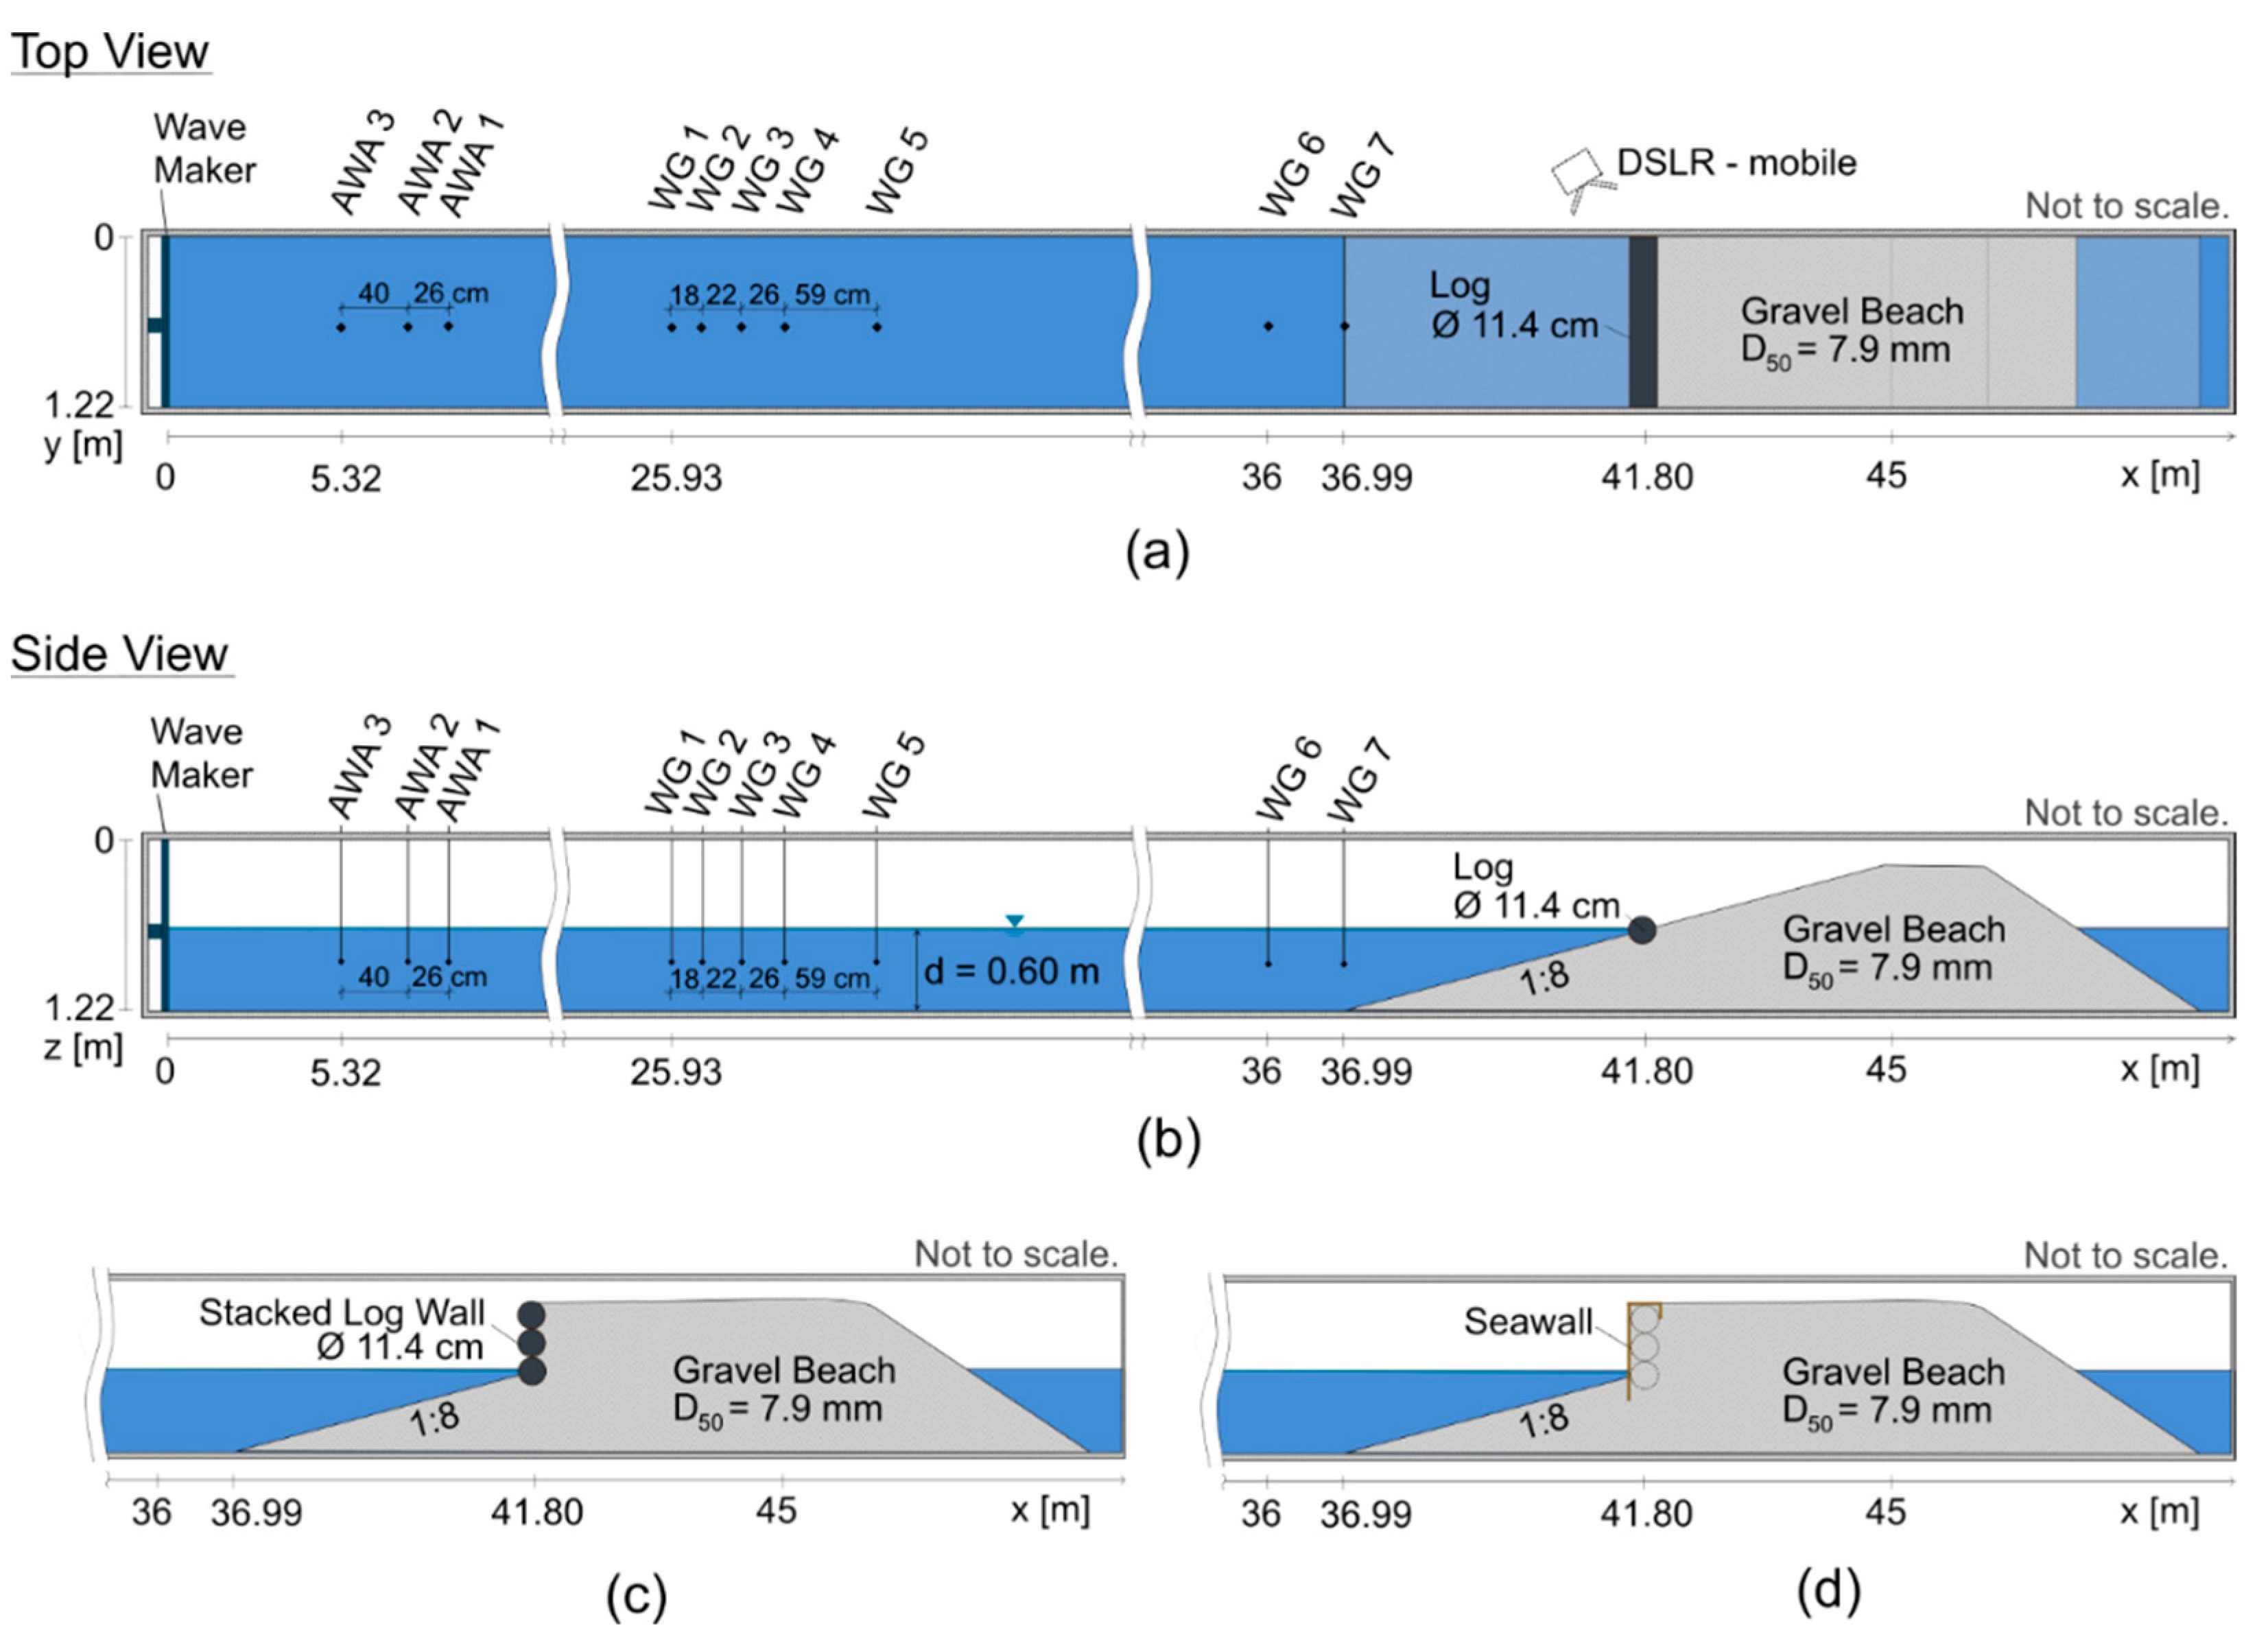
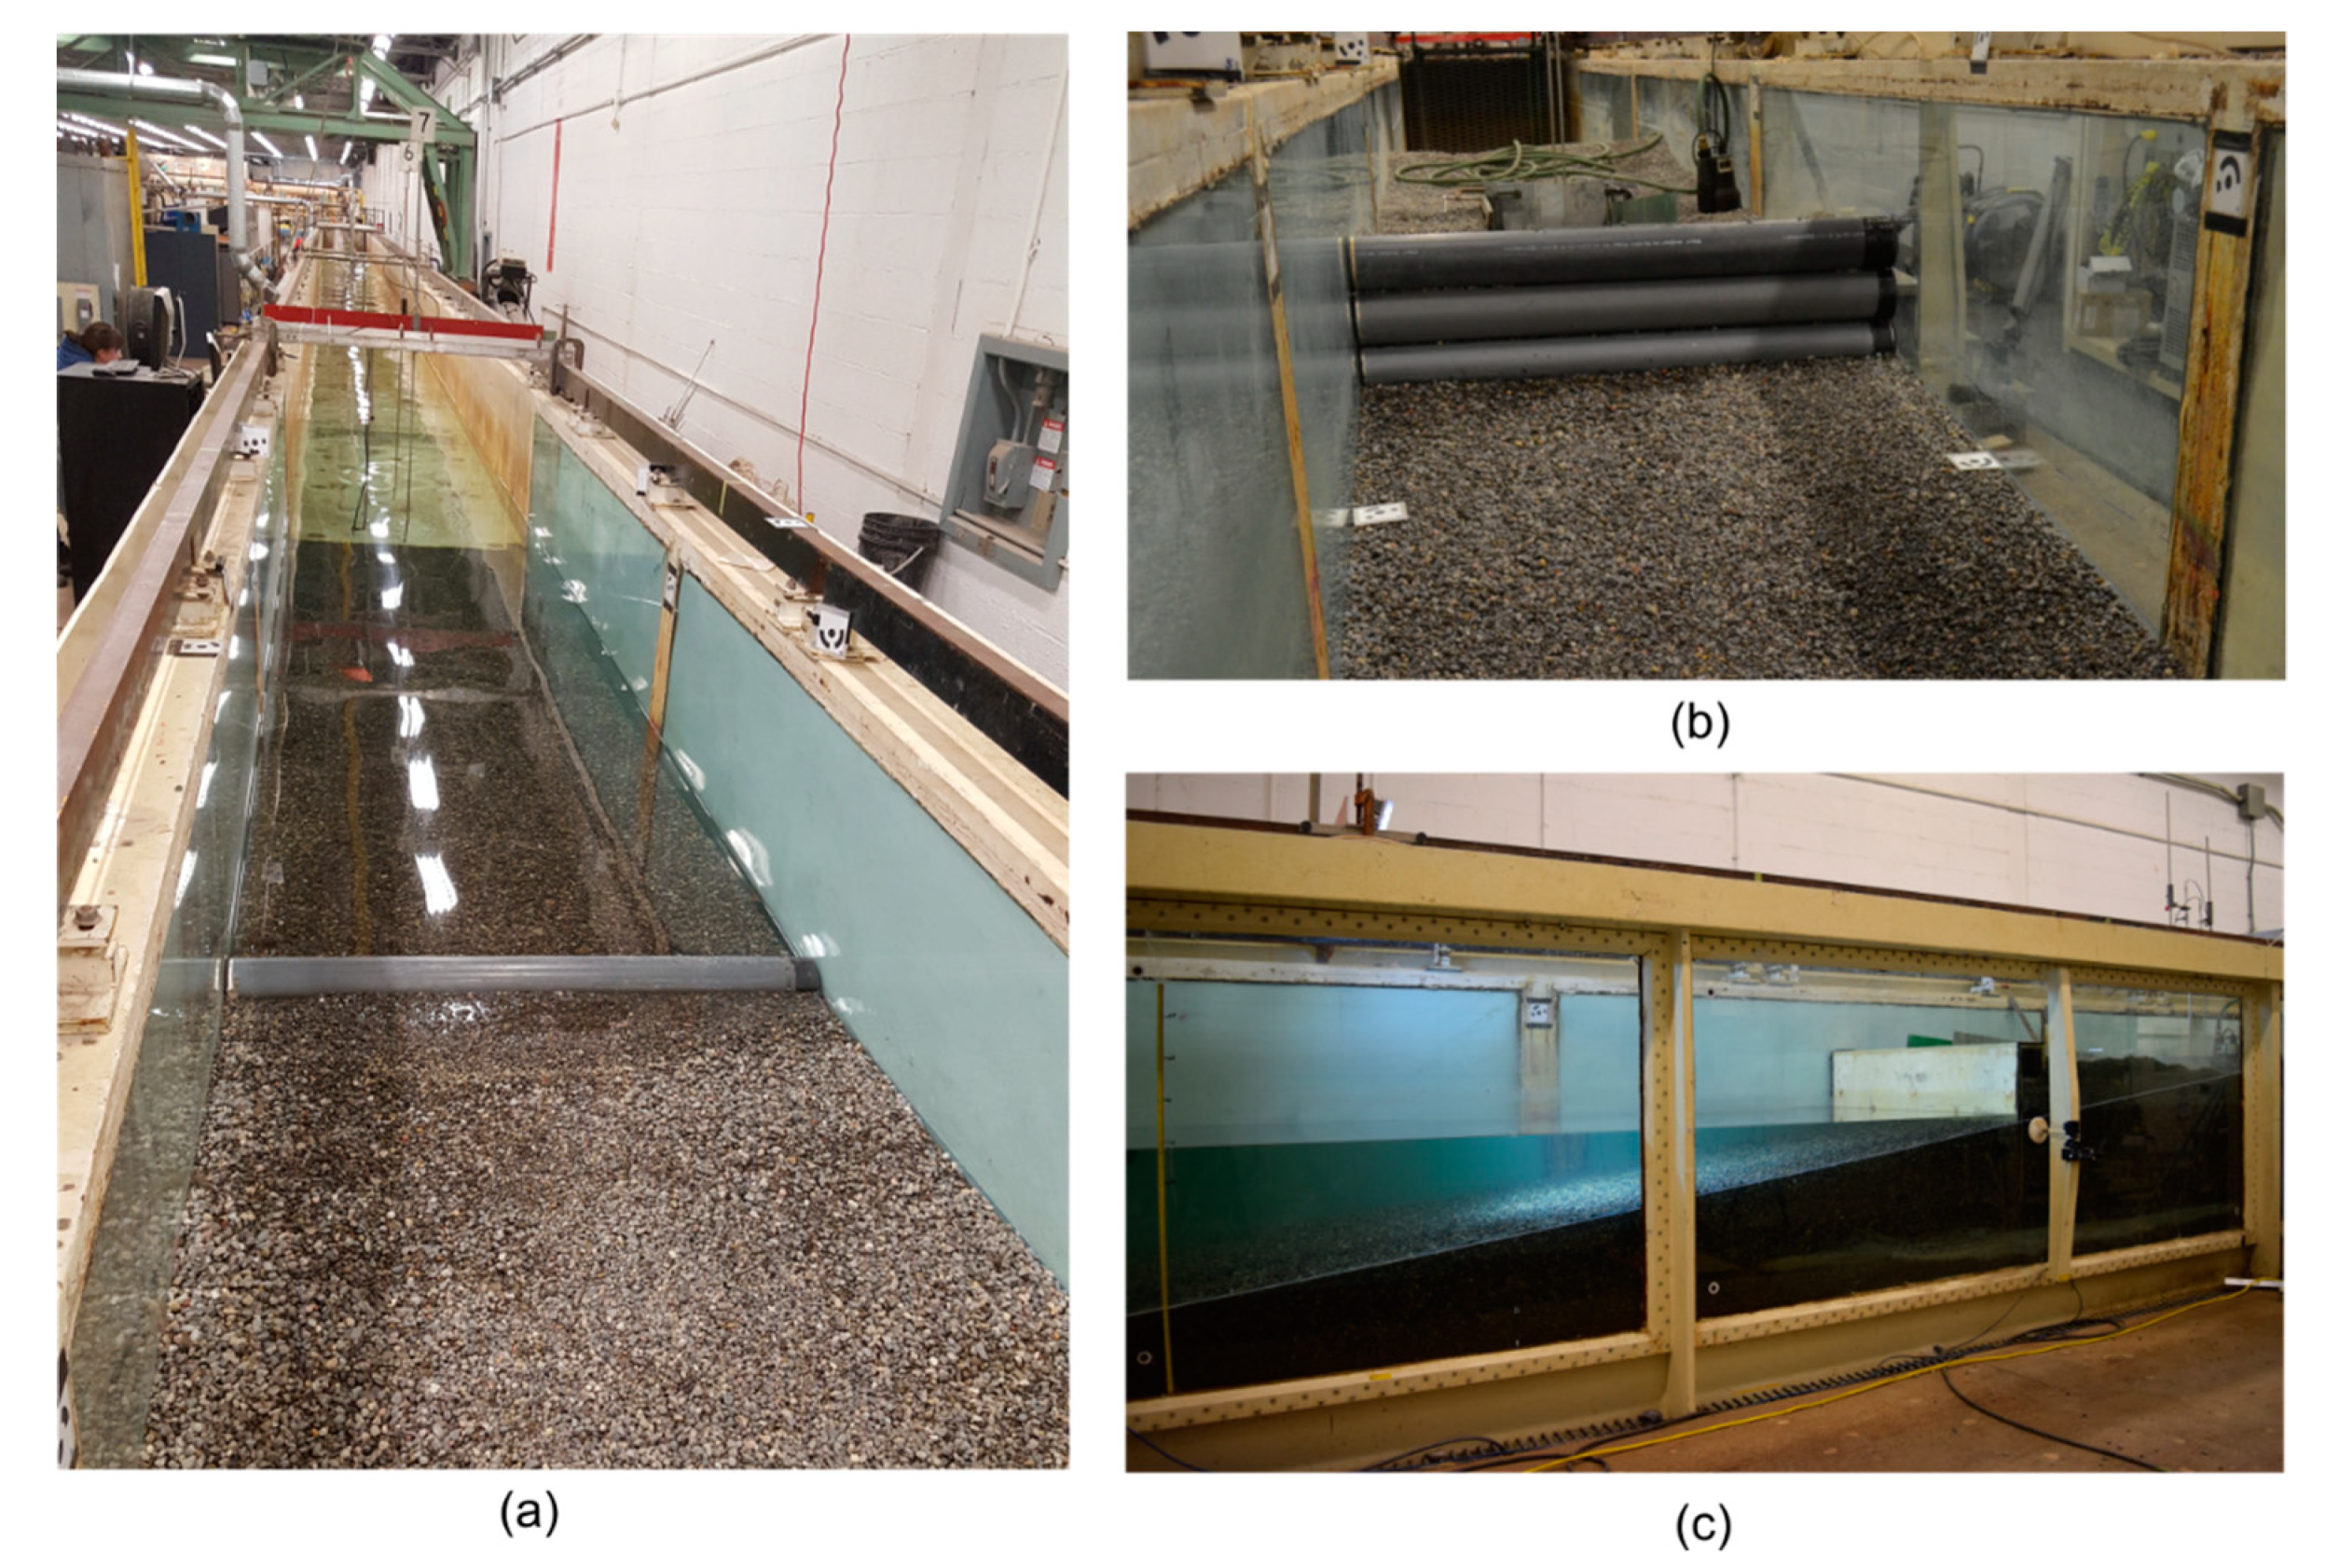
2.1. Experimental Setup

A 1:5 scale physical model was constructed in a 2D wave flume of the Ocean, Coastal, and River Engineering Research Centre at the National Research Council (NRC) in Ottawa, Canada. The wave flume has a length of 63 m, and a cross-sectional area of 1.22 × 1.22 m. The flume is equipped with a piston-type wavemaker with active wave absorption. The active wave absorption uses real-time data from an array of wave gauges located close to the wavemaker to adjust the movement of the wave paddle such that re-reflection of the incident wave in the flume is avoided. For the present study, random waves with significant wave heights of up to Hs = 0.20 m and peak periods of up to Tp = 2.51 s were generated. Parts of the flume walls were equipped with glass sections and, as such, interactions between the waves and the structure and beach could therefore be visually observed during test runs. A permeable model beach with a continuous 1:8 (V:H) slope was installed in the flume using rounded gravel with a D50 = 7.9 mm. The scaling of the test setup and the bed material was based on Froude similitude. Readers are referred to [17] for additional details on the experimental setup.
A total of 10 capacitance-wire wave gauges (WG, Akamina AWP-24-2, 0.15% accuracy, Ottawa ON, Canada) were mounted in the flume. This included the three wave gauges AWA 1–3 for the active wave absorption located at x = 5.3 m away from the wave maker, an array of five wave gauges WG 1–5 for the wave reflection analysis, starting at x = 25.9 m, and two wave gauges WG 6 at x = 36.0 m and WG 7 at the beach toe (x = 36.99 m) for measuring wave conditions at the structure toe. Wave data were collected with a sampling frequency of 50 Hz. Using a mobile digital single-lens reflex camera (DSLR, Nikon D5100, 9MP, FL 18 mm, Melville NY, USA), sets of images of the beach slope were taken before and after each test run for the application of Structure from Motion (SfM) photogrammetry. The applied SfM method is further outlined in Section 2.3.
As shown in Figure 1, three different beach structure types were considered: a single log (Single), a stacked log wall (Stacked), and a vertical seawall (Seawall) were installed at the intersection of the beach slope with the still water level d = 0.60 m. The model logs were constructed using a PVC pipe, which had metal caps at both ends, with one of them expandable. Each pipe had an outer diameter of dlog = 0.114 m (0.57 m in prototype conditions). The model log(s) were positioned in the flume and rigidly fixed against the sidewalls by applying lateral pressure to avoid their displacement during test runs.
The vertical seawall had the same freeboard as the three stacked logs (0.285 m) and was constructed with plywood. For the tests on the stacked log wall and the vertical seawall, the space behind the logs structure was backfilled with the gravel material. Figure 1 shows the base setup (Single) including all instrumentation in top (a) and side view (b) as well as the setup for the Stacked (c) and the Seawall (d) cases. Figure 2 includes some pictures taken from the experimental setup in the flume.

2.2. Test Program and Procedures

The gravel beach without structures (No Structures), and each beach structure type, were tested under three random wave conditions. The smallest waves tested had a target significant wave height of Hs = 0.10 m and a peak period of Tp = 1.78 s. Medium and large wave conditions were tested with Hs = 0.15 m, Tp = 2.17 s, and Hs = 0.20 m, Tp = 2.51 s, respectively. Random waves were generated using a JONSWAP spectrum with a peak-enhancement factor of γ = 3.3. Each test was run until beach equilibrium was successfully reached. According to a novel procedure proposed by [17], this was defined as the point in time where the relative change in beach volume was below 0.001 for 30 consecutive min. The resulting number of waves to reach equilibrium conditions was between approximately 5000 and 7000, depending on the tested wave conditions. The position of the structure, the water depth, the structure geometry, and the initial beach profile were kept constant for each test. Table 1 lists the test programme with all relevant parameters.
Before each test run, the gravel beach was manually reshaped to ensure the 1:8 slope. A first set of photos was taken to capture the initial condition of the beach surface before starting the test. The flume was filled with water and the calibration of each wave gauge was checked to have an accuracy of at least ±0.5% of the calibration range. The data collection system and cameras were started and the test was initiated. After the beach had reached its equilibrium profile, the flume was drained and a second set of photos was taken from the reshaped beach surface.

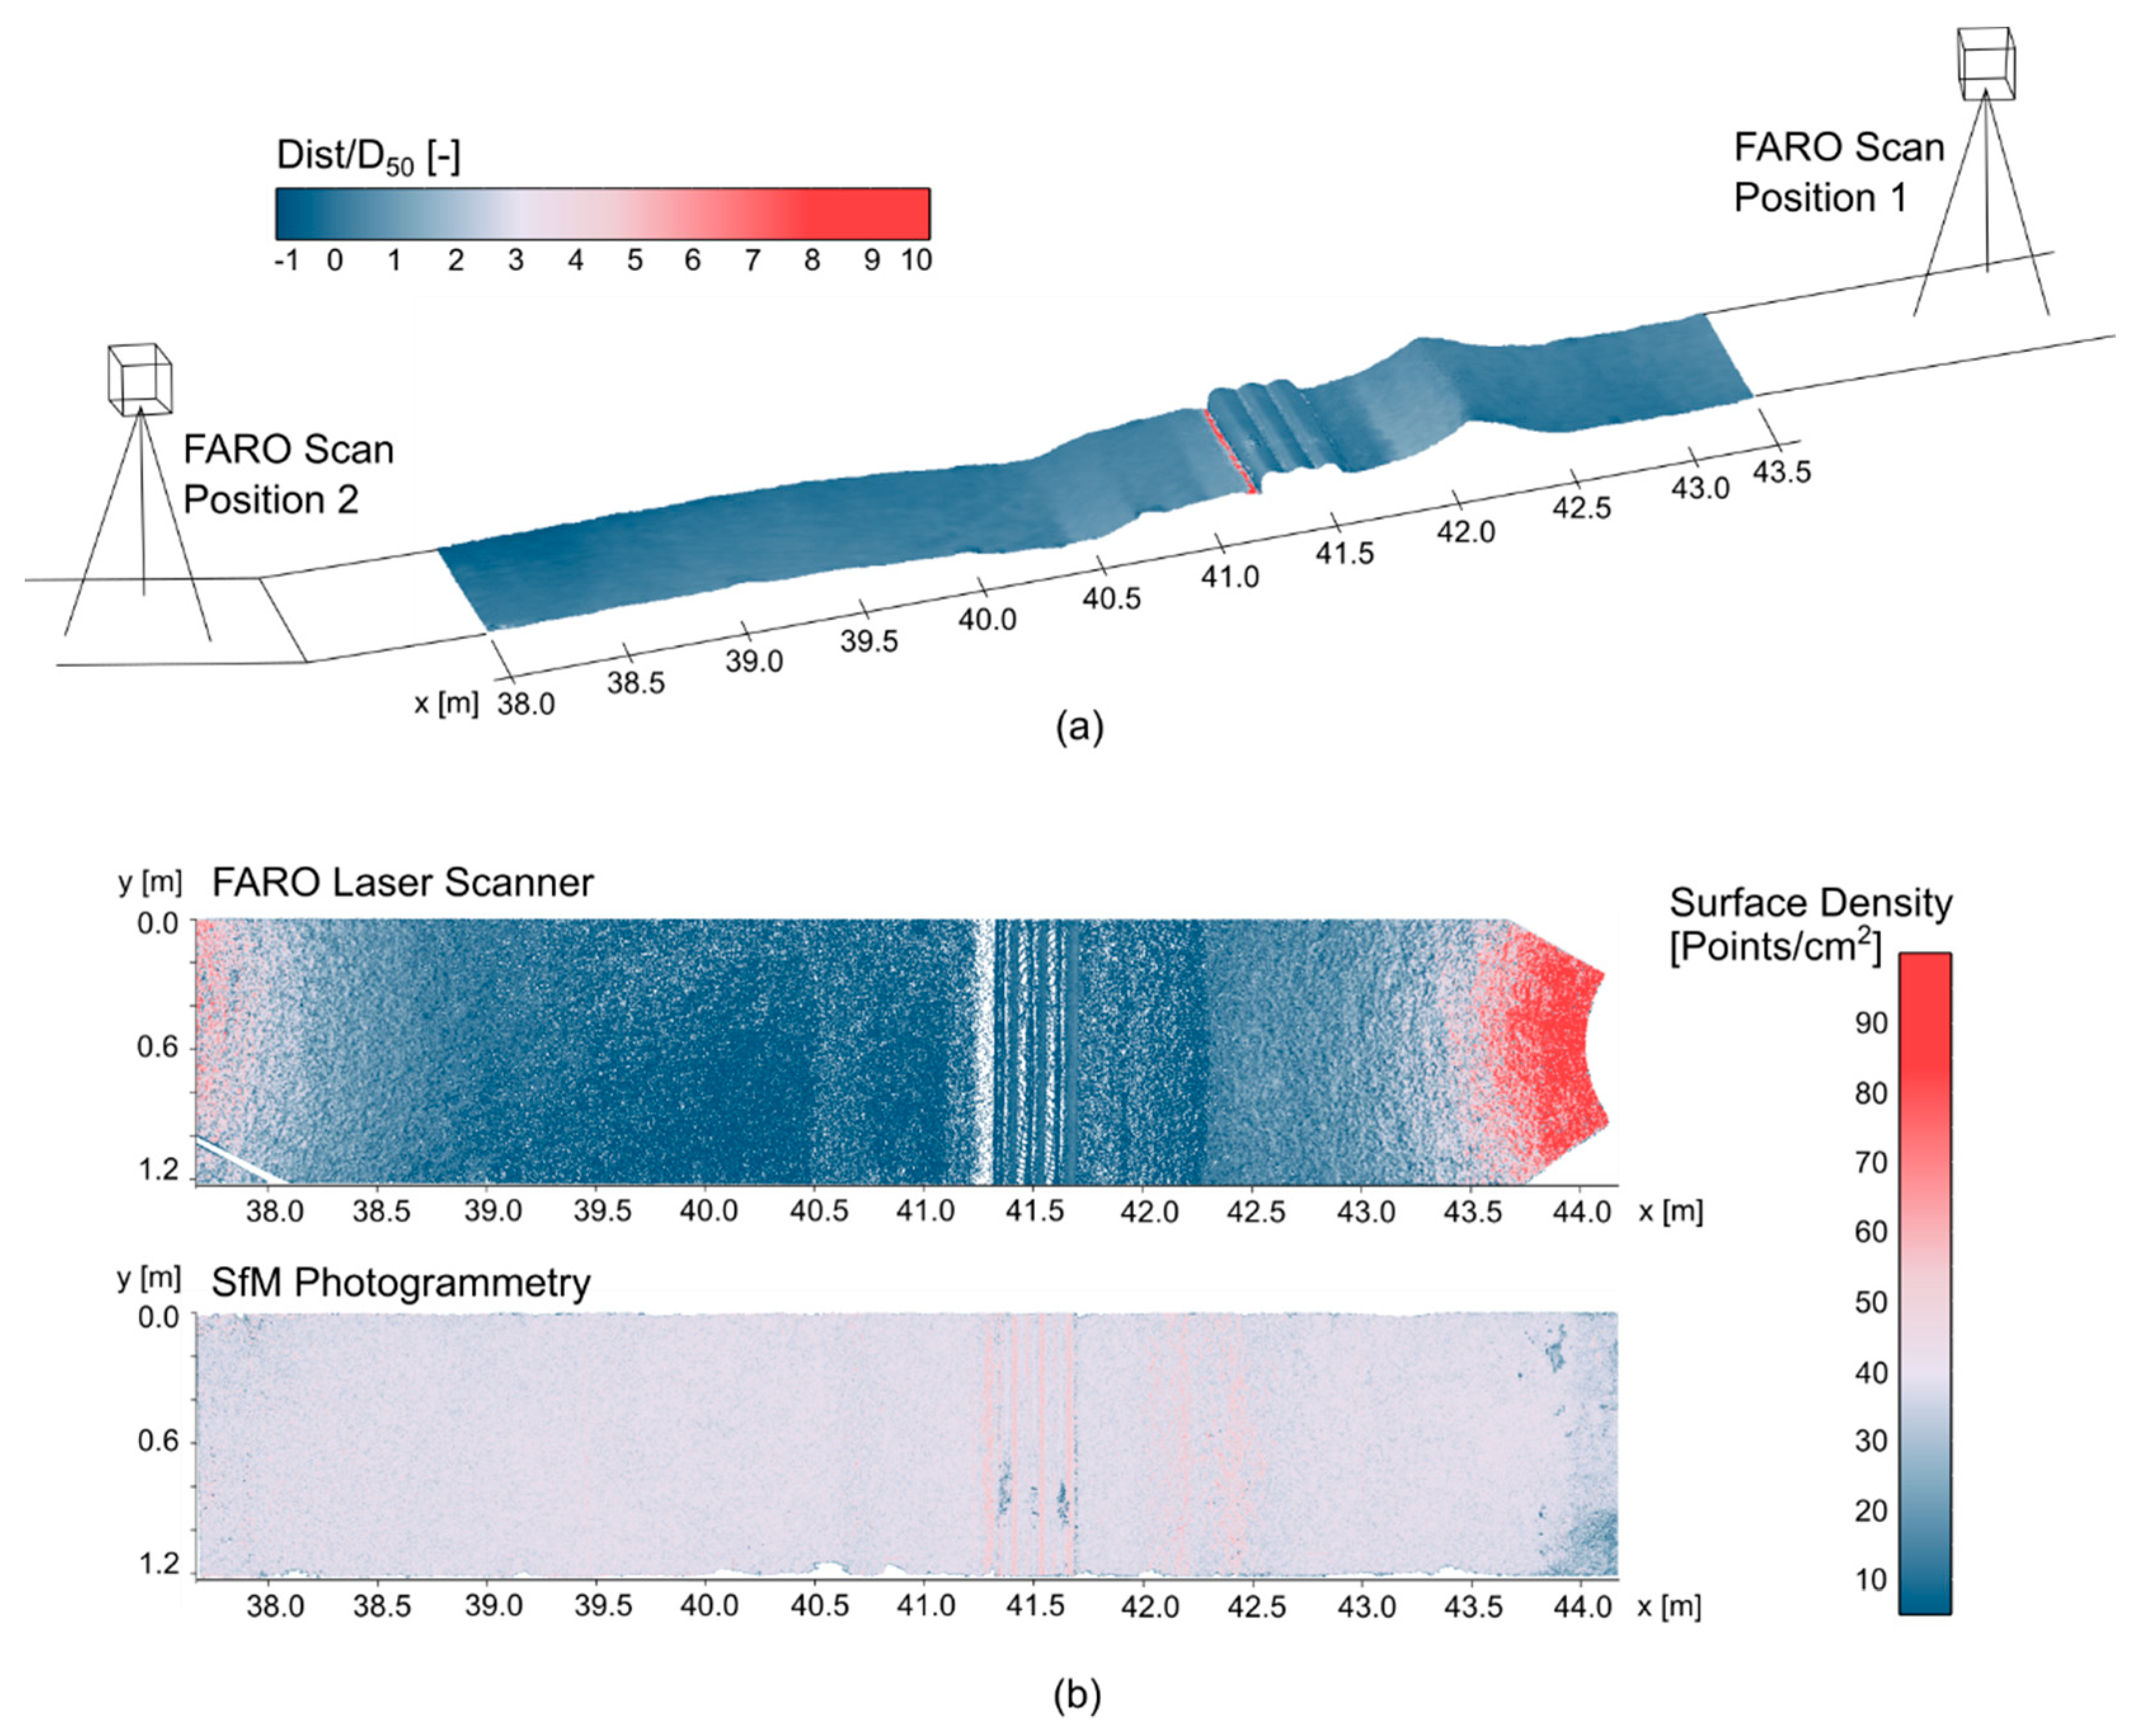
2.3. Beach Morphology Measurement

Structure from Motion (SfM) photogrammetry was used as the principal technique for measuring beach morphology changes. This method has recently gained more attention in coastal physical modeling as a suitable, low-cost alternative to terrestrial laser scanning with similar data accuracy [47]. SfM photogrammetry uses image-processing algorithms to detect similar features in a set of pictures and reconstruct the photographed object based on those detected features. Reference points in the photos allow later scaling of the digital model. A large number of pictures taken from different angles and with significant overlap is necessary for this method.
In preparation for the application of SfM photogrammetry, 12 black-and-white circular targets were attached to the upper part of the flume in the vicinity of the gravel beach. The 12-bit coded targets can be automatically detected by the SfM software Agisoft Metashape Professional (Version 1.5.5, Agisoft LLC, St. Petersburg, Russia), which facilitates the post-processing of large amounts of test sets. A total station (Hilti, P180, accuracy +/− 2 mm + ppm, Schaan, Liechtenstein) was used to measure the location of the targets before starting the test series. The measuring accuracy of the obtained coordinates was approximately 4 mm. The target locations acting as reference locations were not changed throughout the test series. In addition to the fixed targets, mobile targets were added to the beach surface before taking pictures to facilitate the automatic recognition process of the gravel surface. For each test, a set of pictures was taken before (pre-test) and after the test run (post-test), after the flume was drained.
To ascertain the quality of the photogrammetry results, a laser scanner (FARO Focus 3D S120, range error: +/− 2 mm, Lake Mary, FL, USA) was used for selected tests. For these tests, the laser scanner was set up at the beach crest, and at the beach toe, scanning the beach from the top and bottom. The resulting two point clouds were merged prior to calculating point densities and point cloud distances.

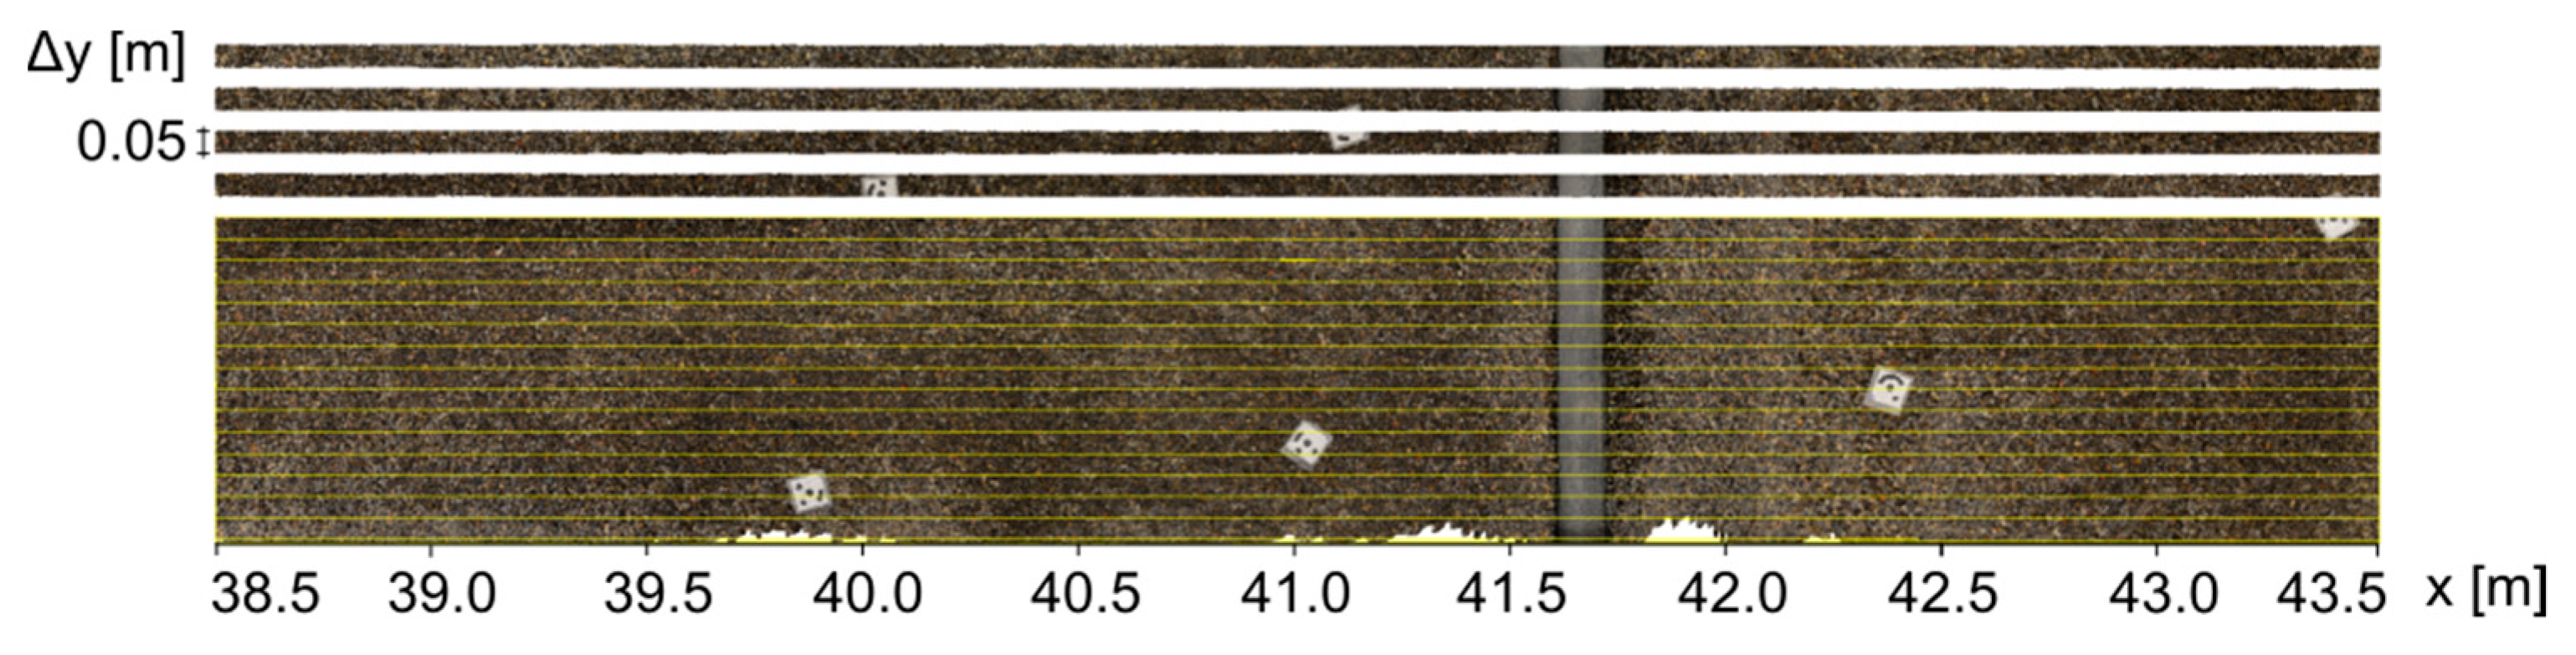
2.4. Post-Processing of Morphology Data

Each set of photos was imported into Agisoft Metashape Professional for digital reconstruction of the beach surface. This process included automatic image alignment based on significant feature points, creation of a dense point cloud, and automatic identification of targets. The target coordinates were imported and the point cloud automatically scaled and referenced accordingly. Detected targets deviating more than 5 mm from their measured position were removed, and the point cloud re-referenced until the total accuracy was within 5 mm.
Further post-processing of the obtained point clouds from SfM and laser scanning was completed using CloudCompare (Version 2.10.2), allowing for the comparison of results obtained from the two techniques. The comparison of the two measurement techniques based on example test results (Figure 3a) showed vertical differences (Dist) smaller than the average grain size diameter (D50) for the most of the beach surface (Dist/D50 < 1). Larger differences of 5–10 D50 were obtained in the vicinity of the logs where scouring had occurred. Here, due to shadowing effects, the laser scanner was not able to capture the deeper section in front of the logs as accurately as the mobile camera could, and hence, differences were significantly higher.
In addition, the point cloud surface density from the laser scan has concentrated information on the beach toe and crest (red areas), but not in the vicinity of the structure, which was the most important source of information for this study. In contrast, the photogrammetry technique provided a more homogenous surface with uniform surface density across the entire beach surface (Figure 3b). For this type of experimental setup, SfM photogrammetry proved to be the more suitable technique to measure the beach morphology. Hence, all post-processing and analysis of this study were based on the SfM data.
In relation to the measurement of the beach morphology, additional emphasis was put on assessing model effects in the flume. In most previous flume studies on gravel beach morphology, model effects have not been addressed [45,48], or have only been mentioned with limited or no quantification of such [46,49,50]. In contrast to the often-used linear profiling of beach surfaces, the use of SfM photogrammetry in this study provided 3D data from 2D experiments. The digital reconstruction of the entire modeled beach surface, therefore, allowed a more detailed assessment of irregularities across the flume width resulting from the model setup and the influence of the flume sidewalls.
For the assessment of the model effects, each pre-point cloud was compared to an ideal 1:8 sloping plane with the M3C2 point cloud distance function in CloudCompare [51]. The root-mean-square (RMS) error of those distances was calculated to determine the basic accuracy and homogeneity of the initial beach surface. The subsection of the beach experiencing the main wave action, x = 38.5–41.58 m (structure front), was used for this analysis.
The potential influence of the flume walls is also an important aspect when assessing morphological development using 2D experimental studies. The influence of the flume walls was investigated by dividing the surveyed beach surface into longitudinal segments 0.05 m wide and comparing the volumetric changes between the segments over the width of the flume according to Figure 4.
For each 0.05 m segment, the volume change of beach sediment was calculated by numerical integration of all height differences with 1 mm increments. Eroded areas were identified by the negative height differences while areas of sediment accretion by their positive height differences. The contribution of each longitudinal beach transect to the total volumetric change relative to a uniform volumetric distribution was then determined for each test. For the Single and None configurations, volumetric changes were calculated in a flume section between x = 38.5 and 43.5 m to capture erosion in front and accretion behind the structure. For the two wall structures (Stacked, Seawall), volumetric changes were only calculated up to the structure front, since erosion and accretion of sediment only occurred in front of the structure. The backfilled part of the two walls was hence not included in the analysis.
For each structure configuration, the equilibrium beach profile shape and volume distribution of sediment in comparison to the No Structures configuration were then analyzed by post-processing of the obtained point clouds under consideration of the determined model effects from the flume sidewalls. Using the same numerical integration of the pre- and post-simulation surfaces in CloudCompare, a final eroded and accreted volume was calculated for each tested configuration. Based on the assessment of model effects (see Section 3.1.2), data within 1% of the flume width from the back wall, and 10% of the flume width from the front wall were removed before calculating the volumes. For each wave condition, the relative changes in the profile response could then be compared between the tested structures.

2.5. Measurement and Analysis of Wave Reflection

An array of five wave gauges with increasing relative distances was used to measure the time-history of the water surface elevations during each test run. The collected wave gauge data was post-processed using an NRC in-house software based on the least-squares reflection analysis method developed by [52]. Their analysis method follows the general assumption that the water surface elevation is the result of the superposition of different linear wave components. The post-processing procedure included: (1) the selection of the three best-suited wave probes according to spacing criteria [52], (2) decomposition of the signal into incident and reflected wave spectrum, and (3) computation of inverse Fast Fourier Transform (FFT) to obtain incident and reflected wave train. The reflection coefficient was then calculated as the ratio of the standard deviation of the reflected wave train and the standard deviation of the incident wave train. To reduce possible error from the separation of low energy components, a high-pass filter of 0.5 fp (peak frequency) and a low-pass filter of 1.8 fp were applied to the wave spectra prior to computing the separated wave trains. This method allowed for long swell waves due to laboratory effects to be excluded from the analysis.

3. Results

3.1. Assessment of Model Effects

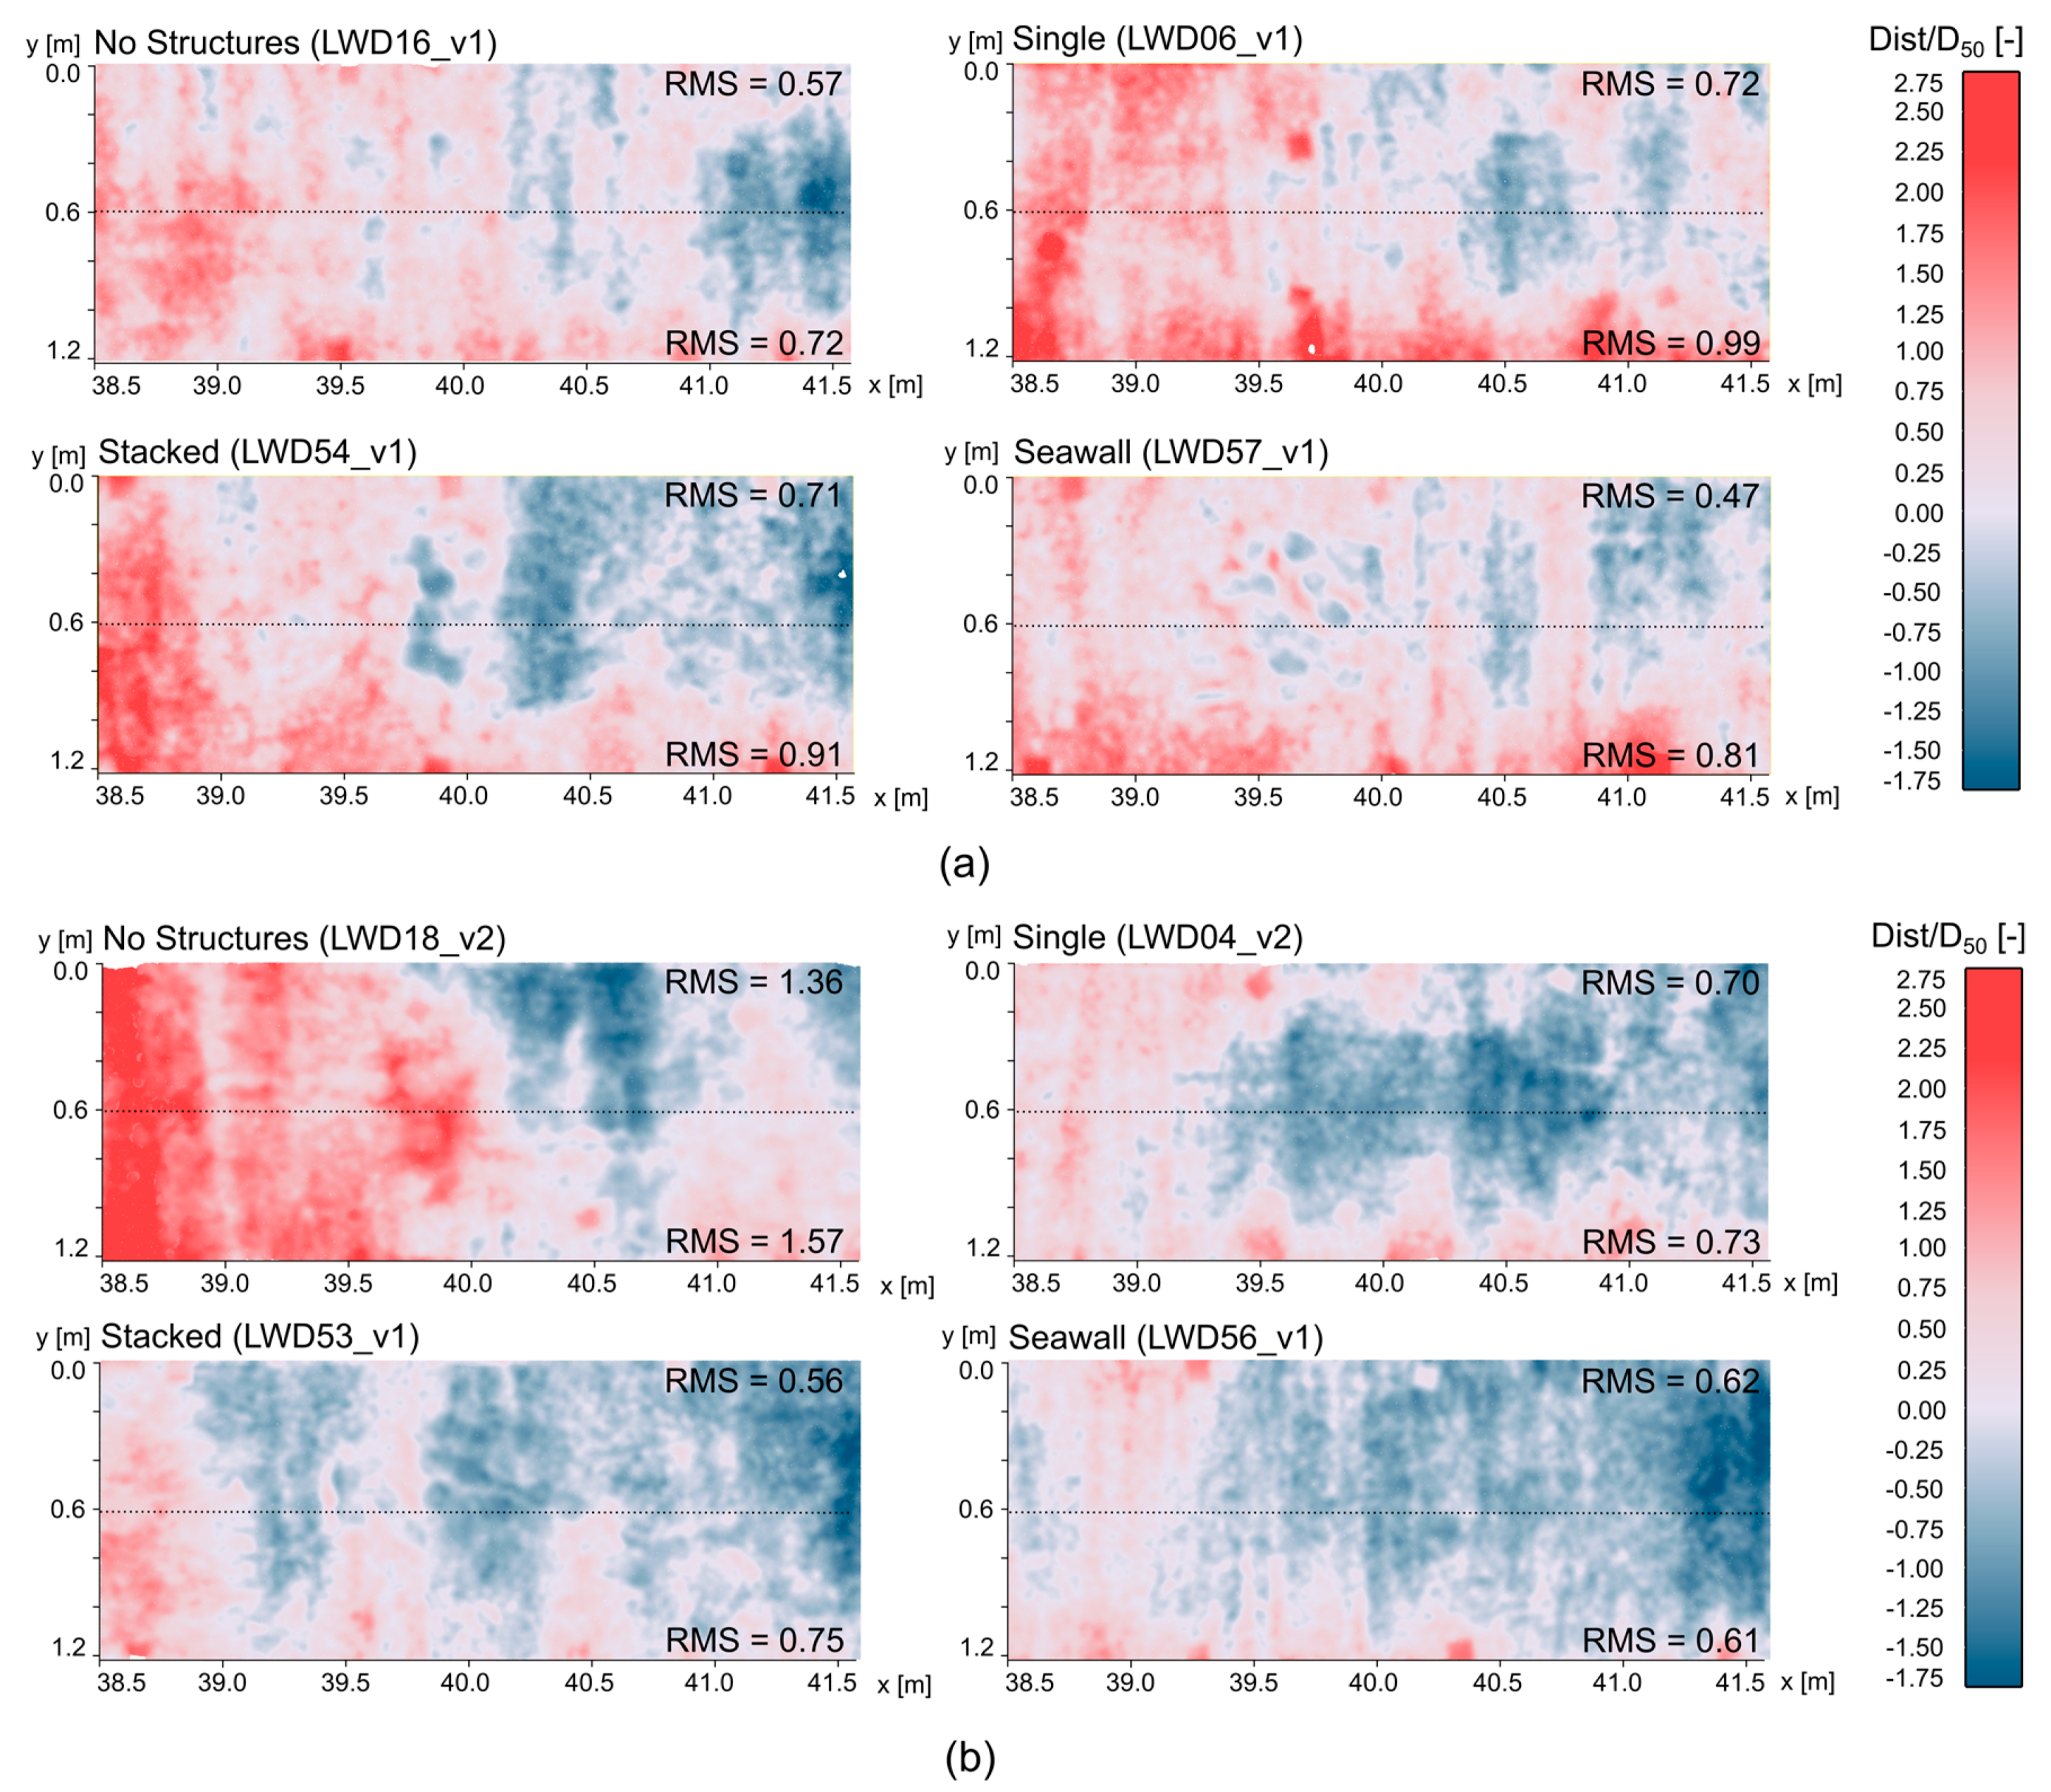
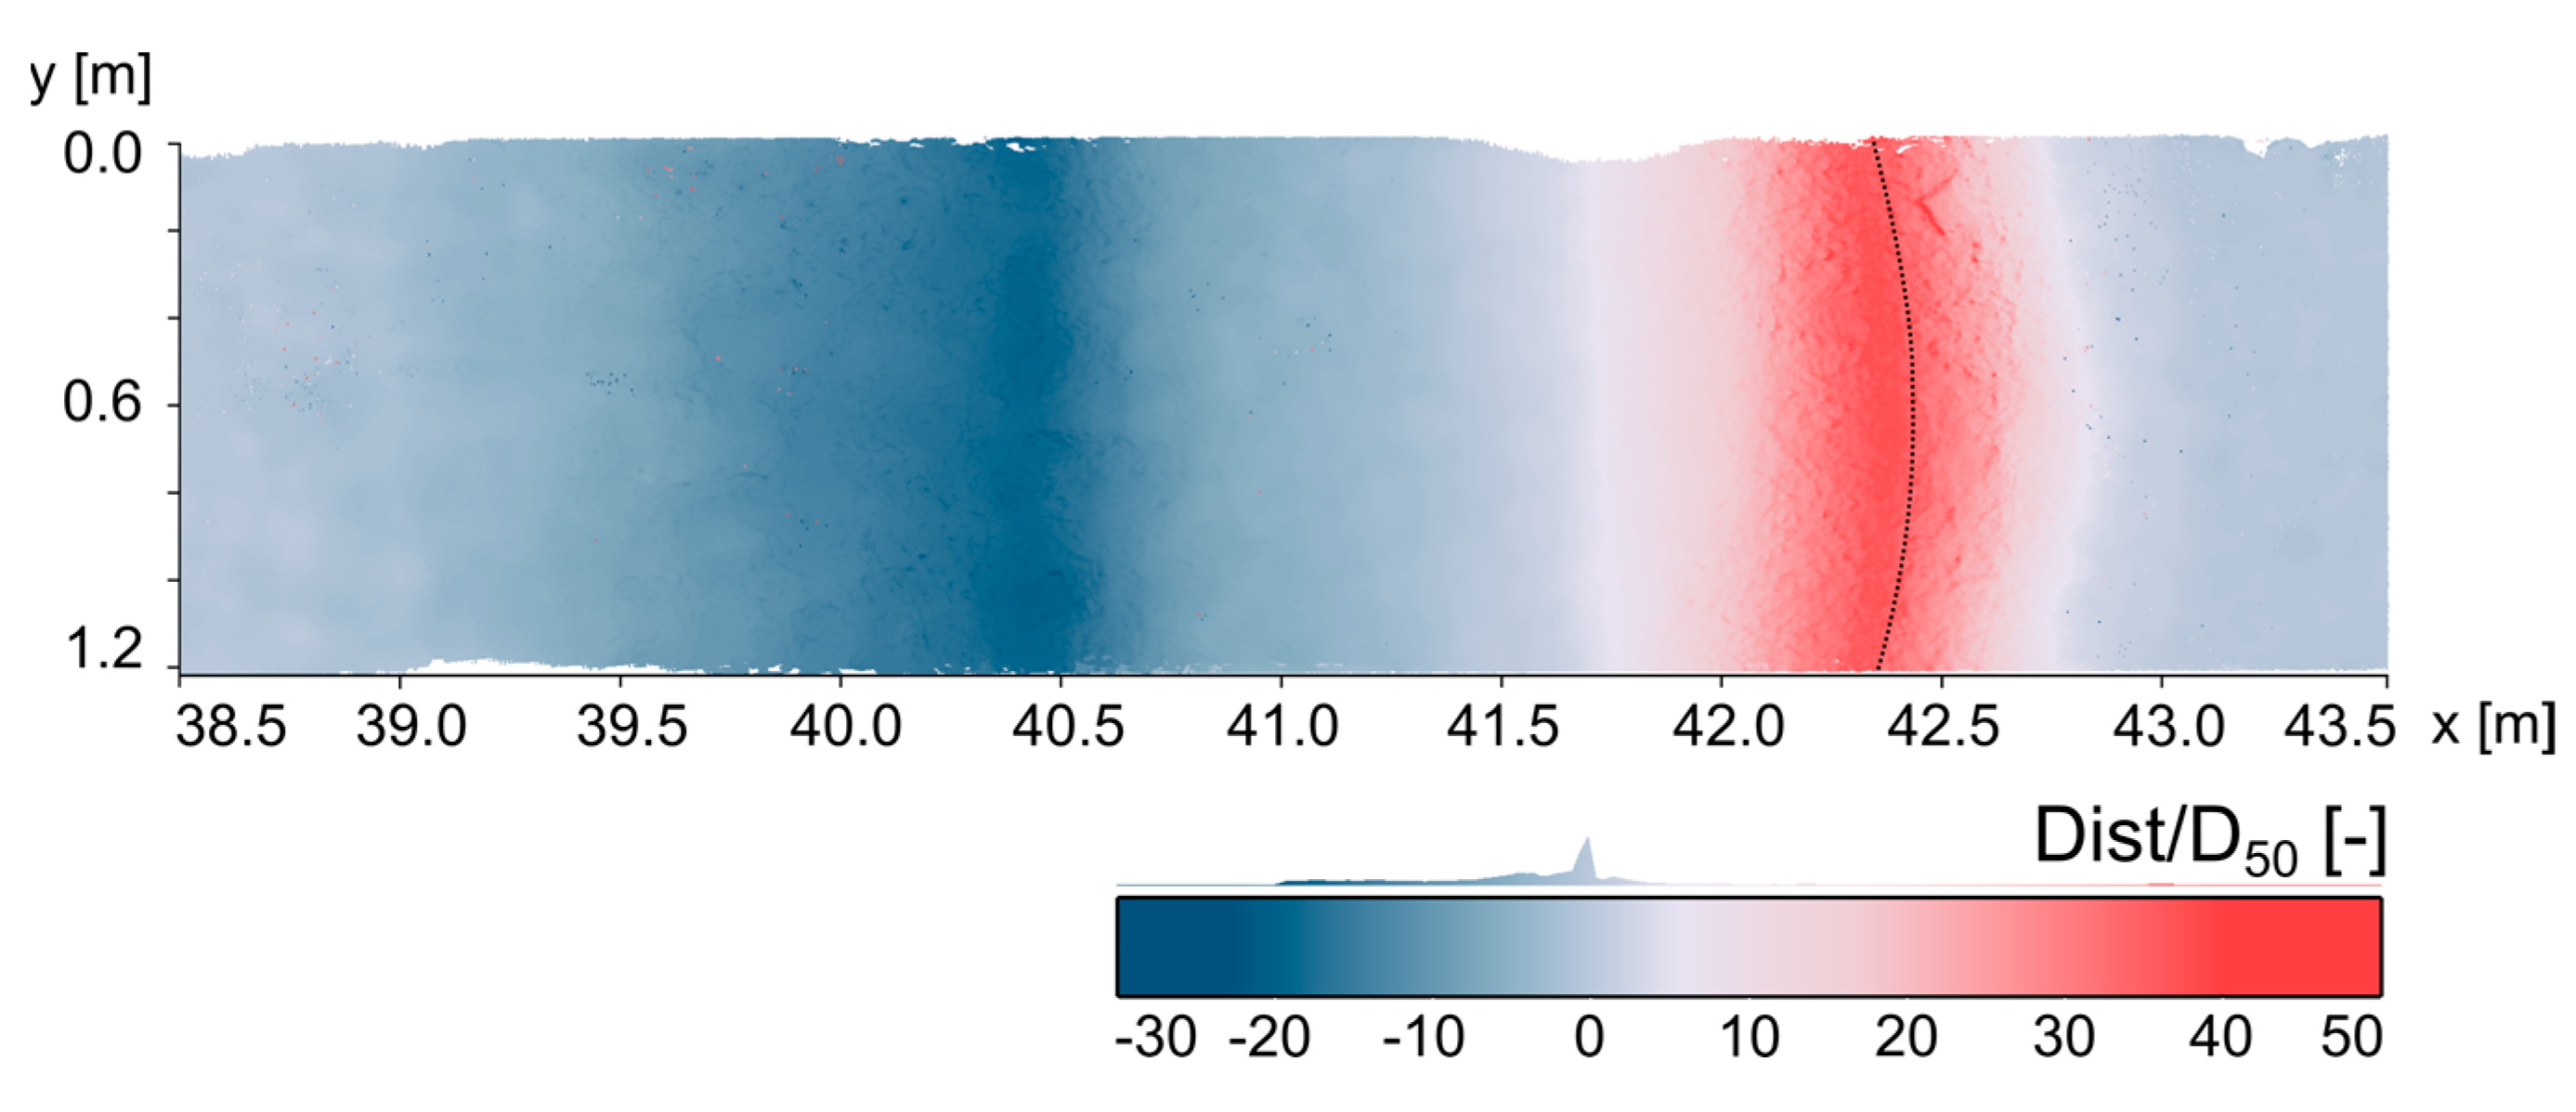
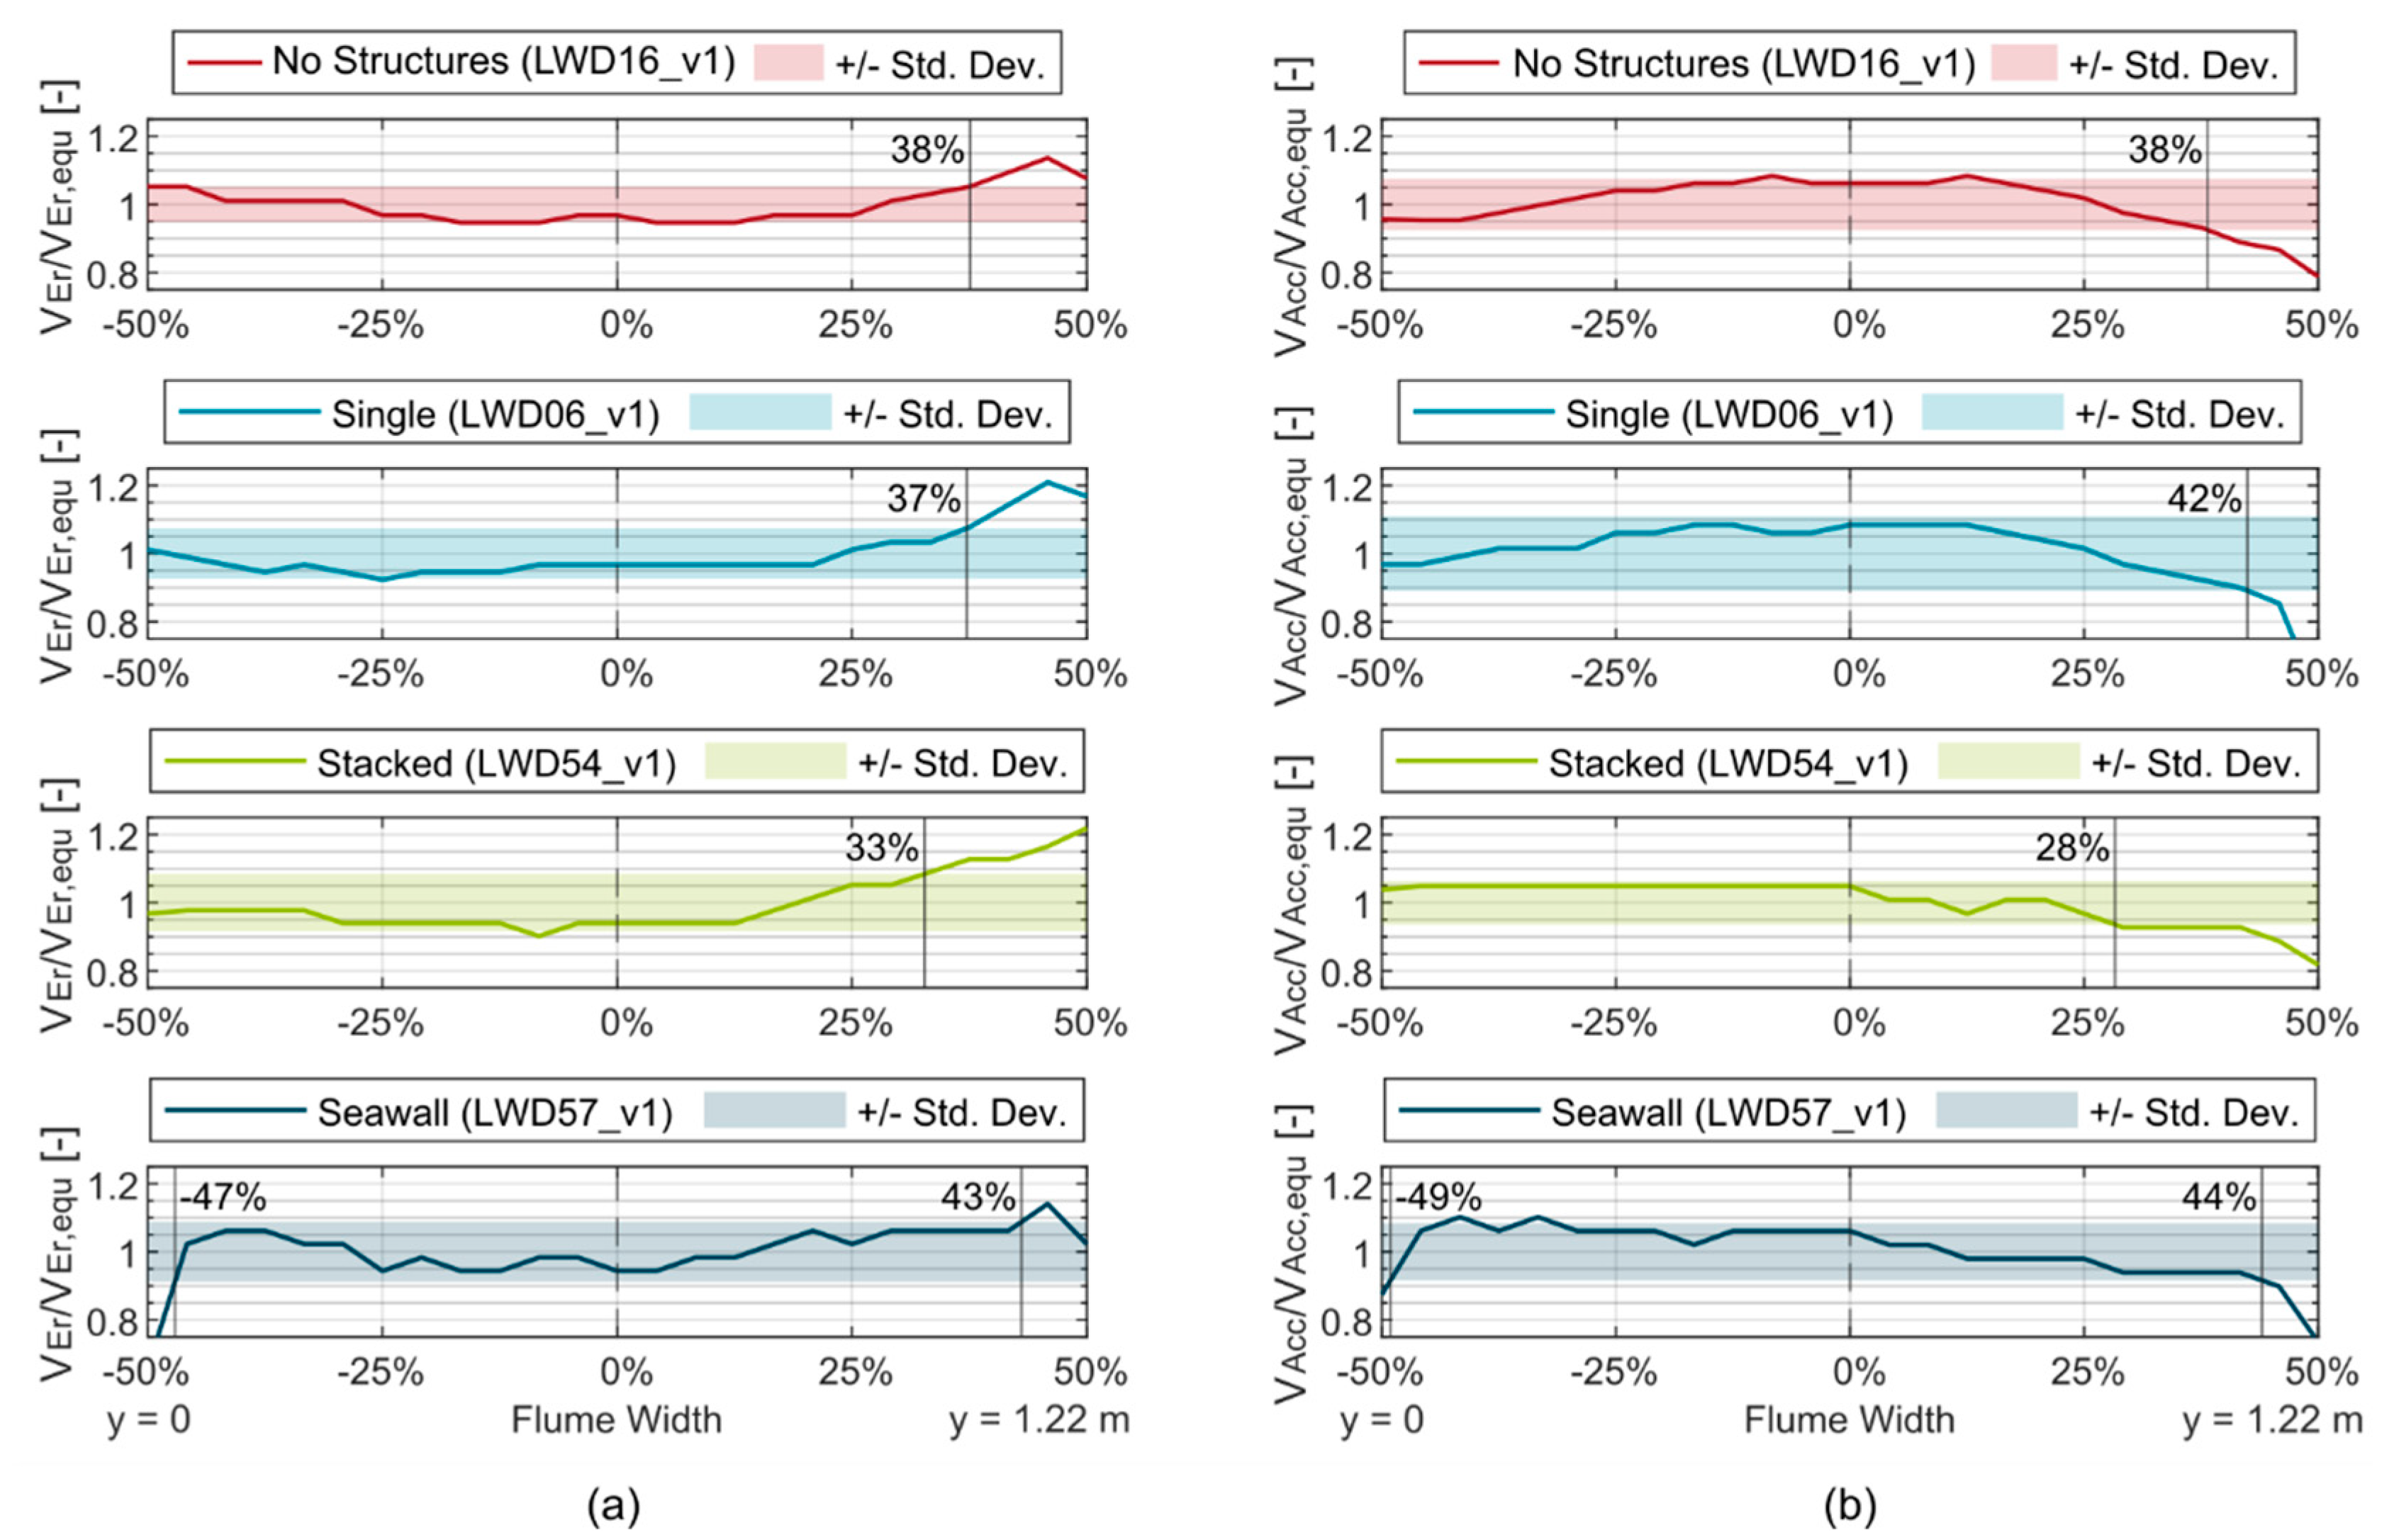
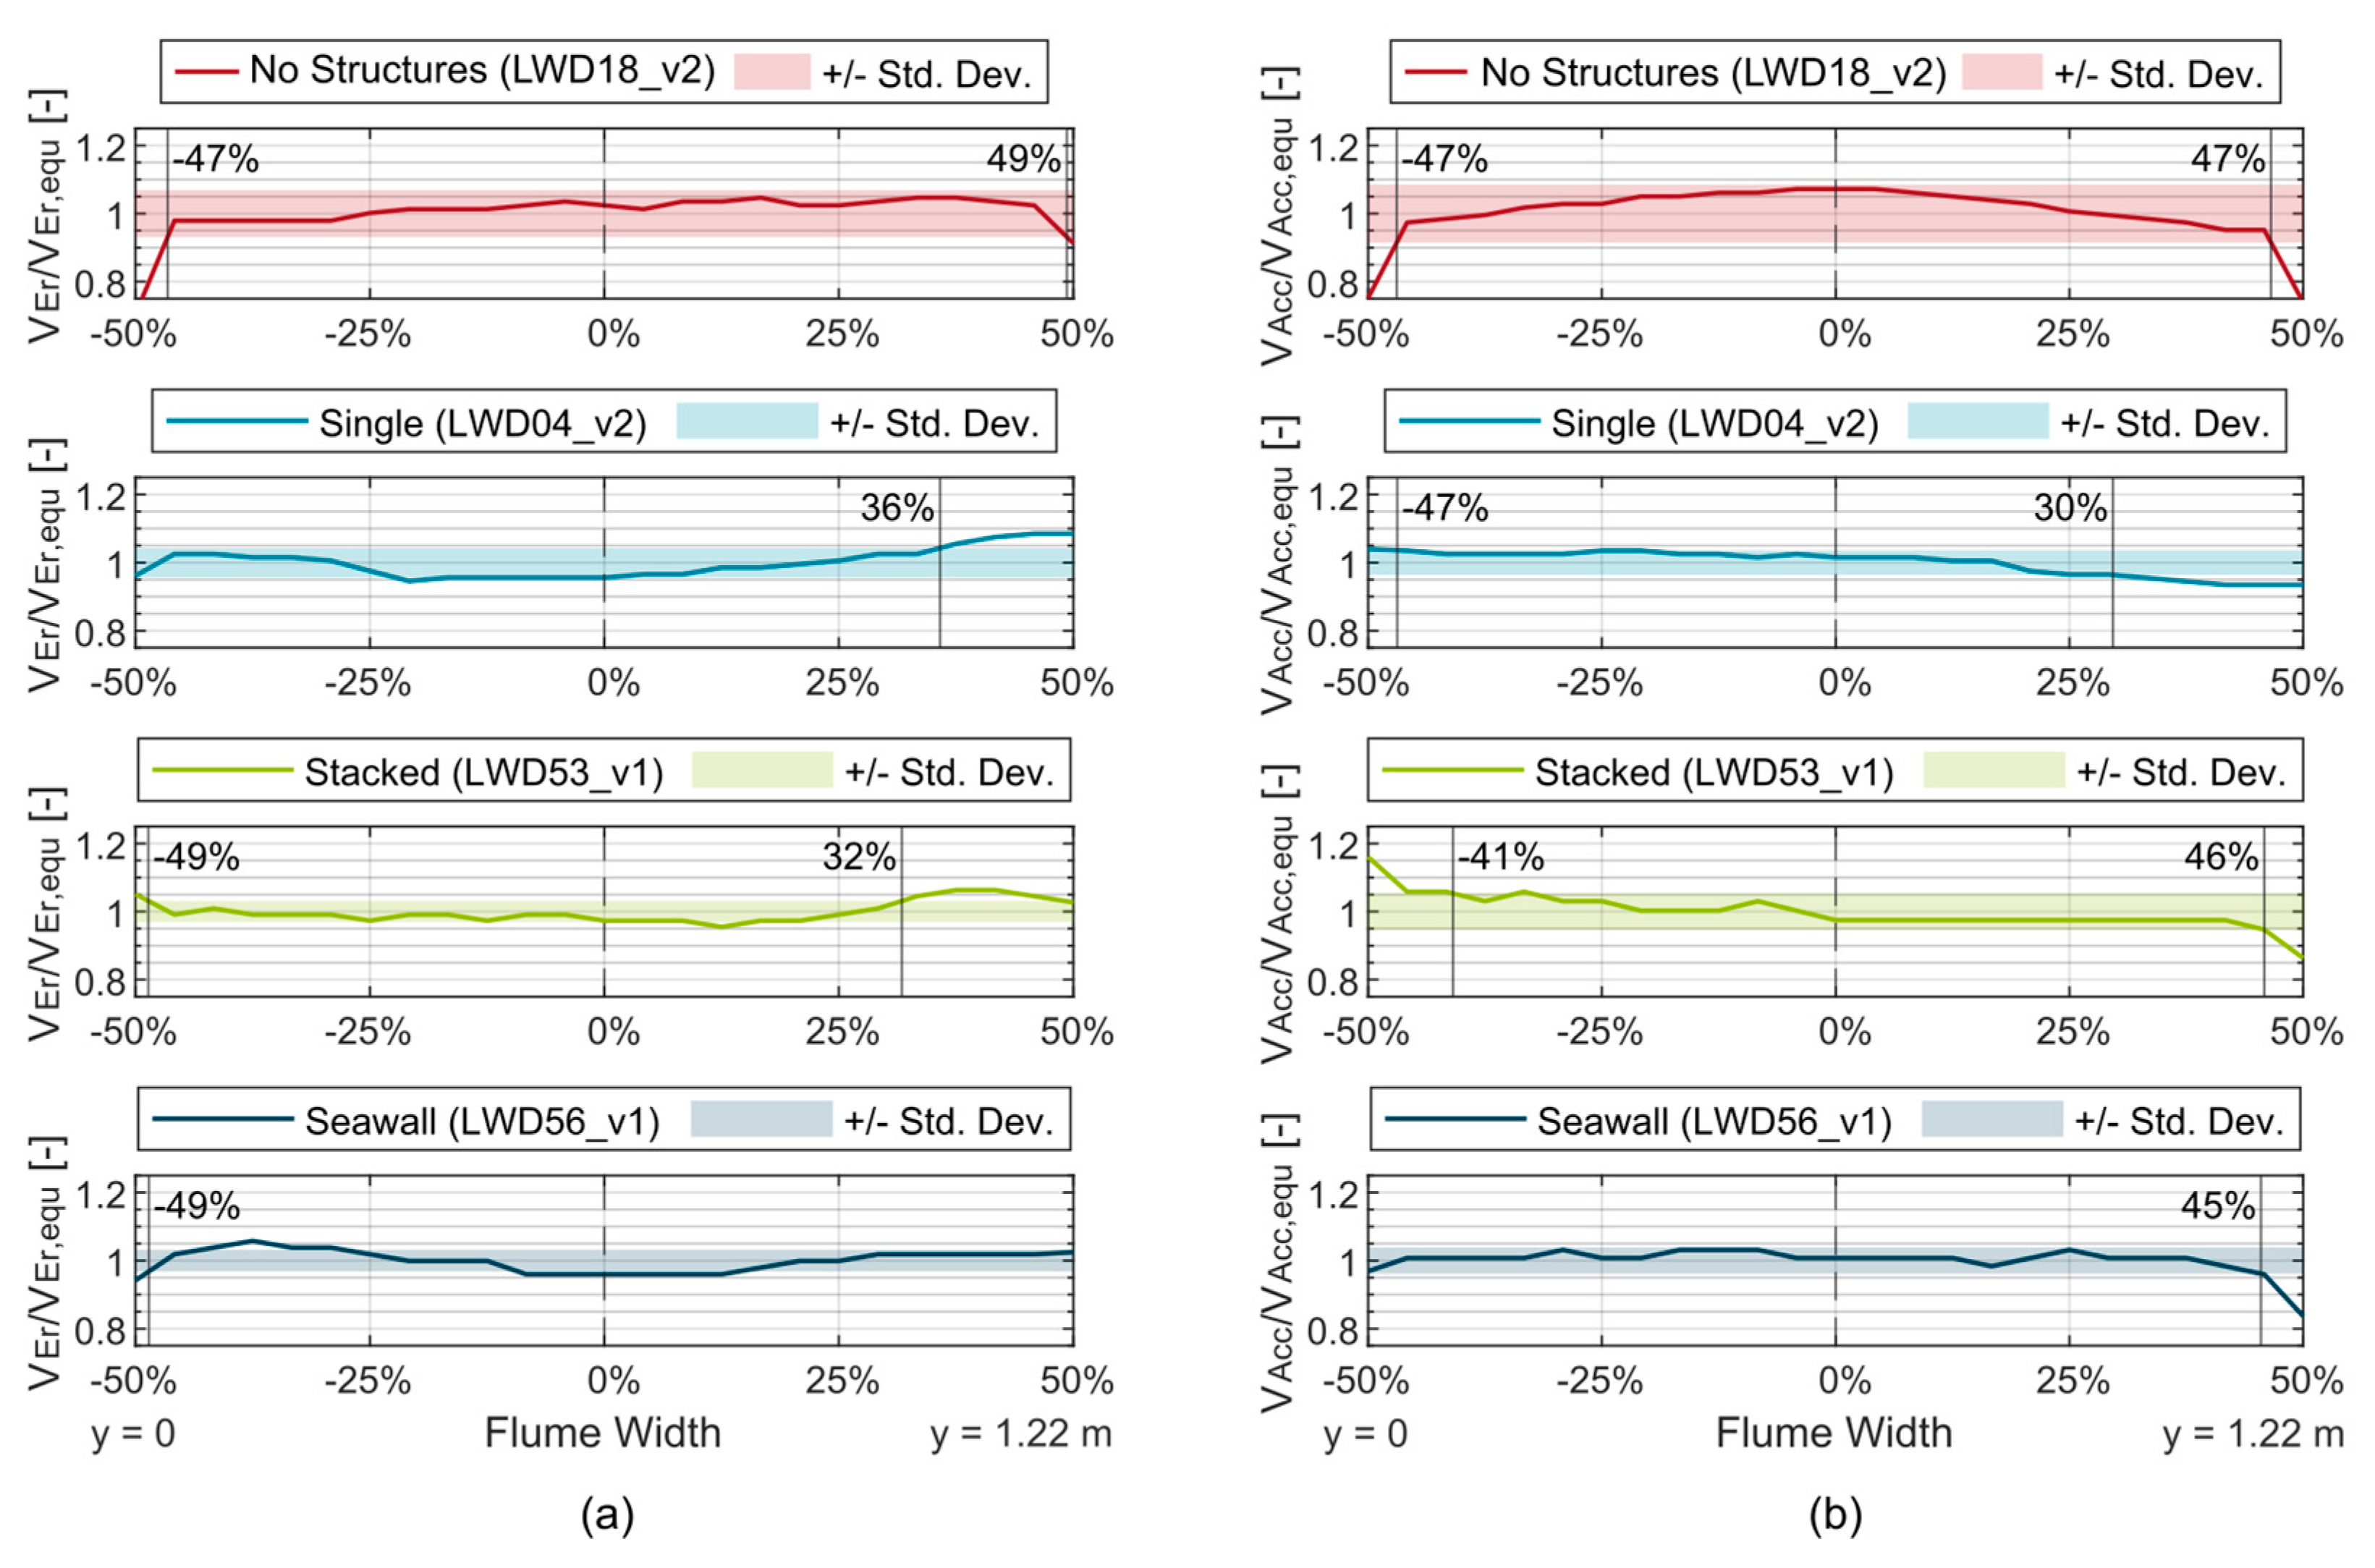
3.1.1. Beach Surface Homogeneity

Prior to calculating morphological changes of the different test configurations, the basic accuracy and homogeneity of the initial beach surface—that is, the beach surface after it was manually prepared—were analyzed. Vertical distances between the actual beach slope made of gravel and an ideal 1:8 sloping plane were calculated for the beach fronting the structure for each experimental configuration tested. Figure 5 presents the vertical distance relative to the mean grain diameter (Dist/D50) for the medium and large wave tests. Localized areas along the front wall and lower part of the beach were up to 2.75 D50 higher than the initial 1:8 slope. Sections along the surface center line and in front of the structure were up to 1.75 D50 lower. The overall accuracy of each surface was lower than one average grain (RMS < 1) except for LWD18_v2 with a RMS of 1.36–1.57. Generally, RMS errors from all tests ranged from 0.5 to 1.6 D50, which showed good accuracy after each reshaping procedure. Notably, RMS errors for the half of each surface close to the front wall are generally higher than for the other half along the back wall. Potential influences of wave-induced compaction of the beach material were not explicitly evaluated within this study.

3.1.2. Sidewall Effects

During the physical modeling, some of the equilibrium beach profiles showed deviations from the idealized uniform two-dimensional distribution of beach sediment, e.g., through forming a convex beach berm. Figure 6 exemplifies the convex berm formed on the equilibrium beach under large wave conditions with an approximated nondimensionalized curvature κ * , representing the curvature multiplied by the flume width, of 0.56.
In contrast to other gravel beach morphology studies, the SfM photogrammetry method used in the present study allowed for quantification of those previously qualitative-only observations to assess the influence of the flume walls or other obstructions. For each test, deviations from a homogeneous distribution of volume change were determined by comparing the volumetric changes of longitudinal sections over the beach width and their relative contribution to the total volume change.
For the medium wave conditions tested (Tp = 2.51 s, Hs = 0.20 m), an influence of more than one standard deviation was detected for 0–9% of the flume width from the back wall (y = 0 m) and 0–20% from the front wall (y = 1.22 m, Figure 7). In the volume distribution under large waves (Tp = 2.17 s, Hs = 0.15 m), deviations of more than the standard deviation were visible within 0–3% of the width from the back wall and 6–22% from the front wall (Figure 8).
On average, an influence on the volume distribution could be detected for 1% of the flume width from the back wall and 10% from the front wall, indicating an increased model effect along the front wall. Additionally, wall effects generally trended to higher values for the cases of Single and Stacked, as compared to the Seawall configuration and the No Structures case. Generally, the larger eroded volume along the front wall has been redistributed over the width of the flume before deposition, since accretion is lower along the wall than in the proximity of the flume center line. Note that the information of each edge section has to be interpreted with caution due to difficulties in separating the surface point cloud from the wall point cloud. Results for the small waves are not shown here, because the overall volume changes were considered to be too small to be attributed to model effects, e.g., elevation differences within the computed standard deviations.

3.2. Beach Morphology

3.2.1. Equilibrium Beach Profiles

For each reshaped beach, profile changes were calculated as the difference between equilibrium profile with structure and equilibrium profile of the No Structures case. Figure 9, Figure 10 and Figure 11 present the results for the small, medium, and large wave conditions tested in this study. Under the smallest wave conditions tested, the placement of the single LWD causes a lower berm, with the berm crest farther inland and the erosive region further offshore, resulting in an overall flatter beach profile. Scouring is also visible in front of the single log. The Stacked and Seawall cases show near-identical equilibrium beach profiles with accretion in front of the structure and erosion at the beach trough further offshore than for the Single and the plain beach. The Single case does not show significant changes in the profile geometry for the medium and large wave conditions. However, for the large wave conditions, additional sediment is deposited on the lee-side of the berm, as well as deeper scouring in front of the log. Again, the wall structures show a near-identical influence on the beach profile under all wave conditions. Generally, the wall structures caused the beach profiles to shift offshore while maintaining the overall characteristic shape of erosion, steeper step, and accretion/berm upslope.

3.2.2. Volumetric Profile Changes

The volumetric profile changes between initial and equilibrium beach profiles were calculated for each test in terms of total eroded volume, VEr and total accreted volume, VAcc, of sediment from the three-dimensional point clouds. For each tested wave condition, the relative volumetric change was then determined as the ratio between those eroded and accreted volumes and the eroded volume and accreted volume of the plain beach case (VEr,None and VAcc,None), of which the results are presented in Figure 12.
The Single case caused a reduction in the eroded volume of 32% under the small waves, but an increase of 11% for the large waves. The same effect can be observed in the accretion of material with a reduction in material accretion under small waves of 26% and a small increase of 7% under large waves. Stacked and Seawall generally caused the overall eroded volume to be reduced by 39–50%, with only minor differences between the two structures, and the different wave conditions. For both wall structures, accretion of material happened in front of the structure (see Figure 9, Figure 10 and Figure 11), resulting in a reduction of 46–71% in comparison to the berm for the No Structures configuration.

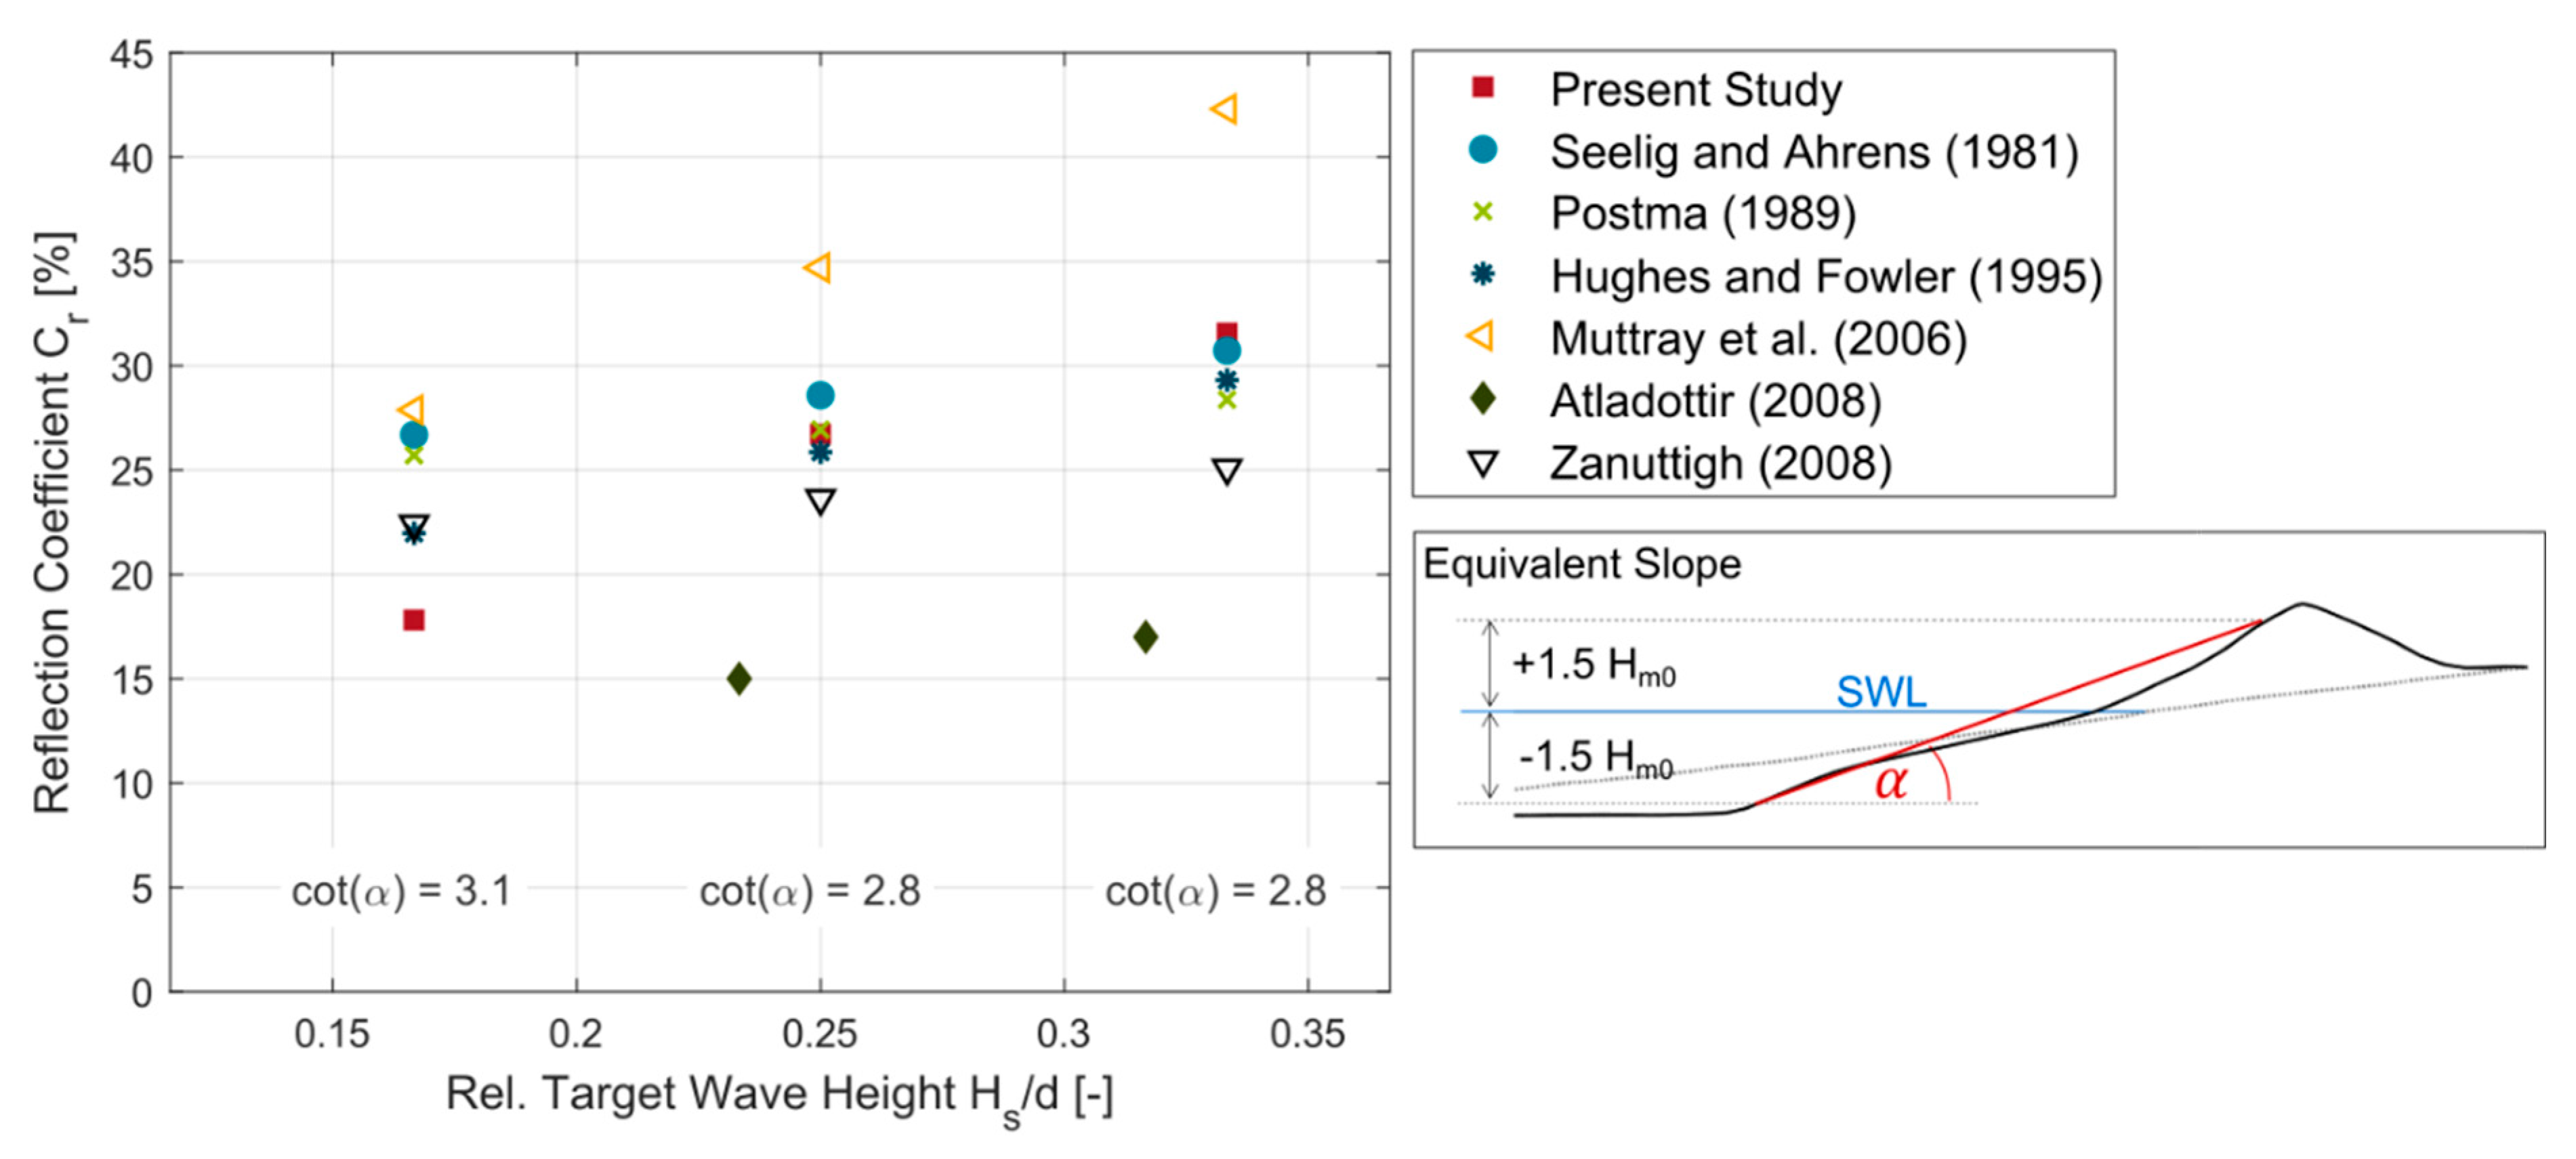
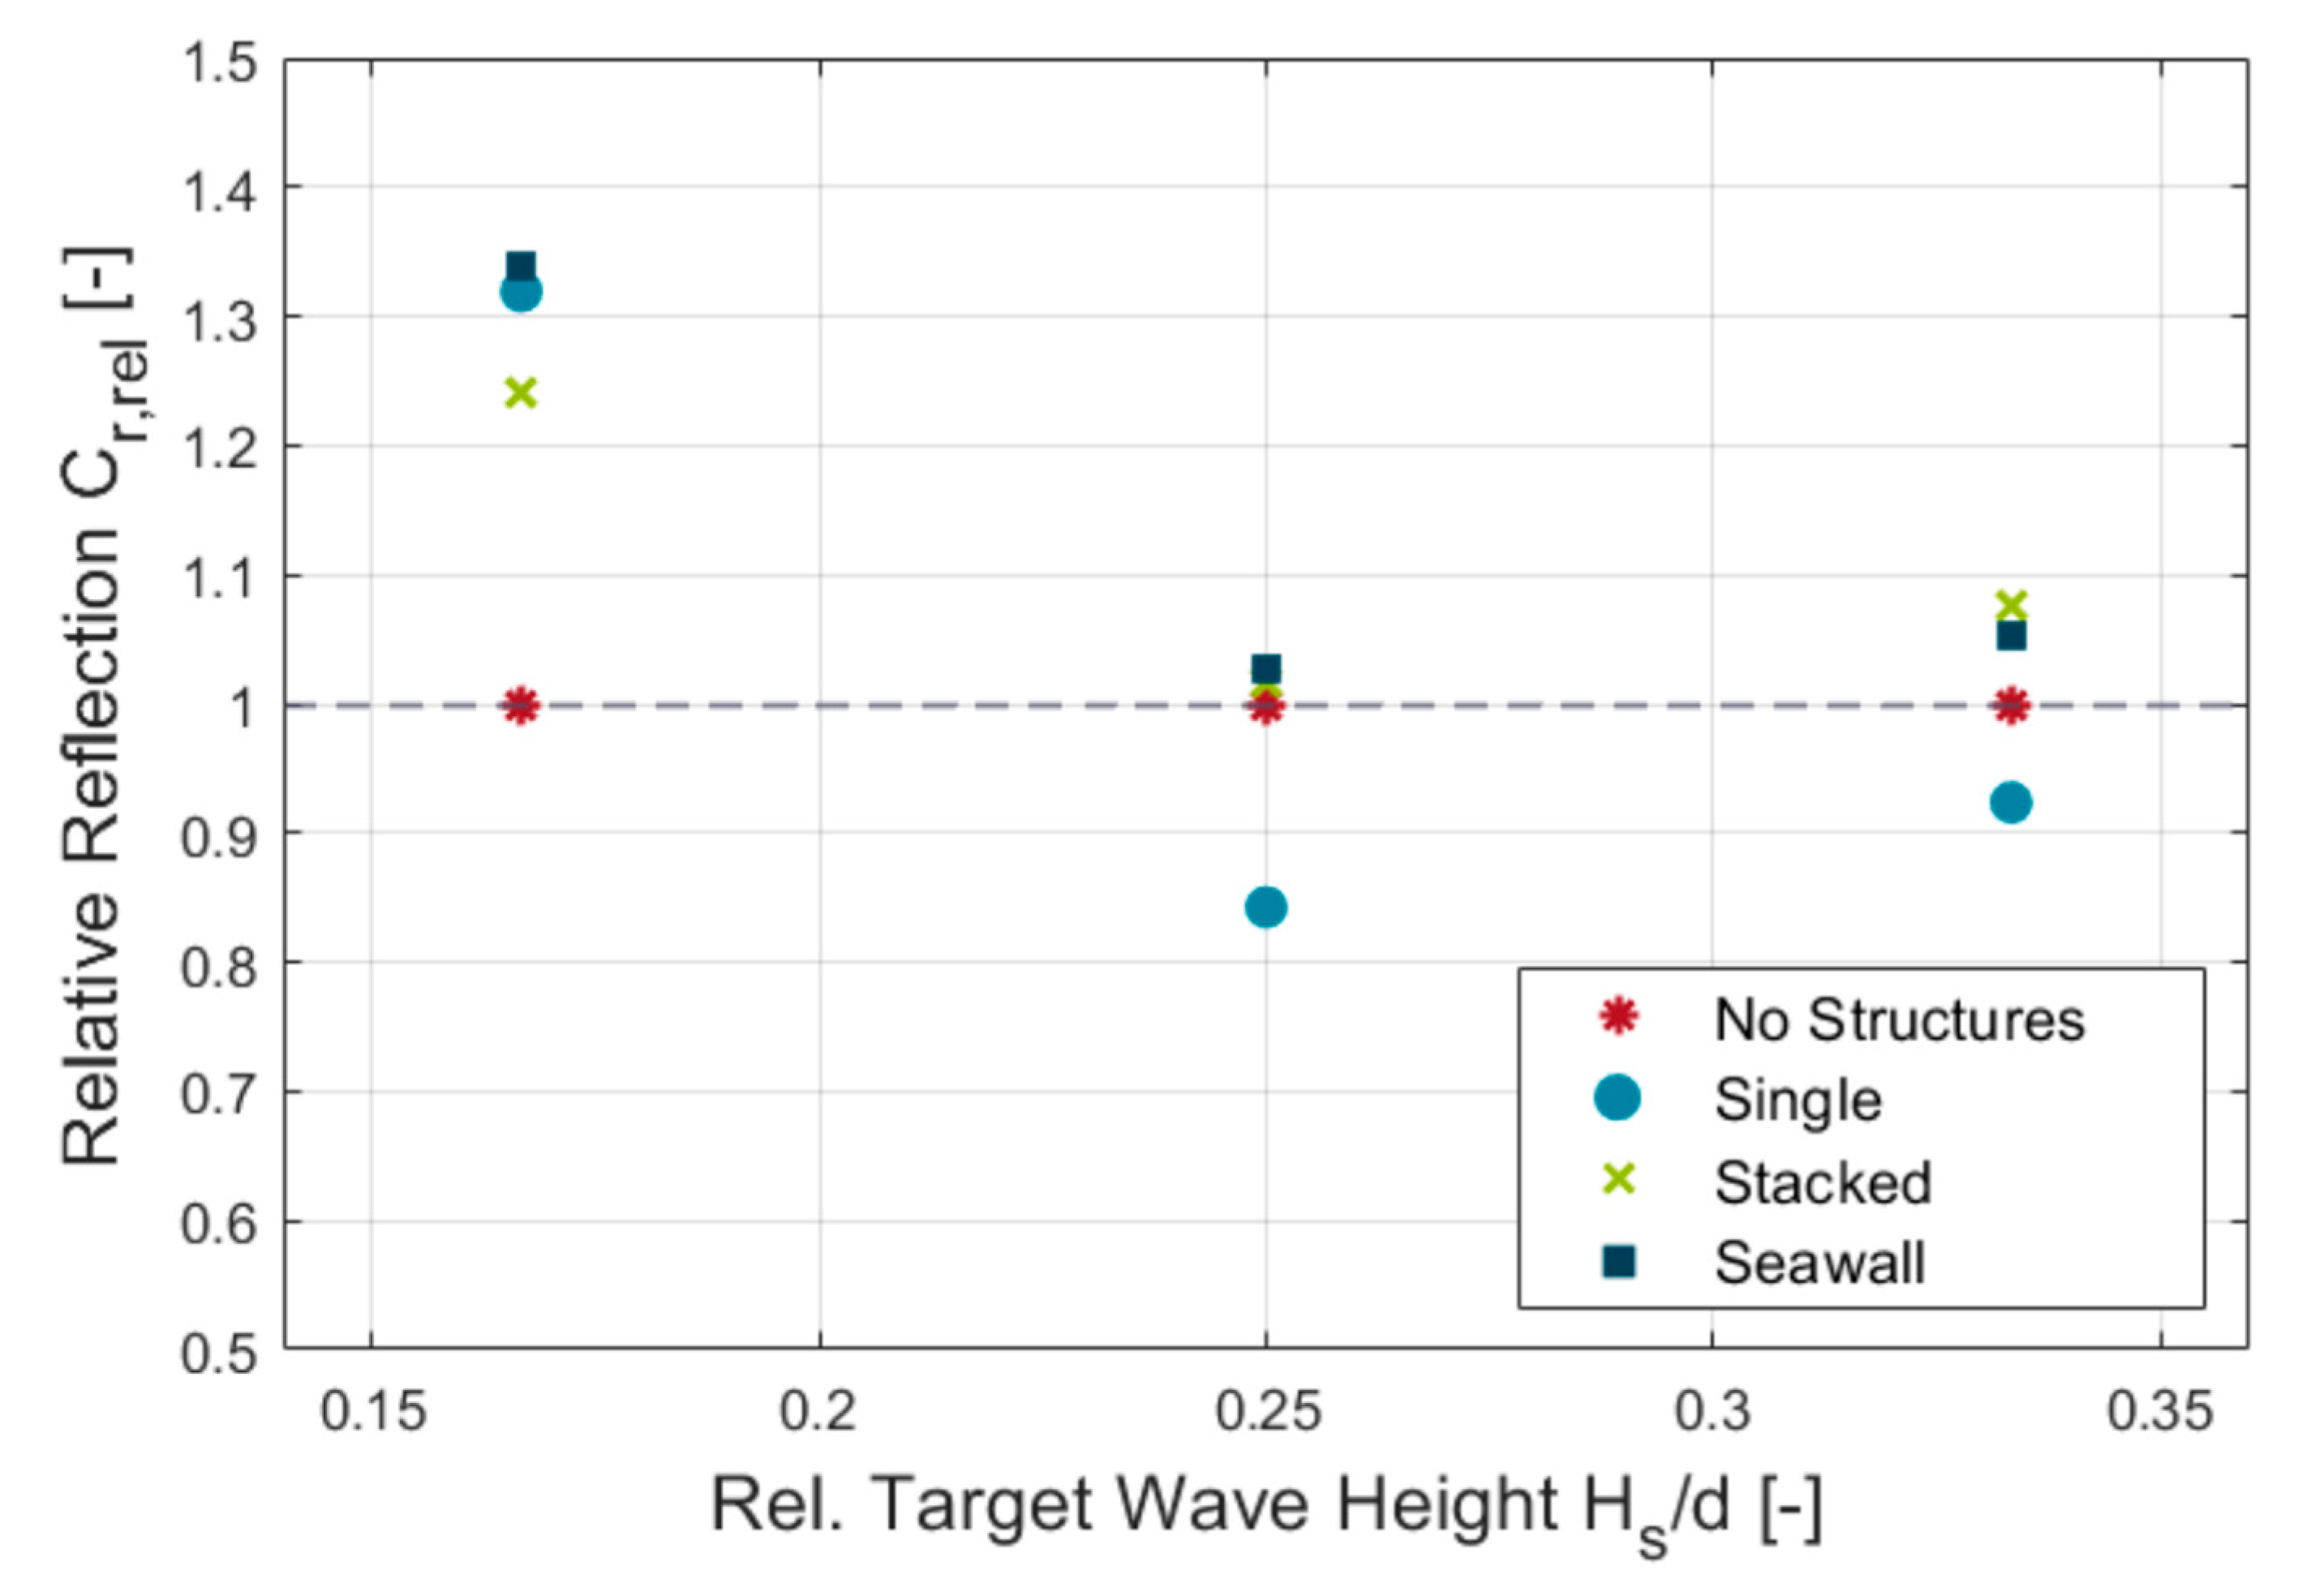
3.3. Wave Reflection

Wave reflection coefficients for each tested structure were calculated according to [52] for the equilibrium state of the beach and then compared to existing values that were available in the literature. The measured reflection coefficients for the No Structures configuration are shown in Figure 13, together with empirically derived reflection coefficients for rouble-mound structures [32,53,54,55,56] and experimental results from [50] for gravel beaches. For this study, reflection coefficients from the beach without structures were between 18 and 32%. Reference reflection coefficients for gravel beaches are scarcely reported in the existing literature, such that the included empirical values are used as an approximation for a permeable structure, such as a gravel beach. Note that all empirical relationships were derived for a continuous beach slope, such that for comparison purposes, the predicted values were calculated using the approximated slope of the steeper beach face, as indicated in Figure 13.
The vertical seawall tests resulted in reflection coefficients between 22 and 34% for the three tested wave conditions and are shown in Table 2, together with available reflection coefficients from other studies on the effect of seawalls [31,33,34,57].
The effect of each structure type on beach reflection relative to the beach reflection of the reference case is shown in Figure 14. Under the smallest wave conditions tested, all structures increased the reflection by 25–34%. Under the medium wave conditions tested, the Single configuration causes a decrease in reflection by 16%, while the two wall structures only showed a negligible increase of 2–3%. For the largest wave conditions tested, Stacked and Seawall again only show a small increase of 5–8%. The single log caused a minor decrease in reflection by 8%.

4. Discussion

4.1. Model Effects

As part of this study, an analysis of model effects related to beach morphology was conducted before comparing the main results on beach morphology changes and reflection from LWD structures and a vertical seawall. The largest deviations from a uniform sediment distribution were detected for the two LWD structures (Single, Stacked). For more than half of the tests, deviations were higher for the accretion part of the beach, which coincides with observations of higher irregularities in the accreted beach profile above SWL from [50]. On average, deviations in the volume distribution over the width of the flume surpassed one standard deviation for 1% of the width on the back wall (y = 0 m), but 10% of the width on the front wall (y = 1.22 m). This result demonstrates the existence of sidewall effects and further shows a difference in magnitude between the results along the two flume walls. Both flume walls are built with the same materials without significant visible differences or obstructions on either side that could explain the difference. Other potential sources for the detected model effects might, therefore, be the initial distribution of the beach material, some error in the alignment of each structure with the flume walls, or interference of the waves with specific instrumentation.
Each structure was carefully put in place and checked multiple times for its alignment with the flume walls, such that major deviations can be excluded here with significant certainty. An additional check of the surveyed structures resulted in an average alignment error of 0.2% relative to the flume width, supporting this assumption. In the assessment of each initial beach surfaces (see Section 3.1.1) areas with more material along the front wall, and consequently, higher RMS errors for the front half of the surface, became apparent for some tests. This coincides with the higher deviations in the volume distribution along the front wall, indicating a possible influence of the initial sediment distribution. However, for the Single test under large wave conditions (LWD04_v2), an initial homogeneous sediment distribution (RMS = 0.71–0.73) still resulted in one of the highest deviations in the final volume distribution, thus refuting this potential connection. The threshold at which the initial sediment distribution has a significant effect on the morphology of the equilibrium beach, therefore, remains uncertain, and would have to be studied in more detail, potentially using other flumes, with different width-to-length ratios, to confirm or reject this study’s findings. Existing gravel beach morphology studies have investigated the effect of the initial slope of the beach [48,50]; however, not the initial sediment distribution on grain scale. A second possible explanation can be found in the instrumentation setup. All wave gauges have been installed along the centerline of the flume (see Figure 1). However, for additional purposes, which are not included in this study, an Acoustic Doppler Velocimeter (ADV) was mounted in the vicinity of the beach toe, at x = 37.190 m, y = 0.885 m (equivalent to +24% from the central flume axis). Its location closer to the front wall generally coincides with the higher deviations along this flume half. However, irregularities in the volume distribution of more than one standard deviation were not detected up to the position of the ADV. Hence, an influence might be possible, but a direct connection could not be established with high confidence.

4.2. Beach Morphology

The main focus of this study was to compare the effect of each structure type on the gravel beach morphology change. According to this study’s results, the morphological response was generally very similar between the Single and the No Structures configuration, as well as between the Stacked and the Seawall. Under the small waves conditions, however, the Single case inhibited sediment transport in contrast to a gravel-only beach. As an addition to the otherwise uniform beach surface, it presented an obstruction, and the wave energy of the small wave heights was not large enough to transport the sediment over the log, which otherwise would be transported upslope more easily. Therefore, the resulting beach profile was flattened with an earlier initiation, and less erosion, and a lower berm. Interestingly, under the large wave conditions, the log facilitated additional sediment movement and, hence, may have had a destabilizing effect on the beach, causing more erosion than a beach without structures. This may be a result of the decreased roughness of the smooth log relative to a plain gravel beach surface, allowing for easier wave transmission over the log.
In contrast to the No Structures case, the two wall structures blocked the sediment transport upslope, such that nearly all the sediment was accumulating in front of the structure. The breaker point of the wave was shifted offshore, such that the erosion started earlier along the beach profile. In contrast to the Single LWD and the plain beach case, less beach material was mobilized until reaching beach equilibrium, such that the beach was stabilized. The overall beach profile shape, however, remained very similar to the characteristic profile of the beach without structures, including an eroded area and a steep step below SWL, and an accreted area above SWL. This is in agreement with previously obtained results of [45], who also found an offshore shift in the gravel beach profile the closer a seawall was positioned at SWL. As in the present study, these authors only found accretion in front of the seawall without an indication of toe scouring.
The results from the present tests show that the placement of a single LWD, e.g., as a replacement after the removal of a wall structure, is only effective in stabilizing the beach under small waves. If stacked logs are considered as an alternative to a vertical seawall, the morphological response of the beach would most likely be nearly identical to that of the vertical wall. Here, the geometry of the wall front with its curved surface does not seem to have a beneficial effect, such that the two structures can be considered equal regarding their effect on the beach profile under the tested conditions. Due to the degradation of LWD over time, the implementation of a stacked log wall instead of a concrete wall might, however, provide a beneficial transition from an armored to a natural shoreline.
It has to be noted that the long-term effects of each structure, as well as the effects of changing water levels on beach morphology, could not be covered in this study. The tests only cover a limited range of parameters and can only provide a momentous insight into the processes involved around each structure. Thus, a conclusion of these walls stabilizing the beach is only valid for the tested conditions, and general conclusions should be drawn with caution, especially considering the ongoing controversial discussion about the active contribution of seawalls to shoreline erosion.

4.3. Wave Reflection

Calculated reflection coefficients investigated in this study were compared to predicted values from literature and also compared to each other in order to assess each structure’s effect on the beach reflectivity. Since direct measurement of wave reflection is not possible; the determination of wave reflection coefficients involves a significant amount of uncertainty [56]. Therefore, absolute values were used in assessing the comparability of the present study results with other experimental or empirical studies, while relative values are used for the comparison between the structure types.
The obtained reflection coefficients of the beach without structures showed good agreement with values from literature despite having been derived for rouble-mound structures. The approximation of the beach face as the continuous slope seems to be an acceptable and accurate enough solution for this comparison. Reflection values from seawall structures overall showed similar ranges as the obtained values from this study despite their different test configurations, beach sediment, and structure type.
As expected, the wall structures generally increased the reflection of the beach due to introducing a vertical, reflective face to the otherwise gradually sloping beach. Interestingly, under small wave conditions, an increase in beach reflection was also apparent for the Single case. It is understood that the single LWD of the tested diameter presents enough of an added obstruction on the beach surface for the small waves’ heights to cause a larger percentage of the wave energy to be reflected than a beach without structures. While the placement of a single LWD under small waves beneficially affects the erosion reduction, it also causes more reflection, which should be considered when designing such structures.
Under medium wave conditions tested, and to a limited extent for the large waves tested, beach reflection can be positively influenced by the placement of the Single LWD. Here, the reflection is even reduced to a lower level than the beach without the structures. For the middle to large waves, the combination of gravel beach surface with added LWD seemed to have presented a less reflective surface for the incoming waves than the gravel-only beach. This can be explained by the smooth surface of the added LWD, as well as by sufficiently large incident wave heights for which the LWD was no longer an obstacle in the profile.

4.4. Test Limitations

To the authors’ knowledge, this is the first experimental study that directly compares the effect of seawalls and LWD structures on gravel beach morphology and reflection under the same test conditions. The following limitations should be accounted for when reviewing the results of this study:
  • The offshore water depth was kept constant for all test runs, such that the effect of each structure’s elevation or the effect of water level changes within one test run (simulating the tide) was not covered in the present study. The relative water depth in front of the structure remains one of the most influential factors for the morphological response of a seawall-backed beach [39,44,46,57]. Hence, water level changes might significantly modify the morphological result of the Stacked Log Wall and Seawall case and hence influence the comparison to other structure types.
  • The experimental modeling program only allowed for a single beach material to be used for all tests. The beach was formed using only one type of gravel (D50 = 7.9 mm) without changing the sediment size or permeability over the course of the test. Different sediment gradations, or an impermeable layer of sediment combined with a permeable gravel top layer, however, have shown significant changes in the morphological response of the beach [45].
  • The LWD structures were fixed in place. However, LWD structures are understood to behave somewhat dynamically (depending on the design and anchoring mechanism) with the incoming waves and changing water levels [17], thus potentially creating a different morphological response of the surrounding beach. Conclusions from this study are therefore only valid for immobile structures.
  • All tests were run with an initial 1:8 beach slope to have the same initial conditions and allow a reliable comparison between each structure. The effect of a potential replacement structure on an equilibrium beach profile, e.g., replacing the vertical wall with a single LWD after the beach has already reached equilibrium, was not covered within this study. Other gravel beach studies have found an effect of the initial beach slope on the sediment transport direction and final profile location even without an additional structure [48]. It is therefore reasonable to expect that a change of structure in addition to a change in the initial beach profile may result in different observations than the present study.

5. Conclusions

In this study, experimental modeling of a Single, Stacked, and Seawall structure on a gravel beach has been undertaken to study each structure’s effect on the beach morphology and wave reflection in contrast to a beach with no structures. Based on the obtained test results, the following conclusions can be drawn:
Model effects:
  • The magnitude of morphology-related side wall effects varied with structure type and wave conditions but generally showed a higher influence along the front flume wall. This may potentially be related to differences in the position of instrumentation, highlighting the need to quantify such effects in future research.
  • For the LWD structures, higher model effects were detected for the seawall case and the beach without structures.
  • Potential sources for the wall effects might be irregularities in the initial sediment distribution or wave interference with instrumentation; however, the data were not conclusive enough to confirm this hypothesis.
Beach stabilization:
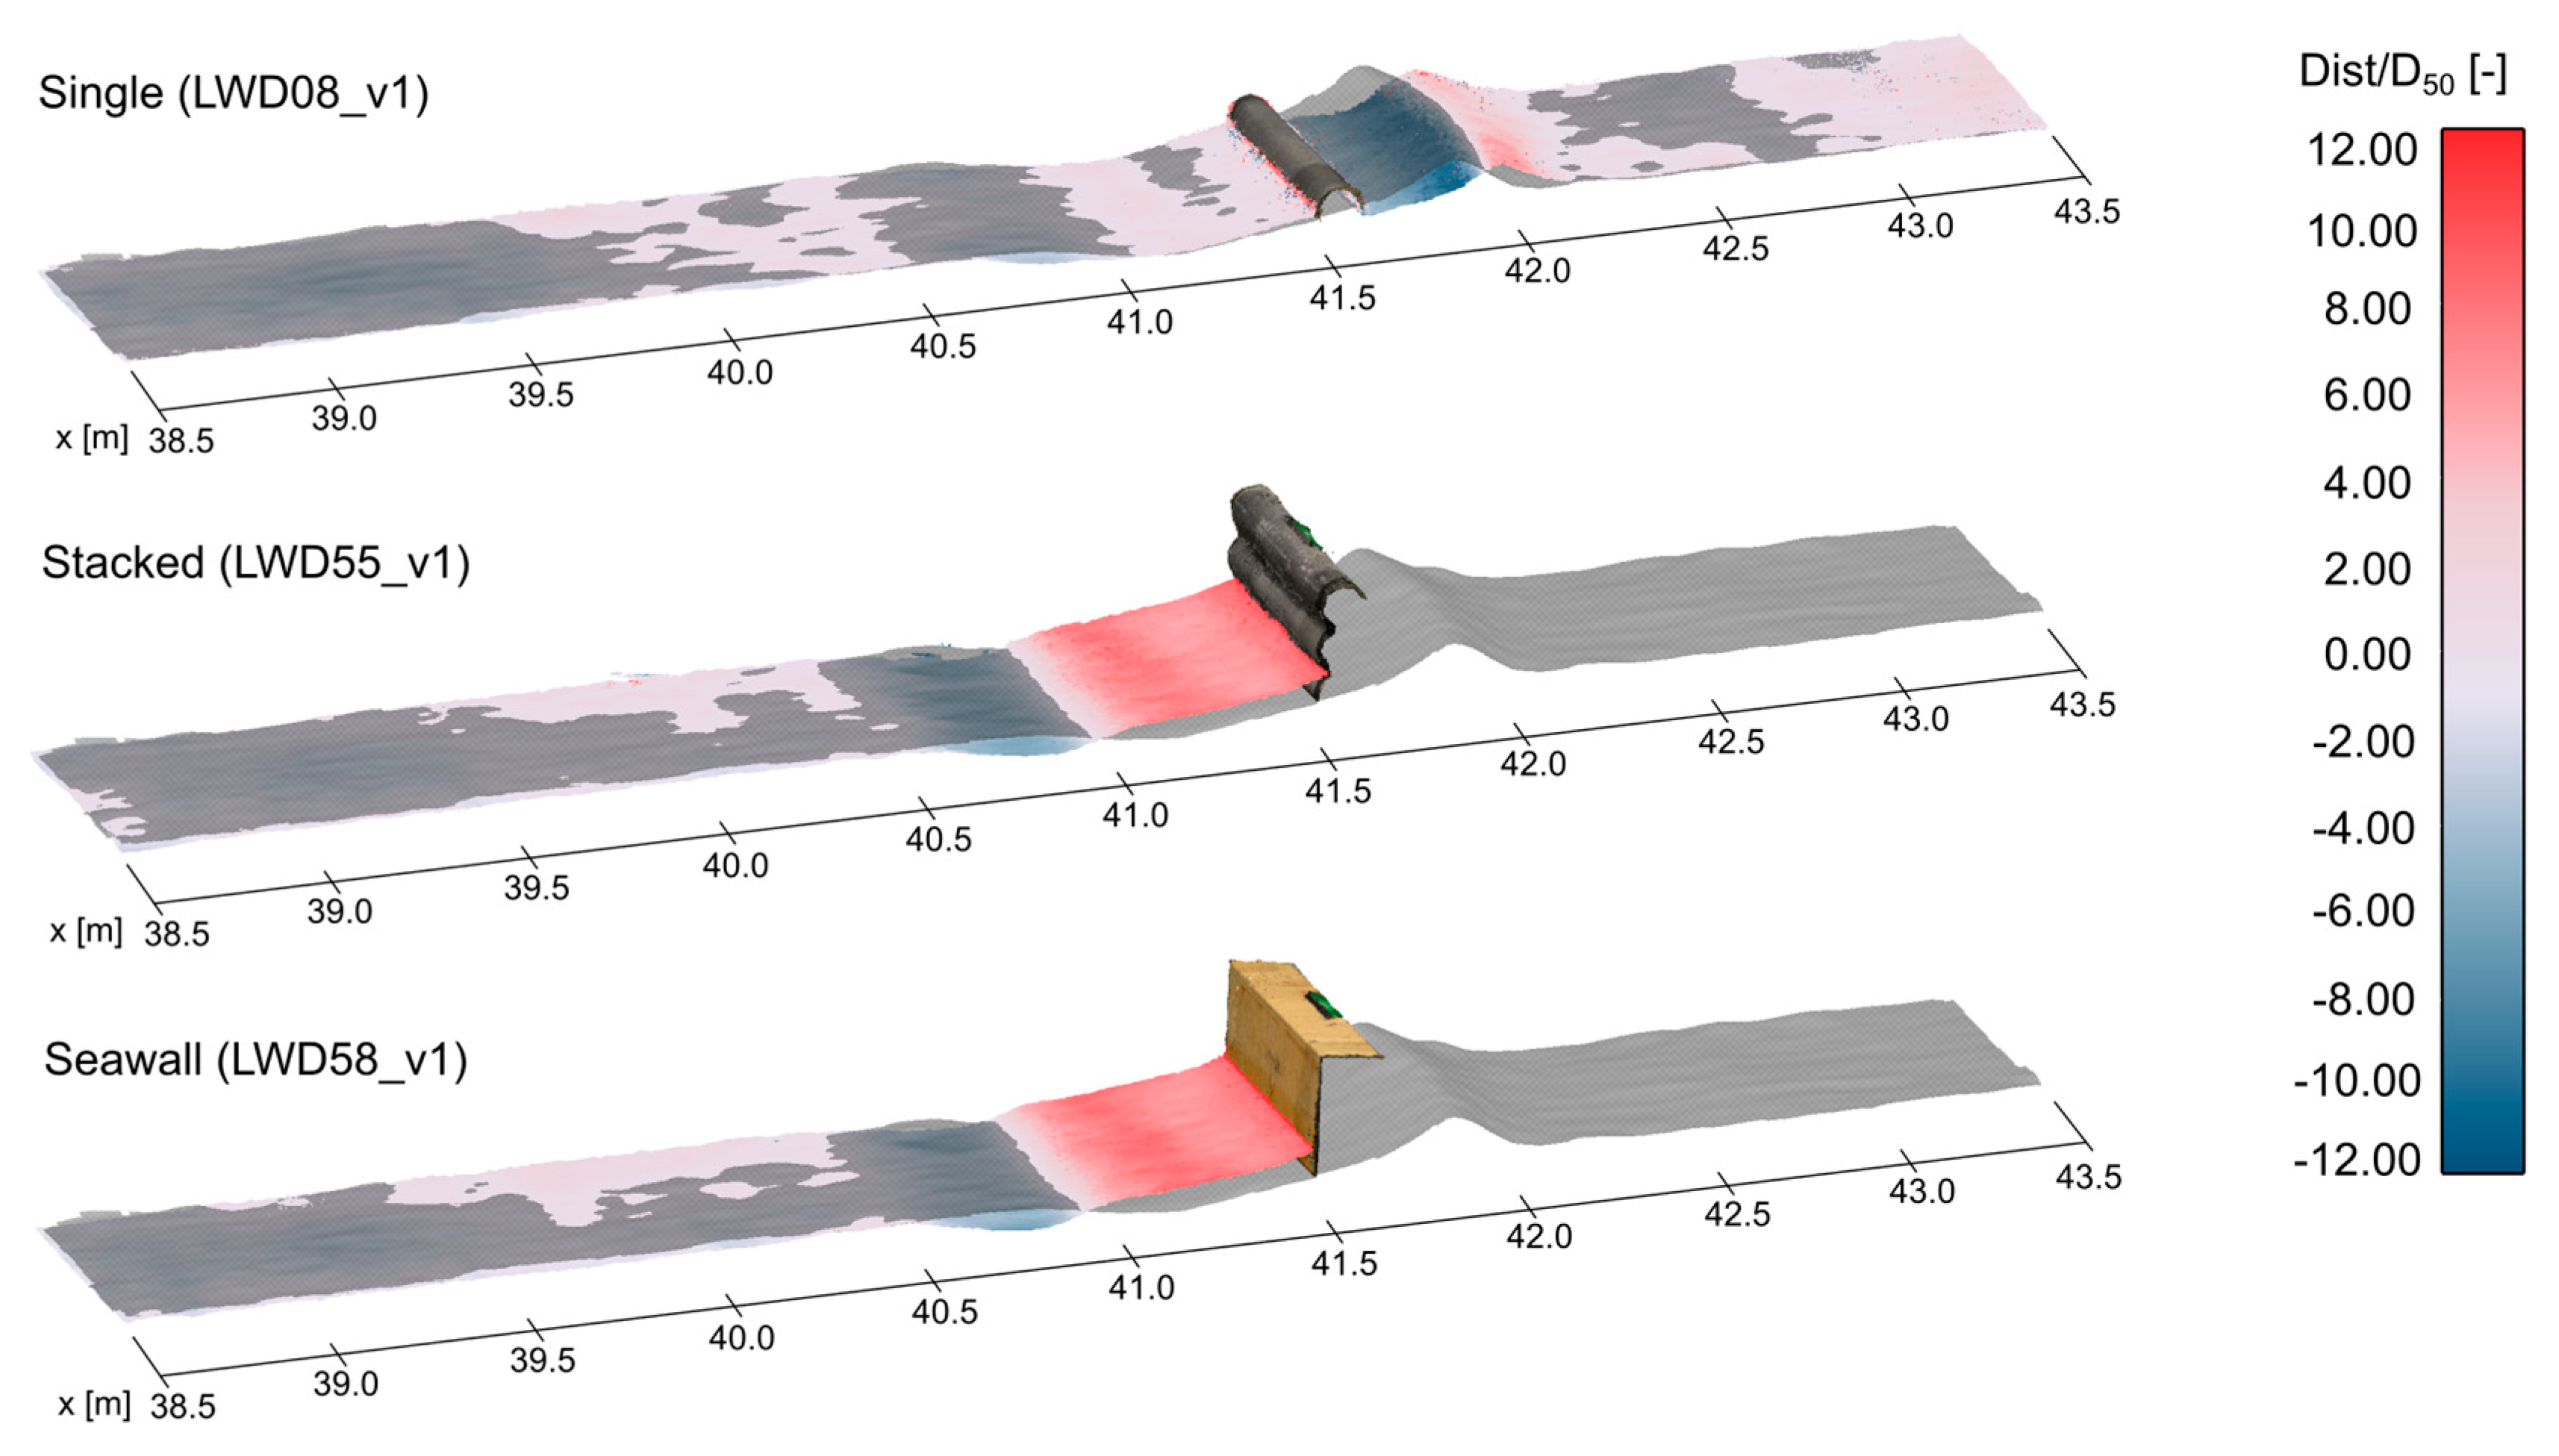
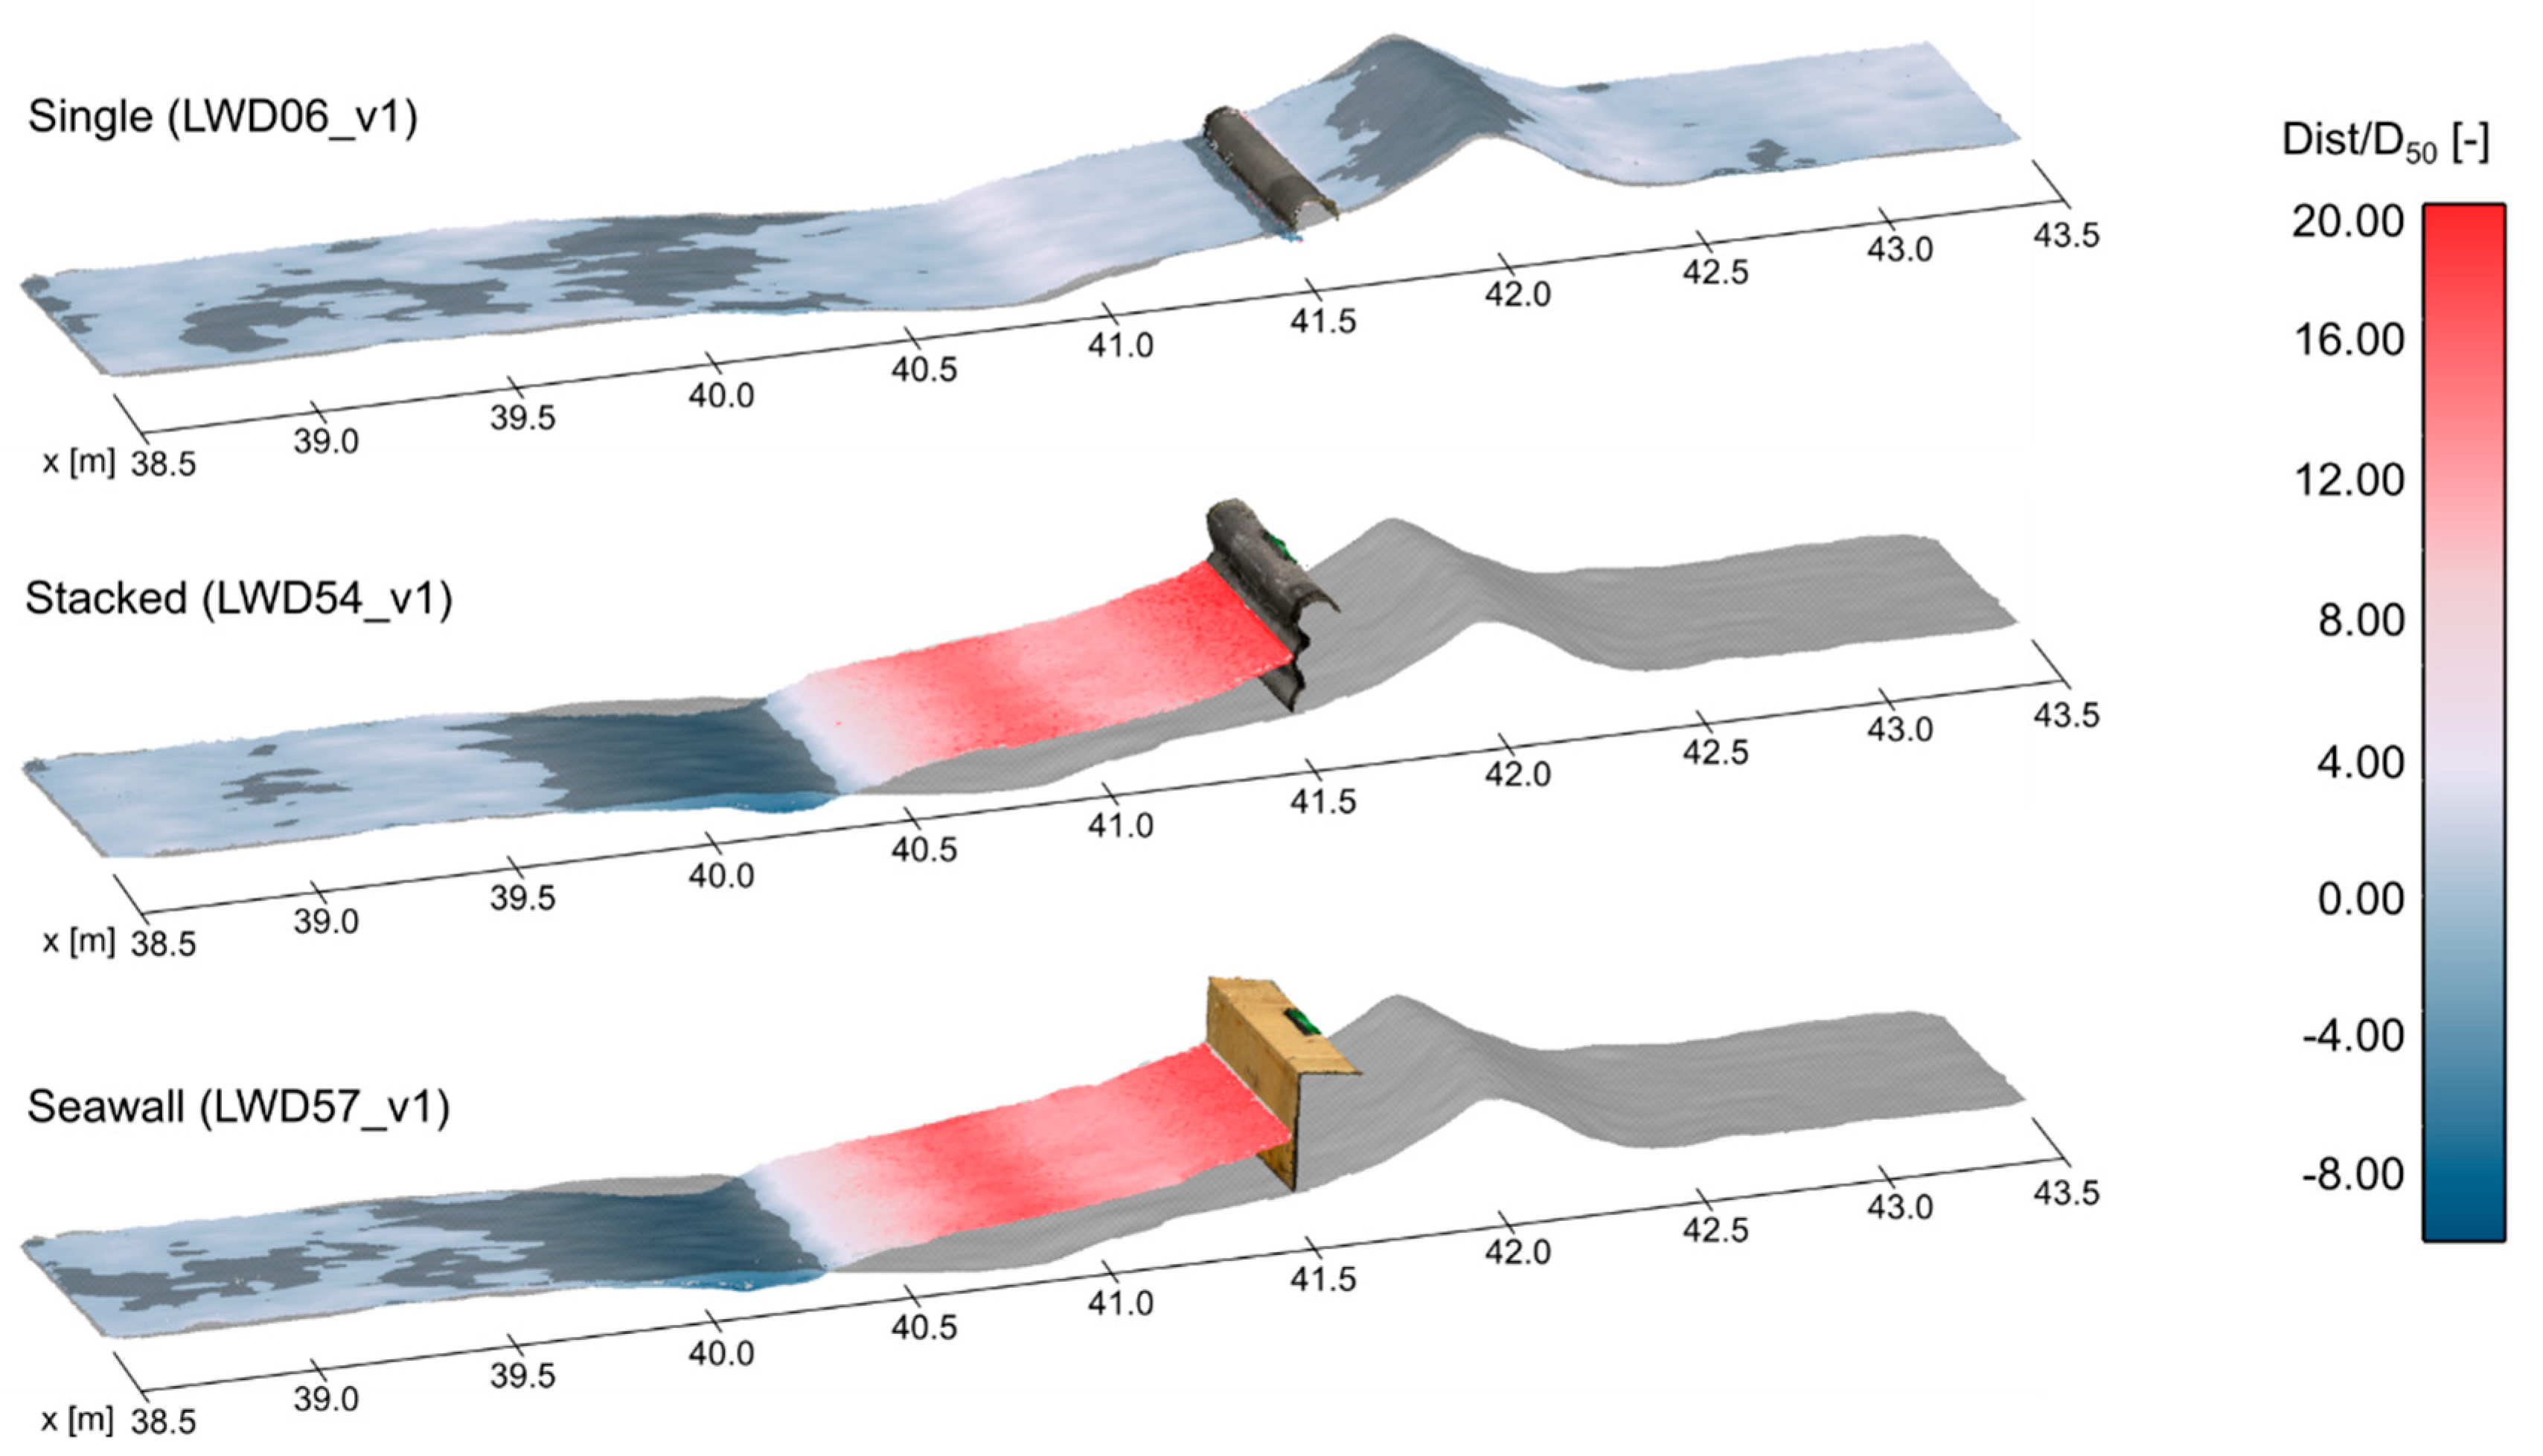
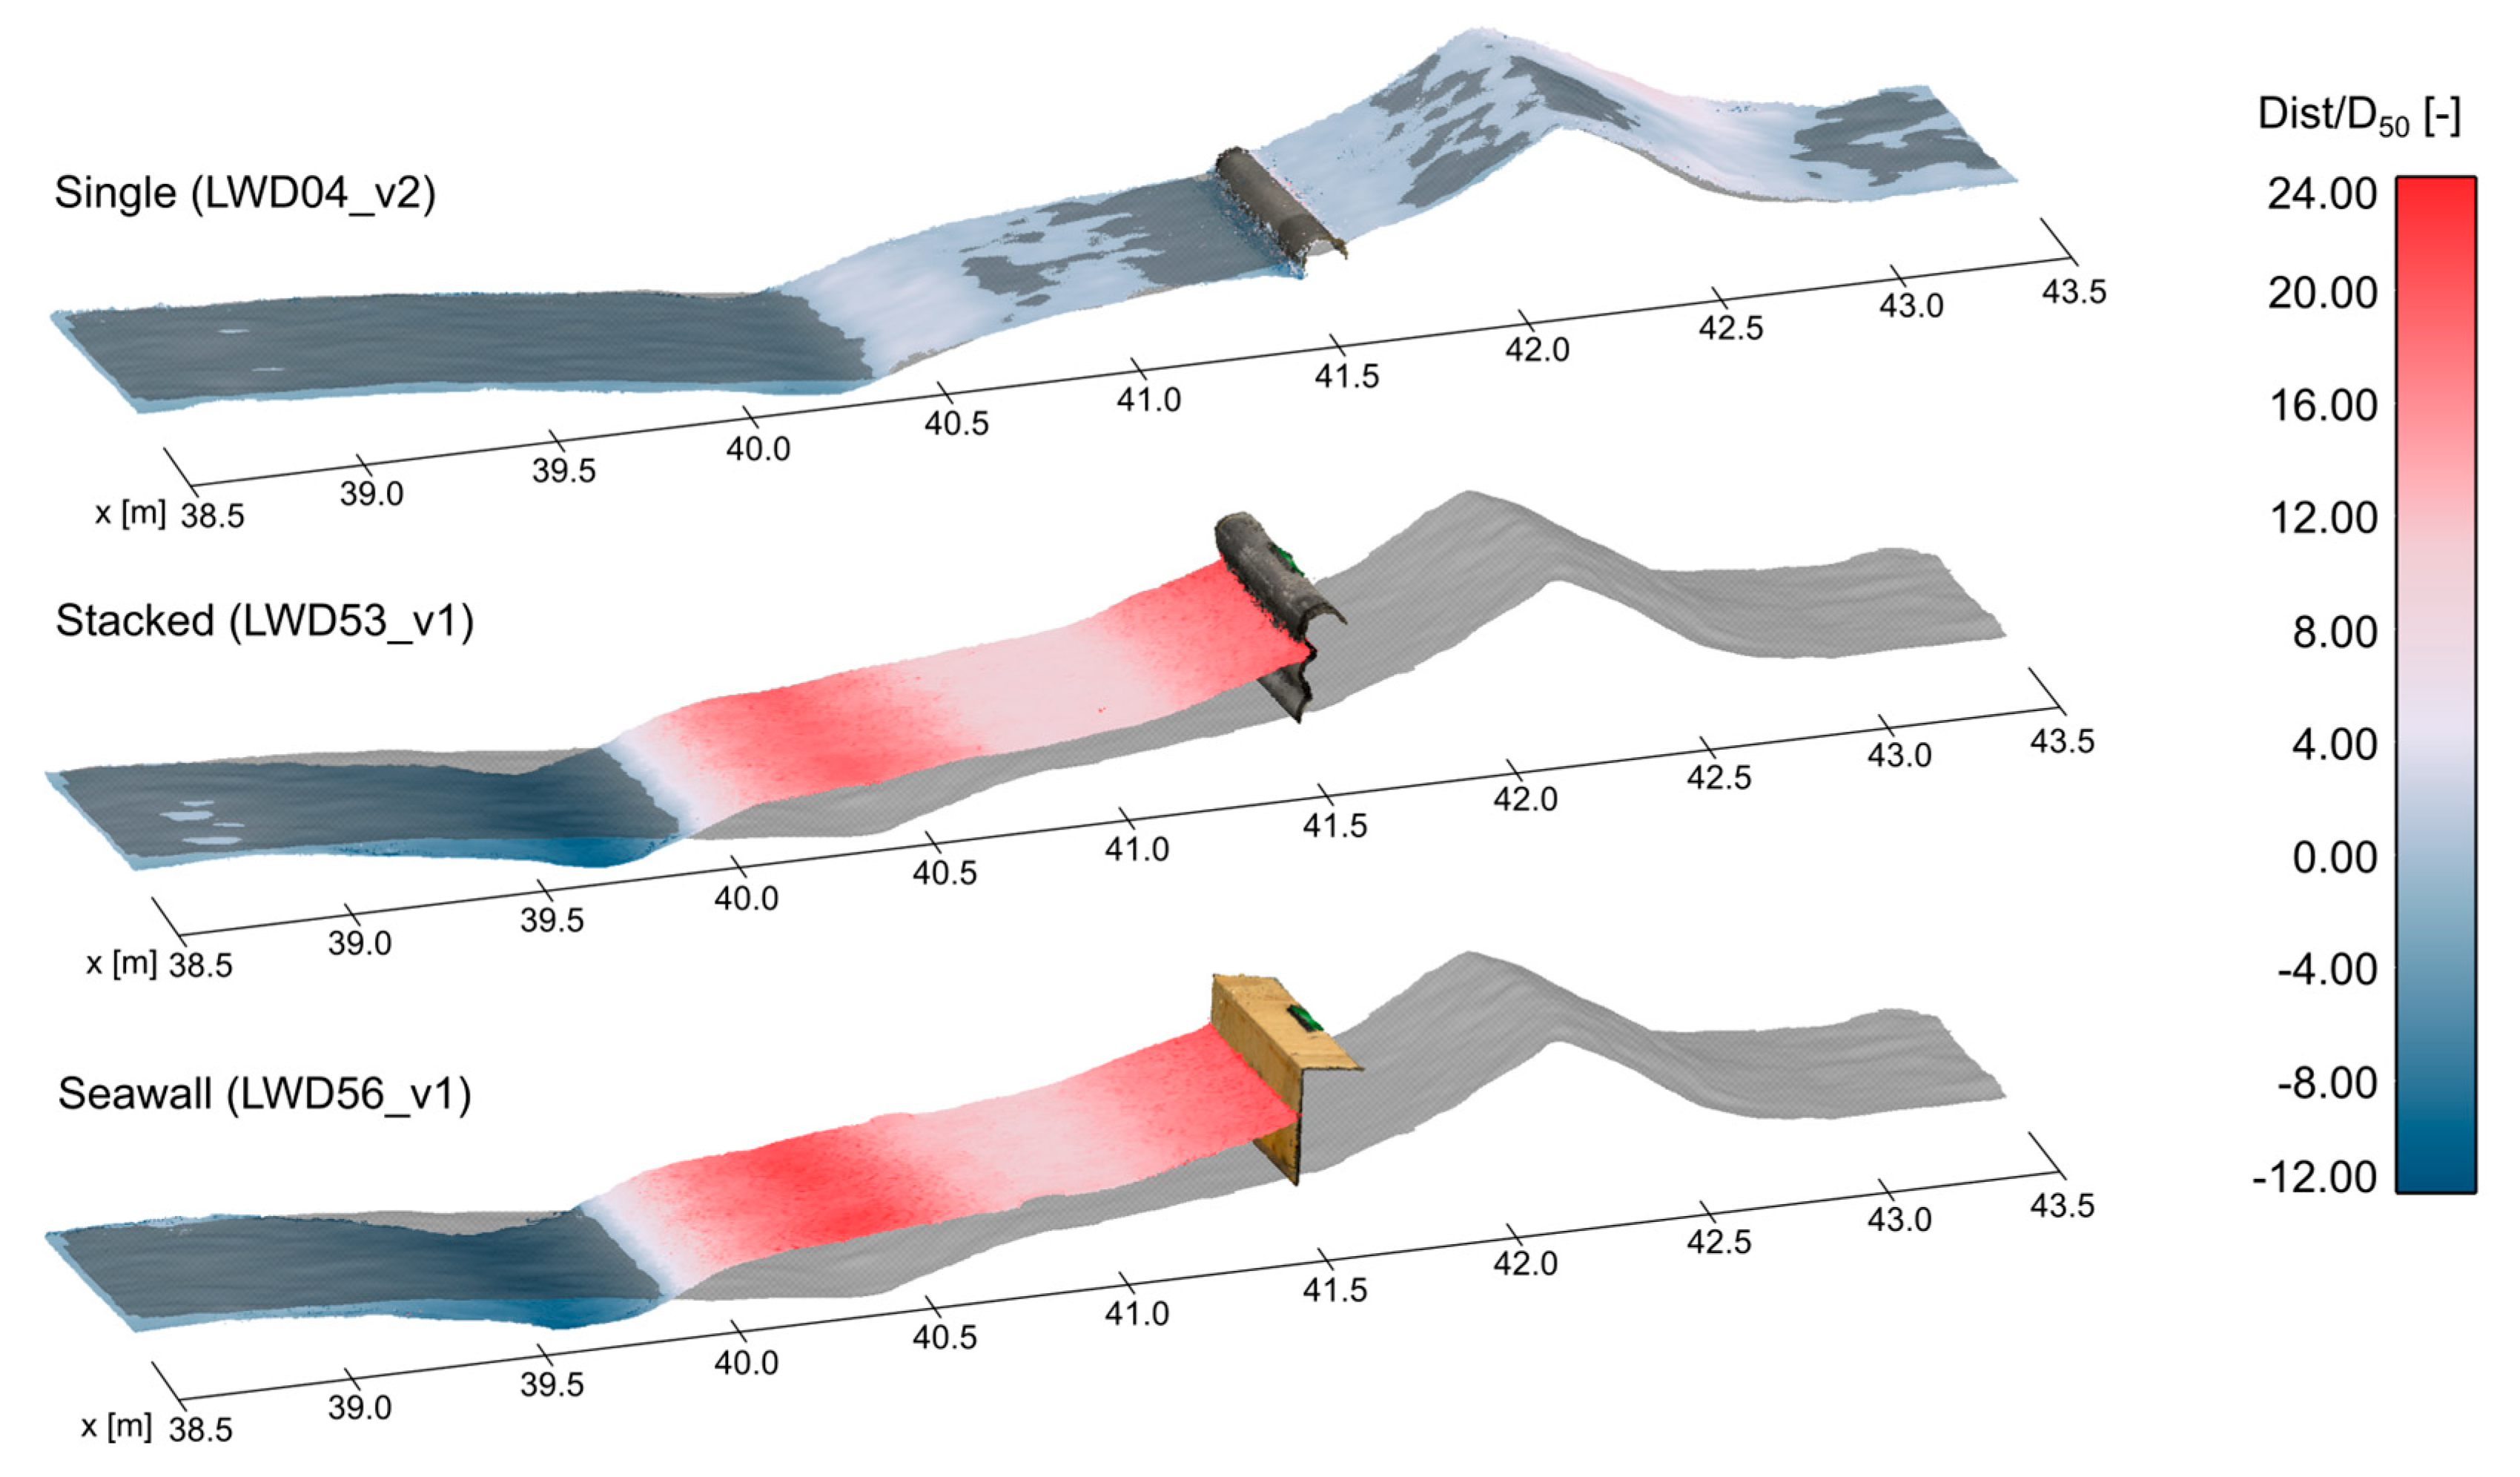
  • The single LWD only reduced erosion and, hence, stabilized the beach under the small wave conditions tested. For the Single configuration under large wave conditions, a small increase in eroded volume indicates a potential adverse effect with a reduction in beach stabilization.
  • Seawall and Stacked Log Wall significantly reduced the beach volume changes by blocking the sediment transport upslope. Despite the different surface geometries, the two wall structures showed near-identical effects on the beach morphology.
Reflection:
  • Under the smallest wave conditions tested, all three structures significantly increased the reflection of the beach with no structures.
  • For the medium and large wave conditions, the presence of the Single LWD positively reduced the beach reflection.
  • Stacked and Seawall structures increased the reflection under the large wave conditions and did not have a significant effect under the medium wave conditions tested.

Author Contributions

Conceptualization, P.F., J.W. and I.N.; formal analysis, J.W.; investigation, P.F. and J.W.; methodology, P.F., J.W., I.N., N.G., A.C. and A.M.; visualization, P.F.; project administration, J.W.; funding acquisition, I.N.; supervision, I.N., N.G., A.C. and A.M.; resources, A.C.; writing—original draft, P.F.; writing—review and editing, J.W., I.N., N.G., A.C. and A.M. All authors have read and agreed to the published version of the manuscript.

Funding

We acknowledge support from the German Research Foundation and the Open Access Publication Funds of Technische Universität Braunschweig and funding for the experimental test program through grant-in-aid awarded to Ioan Nistor from OCRE-NRC.

Acknowledgments

We gratefully acknowledge the Ocean, Coastal, and River Engineering (OCRE) Department at the National Research Council of Canada, Ottawa, for providing the research facility for the physical modeling of this study. Specifically, the help and support of the technical staff at the OCRE-NRC are highly appreciated.

Conflicts of Interest

The authors declare no conflict of interest.

References

  1. Barnard, B. Developing a Guidance Document for Puget Sound Marine Shorelines. In Puget Sound Shorelines and the Impacts of Armoring, Proceedings of a State of the Science Workshop, CA, USA, May 2009; Shipman, H., Dethier, M.N., Gelfenbaum, G., Fresh, K.L., Dinicola, R.S., Eds.; 2010; pp. 205–212. Available online: https://pubs.usgs.gov/sir/2010/5254/pdf/sir20105254_chap21.pdf (accessed on 28 June 2021).
  2. Temmerman, S.; Meire, P.; Bouma, T.J.; Herman, P.; Ysebaert, T.; De Vriend, H.J. Ecosystem-based coastal defence in the face of global change. Nat. Cell Biol. 2013, 504, 79–83. [Google Scholar] [CrossRef]
  3. Kraus, N.C.; McDougal, W.G. The Effects of Seawalls on the Beach: Part I, An Updated Literature Review. J. Coast. Res. 1996, 12, 691–701. [Google Scholar]
  4. Zelo, I.; Shipman, H.; Brennan, J. Alternative Bank Protection Methods for Puget Sound Shorelines; Shorelines and Environmental Assistance Program, Washington Department of Ecology: Olympia, WA, USA, 2000; Publication # 00-06-012; Available online: https://chapter.ser.org/wp-content/blogs.dir/18/files/2012/08/WDOE_alt_shoreline_protection.pdf (accessed on 28 June 2021).
  5. Gittman, R.K.; Scyphers, S.B.; Smith, C.S.; Neylan, I.P.; Grabowski, J.H. Ecological Consequences of Shoreline Hardening: A Meta-Analysis. BioScience 2016, 66, 763–773. [Google Scholar] [CrossRef] [Green Version]
  6. Dethier, M.N.; Raymond, W.W.; McBride, A.N.; Toft, J.D.; Cordell, J.R.; Ogston, A.S.; Heerhartz, S.M.; Berry, H.D. Multiscale impacts of armoring on Salish Sea shorelines: Evidence for cumulative and threshold effects. Estuar. Coast. Shelf Sci. 2016, 175, 106–117. [Google Scholar] [CrossRef]
  7. Narayan, S.; Beck, M.; Reguero, B.; Losada, I.J.; Van Wesenbeeck, B.; Pontee, N.; Sanchirico, J.N.; Ingram, J.C.; Lange, G.M.; Burks-Copes, K.A. The Effectiveness, Costs and Coastal Protection Benefits of Natural and Nature-Based Defences. PLoS ONE 2016, 11, e0154735. [Google Scholar] [CrossRef] [Green Version]
  8. Pontee, N.; Narayan, S.; Beck, M.; Hosking, A.H. Nature-based solutions: Lessons from around the world. Proc. Inst. Civ. Eng. Marit. Eng. 2016, 169, 29–36. [Google Scholar] [CrossRef]
  9. Kabisch, N.; Frantzeskaki, N.; Pauleit, S.; Naumann, S.; Davis, M.; Artmann, M.; Haase, D.; Knapp, S.; Korn, H.; Stadler, J.; et al. Nature-based solutions to climate change mitigation and adaptation in urban areas: Perspectives on indicators, knowledge gaps, barriers, and opportunities for action. Ecol. Soc. 2016, 21. [Google Scholar] [CrossRef] [Green Version]
  10. Bridges, T.S.; Wagner, P.W.; Burks-Copes, K.A.; Bates, M.E.; Collier, Z.A.; Fischenich, C.J.; Gailani, J.Z.; Leuck, L.D.; Piercy, C.D.; Rosati, J.D.; et al. Use of Natural and Nature-Based Features (NNBF) for Coastal Resilience; ERDC SR-15-1; U.S. Army Engi-neer Research and Development Center, Environmental Laboratory, Coastal and Hydraulics Laboratory: Vicksburg, MS, USA, 2015.
  11. Keimer, K.; Schürenkamp, D.; Mieschke, F.; Kosmalla, V.; Lojek, O.; Goseberg, N. Ecohydraulics of Surrogate Salt Marshes for Coastal Protection: Wave–Vegetation Interaction and Related Hydrodynamics on Vegetated Foreshores at Sea Dikes. J. Waterw. Port Coast. Ocean Eng. 2021. [Google Scholar] [CrossRef]
  12. Liu, J.; Kutschke, S.; Keimer, K.; Kosmalla, V.; Schürenkamp, D.; Goseberg, N.; Böl, M. Experimental characterisation and three-dimensional modelling of Elymus for the assessment of ecosystem services. Ecol. Eng. 2021, 166, 106233. [Google Scholar] [CrossRef]
  13. Eichmanns, C.; Schüttrumpf, H. Investigating Changes in Aeolian Sediment Transport at Coastal Dunes and Sand Trapping Fences: A Field Study on the German Coast. J. Mar. Sci. Eng. 2020, 8, 1012. [Google Scholar] [CrossRef]
  14. Dao, H.T.; Hofland, B.; Stive, M.J.F.; Mai, T. Experimental Assessment of the Flow Resistance of Coastal Wooden Fences. Water 2020, 12, 1910. [Google Scholar] [CrossRef]
  15. Winterwerp, J.C.; Albers, T.; Anthony, E.J.; Friess, D.A.; Gijón Mancheño, A.; Moseley, K.; Muhari, A.; Naipal, S.; Noordermeer, J.; Oost, A.; et al. Managing erosion of mangrove-mud coasts with permeable dams–lessons learned. Ecol. Eng. 2020, 158, 10607. [Google Scholar] [CrossRef]
  16. Johannessen, J.; MacLennan, A.; Blue, A.; Waggoner, J.; Williams, S.; Gerstel, W.; Barnard, R.; Carman, R.; Shipman, H. The Aquatic Habitat Guidelines Program: Olympia. In Marine Shoreline Design Guidelines; Washington Department of Fish and Wildlife: Washington, DC, USA, 2014. Available online: https://wdfw.wa.gov/sites/default/files/publications/01583/wdfw01583.pdf (accessed on 28 June 2021).
  17. Wilson, J.L. The Efficacy and Design of Coastal Protection Using Large Woody Debris. Master’s Thesis, University of Ottawa, Ottawa, ON, Canada, October 2020. [Google Scholar]
  18. A Braudrick, C.; E Grant, G. Transport and deposition of large woody debris in streams: A flume experiment. Geomorphology 2001, 41, 263–283. [Google Scholar] [CrossRef]
  19. Eamer, J.B.; Walker, I.J. Quantifying sand storage capacity of large woody debris on beaches using LiDAR. Geomorphology 2010, 118, 33–47. [Google Scholar] [CrossRef]
  20. Harmon, M.E.; Franklin, J.F.; Swanson, F.J.; Sollins, P.; Gregory, S.V.; Lattin, J.D.; Anderson, N.H.; Cline, S.P.; Aumen, N.G.; Sedell, J.R.; et al. Ecology of Coarse Woody Debris in Temperate Ecosystems. Adv. Ecol. Res. 1986, 15, 133–302. [Google Scholar]
  21. Grilliot, M.J.; Walker, I.J.; Bauer, B.O. Airflow Dynamics over a Beach and Foredune System with Large Woody Debris. GeoScience 2018, 8, 147. [Google Scholar] [CrossRef] [Green Version]
  22. Grilliot, M.J.; Walker, I.J.; Bauer, B.O. Aeolian sand transport and deposition patterns within a large woody debris matrix fronting a foredune. Geomorphology 2019, 338, 1–15. [Google Scholar] [CrossRef]
  23. Kennedy, D.; Woods, J.L. The influence of coarse woody debris on gravel beach geomorphology. Geomorphology 2012, 159–160, 106–115. [Google Scholar] [CrossRef]
  24. Heathfield, D.K.; Walker, I.J. Analysis of coastal dune dynamics, shoreline position, and large woody debris at Wickaninnish Bay, Pacific Rim National Park, British Columbia. Can. J. Earth Sci. 2011, 48, 1185–1198. [Google Scholar] [CrossRef]
  25. Hood, G.W. Large Woody Debris Influences Vegetation Zonation in an Oligohaline Tidal Marsh. Estuaries Coast. 2007, 30, 441–450. [Google Scholar] [CrossRef]
  26. Guttman, E.S. Characterizing the Backshore Vegetation of Puget Sound. Master’s Thesis, Prescott College, Prescott, AZ, USA, December 2009. [Google Scholar]
  27. Gerstel, W.J.; Brown, J.F. Alternative Shoreline Stabilization Evaluation Project: Final Report; Technical Report for Puget Sound Action Team: Washington, DC, USA, September 2006; Available online: https://salishsearestoration.org/images/b/b2/Gerstel_%26_Brown_2006_alternative_shoreline_stabilization.pdf (accessed on 28 June 2021).
  28. Nichols, K. A Landowner‘s Guide to Protecting Shoreline Ecosystems; The Washington State Aquatic Habitat Guidelines Program: Washington, DC, USA, May 2014. [Google Scholar]
  29. Chapman, M.; Underwood, A. Evaluation of ecological engineering of “armoured” shorelines to improve their value as habitat. J. Exp. Mar. Biol. Ecol. 2011, 400, 302–313. [Google Scholar] [CrossRef]
  30. Allsop, N.W.H. Sea Walls: A Literature Review; Report No. EX 1490; Technical Report for Hydraulics Research; Hydraulics Research Station: Wallingford, UK, 1986. [Google Scholar]
  31. Allsop, N.W.H.; Hettiarachchi, S.S.L. Reflections from Coastal Structures. Coast. Eng. 1989, 782–794. [Google Scholar] [CrossRef]
  32. Zanuttigh, B.; van der Meer, J.W. Wave Reflection from Coastal Structures in Design Conditions. Coast. Eng. 2008, 55, 771–779. [Google Scholar] [CrossRef]
  33. Miselis, P.L. Beach Profile and Seawall Interaction During Severe Storm Conditions. Master’s Thesis, University of Florida, Florida, FL, USA, 1994. [Google Scholar]
  34. Moody, P.M. Laboratory Study of the Effect of Sea Walls on Beach Erosion. Master’s Thesis, Massachusetts Institute of Technology, Cambridge, MA, USA, 1996. [Google Scholar]
  35. Barnett, M.R.; Wang, H. Effects of a Vertical Seawall on Profile Response. Coast. Eng. 1989, 1493–1507. [Google Scholar] [CrossRef]
  36. Kamphuis, J.W.; Rakha, K.A.; Jui, J. Hydraulic Model Experiments on Seawalls. Coast. Eng. 1993. [Google Scholar] [CrossRef] [Green Version]
  37. Sato, S.; Tanaka, N.; Irie, I. Study on Scouring at the Foot of Coastal Structures. Coast. Eng. Jpn. 1969. [Google Scholar] [CrossRef]
  38. Hughes, S.A.; Fowler, J.E. Midscale Physical Model Validation for Scour at Coastal Structures; Technical Report CERC-90-8; Technical Report for Army Engineer Waterways Experiment Station and Coastal Engineering Research Center; Army Engineer Waterways Experiment Station and Coastal Engineering Research Center: Vicksburg, MS, USA, 1990. [Google Scholar]
  39. Fowler, J.E. Scour Problems and Methods for Prediction of Maximum Scour at Vertical Seawalls; Technical Report CERC-92-16; Coastal Engineering Research Center: Vicksburg, MS, USA, 1992. [Google Scholar]
  40. Plant, N.G.; Griggs, G.B. Interactions between Nearshore Processes and Beach Morphology Near a Seawall. J. Coast. Res. 1992, 8, 183–200. [Google Scholar]
  41. Weggel, J.R. Seawalls: The Need for Research, Dimensional Considerations and a Suggested Classification. J. Coast. Res. 1988, SI, 29–39. [Google Scholar]
  42. Ruggiero, P. Impacts of Shoreline Armoring on Sediment Dynamics. In Puget Sound Shorelines and the Impacts of Armoring, Proceedings of a State of the Science Workshop, May 2009; Shipman, H., Dethier, M.N., Gelfenbaum, G., Fresh, K.L., Dinicola, R.S., Eds.; U.S. Geological Survey: Menlo Park, CA, USA, 2010; pp. 2010–5254. [Google Scholar]
  43. Pilkey, O.H.; Wright, H.L.I. Seawalls Versus Beaches. J. Coast. Res. 1988, SI, 41–64. [Google Scholar]
  44. Sumer, B.M.; Fredsøe, J. The Mechanics of Scour in the Marine Environment; Advanced Series on Ocean Engineering 17; World Scientific: London, UK, 2002. [Google Scholar] [CrossRef]
  45. van der Werf, I.; van Gent, M.R.A. Gravel Beaches with Seawalls. Coast. Eng. 2010, 1, 1–15. [Google Scholar] [CrossRef] [Green Version]
  46. Salauddin, M.; Pearson, J.M. Wave overtopping and toe scouring at a plain vertical seawall with shingle foreshore: A physical model study. Ocean Eng. 2019, 171, 286–299. [Google Scholar] [CrossRef] [Green Version]
  47. Morgan, J.A.; Brogan, D.J.; Nelson, P. Application of Structure-from-Motion photogrammetry in laboratory flumes. Geomorphology 2017, 276, 125–143. [Google Scholar] [CrossRef] [Green Version]
  48. van der Meer, J.W.; Pilarczyk, K.W. Dynamic stability of rock slopes and gravel beaches. Coast. Eng. 1986, 1, 124. [Google Scholar] [CrossRef]
  49. Powell, K.A. Predicting Short Term Profile Response for Shingle Beaches; Technical Report for Hydraulics Research; Hydraulics Research Station: Wallingford, UK, 1990. [Google Scholar]
  50. Atladottir, A. Experimental Investigation of Wave-Induced Morphological Changes of Gravel Beaches. Master’s Thesis, University of Ottawa, Ottawa, ON, Canada, July 2008. [Google Scholar]
  51. Lague, D.; Brodu, N.; Leroux, J. Accurate 3D comparison of complex topography with terrestrial laser scanner: Application to the Rangitikei canyon (N-Z). ISPRS J. Photogramm. Remote Sens. 2013, 82, 10–26. [Google Scholar] [CrossRef] [Green Version]
  52. Mansard, E.; Funke, E. The Measurement of Incident and Reflected Spectra Using a Least Squares Method. Coast. Eng. 1980, 154–172. [Google Scholar] [CrossRef] [Green Version]
  53. Seelig, W.N.; Ahrens, J.P. Estimation of Wave Reflection and Energy Dissipation Coefficients for Beaches, Revetments, and Breakwater; Coastal Engineering Research Center: Washington, DC, USA, 1981. [Google Scholar] [CrossRef] [Green Version]
  54. Postma, G.M. Wave Reflection From Rock Slopes Under Random Wave Attack. Master’s Thesis, Delft University of Technology, Delft, The Netherlands, 1989. [Google Scholar]
  55. Hughes, S.A.; Fowler, J.E. Estimating Wave-Induced Kinematics at Sloping Structures. J. Waterw. Port Coast. Ocean Eng. 1995, 121, 209–215. [Google Scholar] [CrossRef]
  56. Muttray, M.; Smith, J.M.; Oumeraci, H.; Oever, E.T. Wave Reflection and Wave Run-up at Rubble Mound Breakwaters; World Scientific: London, UK, 2007; pp. 4314–4324. [Google Scholar] [CrossRef]
  57. Salauddin, M.; Pearson, J.M. Experimental Study on Toe Scouring at Sloping Walls with Gravel Foreshores. J. Mar. Sci. Eng. 2019, 7, 198. [Google Scholar] [CrossRef] [Green Version]
Figure 1. (a) Top view and (b) side view of base test setup (Single) in 2D wave flume including instrumentation; (c) setup for Stacked configuration, and (d) Seawall including backfill behind structure.
Water 13 02020 g001
Figure 2. Experimental setup of gravel beach and instrumentation in steel flume with (a) model log made out of a PVC pipe with expandable end for the Single configuration, (b) three stacked model logs for the Stacked configuration and (c) a vertical plywood seawall at the SWL for the Seawall test configuration.
Water 13 02020 g002
Figure 3. (a) Differences between point clouds obtained with the FARO laser scanner and ones obtained using the SfM photogrammetry for the example test considered (LWD29_v1,Triple, Tp = 2.17 s, Hs = 0.15 m) in relation to mean sediment diameter (Dist/D50) and (b) surface densities (points/cm²) of points clouds obtained from FARO Laser Scanner and SfM photogrammetry.
Water 13 02020 g003
Figure 4. Segmenting of surface data into longitudinal slices of Δy = 0.05 m wide in preparation for volume comparison.
Water 13 02020 g004
Figure 5. Non-dimensionalized distance between initial gravel surface and ideal 1:8 sloping plane in relation to mean sediment diameter (D50 = 7.9 mm) for x = 38.5–41.58 m under (a) medium wave conditions with Tp = 2.17 s, Hs = 0.15 m and (b) large wave conditions with Tp = 2.51 s, Hs = 0.20 m.
Water 13 02020 g005
Figure 6. Relative distance (Dist/D50) between initial and equilibrium beach profile for the No Structures test under large waves conditions (LWD18_v2, Tp = 2.51 s, Hs = 0.20 m) with visible convex shape of the berm.
Water 13 02020 g006
Figure 7. Deviation from a uniform distribution of (a) eroded volume (VEr/VEr,equ), and (b) accreted volume (VAcc/VAcc,equ) over the width of the flume for all tests under medium wave conditions (Tp = 2.17 s, Hs = 0.15 m).
Water 13 02020 g007
Figure 8. Deviation from a uniform distribution of (a) eroded volume (VEr/VEr,equ), and (b) accreted volume (VAcc/VAcc,equ) over the width of the flume for all tests under large wave conditions (Tp = 2.51 s, Hs = 0.20 m).
Water 13 02020 g008
Figure 9. Beach profile changes for each structure configuration in relation to the beach profile with No Structures (grey) under small wave conditions (Tp = 1.78 s, Hs = 0.10 m).
Water 13 02020 g009
Figure 10. Beach profile changes for each structure configuration in relation to the beach profile with No Structures (grey) under medium wave conditions (Tp = 2.17 s, Hs = 0.15 m).
Water 13 02020 g010
Figure 11. Beach profile changes for each structure configuration in relation to the beach profile with No Structures (grey) under large wave conditions (Tp = 2.51 s, Hs = 0.20 m).
Water 13 02020 g011
Figure 12. Relative volumetric changes caused by each structure in relation to the beach with No Structures, divided into (a) eroded volume, and (b) accreted volume.
Water 13 02020 g012
Figure 13. Reflection coefficients for gravel beach without structures in comparison to predicted values from literature; beach slope approximated between −1.5 and 1.5 Hm0 for prediction equations.
Water 13 02020 g013
Figure 14. Relative reflection from each beach-structure type in relation to the beach with No Structures for all three tested wave conditions. Values determined from equilibrium profile.
Water 13 02020 g014
Table 1. Overview of test runs and associated parameters, used in this study.
Test NameStructure Significant   Wave   Height   H s   ( m ) Peak   Wave   Period   T p   ( s ) Surf   Similarity   ξ 0   ( ) Wave   Steepness   s   ( m )
LWD18_v2No Structures0.202.510.700.035
LWD16_v1No Structures0.152.170.700.031
LWD21_v1No Structures0.101.780.700.027
LWD04_v2Single0.202.510.700.035
LWD06_v1Single0.152.170.700.031
LWD08_v1Single0.101.780.700.027
LWD53_v1Stacked0.202.510.700.035
LWD54_v1Stacked0.152.170.700.031
LWD55_v1Stacked0.101.780.700.027
LWD56_v1Seawall0.202.510.700.035
LWD57_v1Seawall0.152.170.700.031
LWD58_v1Seawall0.101.780.700.027
Table 2. Documented reflection coefficients Cr for seawalls on beaches.
SchemeSeawallBeach WavesCr
[31] Allsop and Hettiarachchi (1988)Vertical with rock protection--20–40%
[33] Miselis (1994)Smooth, verticalSand;
d = 0.09 mm
Regular,
random
14–31%
[34] Moody (1996)Rubble-mound,
inclined
Sand;
d = 0.20 mm
Random10–40%
[57] Salauddin and Pearson (2019)Inclined (1:2)Gravel;
d = 2.1–4.2 mm
Random25–45%
Present studyVerticalGravel,
d = 7.9 mm
Random22–34%
Publisher’s Note: MDPI stays neutral with regard to jurisdictional claims in published maps and institutional affiliations.

