
Climate Justice Planning in Global South: Applying a Coupled Nature–Human Flood Risk Assessment Framework in a Case for Ho Chi Minh City, Vietnam


Abstract
:1. Introduction
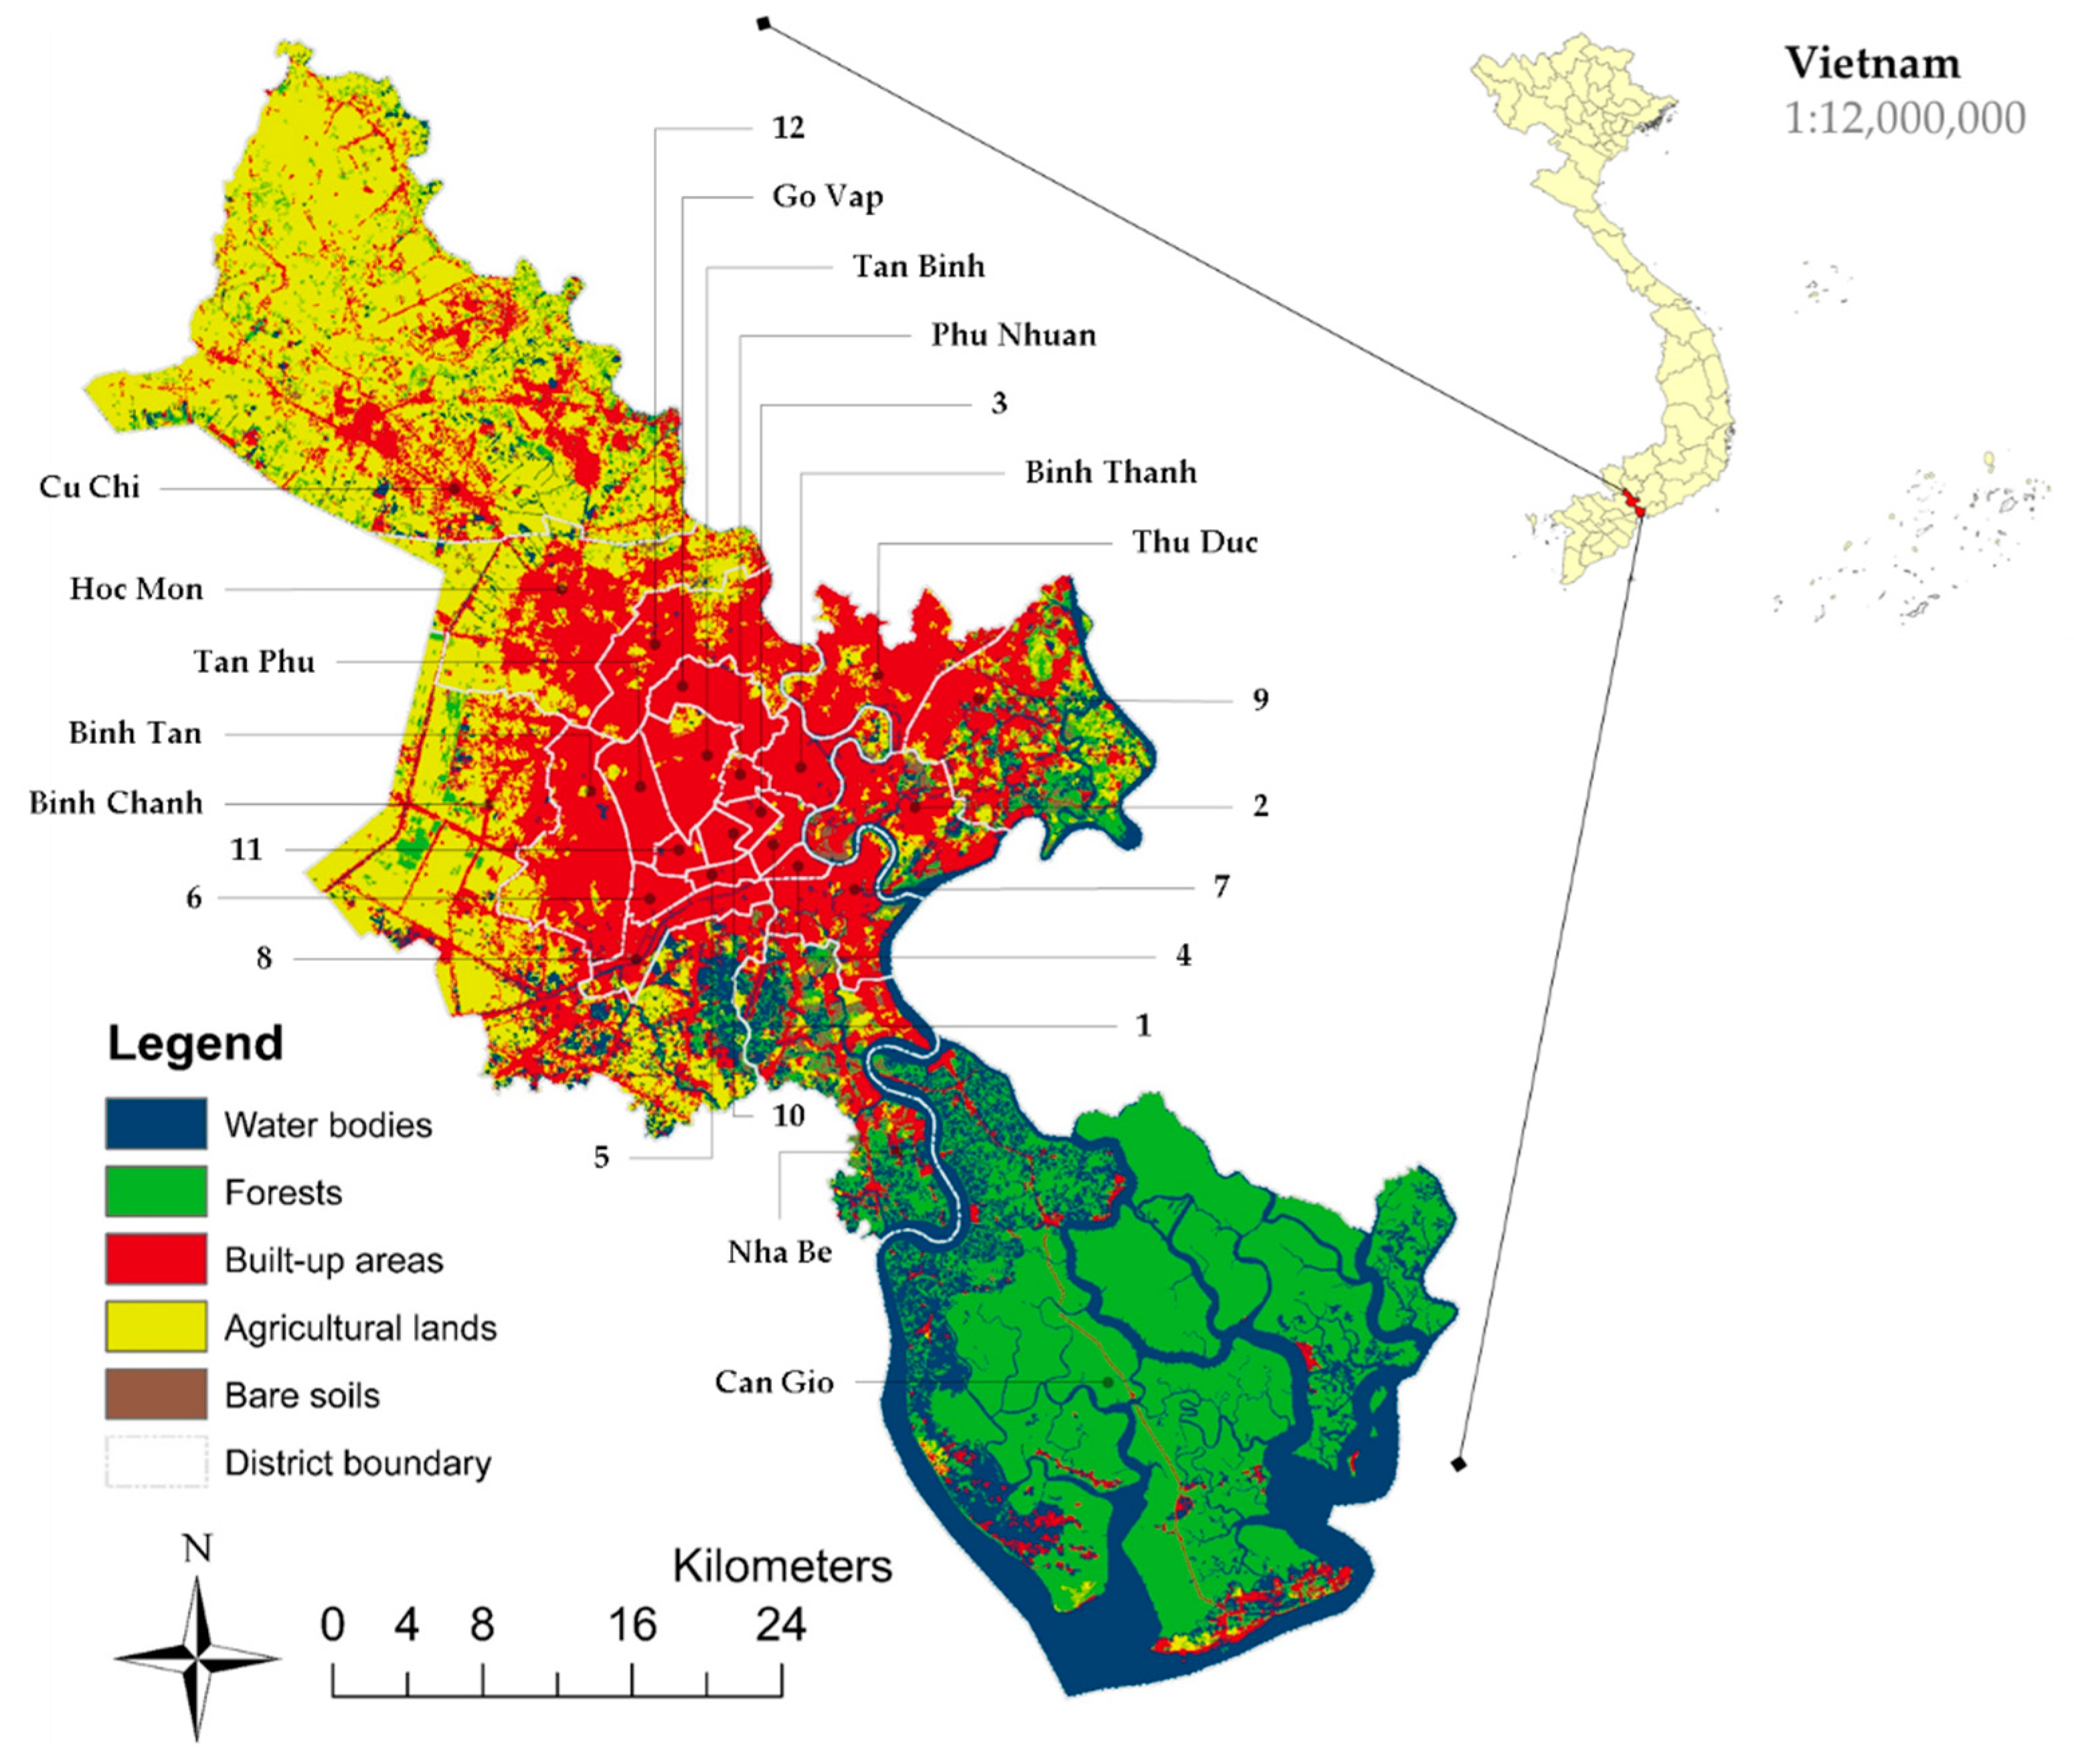
2. Study Area
3. Methods
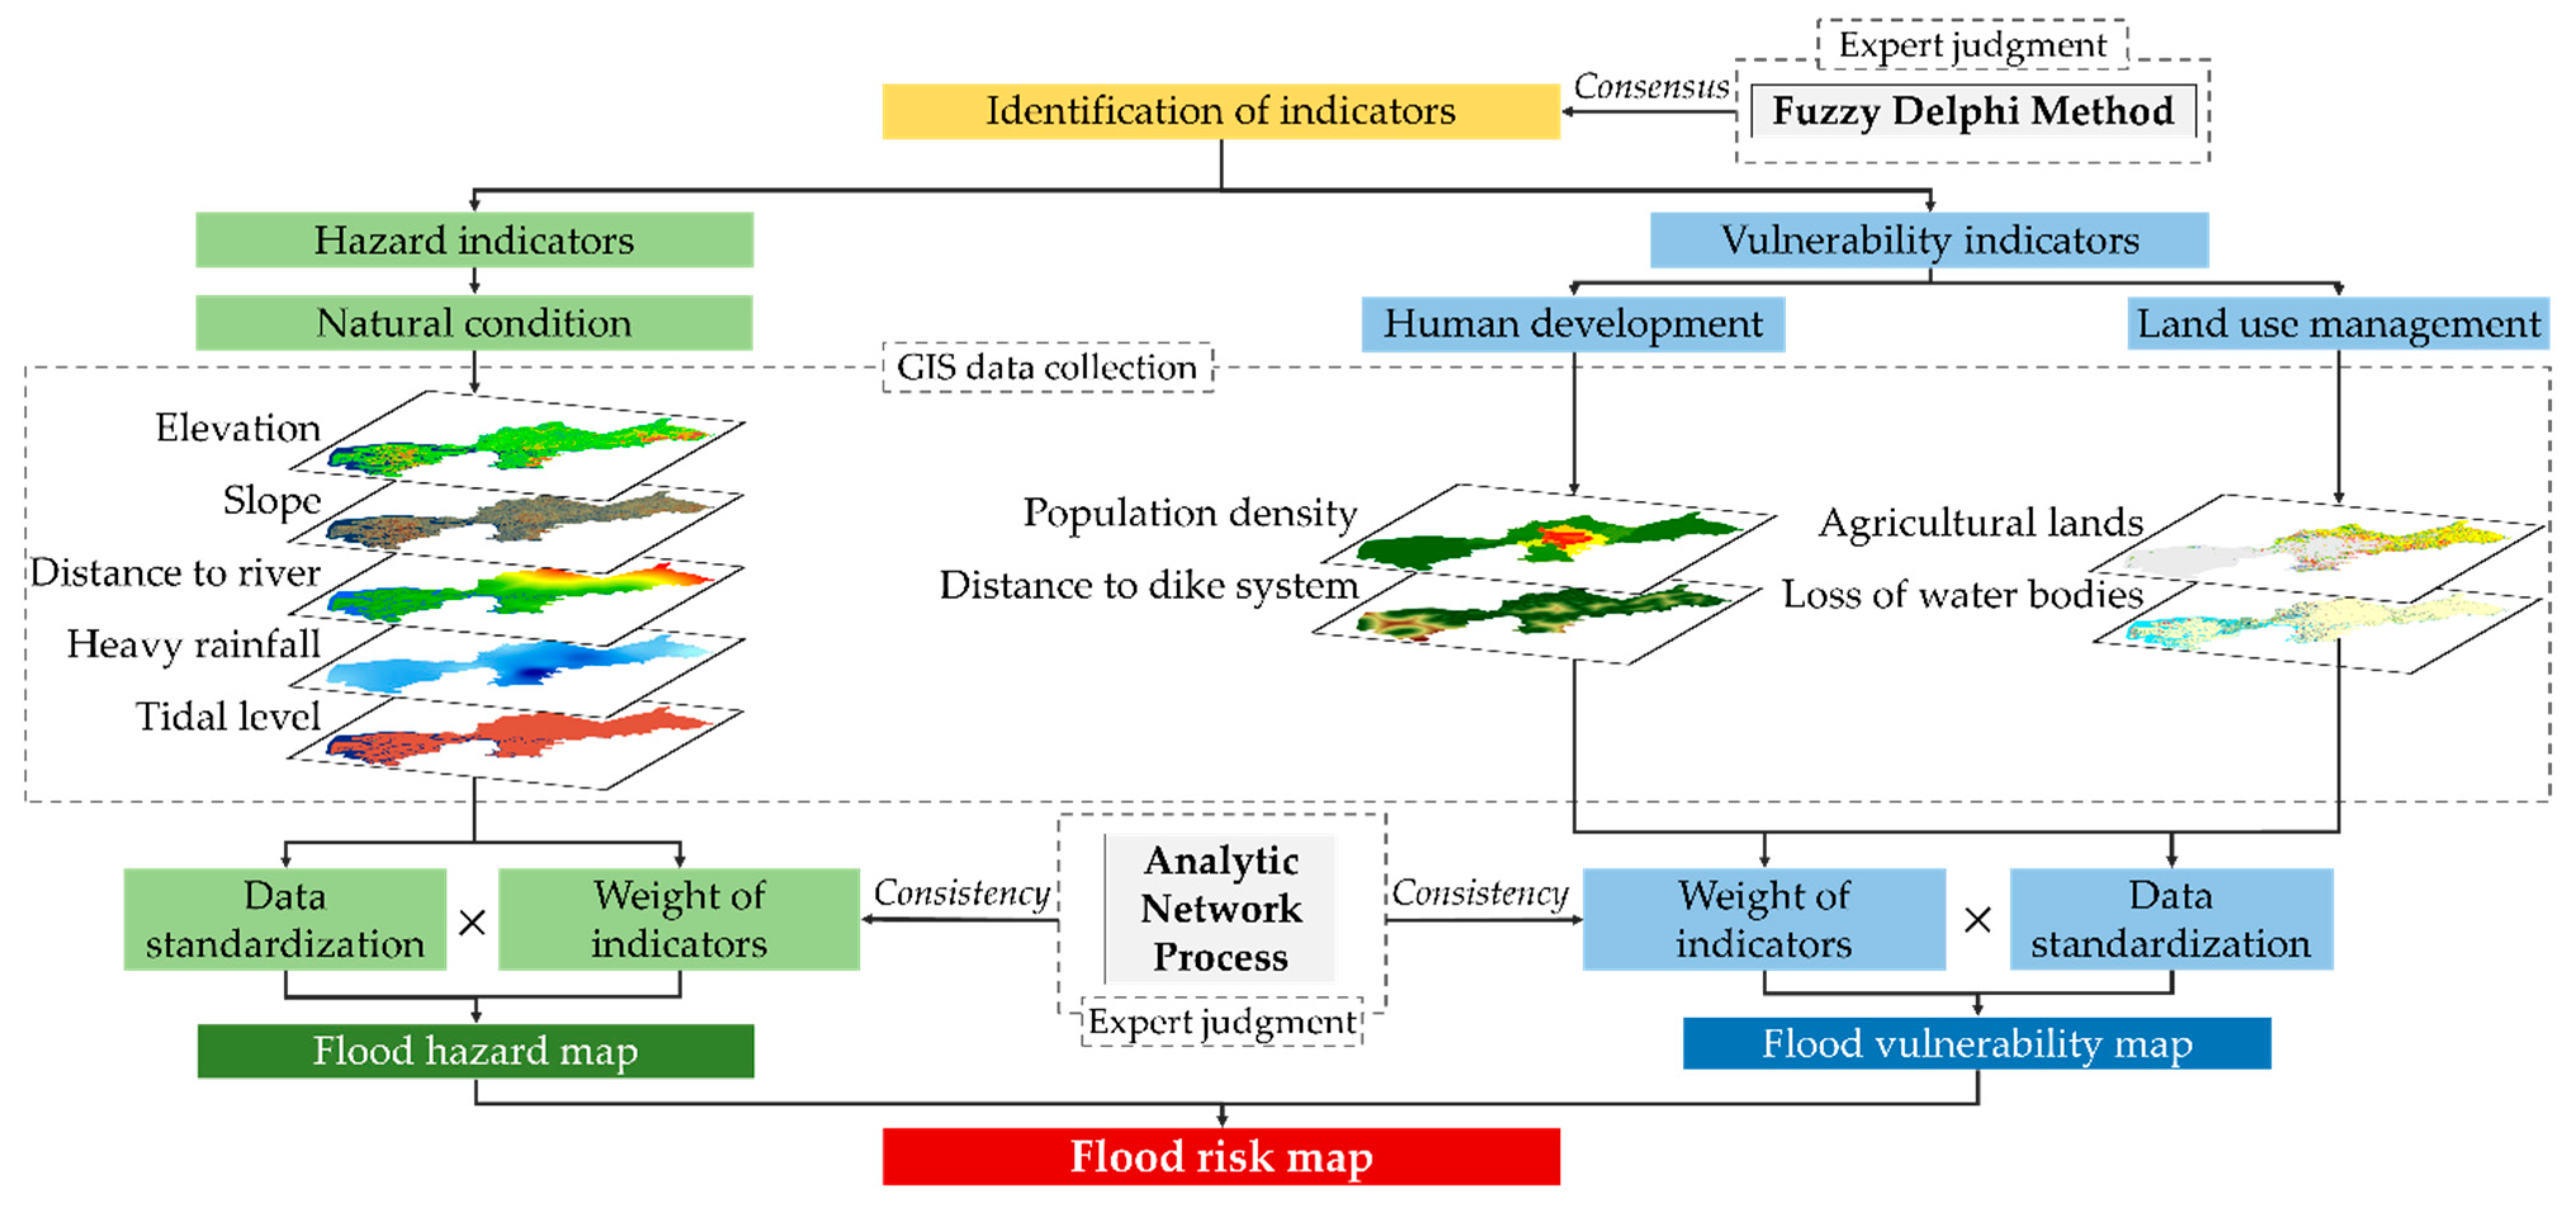
3.1. Coupled Nature–Human Flood Risk Assessment Framework

| Dimension | Indicator | Source | Justification (Flood-Related Relationship) | References |
|---|---|---|---|---|
| Natural condition | Elevation | NASA | Low-lying terrain is more likely to be flooded by water flowing from higher into lower altitude areas. | [4,48,49,50] |
| Slope | NASA | The slope affects the flow rate of the water. An area with a more rough slope causes the water to flow speedily where the slope is more gentle. | [18,51] | |
| Distance to river * | NASA | Areas further from the river basins have less possibility of floods, while overflowing water from major rivers often causes flooding in neighboring areas. | [49,51,52] | |
| Heavy rainfall * | CHMD | If natural watercourses beyond the coping capacity to convey the excess precipitation during heavy rains, flooding will occur and devastate the areas it sweeps through. | [42,53] | |
| Tidal level * | ICOE | Influenced by the semi-diurnal tidal waves and high flows from upstream rivers, the river basins are prone to inundation due to the overflow of high tide. | [24,54,55] | |
| Human development | Population growth rate | HCSO | In areas where the urbanization process is strongly perusing, the rapid population growth has both an effect on soil structure and vegetation and overloading the drainage system. | [56] |
| Population density * | HCSO | The increasing rate of population density along the riverine floodplain is observed positively related to the likelihood of flood vulnerability, leading to the expansion of the impervious area. | [2,41] | |
| Distance to dike system * | ICOE | Areas sheltered by dikes receive effectively physical and human protection from a hydraulic infrastructure in recurrent riverine flooding. | [57,58] | |
| Land use management | Forests | USGS | Forests function to prevent flooding from upstream rivers and mangroves to reduce the influence of tides from the sea, which pushes the rise of river water. | [59,60,61] |
| Loss of forest areas | USGS | Deforestation loses natural shields from the influence of floods. The intensity of floods occurs stronger in areas with deforestation. | [59] | |
| Agricultural lands | USGS | The temporary absorption of runoff on the surface of agricultural land through the permeability of the soil structure increases the likelihood of flood reduction. | [62] | |
| Loss of agricultural lands | USGS | The agricultural land of HCMC noticeably decreased between 2010 and 2017. The encroachment reduces the agricultural land and increases problems overwhelming urban floods. | [63] | |
| Loss of water bodies * | USGS | The encroachment of construction schemes along water bodies on natural water bodies is directly proportional to the occurrence of floods. This could be due to the loss of natural flooding protection systems. | [64] |
3.2. Establish Stakeholder-Driven Ranked Indicators
3.3. Selecting Indicators Using Fuzzy Delphi Method
3.4. Prepare Spatial Layers of Indicators
3.4.1. Natural Condition
3.4.2. Human Development
3.4.3. Land Use Management
3.5. Computing Stakeholder-Driven Weighted Indicators
3.6. Mapping Flood Hazard, Flood Vulnerability, and Flood Risk
4. Results
4.1. Fuzzy Delphi Method
4.2. Analytic Network Process
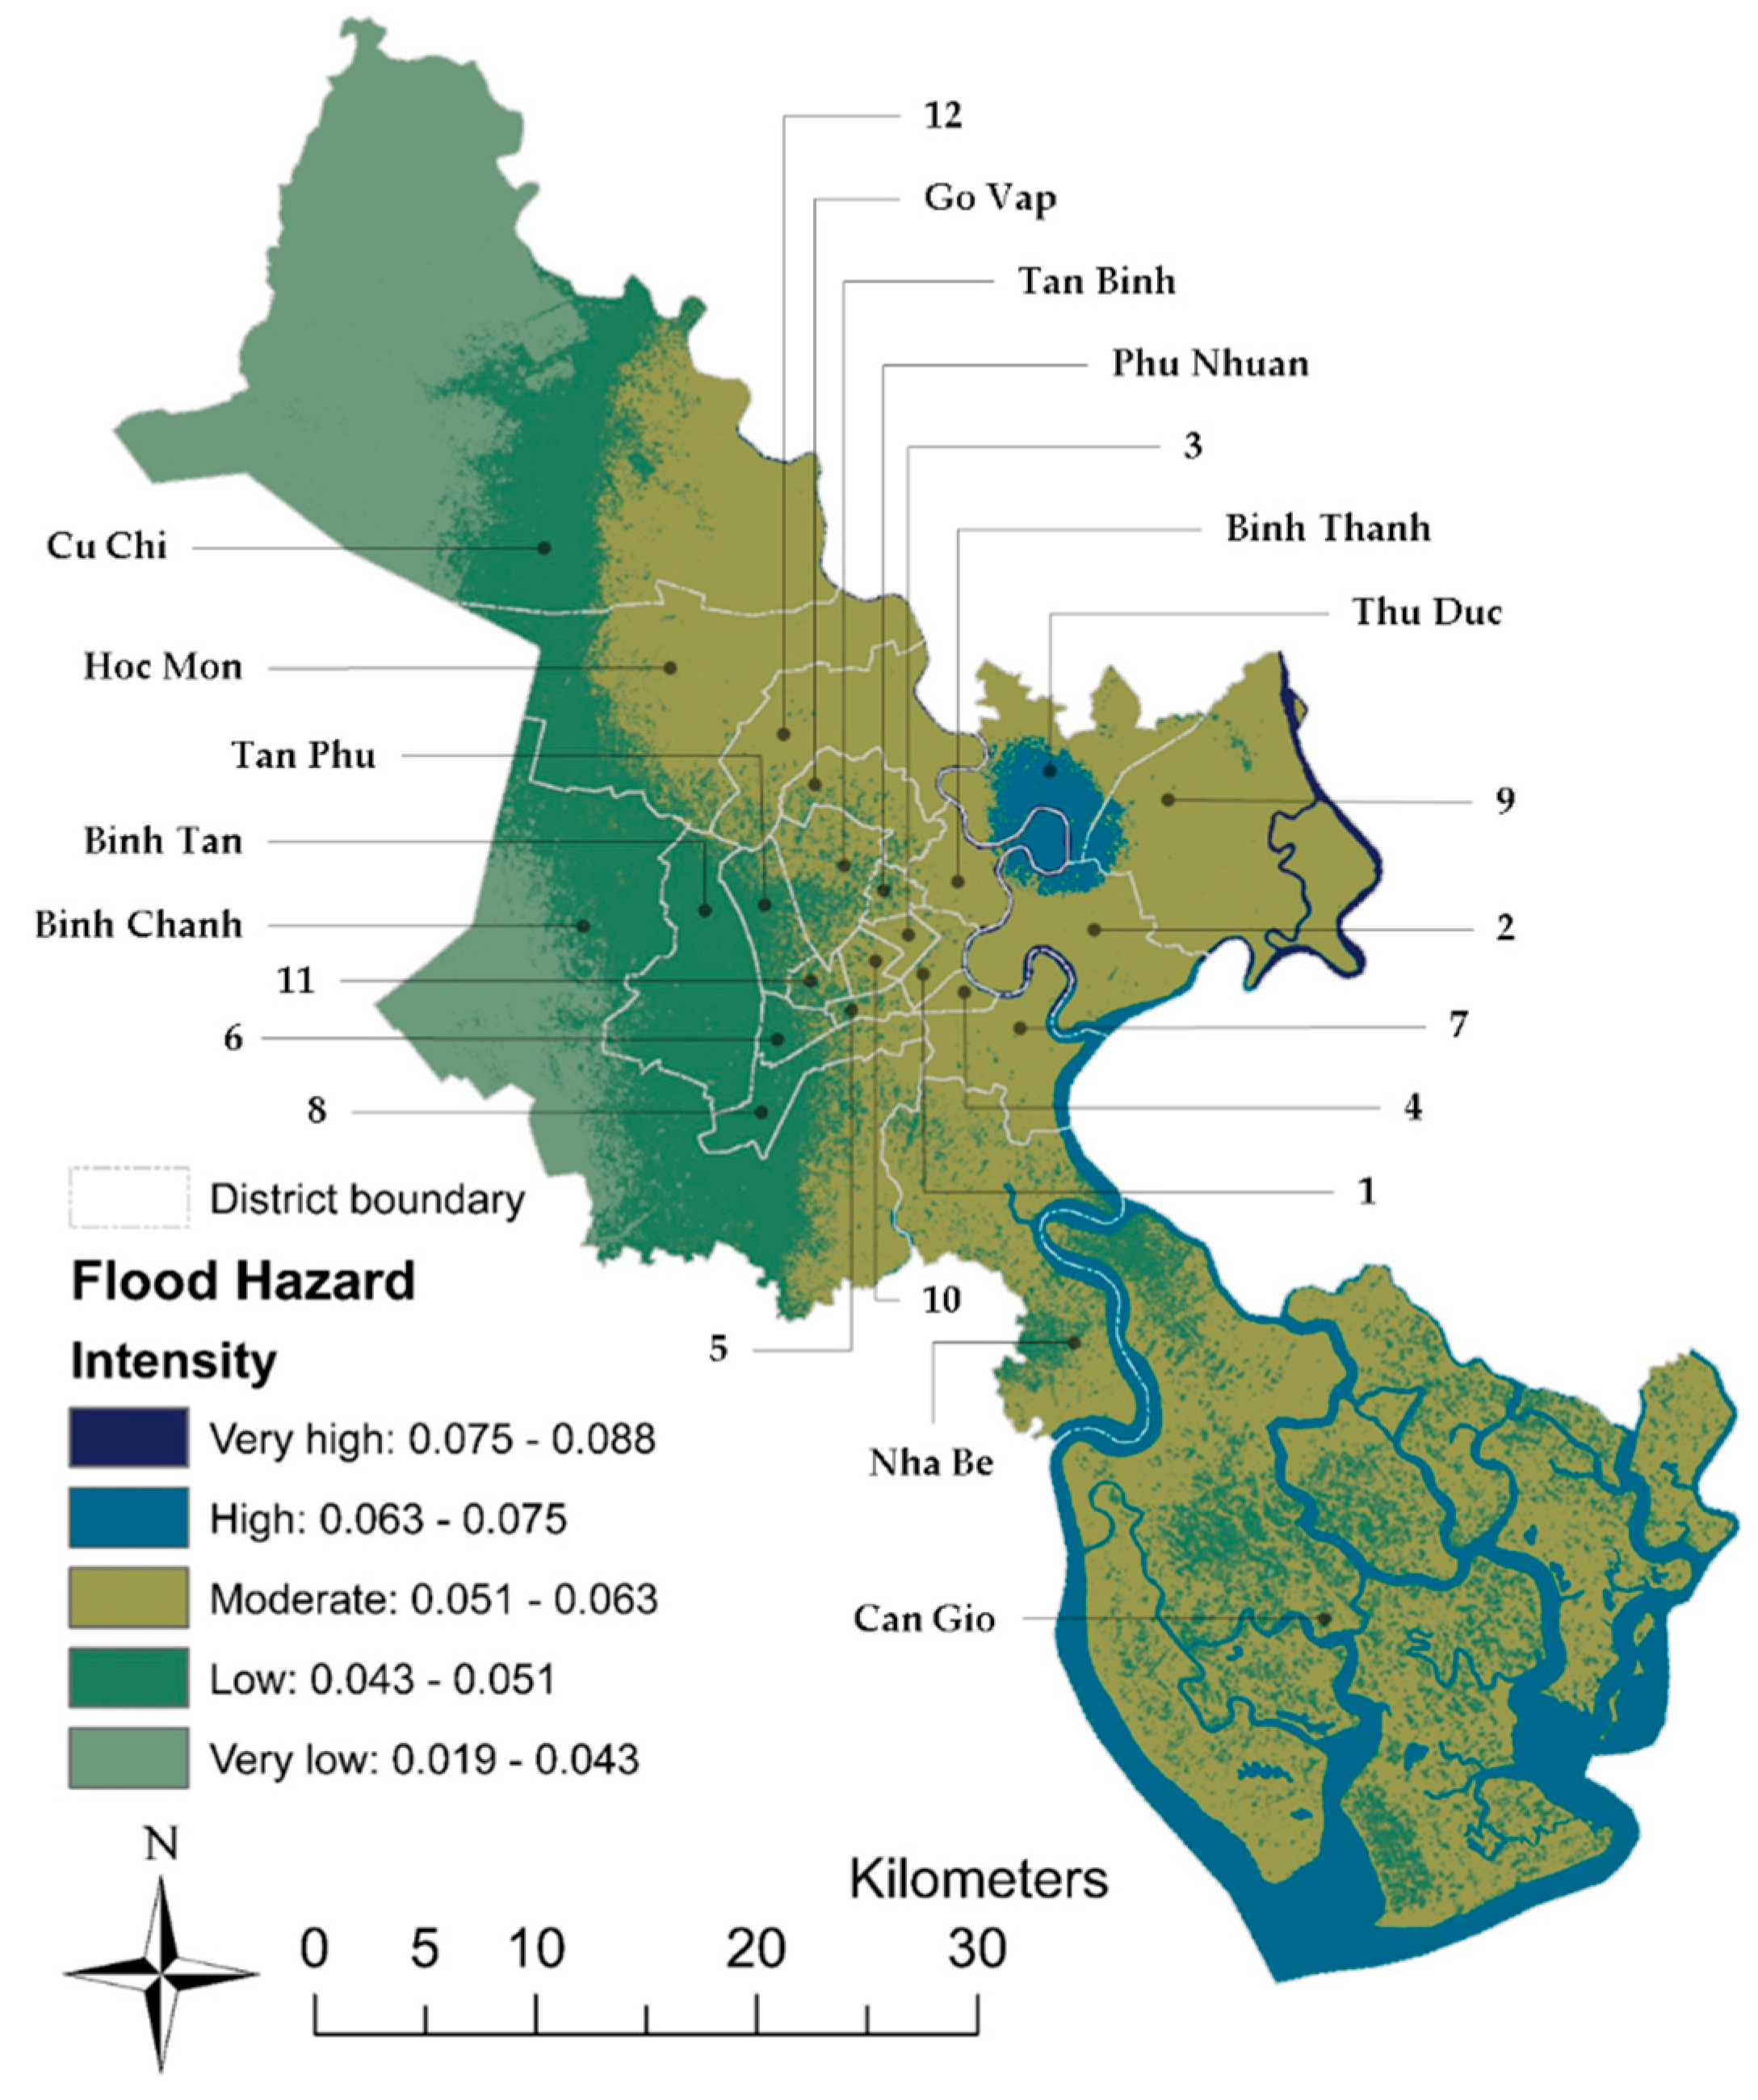
4.3. Flood Hazard Distribution
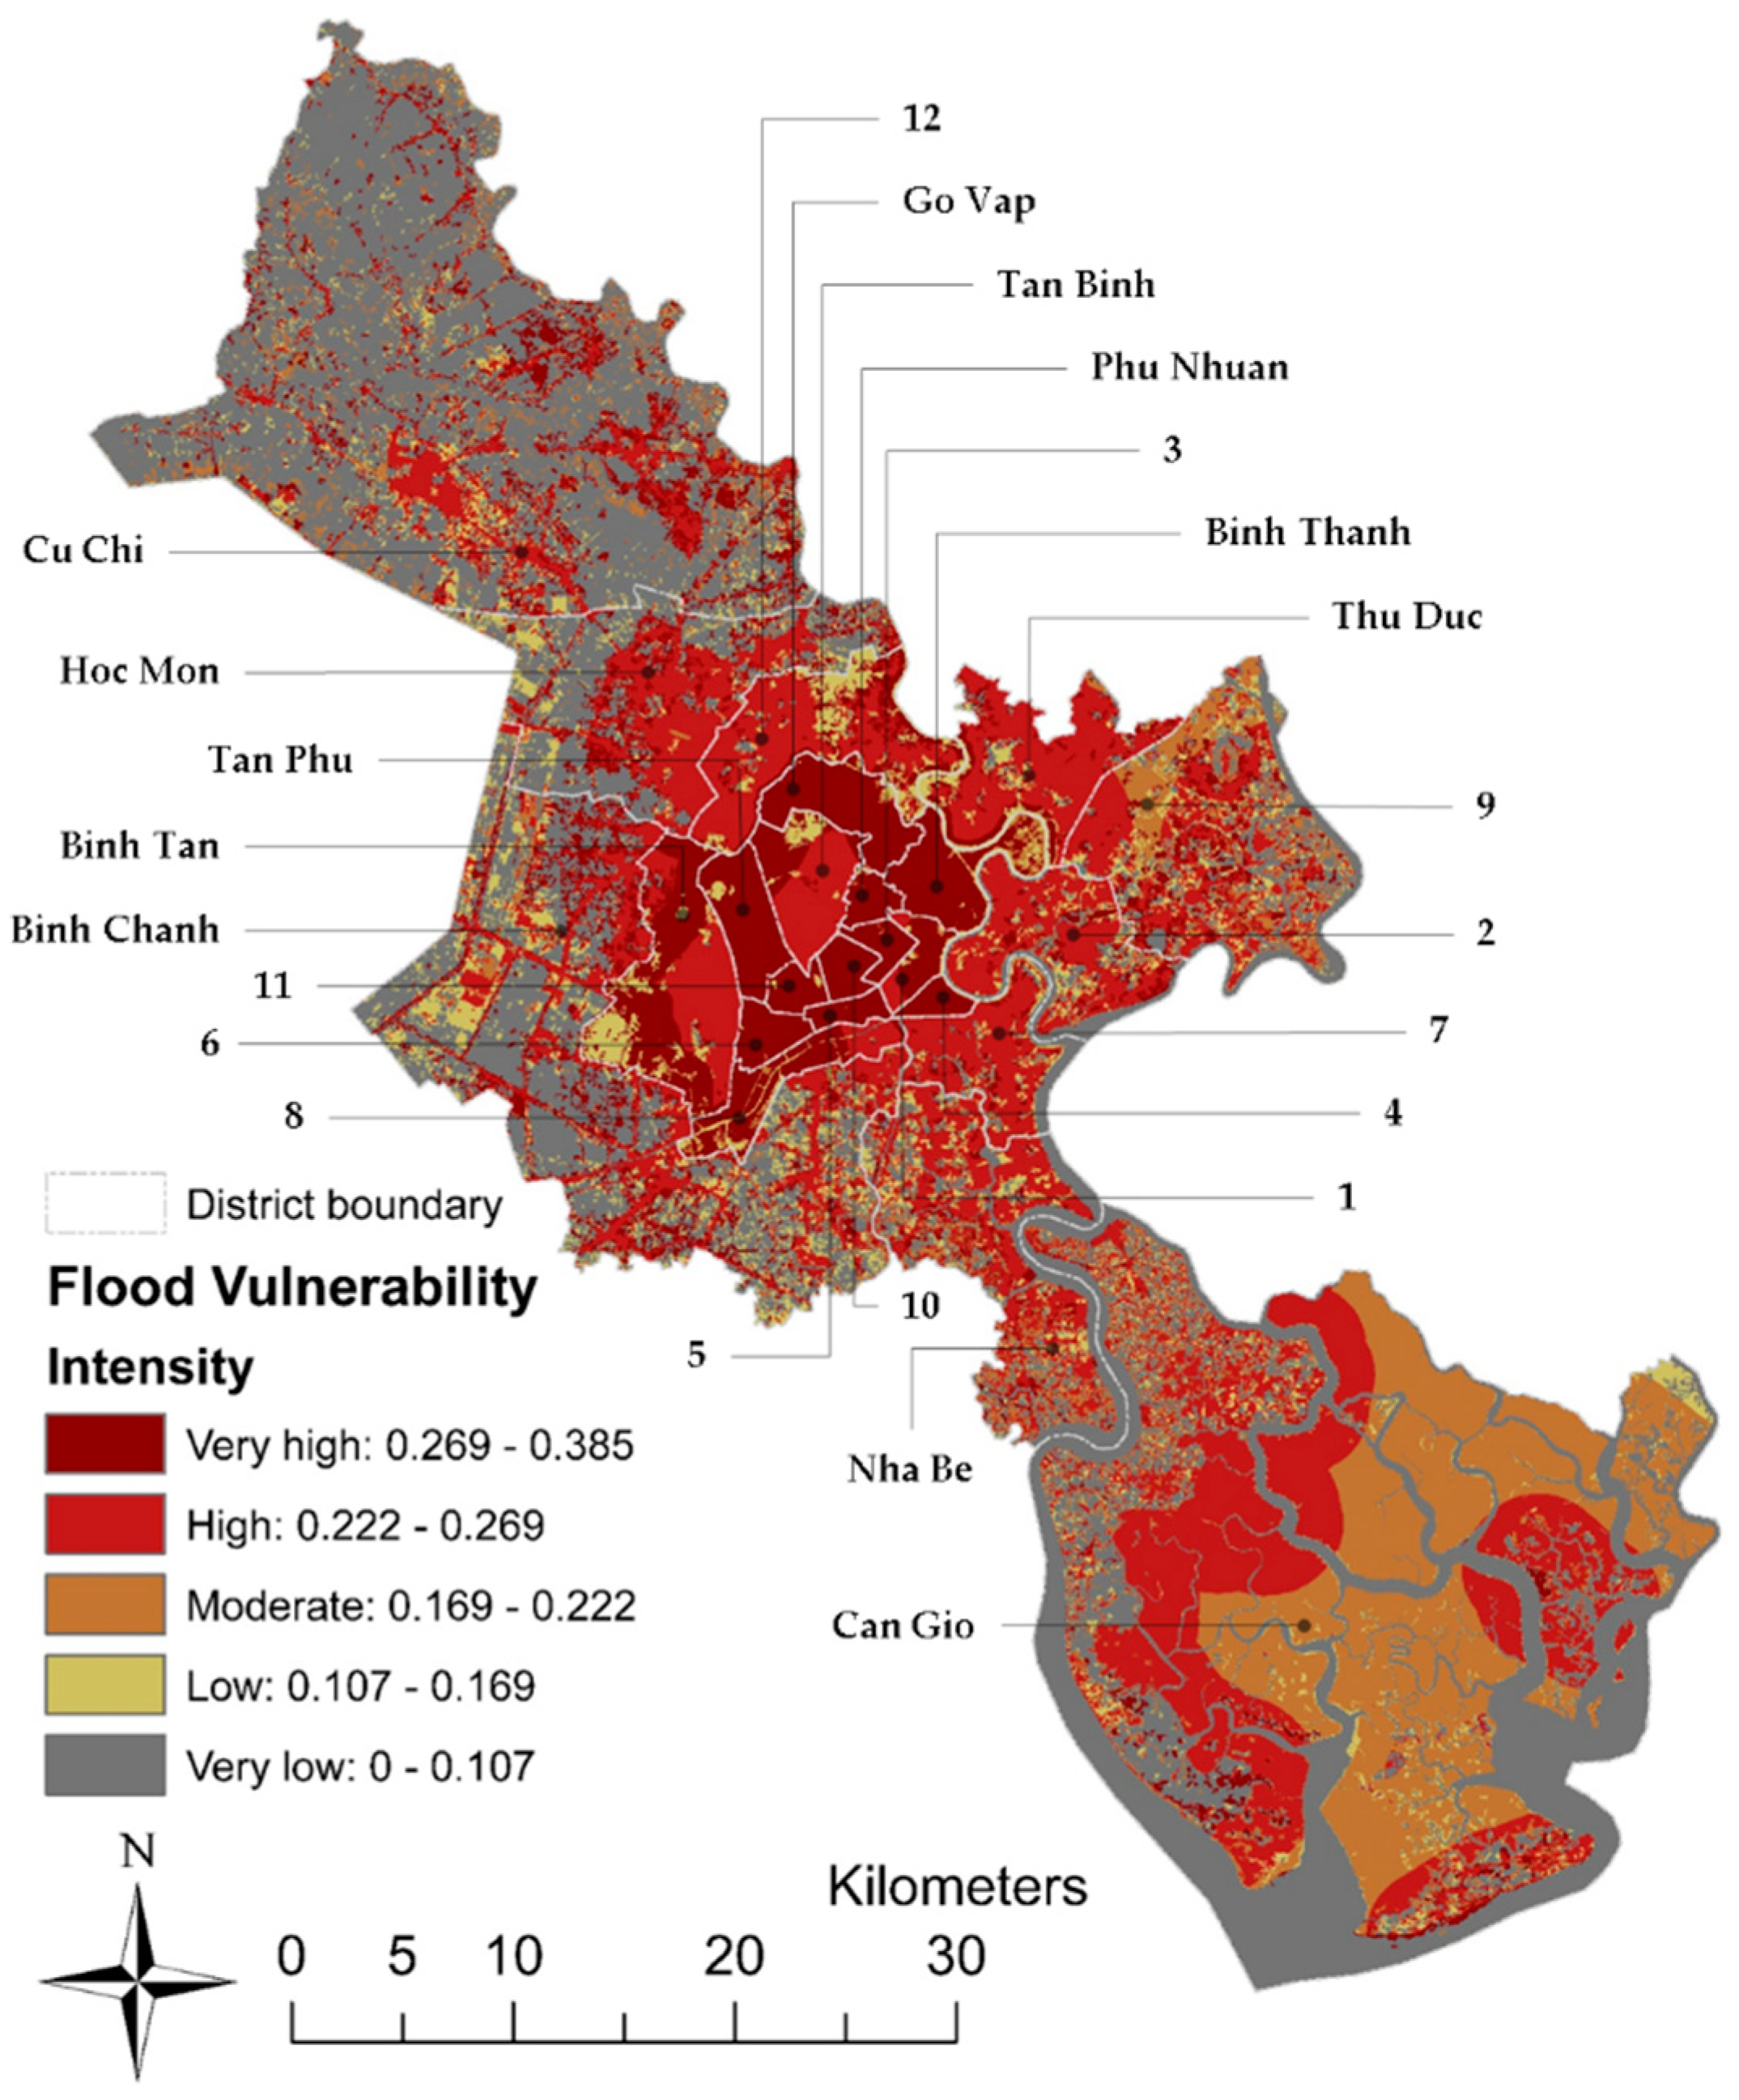
4.4. Flood Vulnerability Distribution
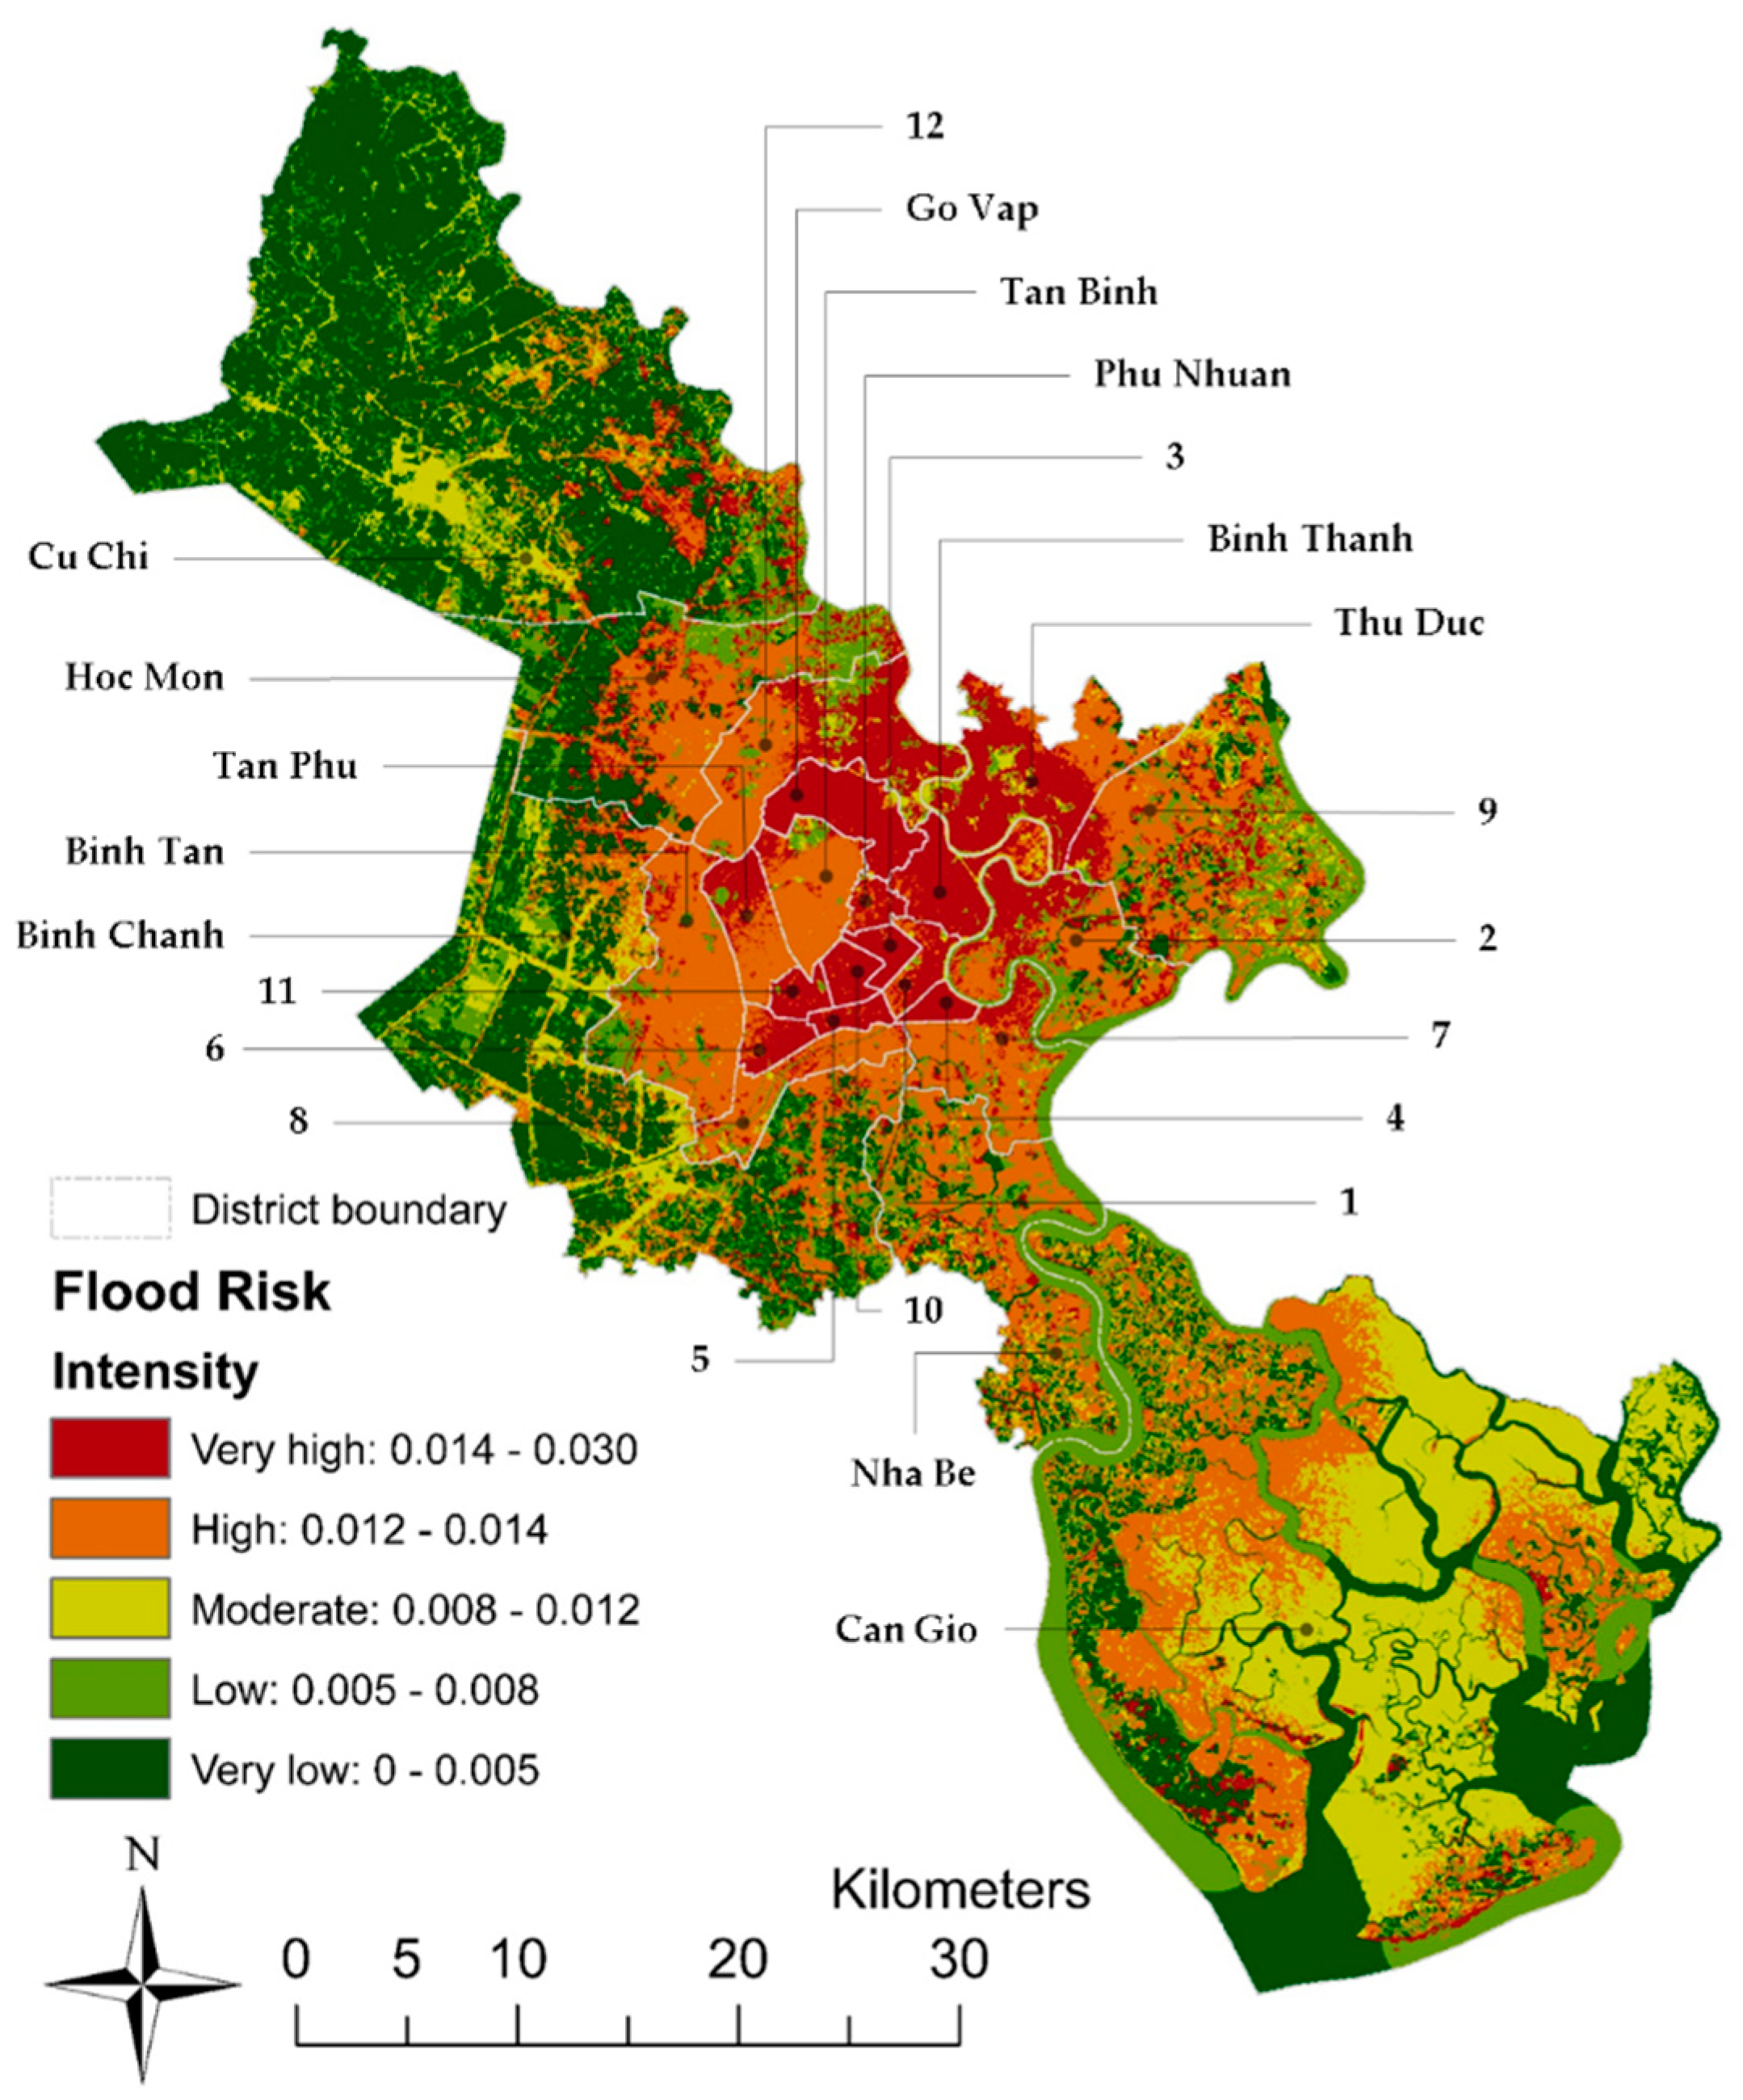
4.5. Flood Risk Distribution
5. Discussion
5.1. Contribution to Flood Assessment Methods
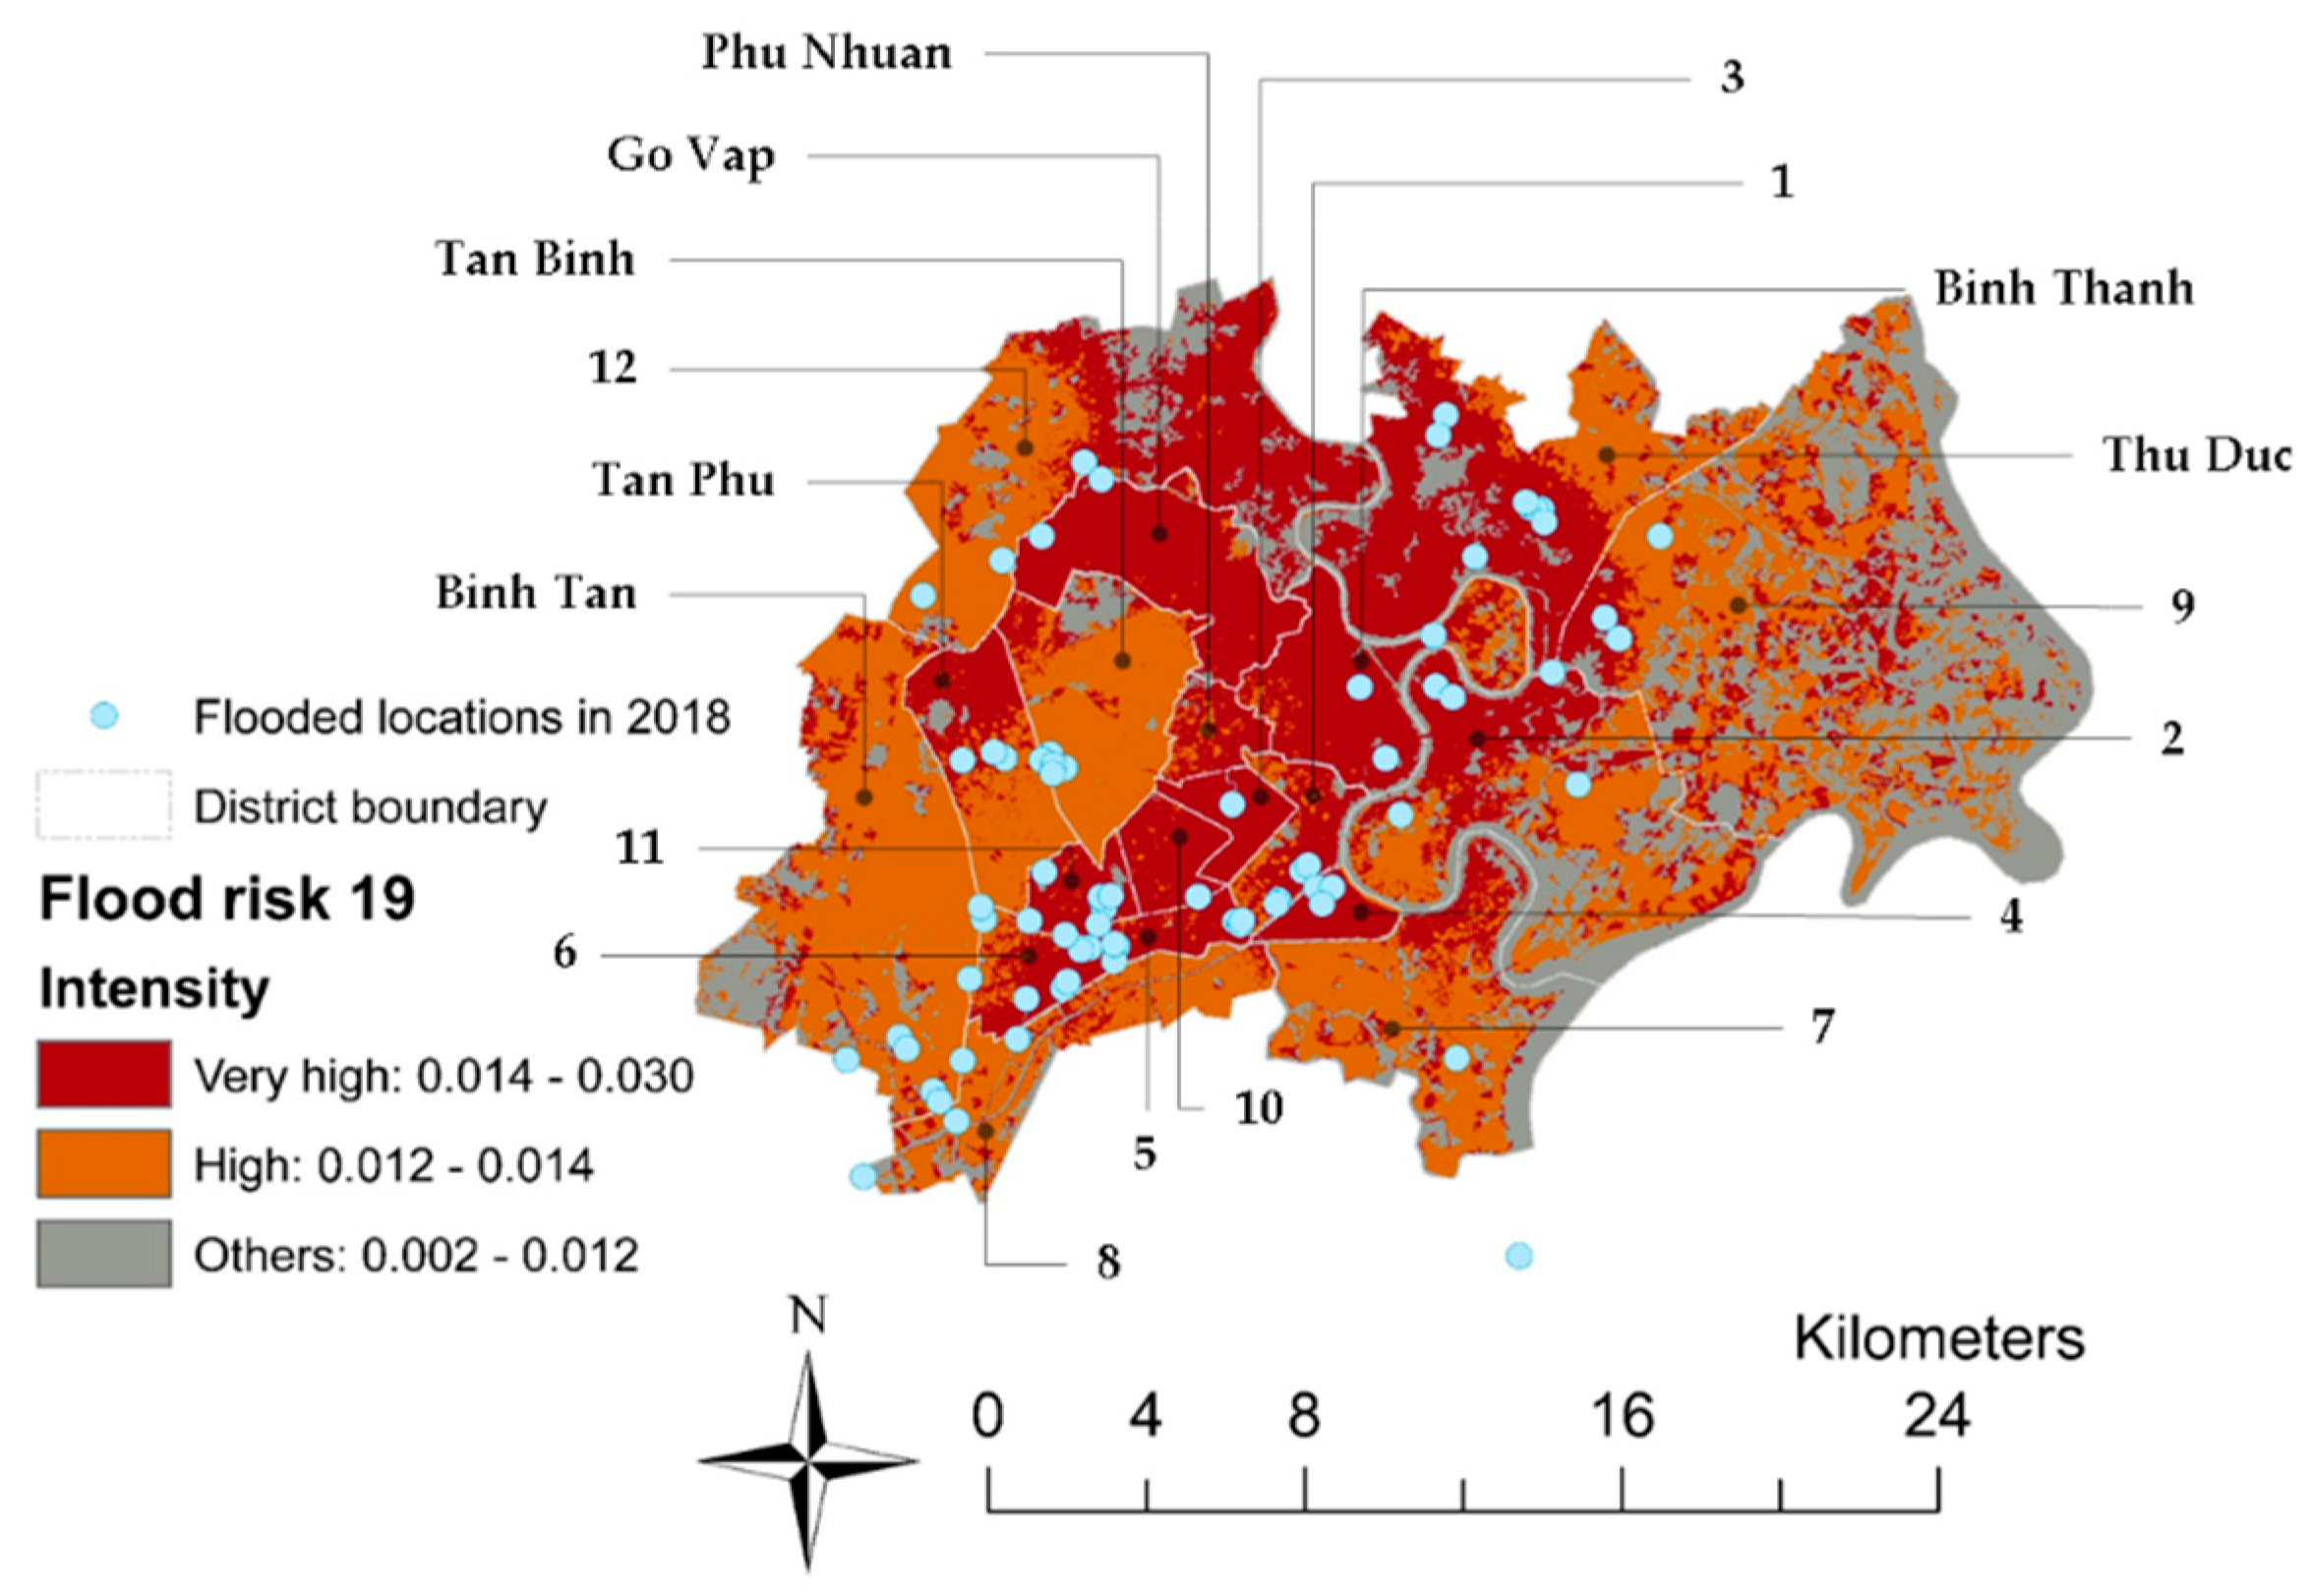
5.2. Correlation between Flood Hazard and Flood Vulnerability Maps
5.3. Implications for Climate Justice Planning
5.4. Implications for Urban Resilience Strategies
6. Conclusions
Author Contributions
Funding
Institutional Review Board Statement
Informed Consent Statement
Data Availability Statement
Acknowledgments
Conflicts of Interest
References
- Kontgis, C.; Schneider, A.; Fox, J.; Saksena, S.; Spencer, J.H.; Castrence, M. Monitoring peri-urbanization in the greater Ho Chi Minh City metropolitan area. Appl. Geogr. 2014, 53, 377–388. [Google Scholar] [CrossRef]
- Son, N.-T.; Chen, C.-F.; Chen, C.-R.; Thanh, B.-X.; Vuong, T.-H. Assessment of urbanization and urban heat islands in Ho Chi Minh City, Vietnam using Landsat data. Sustain. Cities Soc. 2017, 30, 150–161. [Google Scholar] [CrossRef]
- Huynh, D. The misuse of urban planning in Ho Chi Minh City. Habitat Int. 2015, 48, 11–19. [Google Scholar] [CrossRef]
- Gigović, L.; Pamučar, D.; Bajić, Z.; Drobnjak, S. Application of GIS-Interval Rough AHP Methodology for Flood Hazard Mapping in Urban Areas. Water 2017, 9, 360. [Google Scholar] [CrossRef] [Green Version]
- Mentens, J.; Raes, D.; Hermy, M. Green roofs as a tool for solving the rainwater runoff problem in the urbanized 21st century? Landsc. Urban Plan. 2006, 77, 217–226. [Google Scholar] [CrossRef]
- Didenko, N.; Skripnuk, D.; Mirolyubova, O. Urbanization and greenhouse gas emissions from industry. IOP Conf. Ser. Earth Environ. Sci. 2017, 72, 012014. [Google Scholar] [CrossRef]
- Holden, W.N. Endogenous exacerbation of an exogenous problem: Climate change, environmental degradation, and unsustainable development practices in the Philippines. Asian Geogr. 2019, 36, 1–27. [Google Scholar] [CrossRef]
- Sarvari, H. A survey of relationship between urbanization and climate change for major cities in Iran. Arab. J. Geosci. 2019, 12, 1–10. [Google Scholar] [CrossRef]
- Ahmadalipour, A.; Moradkhani, H.; Castelletti, A.; Magliocca, N. Future drought risk in Africa: Integrating vulnerability, climate change, and population growth. Sci. Total Environ. 2019, 662, 672–686. [Google Scholar] [CrossRef]
- Frame, D.J.; Wehner, M.F.; Noy, I.; Rosier, S.M. The economic costs of Hurricane Harvey attributable to climate change. Clim. Chang. 2020, 160, 271–281. [Google Scholar] [CrossRef] [Green Version]
- Hettiarachchi, S.; Wasko, C.; Sharma, A. Increase in flood risk resulting from climate change in a developed urban watershed–the role of storm temporal patterns. Hydrol. Earth Syst. Sci. 2018, 22, 2041–2056. [Google Scholar] [CrossRef] [Green Version]
- Hirabayashi, Y.; Mahendran, R.; Koirala, S.; Konoshima, L.; Yamazaki, D.; Watanabe, S.; Kim, H.; Kanae, S. Global flood risk under climate change. Nat. Clim. Chang. 2013, 3, 816–821. [Google Scholar] [CrossRef]
- Kang, S.; Eltahir, E.A. North China Plain threatened by deadly heatwaves due to climate change and irrigation. Nat. Commun. 2018, 9, 1–9. [Google Scholar] [CrossRef] [Green Version]
- Olesen, J.E.; Bindi, M. Consequences of climate change for European agricultural productivity, land use and policy. Eur. J. Agron. 2002, 16, 239–262. [Google Scholar] [CrossRef]
- Rahmstorf, S. A new view on sea level rise. Nat. Clim. Chang. 2010, 1, 44–45. [Google Scholar] [CrossRef]
- Vu, D.; Yamada, T.; Ishidaira, H. Assessing the impact of sea level rise due to climate change on seawater intrusion in Mekong Delta, Vietnam. Water Sci. Technol. 2018, 77, 1632–1639. [Google Scholar] [CrossRef] [Green Version]
- Cheng, C.; Yang, Y.C.E.; Ryan, R.; Yu, Q.; Brabec, E. Assessing climate change-induced flooding mitigation for adaptation in Boston’s Charles River watershed, USA. Landsc. Urban Plan. 2017, 167, 25–36. [Google Scholar] [CrossRef]
- Fernandez, D.; Lutz, M. Urban flood hazard zoning in Tucumán Province, Argentina, using GIS and multicriteria decision analysis. Eng. Geol. 2010, 111, 90–98. [Google Scholar] [CrossRef]
- Cheng, C. Spatial climate justice and green infrastructure assessment: A case for the Huron River watershed, Michigan, USA. GI Forum 2016, 1, 179–190. [Google Scholar] [CrossRef]
- Cheng, C. Climate Justicescape and Implications for urban Resilience in American Cities. In The Routledge Handbook of Urban Resilience; Burayidi, M., Twigg, J., Allen, A., Wamlester, C., Eds.; Routledge, Taylor & Francis Books: New York, NY, USA, 2019; pp. 83–96. [Google Scholar]
- Huong, H.T.L.; Pathirana, A. Urbanization and climate change impacts on future urban flooding in Can Tho city, Vietnam. Hydrol. Earth Syst. Sci. 2013, 17, 379–394. [Google Scholar] [CrossRef] [Green Version]
- Ishigaki, T.; Kawanaka, R.; Onishi, Y.; Shimada, H.; Toda, K.; Baba, Y. Assessment of safety on evacuating route during underground flooding. In Advances in Water Resources and Hydraulic Engineering; Springer: Berlin/Heidelberg, Germany, 2009; pp. 141–146. [Google Scholar] [CrossRef]
- Tran Ngoc, T.D.; Perset, M.; Strady, E.; Phan, T.S.H.; Vachaud, G.; Quertamp, F.; Gratiot, N. Ho Chi Minh City growing with water related challenges. In Water, Megacities and Global Change: Portraits of 15 Emblematic Cities of the World; UNESCO; ARCEAU: Paris, France, 2016; p. 27. [Google Scholar]
- Vachaud, G.; Quertamp, F.; Phan, T.S.H.; Ngoc, T.D.T.; Nguyen, T.; Luu, X.L.; Nguyen, A.T.; Gratiot, N. Flood-related risks in Ho Chi Minh City and ways of mitigation. J. Hydrol. 2019, 573, 1021–1027. [Google Scholar] [CrossRef]
- Nguyen, D. Size, Shape and Dispersion: Urban form evolution in Saigon River Basin and its impacts on hydrologic performance from 1990 to 2010. In Proceedings of the 49th ISOCARP Congress, Brisbane, Australia, 1–4 October 2013; p. 12. [Google Scholar]
- Asian Development Bank. Available online: https://www.adb.org/publications/ho-chi-minh-city-adaptation-climate-change-summary-report (accessed on 6 February 2020).
- Ministry of Transportation. Available online: https://mt.gov.vn/moitruong/tin-tuc/993/58230/tp-hcm-dang-chiu-thiet-hai-hon-1-500-ty-dong-moi-nam-do-ngap-nuoc.aspx (accessed on 6 February 2020).
- Rehman, J.; Sohaib, O.; Asif, M.; Pradhan, B. Applying systems thinking to flood disaster management for a sustainable development. Int. J. Disaster Risk Reduct. 2019, 36, 101101. [Google Scholar] [CrossRef]
- Babut, M.; Mourier, B.; Desmet, M.; Simonnet-Laprade, C.; Labadie, P.; Budzinski, H.; De Alencastro, L.F.; Tu, T.A.; Strady, E.; Gratiot, N. Where has the pollution gone? A survey of organic contaminants in Ho Chi Minh city/Saigon River (Vietnam) bed sediments. Chemosphere 2019, 217, 261–269. [Google Scholar] [CrossRef]
- Lee, S.K.; Dang, T.A.; Tran, T.H. Combining rainfall–runoff and hydrodynamic models for simulating flow under the impact of climate change to the lower Sai Gon-Dong Nai River basin. Paddy Water Environ. 2018, 16, 457–465. [Google Scholar] [CrossRef]
- Rosenzweig, B.R.; McPhillips, L.; Chang, H.; Cheng, C.; Welty, C.; Matsler, M.; Iwaniec, D.; Davidson, C.I. Pluvial flood risk and opportunities for resilience. WIREs Water 2018, 5, e1302. [Google Scholar] [CrossRef]
- Office of the People’s Committee in Kon Tum Province. Available online: http://kontumvpub.gov.vn/NewsDetail.aspx?id=295 (accessed on 6 February 2020).
- Nawaz, A.; Waqar, A.; Shah, S.A.R.; Sajid, M.; Khalid, M.I. An Innovative Framework for Risk Management in Construction Projects in Developing Countries: Evidence from Pakistan. Risks 2019, 7, 24. [Google Scholar] [CrossRef] [Green Version]
- Nkwunonwo, U.C.; Whitworth, M.; Baily, B. A review of the current status of flood modelling for urban flood risk management in the developing countries. Sci. Afr. 2020, 7, e00269. [Google Scholar] [CrossRef]
- Hazarika, N.; Barman, D.; Das, A.K.; Sarma, A.K.; Borah, S.B. Assessing and mapping flood hazard, vulnerability and risk in the Upper Brahmaputra River valley using stakeholders’ knowledge and multicriteria evaluation (MCE). J. Flood Risk Manag. 2018, 11, S700–S716. [Google Scholar] [CrossRef]
- Hudson, P.; Botzen, W.J.W.; Kreibich, H.; Bubeck, P.; Aerts, J. Evaluating the effectiveness of flood damage mitigation measures by the application of propensity score matching. Nat. Hazards Earth Syst. Sci. 2014, 14, 1731–1747. [Google Scholar] [CrossRef] [Green Version]
- Merz, B.; Thieken, A.; Gocht, M. Flood risk mapping at the local scale: Concepts and challenges. In Flood Risk Management in Europe; Begum, S., Stive, M.J.F., Hall, J.W., Eds.; Springer: Dordrecht, The Netherlands, 2007; Volume 25, pp. 231–251. [Google Scholar]
- Tingsanchali, T.; Karim, M.F. Flood hazard and risk analysis in the southwest region of Bangladesh. Hydrol. Process. 2005, 19, 2055–2069. [Google Scholar] [CrossRef]
- van Alphen, J.; Martini, F.; Loat, R.; Slomp, R.; Passchier, R. Flood risk mapping in Europe, experiences and best practices. J. Flood Risk Manag. 2009, 2, 285–292. [Google Scholar] [CrossRef]
- Das, S. Geographic information system and AHP-based flood hazard zonation of Vaitarna basin, Maharashtra, India. Arab. J. Geosci. 2018, 11, 13. [Google Scholar] [CrossRef]
- Ghosh, A.; Kar, S.K. Application of analytical hierarchy process (AHP) for flood risk assessment: A case study in Malda district of West Bengal, India. Nat. Hazards 2018, 94, 349–368. [Google Scholar] [CrossRef]
- Seejata, K.; Yodying, A.; Wongthadam, T.; Mahavik, N.; Tantanee, S. Assessment of flood hazard areas using analytical hierarchy process over the Lower Yom Basin, Sukhothai Province. Procedia Eng. 2018, 212, 340–347. [Google Scholar] [CrossRef]
- Stefanidis, S.; Stathis, D. Assessment of flood hazard based on natural and anthropogenic factors using analytic hierarchy process (AHP). Nat. Hazards 2013, 68, 569–585. [Google Scholar] [CrossRef]
- Messner, F.; Meyer, V. Flood Damage, Vulnerability and Risk Perception–Challenges for Flood Damage Research. In Flood Risk Management: Hazards, Vulnerability and Mitigation Measures; Springer: Dordrecht, The Netherlands, 2006; Volume 67, pp. 149–167. [Google Scholar]
- Danumah, J.H.; Odai, S.N.; Saley, B.M.; Szarzynski, J.; Thiel, M.; Kwaku, A.; Kouame, F.K.; Akpa, L.Y. Flood risk assessment and mapping in Abidjan district using multicriteria analysis (AHP) model and geoinformation techniques, (cote d’ivoire). Geoenvironment. Disasters 2016, 3, 1–13. [Google Scholar] [CrossRef] [Green Version]
- Portal of the Ministry of Construction. Available online: https://moc.gov.vn/tl/tin-tuc/63149/tp-ho-chi-minh-dieu-chinh-quy-hoach-thoat-nuoc--mo-rong-tren-dien-tich-2-095km2.aspx (accessed on 6 February 2020).
- Party Committee of Ho Chi Minh City. Available online: https://hcmcpv.org.vn/tin-tuc/tphcm-mot-so-du-an-chong-ngap-ung-dua-vao-su-dung-phat-huy-hieu-qua-1491873572 (accessed on 6 February 2021).
- Leitao, J.P.; de Sousa, L.M. Towards the optimal fusion of high-resolution Digital Elevation Models for detailed urban flood assessment. J. Hydrol. 2018, 561, 651–661. [Google Scholar] [CrossRef]
- Rahmati, O.; Darabi, H.; Haghighi, A.T.; Stefanidis, S.; Kornejady, A.; Nalivan, O.A.; Tien Bui, D. Urban Flood Hazard Modeling Using Self-Organizing Map Neural Network. Water 2019, 11, 2370. [Google Scholar] [CrossRef] [Green Version]
- Stieglitz, M.; Rind, D.; Famiglietti, J.; Rosenzweig, C. An Efficient Approach to Modeling the Topographic Control of Surface Hydrology for Regional and Global Climate Modeling. J. Clim. 1997, 10, 118–137. [Google Scholar] [CrossRef]
- Darabi, H.; Choubin, B.; Rahmati, O.; Haghighi, A.T.; Pradhan, B.; Kløve, B. Urban flood risk mapping using the GARP and QUEST models: A comparative study of machine learning techniques. J. Hydrol. 2019, 569, 142–154. [Google Scholar] [CrossRef]
- Pham, B.T.; Avand, M.; Janizadeh, S.; Phong, T.V.; Al-Ansari, N.; Ho, L.S.; Das, S.; Le, H.V.; Amini, A.; Bozchaloei, S.K.; et al. GIS Based Hybrid Computational Approaches for Flash Flood Susceptibility Assessment. Water 2020, 12, 683. [Google Scholar] [CrossRef] [Green Version]
- Ouma, Y.O.; Tateishi, R. Urban flood vulnerability and risk mapping using integrated multi-parametric AHP and GIS: Methodological overview and case study assessment. Water 2014, 6, 1515–1545. [Google Scholar] [CrossRef]
- Adnan, M.S.G.; Talchabhadel, R.; Nakagawa, H.; Hall, J.W. The potential of Tidal River Management for flood alleviation in South Western Bangladesh. Sci. Total Environ. 2020, 731, 13. [Google Scholar] [CrossRef] [PubMed]
- Chen, Y.-R.; Yeh, C.-H.; Yu, B. Integrated application of the analytic hierarchy process and the geographic information system for flood risk assessment and flood plain management in Taiwan. Nat. Hazards 2011, 59, 1261–1276. [Google Scholar] [CrossRef] [Green Version]
- Pradhan-Salike, I.; Pokharel, J.R. Impact of urbanization and climate change on urban flooding: A case of the Kathmandu Valley. J. Nat. Resour. Dev. 2016, 7, 56–66. [Google Scholar] [CrossRef] [Green Version]
- Abebe, Y.A.; Ghorbani, A.; Nikolic, I.; Vojinovic, Z.; Sanchez, A. A coupled flood-agent-institution modelling (CLAIM) framework for urban flood risk management. Environ. Model. Softw. 2019, 111, 483–492. [Google Scholar] [CrossRef]
- Thanh, V.Q.; Roelvink, D.; van der Wegen, M.; Reyns, J.; Kernkamp, H.; Vinh, G.V.; Linh, V.T.P. Flooding in the Mekong Delta: The impact of dyke systems on downstream hydrodynamics. Hydrol. Earth Syst. Sci. 2020, 24, 189–212. [Google Scholar] [CrossRef] [Green Version]
- Bradshaw, C.J.A.; Sodhi, N.S.; Peh, K.S.H.; Brook, B.W. Global evidence that deforestation amplifies flood risk and severity in the developing world. Glob. Chang. Biol. 2007, 13, 2379–2395. [Google Scholar] [CrossRef]
- Dung, T.T.T.; Linh, T.M.; Chau, T.B.; Hoang, T.M.; Swennen, R.; Cappuyns, V. Contamination status and potential release of trace metals in a mangrove forest sediment in Ho Chi Minh City, Vietnam. Environ. Sci. Pollut. Res. 2019, 26, 9536–9551. [Google Scholar] [CrossRef]
- Menéndez, P.; Losada, I.J.; Torres-Ortega, S.; Narayan, S.; Beck, M.W. The Global Flood Protection Benefits of Mangroves. Sci. Rep. 2020, 10, 4404. [Google Scholar] [CrossRef]
- Posthumus, H.; Hewett, C.J.M.; Morris, J.; Quinn, P.F. Agricultural land use and flood risk management: Engaging with stakeholders in North Yorkshire. Agric. Water Manag. 2008, 95, 787–798. [Google Scholar] [CrossRef]
- Schaefer, M.; Thinh, N.X. Evaluation of land cover change and agricultural protection sites: A GIS and remote sensing approach for Ho chi minh city, vietnam. Heliyon 2019, 5, e01773. [Google Scholar] [CrossRef] [PubMed] [Green Version]
- Duy, P.N.; Chapman, L.; Tight, M.; Thuong, L.V.; Linh, P.N. Urban Resilience to Floods in Coastal Cities: Challenges and Opportunities for Ho Chi Minh City and Other Emerging Cities in Southeast Asia. J. Urban Plan. Dev. 2018, 144, 05017018. [Google Scholar] [CrossRef]
- Nasiri, H.; Yusof, M.; Ali, T.; Hussein, M. District flood vulnerability index: Urban decision-making tool. Int. J. Environ. Sci. Technol. 2019, 16, 2249–2258. [Google Scholar] [CrossRef] [Green Version]
- Sun, H.; Cheng, X.; Dai, M. Regional flood disaster resilience evaluation based on analytic network process: A case study of the Chaohu Lake Basin, Anhui Province, China. Nat. Hazards 2016, 82, 39–58. [Google Scholar] [CrossRef]
- Saaty, T.L. The analytic hierarchy and analytic network processes for the measurement of intangible criteria and for decision-making. In Multiple Criteria Decision Analysis, 2nd ed.; Greco, S., Ehrgott, M., Figueira, J.R., Eds.; Springer: Berlin/Heidelberg, Germany, 2016; Volume 1, pp. 363–419. [Google Scholar]
- Juang, S.-R.; Chen, S.-H.; Wu, C.-F. An Expert-based assessment model for evaluating habitat suitability of pond-breeding amphibians. Sustainability 2017, 9, 278. [Google Scholar] [CrossRef] [Green Version]
- Jeng, T. Fuzzy Assessment Model for Maturity of Software Organization in Improving its Staff’s Capability. Master’s Thesis, National Taiwan University of Science and Technology, Taipei, Taiwan, 2001. [Google Scholar]
- Kuo, Y.-F.; Chen, P.-C. Constructing performance appraisal indicators for mobility of the service industries using Fuzzy Delphi Method. Expert Syst. Appl. 2008, 35, 1930–1939. [Google Scholar] [CrossRef]
- Yang, T.; Su, C.T.; Hsu, Y.R. Systematic layout planning: A study on semiconductor wafer fabrication facilities. Int. J. Oper. Prod. Manag. 2000. [Google Scholar] [CrossRef]
- Wang, W.-M.; Lee, A.H.; Chang, D.-T. An integrated FDM–ANP evaluation model for sustainable development of housing community. Optim. Lett. 2010, 4, 239–257. [Google Scholar] [CrossRef]
- Johnson, T.P. Snowball Sampling: Introduction. In Wiley StatsRef: Statistics Reference Online; Balakrishnan, N., Colton, T., Everitt, B., Piegorsch, W., Ruggeri, F., Teugels, J.L., Eds.; Wiley Online Library: New Jersey, NJ, USA, 2014. [Google Scholar] [CrossRef]
- Lai, C.-H.; Lin, S.-H.; Tsai, C.-Y.; Chen, S.-H. Identifying Farm Pond Habitat Suitability for the Common Moorhen (Gallinula chloropus): A Conservation-Perspective Approach. Sustainability 2018, 10, 1352. [Google Scholar] [CrossRef] [Green Version]
- Chou, W.-W.; Lee, S.-H.; Wu, C.-F. Evaluation of the Preservation Value and Location of Farm Ponds in Yunlin County, Taiwan. Int. J. Environ. Res. Public Health 2014, 11, 548–572. [Google Scholar] [CrossRef]
- Wei, W.L.; Chang, W.C. A study on selecting optimal product design solution using fuzzy Delphi method and analytic. J. Des. 2007, 10, 59–76. [Google Scholar]
- Scawthorn, C.; Blais, N.; Seligson, H.; Tate, E.; Mifflin, E.; Thomas, W.; Murphy, J.; Jones, C. HAZUS-MH Flood Loss Estimation Methodology. I: Overview and Flood Hazard Characterization. Nat. Hazards Rev. 2006, 7, 60–71. [Google Scholar] [CrossRef]
- Schumann, G.J.P.; Neal, J.C.; Mason, D.C.; Bates, P.D. The accuracy of sequential aerial photography and SAR data for observing urban flood dynamics, a case study of the UK summer 2007 floods. Remote Sens. Environ. 2011, 115, 2536–2546. [Google Scholar] [CrossRef]
- Yalcin, E. Assessing the impact of topography and land cover data resolutions on two-dimensional HEC-RAS hydrodynamic model simulations for urban flood hazard analysis. Nat. Hazards 2020, 101, 995–1017. [Google Scholar] [CrossRef]
- Hayakawa, Y.S.; Oguchi, T.; Lin, Z. Comparison of new and existing global digital elevation models: ASTER G-DEM and SRTM-3. Geophys. Res. Lett. 2008, 35. [Google Scholar] [CrossRef]
- Cabrera, J.S.; Lee, H.S. Impacts of Climate Change on Flood-Prone Areas in Davao Oriental, Philippines. Water 2018, 10, 893. [Google Scholar] [CrossRef] [Green Version]
- Cabrera, J.S.; Lee, H.S. Flood risk assessment for Davao Oriental in the Philippines using geographic information system-based multicriteria analysis and the maximum entropy model. J. Flood Risk Manag. 2020, 13, 17. [Google Scholar] [CrossRef] [Green Version]
- Huong, D.T.V.; Nagasawa, R. Potential flood hazard assessment by integration of ALOS PALSAR and ASTER GDEM: A case study for the Hoa Chau commune, Hoa Vang district, in central Vietnam. J. Appl. Remote Sens. 2014, 8, 083626. [Google Scholar] [CrossRef]
- Wang, Z.L.; Lai, C.G.; Chen, X.H.; Yang, B.; Zhao, S.W.; Bai, X.Y. Flood hazard risk assessment model based on random forest. J. Hydrol. 2015, 527, 1130–1141. [Google Scholar] [CrossRef]
- Lima, A.O.; Lyra, G.B.; Abreu, M.C.; Oliveira-Júnior, J.F.; Zeri, M.; Cunha-Zeri, G. Extreme rainfall events over Rio de Janeiro State, Brazil: Characterization using probability distribution functions and clustering analysis. Atmos. Res. 2021, 247, 105221. [Google Scholar] [CrossRef]
- Alam, M.A.; Emura, K.; Farnham, C.; Yuan, J. Best-Fit Probability Distributions and Return Periods for Maximum Monthly Rainfall in Bangladesh. Climate 2018, 6, 9. [Google Scholar] [CrossRef] [Green Version]
- Beskow, S.; Caldeira, T.L.; de Mello, C.R.; Faria, L.C.; Guedes, H.A.S. Multiparameter probability distributions for heavy rainfall modeling in extreme southern Brazil. J. Hydrol. Reg. Stud. 2015, 4, 123–133. [Google Scholar] [CrossRef] [Green Version]
- Nardi, F.; Annis, A.; Biscarini, C. On the impact of urbanization on flood hydrology of small ungauged basins: The case study of the Tiber river tributary network within the city of Rome. J. Flood Risk Manag. 2018, 11, S594–S603. [Google Scholar] [CrossRef]
- Nardi, F.; Biscarini, C.; Di Francesco, S.; Manciola, P.; Ubertini, L. Comparing A Large-Scale Dem-Based Floodplain Delineation Algorithm With Standard Flood Maps: The Tiber River Basin Case Study. Irrig. Drain. 2013, 62, 11–19. [Google Scholar] [CrossRef]
- Nardi, F.; Grimaldi, S.; Santini, M.; Petroselli, A.; Ubertini, L. Hydrogeomorphic properties of simulated drainage patterns using digital elevation models: The flat area issue/Propriétés hydro-géomorphologiques de réseaux de drainage simulés à partir de modèles numériques de terrain: La question des zones planes. Hydrol. Sci. J. 2008, 53, 1176–1193. [Google Scholar] [CrossRef]
- Samela, C.; Manfreda, S.; Paola, F.D.; Giugni, M.; Sole, A.; Fiorentino, M. DEM-Based Approaches for the Delineation of Flood-Prone Areas in an Ungauged Basin in Africa. J. Hydrol. Eng. 2016, 21, 06015010. [Google Scholar] [CrossRef]
- Vorogushyn, S.; Lindenschmidt, K.-E.; Kreibich, H.; Apel, H.; Merz, B. Analysis of a detention basin impact on dike failure probabilities and flood risk for a channel-dike-floodplain system along the river Elbe, Germany. J. Hydrol. 2012, 436, 120–131. [Google Scholar] [CrossRef] [Green Version]
- Wang, Y.; Li, Z.; Tang, Z.; Zeng, G. A GIS-based spatial multicriteria approach for flood risk assessment in the Dongting Lake Region, Hunan, Central China. Water Resour. Manag. 2011, 25, 3465–3484. [Google Scholar] [CrossRef]
- Hassan, Z.; Shabbir, R.; Ahmad, S.S.; Malik, A.H.; Aziz, N.; Butt, A.; Erum, S. Dynamics of land use and land cover change (LULCC) using geospatial techniques: A case study of Islamabad Pakistan. SpringerPlus 2016, 5, 1–11. [Google Scholar] [CrossRef] [Green Version]
- Mather, P.M.; Koch, M. Computer Processing of Remotely-Sensed Images: An Introduction, 4th ed.; John Wiley & Sons: Hoboken, NJ, USA, 2011; p. 434. [Google Scholar]
- Ha, T.V.; Tuohy, M.; Irwin, M.; Tuan, P.V. Monitoring and mapping rural urbanization and land use changes using Landsat data in the northeast subtropical region of Vietnam. Egypt. J. Remote Sens. Space Sci. 2020, 23, 11–19. [Google Scholar] [CrossRef]
- Congalton, R.G.; Green, K. Assessing the Accuracy of Remotely Sensed Data: Principles and Practices; CRC Press: Boca Raton, FL, USA, 2019. [Google Scholar]
- Anderson, J.R. A Land Use and Land Cover Classification System for Use with Remote Sensor Data; US Government Printing Office: Washington, DC, USA, 1976; Volume 964.
- Saaty, T.L. Multicriteria Decision Making: The Analytic Hierarchy Process: Planning, Priority Setting Resource Allocation; RWS Pubns: Pittsburgh, PA, USA, 1990. [Google Scholar]
- Malmir, M.; Zarkesh, M.M.K.; Monavari, S.M.; Jozi, S.A.; Sharifi, E. Analysis of land suitability for urban development in Ahwaz County in southwestern Iran using fuzzy logic and analytic network process (ANP). Environ. Monit. Assess. 2016, 188, 447. [Google Scholar] [CrossRef]
- Saaty, T.L.; Vargas, L.G. Decision Making with the Analytic Network Process; Springer: Berlin/Heidelberg, Germany, 2006; Volume 282. [Google Scholar]
- Alaa, M.A.-A.; Shamsuddin, S.; Ali, K.A.-A. A GIS-based integration of catastrophe theory and analytical hierarchy process for mapping flood susceptibility: A case study of Teeb area, Southern Iraq. Environ. Earth Sci. 2016, 75, 1–19. [Google Scholar] [CrossRef]
- Kanani-Sadat, Y.; Arabsheibani, R.; Karimipour, F.; Nasseri, M. A new approach to flood susceptibility assessment in data-scarce and ungauged regions based on GIS-based hybrid multi criteria decision-making method. J. Hydrol. 2019, 572, 17–31. [Google Scholar] [CrossRef]
- Chakraborty, S.; Mukhopadhyay, S. Assessing flood risk using analytical hierarchy process (AHP) and geographical information system (GIS): Application in Coochbehar district of West Bengal, India. Nat. Hazards 2019, 99, 247–274. [Google Scholar] [CrossRef]
- Wu, Y.; Zhong, P.-A.; Zhang, Y.; Xu, B.; Ma, B.; Yan, K. Integrated flood risk assessment and zonation method: A case study in Huaihe River basin, China. Nat. Hazards 2015, 78, 635–651. [Google Scholar] [CrossRef]
- Shen, Y.-C.; Chang, S.-H.; Lin, G.T.; Yu, H.-C. A hybrid selection model for emerging technology. Technol. Forecast. Soc. Chang. 2010, 77, 151–166. [Google Scholar] [CrossRef]
- Zhang, J. Evaluating regional low-carbon tourism strategies using the fuzzy Delphi-analytic network process approach. J. Clean. Prod. 2017, 141, 409–419. [Google Scholar] [CrossRef]
- Zou, Q.; Zhou, J.; Zhou, C.; Song, L.; Guo, J. Comprehensive flood risk assessment based on set pair analysis-variable fuzzy sets model and fuzzy AHP. Stoch. Environ. Res. Risk Assess. 2013, 27, 525–546. [Google Scholar] [CrossRef]
- Afzali, A.; Sabri, S.; Rashid, M.; Mohammad Vali Samani, J.; Ludin, A.N.M. Inter-Municipal Landfill Site Selection Using Analytic Network Process. Water Resour. Manag. 2014, 28, 2179–2194. [Google Scholar] [CrossRef]
- Zhong, M.; Lin, K.; Tang, G.; Zhang, Q.; Hong, Y.; Chen, X. A Framework to Evaluate Community Resilience to Urban Floods: A Case Study in Three Communities. Sustainability 2020, 12, 1521. [Google Scholar] [CrossRef] [Green Version]
- Brooks, N. Vulnerability, risk and adaptation: A conceptual framework. Tyndall Cent. Clim. Chang. Res. Work. Pap. 2003, 38, 1–16. [Google Scholar]
- Chang, H.; Pallathadka, A.; Sauer, J.; Grimm, N.B.; Zimmerman, R.; Cheng, C.; Iwaniec, D.M.; Kim, Y.; Lloyd, R.; McPhearson, T.; et al. Assessment of urban flood vulnerability using the social-ecological-technological systems framework in six US cities. Sustain. Cities Soc. 2021, 68, 102786. [Google Scholar] [CrossRef]
- Schober, P.; Boer, C.; Schwarte, L.A. Correlation coefficients: Appropriate use and interpretation. Anesth. Analg. 2018, 126, 1763–1768. [Google Scholar] [CrossRef]
- Pandey, A.; Singh, S.K.; Nathawat, M. Waterlogging and flood hazards vulnerability and risk assessment in Indo Gangetic plain. Nat. Hazards 2010, 55, 273–289. [Google Scholar] [CrossRef]
- Sar, N.; Chatterjee, S.; Adhikari, M.D. Integrated remote sensing and GIS based spatial modelling through analytical hierarchy process (AHP) for water logging hazard, vulnerability and risk assessment in Keleghai river basin, India. Modeling Earth Syst. Environ. 2015, 1, 1–21. [Google Scholar] [CrossRef] [Green Version]
- Ho Chi Minh City Statistical Office. Available online: http://www.pso.hochiminhcity.gov.vn/web/guest/niengiamthongke2019 (accessed on 6 February 2020).
- Fleischhauer, M. The Role of Spatial Planning in Strengthening Urban Resilience; Springer: Dordrecht, The Netherlands, 2008; pp. 273–298. [Google Scholar]
- Liu, J.; Shi, Z.-W. Quantifying land-use change impacts on the dynamic evolution of flood vulnerability. Land Use Policy 2017, 65, 198–210. [Google Scholar] [CrossRef]
- Vermuyten, E.; Meert, P.; Wolfs, V.; Willems, P. Impact of seasonal changes in vegetation on the river model prediction accuracy and real-time flood control performance. J. Flood Risk Manag. 2020, 13, e12651. [Google Scholar] [CrossRef]
- Chang, H.-K.; Tan, Y.-C.; Lai, J.-S.; Pan, T.-Y.; Liu, T.-M.; Tung, C.-P. Improvement of a drainage system for flood management with assessment of the potential effects of climate change. Hydrol. Sci. J. 2013, 58, 1581–1597. [Google Scholar] [CrossRef] [Green Version]
- Hartmann, T. Clumsy floodplains and the law: Towards a responsive land policy for extreme floods. Built Environ. 2009, 35, 531–544. [Google Scholar] [CrossRef]
- Schanze, J. Flood risk management–a basic framework. In Flood Risk Management: Hazards, Vulnerability and Mitigation Measures; Springer: Berlin/Heidelberg, Germany, 2006; pp. 1–20. [Google Scholar] [CrossRef]
- Cui, P.; Li, D. Measuring the Disaster Resilience of an Urban Community Using ANP-FCE Method from the Perspective of Capitals. Soc. Sci. Q. 2019, 100, 2059–2077. [Google Scholar] [CrossRef]
- Xu, W.; Zhong, M.; Hong, Y.; Lin, K. Enhancing community resilience to urban floods with a network structuring model. Saf. Sci. 2020, 127, 104699. [Google Scholar] [CrossRef]
- Lai, C.-H.; Liao, P.-C.; Chen, S.-H.; Wang, Y.-C.; Cheng, C.; Wu, C.-F. Risk Perception and Adaptation of Climate Change: An Assessment of Community Resilience in Rural Taiwan. Sustainability 2021, 13, 3651. [Google Scholar] [CrossRef]
- Alves, A.; Gersonius, B.; Kapelan, Z.; Vojinovic, Z.; Sanchez, A. Assessing the Co-Benefits of green-blue-grey infrastructure for sustainable urban flood risk management. J. Environ. Manag. 2019, 239, 244–254. [Google Scholar] [CrossRef]
- Chan, F.K.S.; Griffiths, J.A.; Higgitt, D.; Xu, S.; Zhu, F.; Tang, Y.-T.; Xu, Y.; Thorne, C.R. “Sponge City” in China—A breakthrough of planning and flood risk management in the urban context. Land Use Policy 2018, 76, 772–778. [Google Scholar] [CrossRef]
- Jha, A.K.; Bloch, R.; Lamond, J. Cities and Flooding: A Guide to Integrated Urban Flood Risk Management for the 21st Century; The World Bank: Washington, DC, USA, 2012. [Google Scholar] [CrossRef] [Green Version]


| Evaluation Index | Conservative Cognitive Value | Optimistic Cognitive Value | Best Value | Geometric Mean | Mi= | Zi= | Verification Value | Stakeholders Consensus Value | |||||
|---|---|---|---|---|---|---|---|---|---|---|---|---|---|
| CiL | CiU | OiL | OiU | aiL | aiU | CiM | OiM | aiM | OiM − CiM | CiU − OiL | Mi − Zi | Gi = (CiM + OiM)/2 | |
| Elevation | 3 | 8 | 6 | 10 | 7 | 10 | 5.18 | 8.98 | 8.48 | 3.81 | 2 | 1.81 | 7.08 |
| Slope | 2 | 8 | 6 | 10 | 6 | 9 | 5.09 | 8.24 | 7.63 | 3.15 | 2 | 1.15 | 6.67 |
| Distance to river | 2 | 10 | 9 | 10 | 8 | 10 | 5.84 | 9.45 | 8.83 | 3.60 | 1 | 2.60 | 7.65 |
| Heavy rainfall | 4 | 9 | 8 | 10 | 7 | 10 | 6.35 | 8.97 | 8.26 | 2.62 | 1 | 1.62 | 7.66 |
| Tidal level | 2 | 10 | 8 | 10 | 7 | 10 | 5.66 | 9.18 | 8.66 | 3.52 | 2 | 1.52 | 7.42 |
| Population density | 4 | 9 | 7 | 10 | 6 | 9 | 5.91 | 8.38 | 7.78 | 2.47 | 2 | 0.47 | 7.14 |
| Population growth rate | 3 | 10 | 7 | 10 | 6 | 10 | 5.81 | 8.77 | 7.99 | 2.97 | 3 | −0.03 | 7.29 |
| Distance to dike system | 2 | 10 | 7 | 10 | 6 | 10 | 5.66 | 8.95 | 8.28 | 3.29 | 3 | 0.29 | 7.30 |
| Forest areas * | 2 | 10 | 5 | 10 | 3 | 10 | 4.83 | 8.05 | 6.81 | 3.22 | 5 | −1.78 | 6.44 |
| Agricultural lands | 3 | 8 | 6 | 9 | 5 | 8 | 5.33 | 8.02 | 6.70 | 2.69 | 2 | 0.69 | 6.67 |
| Loss of water bodies | 5 | 9 | 8 | 10 | 6 | 10 | 6.57 | 9.27 | 8.30 | 2.70 | 1 | 1.70 | 7.92 |
| Loss of agricultural lands * | 1 | 8 | 5 | 10 | 4 | 9 | 4.12 | 7.26 | 6.55 | 3.14 | 3 | 0.14 | 5.69 |
| Loss of forest areas * | 2 | 9 | 4 | 10 | 3 | 9 | 4.02 | 7.29 | 6.47 | 3.26 | 5 | −1.74 | 5.65 |
| Criteria | Relative Weight (A) | Sub-Criteria | Relative Weight (B) | Overall Weight (A × B) | Final Weight (A × B × S) |
|---|---|---|---|---|---|
| Natural condition | 0.185 | Elevation | 0.211 | 0.039 | 0.018 |
| Slope | 0.146 | 0.027 | 0.013 | ||
| Distance to river | 0.219 | 0.041 | 0.019 | ||
| Heavy rainfall | 0.226 | 0.042 | 0.020 | ||
| Tidal level | 0.198 | 0.037 | 0.017 | ||
| Human development | 0.370 | Population density | 0.500 | 0.185 | 0.088 |
| Distance to dike system | 0.500 | 0.185 | 0.088 | ||
| Land use management | 0.444 | Agricultural lands | 0.500 | 0.222 | 0.105 |
| Loss of water bodies | 0.500 | 0.222 | 0.105 |
Publisher’s Note: MDPI stays neutral with regard to jurisdictional claims in published maps and institutional affiliations. |
© 2021 by the authors. Licensee MDPI, Basel, Switzerland. This article is an open access article distributed under the terms and conditions of the Creative Commons Attribution (CC BY) license (https://creativecommons.org/licenses/by/4.0/).
Share and Cite
Wu, C.-F.; Chen, S.-H.; Cheng, C.-W.; Trac, L.V.T. Climate Justice Planning in Global South: Applying a Coupled Nature–Human Flood Risk Assessment Framework in a Case for Ho Chi Minh City, Vietnam. Water 2021, 13, 2021. https://doi.org/10.3390/w13152021
Wu C-F, Chen S-H, Cheng C-W, Trac LVT. Climate Justice Planning in Global South: Applying a Coupled Nature–Human Flood Risk Assessment Framework in a Case for Ho Chi Minh City, Vietnam. Water. 2021; 13(15):2021. https://doi.org/10.3390/w13152021
Chicago/Turabian StyleWu, Chen-Fa, Szu-Hung Chen, Ching-Wen Cheng, and Luu Van Thong Trac. 2021. "Climate Justice Planning in Global South: Applying a Coupled Nature–Human Flood Risk Assessment Framework in a Case for Ho Chi Minh City, Vietnam" Water 13, no. 15: 2021. https://doi.org/10.3390/w13152021